Article

Measurement of Ultrasound Parameters of Bovine Cancellous Bone as a Function of Frequency for a Range of Porosities via Through-Transmission Ultrasonic Spectroscopy

Materials Science Program, University of Vermont, Burlington, VT 05405, USA
*
Author to whom correspondence should be addressed.
Acoustics 2022, 4(2), 406-418; https://doi.org/10.3390/acoustics4020025
Submission received: 13 March 2022 / Revised: 17 April 2022 / Accepted: 19 April 2022 / Published: 3 May 2022
(This article belongs to the Special Issue Recent Developments in Ultrasound Applications)

Abstract

:
The relationship between ultrasonic parameters (attenuation coefficients and velocity) and bone porosity in bovine cancellous bone is explored to understand the possibility of fracture risk diagnosis associated with osteoporosis by applying ultrasound. In vitro measurements of ultrasonic parameters on twenty-one bovine cancellous bone samples from tibia were conducted, using ultrasonic spectroscopy in the through-transmission mode. Transducers of three different center frequencies were used to cover a wide diagnostic frequency range between 1.0–7.8 MHz. The nonlinear relationship of porosity and normalized attenuation coefficient (nATTN) and normalized broadband attenuation coefficient (nBUA) were well described by a third-order polynomial fit, whereas porosity and the phase velocity (UV) were found to be negatively correlated with the linear correlation coefficients of −0.93, −0.89 and −0.83 at 2.25, 5.00 and 7.50 MHz, respectively. The results imply that the ultrasound parameters attain maximum values for the bone sample with the lowest porosity, and then decrease for samples with greater porosity for the range of porosities in our samples for all frequencies. Spatial variation in the ultrasound parameters was found to be caused by non-uniform pore size distribution, which was examined at five different locations within the same bone specimen. However, it did not affect the relationship of ultrasound parameters and porosity at these frequencies.

1. Introduction

Osteoporosis is a condition involving a decrease in the bone strength due to the modification of the structure (connectivity, porosity, and anisotropy) and composition (bone mineral content) over a time period [1]. Cancellous bone, which is a complex honeycomb-like porous structure of different size pores, is reported to be an important indicator for the prediction of the bone fracture risk related to the osteoporosis [2]. The use of ultrasound for the diagnosis of fracture risk associated with osteoporosis has been proposed as a promising medical application, as it is safe, non-invasive, and non-destructive compared to the current ionizing techniques like dual-energy X-ray absorptiometry (DEXA), quantitative computed tomography (QCT), and magnetic resonance imaging (MRI) [3,4]. The primary parameters characterizing ultrasound propagation in the bone include the ultrasound velocity (UV) and the rate of change of attenuation of ultrasound intensity with frequency (called broadband attenuation coefficient, or BUA). These ultrasound parameters respond differently to the osteoporotic bone than normal bone, allowing for the differentiation of healthy and osteoporotic people [5,6]. These parameters were found to be highly correlated to site-matched bone mineral density (BMD), which is a clinical measure of bone fracture [5,7,8,9,10], and they were also shown to be influenced by mechanical and structural properties of bone-related to fracture risk [4,11,12,13], which is not contained in BMD measurements [14]. However, the complex, anisotropic and inhomogeneous structure of cancellous bone poses a great challenge for understanding exactly how ultrasound interacts with cancellous bone, which has been a primary factor limiting widespread clinical application [7].
Bone porosity, defined as the fraction of pore volume to the total volume covered by the pores, is a prominent quantity in characterizing the bone structure, on which the mechanical properties like Young’s modulus, permeability, and bone tortuosity of bone strongly depend [15]. Porosity is a predictor of bone fracture risk due to osteoporosis, as small increases in porosity equate to disproportionately significant decreases in bone mass and density [16,17]. Porosity affects the ultrasound wave propagation in the medium at all frequencies, influencing the amplitude and velocity of ultrasound waves, as demonstrated by 2D radiographic images of cancellous bone [18] and 3D μ CT images [19]. Evaluating the relationship between bone porosity and ultrasound parameters could be ideal for determining the fracture risk.
Clarke et al. (1994) reported that the attenuation increases in the low porosity region, peaks up at 50% and then decreases at the highest porosity region in cancellous bone-mimic phantom made of epoxy resin-gelatin material over the frequency range 0.5–0.875 MHz [20]. A similar trend was observed by Williams et al. with peak attenuation at 65–70% porosity [21], and by Nicholson et al. with maximum attenuation at 50% porosity in the bone phantoms with fixed pore sizes in the range of 0.1–0.6 mm [8]. Several other experimental studies in human and bovine cancellous bone [22,23,24] and bone phantom [25] demonstrated a nonlinear dependence of porosity on BUA, where they observed that BUA value reaches a maximum of typically 40 dB MHz cm 1 at porosities of approximately 70%. These findings suggested that attenuation depends on the scatterer size and porosity, and the structural property determines the position of the BUA peak. The consensus among these studies was that the correct prediction of the BUA peak strengthens the argument that the complexity of the structure is a factor in the BUA/porosity relationship. However, these arguments were made based on experiments conducted in a hundred-kilohertz range. Therefore, they need to be validated over the whole diagnostic range (1–8 MHz). Furthermore, the pore size was kept constant in their individual investigations, but cancellous bone contains a wide range of pore sizes, which substantially impacts propagation of ultrasound waves.
The ultrasound velocity dispersive nature can be used as an indicator for the structural changes of any material, particularly porous material. A nondispersive relationship occurs when there is no change in phase velocity with frequency. Hosokawa et al. obtained nondispersive phase velocities in the bovine femoral cancellous bone between 0.5 and 5.0 MHz using Biot theory [19]. Strelitzki et al. investigated the influence of porosity and pore size using a Leeds ultrasonic bone phantom and reported that UV in trabecular bone is dependent on porosity but independent of pore size [25]. The negative dispersion was observed in calcaneal cancellous bone with much lower bone mass [25,26,27,28,29,30,31,32,33], whereas positive velocity dispersion was reported by Pal et al. and Fry and Barger in skull cancellous bone specimens with an ultrasound between 0.3 and 2.0 MHz [34,35]. The negative dispersion was explained by multiple scattering [30] or by interference of fast and slow waves predicted by Biot theory [31,32]. These findings strongly agree with the argument made by Lee et al. (2003) that negative dispersion is associated with lower BMD values and nondispersive nature is related to high BMD values [36]. These results suggested that UV is influenced by the mechanical properties of the constituents of the bone and overall framework; hence it will also be affected by the porosity and pore size distributions. However, Cardoso et al. indicated that porosity is a poor parameter for predicting the propagation properties of attenuation and velocity [37]. More experimental studies are required for solid validation.
Although there is keen interest in the use of ultrasound for bone assessment, its use is limited by the lack of consensus on how porosity affects the ultrasound parameters. Furthermore, there is a lack of clarity on the appropriate ultrasound frequency range for bone assessment due to the high attenuation coefficient of bone, which serves to limit the high end of the frequency range [20,23,38]. Another complication is that these parameters strongly depend on the ultrasound propagation direction with respect to trabecular orientation as predicted by Biot’s theory [39,40,41], finite-difference time-domain (FDTD) simulations using the the Schoenberg model [33] or Attenborough model [42]. These studies reported that there exists both fast and slow longitudinal waves, when acoustic waves is propagated in the axial direction of strong trabecular orientation, and only one longitudinal wave appears, when the propagation direction is perpendicular to the direction of the trabecular orientation. The clinical measurements are typically carried out with the ultrasound wave propagating through the cancellous bone in the mediolateral (ML) direction, perpendicular to the trabecular orientation.
Hence, the goals of this study are: (a) to evaluate the frequency dependence of the ultrasonic attenuation coefficient (nATTN), normalized Broadband Ultrasonic Attenuation (nBUA), and ultrasonic velocity (UV) in the cancellous bone at frequencies ranging from 1.62–7.89 MHz using the ultrasonic spectroscopy technique in transverse transmission mode, similar to that used in in vivo measurements; (b) to characterize the velocity dispersion of cancellous bone based on a spectral analysis of ultrasound transmitted through the specimens with the goal of providing a feasible frequency range for ultrasound techniques; and (c) to investigate the relationship of these parameters to bone porosity and pore size distributions measured by the X-ray micro-CT scan technique for the better understanding of bone assessment. This study is conducted utilizing twenty-one bovine trabecular bones and three pairs of transducers, with center ultrasound frequencies of 2.25, 5.00, and 7.50 MHz. Validation of the measurements was performed using three polyethylene disks, similar to those used by Wu (1996) [43].

2. Materials and Methods

2.1. Preparation of Cancellous Bone

The bovine trabecular bones obtained from a grocery store were cleaned thoroughly and cut with a rotating electric saw to remove the cortical part, including soft tissues and bone marrow. Twenty-one circular cancellous bone specimens, each with a diameter of 1.9 cm and a thickness of 3 mm, measured using vernier calipers with a precision of 0.01 mm, were prepared such that each could have an orientation in which the ultrasound could pass through the specimen along the mediolateral direction of the trabecular bone, which is the same direction as used for in vivo measurements. The samples were cut in a cylindrical shape to fit in the sample holder. Fat was removed from the bone specimens by immersion in a dichloromethane solution for two weeks while changing the solutions frequently. Once defatted, the bone samples were thoroughly washed with water and stored in the air at room temperature. Before carrying out the acoustic measurements, these slices were soaked in water under a vacuum to remove air bubbles trapped in the pores.

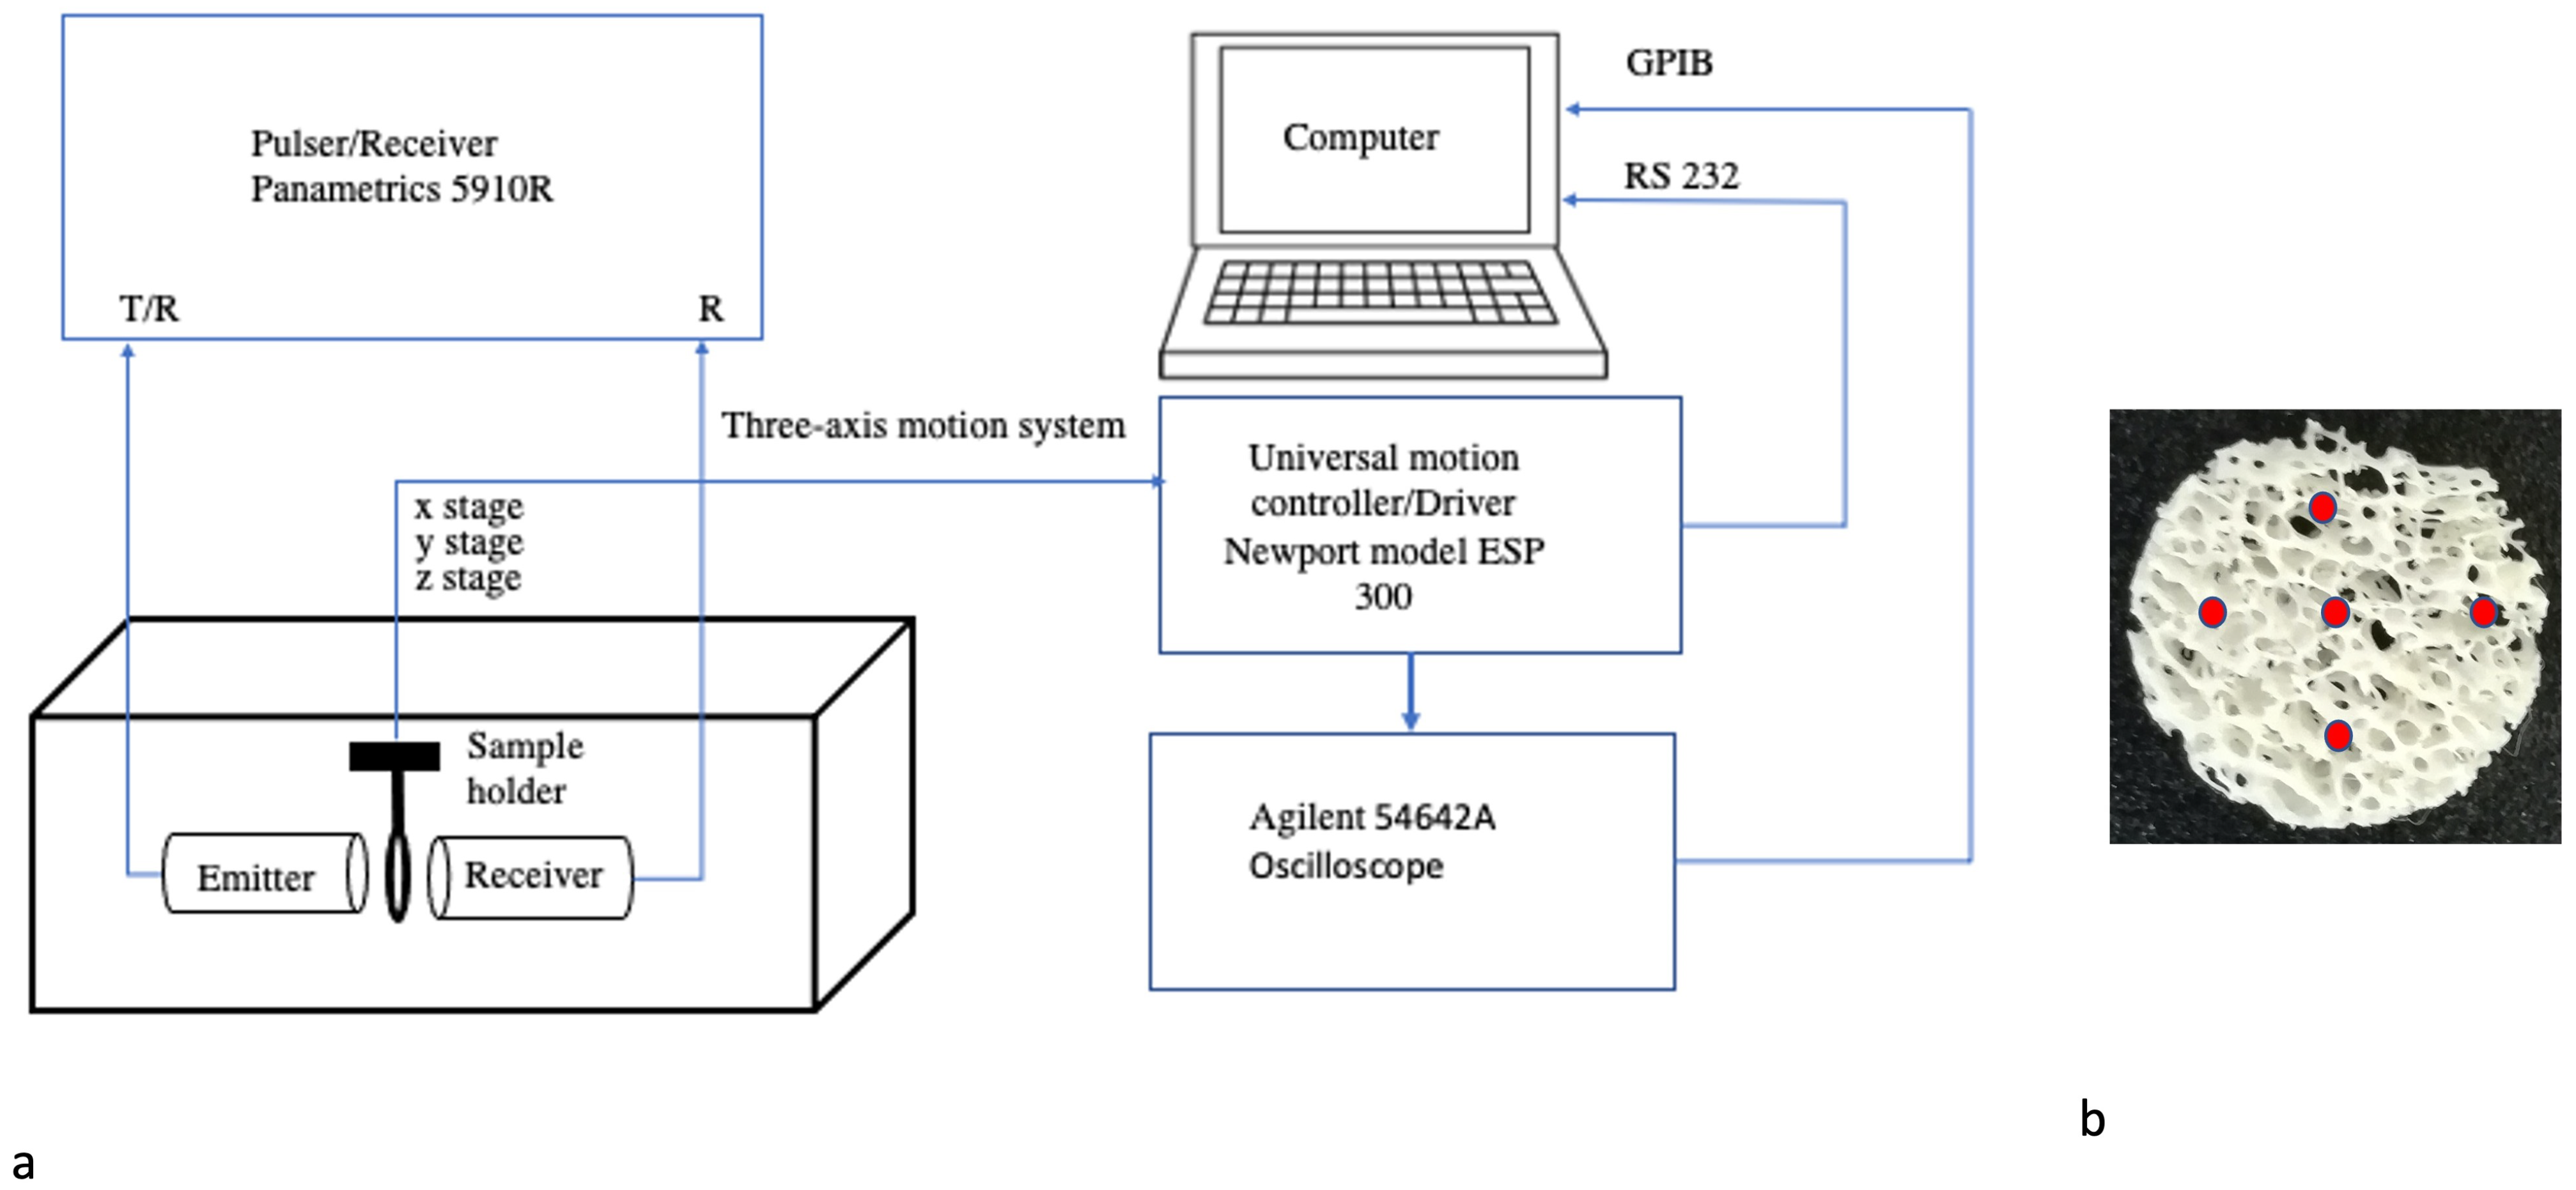
2.2. Ultrasonic Measurement

A schematic diagram of the US measurement system for attenuation (nATTN), BUA, and UV for cancellous bone specimens in the transmission mode is depicted in Figure 1. This system consisted of a pair of matched unfocused transducers (2.25, 5.00 and 7.50 MHz center frequency with 6.04, 13.44 and 20.16 cm near field distances and 1.27 cm diameter: Panametrics Inc., Waltham, MA, USA) as both emitter and receiver, a pulser/receiver (Panametrics 5910R, Panca Mega, Jagakarsa, Jakarta Selatan, Indonesia), an oscilloscope (Agilent 54642A, Keysight, Colorado Springs, CO, USA) and a computer for the data processing. The samples were kept at the near field distance (N) of each transducer, so the uniform ultrasound beam of maximum amplitudes is incident on the sample. The focal width of each transducer is 0.328 cm, which is smaller than the diameter of the sample (both cancellous bone and polyethylene disk, whose diameter is 1.9 cm). The system was designed to cover the wide range (1.62–7.89 MHz) of US frequency. The −3.0 dB bandwidth (new center frequency) of the sound pulse received by the receiver was between 1.62–2.32 MHz (2.05 MHz), 4.02–5.14 MHz (4.58 MHz), and 6.81–7.89 MHz (7.34 MHz) for 2.25, 5.00 and 7.50 MHz transducers, respectively, within which the spectral data are reliable and not subject to the poor signal-to-noise ratio. The new center frequency for each transducer is the frequency corresponding to the maximum amplitude of the measured signal in the distilled water (reference).
The matched transducers were spaced twice their focal length and aligned coaxially and confocally in through transmission mode. A narrow pulse drove the first transducer (<0.1 μs) generated by the pulser. In the receiver section, the output of a second transducer was amplified and transferred to the oscilloscope for digitization. The computer saved the digital results for further analysis. The procedure was tested by measuring the acoustic parameters of 3 mm thick polyethylene disks with the same diameter as the bone sample and comparing the results to Wu’s findings (1996). The ultrasound signal for each sample was measured at five different spots, in a circle at 2 mm away from the center with the help of a three axes universal motion controller/driver (Newport model ESP 300, Newport Corporation, Irvine, CA, USA), which could rotate the sample holder, holding the sample. The purpose was to account for the inhomogeneous nature of bone. The specimen was placed in-between the transducers so that the ultrasound beam was normally incident on the bone samples in the same direction as the bone trabecular network so that the receiver could record the maximum amplitude pulses. The bone samples and transducers were immersed in a distilled and degassed water bath maintained at room temperature of 20 °C. The transmitted ultrasound signals through the bone samples were fast Fourier transformed using MATLAB software to obtain amplitude spectra through water and bone sample ( A w -water and ( A b -bone), which were used to calculate attenuation (ATTN), broadband attenuation coefficient (BUA), and ultrasound velocity (UV) parameters as follows:
ATTN = ln T A w A b d
UV = V w 1 + V w ϕ w ϕ b ± 2 π m 2 π f d
T = 4 Z w Z b ( f ) Z w + Z b ( f ) 2 ϕ b = tan 1 Img A b Re A b ϕ w = tan 1 Img A w Re A w
Here, T, Z w , Z b , ϕ w , and ϕ b are transmission coefficient, acoustic impedances and densities of water and bone specimens of thickness of d, respectively. Similarly, V w , ϕ b and ϕ w are ultrasound velocity through water (reference) and phase angles of amplitude spectra of the bone samples and water, respectively. The term ± 2 π m in Equation (2) was used for the deconvolution of the arctangent function, where m is an integer. The BUA was obtained from the slope of the linear regression fit of the attenuation coefficient of the sample within the −3.0 dB bandwidth. Division of the ATTN and BUA by the sample thickness yields the normalized ATTN (nATTN) and normalized BUA (nBUA) value. The V w value was calculated as a function of temperature T (20°) using the simplified equation by Lubbers and Graaff [44] as given by Equation (4):
V w = 1405.03 + 4.624 × T 0.00383 × T 2

2.3. Water Saturation Method of Bone Porosity Measurement

The bone samples were dried in air for 24 h, and then porosity of each of them was calculated by the water saturation method using the relation:
Porosity = w SA w FA w SA w SL
where w SA is the weight of sample in the air with water-saturated pore space, w FA is the weight of sample in the air with free pore space, and w SL is the weight of sample suspended in water with water-saturated pore space, measured using (PGW 1502e Precision Balances, Adam Equipment Inc., Oxford, CT, USA) with 0.01 g resolution. The sample porosity values were in the range of 60.50–82.40%.

2.4. QCT Bone Porosity Measurement

Nine bovine bone samples were scanned with the Bruker SkyScan 1173 Micro-CT machine, Billerica, MA, USA (highest possible resolution of 9.2 μ m pixel size under 42 KV and 157 μ A) to analyze their porosity and pore distribution. Each scanned specimen was reconstructed using NRecon software, local Version, Bruker Corporation, Billerica, MA, USA and the reconstructed images were performed by CT-Analyzer software (Version 1.13, MicroPhotonics Inc., AllenTown, PA, USA) using the three-dimensional (3D) analysis option. The porosity analysis of each sample was performed by examining a small (10 mm diameter) region enclosing the region of ultrasound measurement. The average porosity in the scanned samples ranged from 60.99–82.42% and the pore sizes ranged from 0.009–1.691 mm. The porosities measured from QCT matched with those determined using the water saturation method for nine samples within a standard deviation (0.2%).

3. Results and Discussion

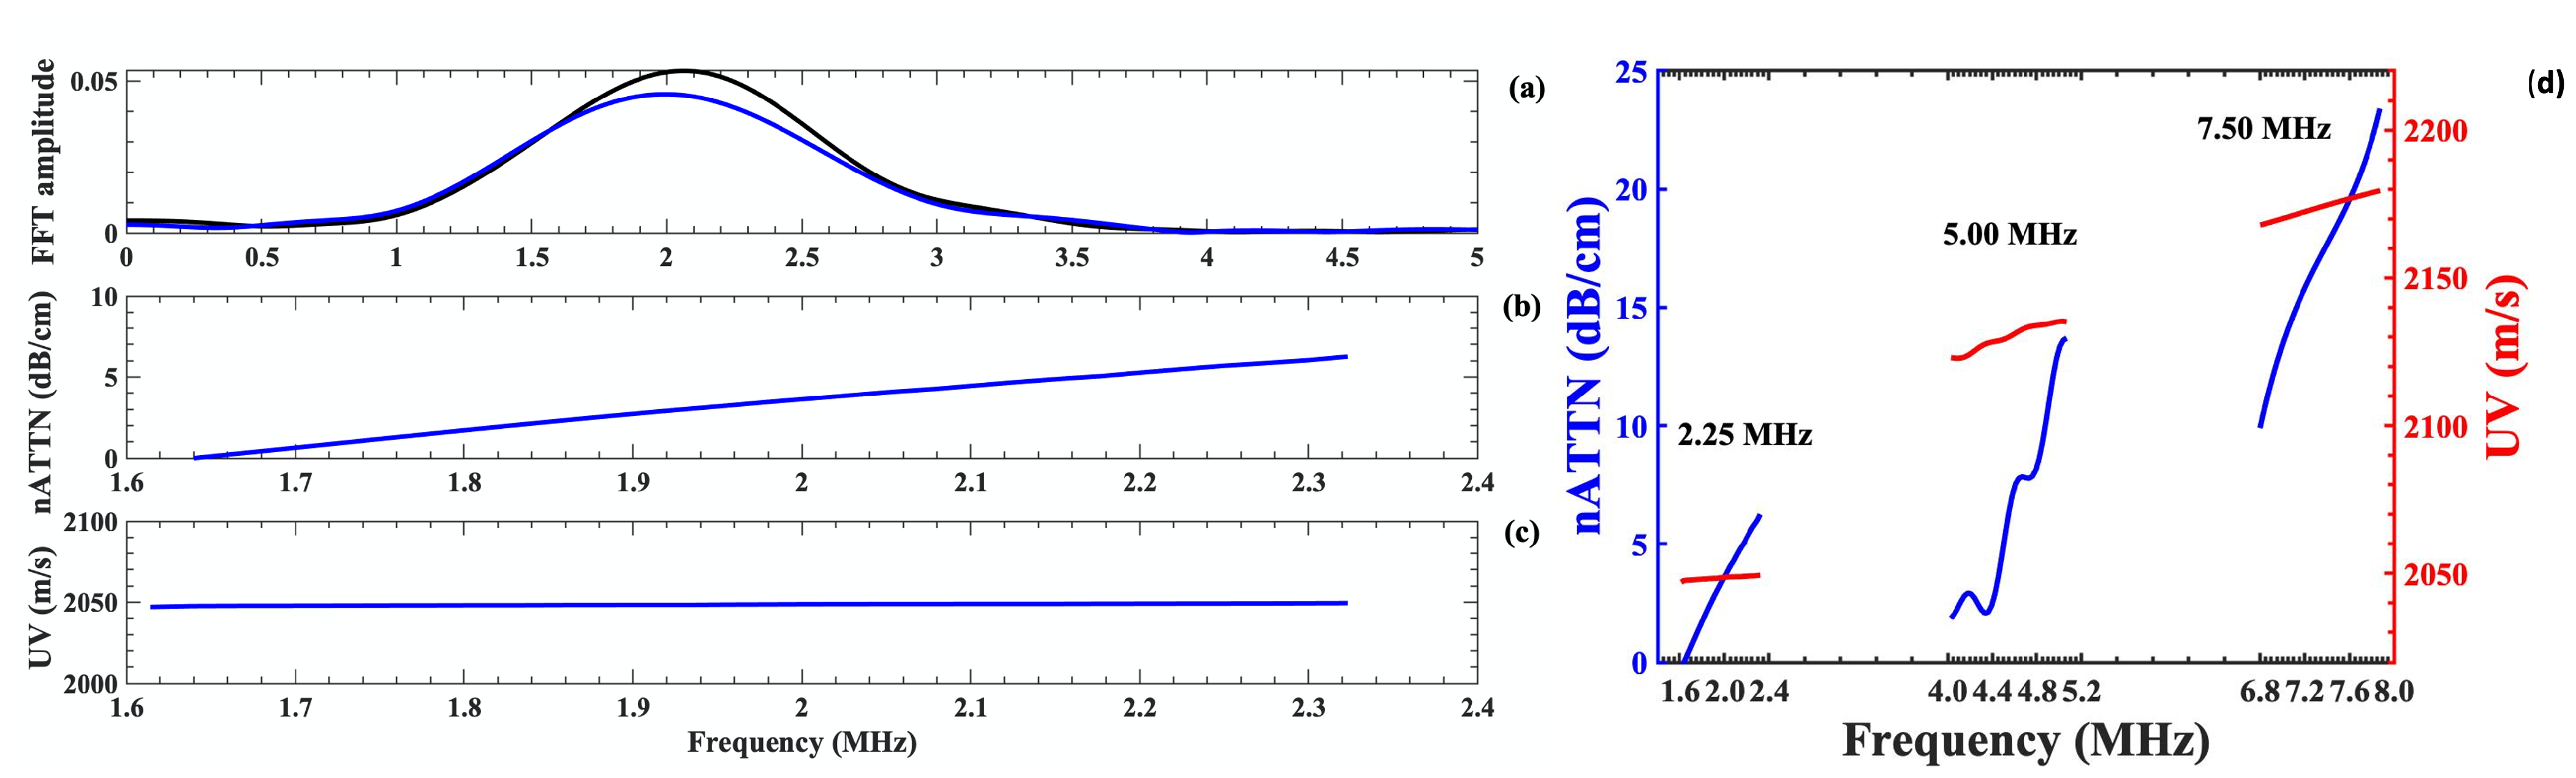
3.1. Validation of Experimental Method Using Polyethylene Disks

The experimental method was validated using three high density circular polyethylene disks (density— 952 g/cm 3 , thickness—0.300 cm, and diameter 1.900 cm, prepared by (Hewlett-Packard Co., Palo Alto, CA, USA). The amplitude spectra of the US signals were determined using reference (black) and the polyethylene disks (blue) with the same diameter as the cancellous bone samples using a transducer with center frequency of 2.25 MHz, as shown in Figure 2a. The nATTN values increases linearly with frequency (Figure 2b), whereas the phase velocity remains constant in (Figure 2c) within the bandwidth of 1.62–2.32 MHz. which demonstrates the nondispersive nature of ultrasound velocity in polyethylene material. A similar measurement was carried out using the 5.00 and 7.50 transducers, as well within their −3.0 dB bandwidth frequencies. The nATTN and nBUA values exhibited a similar nature, with higher values of the attenuation coefficients; however, the phase velocity were found to rise with increase in frequency within the −3.0 dB bandwidth frequency range for 5.00 and 7.50 MHz center frequency transducers, as shown in Figure 2d, suggesting a positive velocity dispersion at higher frequencies. This characteristics property is commonly observed in most viscoelastic material [45].
The mean values of normalized attenuation coefficients (nATTN) of the polyethylene disks, measured at five different spots of the disk from three separate experiments, were found out to be 4.0 ± 0.40 , 7.1 ± 0.99 , and 17.0 ± 0.60 dB/cm at 2.05, 4.58 and 7.34 MHz, respectively. The respective mean values of nBUA of polyethylene disks are 9.20 ± 0.35 , 11.9 ± 0.43 and 13.5 ± 0.58 dB/cm/MHz at 2.05, 4.58 and 7.34 MHz and the respective UV of polyethylene disks were found to be 2040.6 ± 0.2 , 2130.5 ± 0.3 , and 2173.9 ± 0.6 m/s. The attenuation increased linearly with increasing frequency, and there was also an increase in velocity of the disk as frequency increased (from 2.25 to 7.50 MHz). The measured values of attenuation coefficient and UV of polyethylene disks at the center frequencies were compared to the values of Kline [45], and Wu [43]. At those frequencies, our results were close to theirs with 5% agreement. This agreement suggests that the attenuation mechanism in polyethylene disk is dominated by scattering phenomena at these frequencies.

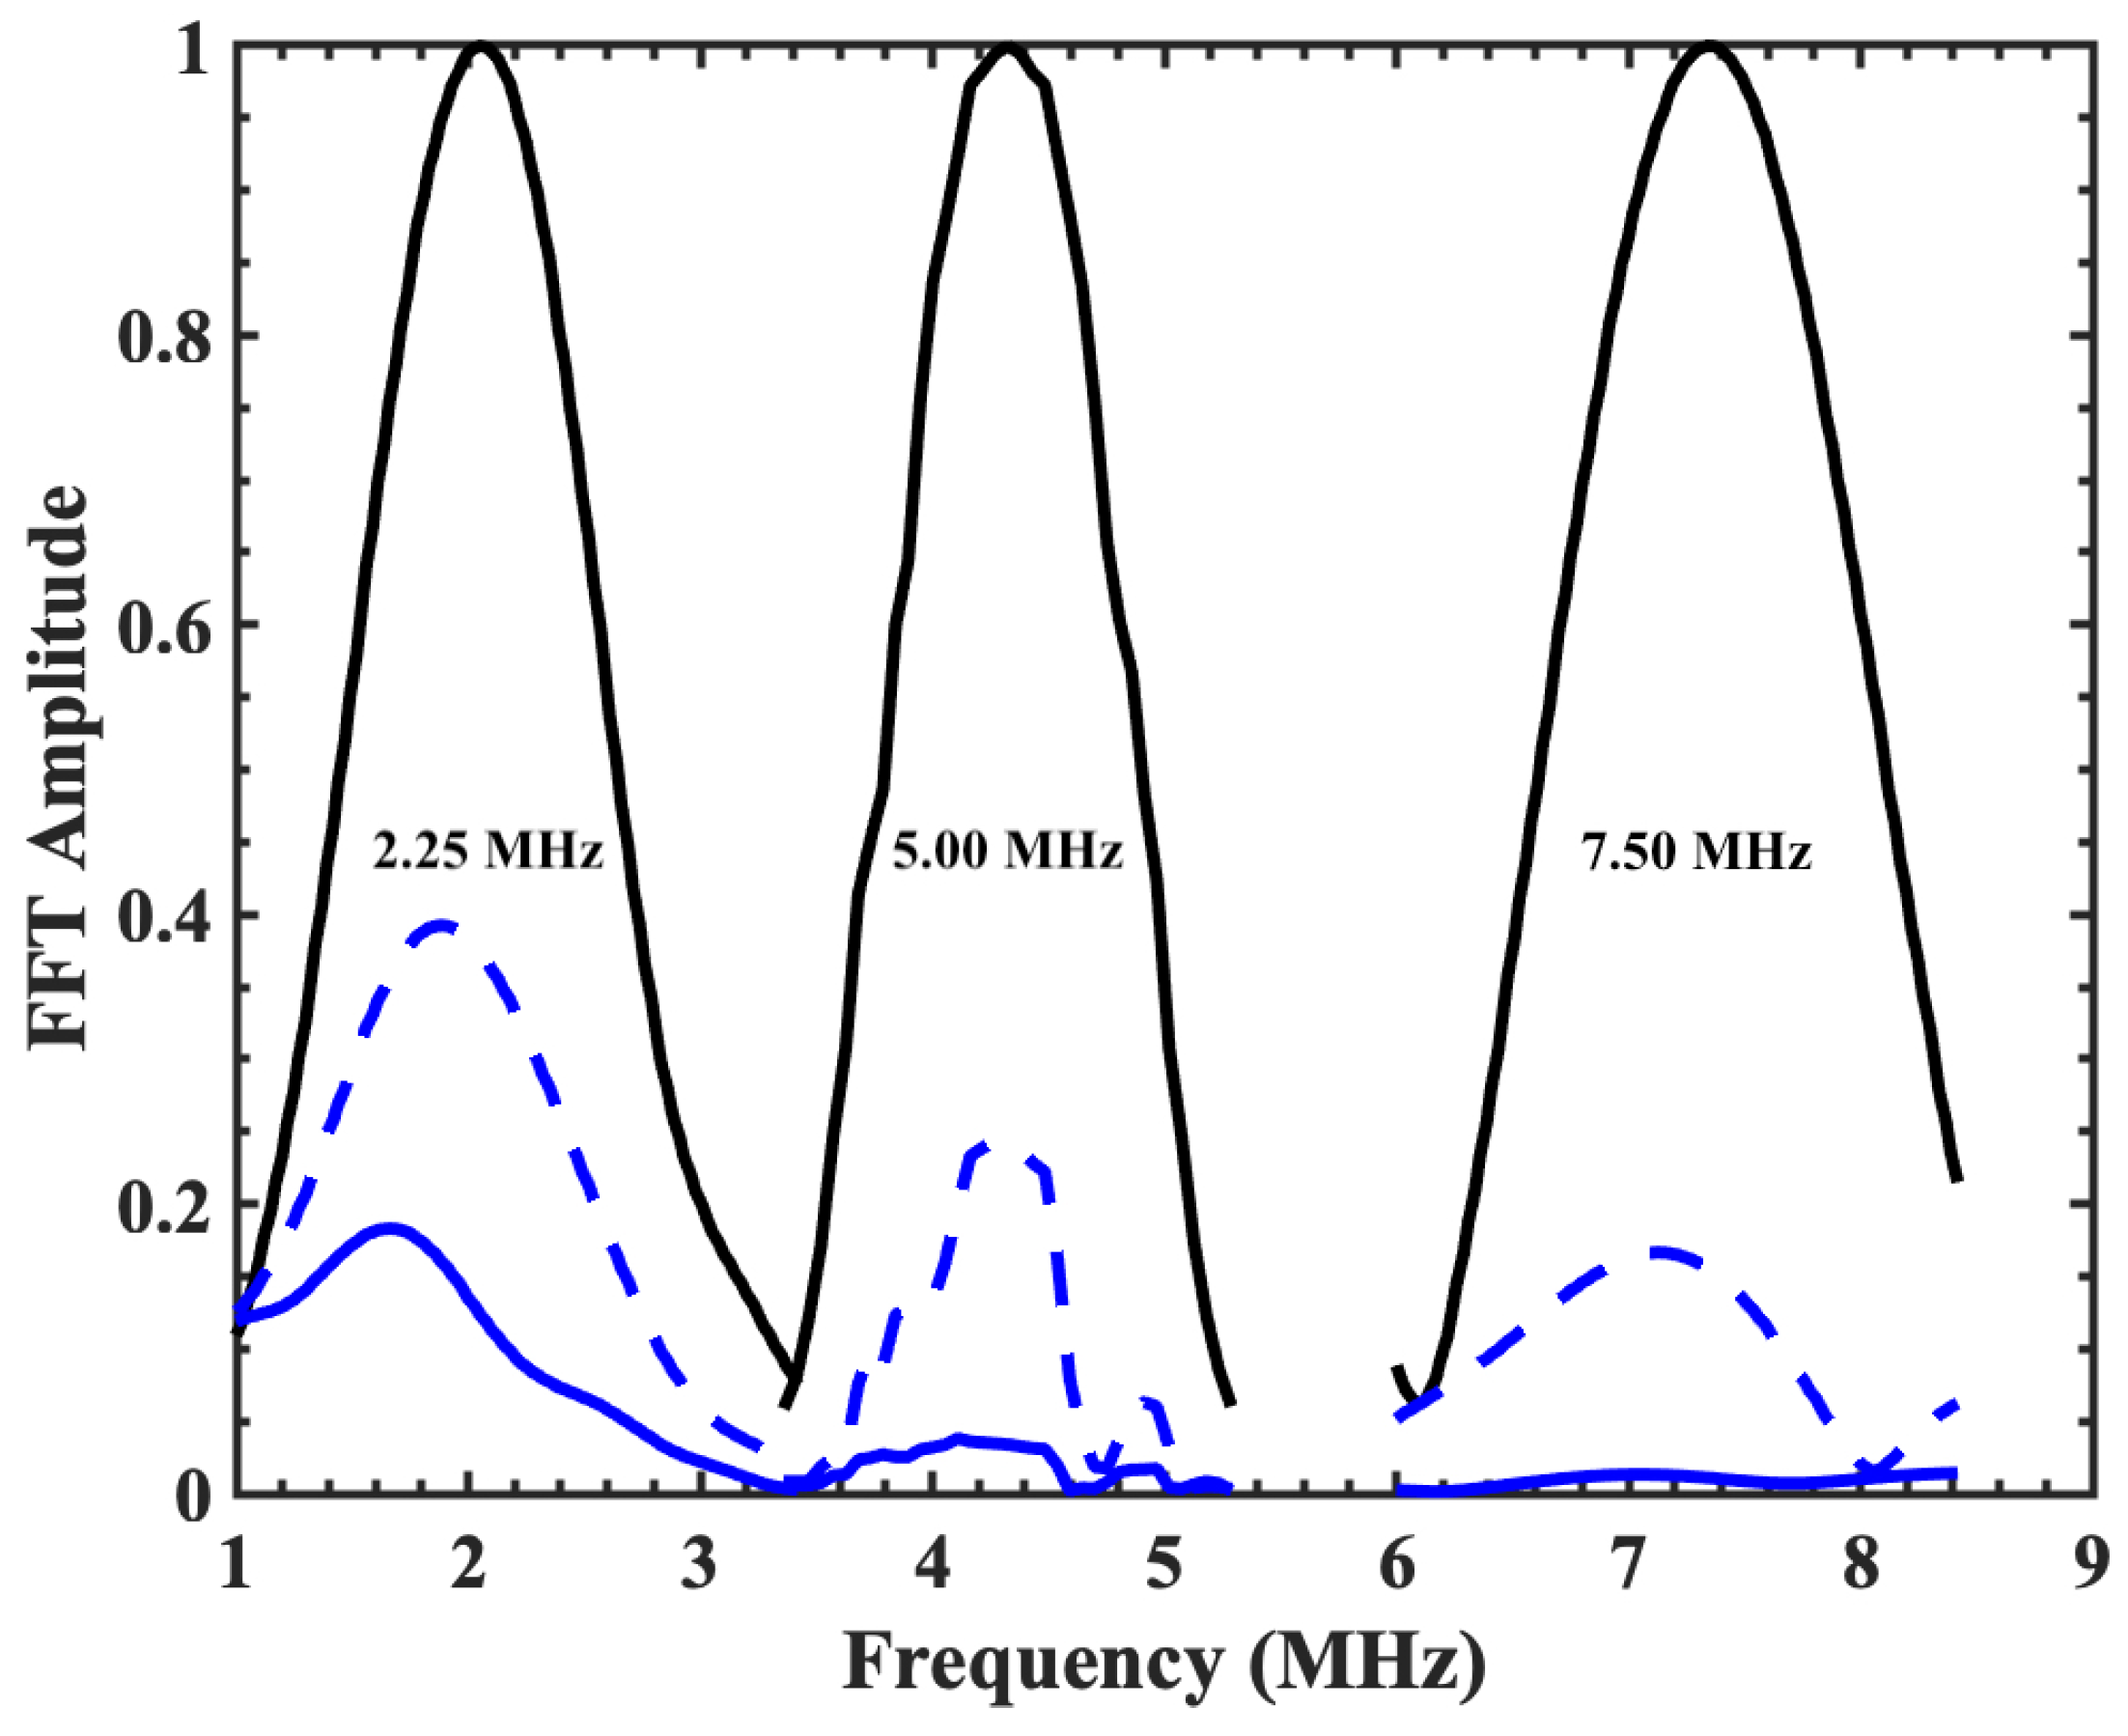
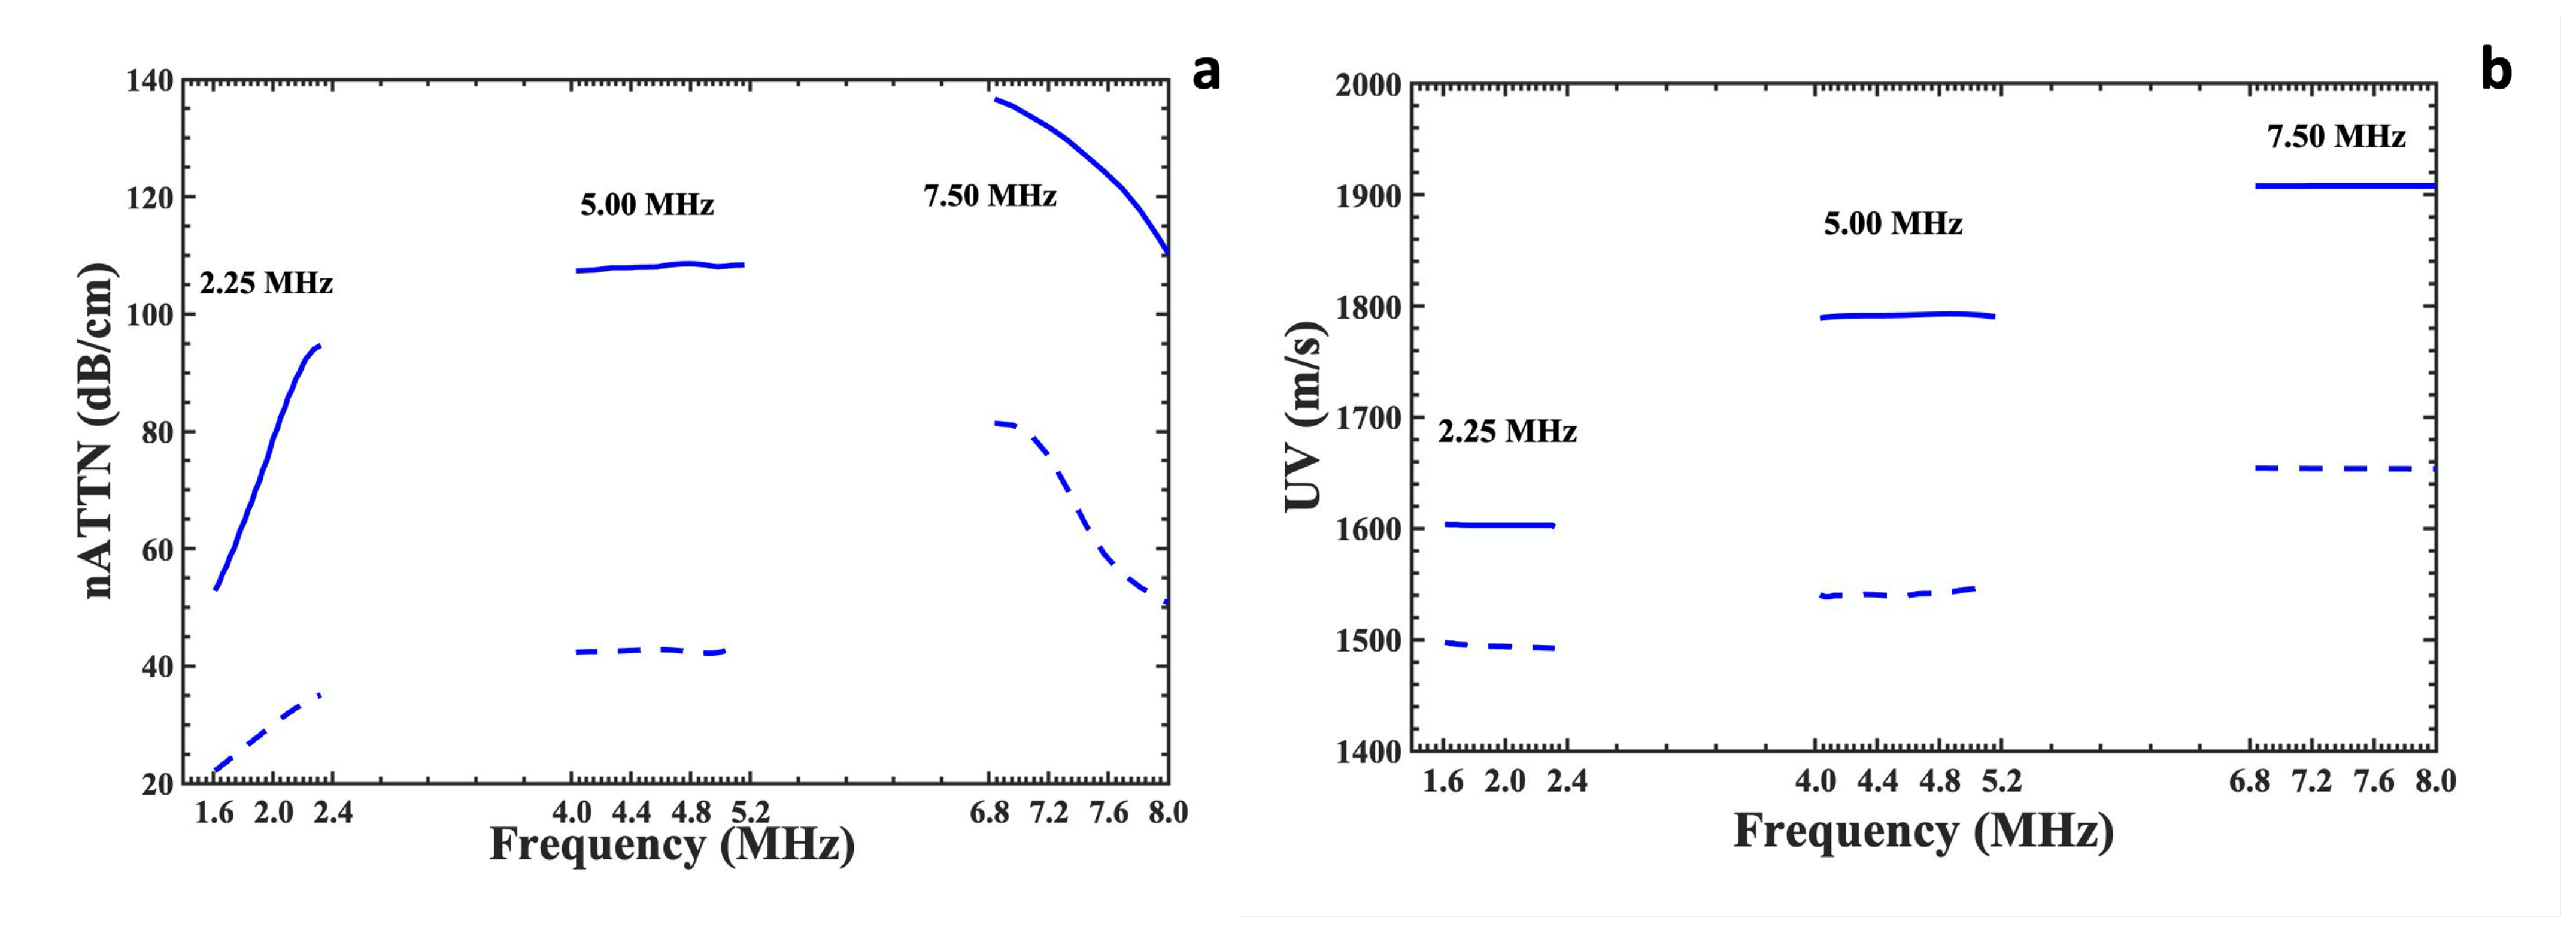
3.2. Calculation of Ultrasound Parameters for Cancellous Bone Samples

The frequency-dependent nATTN, nBUA, and UV values for each bone sample were calculated from the amplitude spectra using three pairs of transducers (2.25, 5.0, and 7.50 MHz center frequency) at five different locations for each bone sample, as shown in Figure 1b. Figure 3 represents the relative amplitudes of the transmitted signals through reference, i.e., distilled water (solid black line) and the bone specimen (blue dotted line—highest porosity and solid blue line—lowest porosity) using 2.25, 5.00 and 7.50 MHz transducers over their respective −3.0 dB bandwidth frequency, measured at the center of the sample. The relative amplitudes are the ratio of absolute FFT amplitudes to the centre-frequency amplitude of the reference. It was observed that the ultrasound amplitude gradually reduces as the frequency increases.
A comparative measure of the attenuation coefficients and velocity of highest porous (dotted blue line) and lowest porous (solid blue line) bone samples (corresponding to Figure 3 over the −3.0 dB frequency bandwidth at 2.25, 5.00 and 7.50 MHz are presented in Figure 4a,b. The attenuation coefficients of bone samples linearly increase at 2.25 MHz, remain almost constant at 5.00 MHz and decrease at 7.50 MHz within the respective −3.0 dB bandwidth frequency range irrespective of porosity. The nature of plots at these frequency ranges could be attributed to the various scattering phenomena due to the non-uniform pore size distributions of the bone samples. The wavelength of these transducers varies from 0.67 to 0.20 mm, whereas the pore sizes of the cancellous bone in our study lie in the range of 0.009 to 1.691 mm. The nBUA values for 5.00 and 7.50 MHz transducers were calculated over the linear regions corresponding to (2.00 MHz–3.50 MHz) and (4.00 MHz–6.00 MHz), respectively, which fall within their respective at a −20 dB bandwidth region.
Positive (negative) ultrasound dispersion is indicated by an increase (decrease) in the value of the phase velocity as frequency increases. A nondispersive relationship occurs when no change in phase velocity with frequency. UV dispersion for the lowest porous bone (60.99%) can be approximated as slightly negative (−2.29 m/s) in the frequency range of (1.68–2.32 MHz), slightly positive (1.28 m/s) in the frequency range of (4.02–5.14 MHz), and no dispersion (0.74 m/s) in the frequency range of (6.34–7.49 MHz), as measured using 2.25, 5.00 and 7.50 MHz transducers. For the highest porous bone (82.42%), the velocity dispersion was measured as 0.29 m/s for (1.68–2.32 MHz), 0.22 m/s for (4.02–5.14 MHz) and 0.13 m/s for (6.34–7.49 MHz), as measured using 2.25, 5.00 and 7.50 MHz transducers. It was observed that UV remains nondispersive for the highest (82.42%) and all higher porous bone samples (beyond 70.18%) at all the frequency ranges. These results are not consistent with the predictions from a Kramers–Kronig (KK) relationship between UV and attenuation in the bone samples, which states that material that exhibits the attenuation must also display dispersion; however, this relationship is valid only if the material satisfies the conditions of linearity and causality [46].
These plots demonstrate that the ability of attenuation coefficients and velocity to vary significantly from lowest porous bone to highest porous bone. Harrar and Jennane had successfully demonstrated that the relation between porosity–lacunarity values (which is a second-order fractal metric values) and porosity–star volume distribution values (SVD) from the 2D radiographic cancellous bone images could discriminate osteoporotic bone from the normal bone [18]. These findings strongly indicate that the porosity of cancellous bone could be used as an indicator for the detection of osteoporosis.

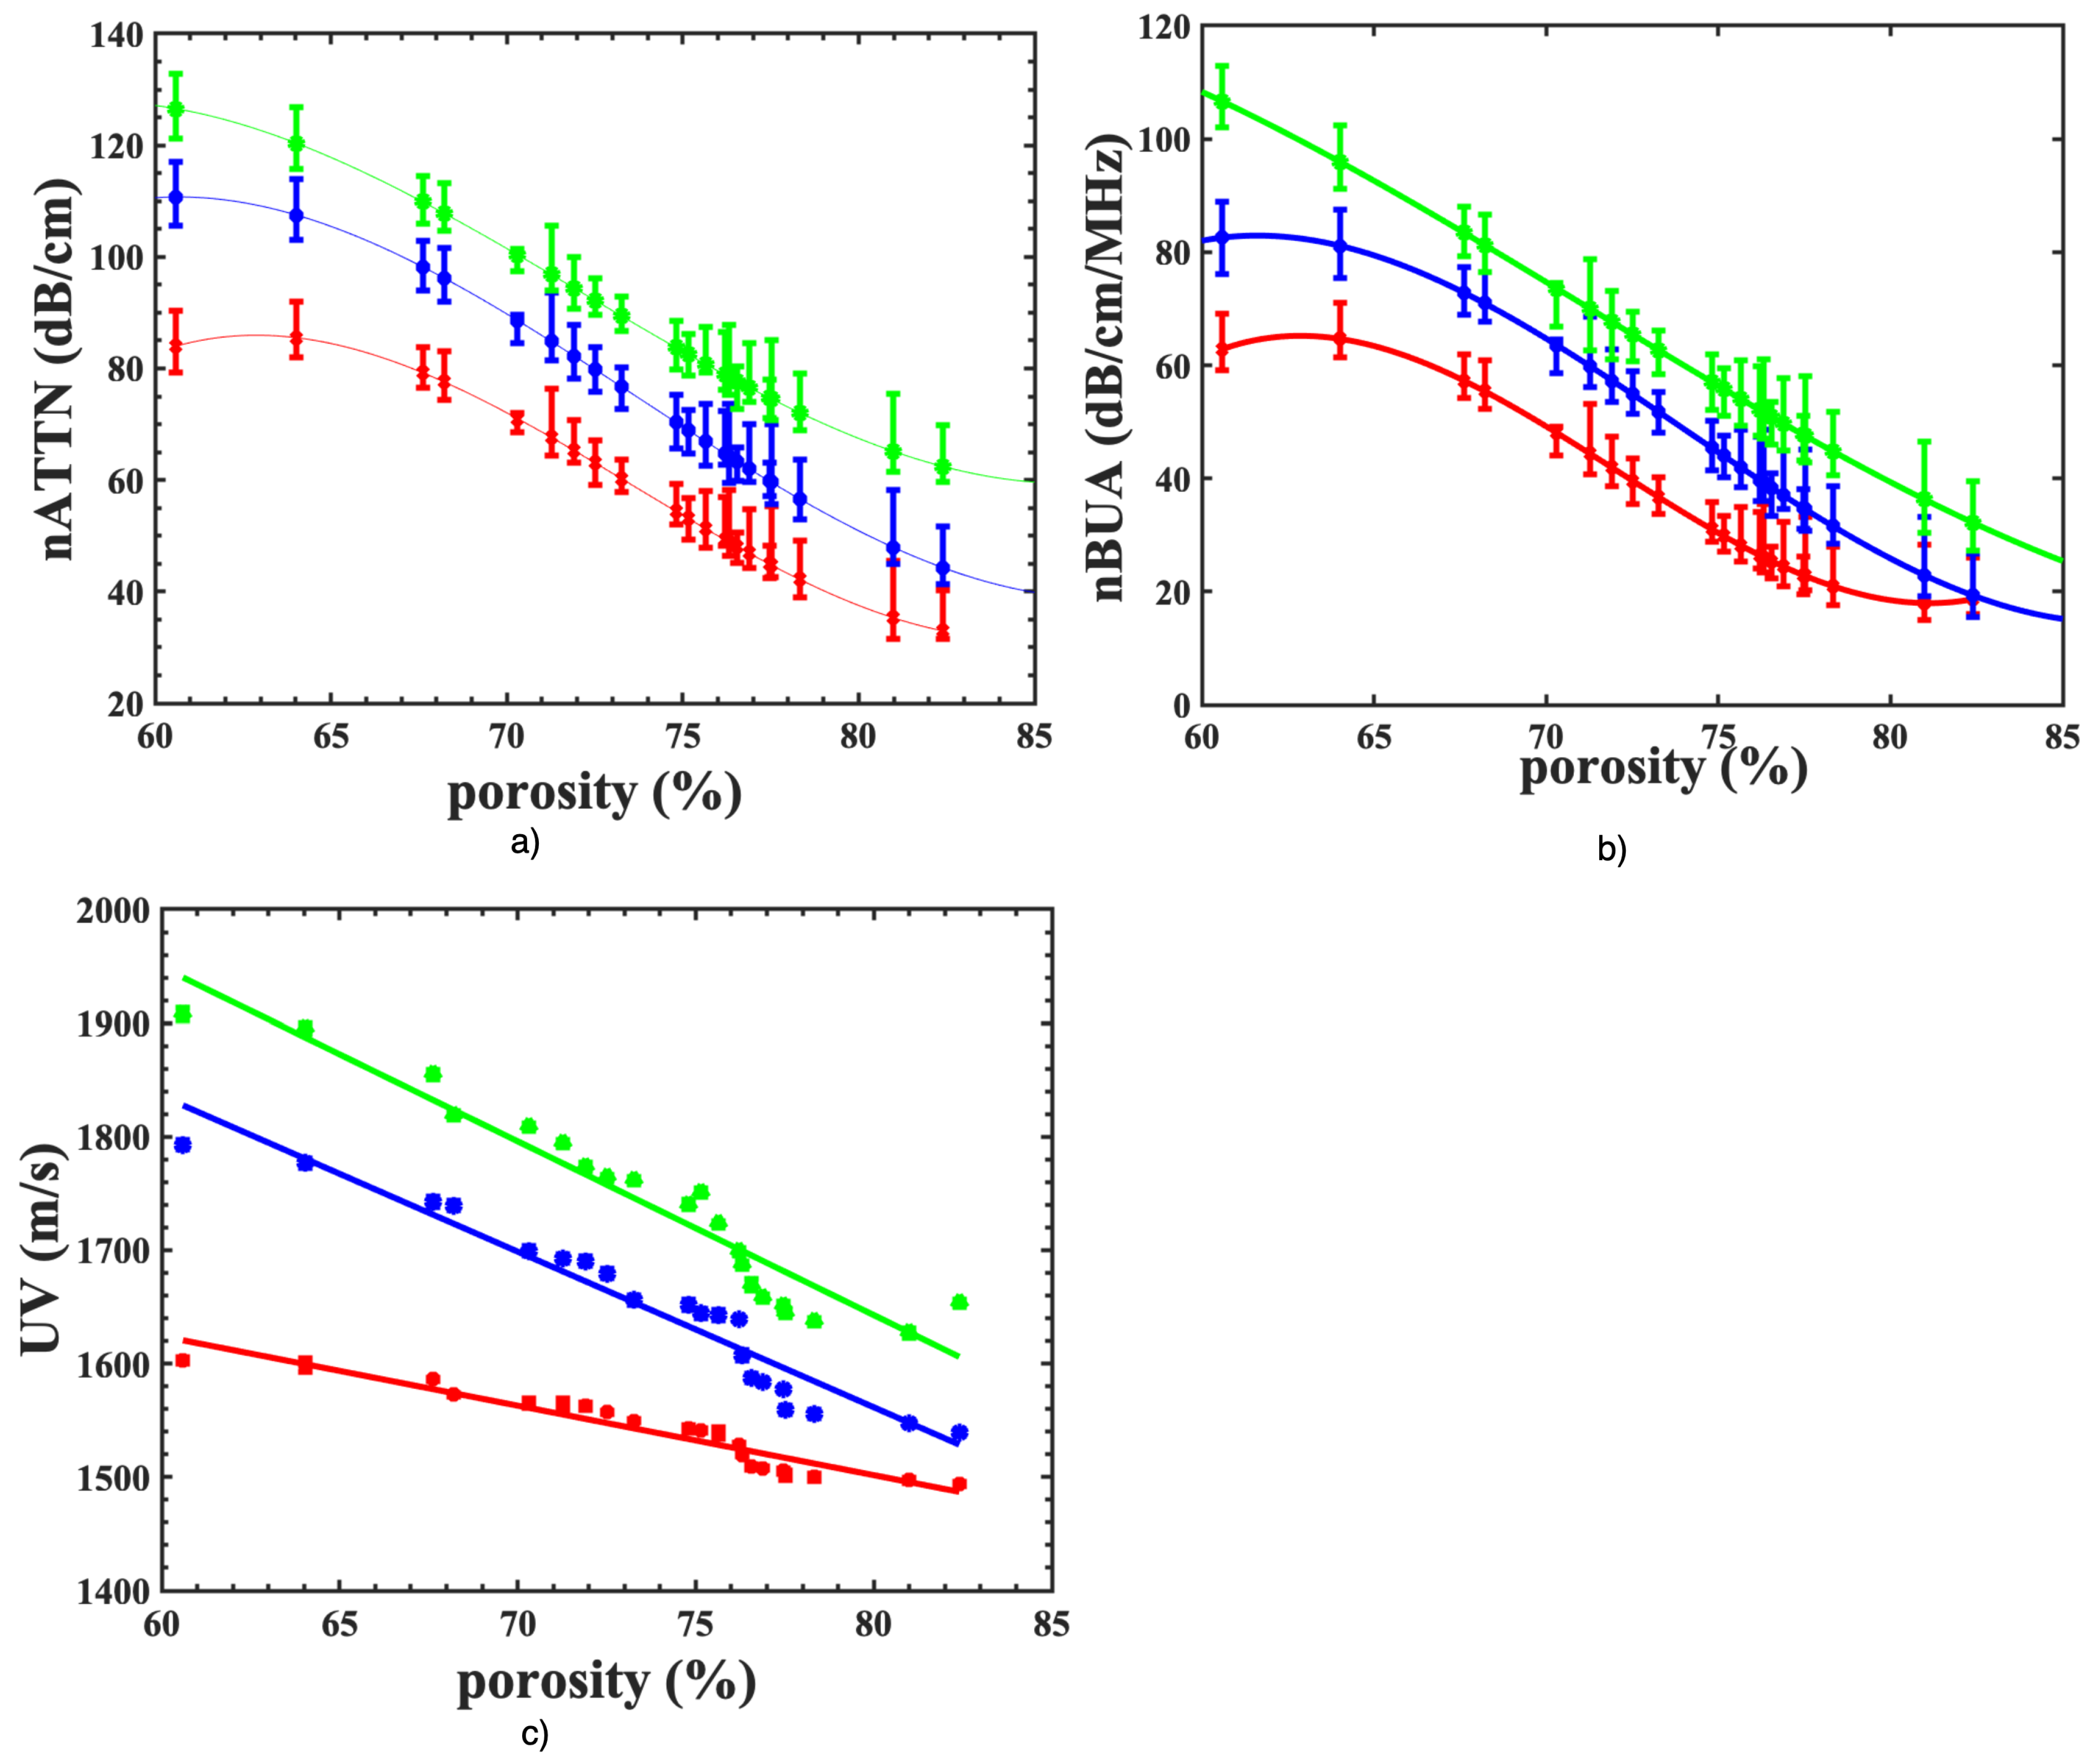
3.3. Relationship between Porosity and Ultrasonic Parameters of Bone Samples

The ultrasound parameters, attenuation coefficients (nATTN), normalized BUA (nBUA), and velocity (UV) of 21 bovine cancellous bones as a function of porosity are plotted in Figure 5a–c using three transducers of center frequencies of 2.25 (red), 5.00 (blue) and 7.50 MHz (green). Each curve in Figure 5a exhibits nonlinear characteristics with a minimum value of nATTN at the highest porosity and maximum at lowest porosity, which is expressed by a cubic polynomial fit (solid lines), with the correlation coefficients (R 2 ) of 0.98, 0.97 and 0.96 at 2.25, 5.00 and 7.50 frequency, respectively. A similar nonlinear relationship between nBUA and porosity is depicted in Figure 5b. By contrast, the UV values plotted in Figure 5c were observed to have an approximately linear variation with porosity at all frequencies, implying that the highly porous bone sample will have the lowest value of phase velocity and vice versa for the range of porosities of our samples.
The mean value of attenuation coefficients (nATTN) ranges from 32.15–85.17 dB/cm for 2.25 MHz, 46.67–113.57 dB/cm for 5.0 MHz and 64.79–126.75 dB/cm for 7.50 MHz for the bone samples in the order of decreasing porosity. In the same order of porosity, the mean phase velocity varies from 1493.93 m/s to 1602.86 m/s (2.25 MHz), 1539.96 m/s to 1792.02 m/s (5.00 MHz) and 1653.96 m/s to 1908.18 m/s (7.50 MHz). The respective range of the mean value of nBUA is 18.85–64.31 dB/cm for 2.25 MHz, 21.66–85.57 dB/cm for 5 MHz and 34.63–109.15 dB/cm for 7.50 MHz. A trend of increase of these ultrasound parameters was observed with an increase in frequency (2.25–7.50 MHz). The mean average attenuation of the lowest (60.99%) and highest (82.42%) porous samples increased by 32.64 dB and 41.58 dB, respectively, when the transducer center frequency was increased from 2.25 MHz to 7.50 MHz.

3.4. Role of Pore Size Distribution on Ultrasound Parameters of Bone Samples

The Bruker SkyScan 1173 Micro-CT machine was used to measure the pore size distribution of nine cancellous bone samples, which was found to be in the range of 0.009–1.691 mm within an uncertainty of 0.001 mm, indicating the inhomogeneous nature of cancellous bone. However, as demonstrated in Table 1, the pore size distribution varies for each bone sample, correlating to varying porosity. The highly porous cancellous bone sample (porosity 82.40%) has pore sizes ranging from 0.009 to 1.691 mm. In contrast, the low porosity specimen (porosity 60.99%) has pore sizes ranging from 0.009 to 0.841 mm, implying that bigger pore sizes correlate to greater porosity values. The non-uniform pore size distribution could be the reason for the fluctuations of nATTN and nBUA values within the five different measurement locations of the sample, shown by the error bars in Figure 5a,b. This fluctuation is consistent across all bone samples at all frequencies. The similar tread of the variability of ultrasound parameters with porosity at (2.25–7.5 MHz) frequencies, as shown by our study, suggests that the relationship between them and porosity is independent on pore size distribution.

4. Conclusions

The through transmission ultrasonic spectroscopy method was used to investigate the ultrasound wave propagation through twenty-one bovine cancellous bone samples in the frequency range of 1.68–7.89 MHz using matched transducers of three different center frequencies (2.25, 5.00 and 7.50 MHz). Using the water saturation method, the bone porosity of these samples was measured and found to be in the range of 60.99–82.42%. Nine samples were examined using a QCT scan to study the influence of pore size on these parameters. The measured porosity value from the QCT scan matched that of the water saturation method within the experimental uncertainty. The relative orientation between the ultrasonic beam and the bone samples was maintained as the mediolateral (ML) direction of the bovine tibia where the trabeculae are aligned in the perpendicular direction to propagation at normal incidence (the same as used in vivo measurements). The attenuation coefficients, nBUA and phase velocity of bovine cancellous bone samples were presented as functions of frequency and porosity using these transducers since these ultrasound parameters are very effective means of material characterization.
It was experimentally observed that the attenuation coefficient curve of bone samples linearly increases at 2.25 MHz, remains almost constant at 5.00 MHz, and decreases at 7.50 MHz within their respective −3.0 dB bandwidth frequency range, irrespective of porosity. The ultrasound velocity dispersion of the lowest porosity bone sample (60.99%) can be approximated as slightly negative at lower and slightly positive at a higher frequency range. At the same time, it remains nondispersive for the highest (82.42%) and all other porous bone samples (>70%) at all the frequency ranges, as measured using 2.25, 5.00 and 7.50 MHz transducers. The nonlinear relationship of porosity-nATTN and porosity-nBUA can be described by a cubic polynomial fit and the porosity–UV relationship by a linear fit, which might be caused by the various scattering phenomena from the non-uniform pore size distributions (pore size varying from 0.009 to 1.691 mm) of the bone samples, as the wavelength of these transducers varies from 0.67 to 0.20 mm. This study also suggests that the non-uniform pore size distribution can influence the measured nATTN, nBUA values, leading to fluctuation within the same bone specimen; however, the relationship between porosity between nATTN and nBUA is independent of pore size distribution, which is valid for all frequencies (2.25–7.5 MHz). A trend of increase of these ultrasound parameters was observed with an increase in frequency (2.25–7.50 MHz). These higher values of nATTN at higher frequency correspond to a higher rate of loss of acoustic energy, which is not ideal for clinical quantitative ultrasound applications. However, the higher frequency means shorter wavelength, which can provide better spatial and axial resolutions of the bone microarchitecture images for the structural analysis applications, indicating that UV measurement at a higher frequency might be suitable for diagnostic purposes. This study hypothesizes that the high and low porous bone could be distinguished by studying the curves of attenuation coefficients measured by the transducer within the bandwidth, as shown in Figure 4a, which strongly manifests the idea that this relationship between attenuation coefficients and porosity could be used for clinical measurements based on a t-score of osteoporotic bone with that of normal bone in a similar fashion as bone mineral density (BMD) is measured. However, this analysis is based on the bovine cancellous bone specimens, whose porosity range (60.99–82.40% in this study) is relatively lower than human cancellous bone (75–95%). As this study also indicates that different pore size distributions can lead to other scattering mechanisms, the mode of interaction of ultrasound can be entirely different with human cancellous bone compared to bovine cancellous bone. The study should be extended to account for this possibility by conducting in vitro experiments using much higher porous samples (>84.90%) or real osteoporotic human cancellous bone specimens. Furthermore, this study could not explain the ultrasonic behavior of the ultrasonic parameters for the cancellous bone with less than 60.99% porosity. The study should also be validated using theoretical models for a general clinical consensus. Despite all these limitations, these results seem promising, and give a new diagnostic parameter to identify the osteoporotic bone using ultrasound technology.

Author Contributions

Conceptualization, A.K. and J.W.; methodology, A.K.; validation, A.K.; formal analysis, A.K.; investigation, A.K.; resources, J.W.; writing—original draft preparation, A.K.; writing—review and editing, A.K.; visualization, J.W.; supervision, J.W.; project administration, J.W.; funding acquisition, J.W. All authors have read and agreed to the published version of the manuscript.

Funding

This research received no external funding.

Institutional Review Board Statement

Not applicable.

Informed Consent Statement

Not applicable.

Data Availability Statement

Not applicable.

Acknowledgments

The authors wish to thank Aijun He for the acoustic microscopy setup and Bijay KC for the support with using a CT scan machine at the Department of Civil and Environmental Engineering at the University of Vermont.

Conflicts of Interest

The authors declare no conflict of interest.

References

  1. Marcus, R.; Bouxsein, M. Understanding osteoporosis. West. J. Med. 2008, 155, 53–60. [Google Scholar]
  2. Peck, W.A. Consensus development conference: Diagnosis, prophylaxis, and treatment of osteoporosis. Am. J. Med. 1993, 94, 646–650. [Google Scholar]
  3. Frost, M.L.; Blake, G.M.; Fogelman, I. Quantitative Ultrasound and Bone Mineral Density Are Equally Strongly Associated with Risk Factors for Osteoporosis. J. Bone Miner. Res. 2001, 16, 406–416. [Google Scholar] [CrossRef]
  4. Njeh, C.F.; Boivin, C.M.; Langton, C.M. The role of ultrasound in the assessment of osteoporosis: A review. Osteoporosis Int. 1997, 7, 1433–2965. [Google Scholar] [CrossRef] [PubMed]
  5. Langton, C.M.; Palmer, S.B.; Porter, R.W. The Measurement of Broadband Ultrasonic Attenuation in Cancellous Bone. Eng. Med. 1984, 13, 89–91. [Google Scholar] [CrossRef] [Green Version]
  6. Turner, C.H.; Peacock, M.; Timmerman, L.; Neal, J.M.; Johnston, C.C. Calcaneal ultrasonic measurements discriminate hip fracture independently of bone mass. Osteoporos. Int. 2001, 5, 130–135. [Google Scholar] [CrossRef]
  7. Kaufman, J.J.; Einhorn, T.A. Ultrasound assessment of bone. J. Bone Miner. Res. 1998, 8, 517–525. [Google Scholar] [CrossRef]
  8. Nicholson, P.H.F.; Müller, R.; Lowet, G.; Cheng, X.G.; Hildebrand, T.; Rüegsegger, P.; Vander, P.G.; Dequeker, J.; Boonen, S. Do quantitative ultrasound measurements reflect structure independently of density in human vertebral cancellous bone? Bone 1997, 23, 425–431. [Google Scholar] [CrossRef]
  9. Njeh, C.F.; Hodgskinson, R.; Currey, J.D.; Langton, C.M. Orthogonal relationships between ultrasonic velocity and material properties of bovine cancellous bone. Med. Eng. Phys. 1996, 18, 373–381. [Google Scholar] [CrossRef]
  10. Tavakoli, M.B.; Evans, J.A. Dependence of the velocity and attenuation of ultrasound in bone on the mineral content. Phys. Med. Biol. 1991, 36, 1529–1537. [Google Scholar] [CrossRef]
  11. Harrar, K.; Hamami, L.; Akkoul, S.; Lespessailles, E.; Jennane, R. Osteoporosis assessment using Multilayer Perceptron neural networks. In Proceedings of the 2012 3rd International Conference on Image Processing Theory, Tools and Applications (IPTA), Istanbul, Turkey, 15–18 October 2012; pp. 217–221. [Google Scholar]
  12. Chaffaı, S.; Peyrin, F.; Nuzzo, S.; Porcher, R.; Berger, G.; Laugier, P. Ultrasonic characterization of human cancellous bone using transmission and backscatter measurements: Relationships to density and microstructure. Bone 2002, 30, 229–237. [Google Scholar] [CrossRef]
  13. Hans, D.; Schott, A.M.; Meunier, P.J. Ultrasonic assessment of bone: A review. Eur. J. Med. 1993, 3, 157–163. [Google Scholar]
  14. Wear, K.A. Mechanisms of interaction of ultrasound with cancellous bone: A review. IEEE Trans. Ultrason. Ferroelectr. Freq. Control. 2019, 67, 454–482. [Google Scholar] [CrossRef] [PubMed]
  15. Hodaei, M.; Maghoul, P.; Popplewell, N. An overview of the acoustic studies of bone-like porous materials, and the effect of transverse acoustic waves. Int. J. Eng. Sci. 2020, 147, 103189. [Google Scholar] [CrossRef]
  16. Fields, A.J.; Lee, G.L.; Liu, X.S.; Jekir, M.G.; Guo, X.E.; Keaveny, T.M. Influence of vertical trabeculae on the compressive strength of the human vertebra. J. Bone Miner. Res. 2020, 147, 103189. [Google Scholar] [CrossRef] [Green Version]
  17. Seeman, E. Age- and Menopause-Related Bone Loss Compromise Cortical and Trabecular Microstructure. J. Gerontol. Ser. A 2013, 68, 1218–1225. [Google Scholar] [CrossRef] [Green Version]
  18. Harrar, K.; Jennane, R. Quantification of trabecular bone porosity on X-ray images. J. Ind. Intell. Inf. 2015, 3, 280–285. [Google Scholar] [CrossRef]
  19. Hosokawa, A.; Otani, T. Ultrasonic wave propagation in bovine cancellous bone. J. Acoust. Soc. Am. 1997, 101, 558–562. [Google Scholar] [CrossRef]
  20. Clarke, A.J.; Evans, J.A.; Truscott, J.G.; Milner, R.; Smith, M.A. A phantom for quantitative ultrasound of trabecular bone. Phys. Med. Biol. 1994, 39, 1677. [Google Scholar] [CrossRef] [PubMed]
  21. Williams, J.L.; Grimm, M.J.; Wehrli, F.W.; Foster, K.R.; Chung, H.W. Prediction of frequency and pore size dependent attenuation of ultrasound in trabecular bone using Biot theory. In Mechanics of Poroelastic Media; Selvadurai, A.P.S., Ed.; Springer: Dordrecht, The Netherlands, 1996; pp. 263–271. [Google Scholar]
  22. Hans, D.; Fuerst, T.; Duboeuf, F. Quantitative ultrasound bone measurement. Eur. Radiol. 1997, 7, S43. [Google Scholar] [CrossRef]
  23. Hodgskinson, R.; Njeh, C.F.; Whitehead, M.A.; Langton, C.M. The nonlinear relationship between BUA and porosity in cancellous bone. Phys. Med. Biol. 1996, 41, 2411–2420. [Google Scholar] [CrossRef]
  24. Serpe, L.; Rho, J.Y. Assessment of bone density using ultrasonic backscatter. J. Biomech. 1996, 29, 963–966. [Google Scholar] [CrossRef]
  25. Strelitzki, R.; Evans, J.A.; Clarke, A.J. The influence of porosity and pore size on the ultrasonic properties of bone investigated using a phantom material. Osteoporos. Int. 1997, 7, 370–375. [Google Scholar] [CrossRef] [PubMed]
  26. Wear, K.A. Group velocity, phase velocity, and dispersion in human calcaneus in vivo. J. Acoust. Soc. Am. 2007, 121, 2431–2437. [Google Scholar] [CrossRef]
  27. Nicholson, P.H.F.; Lowet, G.; Langton, C.M.; Dequeker, J.; Van der Perre, G. A comparison of time-domain and frequency-domain approaches to ultrasonic velocity measurement in trabecular bone. Phys. Med. Biol. 1996, 41, 2421. [Google Scholar] [CrossRef]
  28. Wear, K.A. The dependencies of phase velocity and dispersion on trabecular thickness and spacing in trabecular bone-mimicking phantoms. J. Acoust. Soc. Am. 2005, 118, 1186–1192. [Google Scholar] [CrossRef]
  29. Wear, K.A. The dependencies of phase velocity and dispersion on volume fraction in cancellous-bone-mimicking phantoms. J. Acoust. Soc. Am. 2009, 125, 1197–1201. [Google Scholar] [CrossRef] [PubMed]
  30. Haiat, G.; Naili, S. Independent scattering model and velocity dispersion in trabecular bone: Comparison with a multiple scattering model. Biomech. Model. Mechanobiol. 2011, 10, 95–108. [Google Scholar] [CrossRef]
  31. Bauer, A.Q.; Marutyan, K.R.; Holland, M.R.; Miller, J.G. Negative dispersion in bone: The role of interference in measurements of the apparent phase velocity of two temporally overlapping signals. J. Acoust. Soc. Am. 2011, 123, 2407–2414. [Google Scholar] [CrossRef] [Green Version]
  32. Anderson, C.C.; Marutyan, K.R.; Holland, M.R.; Wear, K.A.; Miller, J.G. Interference between wave modes may contribute to the apparent negative dispersion observed in cancellous bone. J. Acoust. Soc. Am. 2008, 124, 1781–1789. [Google Scholar] [CrossRef] [PubMed]
  33. Hughes, E.R.; Leighton, T.G.; Petley, G.W.; White, P.R. Ultrasonic propagation in cancellous bone: A new stratified model. Ultrasound Med. Biol. 1999, 25, 811–821. [Google Scholar] [CrossRef]
  34. Pal, S.; Saha, S.; Reddy, G.N. Frequency Dependence of Ultrasonic Characteristics of Cancellous Bone. In Biomedical Engineering I; Saha, S., Ed.; Publishing House: Oxford, UK, 1982; pp. 352–356. [Google Scholar]
  35. Fry, F.J.; Barger, J.E. Acoustical properties of the human skull. J. Acoust. Soc. Am. 1978, 63, 1576–1590. [Google Scholar] [CrossRef]
  36. Lee, K.I.; Roh, H.S.; Yoon, S.W. Acoustic wave propagation in bovine cancellous bone: Application of the Modified Biot-Attenborough model. J. Acoust. Soc. Am. 2003, 114, 2284–2293. [Google Scholar] [CrossRef]
  37. Cardoso, L.; Teboul, F.; Laurent, S.; Christian, O.; Meunier, A. In vitro acoustic waves propagation in human and bovine cancellous bone. J. Bone Miner. Res. 2003, 18, 1803–1812. [Google Scholar] [CrossRef]
  38. Nicholson, P.H.F.; Strelitzki, R.; Cleveland, R.O.; Bouxsein, M.L. Scattering of ultrasound in cancellous bone: Predictions from a theoretical model. J. Biomech. 2000, 33, 503–506. [Google Scholar] [CrossRef]
  39. Hosokawa, A.; Otani, T. Acoustic anisotropy in bovine cancellous bone. J. Acoust. Soc. Am. 1998, 103, 2718–2722. [Google Scholar] [CrossRef] [PubMed]
  40. Haire, T.J.; Langton, C.M. Biot theory: A review of its application to ultrasound propagation through cancellous bone. Bone 1999, 24, 291–295. [Google Scholar] [CrossRef]
  41. Sebaa, N.; Fellah, Z.E.A.; Fellah, M.; Ogam, E.; Wirgin, A.; Mitri, F.G.; Depollier, C.; Lauriks, W. Ultrasonic characterization of human cancellous bone using the Biot theory: Inverse problem. J. Acoust. Soc. Am. 2006, 120, 1816–1824. [Google Scholar] [CrossRef] [PubMed]
  42. Hosokawa, A. Numerical analysis of variability in ultrasound propagation properties induced by trabecular microstructure in cancellous bone. IEEE Trans. Ultrason. Ferroelectr. Freq. Control. 2009, 56, 738–747. [Google Scholar] [CrossRef] [PubMed]
  43. Wu, J. Determination of velocity and attenuation of shear waves using ultrasonic spectroscopy. J. Acoust. Soc. Am. 1996, 99, 2871–2875. [Google Scholar] [CrossRef]
  44. Lubbers, J.; Graaff, R. A simple and accurate formula for the sound velocity in water. Ultrasound Med. Biol. 1998, 24, 1065–1068. [Google Scholar] [CrossRef]
  45. Kline, R.A. Measurement of attenuation and dispersion using an ultrasonic spectroscopy technique. J. Acoust. Soc. Am. 1984, 76, 498–504. [Google Scholar] [CrossRef]
  46. O’Donnell, M.; Jaynes, E.T.; Miller, J.G. Kramers-Kronig relationship between ultrasonic attenuation and phase velocity. J. Acoust. Soc. Am. 1981, 69, 696–701. [Google Scholar] [CrossRef]
Figure 1. (a) Experimental set-up for the ultrasound measurements; (b) cancellous bone sample with five different spots (red) where measurements were taken.
Acoustics 04 00025 g001
Figure 2. Ultrasound parameter measurements for reference- water (black) and polyethylene disk (blue and red) samples by 2.25 MHz center frequency transducer: (a) amplitude of US signals; (b) normalized attenuation coefficient (nATTN) of the disk; (c) phase velocity of the disk as a function of frequency within its bandwidth; and (d) comparison of nATTN and UV measured by transducer of 2.25, 5.00 and 7.50 MHz center frequency within their −3.0 dB bandwidth. The −3.0 dB bandwidth are 1.62–2.32 MHz for 2.25 MHz, 4.02–5.14 MHz for 5.00 MHz and 6.81–7.89 MHz for 7.5 MHz center frequency transducers.
Acoustics 04 00025 g002
Figure 3. Relative amplitude of ultrasound signals measured by 2.25 MHz, 5.00 and 7.50 MHz center frequency transducers within −3.0 dB bandwidth: reference (black line), 82.40% porous bone sample (dotted blue line) and 60.99% porous bone sample (solid blue line). The −3.0 dB bandwidth are 1.62–2.32 MHz for 2.25 MHz, 4.02–5.14 MHz for 5.00 MHz and 6.81–7.89 MHz for 7.5 MHz center frequency transducers.
Acoustics 04 00025 g003
Figure 4. Measurement of ultrasound parameters of bone samples by 2.25 MHz, 5.00 and 7.50 MHz center frequency transducers within −3.0 dB bandwidth of 82.42% porous bone sample (dotted blue line) and 60.99% porous bone sample (solid blue line). (a) Attenuation (nATTN) and (b) ultrasound velocity (UV) as a function of frequency within −3.0 dB bandwidth frequency. The −3.0 dB bandwidths are 1.62–2.32 MHz for 2.25 MHz, 4.02–5.14 MHz for 5.00 MHz and 6.81–7.89 MHz for 7.5 MHz center frequency transducers.
Acoustics 04 00025 g004
Figure 5. Plot of (a) nATTN (dB/cm), (b) nBUA (dB/cm.MHz) and (c) UV (m/s) of twenty-one bovine bone specimens as a function of porosity measured by three different center frequency transducers of 7.50 MHz (green), 5.00 MHz (blue) and 2.25 MHz (red). Each symbol represents the mean value of each parameter measured at five different spots and the error bar represents one standard deviation of the measurement. The solid line represents the fit line obtained from the polynomial fit of order 3 for (a,b) and the linear fit for (c) using MATLAB software.
Acoustics 04 00025 g005
Table 1. Table of pore size distribution and porosity of nine cancellous bone samples.
SamplePore Size (mm)Porosity %
10.009–0.84160.99
20.009–0.89666.45
30.009–0.94670.18
40.010–1.02672.51
50.009–1.14476.03
60.009–1.25578.36
70.009–1.43279.09
80.009–1.50680.51
90.009–1.69182.42
Publisher’s Note: MDPI stays neutral with regard to jurisdictional claims in published maps and institutional affiliations.

