Article

Investigation of a Tuff Stone Church in Cappadocia via Acoustical Reconstruction

Department of Architecture, Bilkent University, Ankara 06800, Turkey
*
Author to whom correspondence should be addressed.
Acoustics 2022, 4(2), 419-440; https://doi.org/10.3390/acoustics4020026
Submission received: 23 March 2022 / Revised: 5 May 2022 / Accepted: 11 May 2022 / Published: 16 May 2022
(This article belongs to the Special Issue Acoustics, Soundscapes and Sounds as Intangible Heritage)

Abstract

:
This study investigates the indoor acoustical characteristics of a Middle Byzantine masonry church in Cappadocia. The Bell Church is in partial ruins; therefore, archival data and the church’s remains are used for its acoustical reconstruction. The study aims to formulate a methodology for a realistic simulation of the church by testing the applicability of different approaches, including field and laboratory tests. By conducting qualitative and quantitative material tests, different tuff stone samples are examined from the region. Impedance tube tests are performed on the samples from Göreme and Ürgüp to document their sound absorption performances. Previous field tests on two sites in Cappadocia are also used to compare the sound absorption performance of tuff stones, supported by acoustical simulations. The texture, physical and chemical characteristics of the stones together with the measured sound absorption coefficient values are comparatively evaluated for selecting the most suitable material to be applied in the Bell Church simulations. The church was constructed in phases and underwent architectural modifications and additions over time. The indoor acoustical environment of the church is analyzed over objective acoustical parameters of EDT, T30, C50, C80, D50, and STI for its different phases with different architectural features and functional patterns.

1. Introduction

Archaeoacoustics is an interdisciplinary field that focuses on the understanding of acoustical qualities of archaeological sites. Developments in technology have enabled researchers to document and discuss various soundscapes: acoustic environments based on functional context and perception by humans [1]. Scholars who are interested in archaeoacoustics try to gather non-material pieces of evidence from the human past, as a contextual acoustical study of a space can reveal a number of important features regarding the function of the space and the people that inhabited it. Acoustics can bring us invaluable information about intangible parts of a culture such as music, ritual and religion [2]. Consequently, it becomes relevant to enrich the academic discourse on the use of Middle Byzantine spaces in Cappadocia, a region in Central Anatolia, through an archaeoacoustic study.
Cappadocia is a region in Turkey. The region is known for its idiosyncratic volcanic landscape, and is marked by the present-day cities of Aksaray, Nevşehir, Kayseri, and Niğde. Most of the surviving rock-cut and masonry structures in the region correspond to the Middle Byzantine period, especially to the ninth to eleventh centuries [3]. The rock-cut structures of Cappadocia are listed UNESCO World Heritage Sites.
A number of historical structures have been acoustically reconstructed by means of simulations in order to evaluate the spaces’ acoustical characteristics for those locations that cannot be field-tested due to restorations, limited time permissions or for in-depth sound field analysis [4,5,6,7,8,9]. For instance, the acoustics of the buildings from Greek antiquity, such as the Temple of Zeus, have been explored using computer-aided simulations and the results indicate that due to the high reverberance as well as low clarity and intelligibility of the space, the temple is more apt for the performance of hymns and ritual songs rather than speech communication [10]. The acoustic properties of Benevento Roman theatre from A.D. 2 [11] and the little theatre of Pompeii, also known as the “Odeon” [12], have been predicted using ray-tracing simulations by evaluating some of the major acoustical parameters such as EDT, T30, C80, etc. Furthermore, the Roman theatre of Posillipo in Naples has excellent speech comprehension, which has been tested through both field measurements and a virtual model [13].
Similarly, the acoustic make-up of churches has also been virtually recreated; these studies include a domus and basilica [14], the Romanesque cathedral of Santiago de Compostela [15], and the Maior Ecclesia in Cluny [16]. All these studies analyze the acoustic performance of these spaces in regard to liturgical celebrations and other religious music. Virtual aural reconstruction is also used to analyze the three-choir configurations that have been employed in the Cathedral of Granada, Spain [17]. A similar technique is used to document the soundscape of a 14th century Spanish church, which was abandoned in 1836 and is currently in ruins [18]. The effect of occupancy and festive decorations on the acoustics of a church from the Baroque Period (San Petronio Basilica) reveals that during festive seasons of the era, the church would have significantly reduced reverberation times [19].
The study is one of the first archaeoacoustic studies pursued in Cappadocia, which is a region that has always been a topic of academic discourse. With archaeoacoustic studies that would bring forward intangible aspects of the Middle Byzantine Cappadocian life, the region, its people and their lifestyles can be better understood and documented. In order to contribute to the acoustical archive of historical sites, this study aims to analyze the indoor acoustical climate of the remains of a Middle Byzantine masonry church (Bell Church) in Cappadocia by means of virtual reconstruction of its aural environment. The methodology covers ray-tracing room acoustic simulations, which are supported by previous field tests conducted in different structures of the nearby region, and impedance tube tests for determining the sound absorption characteristics of tuff rocks. The study compares the changes in the acoustical performance of the church over its two phases of construction by using available drawings of the original states. Gathering the sound absorption coefficient data of the material, which is predominantly tuff rock, is the most challenging part of this research. In this regard, field tests of other structures from the same region (Hallaç Church and Avanos Dining Hall) [20] and their simulations, as well as impedance test results of tuff stone samples from different areas of the region are compared for their further application in the church’s simulations. This paper is structured as follows. Section II sets out the historical and architectural features of Cappadocia and the Bell Church. Section III gives details of the methodologies used for collecting and analyzing the data, ray-tracing model implementation and calibration, and impedance tube tests. In Section IV, the results are discussed in detail. Section V concludes the paper by emphasizing the major findings.

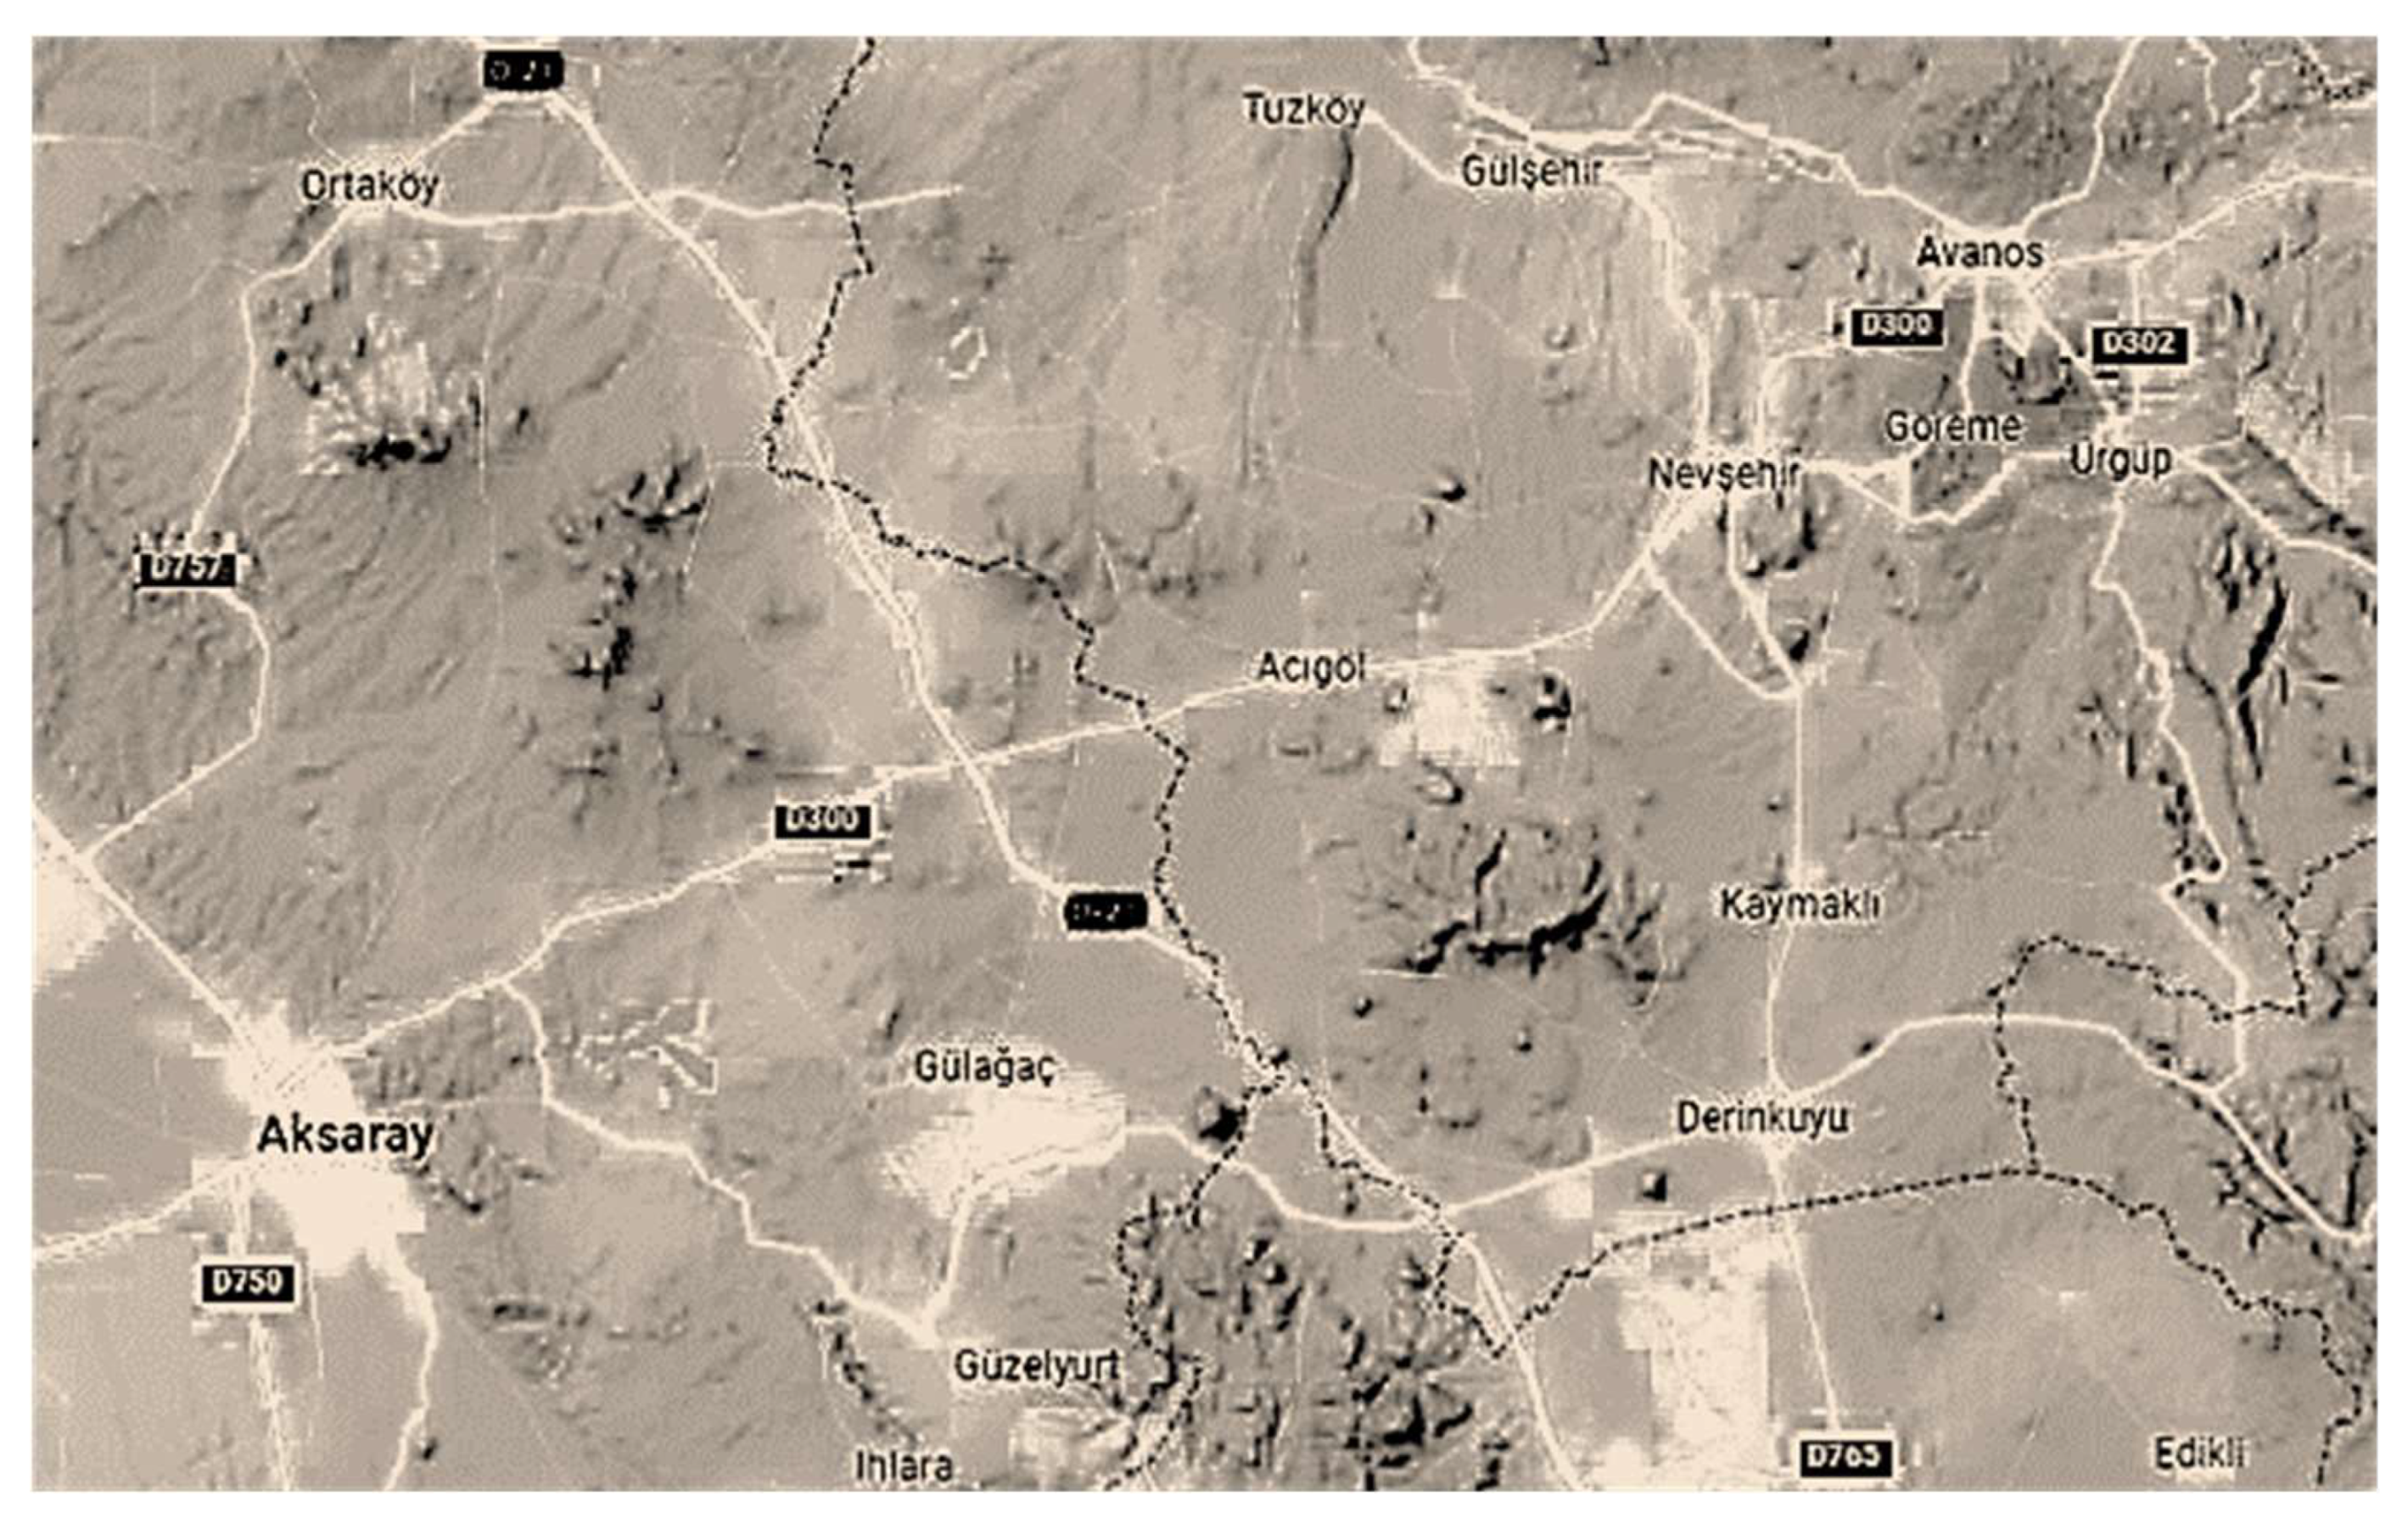
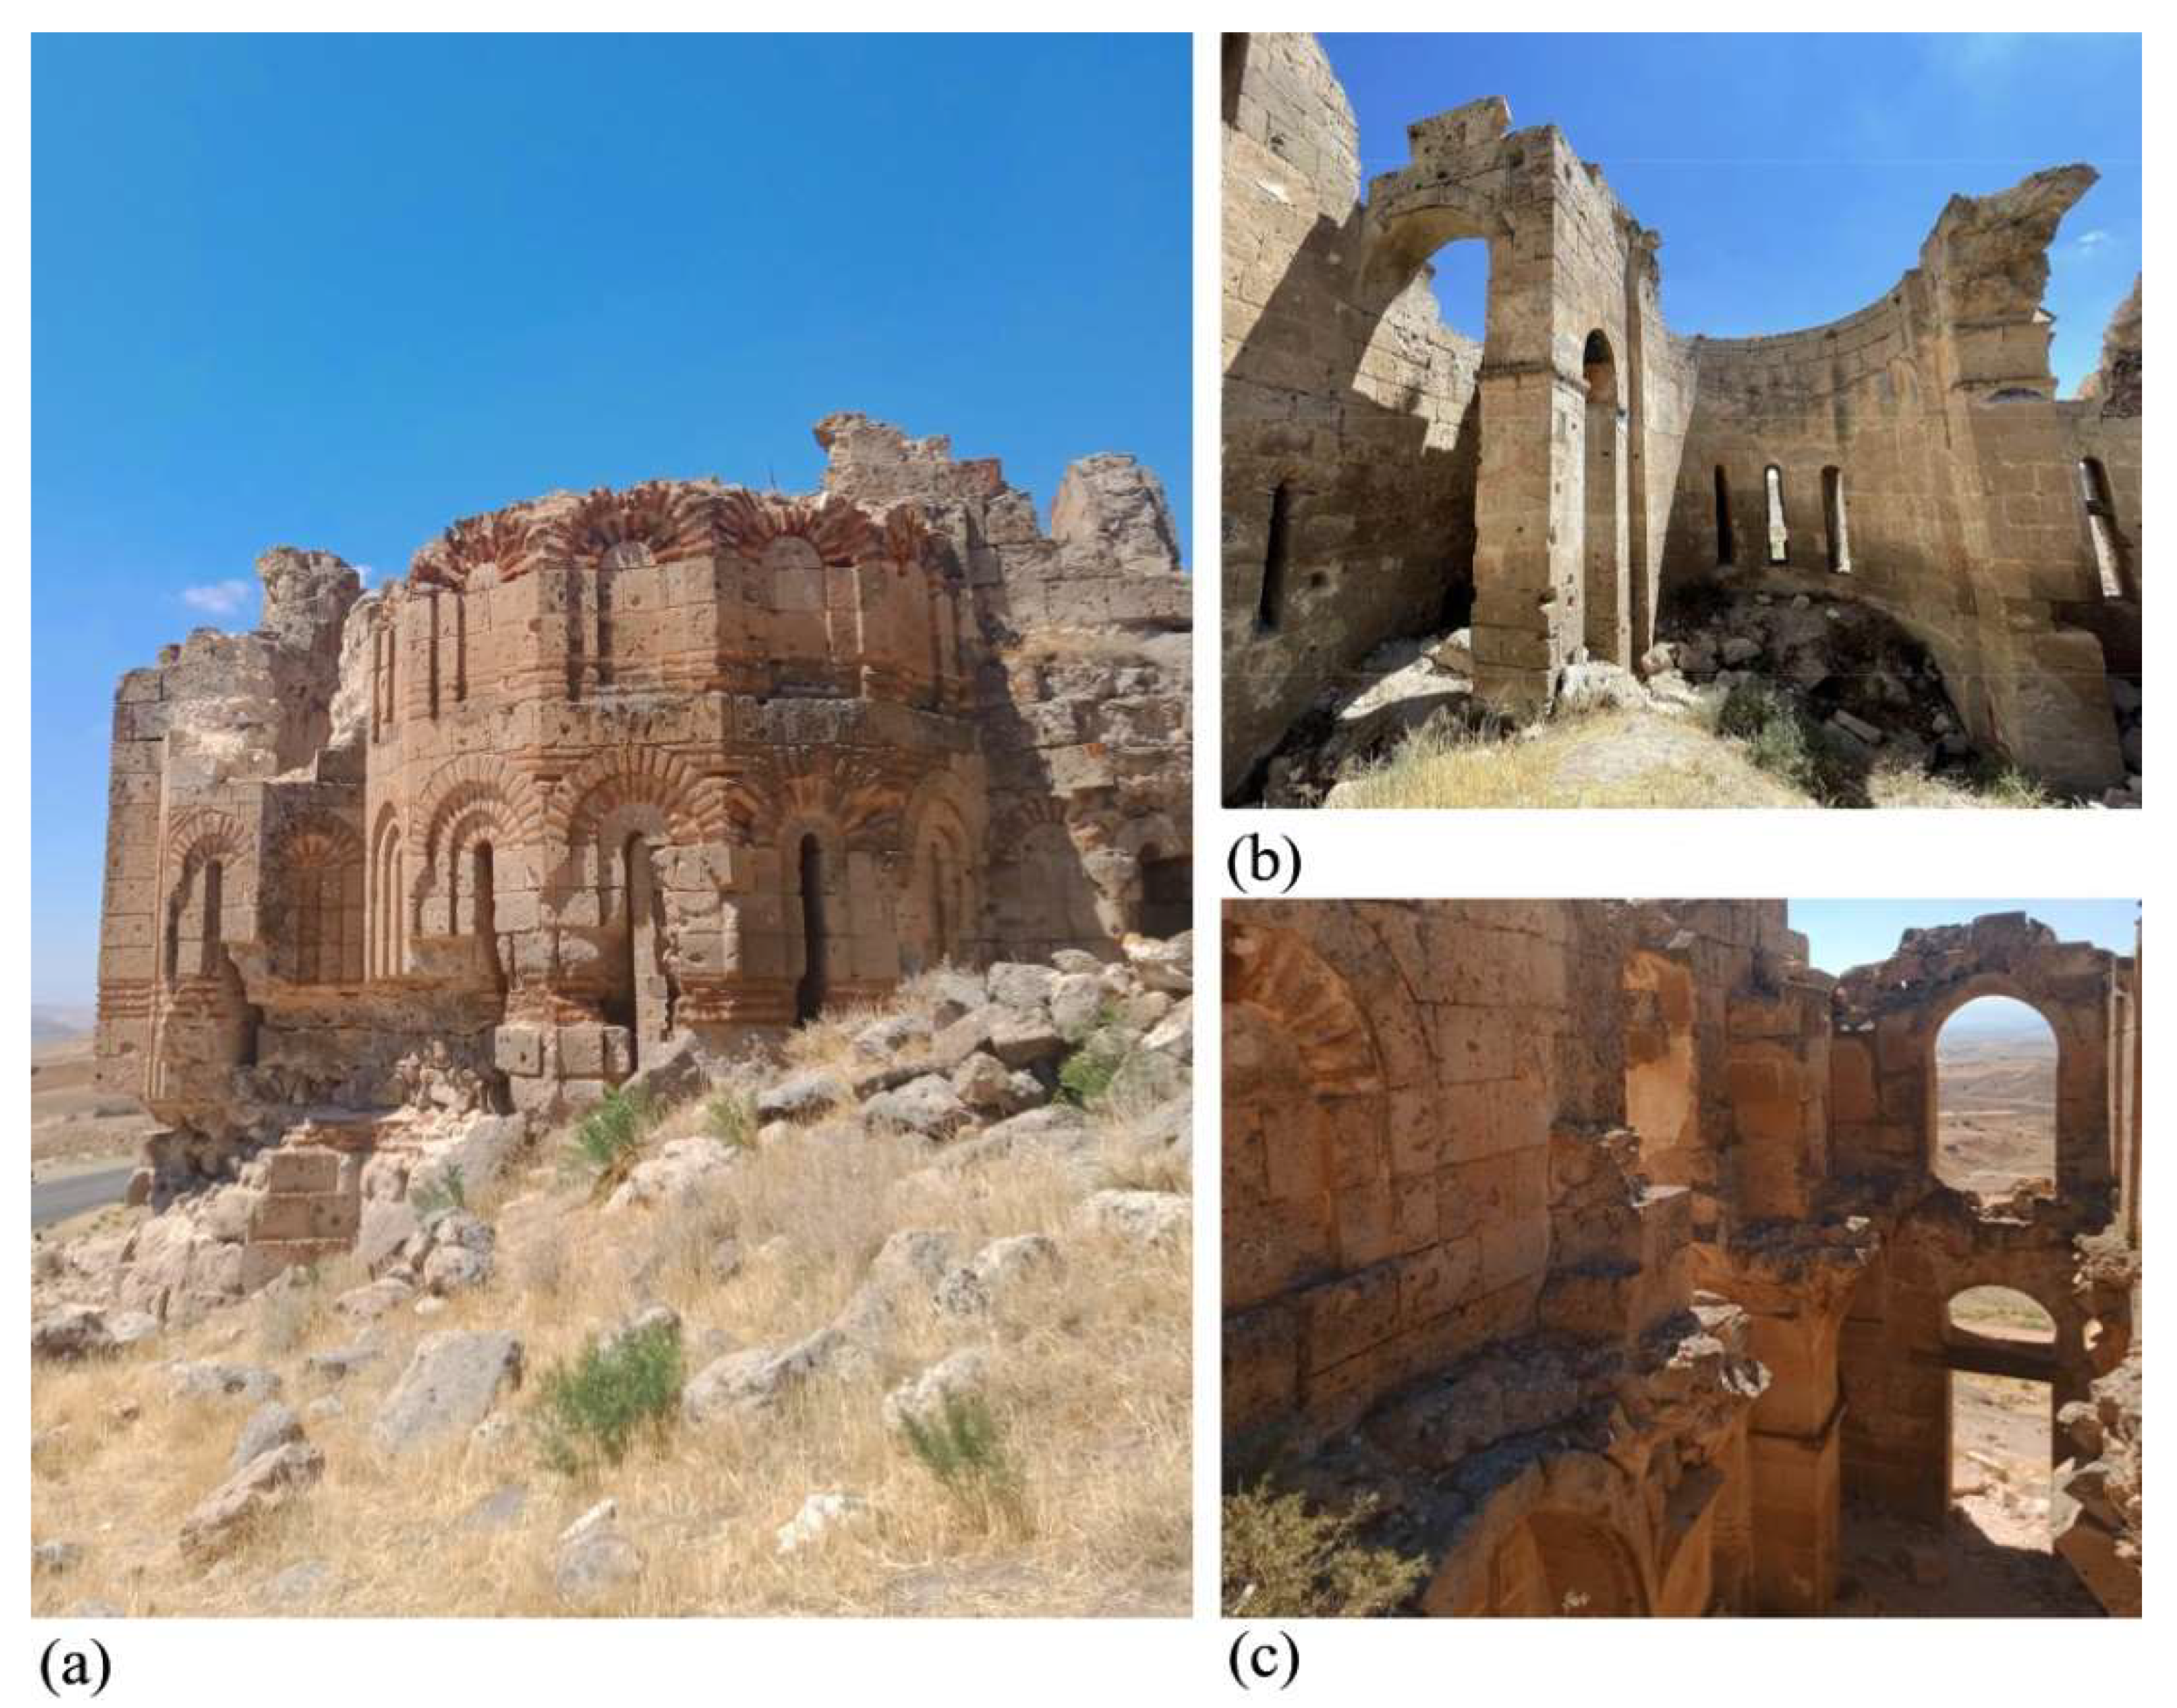
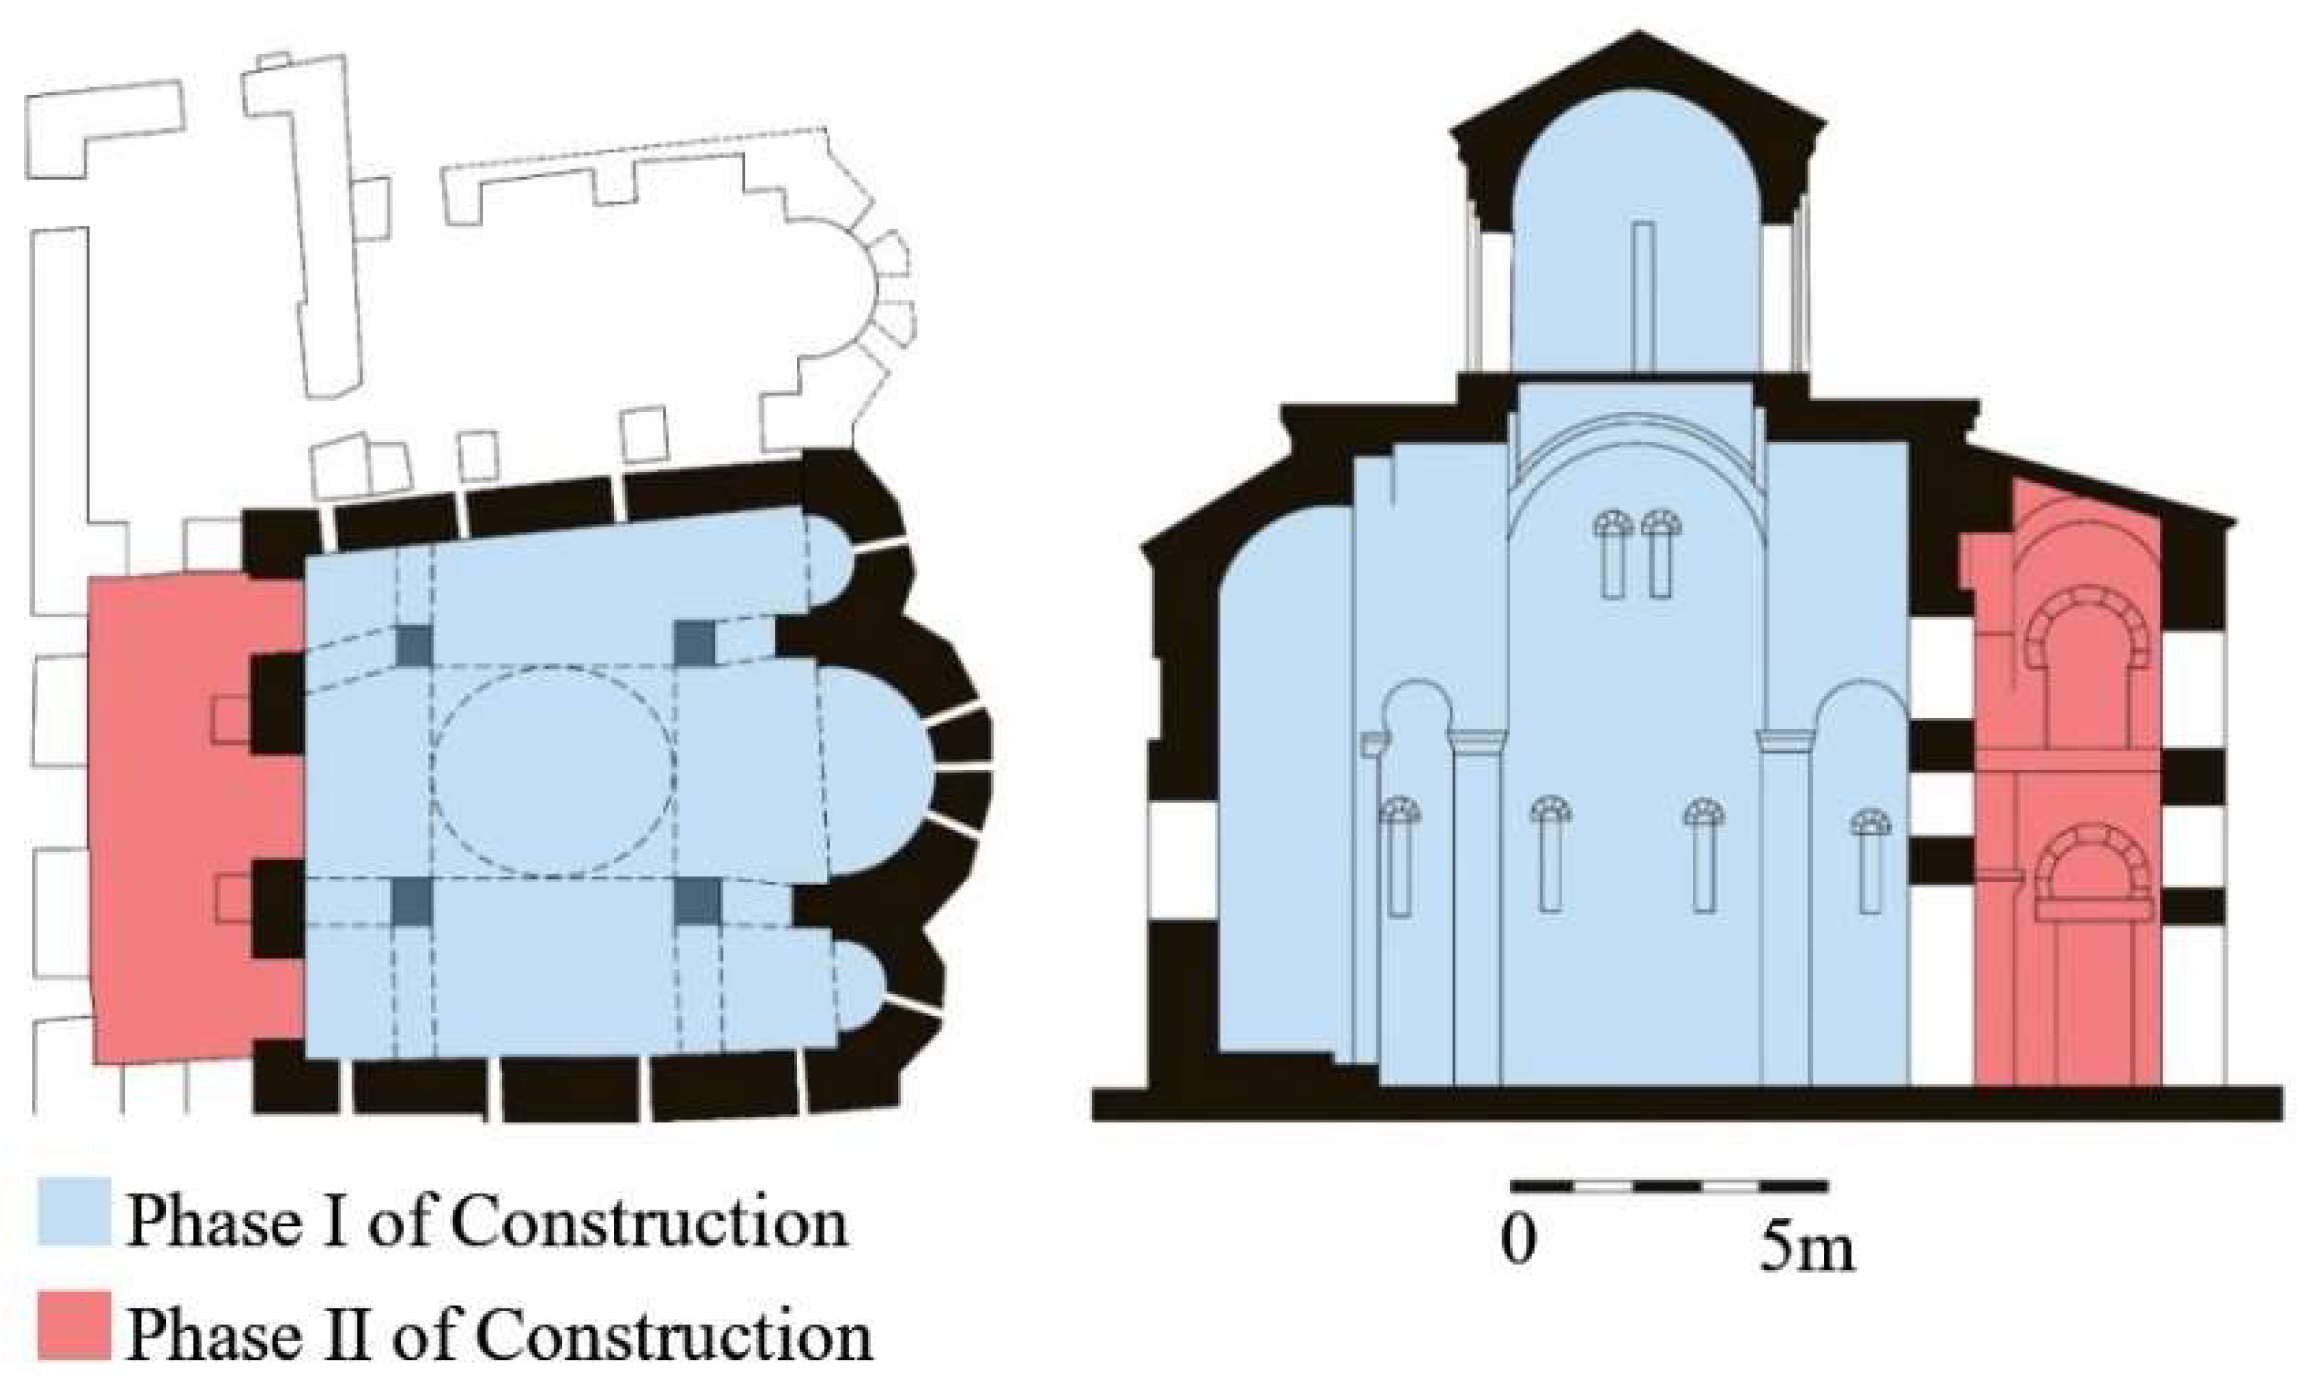
2. Historical and Architectural Description of Cappadocia and Bell Church (Çanlı Kilise)

Cappadocia is registered as a mixed natural and cultural heritage site by UNESCO and is located in Central Anatolia. The Cappadocian region is composed of a number of towns that are known for their characteristic rock-cut structures (Figure 1). The majority of the structures date back to the 9th and 11th centuries, when there was a peak in construction activities especially between the end of the Arab invasion in the 10th century and the gradual takeover by the Seljuks by the end of the 11th century [21] when Cappadocia remained a provincial settlement under the rule of the Byzantine Empire.
There exist a number of problems that hinder comprehensive understanding of the settlement patterns of Byzantine Cappadocia and archaeological fieldwork conducted in the region remains limited. One of the main problems is the lack of any textual evidence that comes from the region [22]. However, there is a plethora of physical study material in the form of Cappadocia’s signature rock-cut structures which are studied in an interpretative way to understand their functions and the people of the time. Therefore, studies concentrating on different perspectives would contribute to a better understanding of such spaces of the Byzantine Cappadocia. One such physical character is the indoor acoustical climate of these spaces. This study is an attempt to understand the context of the use of a Middle Byzantine church, the Bell Church (Çanlı Kilise), in Cappadocia through acoustical reconstruction of the partially demolished structure based on the available data.
The Bell Church settlement is located on the outskirts of present-day Aksaray, Turkey. The church stands aloof from the rest of the settlement (Figure 2). According to Ousterhout, as opposed to the perspective of previous scholarship, the Bell Church region was not a monastic center; instead, the region had a significant residential and military character [23]. The church is located on a hilltop, at the edge of the settlement; and was the main church of the settlement. The church is considered unique because it is one of the few churches in the Cappadocian region that is a masonry construction as opposed to being carved out of the volcanic tuff, as is the case of the Hallaç Church [21]. Furthermore, the Bell Church is known to have undergone alterations and additions in the time span of its use; hence, it is significant to compare the indoor acoustical changes of the church over time.
The church was built in three main phases [23]. Phase I of the church only included the main structure, the naos, which is approximately 9.2 m2, and was constructed in the early eleventh century [22]. The second phase of the church included a narthex to the south and the north, while during the third phase of the construction, a parekklesion (side chapel) was added to the church [23]. Figure 3 shows the two main phases of construction on which this study focuses.
The naos, with three apses on the east, has four central piers that supported the dome until the twentieth century. The dome holds immense importance as it was the only Middle Byzantine dome in Cappadocia that survived and could be documented in the 20th century. Although the dome does not exist today, it is known to have been approximately 16 m in height. While the drum of the dome was decorated with slit windows, it was smooth on the inside [24]. The plan of the cross-in-square church remains compact, a characteristic that is in line with the local practice. Almost all Cappadocian churches are more compact versions of examples from Constantinople [22,25].
The church’s underground structures, the finely detailed facades, the faceted apses, and thick mortar beds all affirm the notion that the design of the church comes from Constantinople, and a few builders must have received their training in the capital, while the rest of the work was carried out by a local workforce [23,26]. There are some striking similarities in the design of the church with the churches of Constantinople, although there are a few aspects that make Bell Church different. Instead of using brick for the entire thickness of the walls, stone and brick have been utilized as revetments for a rubble core. The vaulting of the church is also made of stone, which reflects the local construction technique of the region [22]. Therefore, the limited use of bricks in the façade indicates the possibility of the bricks being imported in order to create a prominent landmark in Cappadocia, as a reminder of the center, Constantinople. The limited use of bricks in the arches of the slit windows on the interior wall surfaces has a trivial effect on the indoor sound field of the church.
The architectural typology of the Bell Church is a simple cross-in-square composition that was developed from a single nave after the addition of two lateral naves. This architectural composition was common in Middle Byzantine churches [27]. Similarly to the St Nicholas Monastery of Mesopotamia which was constructed in 1224 [28], the Bell Church is built on top of a hill and consists of one interior volume that has been divided by columns and arches. As opposed to four domes of the St Nicholas Monastery of Mesopotamia, the Bell Church has only one dome with a tall drum and slit windows.
The naos of a Middle Byzantine church was utilized during liturgical practice for congregational purposes. The practice would involve a congregation of people and clergy in the church [29]; some parts of the Divine Liturgy were composed of a dialogue between the two groups. Singers used to be a distinguishing part of the congregation and they had fixed places in the church; the choir would either be on an ambo, an elevated platform in the naos, or divided into two groups on either side of the center of the naos. Other than the Divine Liturgy, other regular and intermittent services were also celebrated; these services would range from baptism and marriage to simple prayers that would address a specific need of the people such as curing a sickness. The Byzantine liturgy was composed of a variety of services to praise God and saints. The rites would be expressed in speech, text, and song. Furthermore, movement was also an important part of a few rituals such as the Divine Liturgy, where the congregation would meet in the church, go around the town, and gather at the naos of the church again [29]. In order to decipher the auditory environment during liturgical practices in terms of the effects of the physical features of the space, the sound field of the main church is searched in detail within this study.
Instead of a permanent separation between the sanctuary and the naos, it is possible that a wooden screen (templon) was used during times of liturgy in the Bell Church [22], which would block any visible connection while maintaining an aural connection between the clergy and the congregation [30]. The purpose of the templon was to reinforce the sacredness of the holy space by separating the clergy from others who would just attend the services from the naos [29]. Therefore, in this study, the screen is included in the naos before carrying out acoustical simulation tests on the church in order to mimic and/or generate a more realistic reconstruction of the church’s acoustic environment.
This study also documents the acoustics of the church with the additional features of Phase II, which mainly included a double-storied southern narthex with a wooden roof [23] (Figure 3). According to Ousterhout, based on the iconography of the paintings in the naos, a painter from the center of Constantinople must have been hired by the patron of the church to do the job. It is possible that the painter would have reached the area well after the completion of Phase II [22]. Therefore, based on this theory, the study includes a virtual and aural study of the Phase I construction (naos) with and without the paintings found on the interior surfaces. These paintings were made with the application of a very thin layer of plaster on the interior walls, which could be the reason behind the present-day deterioration of the paintings [23]. The study documents the acoustics of the church from both Phase I and Phase II, to evaluate the aural performance of the space over time.

3. Materials and Methods

The data collection of the study has been conducted in two main parts. The Bell Church has been virtually and aurally reconstructed using computational 3D-modeling tools based on the information from available archival data (drawings, etc.) [22,23,24] and on-site measurements of window slits and wall thickness. Impedance tube tests have also been performed on two rock samples from two different towns of Cappadocia. By dint of ray tracing, the church’s acoustic environment has been documented and analyzed.
In order to have a more reliable acoustical analysis of the church, it is important to document the sound absorption performances of the building material. Due to the archaeological significance of the masonry blocks at the Bell Church, the blocks could not be taken from the nearby site for a material analysis. However, rock samples from three different regions of Cappadocia, Göreme, Ürgüp, and Hallaç (Figure 1), were collected. These samples are all tuff stone, which is the characteristic rock type of the region. The sample collection areas house a number of rock-cut churches. For instance, the Hallaç Complex is a mid-eleventh century complex that has almost entirely been carved out of living rock and Hallaç Church is a cross-in-square church on the east of the main courtyard of the complex [21]. Apart from material tests of the rocks from these sites, previously held field tests held in Hallaç Church and Avanos [20] are used to tune the acoustical models of selected structures. The field test tuned acoustical simulations aid to identify the sound absorption performance of tuff rocks.

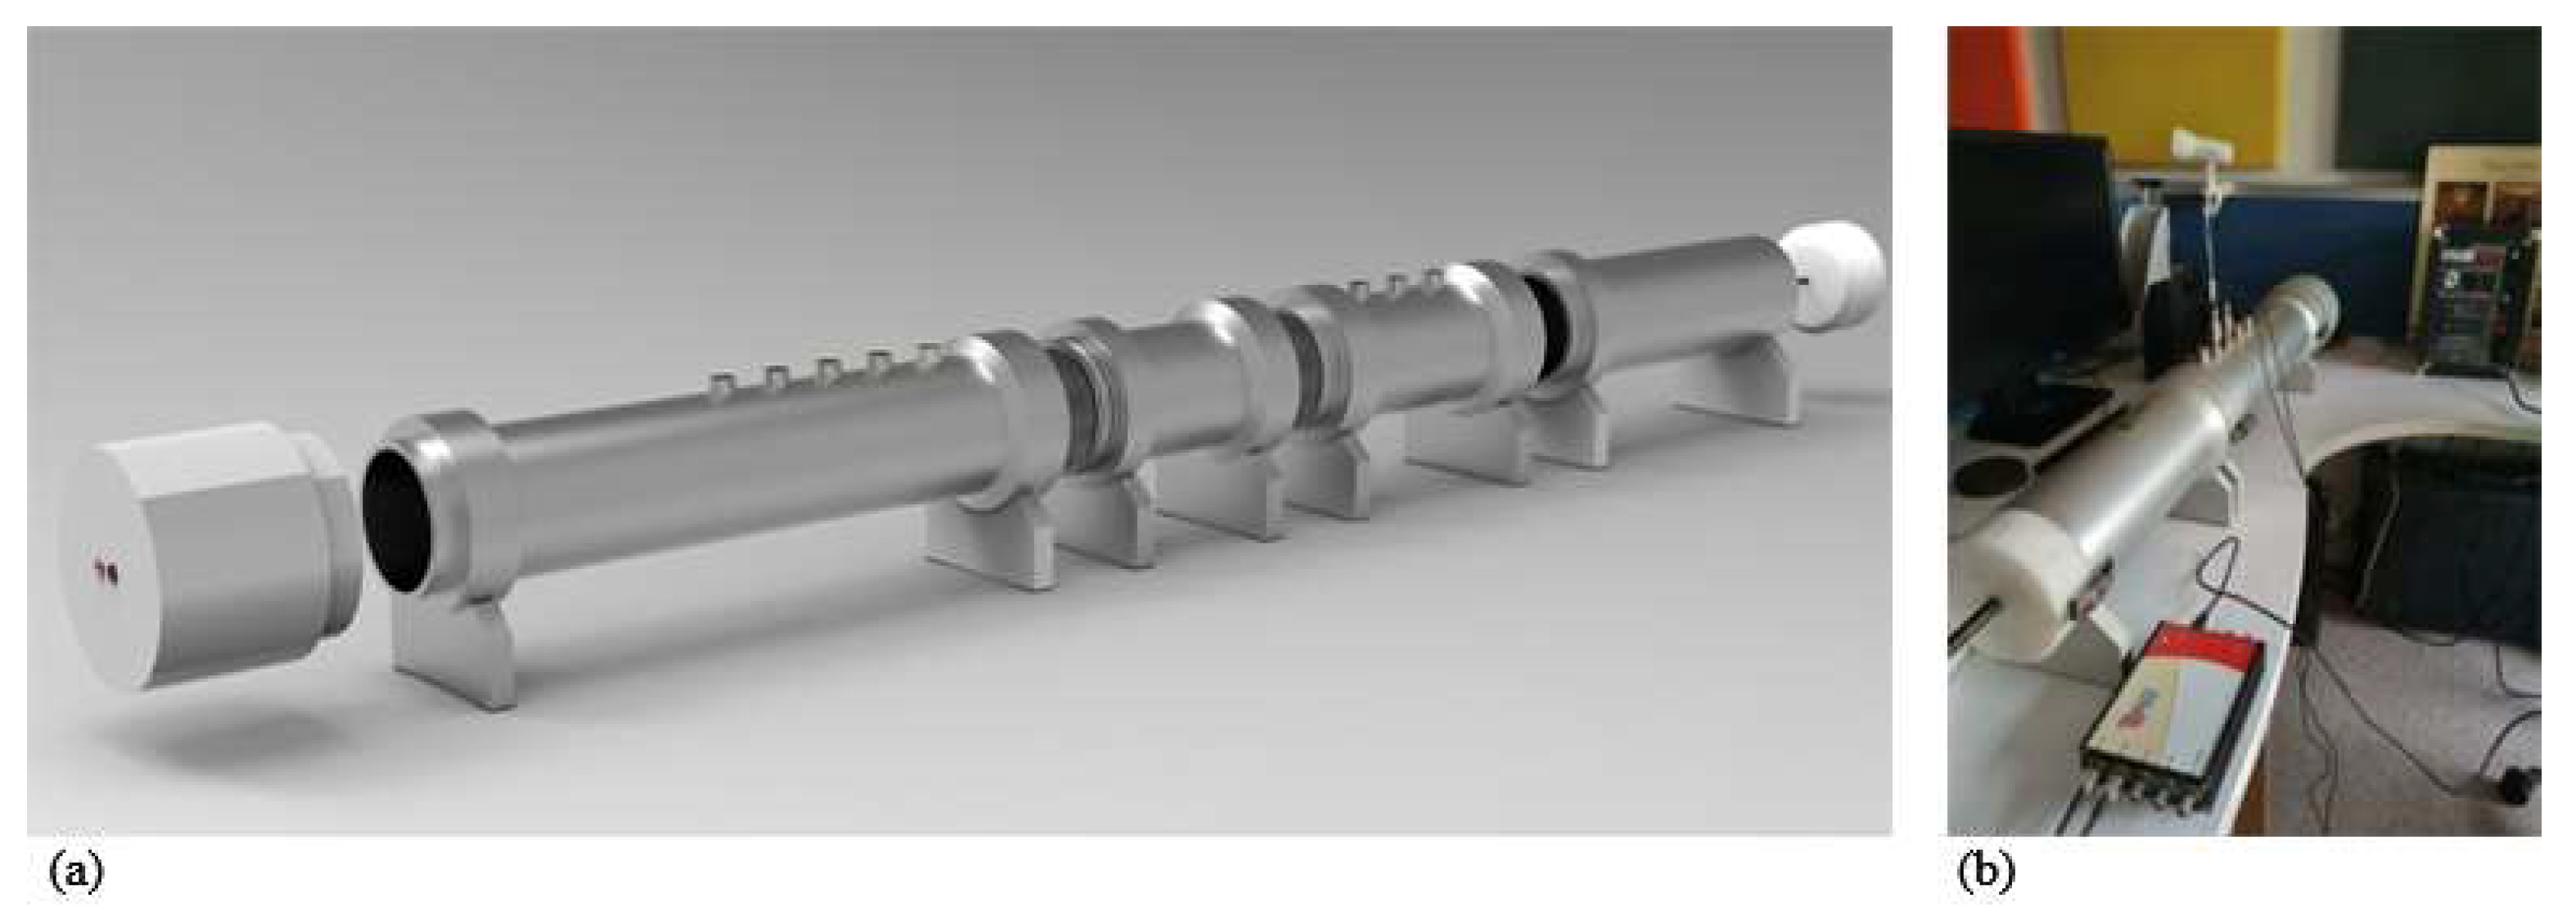
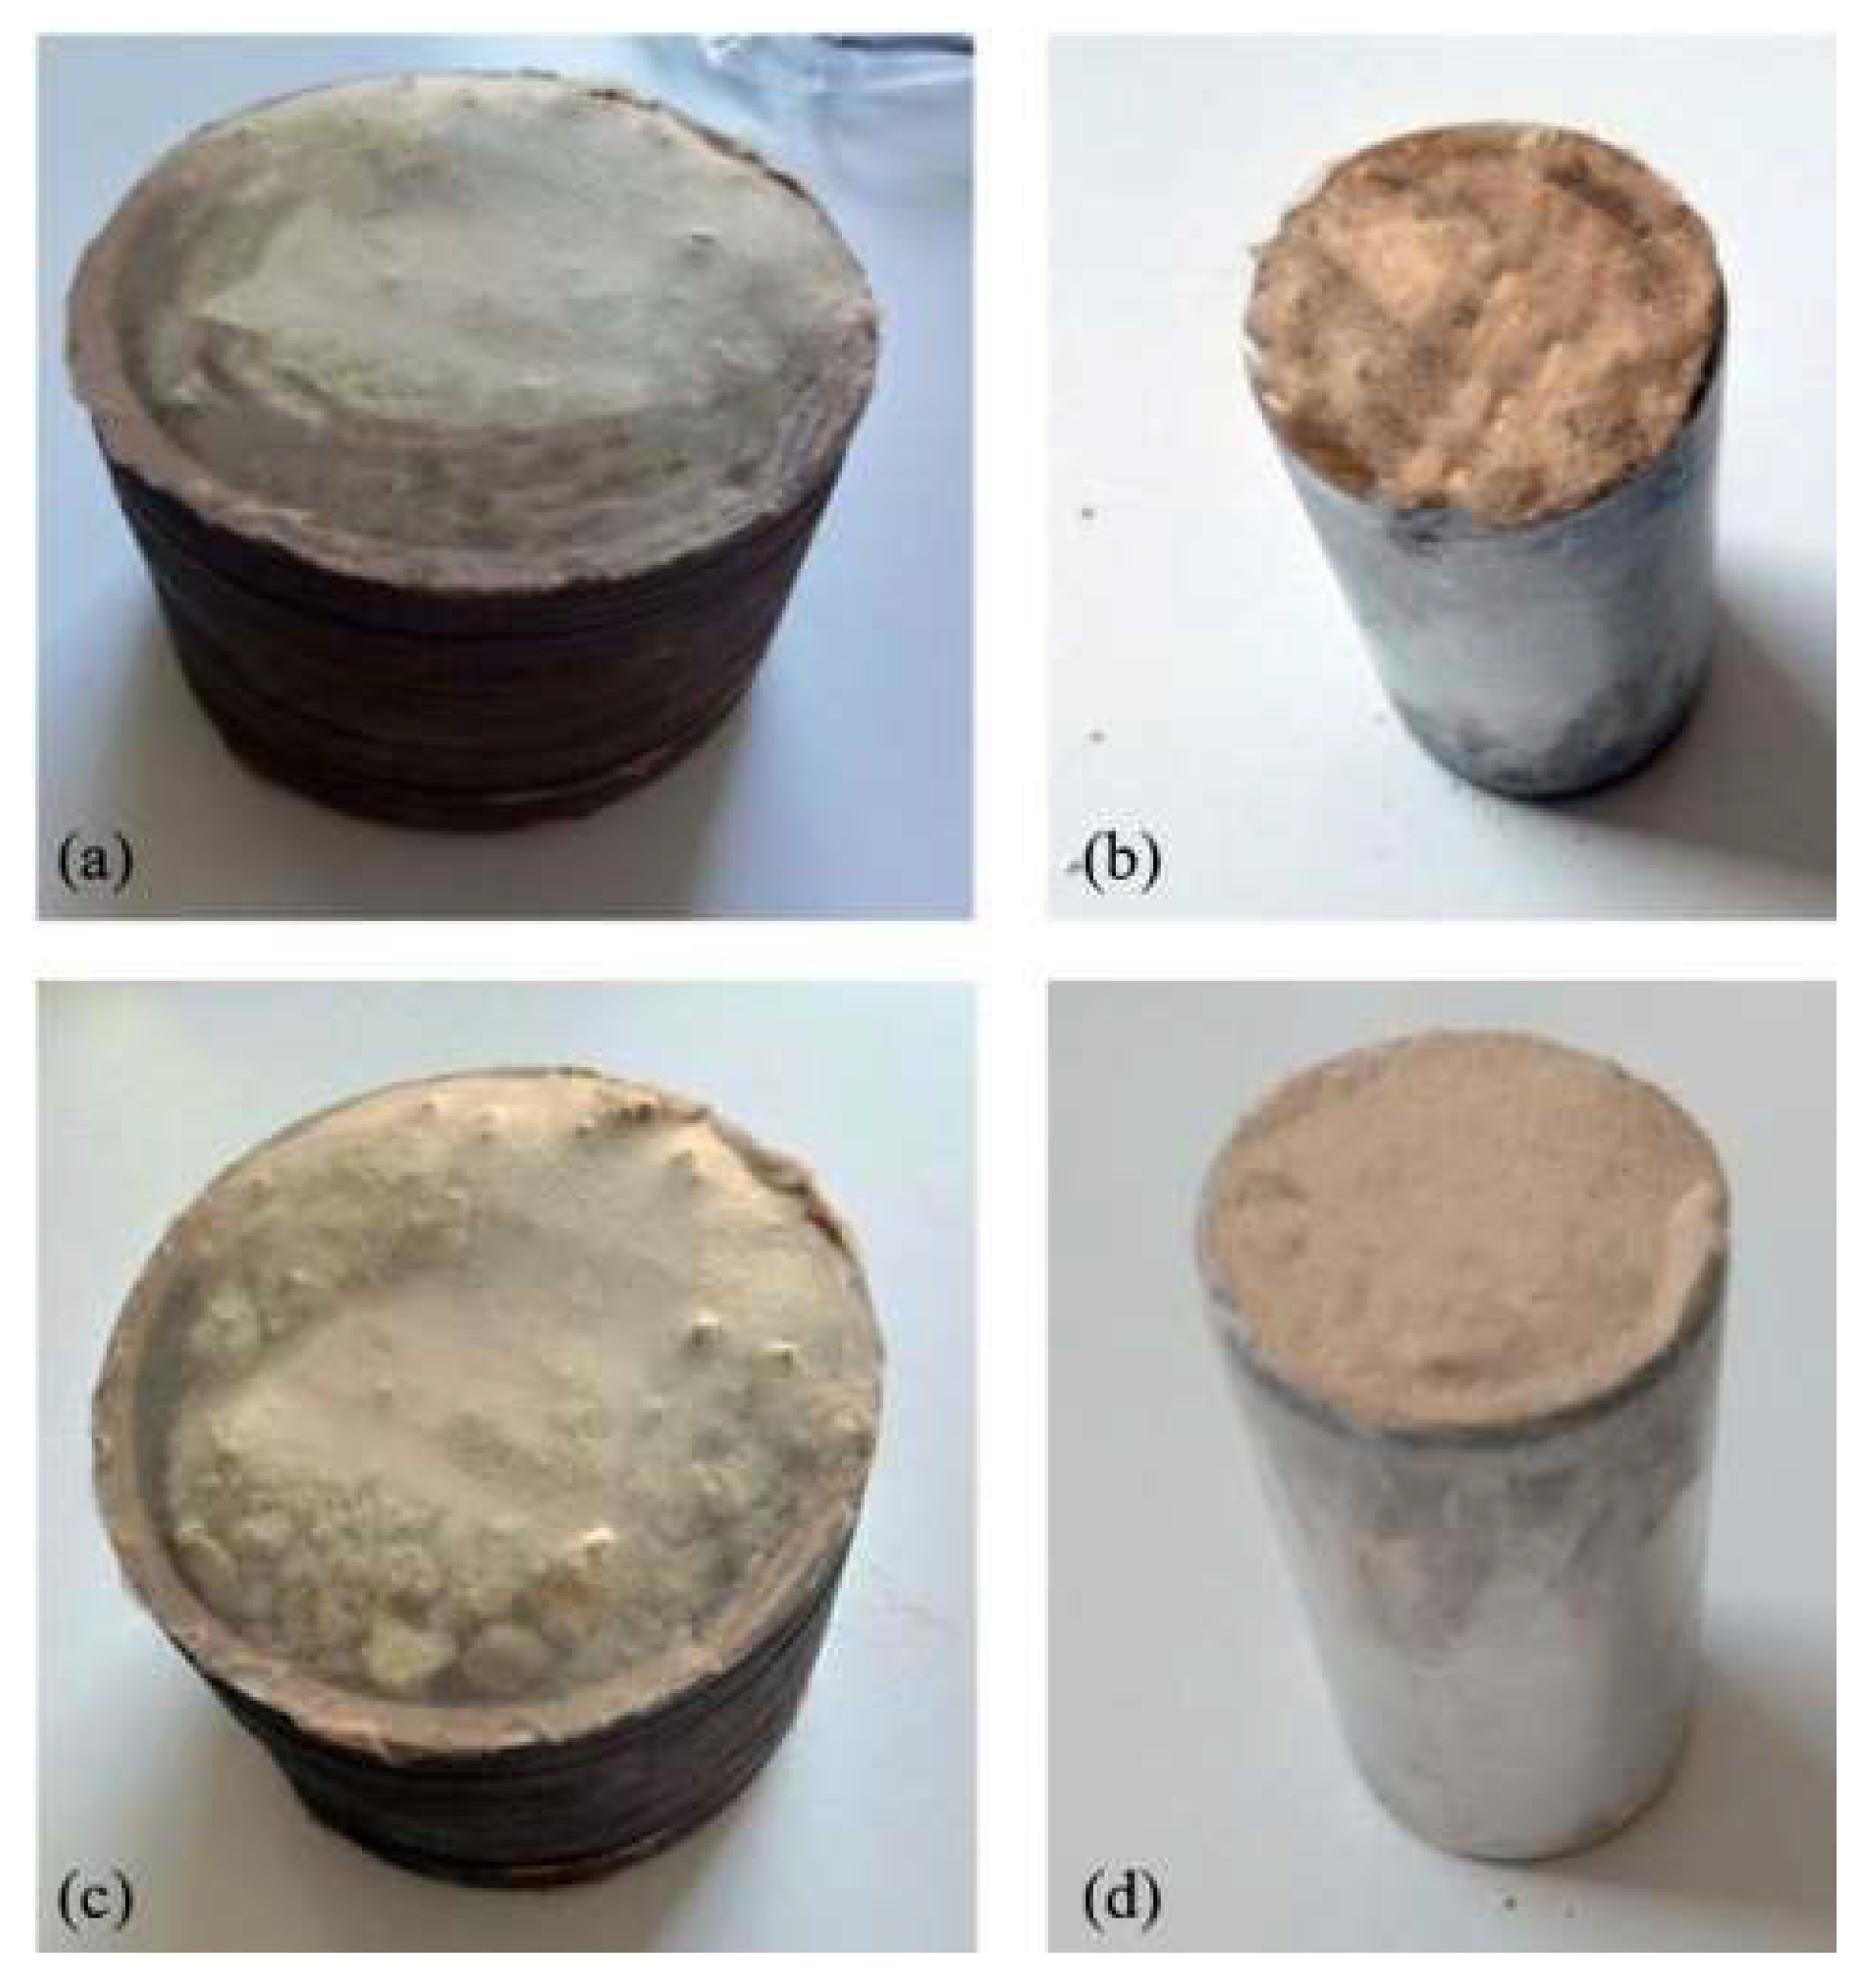
3.1. Impedance Measurements

For the samples from Göreme and Ürgüp, impedance tube (S.C.S. Kundt Impedance Tubes) tests are performed (Figure 4). Kundt / TL Tubes (S.C.S) measure absorption coefficient, standard impedance, characteristic impedance and transmission loss as a function of frequency. A two-microphone-transfer function method is applied, according to ISO 10534-2:1998 [31]. The double-tube setup of the sound absorption measurements includes small and large tubes. The small-tube setup is composed of small-sized (Ø28 mm) devices for measurements of acoustic properties in the high frequency range (800 Hz to 6300 Hz), while the large-tube setup is made up of larger tubes (Ø100 mm) and is used for measurements in the low frequency range (50 Hz to 1200 Hz).
The Kundt Tube method has been proven to be an efficient and faster method to calculate absorption coefficients of sound-absorbing materials than both Standing-Wave-Ratio (SWR) and reverberant room methods [32,33]. Another reason to use the Kundt Tube method is the fact that large samples cannot be brought into the reverberation chambers for sound absorption coefficient measurements.
For this study, two types of samples are prepared for each rock, collected from three different areas of the region. For the low-frequency measurements (100 mm samples), rings of cardboard have been stacked to create a mold to hold the tuff stones. The corners of the mold are filled with the same tuff stone to reduce air gaps. For the high-frequency samples (28 mm samples), a steel mold has been filled in with the rock tuff. Since the rock samples are porous, an acoustically transparent piece of cloth has been used on both ends of the mold to ensure that the material stays compact (Figure 5). For the low-frequency setup, the rock samples have been cut to fit in the mold, just like a masonry block. Therefore, the tuff is primarily in the shape that was used in the construction of the rock-cut spaces. However, for the high-frequency setup, fragments of the tuff stone have been put together to fill the mold. The method is considered appropriate due to the presence of air spaces in the porous rock materials. The inability to clearly cut the rock samples for the high-frequency setup is a limitation of this study. Each sample, for both low- and high-frequency setups, has been tested in the tube 10 times to ensure the repeatability and accuracy of the results.
The rock sample from Hallaç Complex has also been brought to study its acoustical properties (Figure 6). The sample cannot be used for impedance tests as it could not be cut in the proper shape to fit into the tube due to the hardness of the material. As Figure 6 shows, the rock sample cannot be cut using the same cutter that has been used for the rock samples from Göreme and Ürgüp. Accordingly, there are basically two types of tuff stones which are different due to their changing porosity and stiffness. This may be due to their exposure to environmental factors as well as different chemical compositions. Even based on these cutting and shaping experience of the rock samples, it can be said that the tuff stone samples from different areas of Cappadocia have different physical properties due to their different compositions or exposure to environmental factors. Hence, it would be misleading to assume that all the tuff rocks from Cappadocia have similar acoustical properties, and thus, it is important to document different rock samples and their absorption coefficients from different locations. In order to better characterize the samples, Qualitative and Quantitative Mineral Tests were performed on all three samples. These tests were carried out at the General Directorate of Mineral Research and Exploration (MTA) in Ankara. The test codes are 35-30-MP-19 (Standard Qualitative Mineral Tests under XRD Analysis) and 35-30-AJ-31 (XRF analysis) in accordance with TS EN ISO/IEC 17025 Standard. The results of the tests are presented in tables under Section 4.1.1.

3.2. Acoustical Simulations

With the current advancements in computer-aided tools to create virtual 3D spaces, it has become more convenient to study the acoustics of spaces that are otherwise difficult or impossible to study. The Bell Church is one such site; the remains of the Middle Byzantine masonry church include only the four walls that encapsulate the main hall of the church. Initially, an acoustical model with all the main volumetric arrangements (Figure 5) of the church was generated.
The acoustical simulations are held by ODEON Room Acoustics Software version 16.08. The program uses a hybrid calculation system that makes use of both the image-source method and ray tracing [34].
The interior surfaces of the church are dominantly tuff stone, according to the information gathered from both archival data and on-site observations. For estimating the sound absorption performance of tuff rocks in order to support or compare impedance test results, acoustical simulations are utilized. Field test results from two sites in Cappadocia have been included in this study. As part of a previous study, field measurements have already been held in the Hallaç Church and Avanos Dining Hall [20]. The full set of measurements are held by using a B&K (Type 4292-L) standard dodecahedron omni-power sound source, a B&K (Type 2734-A) power amplifier, a B&K (Type 4190ZC-0032) microphone combined with a B&K (Type 2250-A) hand-held analyzer, and a portable PC. The sampling frequency of the recorded multi-spectrum impulse is 48 kHz, covering the interval of interest between 100 and 8000 Hz. The impulse response length is kept at 10 s. Noise signals are generated using DIRAC Room Acoustics Software Type 7841 v.4.1. The same software is also used for post-processing of the measured impulse responses for all receiver positions. Three types of signals are tested: E-sweep, MLS, and balloon pop.

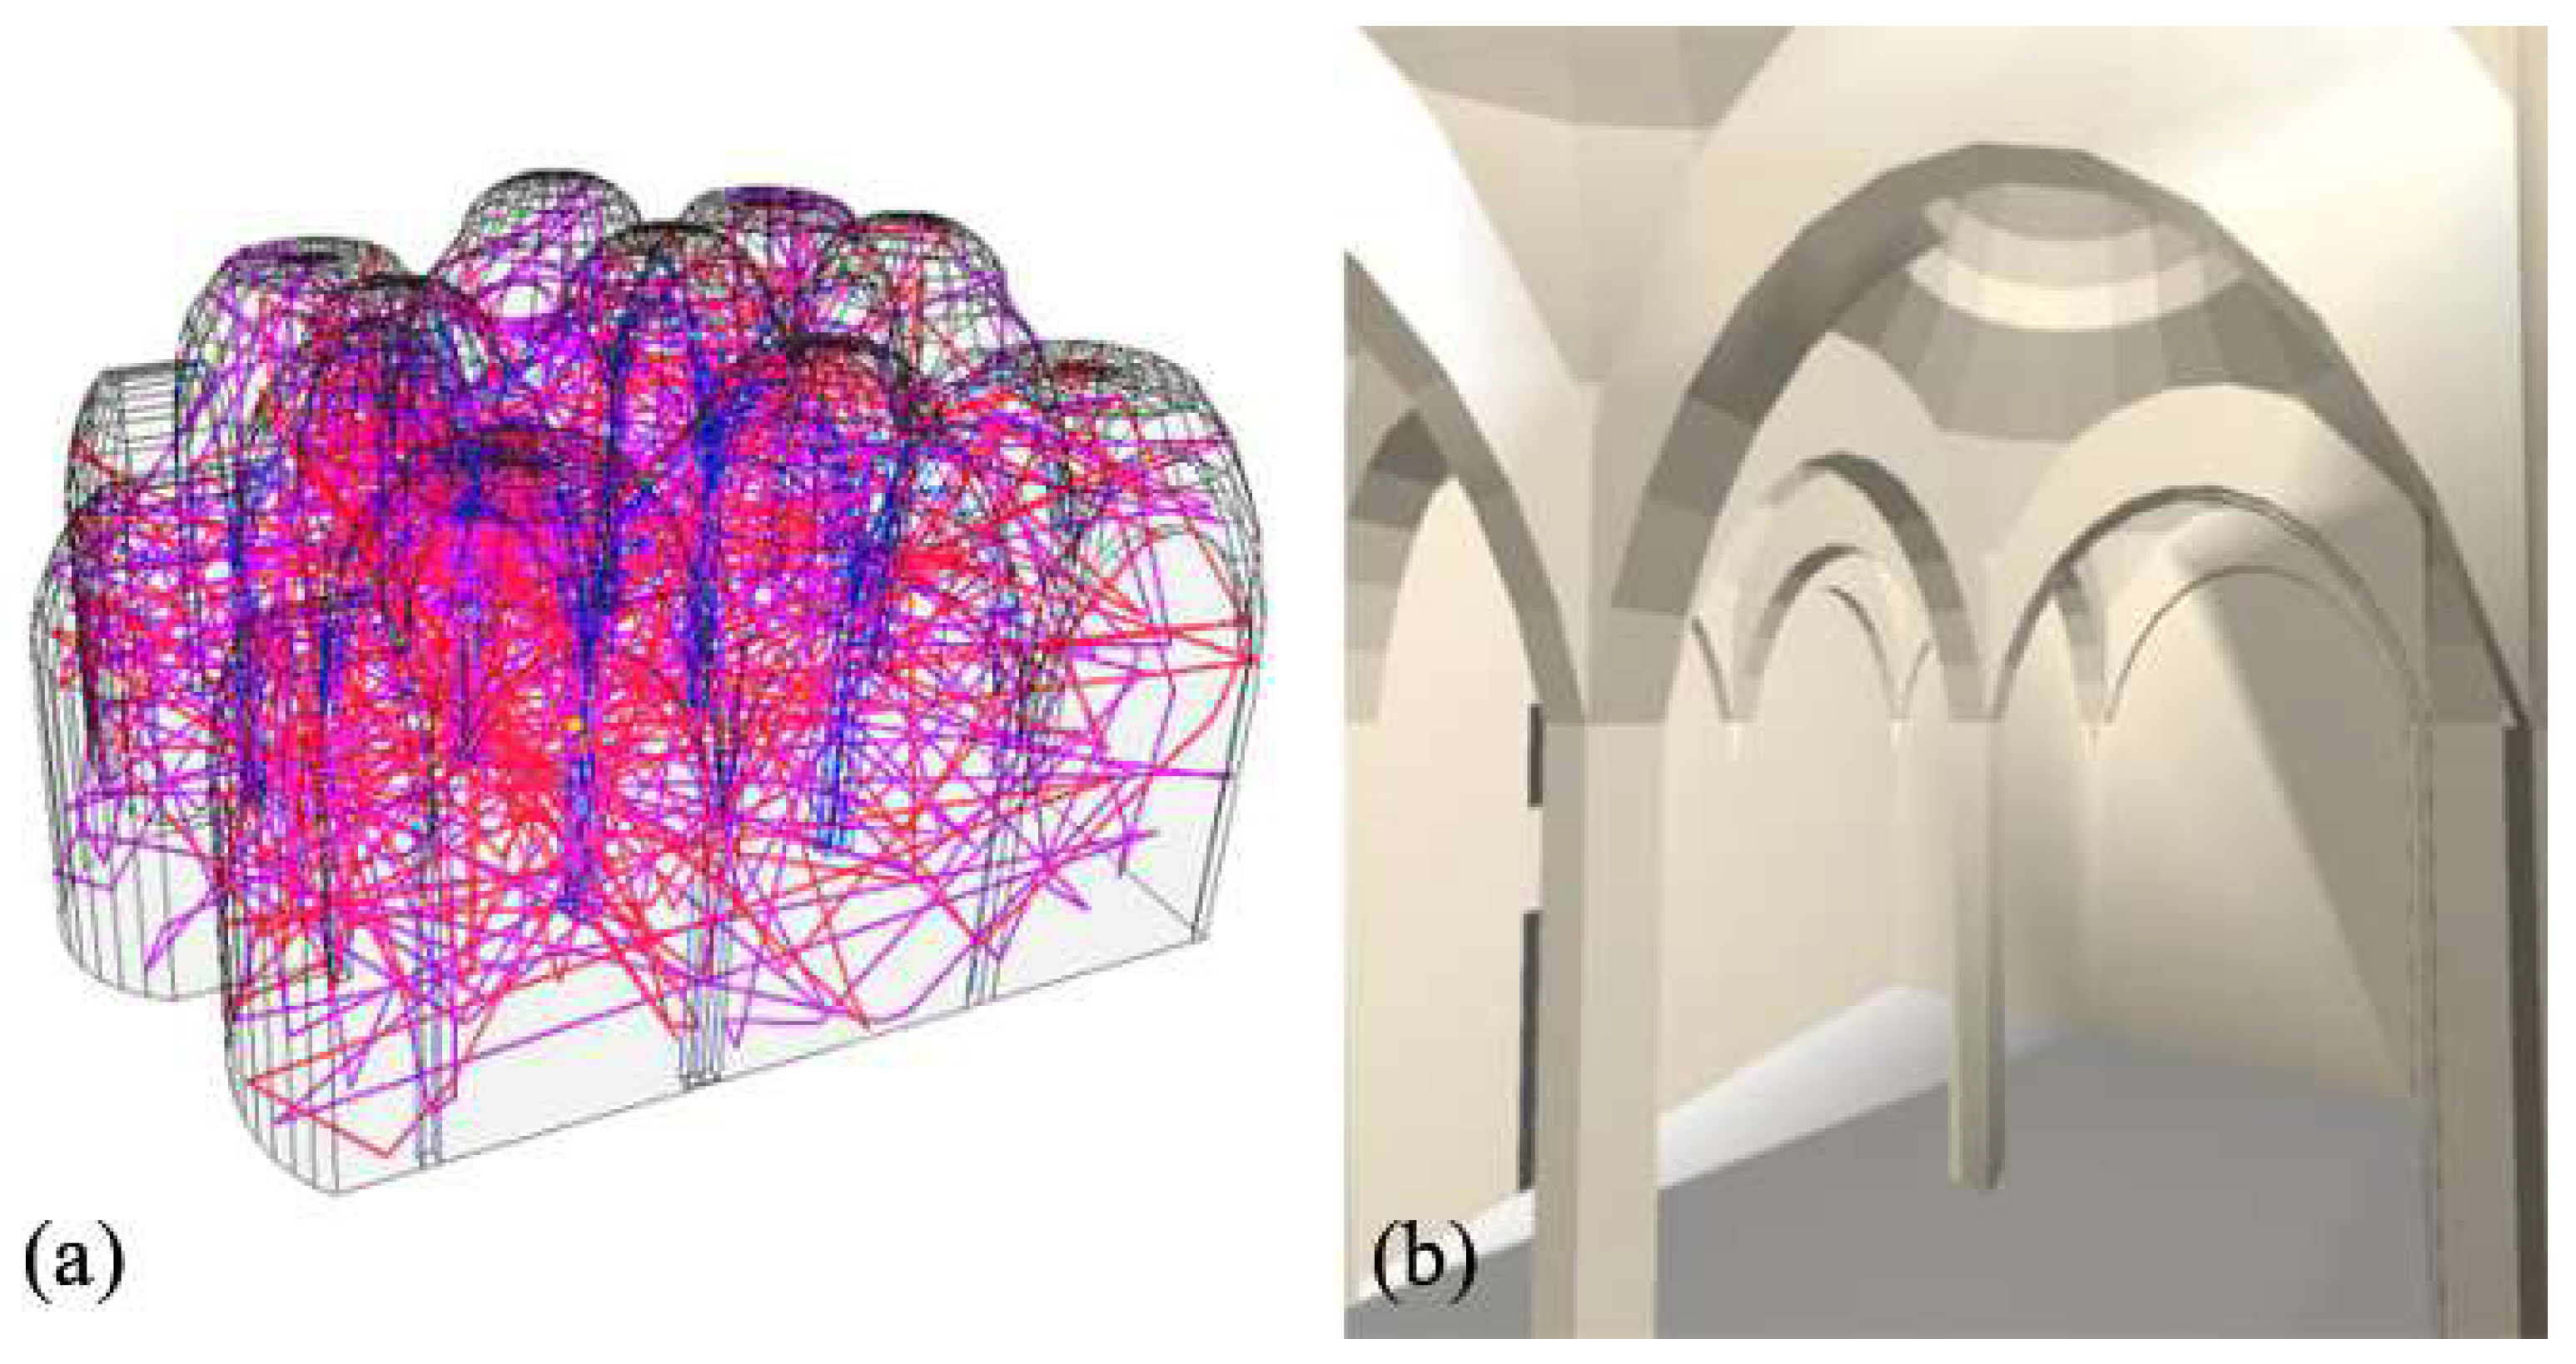
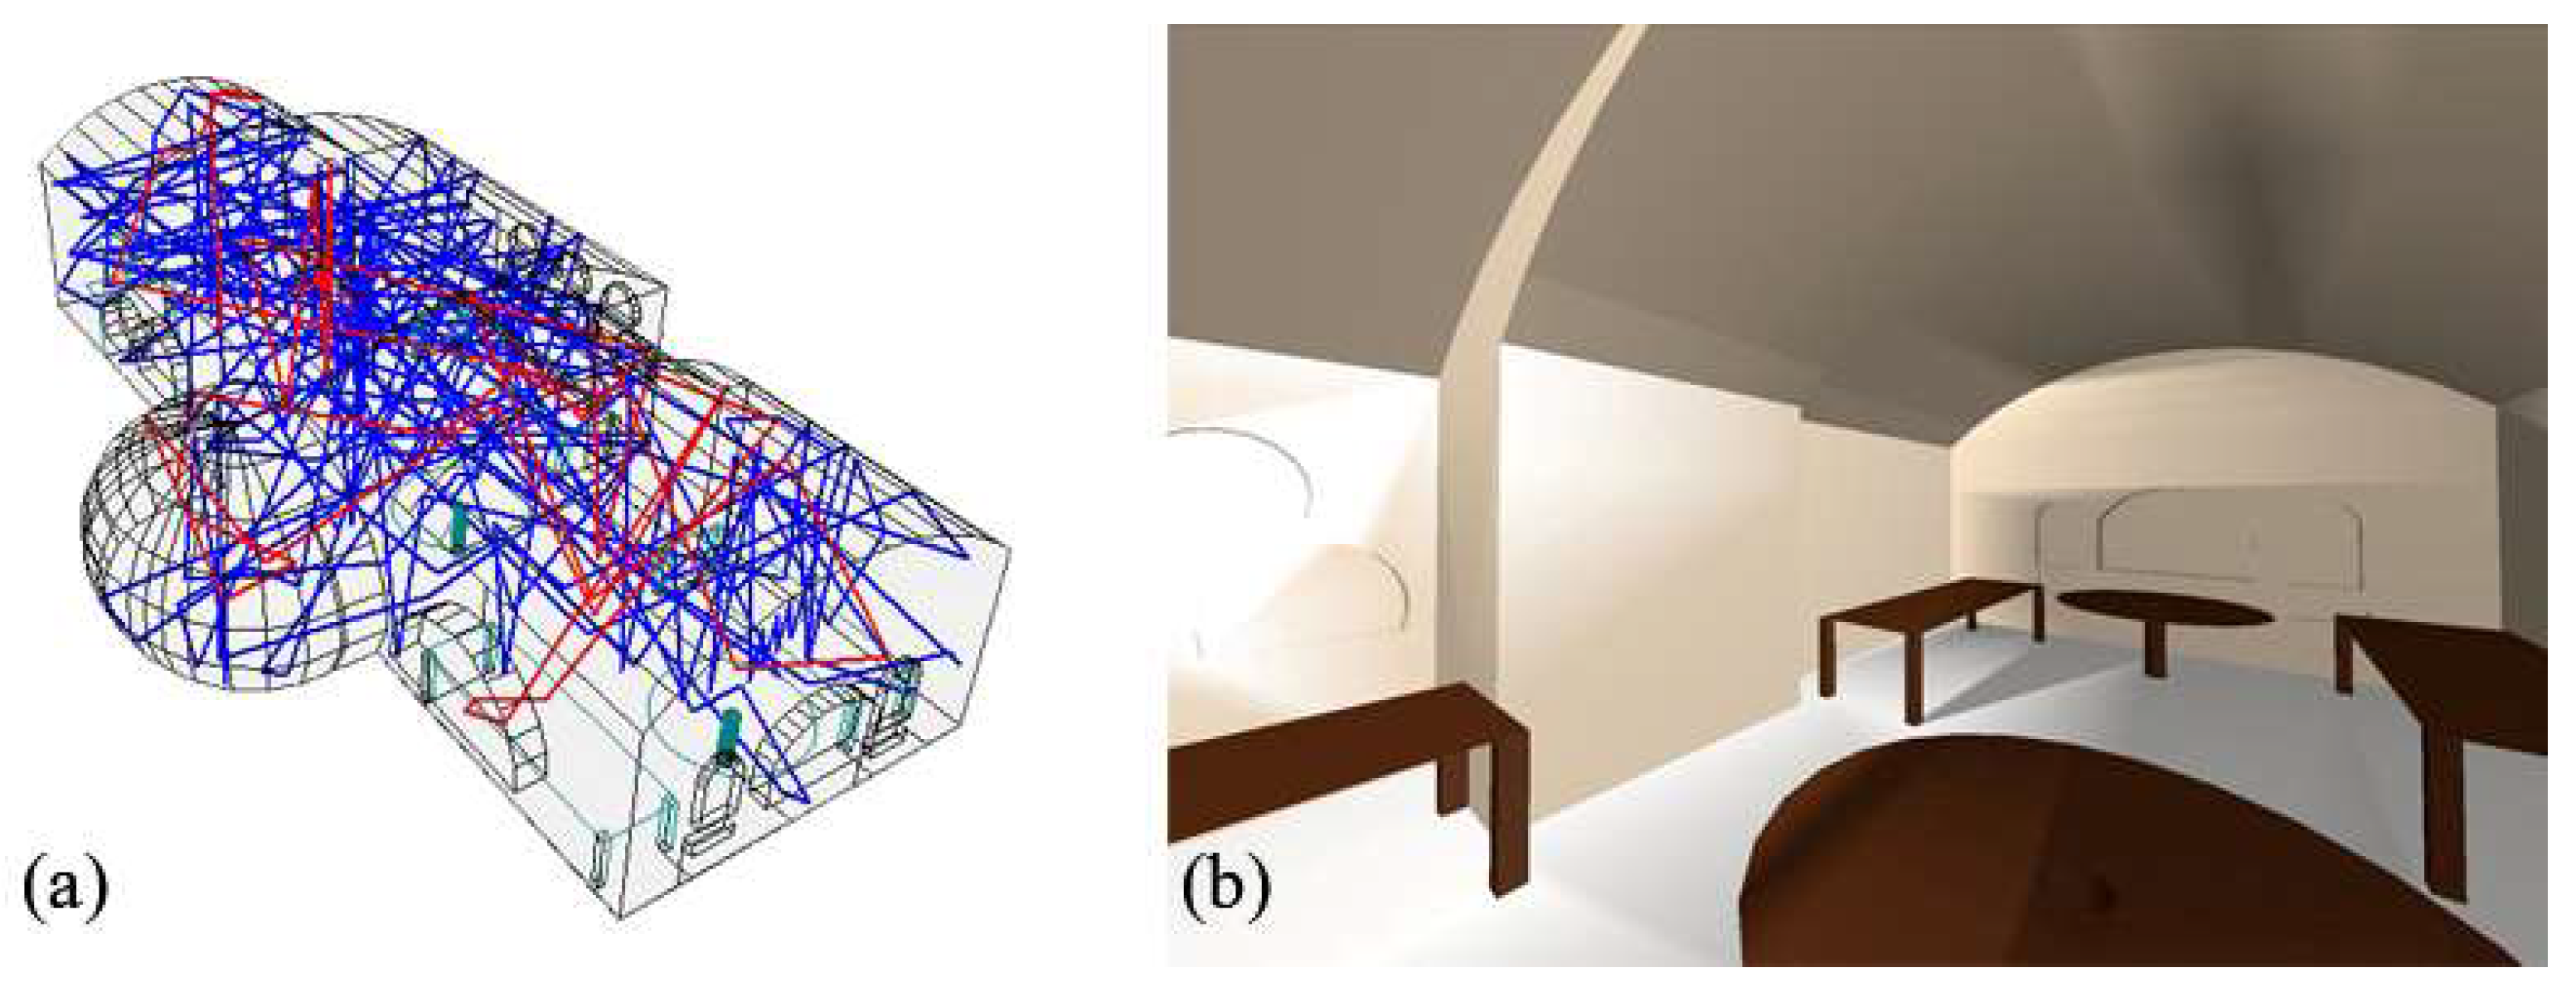
3.2.1. Simulations Based on Field Tests

A simplified virtual model of the Hallaç Church (estimated volume: 595 m3) has been created based on the plan drawing by Ousterhout [22] and the geometrical measurements taken on the site. ODEON Room Acoustics Software version 16.08 has been used for acoustic analysis. The transition order is set at 2, the room impulse response length is kept at 5000 ms, with a resolution of 5.0 ms, and the number of late rays is set at 7736. Figure 7 shows images of the church’s ray tracing model and a 3D Open GL view. The same process is repeated for the Avanos Dining Hall (Figure 8). A simplified acoustical model of the hall is generated based on the three-dimensional measurements taken on the site (estimated volume: 123 m3). The calculation setup of the acoustical model is as follows: the transition order is kept at 2, the room impulse response length is kept at 2000 ms, with a resolution of 2.0 ms, and the number of late rays is set at 1898.
Acoustical parameters and specifically T30 values from the Hallaç Church and Avanos Dining Hall have been tuned with the field test results in their respective simulations with a maximum deviation of 1 just-noticeable-difference (JND), which corresponds to 5% of the value, in order to obtain sound absorption coefficients of the surrounding tuff stone surfaces [35]. JND is a measure of the smallest perceivable difference of a given parameter, and is used to accurately correlate subjective sound perception to objective measurements [36,37]. After tuning, sound absorption coefficients of the rock materials are noted over octave bands for the Hallaç Church and Avanos Dining Hall. The tuff stone is the dominating material in these spaces; the other materials, such as marble for flooring and wood for the roof of the narthex, occupy comparatively less surface area.

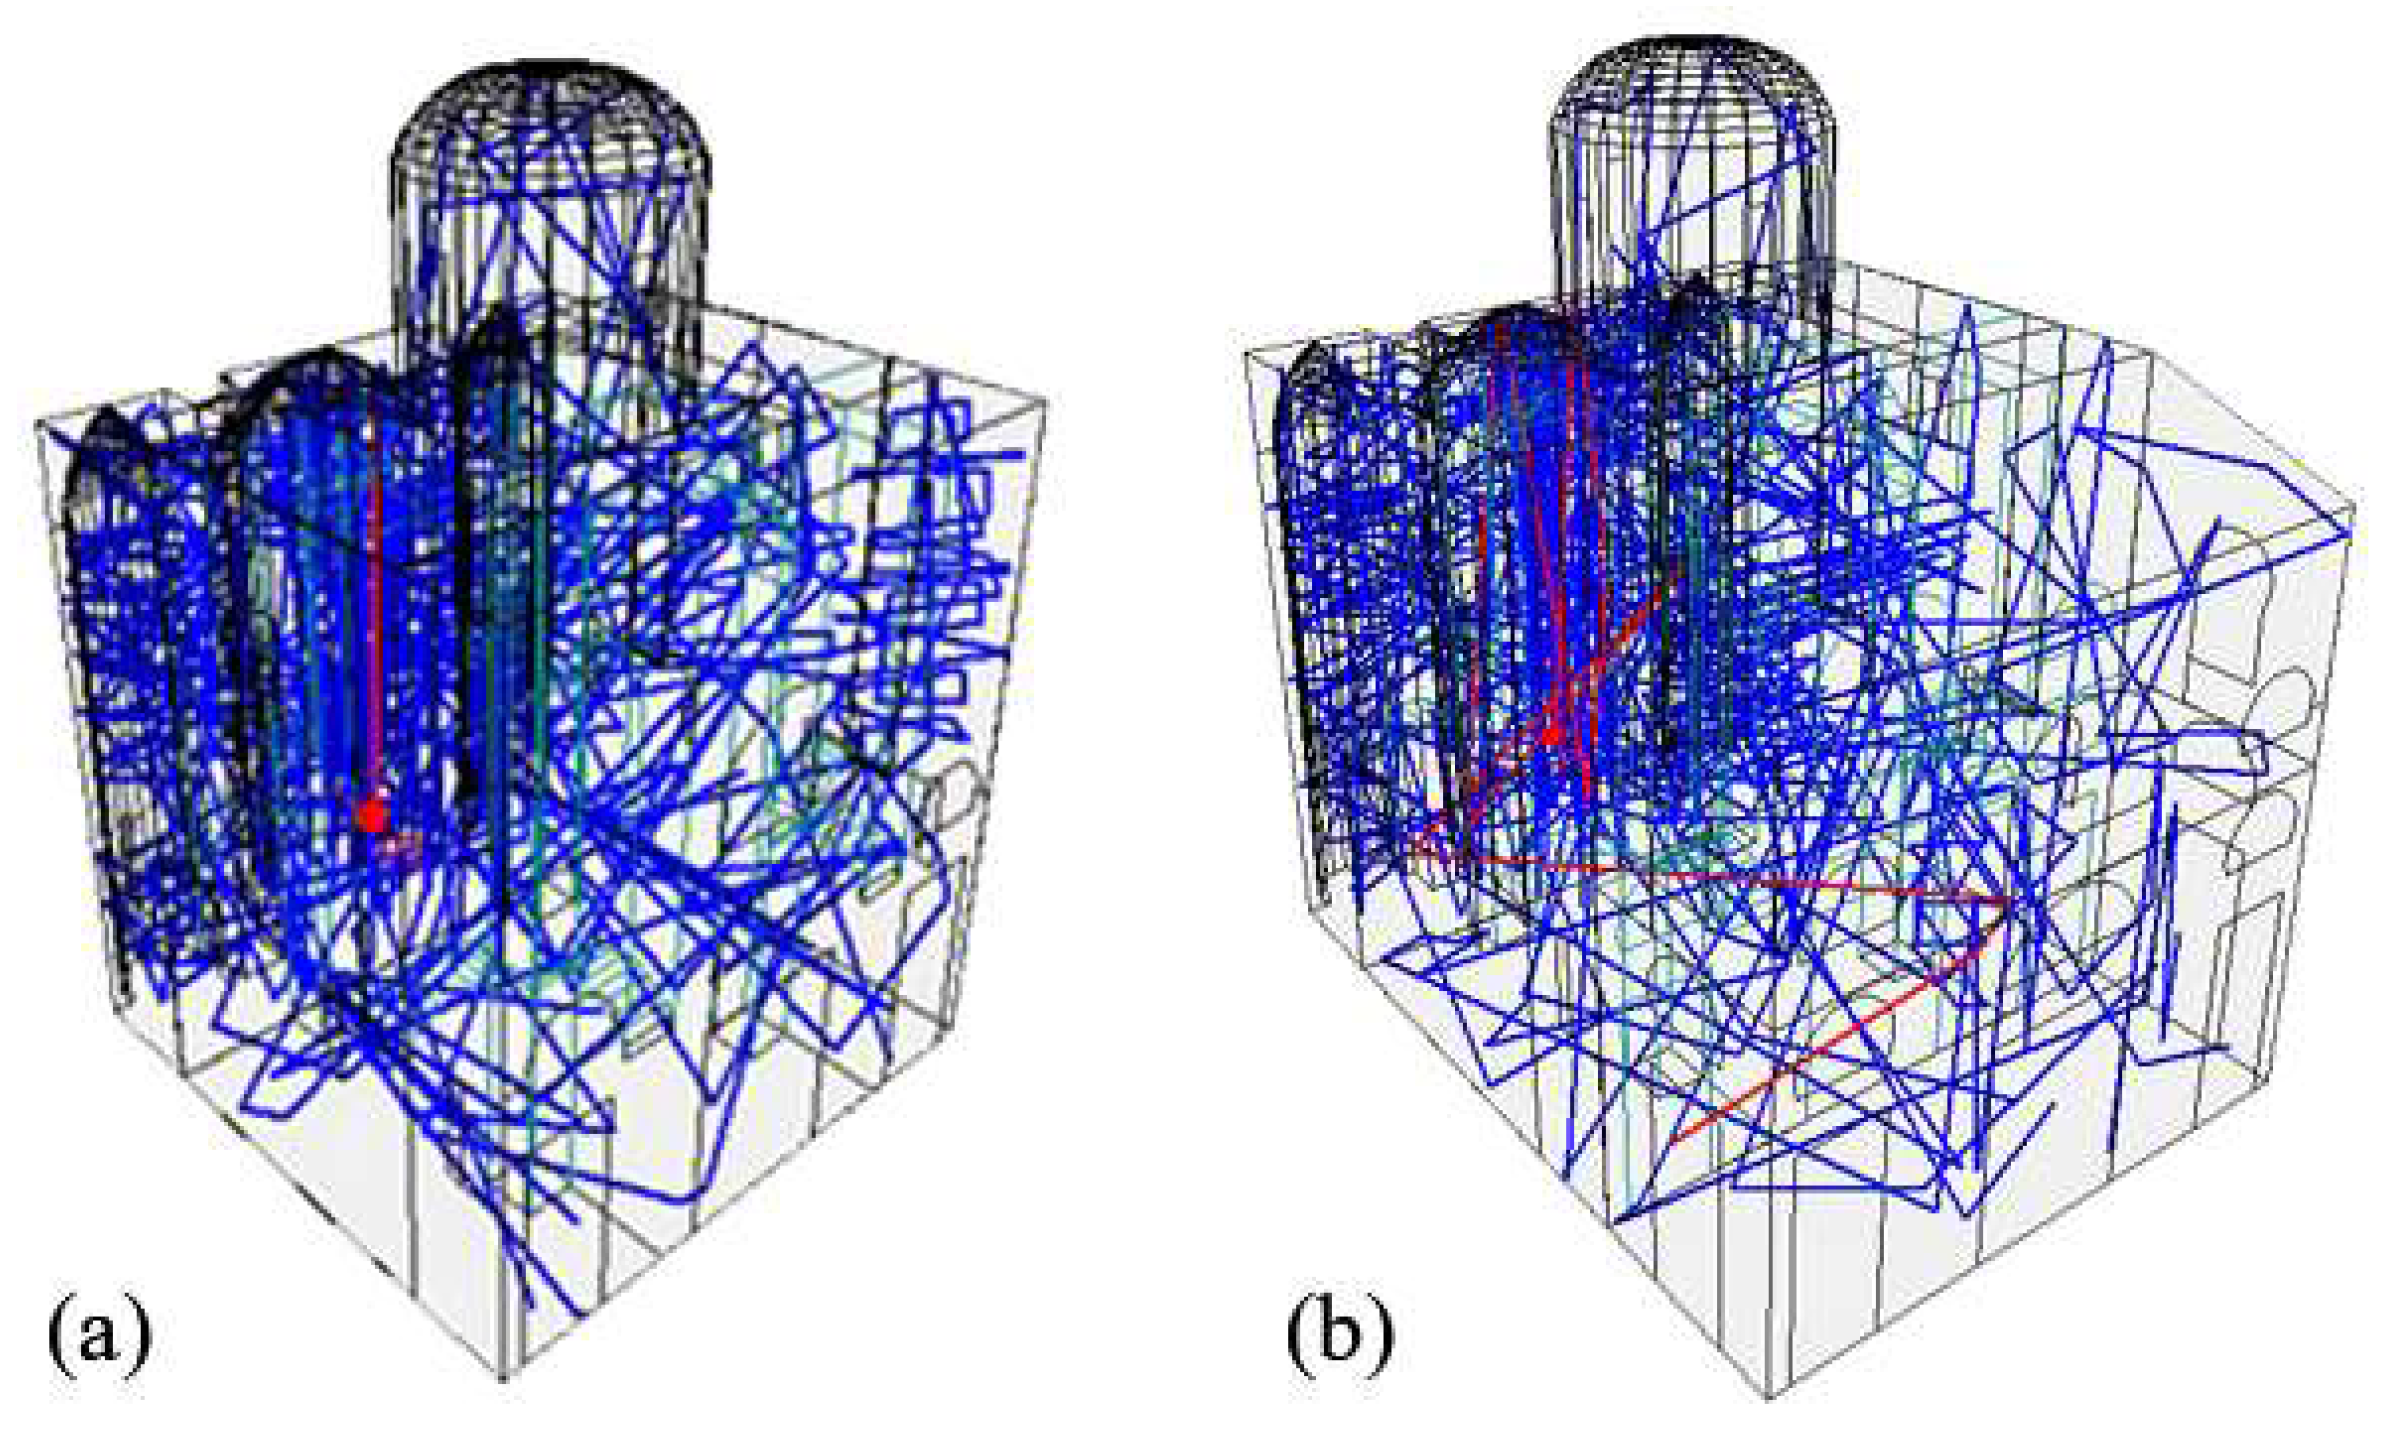
3.2.2. Acoustical Simulation Setup of Bell Church

The architectural drawings (Figure 3) and dimensions recorded at the site have been used to create simplified computational 3D models of the Bell Church. The simulations are run on three different models of the Bell Church; Phase I (without frescoes), Phase I (with frescoes), and Phase II (with frescoes and narthex). In the simulations of the church, the transition order is set at 2, the room impulse response length is kept at 4000 ms, with a resolution of 5.0 ms, and the number of late rays is set at 2000.
For the Bell Church, the same materials are used for the floor as in the model of the Hallaç Church. Furthermore, the Hallaç Church material (tuff stone type I) is used for the walls and the dome of Bell Church. Based on the impedance tests and material tuning through simulation, the materials presented a significantly large difference between their absorption coefficients. Therefore, the sound absorption properties of the tuff stone type I were used because of the material’s physical texture, which is similar to the Bell Church’s masonry blocks. Moreover, the rock samples from Göreme and Ürgüp are more porous than the masonry blocks of the Bell Church, which is why they have not been employed to the church’s acoustical model. The choice of the material used for the Bell Church in the simulation is further discussed in the next section.
In the simulations of Bell Church Phase I (estimated volume: 975 m3), a wooden screen is added between the apses and the naos to represent an iconostasis [23]. Therefore, the sound source is placed behind the screen to recreate the acoustical environment during liturgical practices. Figure 9a and Figure 10a show a ray tracing model and a 3D OpenGL view of the church from Phase I.
For Phase II of the model, a two-storied narthex, with a wooden roof, is added to the main church space. The estimated volume of the Bell Church Phase II model is 1200 m3. Figure 9b and Figure 10b present a ray tracing model and a 3D OpenGL view of the church from Phase II.
Distribution maps are visual representations of the quantitative probability of an acoustical parameter in grid form. Therefore, distribution maps of the church are also analyzed (Section 4.2) in order to see the overall distribution of acoustic quality in the space. In order to obtain distribution maps for Bell Church simulations, the floor of the naos and narthex (if present) are divided into a grid of 80 cm to 80 cm, with a height of 1.5 m to correspond to the average height of human ears.

4. Results and Discussions

4.1. Acoustical Material Analysis

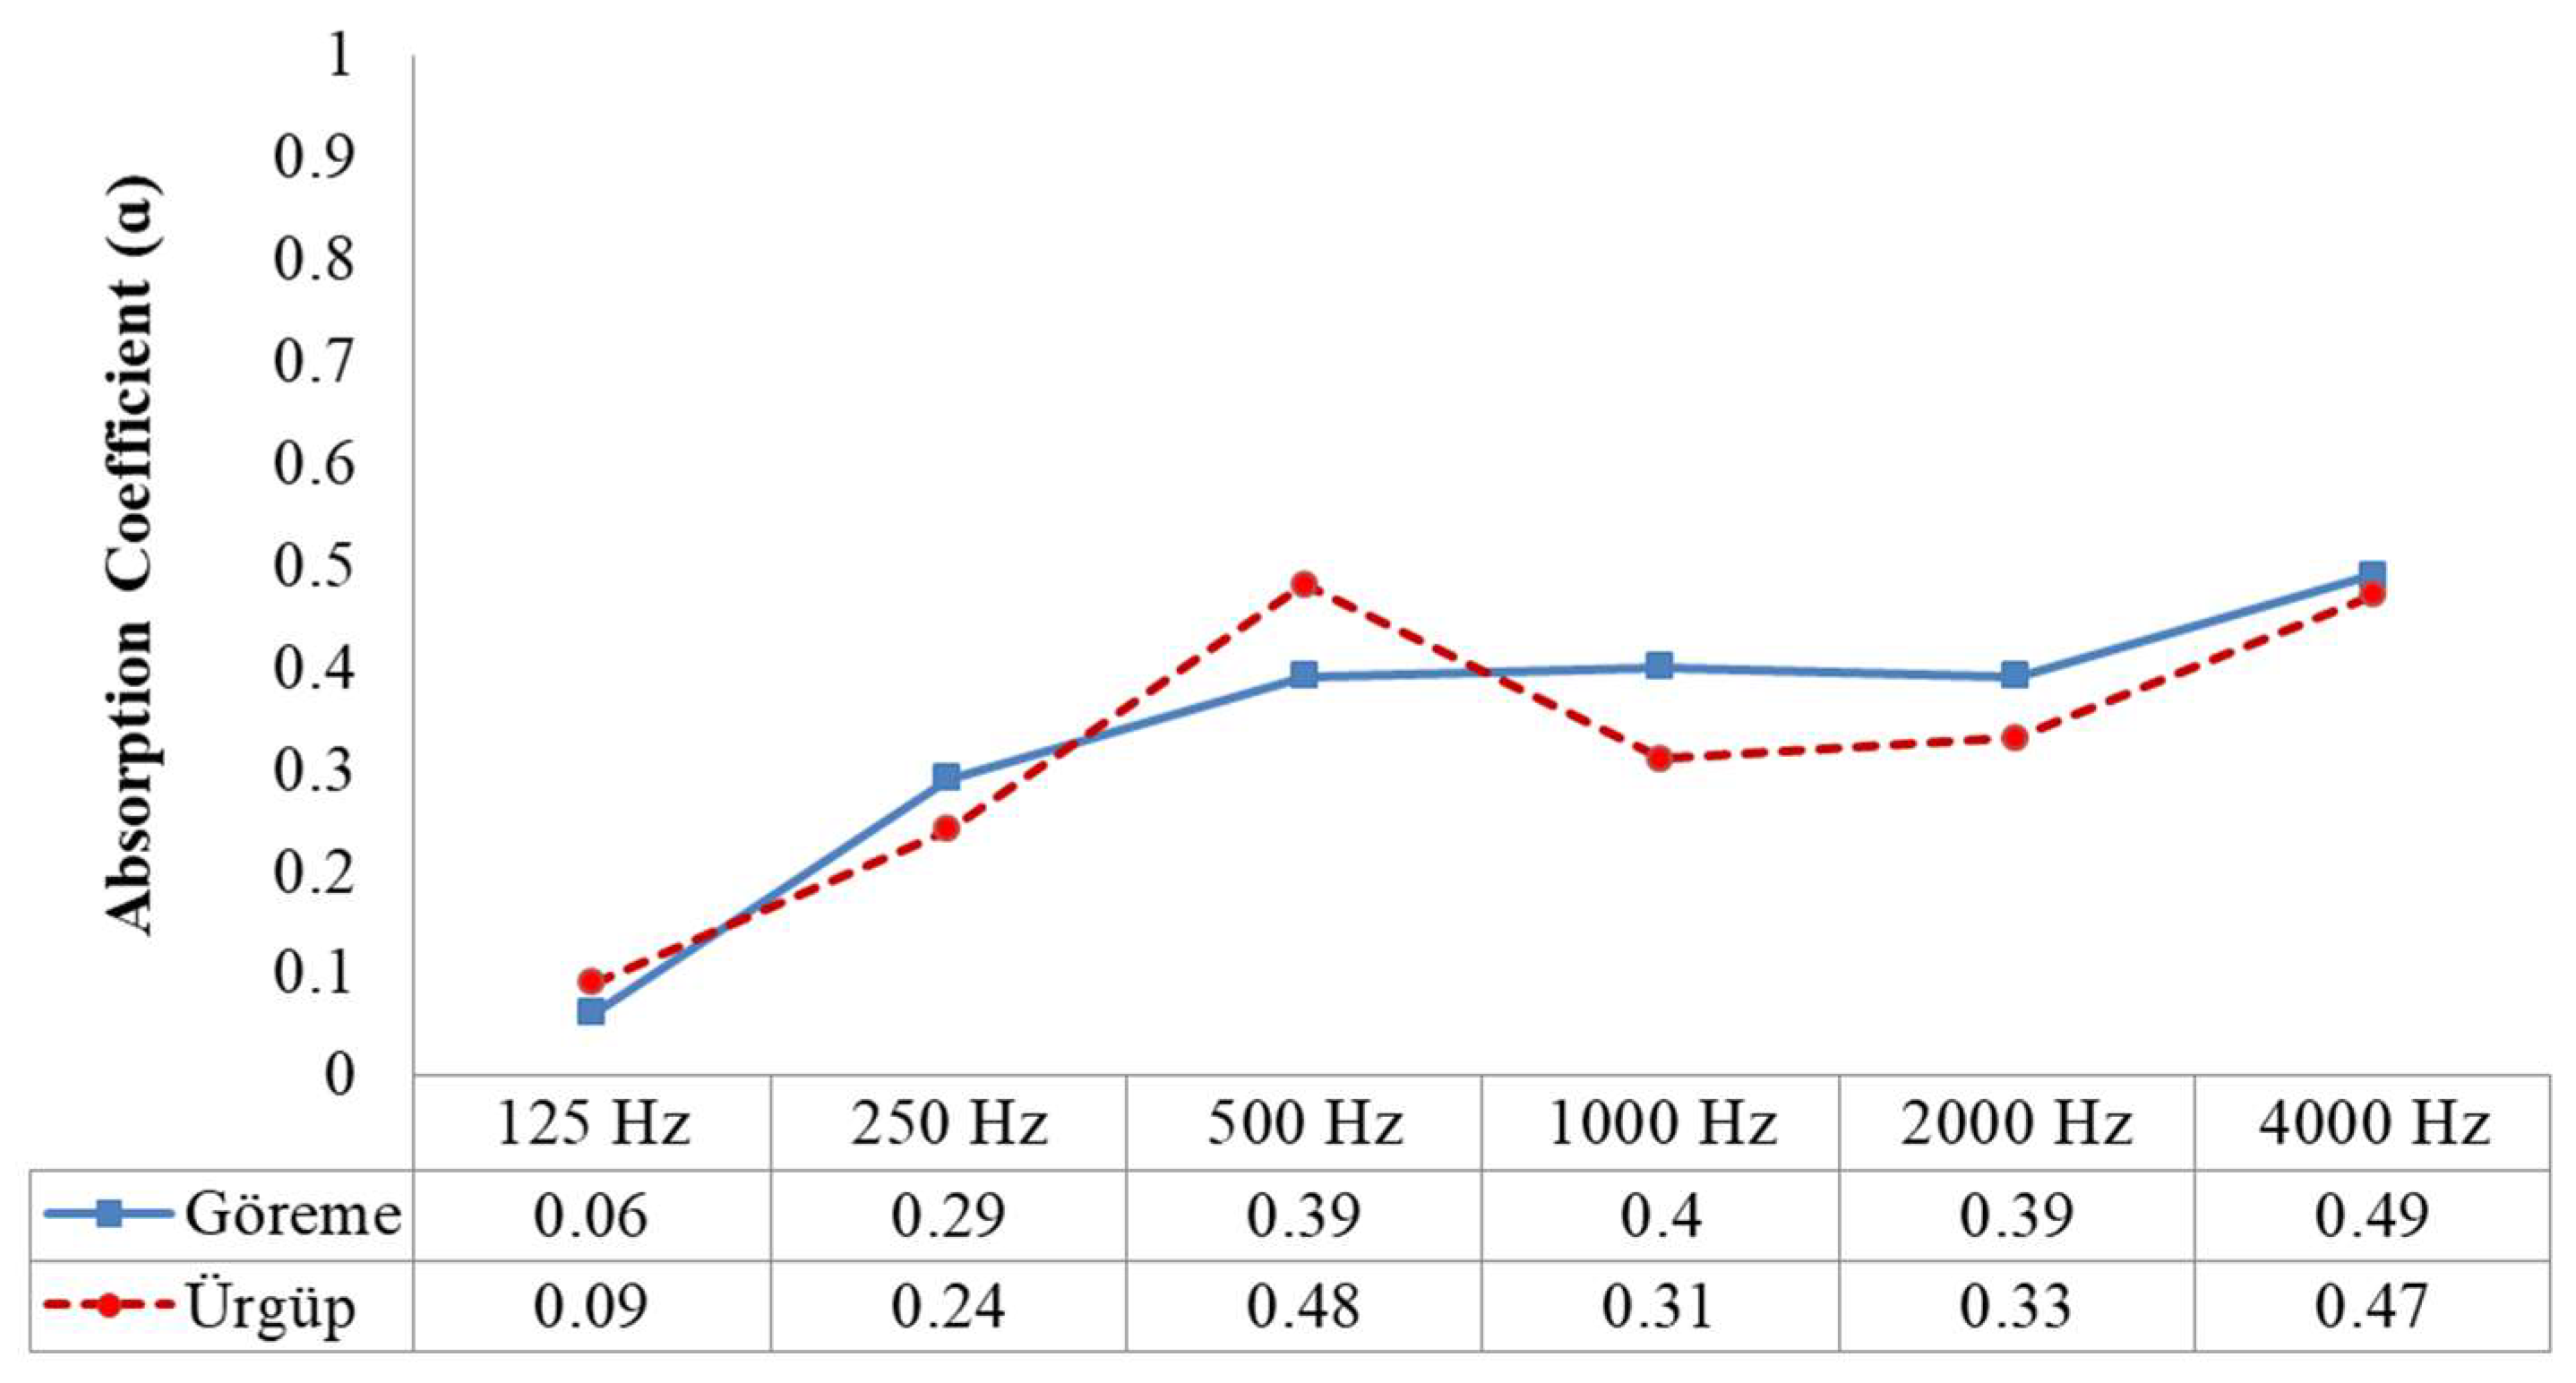
4.1.1. Impedance Test Results

As detailed in Section 3.1, tuff stone samples from Göreme and Ürgüp have been collected for further analysis of their sound absorption performance. These samples can be different from other samples collected from the same region based on their different composition. However, as part of this study, it is an attempt to document the characteristic tuff stone examples from the Cappadocia region. Most of the tuff stone samples from Cappadocia are comparatively soft and porous, but the sample from Hallaç (Figure 6) is stiff and could not be even cut properly to be tested in the impedance tube setup. Therefore, qualitative and quantitative mineral tests are conducted on the three samples under study to have a better understanding of the physical makeup of the samples. Table 1 shows the results of the qualitative test, while the results of the quantitative test are summarized in Table 2.
Based on the results of the qualitative mineral test, the three tuff stone samples are mainly composed of the same minerals such as plagioclase, quartz, mica, etc. However, there are some differences in these tuff stones. For example, tridymite is only found in the sample of Hallaç. The difference in the physical properties of the samples could be a result of the quantitative mineral makeup of the tuff stones. From a chemical point of view, the samples show comparable differences in the percentages of chemical compounds such as Na2O, SiO2, and A.Za in the sample from Hallaç (Table 2). The quantitative differences of chemical compounds in the samples can account for the different textures, porosity, and hardness of the tuff stone samples.
As a result, the two samples from Göreme and Ürgüp are much more porous and softer than the tuff stone from Hallaç, and hence, as mentioned in Section 3.1, impedance tube tests could be performed on the tuff stone samples from Göreme and Ürgüp. The results of the test are discussed as follows.
Figure 11 shows the sound absorption coefficients of the tested two rock samples over the octave bands from 125 Hz to 4000 Hz. According to the results, the absorption coefficient values of the samples are very close to each other, except for 500 Hz, where the absorption coefficient of Ürgüp’s rock sample (0.48) is slightly higher than that of Göreme (0.39). Maximum sound absorption (0.49) is achieved by the sample from Göreme at 4000 Hz. These results indicate that the collected and measured rock samples (not the hard sample that cannot be measured) are highly absorptive (especially with absorption coefficient values reaching up to 0.50) and can be categorized as absorptive materials under today’s diverse sound-absorptive material umbrella, which include both natural and man-made materials. This information is shared for future research on tuff stone and its potential application in architectural acoustics. However, the impedance tube results could not be applied to the Bell Church, as the porous samples do not reflect the current tuff in the Bell Church. For this reason, rather than the tube results, field-tuned acoustical simulation absorption data of the hard tuff stone (tuff stone type I), obtained from the Hallaç Church, are applied to the acoustical models of Bell Church.

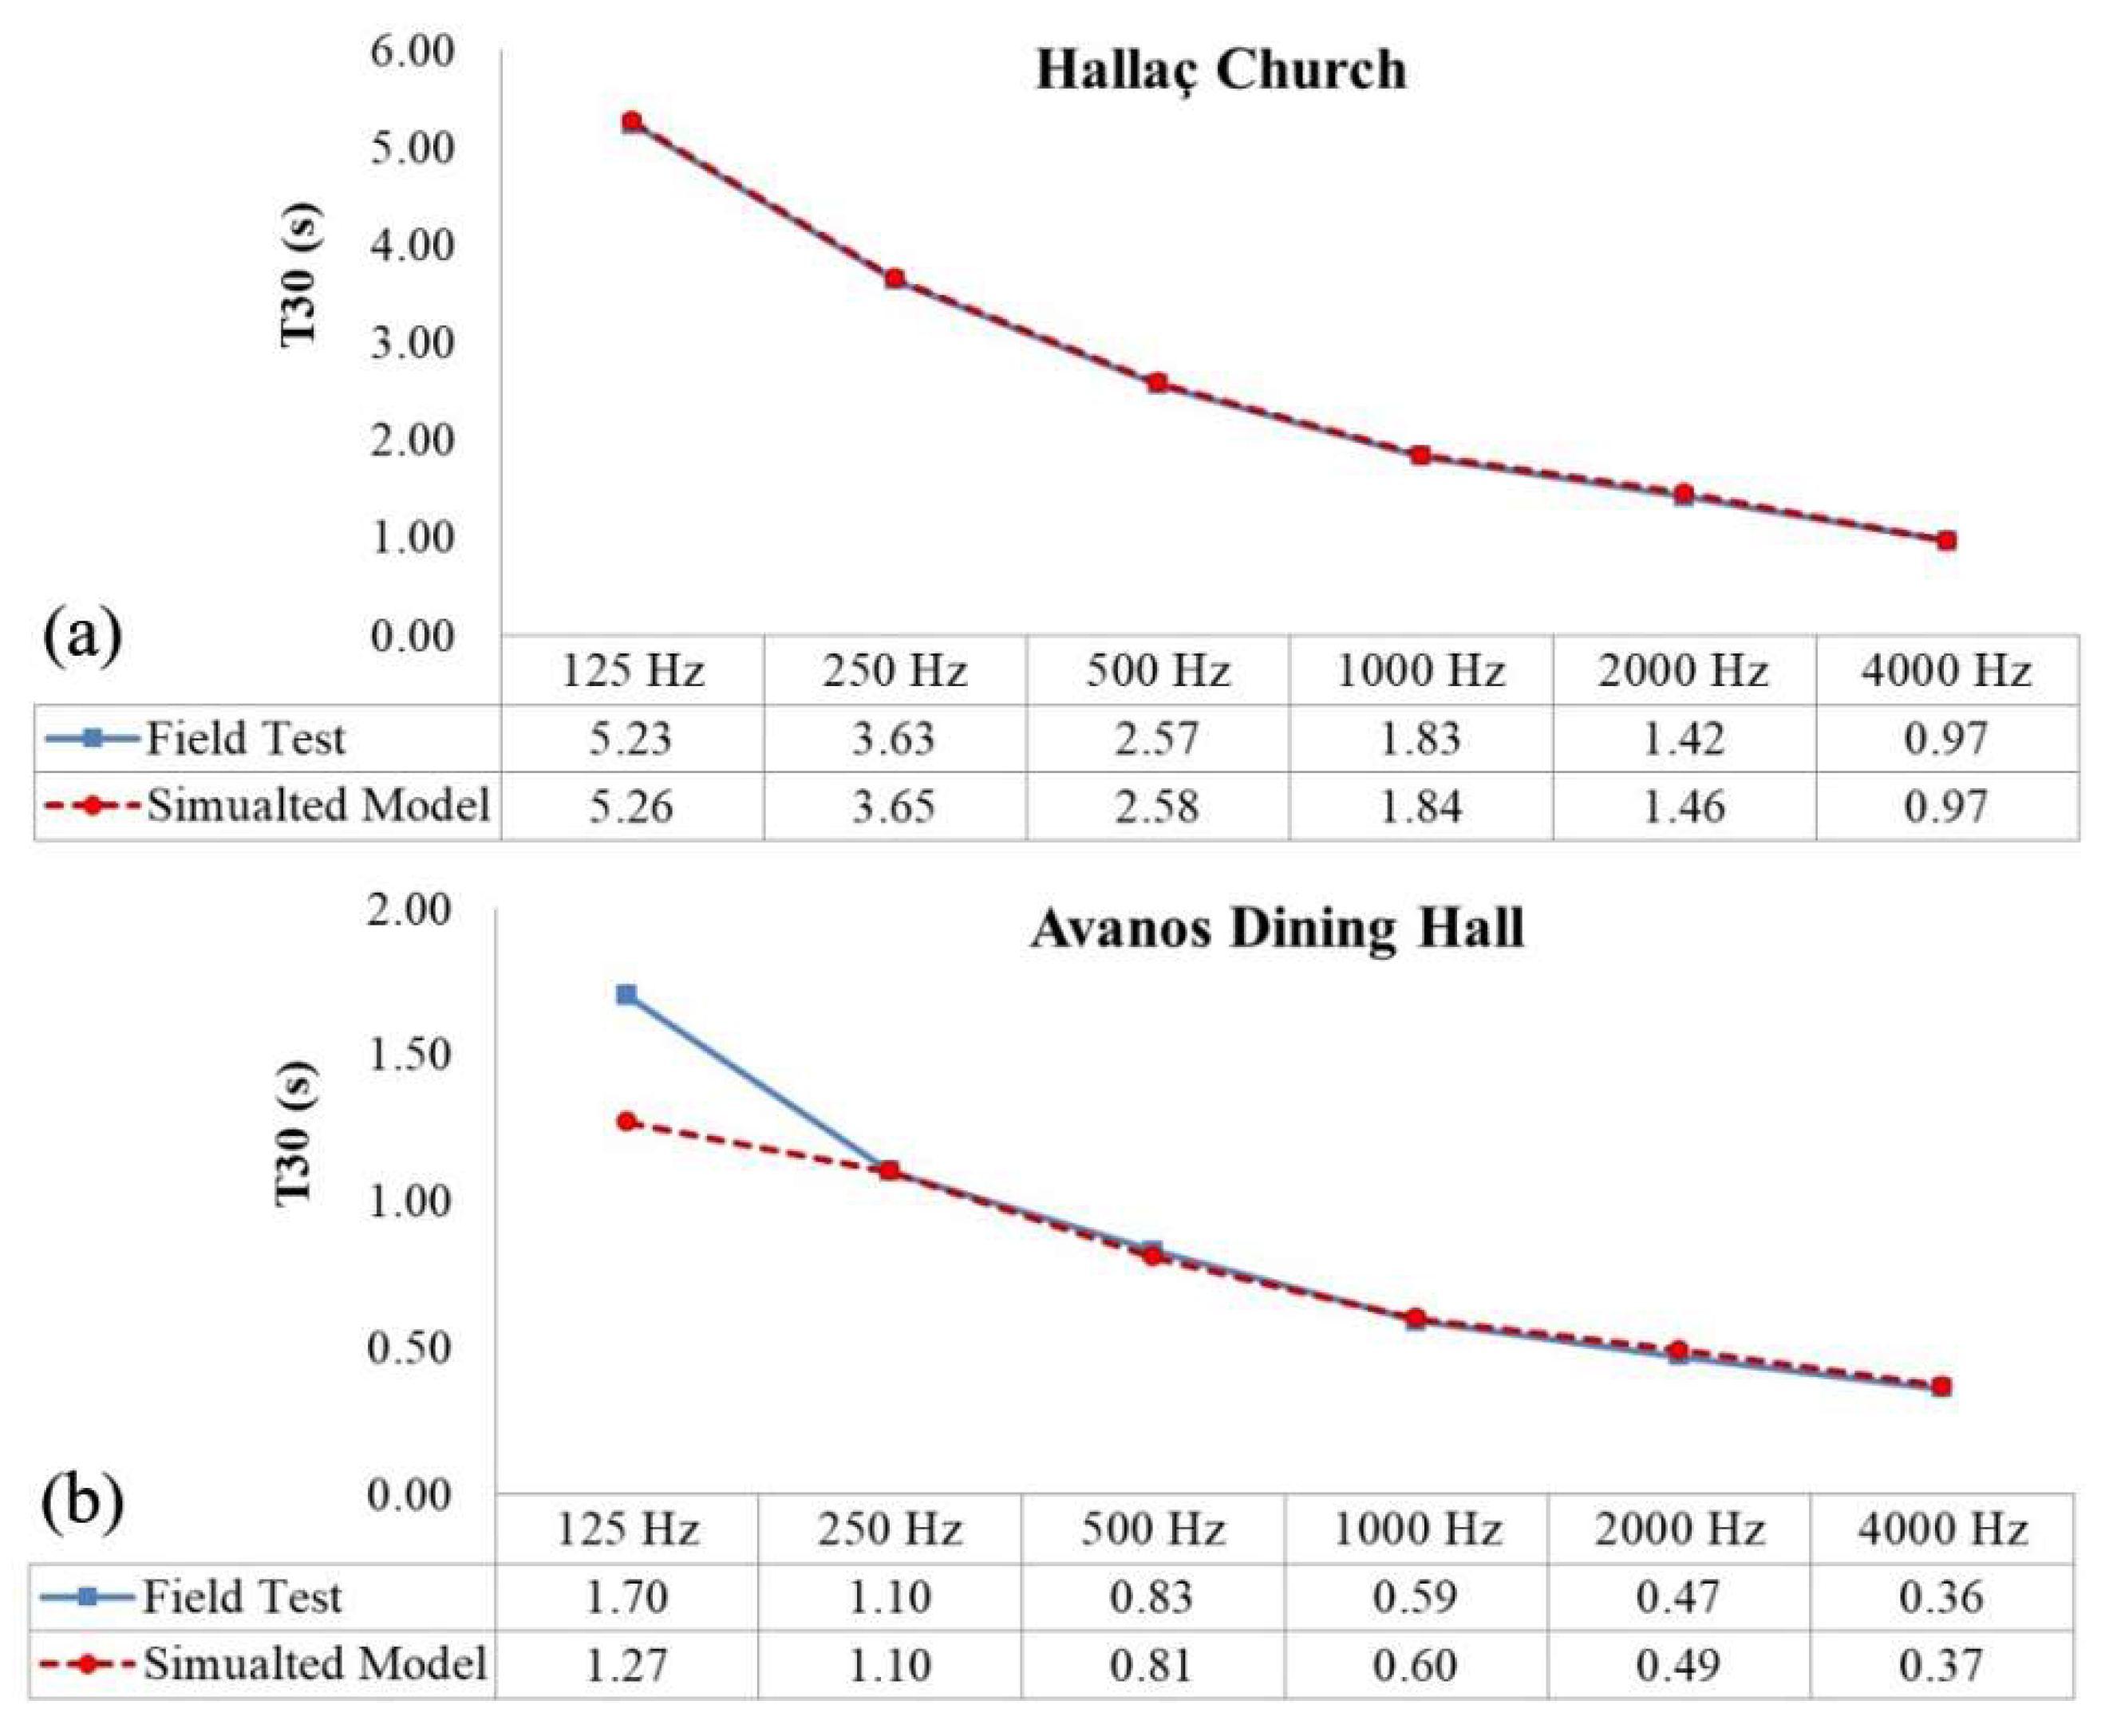
4.1.2. Acoustical Simulation Results of the Hallaç Church and Avanos Dining Hall

The main reason for generating acoustical models of the Hallaç Church and Avanos Dining Hall is to gather information regarding the tuff rocks’ acoustical performance. It is important because even though all the spaces are composed of volcanic tuff, the make-up of Cappadocian rocks from different regions is generally different based on varying rock ingredients and physical conditions. In this regard, the test results obtained from MTA (Table 1 and Table 2) prove that hypothesis. The tube results of the tested group of rocks, which are much softer and more porous in comparison to the Hallaç stone sample, have shown very high values of sound absorption. On the other hand, the current rocks of Hallaç Church (Figure 6), in texture and hardness, are much similar to the existing stones of Bell Church. Thus, a group of simulation studies is necessary for the calibration of the Bell Church’s acoustical model.
The tuning procedure is explained under Section 3.2. After adjusting the absorption coefficients of the walls and the ceiling of the church, T30 values close to (with less than 5% difference) the in-situ measurements are obtained (Figure 12). Accordingly, the attained sound absorption coefficients of the Hallaç Church’s interior tuff rock surfaces are listed in Table 3.
A similar tuning process is held for the Avanos Dining Hall. The sound absorption coefficient values over octave bands for the rock-cut tuff stone walls and ceiling are tuned according to the T30 results of the site measurements. After the absorption coefficients are adjusted to obtain T30 values for the model close to 1 JND (with less than 5% difference) to the field measurements, the tuning process is completed. The results are shown in Figure 12. The figure shows that the T30 values of both the field test and the simulated model are close to each other along the frequency spectrum, except for values at 125 Hz. Even when the absorption coefficient is kept at a minimum (0.01), the T30 value of the simulated model remains much shorter than the field test result. The additional energy obtained at 125 Hz in the field test could be due to the presence of neighboring galleries around the dining hall. The estimated absorption coefficients of the tuff material (tuff stone type II) around the walls and the ceiling vault of the Avanos Dining Hall are shown in Table 4.

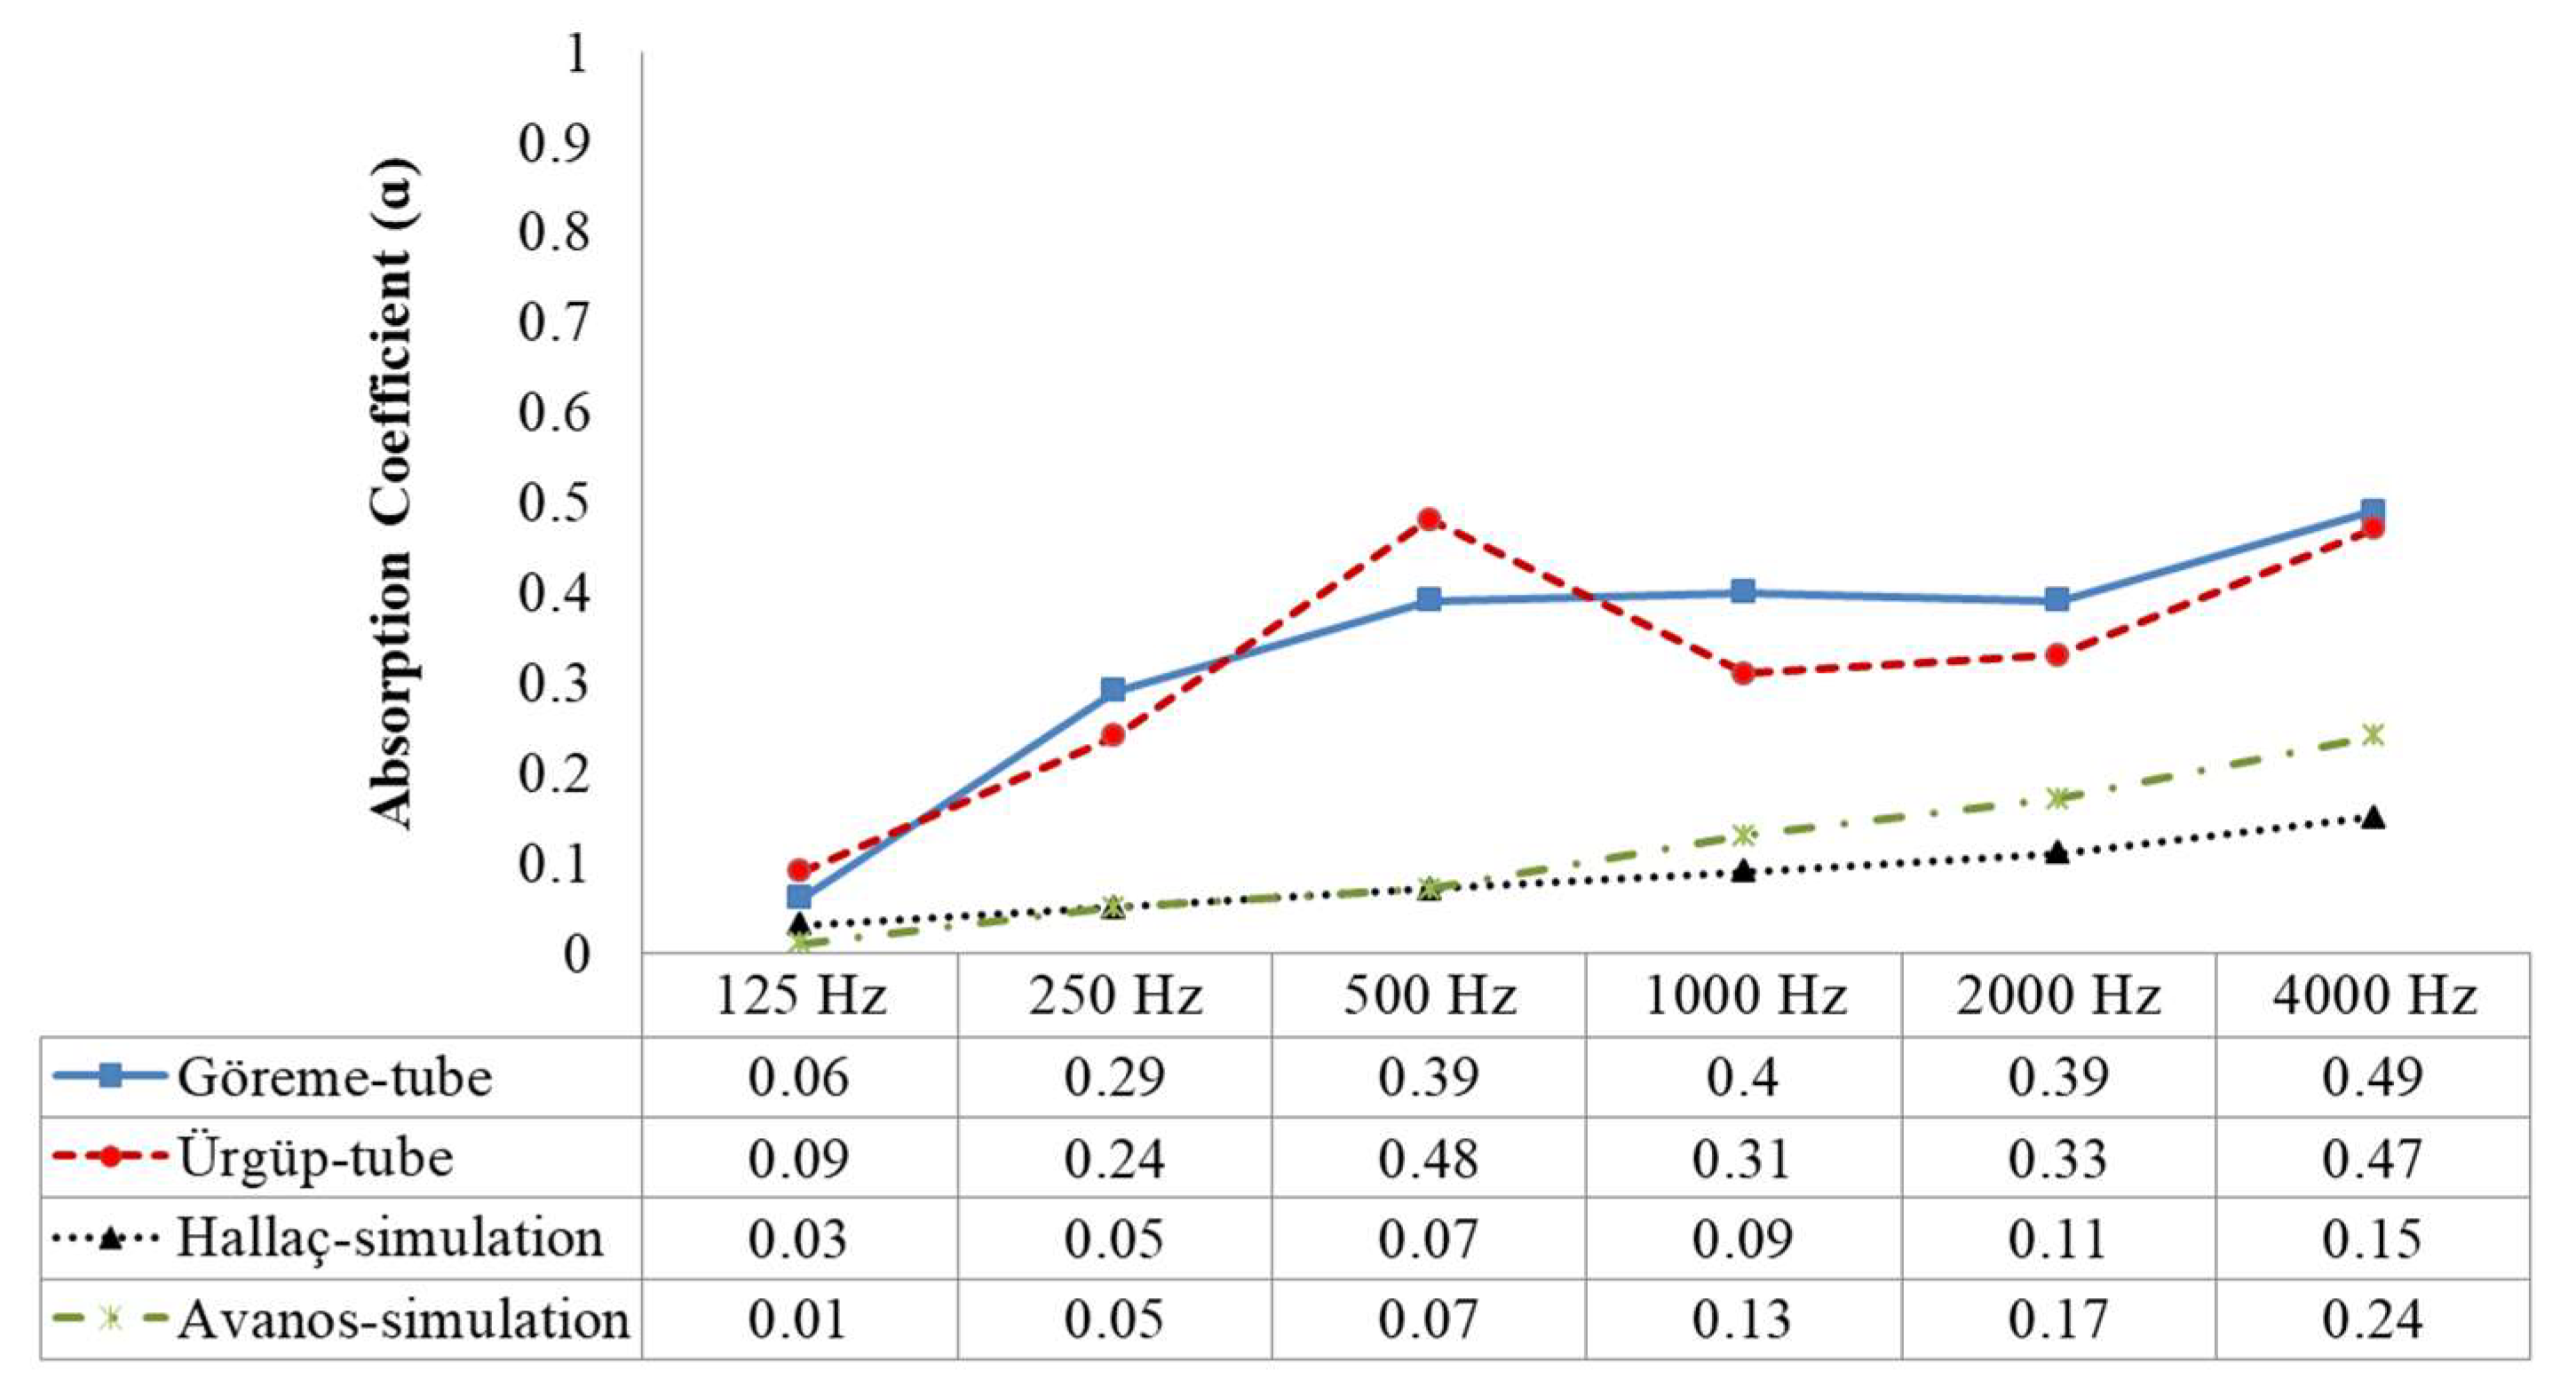
4.1.3. Comparison of Sound Absorption Coefficients Obtained by Simulations and Impedance Tests

By means of impedance measurements and acoustical simulations, four materials from different parts of Cappadocia (Göreme, Ürgüp, Hallaç Church and Avanos Dining Hall) and their absorption coefficients have been documented. It is essential to compare the data regarding these materials in order to see the similarities and differences between their sound absorption performances, as shown in Figure 13. It should also be noted that impedance tube results are not random incidence measurements, but instead rely on plane wave propagation; plane wave reflection coefficients can only be estimated. Although this is a limitation, the tube method is still one of the few techniques to be used in experimental analysis when it is not possible to collect the large samples for further reverberation chamber tests.
According to Figure 13, among all the materials under study, Göreme has the highest sound absorption, while the Hallaç Church seems to be the most reflective. The sound absorption values of the samples studied with the impedance tests (Göreme and Ürgüp) have an overall higher sound absorption than the materials obtained from the tuning of virtual models (Hallaç Church and Avanos Dining Hall).
The higher sound absorption performance of the rock samples from Göreme and Ürgüp is initially thought to be due to the fact that they are untouched rocks with higher porosity. On the other hand, the tuff stones of the Hallaç Church and Avanos Dining Hall are in their current state after the tuff around them had been carved off and the final surface smoothened. Moreover, over time, the rock materials in these spaces have been in contact with air, which could have led to the thickening of the surfaces, and hence resulted in their increased reflectivity.
Originally, the masonry church was constructed of hard gray tuff, set above an ash layer, which is different than the softer purple tuff which was carved to make the rock-cut spaces around the neighboring settlement [38]. There are basically two types of rock samples that have been evaluated: soft and hard. The difference in the hardness of these rock samples is due to their different mineral compositions. Therefore, due to a lack of data regarding the hard gray tuff found around the Bell Church settlement, the tuff stone type I (from the Hallaç Church) is used for the surrounding walls and the dome of the masonry church for its aural reconstruction. The tuff stone type I is chosen for its similar texture and hardness to the masonry blocks of the Bell Church.

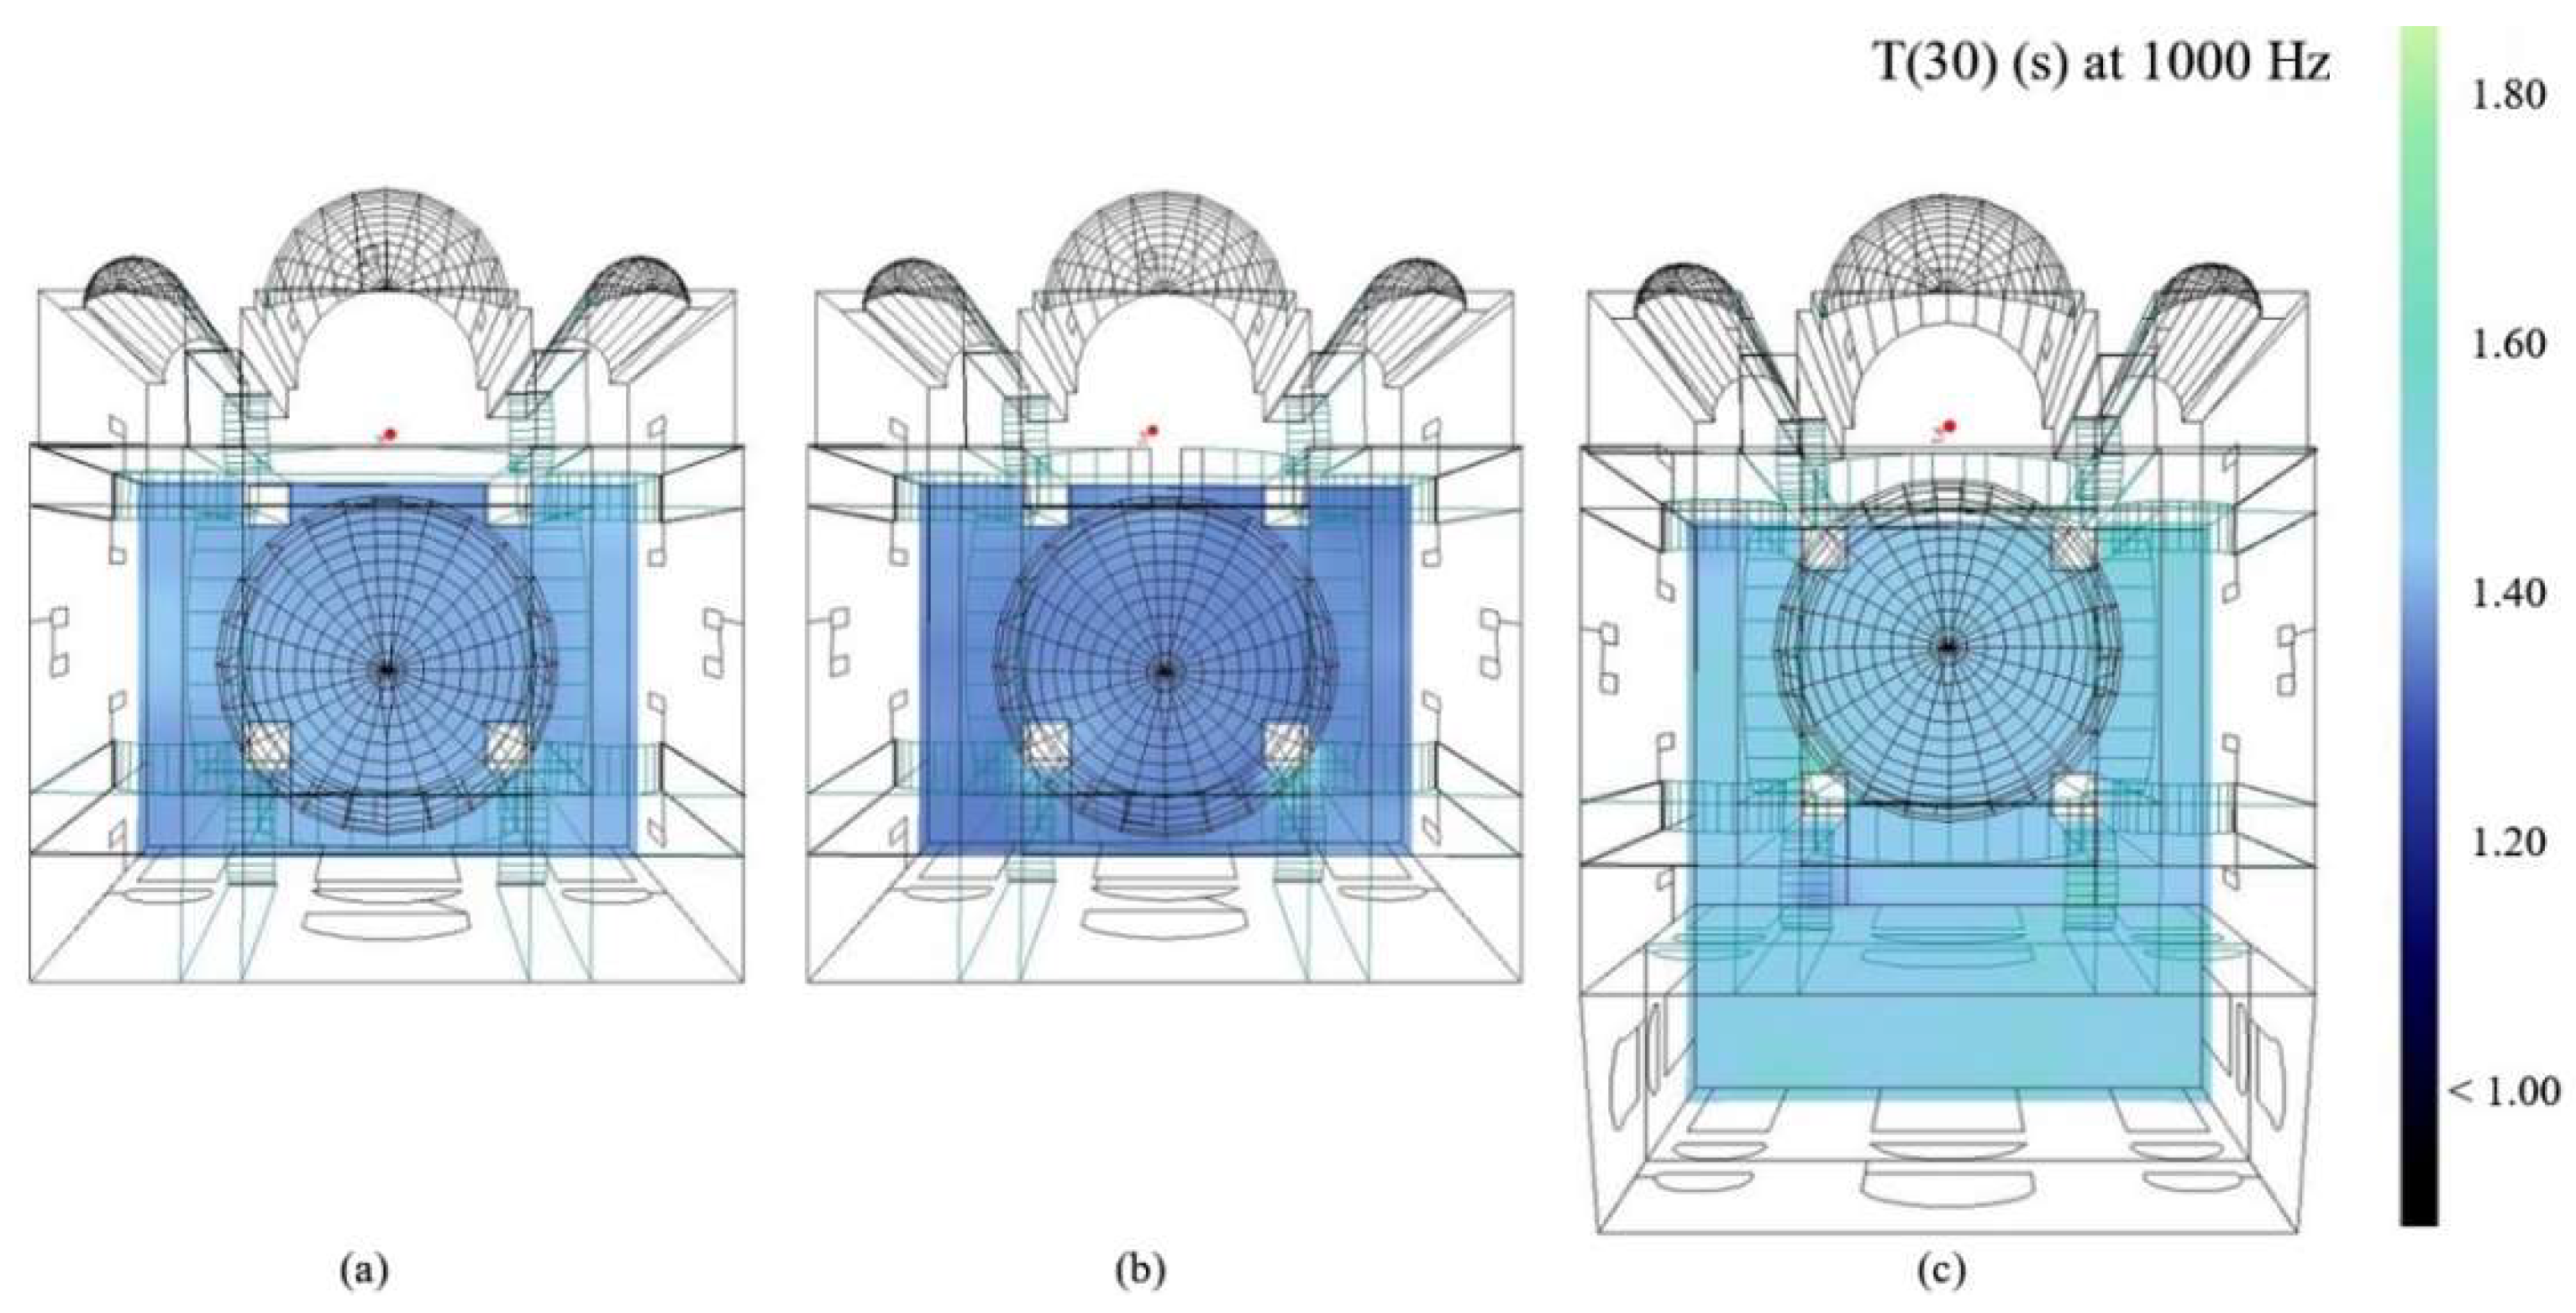
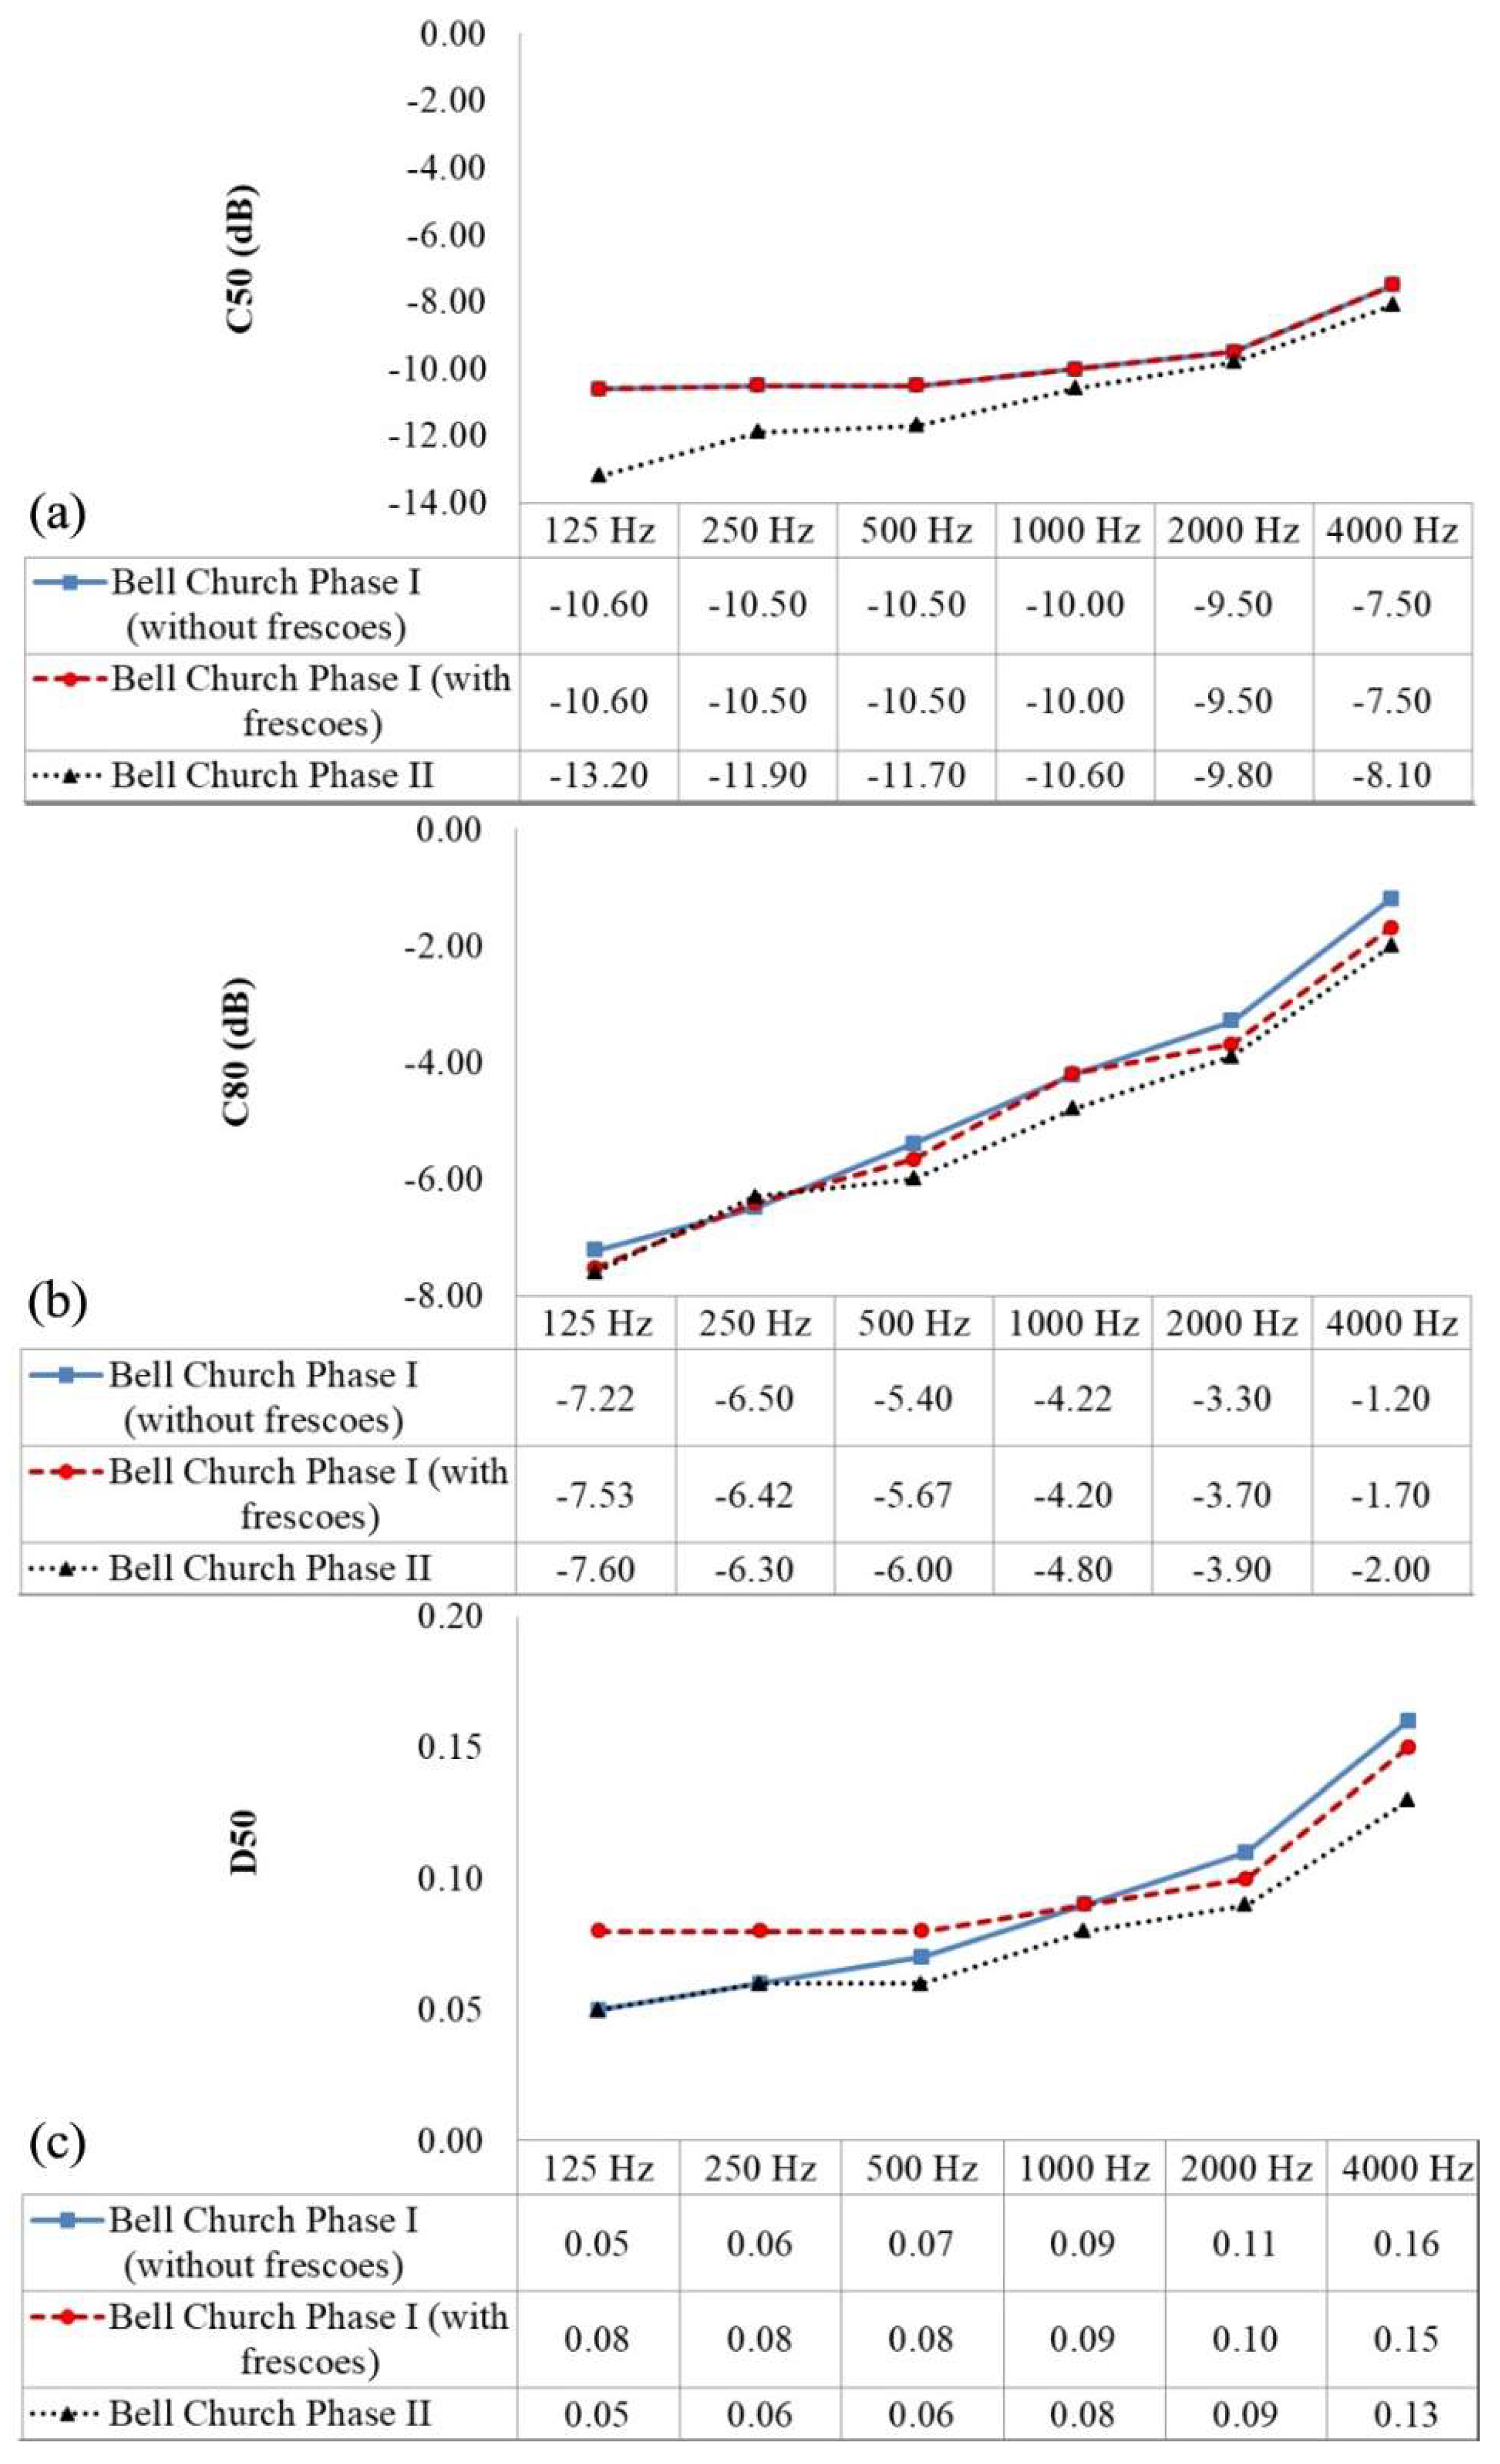
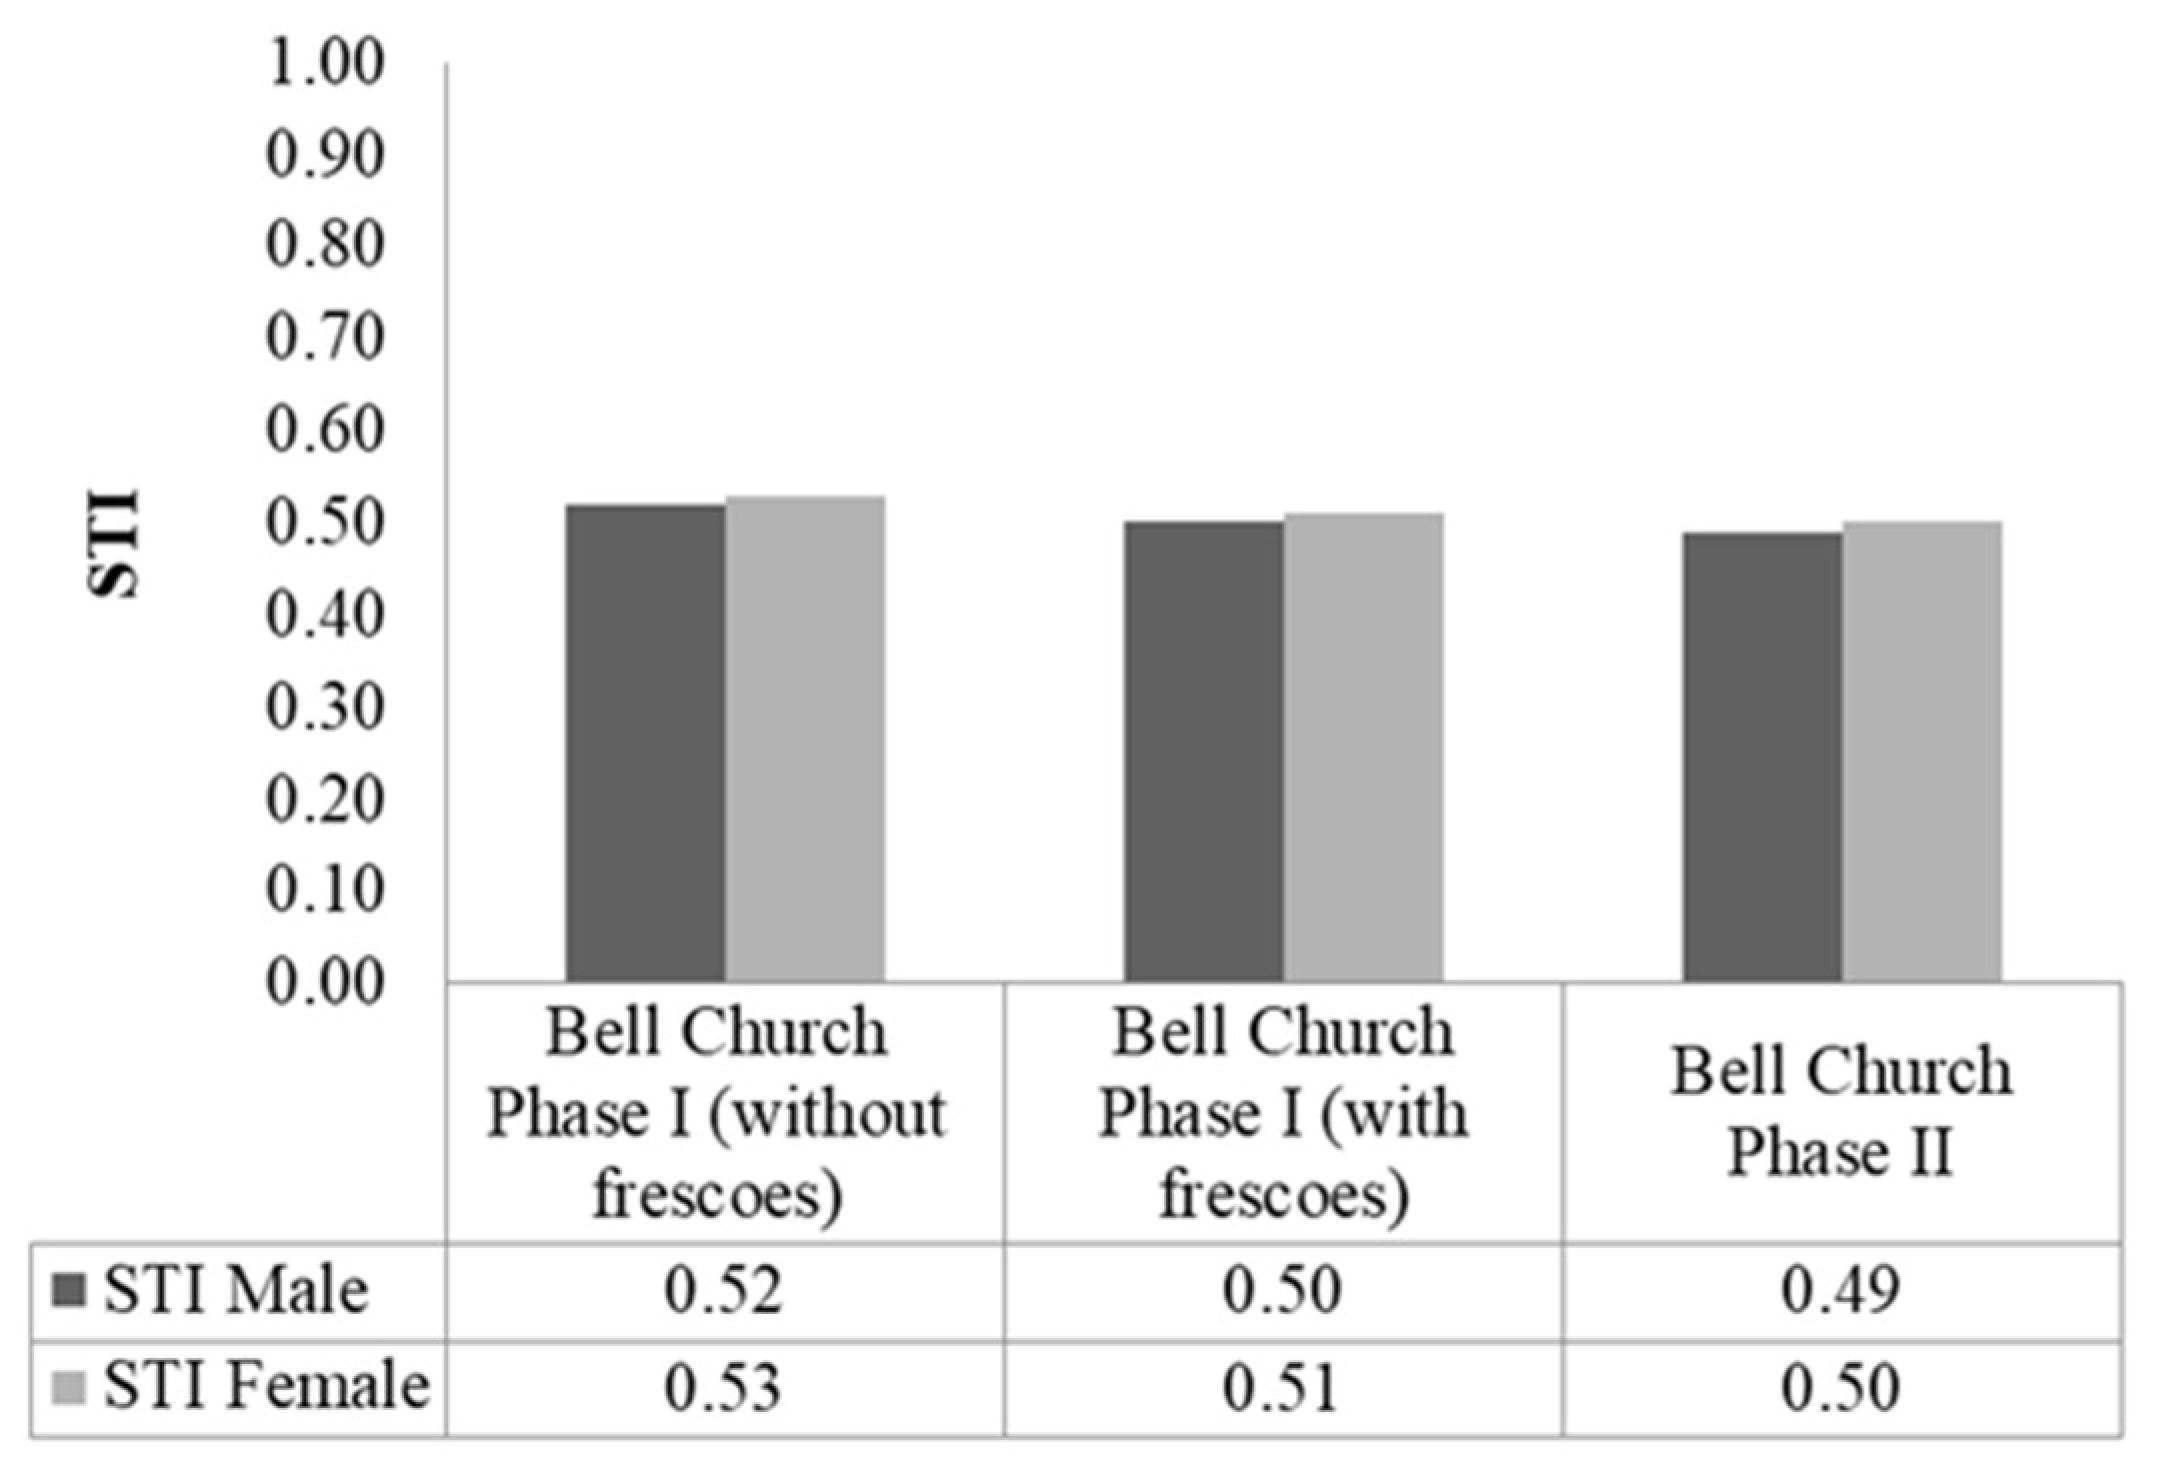
4.2. Acoustical Parameter Results and Comparisons of the Different Phases of Bell Church

The Bell Church, which in its current condition cannot even be assessed by field tests, can best be understood aurally through the utilization of virtual reconstruction and acoustical simulations. The common acoustical parameters, as previously utilized in other archaeoacoustic studies, are also used in this study to assess the acoustics of the Bell Church.
As mentioned before, the Bell Church was constructed in phases. This study documents the acoustics of three likely states of the church: Phase I (without frescoes), Phase I (with frescoes), and Phase II (with frescoes and narthex).
For Phase I (without frescoes), the tuff stone type I has been used (Table 3). For Phase I (with frescoes), the same material has been used for the walls without any traces of frescoes. In order to account for the frescoes, the sound absorption coefficients of plaster of the Hagia Sophia [8] are applied in the simulations. Although the Hagia Sophia and the Bell Church are from different time periods, the building stands as the closest example from Anatolia. The main frescoes in the Bell Church are found over the dome of the church, on the three apses, and the eastern wall. For the iconostasis of the church, a wooden material has been used. The same material is also used for the roof of the narthex, which is added in Phase II of the church. The sound absorption coefficient values of the applied materials in the acoustical models of the Bell Church are summarized in Table 5.
Early decay time (EDT), reverberation time (T30), clarity (C80), definition (D50), and speech intelligibility (STI) values are estimated from the room impulse responses collected from the simulations run on the three models representing three potential phases of the Bell Church.
Figure 14 displays EDT and T30 values of the three states of the church. For Bell Church Phase I (estimated volume: 975 m3), an optimum range for liturgical music has been estimated by applying RT = 0.55 × log10(Vol.) − 0.14 [39]. Accordingly, T30 of 1.5 s over the mid-range frequencies is optimal for liturgical performances.
The T30 value for Bell Church Phase I (without frescoes) is around 1.44 s over the mid-range frequencies (Figure 14). Based on this result, the church satisfies the average value for liturgical music (1.50 s) which would include both speech and music. For the same phase of the church, an EDT of 1.64 s for the mid frequency range is observed. The bass ratio (BR) a ratio of the reverberation times of low frequencies over middling frequencies. The BR for the church is around 1.4. The high BR, as in this case, is a means of augmenting male voices [9], which should have been an important part of the liturgical practices at a Medieval Byzantine church.
The second condition of the Phase I Bell Church (with frescoes) Is found to have an EDT of approximately 1.64 s, and a T30 of 1.39 s over the mid-range frequencies (Figure 14). The church remains suitable for practices related to liturgy with the addition of plastered frescoes in the naos. The BR of the space drops to 1.1, which is still a high BR indicating the bass frequency augmentation.
The Phase II of Bell Church includes the addition of a narthex and the frescoes in both the naos and the narthex. The estimated volume of the Phase II church is approximately 1200 m3. For this volume, an optimum RT for liturgical music is 1.55 s for mid frequencies. Figure 14 shows that the church has an EDT of 2.42 s and a T30 of 1.60 s at the mid-range frequencies. The BR of the church is approximately 1.4 s. Although the church in its Phase II favors liturgical practices, it has a much higher EDT than Phase I, which means that the perceived reverberance of the church has increased due to the addition of the narthex. The Phase II version of the church has become more alive.
Overall, the EDT, T20, and T30 values are close to each other over the whole frequency range. In most cases, the difference between EDT and RT values is less than 10%. This signifies that there is an even distribution of sound within the church space in all three stages of construction and fresco decoration. The T30 of Bell Church Phase II (1.60 s) is higher than the other two phases (Figure 14). This is due to the addition of the frescoes. The plastered surfaces in the church are more reflective compared to the tuff stone type I applied to the church over the mid- and high-range frequencies. Furthermore, the increase in T30 is also due to the additional volume of the narthex. With the new additions to the Bell Church the interior space has become more reverberant, but in all cases the decay rates are high enough and consistent with the optimums defined in the literature of church acoustics.
The EDT value of St Nicholas’s church is around 2.2 s at 1000 Hz [27]. Bell Church Phase II has a very similar EDT with 2.4 s over the mid-range frequencies. The higher EDT values are a result of larger volumes and the presence of frescoes in these churches.
The T30 at 1000 Hz distribution map (Figure 15) of the three states of the Bell Church shows that there is a fairly uniform distribution of the T30 values that are predicted over the entire floor of the church as presented by the uniform distribution of the acoustical parameter value. Bell Church Phase I (with frescoes) has the lowest T30 over the mid-range frequencies (around 1.39 s). On the other hand, Bell Church Phase II shows the highest value of T30 in the whole congregational space, with a value of approximately 1.60 s.
C50, C80 and D50 are ratios of early sound energy to late sound energy (50, 80, and 50 ms respectively), where C80 is directly correlated with music while C50 and D50 are used to analyze speech [40]. The parameters are dependent on the location of source and receiver. The optimum C50 values for speech-related activities are in the range of −2dB and +2 dB [41]. The optimum C80 values for liturgical music should be in between −2 dB and +3 dB for locations in the space that are closer to the source, whereas for larger distances, the C80 values can be in the optimum range of 0 to +5 dB [42]. The Bell Church is a comparatively small space; consequently, the optimum range of C80 for nearby locations (−2 dB and +3 dB) can be utilized. On the other hand, for speech-related activities, the optimum value of D50 should be higher than 0.15 [43].
Negative values of C50 are observed during all three states of the church (Figure 16). Bell Church Phase I (without frescoes) and Phase I (with frescoes) have the same values of C50 over the whole frequency range, which signifies that the addition of frescoes has no or minimal effect on the clarity of speech in the space. With the addition of volume, the church seems to experience lower C50 values over the entire spectrum. However, the C50 values are not in the optimum range of −2 dB to +2dB over the whole frequency range. This signifies poor condition of verbal clarity. A similar trend of negative C50 values is observed in other Byzantine churches due to late reflections, which are caused by architectural features such as vaults and domes [27]. The same reasoning could be applied for the negative C50 values of Bell Church in all its three different states. Furthermore, the presence of a wooden screen as a barrier between the naos and the apse also results in negative values of C50.
For Bell Church Phase I (without frescoes), the simulation results present negative values of C80 over the whole frequency range. The negative values of C80 indicate the absence of crisp acoustics in the space. The church is found to have an approximate C80 of −4.81 in the mid frequency range (Figure 16). The values of C80 increase with increasing octaves; however, they do not fall in the optimum range (−2 dB and +3 dB), except at 4000 Hz where C80 is −1.20 dB. For D50, the results indicate values lower than 0.15. This could be accounted by the presence of the wooden screen, which blocks early energy. Moreover, the low D50 values are also due to the high reverberation in the space. The D50 has a mean value of 0.08 at mid-range octave bands.
For Bell Church Phase I (with frescoes), negative values of C80 over the whole frequency range are observed. With the addition of frescoes, the church is found to have an approximate C80 of −4.94 dB (Figure 16). The same effect of increasing C80 values with increasing octaves is also observed. Figure 15 also shows low values of D50, with a mean value of 0.09 at mid-range frequencies.
For Bell Church Phase II, the mean C80 value is around −5.40 dB. The decrease in clarity over the different phases of the church is due to the increase in reverberation times. Similarly to the results from the earlier phases of the church, the D50 values also remain lower than 0.15 for the assessed octave bands (Figure 16). At the mid-range octave bands, the mean D50 value is 0.07. D50 values decrease with an increase in reverberation in the three versions of the church.
Generally, the energy ratio results show C50, C80 and D50 values lower than the optimum range in all phases of the Bell Church, mainly due to the blockage (barrier effect) provided by a wooden screen between the sound source and the receiver, as would be the practice during a liturgical ceremony in the church. Generally, optimum values of C80 indicate the ease of noticing differences in musical details of different instruments. However, it appears that the distinctness of sound is less audible in the Bell Church. It may be possible that the blurriness of sound could have created a more spiritual environment for the people visiting the church. It is certain that the invisible sound source and its audible effect is much different than the effect in the Hallaç Church [20] or any other church that does not have a templon separating the priest from the congregation. All the phases of the church have very similar D50 values. The low values of D50 indicate that the church is not the most suitable space for speech-related activities, which is reasonable as the church would mainly be used for congregational prayers and ceremonies where both speech and music must have been employed. The quality of speech in the church is further discussed in regard to STI scores.
Speech intelligibility can be evaluated by assessment with the Speech Transmission Index (STI), which is a metric that denotes the quality of speech while considering the loss of speech articulation caused by reverberation [44]. Figure 17 displays average male and female STI results of the three states of Bell Church under study. The differences between the male and female STI values are considerably small in all three states of the church. The STI values seem to drop with the addition of plaster in the church space, as the reverberation in the space increases. The lowest STI value is 0.49 (STI male, Bell Church Phase II), whereas the highest value is 0.53 (STI female, Bell Church Phase I, without frescoes). STI values between 0.45 and 0.60 are fair for speech intelligibility [39]. Hence, Bell Church Phase I and Phase II results indicate that the space is only fairly good for speech intelligibility, which is also supported by the church’s D50 values. Similar results in relation to speech intelligibility are obtained in other Byzantine churches due to the distortion of the speech signal in high-reverberation areas [27].

5. Conclusions

Table 3 values to field measurements. After the process is completed, sound absorption coefficients for the tuff stones in the Hallaç Church and the Avanos Dining Hall are obtained. The absorption coefficients of the material from these spaces are found to be much more reflective than those of the tuff stone samples collected from Göreme and Ürgüp, which have been tested in the tube. After comparing the results of tube tests and tuning of materials through simulations, the tuff stone of the Hallaç Church seems to be the most plausible option to be used in the simulation of Bell Church because of the material’s physical similarity to the masonry blocks of the church in terms of texture and hardness. Hence, in ray-tracing simulations, the absorption coefficient data obtained from the Hallaç Church (tuff stone type I) is applied to the acoustical models of the Bell Church.
Once the acoustical simulations are performed, the results of three states of Bell Church, Phase I (without frescoes), Phase I (with frescoes), and Phase II, are obtained and compared with each other to see the effect of the architectural changes on the acoustics of the church over time. First of all, the decay rate results from all three sates of the church show that the space is suitable for liturgical practices. As expected, T30 values show an increase with the addition of plastered frescoes and volume (narthex). Due to a screen between the source and the receiver, negative C50 and C80 values are obtained over the whole frequency range, indicating that the distinctness of musical and speech tones in a liturgical ceremony might not be clear to the listeners. The blurriness of sound in the space may have created a spiritual atmosphere. STI results denote that the church space, in all its phases, is fair for speech intelligibility. In general, the results obtained from the simulation run on the church present a different set of results (low C80 and D50 values) for different states of the church in its timespan, but these results present the characteristic indoor acoustical environment of the Bell Church, which, in combination with the unconventional architecture (e.g., wooden templon) of the church, would have made it a unique space offering a distinct aural experience.
The main motivation behind the study is to document the soundscape of a Middle Byzantine built environment in Cappadocia. With the academic discourse on the identification and functions of the spaces in Cappadocia, an acoustical approach can provide invaluable information that can help broaden the current literature. The study of the acoustical environments of Middle Byzantine churches and other rock-cut structures can be useful in identifying functional patterns of these spaces. Future archaeoacoustic studies can use the model of this research to study the acoustical performance of remote and/or ruined spaces. The Byzantine liturgy rites can also be further studied in regard to different churches and different ceremonial occasions using a similar computational reconstruction method.
To conclude, this study primarily focuses on creating the most proximate representation of the acoustical climate of a Middle Byzantine masonry church over its different phases of construction, and it has only been possible by taking into account a couple of typical methodological approaches and combining them to make a more informed decision. The challenges of aural and virtual reconstruction of a ruined church are discussed hoping that the research steps will guide similar future archaeoacoustic studies.

Author Contributions

Conceptualization, A.H.A. and Z.S.G.; methodology, Z.S.G.; software, A.H.A.; validation, A.H.A.; formal analysis, A.H.A.; investigation, A.H.A. and Z.S.G.; resources, Z.S.G.; data curation, A.H.A.; writing—original draft preparation, A.H.A.; writing—review and editing, Z.S.G.; visualization, A.H.A.; supervision, Z.S.G.; project administration, Z.S.G.; funding acquisition, Z.S.G. All authors have read and agreed to the published version of the manuscript.

Funding

This research received no external funding.

Data Availability Statement

Not applicable.

Acknowledgments

The authors would like to acknowledge Mezzo Stüdyo Ltd. for providing the necessary tools for simulations, laboratory conditions and equipment for impedance tube tests. The authors are also grateful to Ayşe Henry for her valuable contributions on the site and case selections, and her inspiration for this study.

Conflicts of Interest

The authors declare no conflict of interest.

References

  1. Brown, A.L.; Gjestland, T.; Dubois, D. Acoustic environments and soundscapes. In Soundscape and the Built Environment, 1st ed.; Kang, J., Schulte-Fortkamp, B., Eds.; Taylor & Francis Group: Oxfordshire, UK, 2017; pp. 1–16. [Google Scholar]
  2. Gibson, J.J.; Carmichael, L. The Senses Considered as Perceptual Systems; Houghton Mifflin: Boston, MA, USA, 1966; Volume 2. [Google Scholar]
  3. Öztürk, F.G. Transformation of the ‘Sacred’ Image of a Byzantine Cappadocian Settlement. In Architecture and Landscape in Medieval Anatolia, 1100–1150, 1st ed.; Blessing, P., Goshgarian, R., Eds.; Edinburgh University Press: Edinburgh, UK, 2017; pp. 135–154. [Google Scholar]
  4. Sü Gül, Z.; Xiang, N.; Çalışkan, M. Investigations on sound energy decays and flows in a monumental mosque. J. Acoust. Soc. Am. 2016, 140, 344–355. [Google Scholar] [CrossRef] [PubMed]
  5. Sü Gül, Z.; Xiang, N.; Çalışkan, M. Diffusion Equation-Based Finite Element Modeling of a Monumental Worship Space. J. Comput. Acoust. 2017, 25, 1750029. [Google Scholar] [CrossRef] [Green Version]
  6. Sü Gül, Z.; Çalıskan, M.; Tavukçuoğlu, A.; Xiang, N. Assessment of acoustical indicators in multi-domed historic structures by non-exponential energy decay analysis. Acoust. Aust. 2018, 46, 181–192. [Google Scholar] [CrossRef] [Green Version]
  7. Sü Gül, Z.; Odabaş, E.; Xiang, N.; Çalışkan, M. Diffusion equation modeling for sound energy flow analysis in multi domain structures. J. Acoust. Soc. Am. 2019, 145, 2703–2717. [Google Scholar] [CrossRef] [PubMed] [Green Version]
  8. Sü Gül, Z. Acoustical impact of architectonics and material features in the lifespan of two monumental sacred structures. Acoustics 2019, 1, 493–516. [Google Scholar] [CrossRef] [Green Version]
  9. Sü Gül, Z. Exploration of room acoustics coupling in Hagia Sophia of Istanbul for its different states. J. Acoust. Soc. Am. 2021, 149, 320–339. [Google Scholar] [CrossRef]
  10. Vassilantonopoulos, S.L.; Mourjopoulos, J. Virtual acoustic reconstruction of ritual and public spaces of ancient Greece. Acta Acust. United Acust. 2001, 87, 604–609. [Google Scholar]
  11. Sukaj, S.; Ciaburro, G.; Iannace, G.; Lombardi, I.; Trematerra, A. The Acoustics of the Benevento Roman Theatre. Buildings 2021, 11, 212. [Google Scholar] [CrossRef]
  12. Giuseppe, C.; Iannace, G.; Lombardi, I.; Trematerra, A. Acoustic design of ancient buildings: The odea of Pompeii and Posillipo. Buildings 2020, 10, 224. [Google Scholar]
  13. Gino, I.; Berardi, U. Acoustic virtual reconstruction of the Roman theater of Posillipo, Naples. Proceedings of Meetings on Acoustics 173EAA. Acoust. Soc. Am. 2017, 30, 1–9. [Google Scholar]
  14. Suarez, R.; Sendra, J.J.; Alonso, A. Acoustics, Liturgy and Architecture in the Early Christian Church. From the domus ecclesiae to the basilica. Acta Acust. United Acust. 2013, 99, 292–301. [Google Scholar] [CrossRef]
  15. Suárez, R.; Alonso, A.; Sendra, J.J. Intangible cultural heritage: The sound of the Romanesque cathedral of Santiago de Compostela. J. Cult. Herit. 2015, 16, 239–243. [Google Scholar] [CrossRef]
  16. Suárez, R.; Alonso, A.; Sendra, J.J. Archaeoacoustics of intangible cultural heritage: The sound of the Maior Ecclesia of Cluny. J. Cult. Herit. 2016, 19, 567–572. [Google Scholar] [CrossRef]
  17. Alonso, A.; Suarez, R.; Sendra, J.J. Virtual reconstruction of indoor acoustics in cathedrals: The case of the Cathedral of Granada. Build. Simul. 2016, 4, 431–446. [Google Scholar] [CrossRef]
  18. Sender, M.C.; Planells, A.; Perelló, R.R.; Segura, J.G.; Giménez, A. Virtual acoustic reconstruction of a lost church: Application to an Order of Saint Jerome monastery in Alzira, Spain. J. Build. Perform. Simul. 2018, 11, 369–390. [Google Scholar] [CrossRef]
  19. Francesco, M.; Cirillo, E.; Della Crociata, S.; Gasparini, E.; Preziuso, D. Acoustical reconstruction of San Petronio Basilica in Bologna during the Baroque period: The effect of festive decorations. J. Acoust. Soc. Am. 2008, 123, 3607. [Google Scholar]
  20. Adeeb, A.H.; Sü-Gül, Z.; Henry, A.B. Characterizing the Indoor Acoustical Climate of the Religious and Secular Rock-Cut Structures of Cappadocia. Int. J. Archit. Herit. 2021, 1–22. [Google Scholar] [CrossRef]
  21. Mathews, T.F.; Daskalakis Mathews, A.C. Islamic-style mansions in Byzantine Cappadocia and the development of the inverted T-plan. J. Soc. Archit. Hist. 1997, 56, 294–315. [Google Scholar] [CrossRef]
  22. Ousterhout, R.G. Visualizing Community: Art, Material Culture, and Settlement in Byzantine Cappadocia; Dumbarton Oaks Research Library and Collection: Washington, DC, USA, 2017. [Google Scholar]
  23. Ousterhout, R.G. A Byzantine Settlement in Cappadocia; Dumbarton Oaks: Washington, DC, USA, 2005. [Google Scholar]
  24. Ramsay, W.M.; Bell, G.L. The Thousand and One Churches (London, 1909); Reprint, with a new foreword; Outsterhout, R.G., Jackson, M.P.C., Eds.; University of Pennsylvania Press: Philadelphia, PA, USA, 2008. [Google Scholar]
  25. Rodley, L. Cave Monasteries of Byzantine Cappadocia; Cambridge University Press: Cambridge, UK, 2010. [Google Scholar]
  26. Krautheimer, R.; Ćurčić, S. Early Christian and Byzantine Architecture; Yale University Press: New Haven, CT, USA, 1992; Volume 24. [Google Scholar]
  27. Sukaj, S.; Bevilacqua, A.; Iannace, G.; Lombardi, I.; Parente, R.; Trematerra, A. Byzantine Churches in Albania: How Geometry and Architectural Composition Influence the Acoustics. Buildings 2022, 12, 280. [Google Scholar] [CrossRef]
  28. St. Nicholas (Mesopotam) Monastery. Available online: https://www.intoalbania.com/attraction/st-nicholas-mesopotam-monastery (accessed on 26 April 2022).
  29. Vasileios, M. Architecture and Ritual in the Churches of Constantinople: Ninth to Fifteenth Centuries; Cambridge University Press: Cambridge, UK, 2014. [Google Scholar]
  30. Teteriatnikov, N.B. The Liturgical Planning of Byzantine Churches in Cappadocia. In Orientalia Christiana Analecta; Pontificio Istituto Orientale: Rome, Italy, 1996; p. 252. [Google Scholar]
  31. International Organization for Standardization (ISO). ISO 10534-2; Acoustics–Determination of Sound Absorption Coefficient and Impedance in Impedance Tubes-Part 2: Transfer-Function Method.; International Organization for Standardization (ISO): Geneva, Switzerland, 1998. [Google Scholar]
  32. McGrory, M.; Castro Cirac, D.; Gaussen, O.; Cabrera, D. Sound Absorption Coefficient Measurement: Re-Examining the Relationship between Impedance Tube and Reverberant Room Methods. In Proceedings of the Acoustics, Fremantle, Australia, 21–23 November 2012; 2012. [Google Scholar]
  33. Chung, J.Y.; Blaser, D.A. Transfer function method of measuring in-duct acoustic properties. II. Experiment. J. Acoust. Soc. Am. 1980, 68, 914–921. [Google Scholar] [CrossRef]
  34. Rindel, J.H. The use of computer modeling in room acoustics. J. Vibroengineering 2000, 3, 219–224. [Google Scholar]
  35. International Organization for Standardization (ISO). In ISO. ISO 3382-1; Acoustics: Measurement of the Reverberation Time of Rooms with Reference to Other Acoustical Parameters; International Organization for Standardization (ISO): Geneva, Switzerland, 2009.
  36. Martellotta, F. The just noticeable difference of center time and clarity index in large reverberant spaces. J. Acoust. Soc. Am. 2010, 128, 654–663. [Google Scholar] [CrossRef] [PubMed]
  37. Bork, I. A comparison of room simulation software-the 2nd round robin on room acoustical computer simulation. Acta Acust. United Acust. 2000, 86, 943–956. [Google Scholar]
  38. Ousterhout, R. Survey of the Byzantine Settlement at Çanlı Kilise in Cappadocia: Results of the 1995 and 1996 Seasons; Dumbarton Oaks Papers: Wahington, DC, USA, 1997; pp. 301–306. [Google Scholar]
  39. Beranek, L.L. Acoustical Measurements; Acoustical Society of America: New York, NY, USA, 1988. [Google Scholar]
  40. Barron, M. Auditorium Acoustics and Architectural Design; Routledge: Oxfordshire, UK, 2009. [Google Scholar]
  41. Giron, S.; Alvarez-Morales, L.; Zamarreno, T. Church acoustics: A state-of-the-art review after several decades of research. J. Sound Vib. 2017, 411, 378–408. [Google Scholar] [CrossRef]
  42. Makrinenko, L.I. Acoustics of Auditoriums in Public Buildings; American Institute of Physics: College Park, MD, USA, 1994. [Google Scholar]
  43. Templeton, D. Acoustics in the Built Environment: Advice for the Design Team; Butterworth-Heinemann: Oxford, UK, 1998. [Google Scholar]
  44. Steeneken, H.J.; Houtgast, T. A physical method for measuring speech-transmission quality. J. Acoust. Soc. Am. 1980, 67, 318–326. [Google Scholar] [CrossRef]
Figure 1. A map of the towns in Cappadocia taken from Google Maps. A similar map has been used by Öztürk [3], p. 137.
Acoustics 04 00026 g001
Figure 2. (a) An exterior view of Bell Church; (b) an interior view of the main church space (naos) with three apses; (c) the entrance hallway (narthex) of the church.
Acoustics 04 00026 g002
Figure 3. Plan and section drawings of the Bell Church showing its two phases of construction. Drawn by the authors based on the drawings from Ousterhout [22], pp. 92, 94.
Acoustics 04 00026 g003
Figure 4. (a) A diagrammatic view of Kundt Impedance Tubes; (b) the Kundt Tube setup used in the study.
Acoustics 04 00026 g004
Figure 5. Göreme rock sample (a) for low-frequency setup; (b) for high-frequency setup; Ürgüp rock sample (c) for low-frequency setup; (d) for high-frequency setup.
Acoustics 04 00026 g005
Figure 6. Rock sample from Hallaç Complex, which could not be cut to be used for impedance tube testing.
Acoustics 04 00026 g006
Figure 7. Hallaç Church (a) ray tracing model with source (red) and receiver (blue) positions; (b) 3D Open GL of an interior view.
Acoustics 04 00026 g007
Figure 8. Avanos Dining Hall (a) ray tracing model with source (red) and receiver (blue) positions; (b) 3D Open GL of an interior view.
Acoustics 04 00026 g008
Figure 9. Ray tracing model of Bell Church from (a) Phase I; (b) Phase II.
Acoustics 04 00026 g009
Figure 10. 3D Open GL of an interior view of Bell Church from (a) Phase I; (b) Phase II.
Acoustics 04 00026 g010
Figure 11. Absorption coefficient (α) values over 1/1 octave bands of the rocks from Göreme and Ürgüp. Maximum sound absorption (0.49) is achieved by the sample from Göreme at 4000 Hz.
Acoustics 04 00026 g011
Figure 12. T30 values over 1/1 octave bands of the field test and simulated model of (a) the Hallaç Church; (b) the Avanos Dining Hall. T30 values of both the field test and the simulated model are close to each other along the frequency spectrum.
Acoustics 04 00026 g012
Figure 13. Absorption coefficients (α) of the materials over 1/1 octave bands from the Hallaç Church, Avanos Dining Hall, Göreme, and Ürgüp tuff stones. Göreme has the highest sound absorption, while the Hallaç Church seems to be the most reflective sample.
Acoustics 04 00026 g013
Figure 14. (a) EDT; (b) T30 over 1/1 octave bands for Bell Church acoustical models. The highest EDT of 2.42 s and a T30 of 1.60 s at the mid-range frequencies is observed in Phase II of Bell Church.
Acoustics 04 00026 g014
Figure 15. T30 (1000 Hz) distribution maps of (a) Bell Church Phase I (without frescoes); (b) Bell Church Phase I (with frescoes); (c) Bell Church Phase II. There is a fairly uniform distribution of the T30 values over the entire floor of the church.
Acoustics 04 00026 g015
Figure 16. (a) C50; (b) C80; (c) D50 obtained over 1/1 octave bands for Bell Church Phase I & II. Negative C50 values are observed in all phases of the church. The values of C80 increase with increasing octaves, with Phase II showing a mean C80 value of around −5.40 dB. The low D50 values observed are due to high reverberation in the space.
Acoustics 04 00026 g016
Figure 17. Male and female STIs obtained for Phase I & II of Bell Church. The lowest STI value is 0.49 (STI male, Bell Church Phase II), whereas the highest value is 0.53 (STI female, Bell Church Phase I, without frescoes).
Acoustics 04 00026 g017
Table 1. Results of the Qualitative Mineral Test on the tuff stone samples from Göreme, Ürgüp, and Hallaç.
SampleMineral Composition
GöremeGypsum, kaolinite, clay, calcite, quartz, plagioclase, cristobalite, alkali feldspar, mica, zeolite, amphibole
ÜrgüpPlagioclase, clay, quartz, cristobalite, dolomite, zeolite, alkali feldspar, mica, calcite
HallaçQuartz, plagioclase, clay, mica, alkali feldspar, cristobalite, tridymite, amphibole (little traces)
Table 2. Results of the Quantitative Mineral Test on the tuff stone samples from Göreme, Ürgüp, and Hallaç.
SampleChemical Compounds (%)
A.ZaAl2O3CaOFe2O3K2OMgOMnONa2OP2O5SiO2TiO2
Göreme8.910.02.21.23.20.2<0.10.70.170.90.1
Ürgüp6.711.31.33.03.90.5<0.11.00.171.70.1
Hallaç4.210.92.02.83.50.30.11.6<0.174.20.2
Table 3. Absorption coefficients (ɑ) over 1/1 octave bands of the materials applied to the Hallaç Church acoustical model.
Materials/LocationsFrequency (Hz)
125250500100020004000
Stone (marble)/Floor0.010.010.010.020.020.02
100% open to outdoor1.001.001.001.001.001.00
Hallaç church (tuff stone type I)/Walls & ceiling0.030.050.070.090.110.15
Table 4. Absorption coefficients (α) over 1/1 octave bands of the materials applied to the Avanos Dining Hall acoustical model.
Materials/LocationsFrequency (Hz)
125250500100020004000
Stone (marble)/Floor0.010.010.010.020.020.02
50% Absorbent (open door to kitchen)0.500.500.500.500.500.50
Avanos dining hall (tuff stone type II)/Walls & ceiling vault0.010.050.070.130.170.24
Table 5. Absorption coefficients (ɑ) over 1/1 octave bands of the materials applied to Bell Church acoustical model.
Materials/LocationsFrequency Band (Hz)
125250500100020004000
Stone (marble)/Floor0.010.010.010.020.020.02
100% open to outdoor1.001.001.001.001.001.00
Tuff stone type I/Walls & ceiling0.030.050.070.090.110.15
Fresco paintings0.130.090.070.050.030.04
Wooden screen & narthex roof0.150.200.100.100.100.10
Publisher’s Note: MDPI stays neutral with regard to jurisdictional claims in published maps and institutional affiliations.

