Article

Analysis of Sensitivity of Distance between Embedded Ultrasonic Sensors and Signal Processing on Damage Detectability in Concrete Structures

1
NeoStrain Sp. z o.o, Lipowa 3, 30-702 Krakow, Poland
2
Bundesanstalt für Materialforschung und -Prüfung (BAM), Unter den Eichen 87, 12205 Berlin, Germany
*
Author to whom correspondence should be addressed.
These authors contributed equally to this work.
Acoustics 2022, 4(1), 89-110; https://doi.org/10.3390/acoustics4010007
Submission received: 23 December 2021 / Revised: 23 January 2022 / Accepted: 25 January 2022 / Published: 1 February 2022
(This article belongs to the Special Issue Recent Developments in Ultrasound Applications)

Abstract

:
Damage detection of reinforced concrete (RC) structures is becoming a more attractive domain due to the safety issues arising in the last few decades. The damage in concrete can be caused by excessive exploitation of the structure or environmental effects. The cracks in concrete can be detected by different nondestructive testing methods. However, the available methods used for this purpose have numerous limitations. The technologies available in the market nowadays have difficulties detecting slowly progressive, locally limited damage. In addition, some of these methods cannot be applied, especially in hard-to-reach areas in the superstructures. In order to avoid these deficiencies, an embedded ultrasonic methodology can be used to detect cracks in RC structures. In this study, the methodology of crack detection supported with the advanced signal processing algorithm was proposed and verified on RC structures of various types, and cracks occurring between embedded sensors can be detected. Moreover, different pairs of ultrasonic sensors located in the considered structures are used for the analysis of the sensitivity of distance between them. It is shown that the ultrasonic sensors placed in the range of 1.5–2 m can detect cracks, even when the other methods failed to detect changes in the structure. The obtained results confirmed that diffuse ultrasonic sensor methodology is able to monitor real structures more effectively than traditional techniques.

1. Introduction

Most of the civil structures are made of composite materials, mainly reinforced concrete, due to the load-carrying capacity and less expensive components. However, concrete is a heterogeneous material that changes its properties over the time due to heavy load, environmental aggression, and complex mechanical behavior, including the initiation and propagation of cracks [1]. The progressive cracks allowed water to enter inside the structure, introducing a chemical reaction with reinforcement rods. This chemical reaction establishes a corrosion which degrades the strength of the structure. Therefore, concrete structures are less reliable due to material degradation over the period. Yet, it is built for long-term service. Following this, structural health monitoring is necessary, since it can increase the reliability of the structures. Traditional sensors (such as strain gauges, accelerometers, and weight in motion) are commonly used in the SHM system [2,3,4,5]. Traditional sensors mainly measured point-based locations. Therefore, they are not economically beneficial for long-range inspection.
The nondestructive techniques (NDT), which may use different kinds of sensors, can be applied in the SHM system. There are different sets of NDT techniques available in the market [6,7,8,9]. The most reliable NDT techniques are acoustic emission and ultrasonic NDT [10,11,12]. The acoustic emission technique requires costly equipment. In addition, it is sensitive to background noises, which requires more pre-processing and consumes more energy. On the other hand, the ultrasonic NDT technique is economical, and the consequent relationship between the wave velocity and quality of the materials makes this system more attractive [13,14]. During infrastructural inspection, the ultrasonic NDT requires a trained operator and constant coupling between the sensors [15]. This is a disadvantage for long-term monitoring, which restricts the use of this technique in the SHM system. Therefore, Bundesanstalt für Materialforschung und -prüfung (BAM) developed a new ultrasonic measurement system that can be embedded inside the structure [16]. The main benefit of this measurement system is constant coupling between the sensors and durability inside the structure. It can measure the response from a long portion of the structure.
In ultrasonic NDT, the ultrasonic pulse velocity method is mainly used to measure the damage inside the structure. Here, the decision to detect damage is based on the velocity of the excitation pulse [17]. Even so, it is difficult to detect damage in a large composite structure, as the signal becomes weaker after passing some distance and becomes noisy. For this reason, the ultrasonic receiver sensor can acquire more reflected waves from concrete material and as well as the diffuse waves of the structure [18]. The main advantages of this method are its high sensitivity and capability of monitoring wide areas (as diffuse waves come from different parts of a tested structure). In the diffuse ultrasonic method, two transducers are placed at a certain distance; one sensor is used to transmit the pulse and another one is used to record the diffuse signal. The first challenge linked with diffuse waves is the sensor placement, because it allows many reflections if the sensors are placed at a long distance; thus, more noisy signal can be added into diffuse waves. Therefore, it can mislead analysis of the structural response. This challenge addresses the optimal sensor placement as an essential research topic for real structures, as it is more challenging in the real structure due to the dimensions of the structure.
The location optimization of sensors has been the subject of a vast number of studies [19,20,21]. For traditional sensors used in the SHM system, it is uneconomical to install sensors on every point of a cross-section in the structure. For example, in [22], the authors investigated optimal sensor placement using genetic algorithms. In [23], the researchers showed an optimality criterion for the selection of optimal sensor locations, and the ground was based on a frequency domain-based optimal sensor placement. In another study, a methodology for the effective positioning of sensors and actuators for damage detection was presented, where a fitness function was applied to get maximum coverage of the structure via Lamb waves. In [24], the authors proposed a genetic algorithm-based optimization strategy for guided ultrasonic waves applied on a simple aluminum plate to get maximum coverage. In another study [25], the authors proposed a bespoke genetic algorithm for optimal transducer placement for adhesive disbond detection on metallic aerospace structures. In [26], the authors compare different NDT methods to detect cracks in a benchmark structure, and statistical evaluation was also performed. However, no research studies can be found on optimal ultrasonic sensor placement, considering diffuse ultrasonic waves in a concrete structure. These techniques developed for the diagnosis of structures often extract raw signals as a response of a structure, and then, features are extracted from these raw signals. There are different signal processing algorithms that can be found, which were used as damage-sensitive features. The signal-processing algorithms have an influence on processing these raw signals, as in a real structure, signals are more influenced by noises. In [27], the authors presented a novel approach for vibration-based damage detection using an Autoregressive (AR) Model. The cross-correlation function was used for damage detection in a steel beam under varying temperatures [28]. In [29], the authors applied the wavelet transform to detect damage in the structures. The short-time Fourier transform (STFT) has been used to detect local damage in a bearing [30]. The disadvantages of STFT include its small frequency resolution; however, low frequency can be hardly represented with a small window. Once one can select a particular time window, then this window is also the same for all frequency blocks. The STFT contains time information as well, but it is not as efficient as the wavelet transform. However, according to the results found in the literature, there are different signal-processing approaches applied for different techniques for damage detection, and researchers acknowledged the neceessity of a proper signal-processing algorithm for specific requirements of civil structures. In the ultrasonic technique, most of the research can be found based on time of first arrival [31,32] and the amplitude-phase method [33,34]. Some advanced works can be found based on Coda Wave Interferometry [35,36,37,38]. Although, most of them were on small-scale objects in a lab environment, or even a single signal-processing algorithm was used.
As it can be concluded from the above literature survey, the optimal sensor placement allows for maximum coverage, which can provide early crack investigation in large structures. Often, it can be seen that most of the signal-processing approaches applied for damage detection have some limitation for damage/change detection in real structures under the influence of temperature. In this paper, the authors investigated different sensor combinations located at different distances on multiple structures. The sensitivity to damage/load detection and distance of the sensors is also considered. The multiple signal-processing algorithm was considered to analyze the raw signals acquired from different structures, which resulted in a relationship between signal-processing algorithms and sensor placement to damage detection. The novelty of this paper covers the modeling of sensor pairs located at different distances and their influence on the acquired signals to detect damage in the structure, which resulted in optimal sensor placement and using an appropriate signal processing algorithm for change detection in real structures.
This paper begins by presenting a description of different structures considered in this study; then, the location, distance of the sensors, and data acquisition parameters were discussed. The applied signal-processing algorithm was presented. The results of an investigated study for all the considered structures were then presented, considering different signal-processing techniques to analyze diffuse waves and their influence to variable distance of the sensors.

2. Experimental Program

The four-point bending test on the benchmark RC structure was used in order to test the distance and sensitivity of the embedded sensors in the lab environment. It allowed assessing whether any cracking occurs with the embedded sensors, and its influence on the distance between sensors can be detected. The second structure on which the statistical SHM framework was tested is the reference structure called the BLEIB structure. The goal of the experiment was to measure the changes in concrete during static loading using different pairs of sensors located at different distances in the field conditions. The third structure was the Gliwice bridge. The main scope of this research was to investigate the influence on embedded sensors placed at different distances for one cross-section in a real structure. All the embedded ultrasonic sensors installed in these structures had perfect coupling to the concrete.

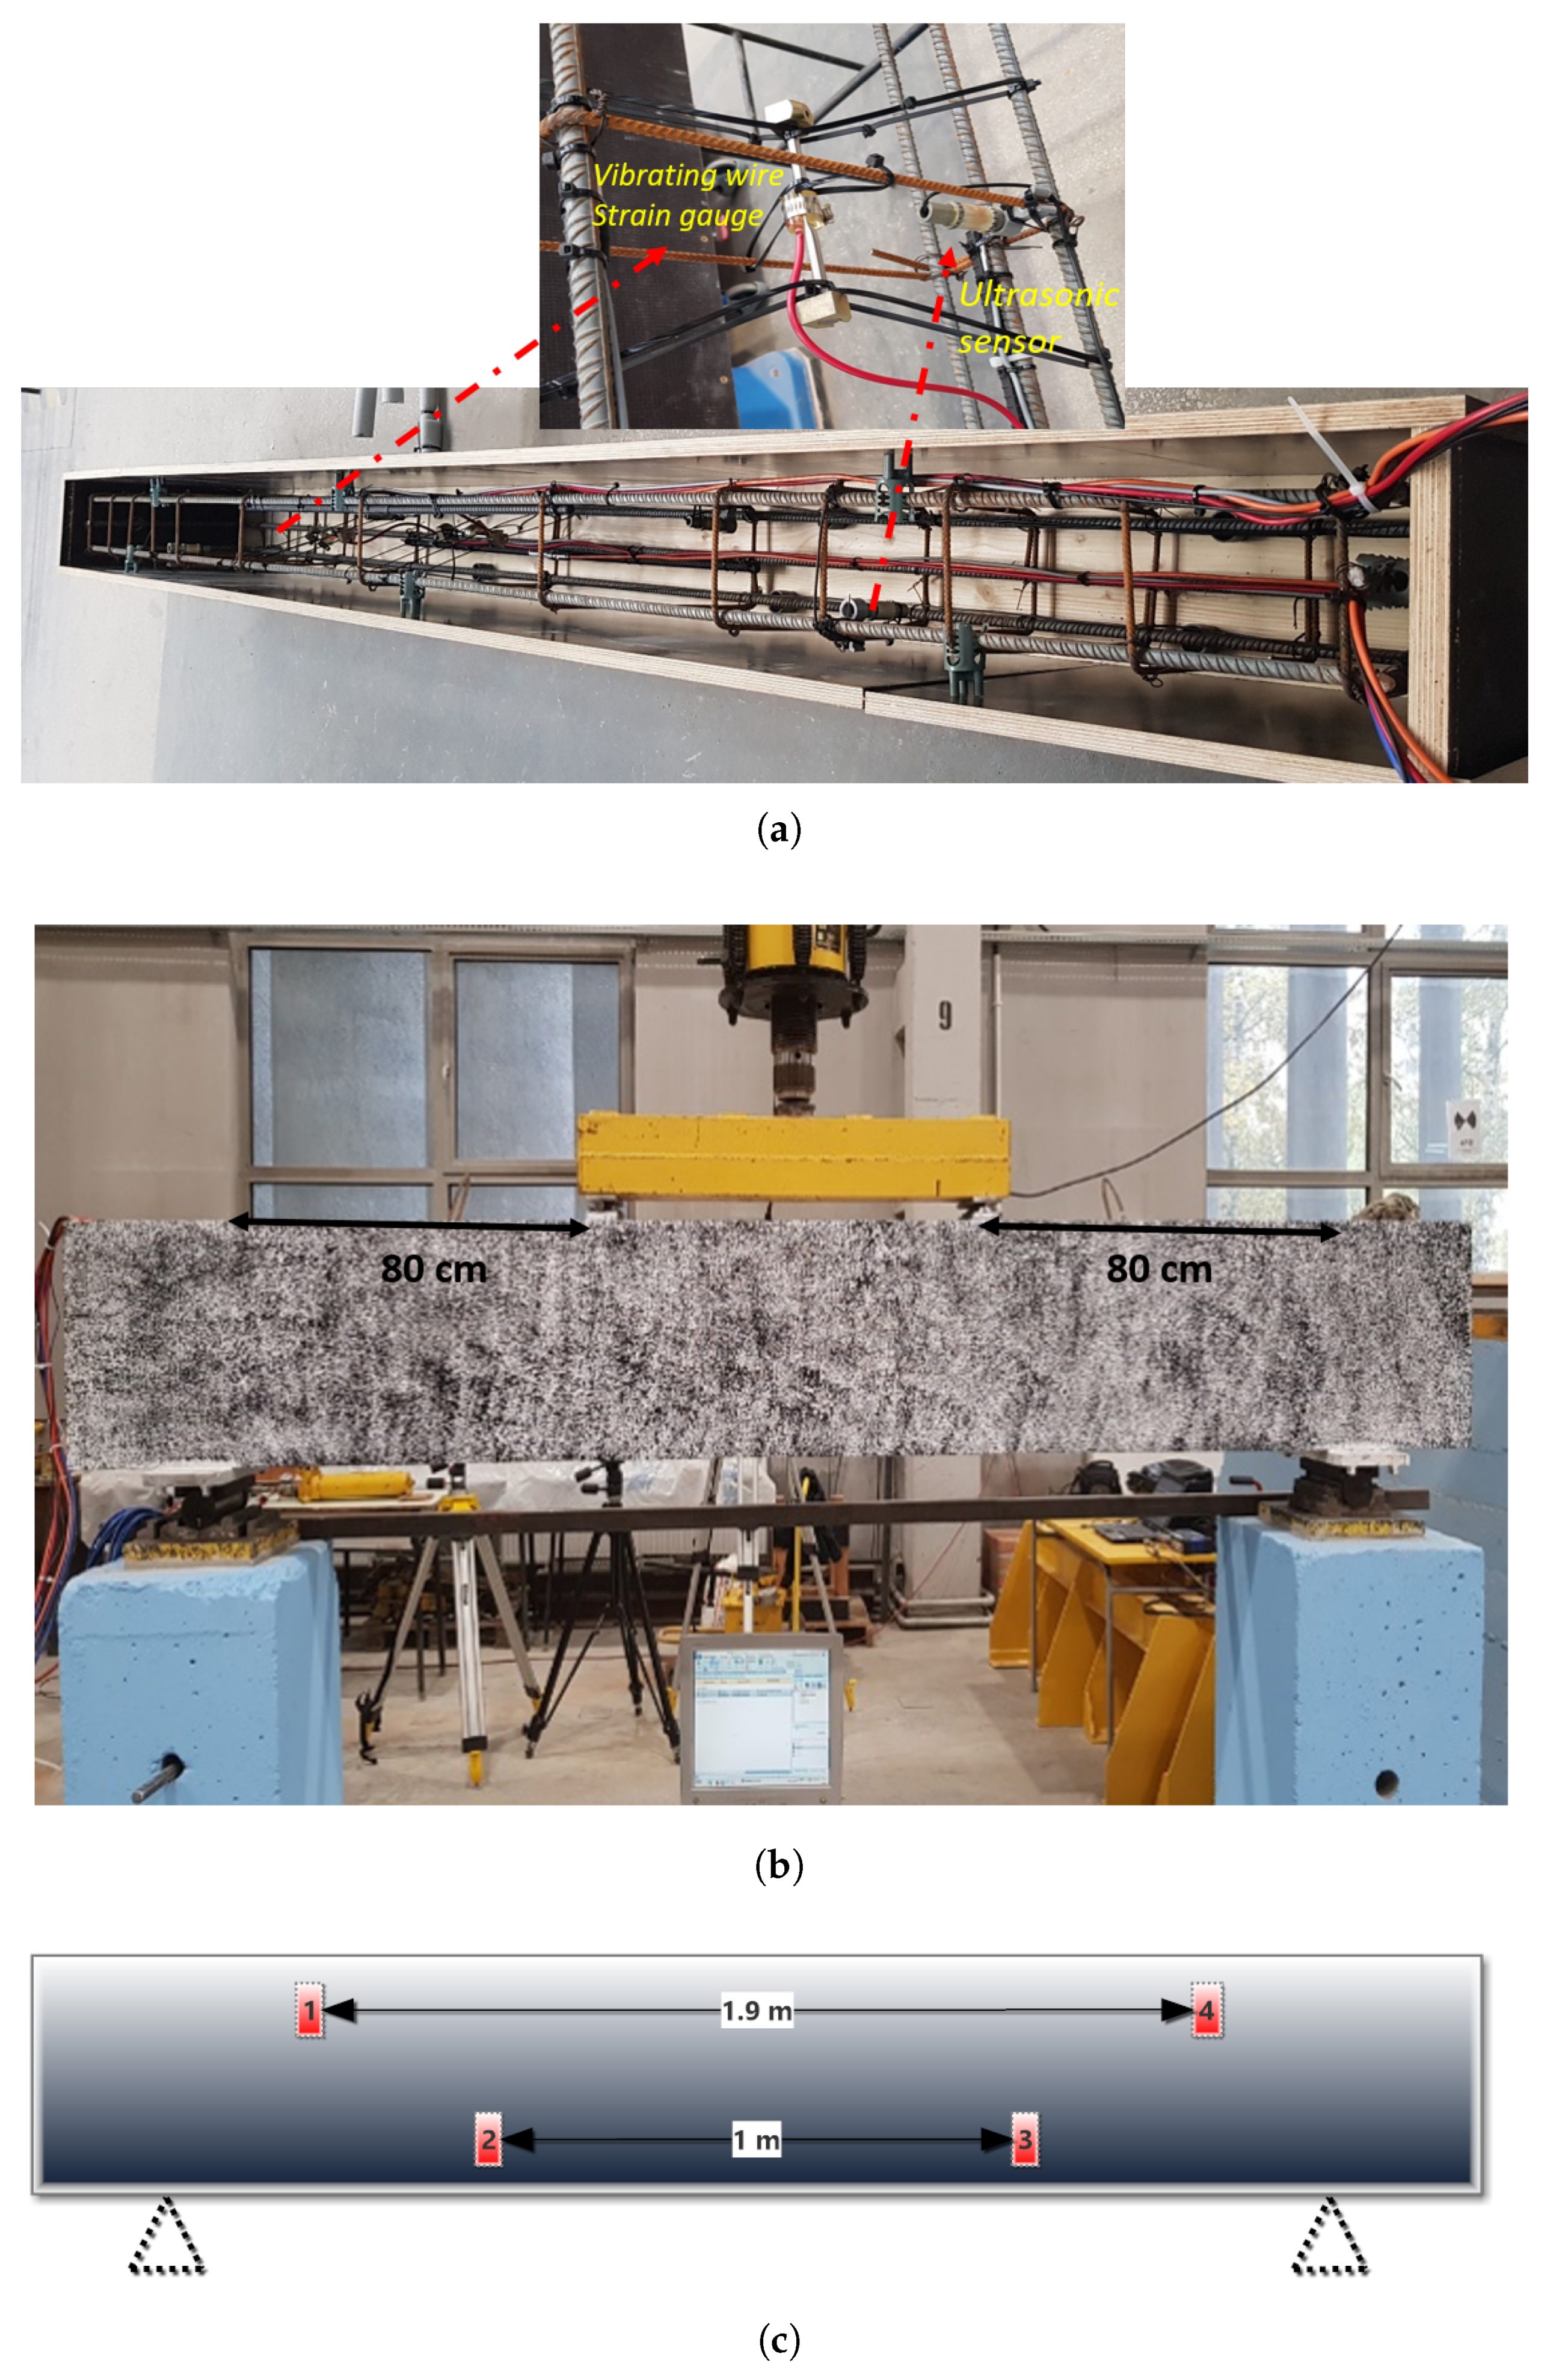
2.1. Benchmark RC Beam

The first experimental study was performed on the RC beam on which the four-point bending test was performed to detect the initiated cracks and their propagation. Figure 1b shows the beam with following dimensions: 2.9 × 0.4 × 0.2 m (length × height × width). The new ultrasonic sensors (see Figure 1a) were immersed inside the beam during casting.
The center frequency of that sensor is around 62 kHz. The exemplary signal in the time and frequency domain is shown in Figure 2.
There were four sensors placed in different locations of the beam. One can see from Figure 1c the location of these sensors and the distances between them. The maximum distance was 1.9 m, where the sensors were located in the top region of the beam; on the other hand, the lowest distance was of 1 m, which was situated on the bottom of the beam.
The new data acquisition system was designed to acquire raw ultrasonic signals (for more details, see [39]). To start this measurement, the system needed at least two sensors; e.g., sensor X transmits the excitation pulse, while sensor Y receives the diffuse wave. The acquisition software controls all the sensors, choosing the sensors as a transmitter and receiver or vice versa. The multiplexer was used to switch the combination of the sensors.

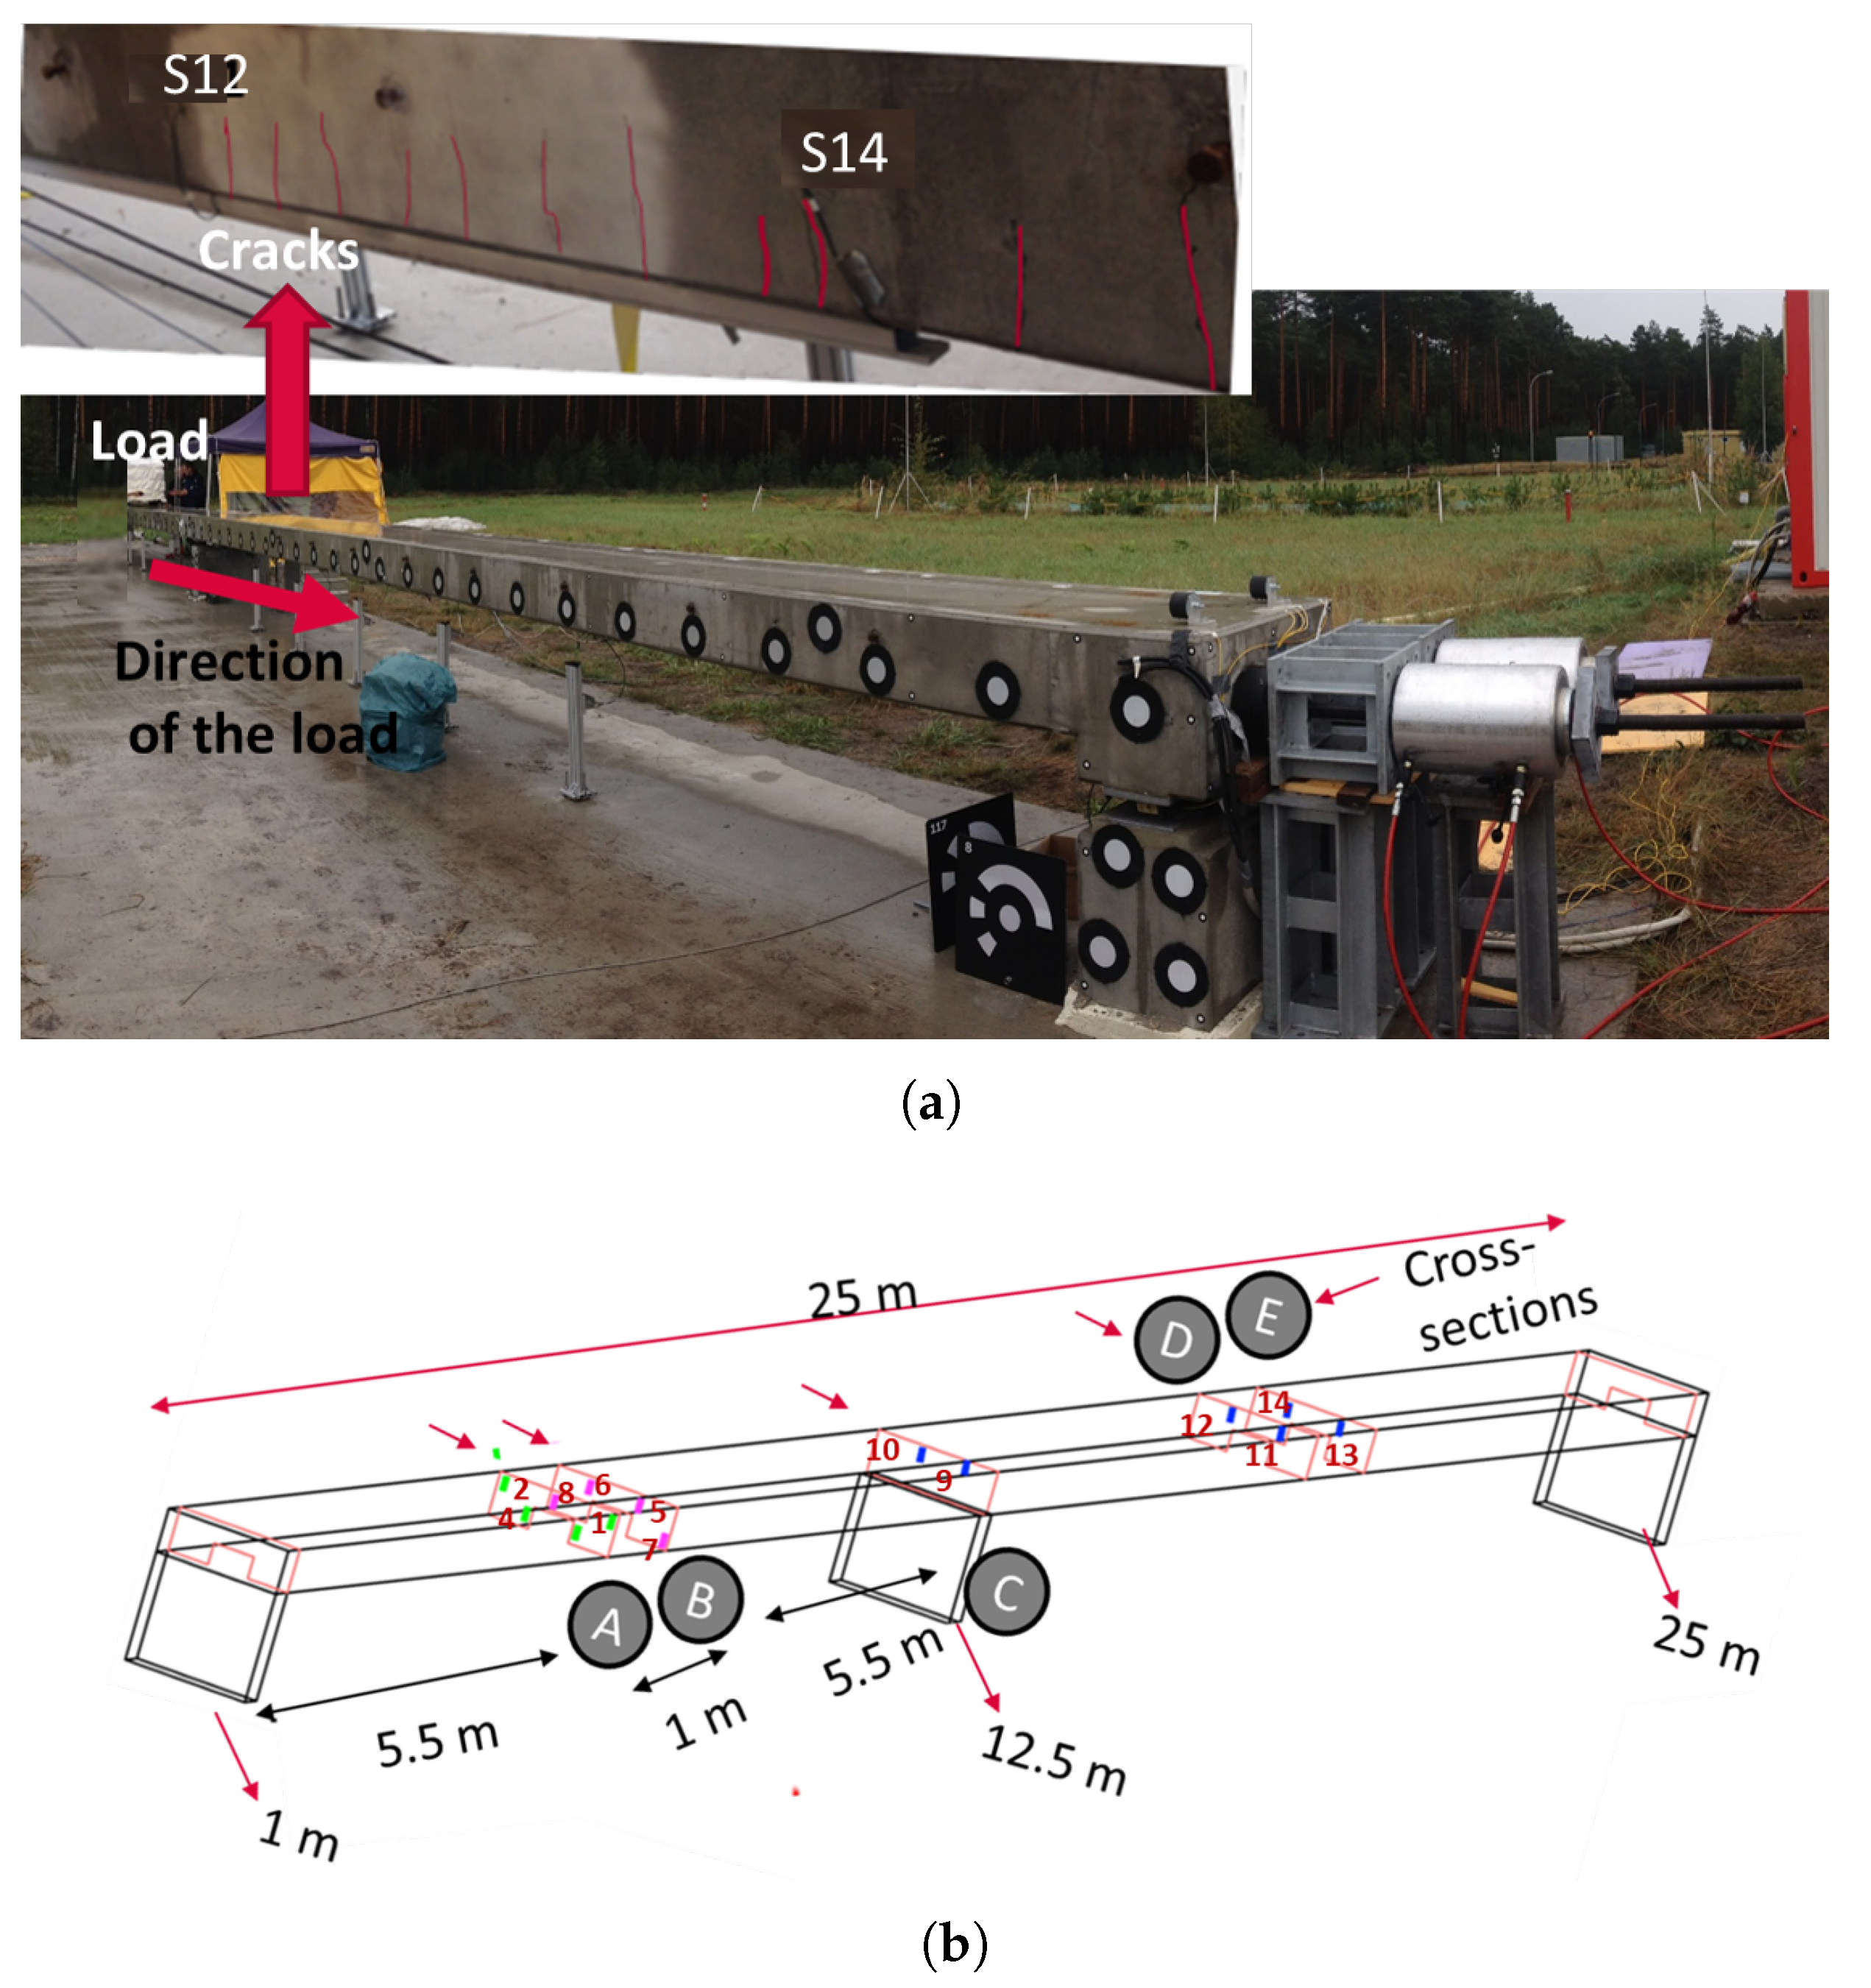
2.2. Reference Real Structure
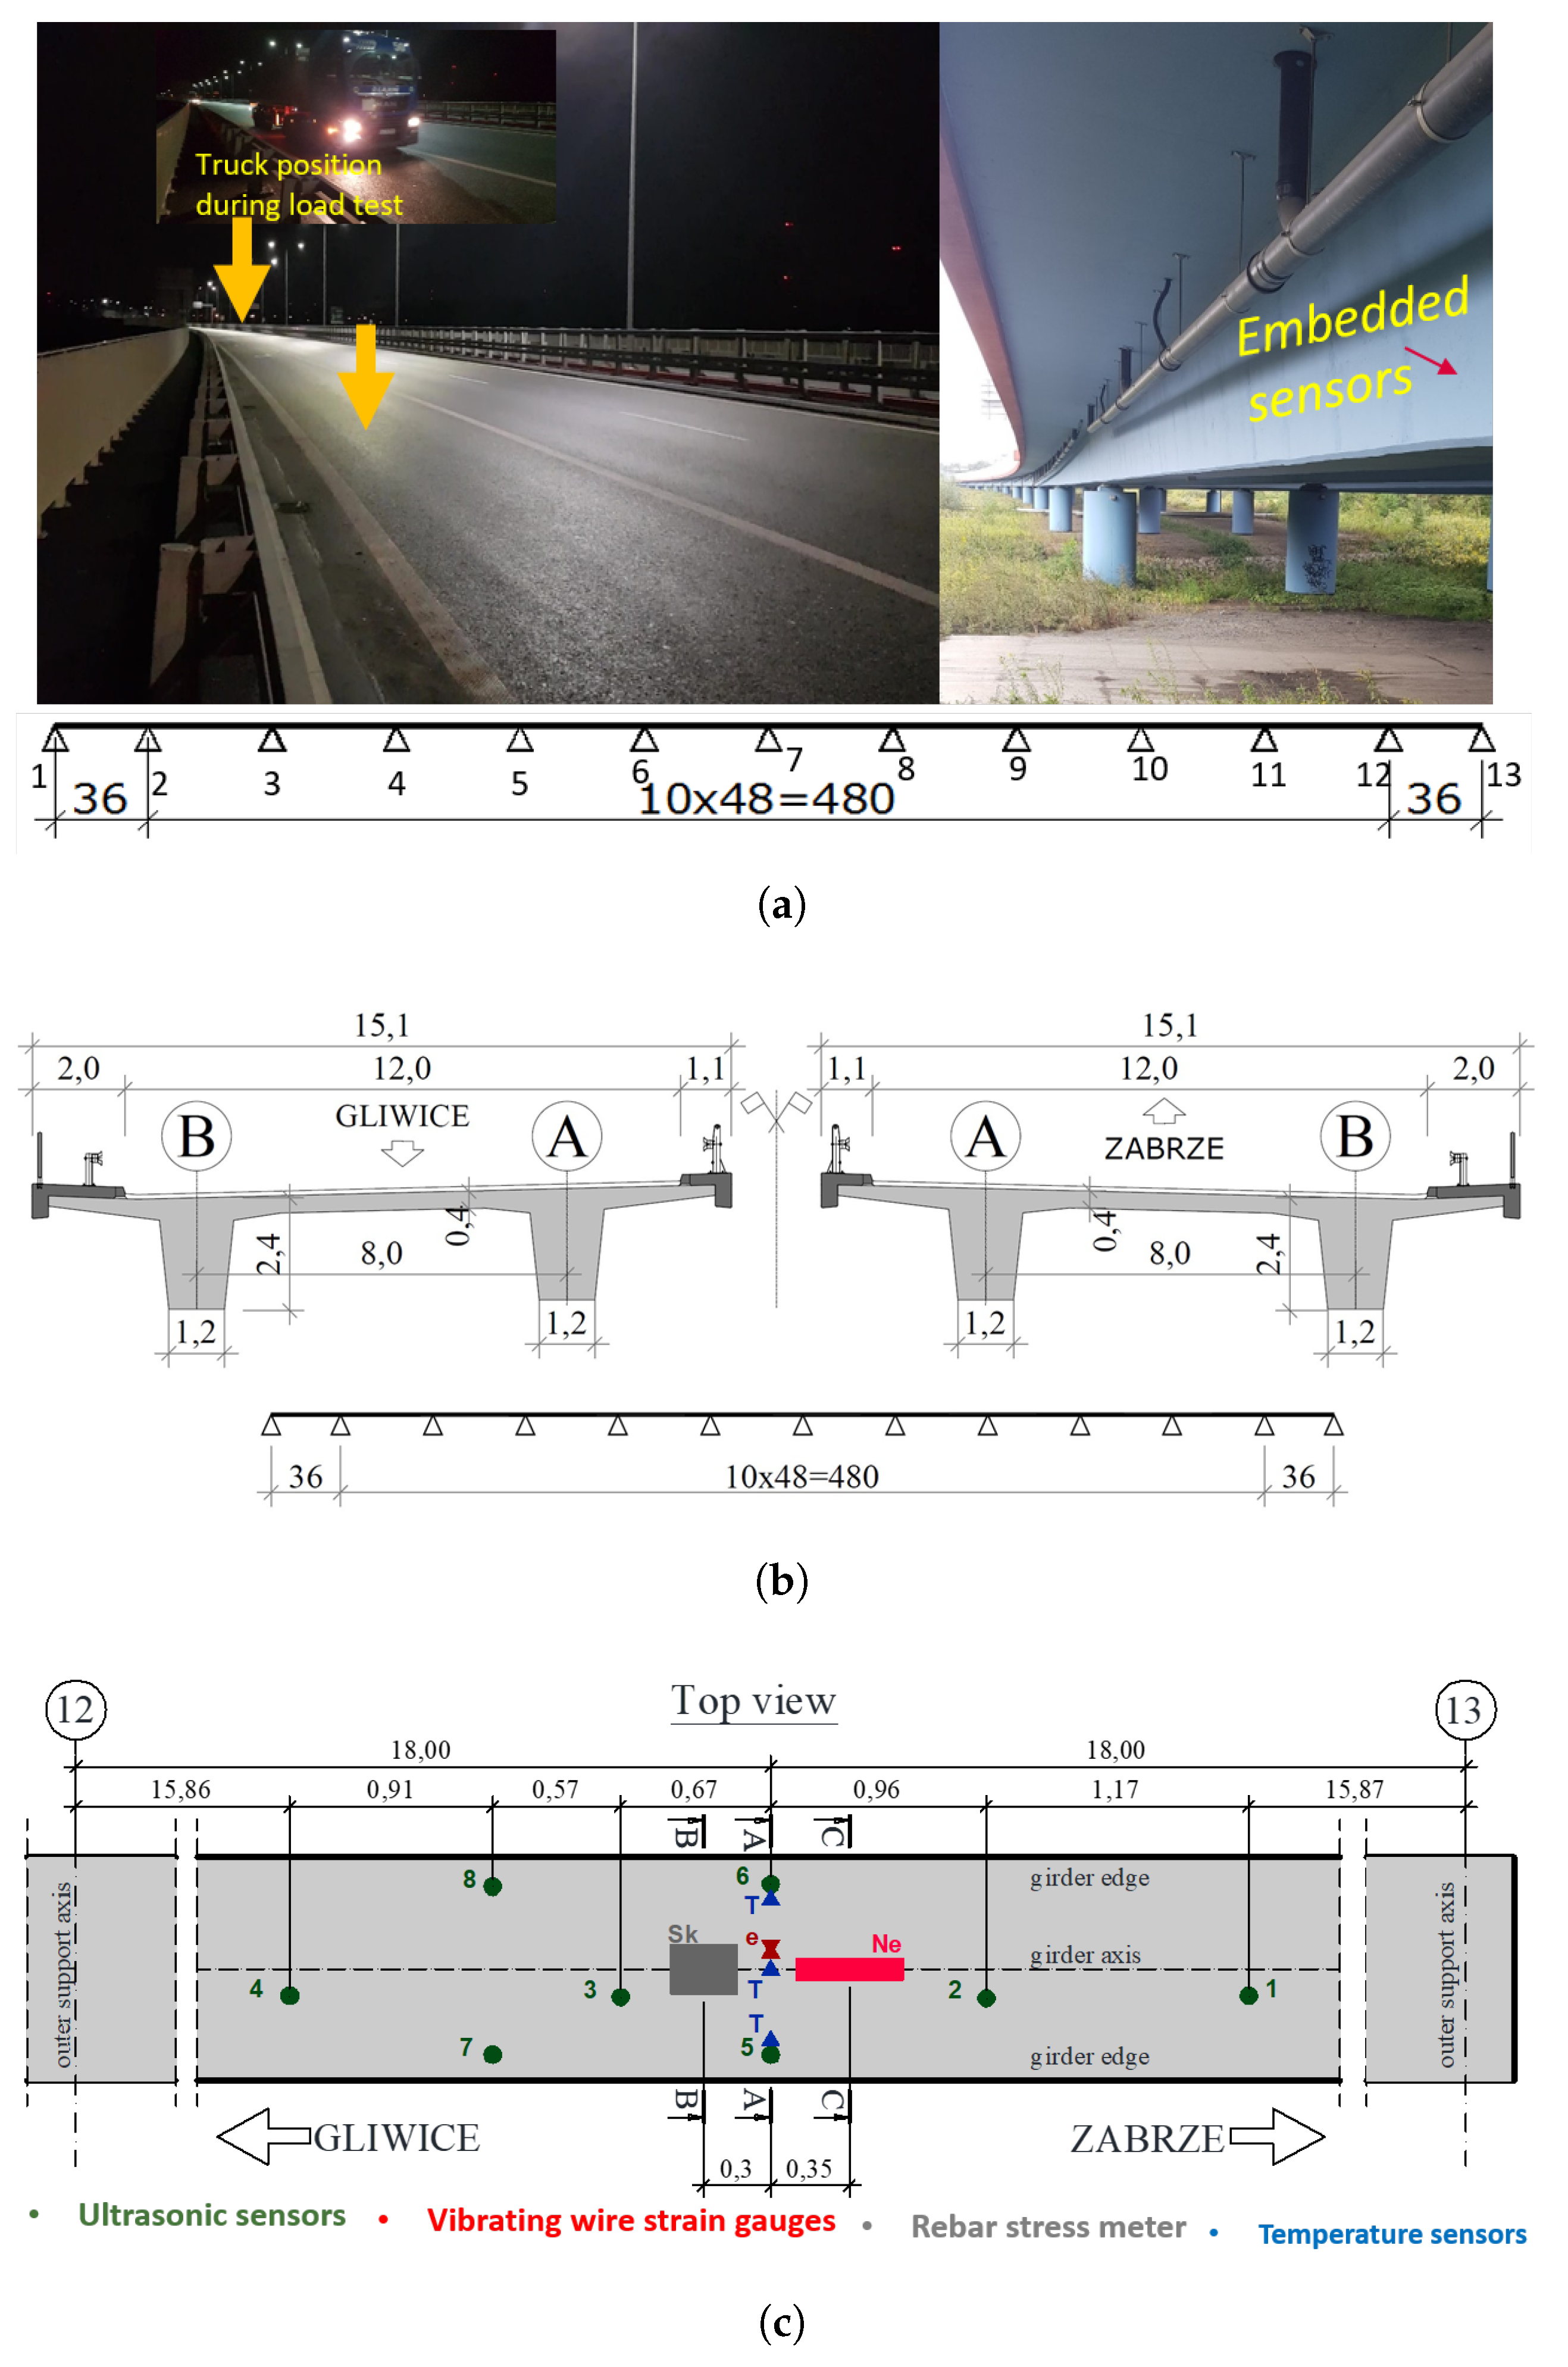
The second experiment was performed on another RC structure which was developed by BAM, as shown in Figure 3, and named the BLEIB structure (shared object for INFRASTAR project) [38,40]. This reference structure was developed at the BAM test site located at Horstwalde (Berlin, Germany) to perform experimental studies for different NDT techniques, especially embedded ultrasonic sensors. The main intention of developing this reference structure was to detect operational changes as in the real structure considering all the environmental effects. This 25 m-long reference structure consists of three supports, one in the middle and two on the edges of both sides, and it has five cross-sections (Figure 3b).
Fourteen ultrasonic sensors were installed inside the reference RC structure during casting. They were vertically mounted using a special clip on the stirrup reinforcement. The combination was controlled by the data acquisition system discussed in detail in the previous section. One can see from Figure 3b that the sensors were located in five cross-sections. The maximum distance between the sensors pair was of 5.5 m, and the minimum was 1 m.

2.3. Real Bridge

The last performed experiment was the field test that allowed demonstrating the sensitivity related to the distance between sensors in a real civil structure. The bridge in Gliwice was built in 2015 (more details about the bridge can be found in [41,42]). The bridge superstructure is divided into 12 spans: two outer spans of 36 m and 10 internal spans of 48 m. The cross-section consists of two trapezoidal beams with a constant height of 2.4 m connected by a platform plate. The superstructure was made of concrete class C35/45 with 19L15.5 post-tensioning cables (10 cables per girder). Each cable was pre-stressed with the 5.6 MN force. Span-by-span technology was used to erect the bridge with mobile scaffolding. The successive concreting of subsequent spans forced the specific arrangement and geometry of the tendons. Eight ultrasonic sensors were embedded inside the girder in the cross-section at the southeast end of the bridge during the erection period. In this set-up, the maximum distance between the combinations of embedded sensors was 2.1 m, and the minimum was 0.57 m (Figure 4). The testing procedure assumed the loading of a bridge by a moving truck. The same data acquisition system was used to extract measurement signals during the experiment.

3. Methodology

The acquired ultrasonic signals were raw signals. Therefore, it is important to use the signal processing technique to extract meaningful features/information from these raw signals. The feature extraction process involves the extraction of load/crack-sensitive information from the data collected during the data acquisition procedure to determine the presence of changes in the structure. In this study, we applied window-based cross-correlation and continuous wavelet transform (CWT) to extract information/features from raw signals.

3.1. Window-Based Cross-Correlation

The basic idea of the window-based correlation technique is to apply the local cross-correlation with many samples in the signal to solve the corresponding problem. The main benefit of the window-based cross-correlation is that it is sensitive to small changes in the amplitude of illumination in the two compared images. The one-dimensional window-based cross-correlation technique can be used in order to find specific patterns (changes in the medium) within a signal. This technique can be effective, especially when dealing with many samples in a signal. In a one-dimensional signal, window-based correlation is used by considering a small window template from a baseline signal (signal extracted during or at the initial phase of the experiment) and the measured signal, then sliding the window over the considered samples to find the similarities between them if the baseline signal window is properly matched with the measured signal window, and finally determining the cross-correlation coefficient, which reaches maximum at zero lag. The sliding mechanism can start at any sample within the signal. The general concept of the sliding mechanism is to perform cross-correlation between the baseline window template and the measured window template covering a signal. One should remember when performing the cross-correlation over the measured signal that both windows need to be of the same length. Therefore, if the windows have different lengths, then there is a good chance for window overlapping between successive windows. A strongly reverberating signal, such as a diffuse ultrasonic signal, can cover a larger area of complex structures that cannot be interpreted by guided waves (guided waves are suitable for e.g., steel rods). It is a combination of multiple paths, which includes lots of other scattered waves, and which arrive much later at the receiver. It is quite difficult to evaluate these arrivals (containing valuable information) separately. Therefore, window-based cross-correlation is the basis to identify relevance between non-scattered (not perturbed by changes in the medium) and scattered (perturbed by changes in the medium) waveform in the window. It can be performed in the time domain [43]. It is used to compute the degree of similarity of two signals in the window [44]. The comparison of two signals σ x x ( t ) and σ y y ( t ) is done by computation in the time window, and it later computes the mean of ρ x y . The feature proposed here is the correlation coefficient index, which is used to detect changes in a structure from unity, as shown in Equation (2) [45]:
ρ x y = σ x y ( t ) σ x x ( t ) σ y y ( t ) ,
D c c = 1 ρ x y .

3.2. Continuous Wavelet Transform

CWT is an effective signal processing approach that is used to detect changes/cracks in many applications due to the very high sensitivity to even tiny disturbances in a time-domain signal. The CWT algorithm is described by the following integral equation:
C W T ( a , τ ) = 1 a x ( t ) γ t τ a dt ,
where x ( t ) is the transformed signal, a is the scaling coefficient, τ is the translational value, and γ ( t ) is the mother wavelet with respect to the measured signal. The features can be extracted using the measure considered here as the maximal energy of the obtained CWT coefficient, which is related to changes/damage in the structure. The CWT coefficient is computed from Equation (4).
C W T c = j = 1 n ( C W T e , j C W T e , 1 ) 2 j = 1 n ( C W T e , 1 ) 2
where the matrix element C W T c represents the CWT-based index of changes associated with the time histories of each pair of the sensors. C W T e , 1 represents the CWT coefficient based on the initial signal, (baseline) and C W T e , j represents the CWT coefficient based on the measured signal with time histories. The bump wavelet is used as a mother wavelet in this study [46,47].

4. Experimental Setup and Results

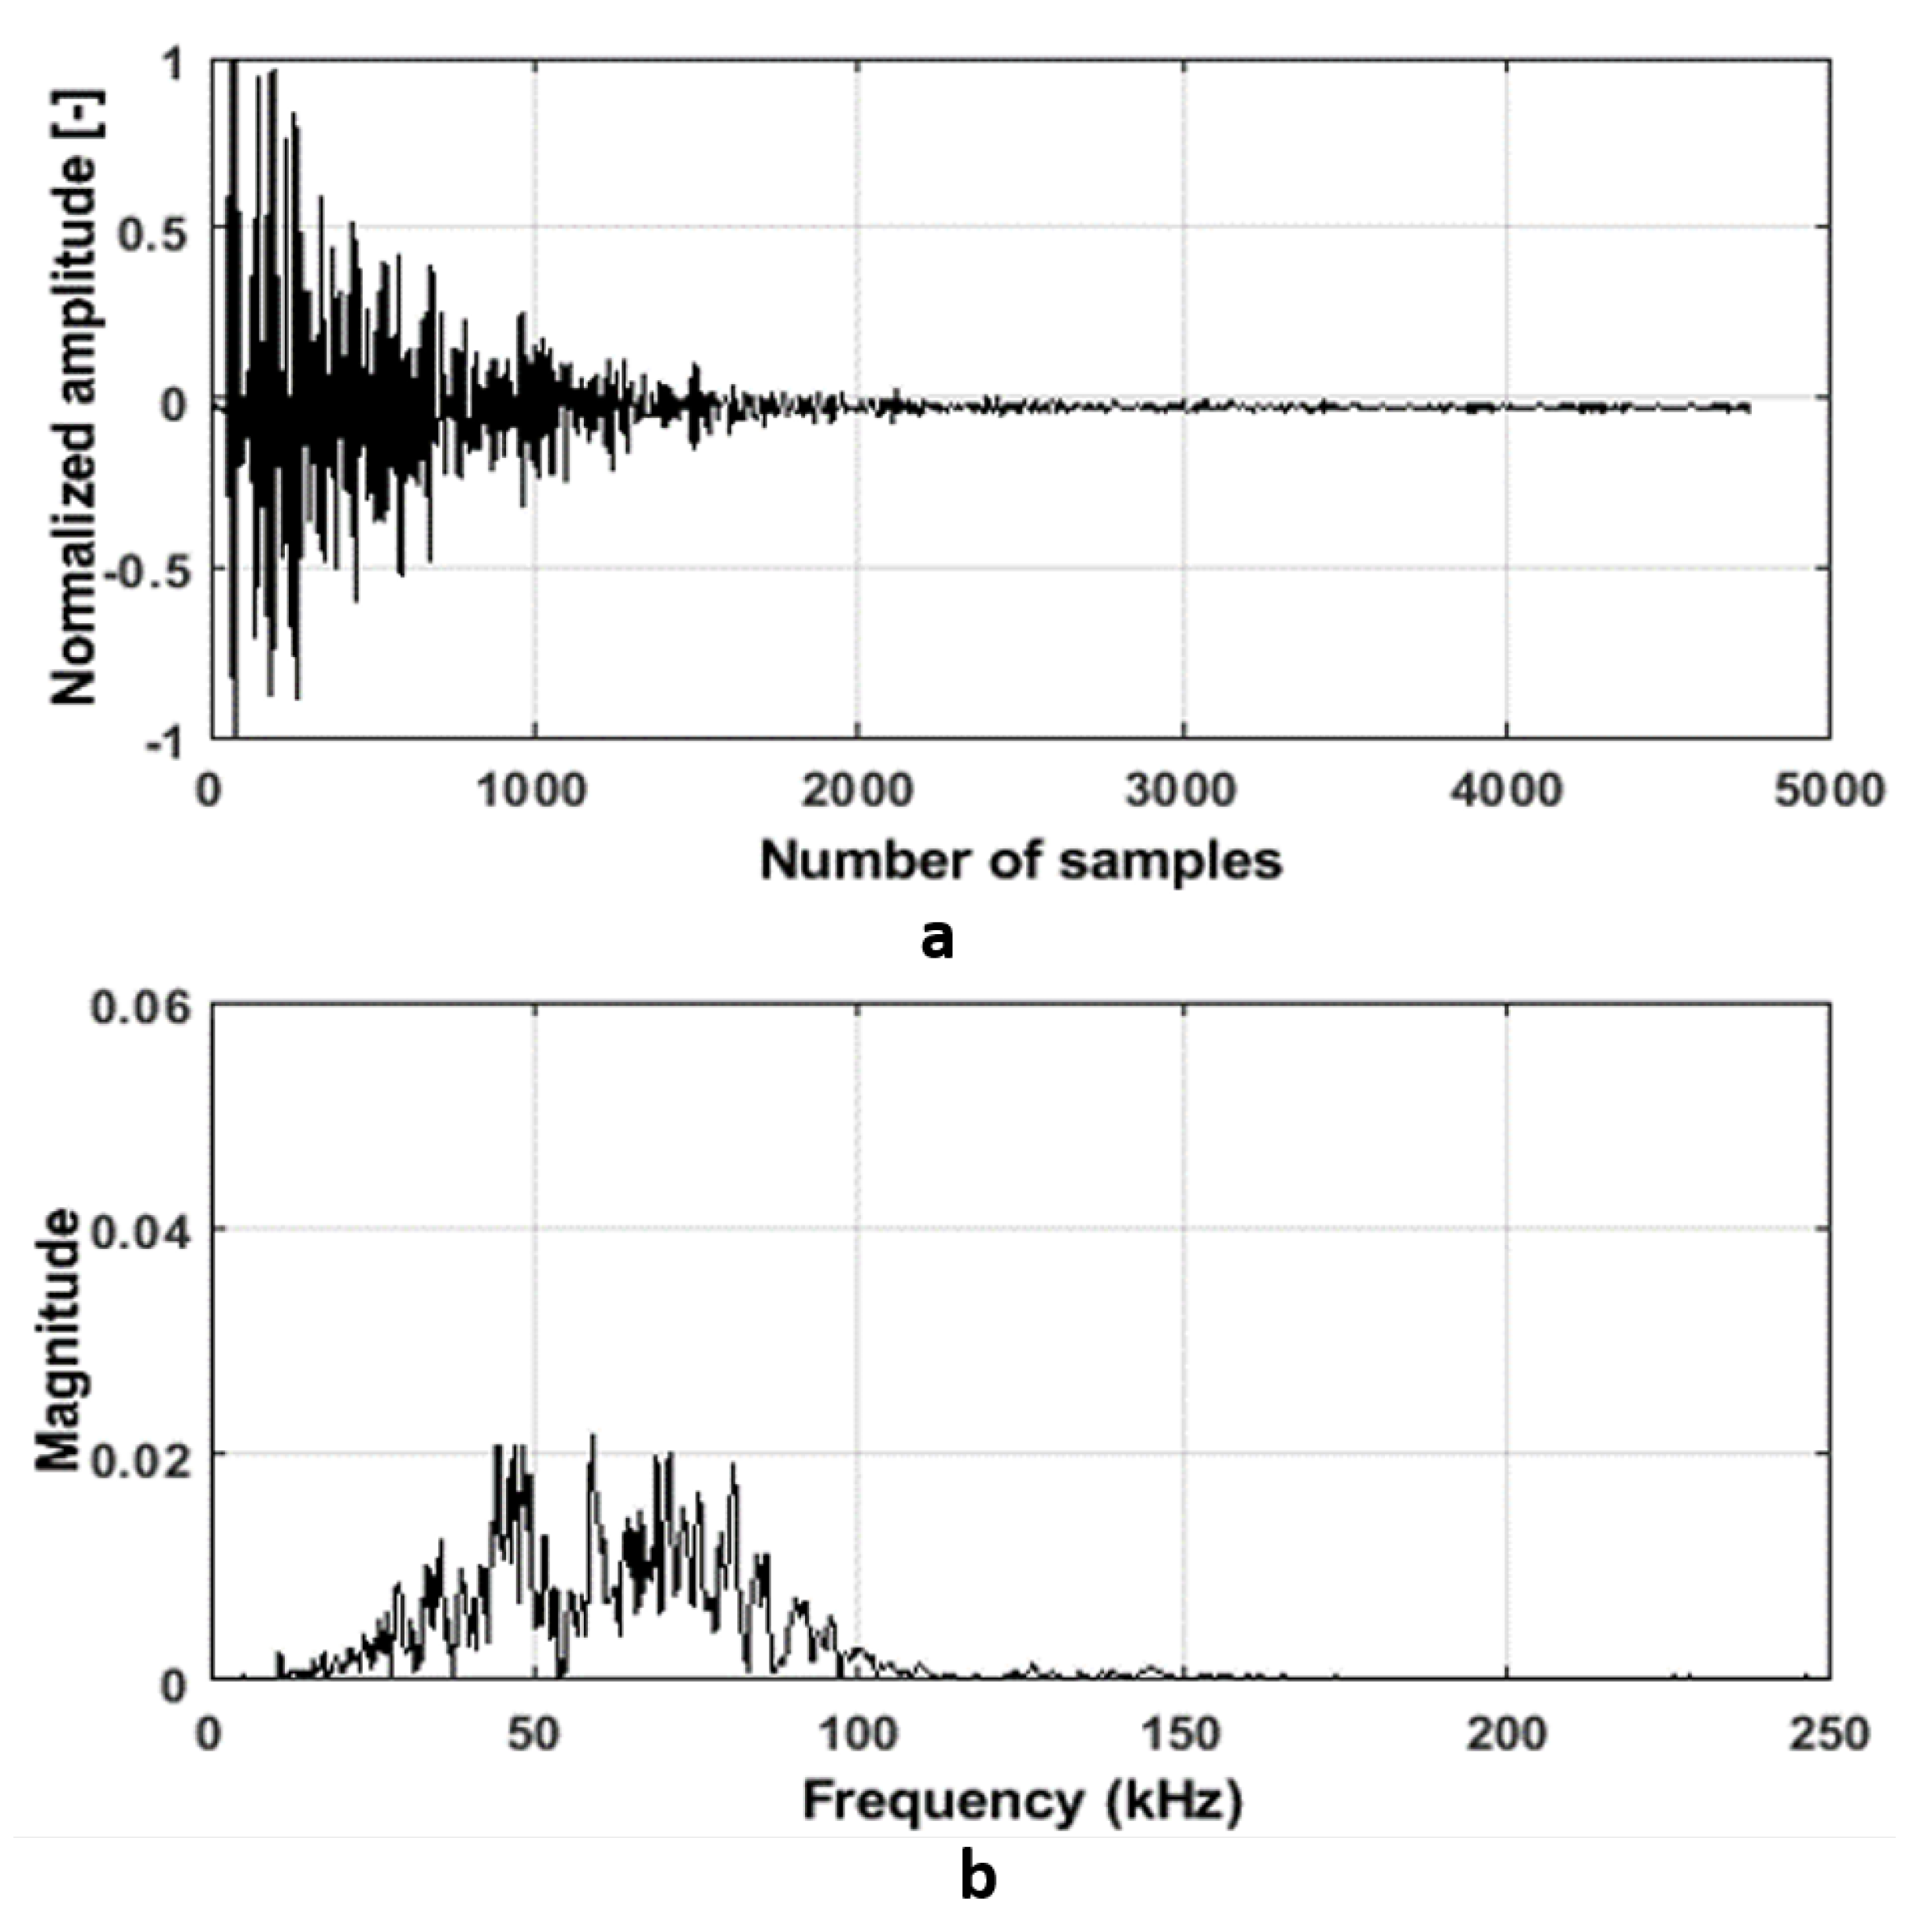
4.1. Benchmark RC Structure

The four-point bending test on the beam was performed to detect cracks using embedded ultrasonic sensors. To perform this bending test, a loading procedure was setup at the beginning on 1 kN/min until 108 kN, and then, it changed to 5 kN/min. The number of loading steps is equivalent to the number of ultrasonic measurements (see Figure 5a). One can see that the first crack was initiated at around 40 kN, which can be verified through DIC deflection measurements in the middle of the beam (see Figure 5a,b).
During the bending test, each pair of embedded sensors recorded seven signals per minute. The acquired first raw signal from the top and bottom pairs of the sensors can be seen in Figure 6. One can notice that the bottom pair of sensors recorded samples earlier than the top one (Figure 6a,b), which was expected due to the various distances between these sensor pairs.
Since acquisition of meaningful information from the raw signals is difficult in this case, the signal-processing techniques (features) described in Section 3 were applied to the raw signals. The features D c c and C W T c were computed from all the acquired signals collected during the loading procedure. Figure 7 shows that the initiating cracks were detectable using both the features and both sensors pairs. It is important to mention that the previous experimental studies showed linear phase changes under different load variations [35,36,37,40]. Therefore, the nonlinear phase (unusual behavior) can be considered as an indicator of cracks initiation.
From Figure 7a, it can be observed that cross-correlation and CWT coefficients index initially increased, which was originated by the bending of the benchmark structure under increasing load, as it affects the ultrasonic wave path. Moreover, the initial fluctuations in the index (around the 100th measurement) seen during initial phase of the loading were probably caused by the manually controlled loading procedure. The first small nonlinearity can be observed in all the coefficients indices at 35 kN for the bottom sensors pair, which indicates the initiation of the first crack. The first significant changes in the coefficient indices can be seen at 40 kN. This result can be verified from Figure 5. The changes for both coefficients ( D c c and CWT) in the bottom pairs were similar with the top pair of the sensors (S01R04). However, in this pair, first, a small nonlinearity can be seen around 36 kN, and significant changes occurred after 42 kN, which was obvious as the sensors were located in the top region of the beam. The trend of changes in the coefficients for both pairs of sensors followed simultaneously, which also confirmed their sensitivity to detecting cracks initiation, propagation, and failure phase. One should remember that the trend of changes is qualitatively a little different due to the nature of each algorithm. However, all the coefficients showed the nature of changes due to loading, initiation of cracks, and propagation of cracks. These results can be confirmed by other techniques used during this testing (as shown in Figure 5). It was interesting to note that the distance of the sensors and applied signal processing have no other influence in the detectability. This confirms that for a 2 m distance between the ultrasonic sensors, the damage detection is still possible. However, the results of this test are not biased by environmental effect. This was the reason why the further tests were performed on the reference real structure, which is the subject of the next section.

4.2. Reference Real RC Structure

The quasi-static load was applied in the BLEIB structure to detect changes/cracks in this RC structure using embedded ultrasonic sensors. A 39.85 kN load was placed on different positions of the BLEIB structure, and the time and positions were noted down in the paper during the experiment. All the steps and time intervals can be found in Figure 8. The displacement values measured by digital image correlation can be found in Figure 8b.
During this experiment, the ultrasonic measurements were done for all the combinations simultaneously. The signal from each sensors pair was acquired for each minute of measurements. As one can see from Figure 3b, the highest distance between the pair of sensors (located in different cross-sections) was 5 m, and the lowest was 1 m. Therefore, four pairs of sensors (S10R12, S09R11, S11R13, and S12R14) were chosen for this study. The reason behind choosing those pairs of sensors was the location of the cracks (see Figure 3a). The acquired signals from two pairs of sensors (S10R12 and S12R14) located in cross-sections C, D, and E are shown in Figure 9. It can be observed from Figure 9b that the amplitude of signal from the S10R12 pair was noticeably smaller with respect to other pairs. It was difficult to distinguish useful information from the signal with such a noise level that creates difficulties in the analysis part.
Figure 10 shows that both coefficients indices (features) detect loading steps from the sensor pair S12R14, where the distance between both pairs was 1 m. The CWT coefficient index (see Figure 10b) detects nonlinearity when the load started to move from the edge (25 m) of the structure, and the coefficient index suddenly drops by 70% when the load comes to the 7th step (19 m in the structure), where the cracks are located (see Figure 3a). This confirms that the CWT coefficient dropped due to the crack opening. The CWT coefficient index became low when the load moved to middle of the beam (13 m), and again, it increases a little bit when the load comes to the cross-section A, B.
However, the sensor pair located in cross-section C and D (S10R12) showed differences in both features (described in Section 3). It is difficult to find the loading steps from the correlation coefficient index feature (see Figure 11a). It was obvious, since the sensor pairs were located too far from each other. Therefore, the arrival signal becomes weaker while traveling long distances. Nevertheless, the CWT coefficient index can follow the loading steps. Figure 11b shows the value of the CWT coefficient index, where one can follow the coefficient index changes due to the load moving in different steps. In addition, when load was on the top of the cross-section D and E (19 to 17 m, respectively, in the BLEIB), where the cracks were located, the coefficient index droped 35% due to crack openings in the structure. The coefficient index was higher when the load moved toward the sensor number 10 (S10 was the transmitter in that pair). The CWT coefficient index started to decrease when the load moved to the middle of the beam and forwarding toward cross-section A, B. Therefore, it is important to mention that CWT was successful in extracting meaningful features in that case (when the sensors in the sensor pair are too far from each other and there is a low signal amplitude) due to the time-frequency analysis of the signal, and the CWT also suppresses noises from the signal (as wavelet transform was performed as a filter also).

4.3. Results from Real Bridge

During the load test on the Gliwice bridge, one 382.66 kN truck was used as a load during the field test. The 5-axial truck was used to pass the bridge slowly (10 km/h) and wait three times at the southeast end of the bridge near the zone of placement of the ultrasonic sensors (see Figure 4). During the load test in the Gliwice bridge, the traffic was opened, which can verify the sensitivity of the embedded ultrasonic sensors. The main aim was to detect the main truck load without stopping the other traffic. However, the load test was chosen during the night to reduce the influence of the daily traffic. This truck (used as a load) waited for 8 min in the first round and 15 min in the second round near the ultrasonic sensors number 02, 01. During the examination, the position of the truck was marked according to the zone with ultrasonic sensors. The ultrasonic measurement instruments were placed, and ultrasonic signals were acquired. The raw signals from sensor pairs S01R02 and S02R08 are presented in Figure 12. The reason behind choosing both pairs of sensors was their location in the structure. The distances between sensor pairs S01R02 and S02R08 were 1.17 m, and 2.2 m, respectively. The amplitude of the signal (see Figure 12b) acquired from the sensor pair S02R08 was very low due to the distance between the sensors within this pair (2.2 m).
The signal-processing method described in the previous section was applied to the raw signals. As the ultrasonic signals were acquired from the real bridge, the traffic and environmental effect were present in the signal. It is important to mention again that the sensors were embedded inside the structure, so the effect of temperature is less observable compared to the surface placement of the sensors. To remove the small period of temperature or the traffic-induced distortions during our experiment, each mean is calculated over a sliding window over the features. It was possible due to the fact that the effects of traffic occur at frequencies much higher than temperature variations. Figure 13 shows the value for both coefficient indices extracted from acquired signals (sensors pair S01R02). It can be observed that the coefficient value was small and stable during when the truck waited at the location of sensors number 01, 02 (for both rounds at 01:07 to 01:16 and 01:28 to 01:46). This result can be verified from other measurements used during this test (which can be found in [36]). The obtained results indicated that the CWT coefficient is more sensitive to detect the load.
However, the coefficients extracted from the sensors pair S02R08 are different, which is similar to the previous result shown in Section 4.2. It is difficult to detect load from the correlation coefficient index (see Figure 14a); also, the value is too high, and it means that the extracted feature comes mainly from noise (too much phase and amplitude changes from baseline to measured signals). On the other hand, the CWT coefficient index (Figure 14b) detected the truck load when it waited for 8 min (first round). During the second round, the CWT coefficient change was small due to the truck position on the bridge (waited at the top of the sensor number 01).
Both coefficients are negligible, which indicates the good condition of the bridge.

5. Conclusions

The primary attention of this paper was paid to using embedded ultrasonic sensors in different structures. The study shows that the extracted features obtained using signal-processing algorithms allowed detecting the changes/cracks/damage in RC structures with similar effectiveness as some other NDT methods used in this study. The proposed signal processing was applied to the raw signals acquired from different structures considered in this study. The cracks and changes in the structures were successfully detected for all the structures. The evaluation of sensitivity of embedded ultrasonic sensors in RC structures, which was the main goal of this study, was successfully performed and verified in various conditions on three RC structures of various scales. If the sensors were placed in the range of 1.5 m, then the standard signal processing algorithm can be applied to extract features from raw signals. When the sensors within the sensor pair are located far from each other, then applied advanced signal processing is suitable to extract features from raw signals, which also indicated considering advanced filtering to pre-process the signal. Finally, this study concluded with the findings listed below:
  • The applied signal processing to extract features was verified from three different structures.
  • The proposed signal processing techniques with embedded ultrasonic sensors methodology is suitable for the structural health monitoring of real civil objects.
  • The optimal placement of sensors in a real structure is around 1.5 m, which will ensure the reliability of the results.

Author Contributions

All the authors conceived and designed the experiments; J.C. performed NDT experiments, performing the ultrasonic measurements, signal analysis, algorithms, and correlation studies, and prepared the full version of the manuscript; X.W. participated in the preparation of test specimens, performing the ultrasonic measurement; M.S. also participated in the preparation of test specimens, suggested the composition of this paper, and supervised the overall process. All authors have read and agreed to the published version of the manuscript.

Funding

Open Access funding is enabled by special voucher of MDPI (Paper Invitation). The project INFRASTAR (http://infrastar.eu/) has received funding from the European Union Horizon 2020 research and Innovation Program under the Marie Curie–Skłodowska grant agreement number 676139. The grant is gratefully acknowledged.

Institutional Review Board Statement

Not applicable for studies not involving humans or animals.

Informed Consent Statement

Not applicable.

Data Availability Statement

Not applicable.

Acknowledgments

The authors wish to acknowledge the help of Ernst Niederleithinger, BAM, for the sensors, data acquisition setup, and Tomasz Hahn from the Silesian University of Technology and Piotr Klikowicz from the NeoStrain Sp. z o.o., respectively, for helping with the data acquisition setup and experiment in the lab. We thank Andrzej Katunin for his technical suggestions and correction.

Conflicts of Interest

The authors declare no conflict of interest.

References

  1. Abraham, O.; Niederleithinger, E.; Chapeleau, X.; Klikowicz, P.; Brühwiler, E.; Bassil, A.; Wang, X.; Chakraborty, J.; Bayane, I.; Leduc, D.; et al. Addressing the Need to Monitor Concrete Fatigue with Nondestructive Testing: Preliminary Results of Infrastar European Project. In Proceedings of the NDE/NDT Structural Materials Technology for Highways and Bridges (SMT) and the International Symposium on Non-Destructive Testing in Civil Engineering, Columbus, OH, USA, 27 August 2018; p. 12. [Google Scholar]
  2. Ko, J.M.; Ni, Y.Q. Technology developments in structural health monitoring of large-scale bridges. Eng. Struct. 2005, 27, 1715–1725. [Google Scholar] [CrossRef]
  3. Wu, J.; Yan, Q.; Wu, X. System Identification of One Historical Bridge Using Dynamic Test Data. Arabian J. Sci. Eng. 2017, 42, 4145–4155. [Google Scholar] [CrossRef]
  4. Cantero, D.; González, A. Bridge Damage Detection Using Weigh-in-Motion Technology. J. Bridge Eng. 2015, 20, 04014078. [Google Scholar] [CrossRef] [Green Version]
  5. Zheng, Y.; Xia, L. Investigation of the Ultimate Capacity of NSM FRP-Strengthened Concrete Bridge Deck Slabs. Arab. J. Sci. Eng. 2017, 43, 1597–1615. [Google Scholar] [CrossRef]
  6. Scott, M.; Rezaizadeh, A.; Delahaza, A.; Santos, C.G.; Moore, M.; Graybeal, B.; Washer, G. A comparison of nondestructive evaluation methods for bridge deck assessment. NDT E Int. 2003, 36, 245–255. [Google Scholar] [CrossRef]
  7. Hussain, A.; Akhtar, S. Review of Non-Destructive Tests for Evaluation of Historic Masonry and Concrete Structures. Arab. J. Sci. Eng. 2017, 42, 925–940. [Google Scholar] [CrossRef]
  8. Hellier, C. Handbook of Nondestructive Evaluation, 2nd ed.; McGraw-Hill Education, Europe: Blue Ridge Summit, PA, USA, 2012. [Google Scholar]
  9. Sikorski, W. Acoustic Emission—Research and Applications; InTech: Vienna, Austria, 2013. [Google Scholar]
  10. Nirbhay, M.; Dixit, A.; Misra, R.K. Finite Element Modelling of Lamb Waves Propagation in 3D Plates and Brass Tubes for Damage Detection. Russ. J. Nondestruct. Test. 2017, 53, 308–329. [Google Scholar] [CrossRef]
  11. Aggelis, D.G.; Shiotani, T.; Momoki, S.; Hirama, A. Acoustic Emission and Ultrasound for Damage Characterization of Concrete Elements. ACI Mater. J. 2009, 106, 509–514. [Google Scholar]
  12. Wang, C.; Yang, S.; Li, X.; Jiang, C.; Li, M. Study on the Failure Characteristics of Concrete Specimen Under Confining Pressure. Arab. J. Sci. Eng. 2018, 44, 4119–4129. [Google Scholar] [CrossRef]
  13. Mutlib, N.K.; Baharom, S.; Nuawi, M.Z.; El-Shafie, A. Ultrasonic Surface Wave Monitoring for Steel Fibre-Reinforced Concrete Using Gel-Coupled Piezoceramic Sensors: A Case Study. Arab. J. Sci. Eng. 2015, 41, 1273–1281. [Google Scholar] [CrossRef]
  14. Rose, J.L.; Nagy, P. Ultrasonic Waves in Solid Media. J. Acoust. Soc. Am. 2000, 107, 1807–1808. [Google Scholar] [CrossRef]
  15. Budenkov, G.A.; Nedzvetskaya, O.V.; Shishkina, S.I.; Polyankin, G.A. Stabilization of Acoustic Coupling for Ultrasonic Testing. Russ. J. Nondestruct. Test. 2000, 36, 910–915. [Google Scholar] [CrossRef]
  16. Niederleithinger, E.; Wolf, J.; Mielentz, F.; Wiggenhauser, H.; Pirskawetz, S. Embedded Ultrasonic Transducers for Active and Passive Concrete Monitoring. Sensors 2015, 15, 9756–9772. [Google Scholar] [CrossRef] [PubMed] [Green Version]
  17. Karaiskos, G.; Deraemaeker, A.; Aggelis, D.G.; Hemelrijck, D.V. Monitoring of concrete structures using the ultrasonic pulse velocity method. Smart Mater. Struct. 2015, 24, 113001. [Google Scholar] [CrossRef] [Green Version]
  18. Lu, Y.; Michaels, J.E. A methodology for structural health monitoring with diffuse ultrasonic waves in the presence of temperature variations. Ultrasonics 2005, 43, 717–731. [Google Scholar] [CrossRef] [PubMed]
  19. Cruz, A.; Vélez, W.; Thomson, P. Optimal sensor placement for modal identification of structures using genetic algorithms—A case study: The olympic stadium in Cali, Colombia. Ann. Oper. Res. 2009, 181, 769–781. [Google Scholar] [CrossRef]
  20. Chen, B.; Huang, Z.; Zheng, D.; Zhong, L. A hybrid method of optimal sensor placement for dynamic response monitoring of hydro-structures. Int. J. Distrib. Sens. Netw. 2017, 13. [Google Scholar] [CrossRef]
  21. Sun, H.; Büyüköztürk, O. Optimal sensor placement in structural health monitoring using discrete optimization. Smart Mater. Struct. 2015, 24, 125034. [Google Scholar] [CrossRef]
  22. Guo, H.Y.; Zhang, L.; Zhang, L.L.; Zhou, J.X. Optimal placement of sensors for structural health monitoring using improved genetic algorithms. Smart Mater. Struct. 2004, 13, 528–534. [Google Scholar] [CrossRef] [Green Version]
  23. Rao, A.R.M.; Lakshmi, K.; Krishnakumar, S. A Generalized Optimal Sensor Placement Technique for Structural Health Monitoring and System Identification. Procedia Eng. 2014, 86, 529–538. [Google Scholar]
  24. Soman, R.; Kudela, P.; Balasubramaniam, K.; Singh, S.K.; Malinowski, P. A Study of Sensor Placement Optimization Problem for Guided Wave-Based Damage Detection. Sensors 2019, 19, 1856. [Google Scholar] [CrossRef] [PubMed] [Green Version]
  25. Marks, R.; Clarke, A.; Featherston, C.A.; Pullin, R. Optimization of acousto-ultrasonic sensor networks using genetic algorithms based on experimental and numerical data sets. Int. J. Distrib. Sens. Netw. 2017, 13, 155014771774370. [Google Scholar] [CrossRef]
  26. Chakraborty, J.; Katunin, A.; Klikowicz, P.; Salamak, M. Early Crack Detection of Reinforced Concrete Structure Using Embedded Sensors. Sensors 2019, 19, 3879. [Google Scholar] [CrossRef] [PubMed] [Green Version]
  27. Liu, A.; Wang, L.; Bornn, L.; Farrar, C. Robust structural health monitoring under environmental and operational uncertainty with switching state-space autoregressive models. Struct. Health Monitor. 2018, 18, 435–453. [Google Scholar] [CrossRef]
  28. Li, M.; Ren, W.X.; Huang, T.L.; Wang, N.B. Experimental investigations on the cross-correlation function amplitude vector of the dynamic strain under varying environmental temperature for structural damage detection. J. Low Freq. Noise Vib. Active Control 2018, 39, 631–649. [Google Scholar] [CrossRef]
  29. Chakraborty, J.; Wang, X.; Stolinski, M. Damage Detection in Multiple RC Structures Based on Embedded Ultrasonic Sensors and Wavelet Transform. Buildings 2021, 11, 56. [Google Scholar] [CrossRef]
  30. Żak, G.; Wyłomańska, A.; Zimroz, R. Local damage detection method based on distribution distances applied to time-frequency map of vibration signal. In Proceedings of the 2017 IEEE 11th International Symposium on Diagnostics for Electrical Machines, Power Electronics and Drives (SDEMPED), Tinos, Greece, 29 August–1 September 2017; pp. 134–140. [Google Scholar]
  31. Willatzen, M.; Søndergaard, P.; Latino, C.; Voss, F.; Andersen, N.L.; Brokate, M.; Bounaim, A. Arrival-Time Detection and Ultrasonic Flow-Meter Applications. J. Phys. Conf. Ser. 2006, 52, 58–72. [Google Scholar] [CrossRef]
  32. Rojas, E.; Baltazar, A.; Loh, K.J. Damage detection using the signal entropy of an ultrasonic sensor network. Smart Mater. Struct. 2015, 24, 075008. [Google Scholar] [CrossRef]
  33. Kazakov, V.V. An Amplitude-Phase Method for Testing Acoustic Contact of Ultrasonic Transducer. Russ. J. Nondestruct. Test. 2019, 55, 169–172. [Google Scholar] [CrossRef]
  34. Bai, L.; Velichko, A.; Drinkwater, B.W. Ultrasonic defect characterisation—Use of amplitude, phase, and frequency information. J. Acoust. Soc. Am. 2018, 143, 349–360. [Google Scholar] [CrossRef] [Green Version]
  35. Stähler, S.C.; Sens-Schönfelder, C.; Niederleithinger, E. Monitoring stress changes in a concrete bridge with coda wave interferometry. J. Acoust. Soc. Am. 2011, 129, 1945–1952. [Google Scholar] [CrossRef] [Green Version]
  36. Fröjd, P.; Ulriksen, P. Frequency selection for coda wave interferometry in concrete structures. Ultrasonics 2017, 80, 1–8. [Google Scholar] [CrossRef] [PubMed]
  37. Zhang, Y.; Abraham, O.; Larose, E.; Planes, T.; Duff, A.L.; Lascoup, B.; Tournat, V.; Guerjouma, R.E.; Cottineau, L.M.; Durand, O.; et al. Following stress level modification of real size concrete structures with coda wave interferometry (CWI). AIP Conf. Proc. 2011, 1335, 1291–1298. [Google Scholar]
  38. Wang, X.; Niederleithinger, E. Coda Wave Interferometry used to detect loads and cracks in a concrete structure under field conditions. In Proceedings of the 9th European Workshop on Structural Health Monitoring Series, Manchester, UK, 10–13 July 2018; pp. 10–13. [Google Scholar]
  39. Chakraborty, J.; Stoliński, M.; Katunin, A. Addressing the detection capability for scalable energy consumption using primary data acquisition system of embedded ultrasonic sensors in SHM. In Proceedings of the 5th International Conference on Advances in Electrical Engineering (ICAEE), Dhaka, Bangladesh, 26–28 September 2019. [Google Scholar]
  40. Chakraborty, J.; Katunin, A. Detection of structural changes in concrete using embedded ultrasonic sensors based on autoregressive model. Diagnostyka 2019, 20, 103–110. [Google Scholar] [CrossRef]
  41. Klikowicz, P.; Salamak, M.; Poprawa, G. Structural Health Monitoring of Urban Structures. Procedia Eng. 2016, 161, 958–962. [Google Scholar] [CrossRef] [Green Version]
  42. Chakraborty, J.; Katunin, A.; Klikowicz, P.; Salamak, M. Embedded ultrasonic transmission sensors and signal processing techniques for structural change detection in the Gliwice bridge. Procedia Struct. Integr. 2019, 17, 387–394. [Google Scholar] [CrossRef]
  43. Yang, Z.; Mueller, R. Spatial-spectral cross-correlation for change detection: A case study for citrus coverage change detection. In Proceedings of the ASPRS 2007 Annual Conference, Tampa, FL, USA, 7–11 May 2007; pp. 767–777. [Google Scholar]
  44. Chakraborty, J.; Ottoy, G.; Goemaere, J.P.; Strycker, L.D. Modeling acoustic localization accuracy for scalable energy consumption in wireless sensor swarms. In Proceedings of the 2014 Ubiquitous Positioning Indoor Navigation and Location Based Service (UPINLBS), Corpus Christ, TX, USA, 20–21 November 2014. [Google Scholar]
  45. Tsai, D.M.; Lin, C.T. Fast normalized cross correlation for defect detection. Pattern Recognit. Lett. 2003, 24, 2625–2631. [Google Scholar] [CrossRef]
  46. Melhem, H.; Kim, H. Damage Detection in Concrete by Fourier and Wavelet Analyses. J. Eng. Mech. 2003, 129, 571–577. [Google Scholar] [CrossRef]
  47. Katunin, A. Diagnostics of Composite Structures Using Wavelets; The Publishing House of the Institute for Sustainable Technologies, National Research Institute: Gliwice, Poland, 2015. [Google Scholar]
Figure 1. The load position and sensors positions in the beam. (a) Ultrasonic sensors embedded with reinforcement; (b) Measuring stand and beam load position; (c) Ultrasonic sensor position inside the beam.
Acoustics 04 00007 g001
Figure 2. Pre-processed ultrasonic signal: (a) in time domain, (b) in frequency domain.
Acoustics 04 00007 g002
Figure 3. The BLEIB reference structure and sensors distance from each other in the BLEIB reference structure. (a) BLEIB reference structure, load direction, and location of cracks; (b) Ultrasonic sensor position and distance inside the BLEIB reference structure.
Acoustics 04 00007 g003
Figure 4. The static scheme and arrangement of all sensors. (a) Bridge in Gliwice; (b) Static scheme and cross-section of the bridge in Gliwice; (c) Arrangement of all sensors in the girder.
Acoustics 04 00007 g004
Figure 5. Deflection (DIC) at different load levels and final stage of the beam. (a) Deflection (LVDT) vs. load; (b) Strain images at different load levels and final stage of the beam.
Acoustics 04 00007 g005
Figure 6. Raw signals from the top and bottom pair of sensors. (a) Raw signal acquired from the bottom pair of sensors (S02R03); (b) Raw signal acquired from the top pair of sensors (S01R04).
Acoustics 04 00007 g006
Figure 7. Features computed from the top and bottom pairs of measurements. (a) D c c and CWT coefficients for the bottom pair of signals (S02R03); (b) D c c and CWT coefficients for the top pair of signals (S01R04).
Acoustics 04 00007 g007
Figure 8. Quasi-static load position and displacement values are shown. (a) Quasi-static load position and time in the BLEIB structure; (b) Displacement value measured by DIC.
Acoustics 04 00007 g008
Figure 9. Raw signals acquired from the two pairs of sensors are shown. (a) Raw signal acquired from the sensor pair S12R14 (distance between sensors was of 1 m); (b) Raw signal acquired from the sensor pair S10R12 (distance between sensors was of 5.5 m).
Acoustics 04 00007 g009aAcoustics 04 00007 g009b
Figure 10. Coefficient indices from the sensor pair S12R14. (a) Values of cross-correlation coefficient ( D c c ) index from the sensor pair S12R14; (b) Values of CWT coefficient index from the sensor pair S12R14.
Acoustics 04 00007 g010
Figure 11. Coefficient indices from the sensor pair S10R12. (a) Values of cross-correlation coefficient ( D c c ) index from the sensor pair S10R12; (b) Values of CWT coefficient index from the sensor pair S10R12.
Acoustics 04 00007 g011aAcoustics 04 00007 g011b
Figure 12. Raw signal acquired from the bridge in Gliwice. (a) Raw signal acquired from the sensors pair S01R02 in the Gliwice bridge; (b) Raw signal acquired from the sensors pair S02R08 in the Gliwice bridge.
Acoustics 04 00007 g012
Figure 13. Values of both coefficient indices. (a) Cross-correlation coefficient index from the sensor pair S01R02 in the Gliwice bridge; (b) CWT coefficient index from the sensor pair S01R02 in the Gliwice bridge.
Acoustics 04 00007 g013
Figure 14. Values of both coefficient indices from the sensor pair S02R08. (a) Cross-correlation coefficient index from the sensors pair S02R08 in the Gliwice bridge; (b) CWT coefficient index from sensors pair S02R08 in the Gliwice bridge.
Acoustics 04 00007 g014
Publisher’s Note: MDPI stays neutral with regard to jurisdictional claims in published maps and institutional affiliations.

