Article

Numerical and Experimental Characterisation of Polylactic Acid (PLA) Processed by Additive Manufacturing (AM): Bending and Tensile Tests

1
CMEMS-UMinho, Campus de Azurém, University of Minho, 4800-058 Guimarães, Portugal
2
LABBELS, Associate Laboratory, 4710-057 Braga, Portugal
3
CITAB/UTAD, Departamento de Engenharias, Quinta de Prados, 5001-801 Vila Real, Portugal
4
ISISE, IB-S, School of Engineering, Campus de Azurém, University of Minho, 4800-058 Guimarães, Portugal
5
Mechanics, Modelling and Production Research Laboratory (LA2MP), National School of Engineers of Sfax, University of Sfax, Sfax 3047, Tunisia
6
2C2T-Centro de Ciência e Tecnologia Têxtil, Universidade do Minho, 4800-058 Guimarães, Portugal
*
Author to whom correspondence should be addressed.
J. Compos. Sci. 2024, 8(2), 55; https://doi.org/10.3390/jcs8020055
Submission received: 12 December 2023 / Revised: 20 January 2024 / Accepted: 29 January 2024 / Published: 1 February 2024
(This article belongs to the Special Issue Additive Manufacturing of Advanced Composites)

Abstract

:
In additive manufacturing (AM), one of the most popular procedures is material extrusion (MEX). The materials and manufacturing parameters used in this process have a significant impact on a printed product’s quality. The purpose of this work is to investigate the effects of infill percentage and filament orientation on the mechanical properties of printed structures. For this reason, the characterisation of polylactic acid (PLA) was done numerically using the finite element method and experimentally through mechanical tests. The experiments involved three-point bending and tensile tests. The results showed that mechanical performance is highly dependent on these processing parameters mainly when the infill percentage is less than 100%. The highest elastic modulus was exhibited for structures with filament align at 0° and 100% infill, while the lowest one was verified for specimen filament aligned at 0° and 30% infill. The results demonstrated that the process parameters have a significant impact on mechanical performance, particularly when the infill percentage is less than 100%. Structures with filament aligned at 0° and 100% infill showed the maximum elastic modulus, whereas specimens with filament oriented at 0° and 30% infill showed the lowest. The obtained numerical agreement indicated that an inverse method based only on the load–displacement curve can yield an accurate value for this material’s elastic modulus.

1. Introduction

Additive manufacturing (AM) first emerged in the 1980s for developing models and prototypes, expanding the digital chain beyond computer-aided design (CAD) or reverse engineering. The main advantages of additive manufacturing (AM) over other traditional manufacturing processes were rapidly identified, including the capacity to form complex geometries while reducing human interaction and product development time and cost [1,2]. Binder jetting (BJT), material extrusion (MEX), directed energy deposition (DED), material jetting (MJT), powder bed fusion (PBF), sheet lamination (SHL), and vat photopolymerization (VPP) are examples of additive manufacturing (AM) processes [3].
MEX is the second most widely used three-dimensional printing (3DP) technology because of its simplicity and accessibility of utilisation [4,5]. The advanced 3DP technique for producing polymeric products is also referred to as fused filament fabrication or FFF. Through layer-by-layer melting and extrusion of a polymeric filament, this method produces three-dimensional structures. The fundamental idea behind the FFF production process is to melt the raw material to make it easier to form new shapes [6].
Low-melting-point polymers such as polylactic acid (PLA), polyamide (PA), acrylonitrile butadiene styrene (ABS), polyvinyl acetate (PVA), and polycarbonate (PC) are the principal components adopted in MEX [7]. In this technology, PLA is widely utilised. It is a biodegradable thermoplastic made from crops fermented like potatoes or maize. Its primary characteristics, when applied to FFF production techniques, are low glass transition temperature, high processability, low ductility, decreased resilience, and decreased volumetric contraction [8].
The material, structural elements, and manufacturing variables all affect the mechanical characteristics of MEX-printed parts. Among the manufacturing and structural characteristics are layer height, contour number, raster width, raster angle, infill percentage, fill pattern, air gap, build orientation, print speed, and extruder temperature. Component characteristics are influenced differently by various combinations and degrees of parameter variation (Figure 1) [9,10].
Numerous studies have been conducted over time to optimise and comprehend the influence of these parameters using a variety of materials, given the myriad combinations of parameters to be selected in this manufacturing technique.
Three responses, namely tensile, flexural, and impact strength, were examined by Sood et al. [11] in relation to five significant production parameters: layer thickness, orientation, raster angle, raster width, and air gap of printed ABS parts. The majority of these parameters can affect the printed parts’ tensile characteristics, and porosity between layers can lead to weak structures, according to the authors’ findings.
Baich et al. [12] considered the implications of infill concepts and printing time on the mechanical response (tensile, compressive, and flexural strength) of ABS printed parts. As expected, high infill density not only offers greater strength but also increases production costs due to the increased amount of material required.
Harpool and collaborators [13] studied the tensile strength of PLA components with four distinct infill patterns: rectilinear, diamond, hexagonal, and solid. According to the findings, the infill design has a considerable influence on the mechanical qualities of the printed objects.
The impact of process parameters, such as build direction, infill percentage, infill pattern, printing speed, extrusion temperature, and layer height, on the mechanical tensile properties of printed parts was experimentally investigated by Alafaghani et al. [14]. The authors discovered that the tensile properties are hardly affected by printing speed, infill density, or infill pattern.
Behzadnasab and Yousefi [15] investigated the effects of nozzle temperature settings on the mechanical behaviour of 3D-printed samples. The authors discovered that as the set nozzle temperature increased to 240 °C, the strength of PLA 3D-printed parts increased, although degradation was observed when nozzle temperatures were set higher than 240 °C polymer, which is the common upper bound of set temperature restraint of 3D printing of polymeric materials. Furthermore, the printing speed can have an impact on the mechanical properties of the printed parts. Setting a high printing speed can result in inadequate layer bonding, decreasing the mechanical strength of the parts [16].
Bardiya et al. [17] chose the three main process parameters to investigate: layer thickness, build orientation, and infill density. It was determined that the maximum impact strength of 3D-printed PLA parts can be achieved by employing a layer thickness of 0.2 mm, a layer orientation of 30°, and an infill density of 80%.
The study by Abeykoon et al. [18] was concentrated on the mechanical, thermal, and morphological properties of 3D-printed specimens under several processing conditions, including infill pattern, density, and speed, as well as with various printing materials. In the end, the best process parameters for the best performance of the various printing materials were a linear fill pattern, 100% infill density, 90 mm/s infill speed, and a set nozzle temperature of 215 °C.
In none of the above referred studies was the mechanical behaviour of 3D-printed components predicted using a combination of numerical modelling and experimental data. The cited authors used conventional methods to measure basic mechanical properties in the experimental characterisation. To date, there have been no studies examining the use of contactless full-field experimental techniques to assess the mechanical performance of 3D-printed materials and validate measurement protocols.
In this study, two experimental mechanical tests—the three-point bending (TPB) and tensile ones—were used to assess the impact of filament orientation and infill percentage on the overall stiffness. As a way to acquire tensile stress–strain curves and the fundamental mechanical properties of the material (PLA), two methods were combined to monitor discrete and full-field data. Numerical modelling was performed to simulate the influence of infill percentage on the PLA response for filament orientations both at 0° and 90°. Notably, this study goes beyond conventional approaches employed in previous studies by incorporating a combination of numerical modeling and experimental data, integrating non-contact full-field experimental techniques to evaluate the mechanical performance of 3D-printed materials. By doing so, this study aims to bridge the gap between theoretical predictions and practical results, thereby improving the understanding of the mechanical behaviour of 3D-printed components. Furthermore, this work introduces a unique focus on filament orientation and fill percentage, two crucial factors that influence the overall stiffness of 3D-printed structures.

2. Materials and Methods

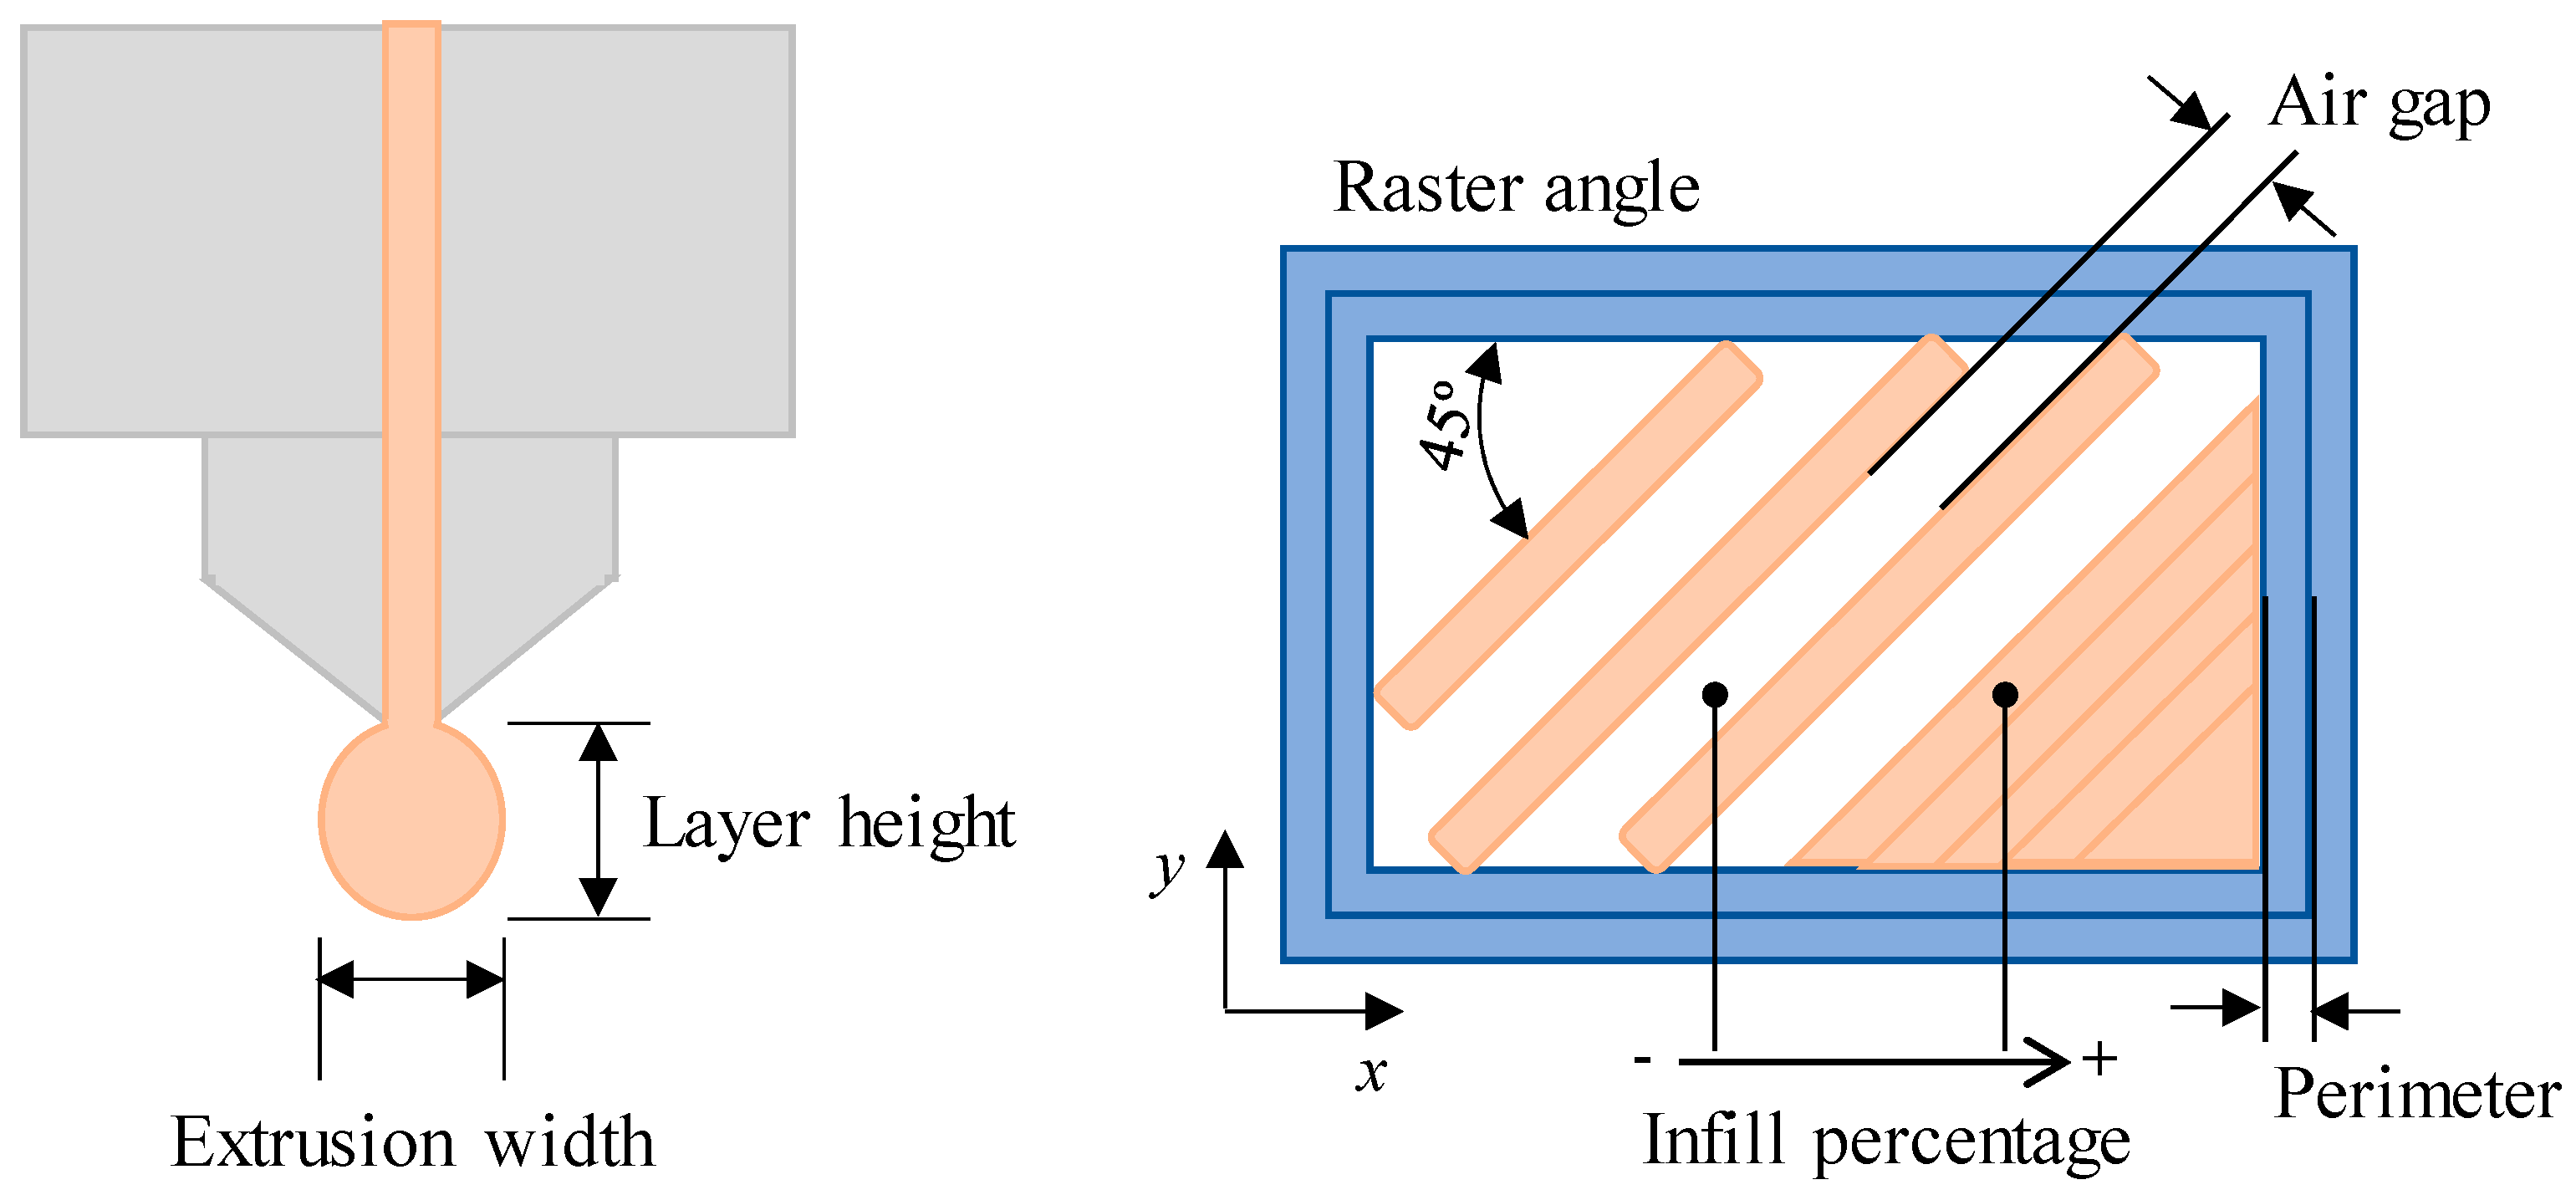
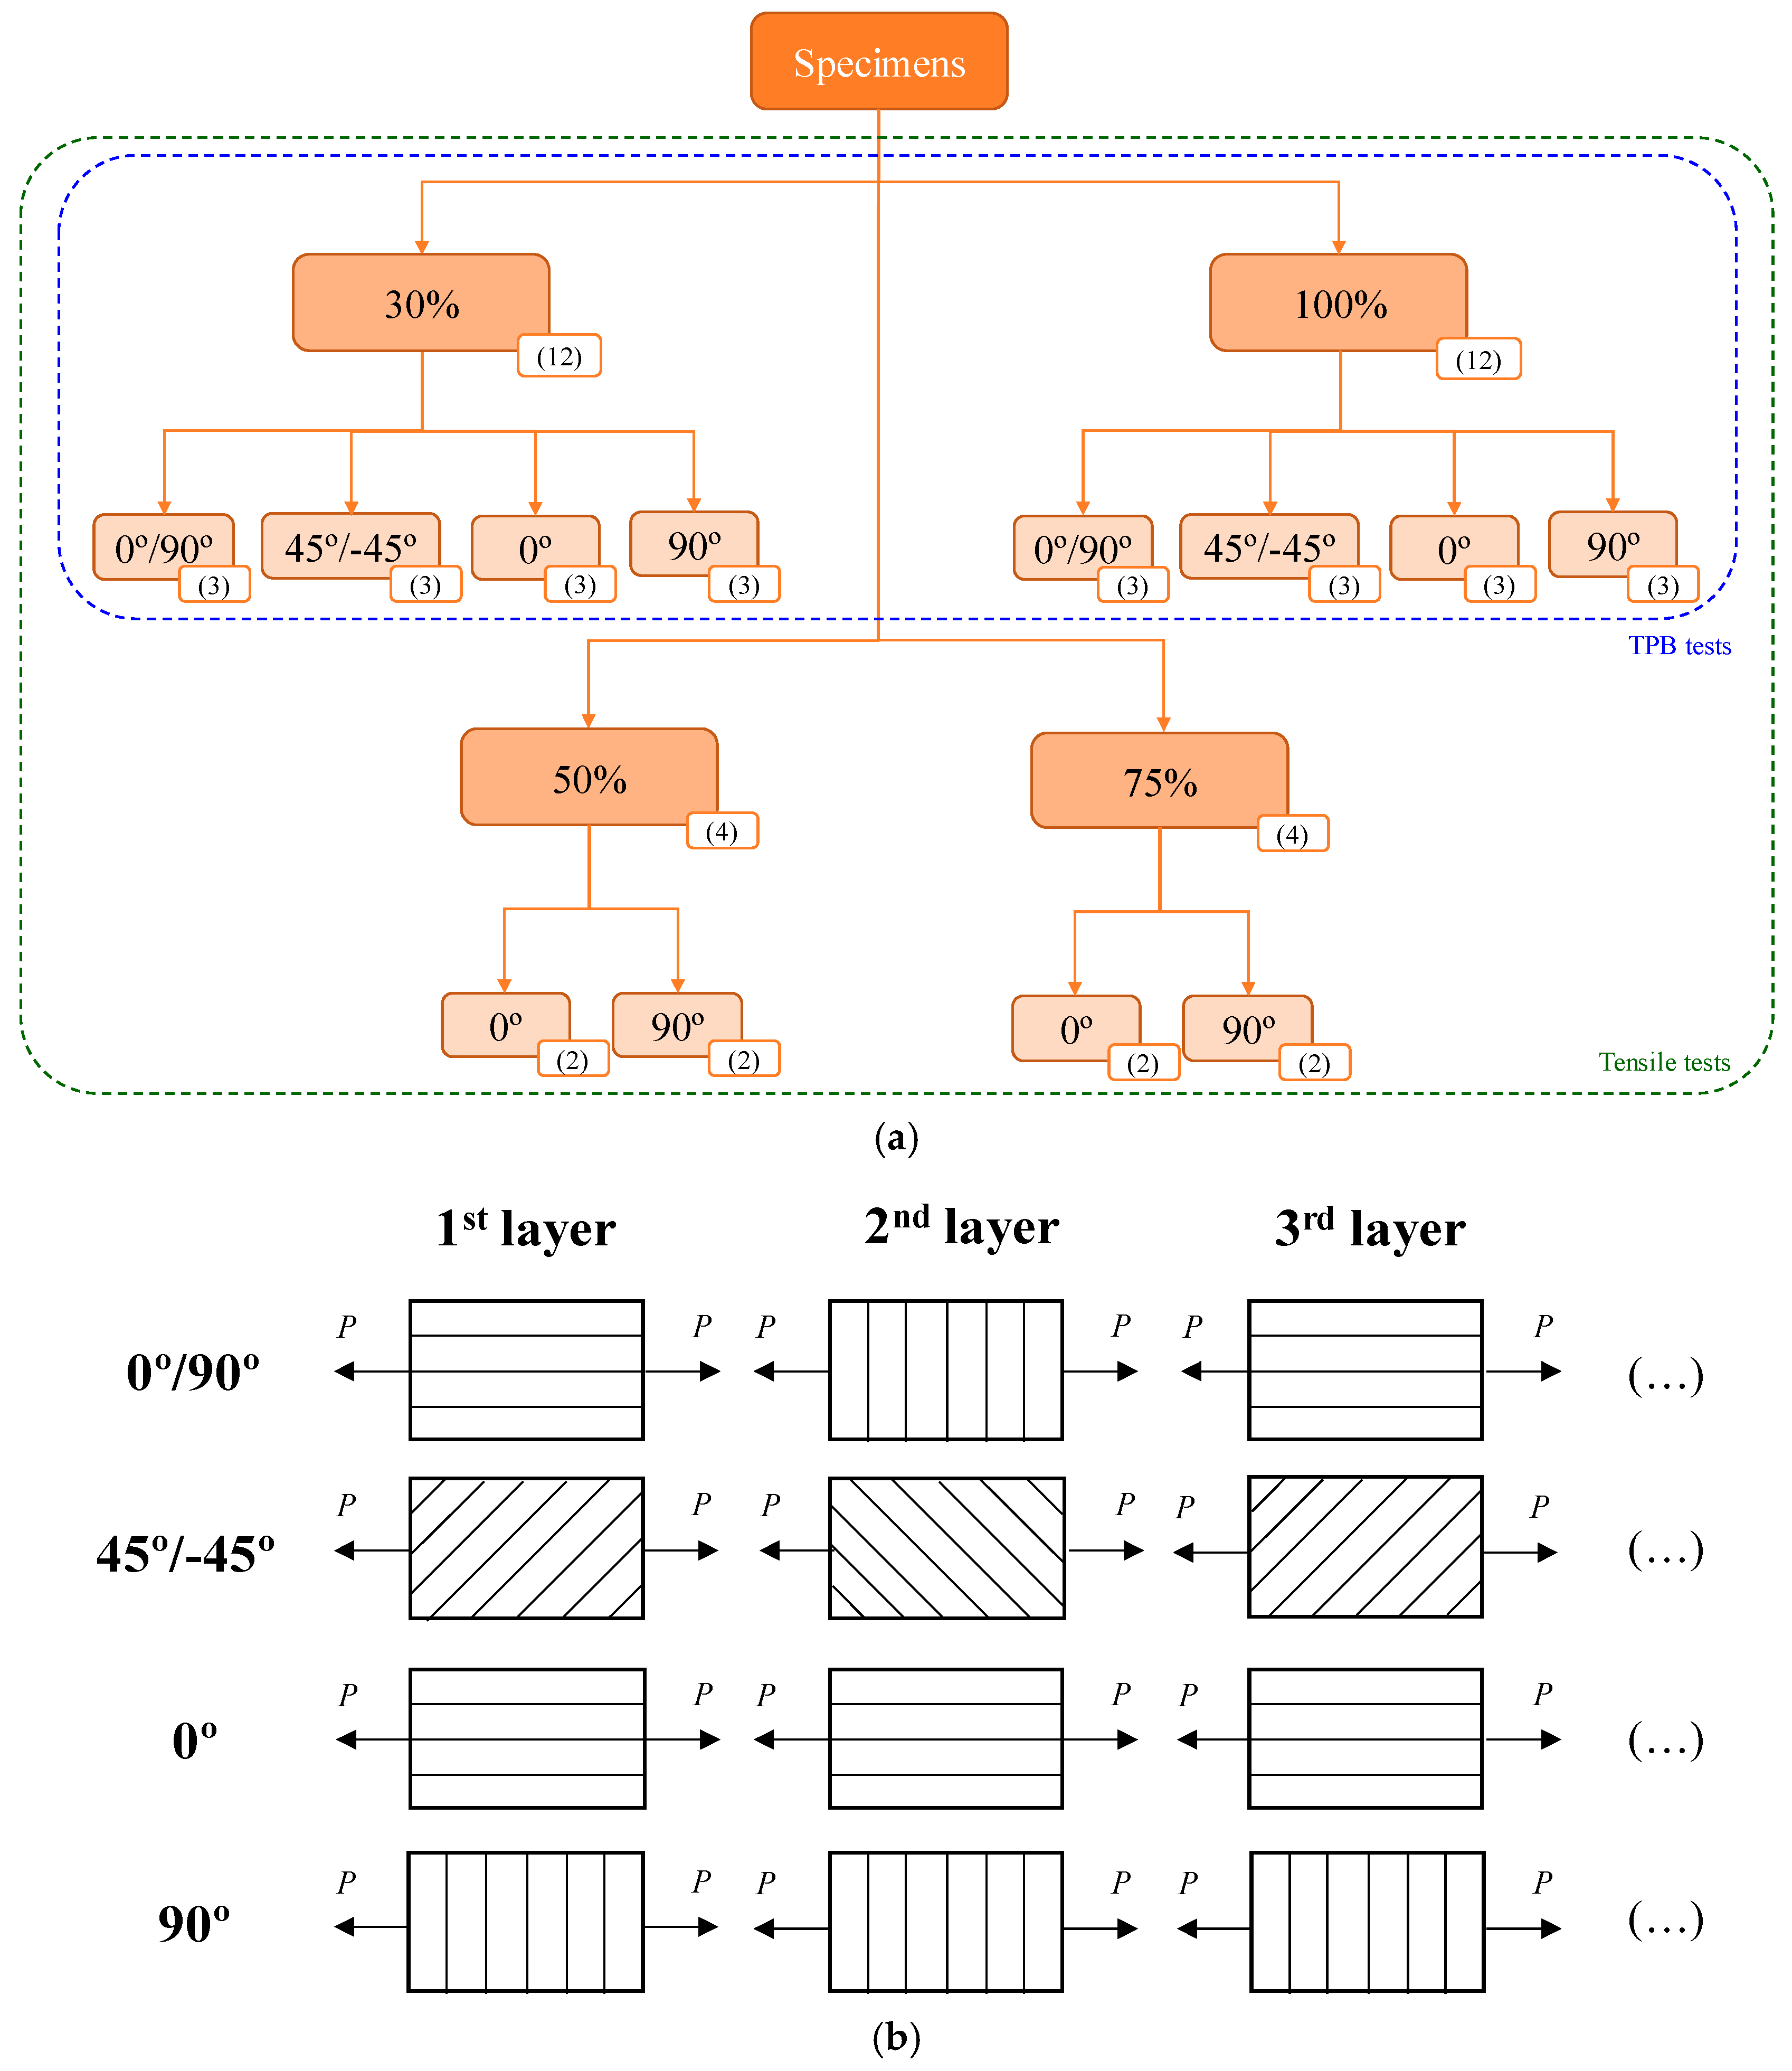
2.1. Preparation of Specimens
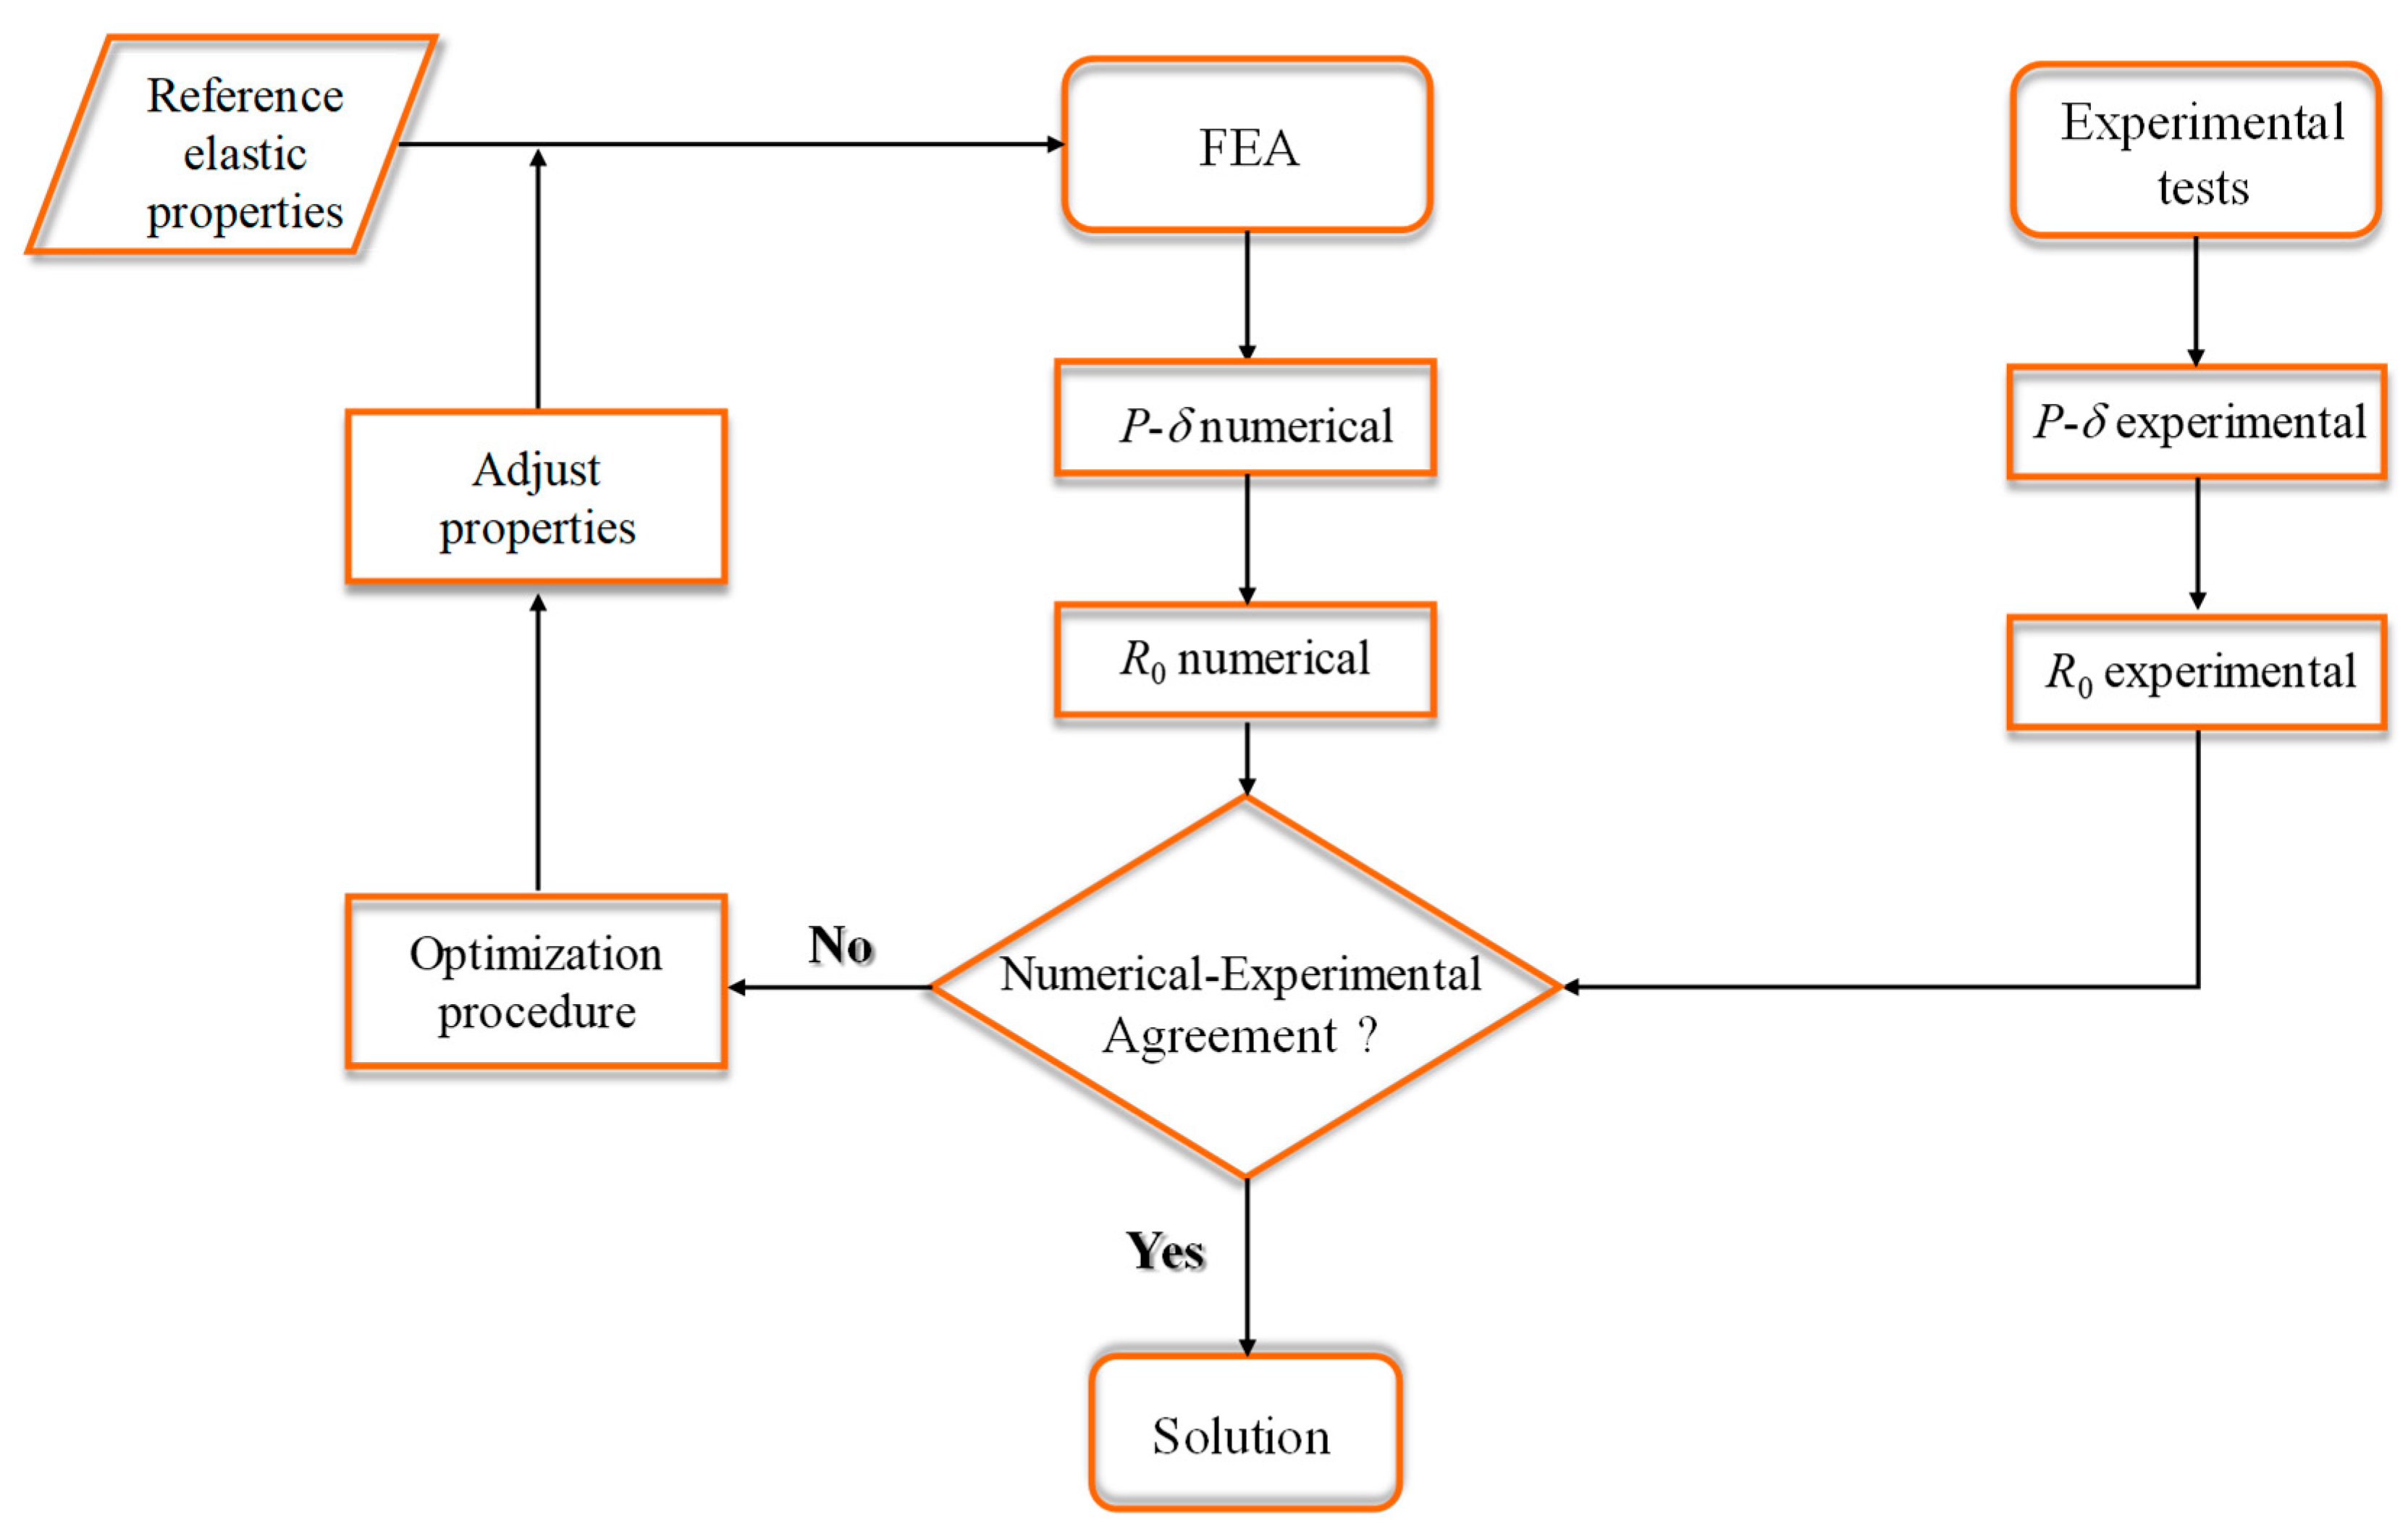
Using a Creatbot® model F430 machine (3D printing technology, Zhengzhou, China), PLA samples were created using MEX technology. Flashforge Technology Co., Ltd. (Jinhua, China) supplied 1.75 mm diameter PLA filament (Primavalue®, 3DPrima, Malmö, Sweden). CAD models such as parallelepipedals and dogbones (Figure 2a,b) were developed in accordance with ISO 20753 and ISO 3167 type A, the corresponding testing standards for three-point bending (TPB) and tensile tests. The STL file format was adopted for slicing operations in the CreatWare V6.5.1 print control programme. G-code files were generated based on geometrical and printing settings (Table 1). Twenty-four specimens were printed to undergo TPB tests, three for each orientation with 30% and 100% infill. Thirty-two specimens were printed with four filament orientations (0°/90°, 45°/−45°, 0°, and 90°) and infill percentages of 30% and 100% for the tensile tests. Tensile tests were also conducted with 50% and 75% for filament orientations at 0° and 90° relative to the loading axis aiming to evaluate more deeply the impact of the elastic modulus with the infill percentage (Figure 3a,b). The elastic moduli E_1 and E_2 were identified through specimens with filaments oriented at 0° and 90°, respectively.
Using varying orientations and infill percentages, specimens for TPB and tensile testing were printed (Figure 3), with the corresponding effective dimensions (width, length, and thickness) exhibited in Table 2 and Table 3.

2.2. Inverse Method

As previously stated, the goal of this work is to provide a simple strategy for identifying the elastic performance of PLA by combining experimental and numerical data through optimisation. Thus, the three-point bending (TPB) and tensile tests were selected as the two experimental tests. The chosen method entails identifying the printed PLA’s elastic characteristics that mimic the experimentally determined mechanical response (P-d curve) (Figure 4).

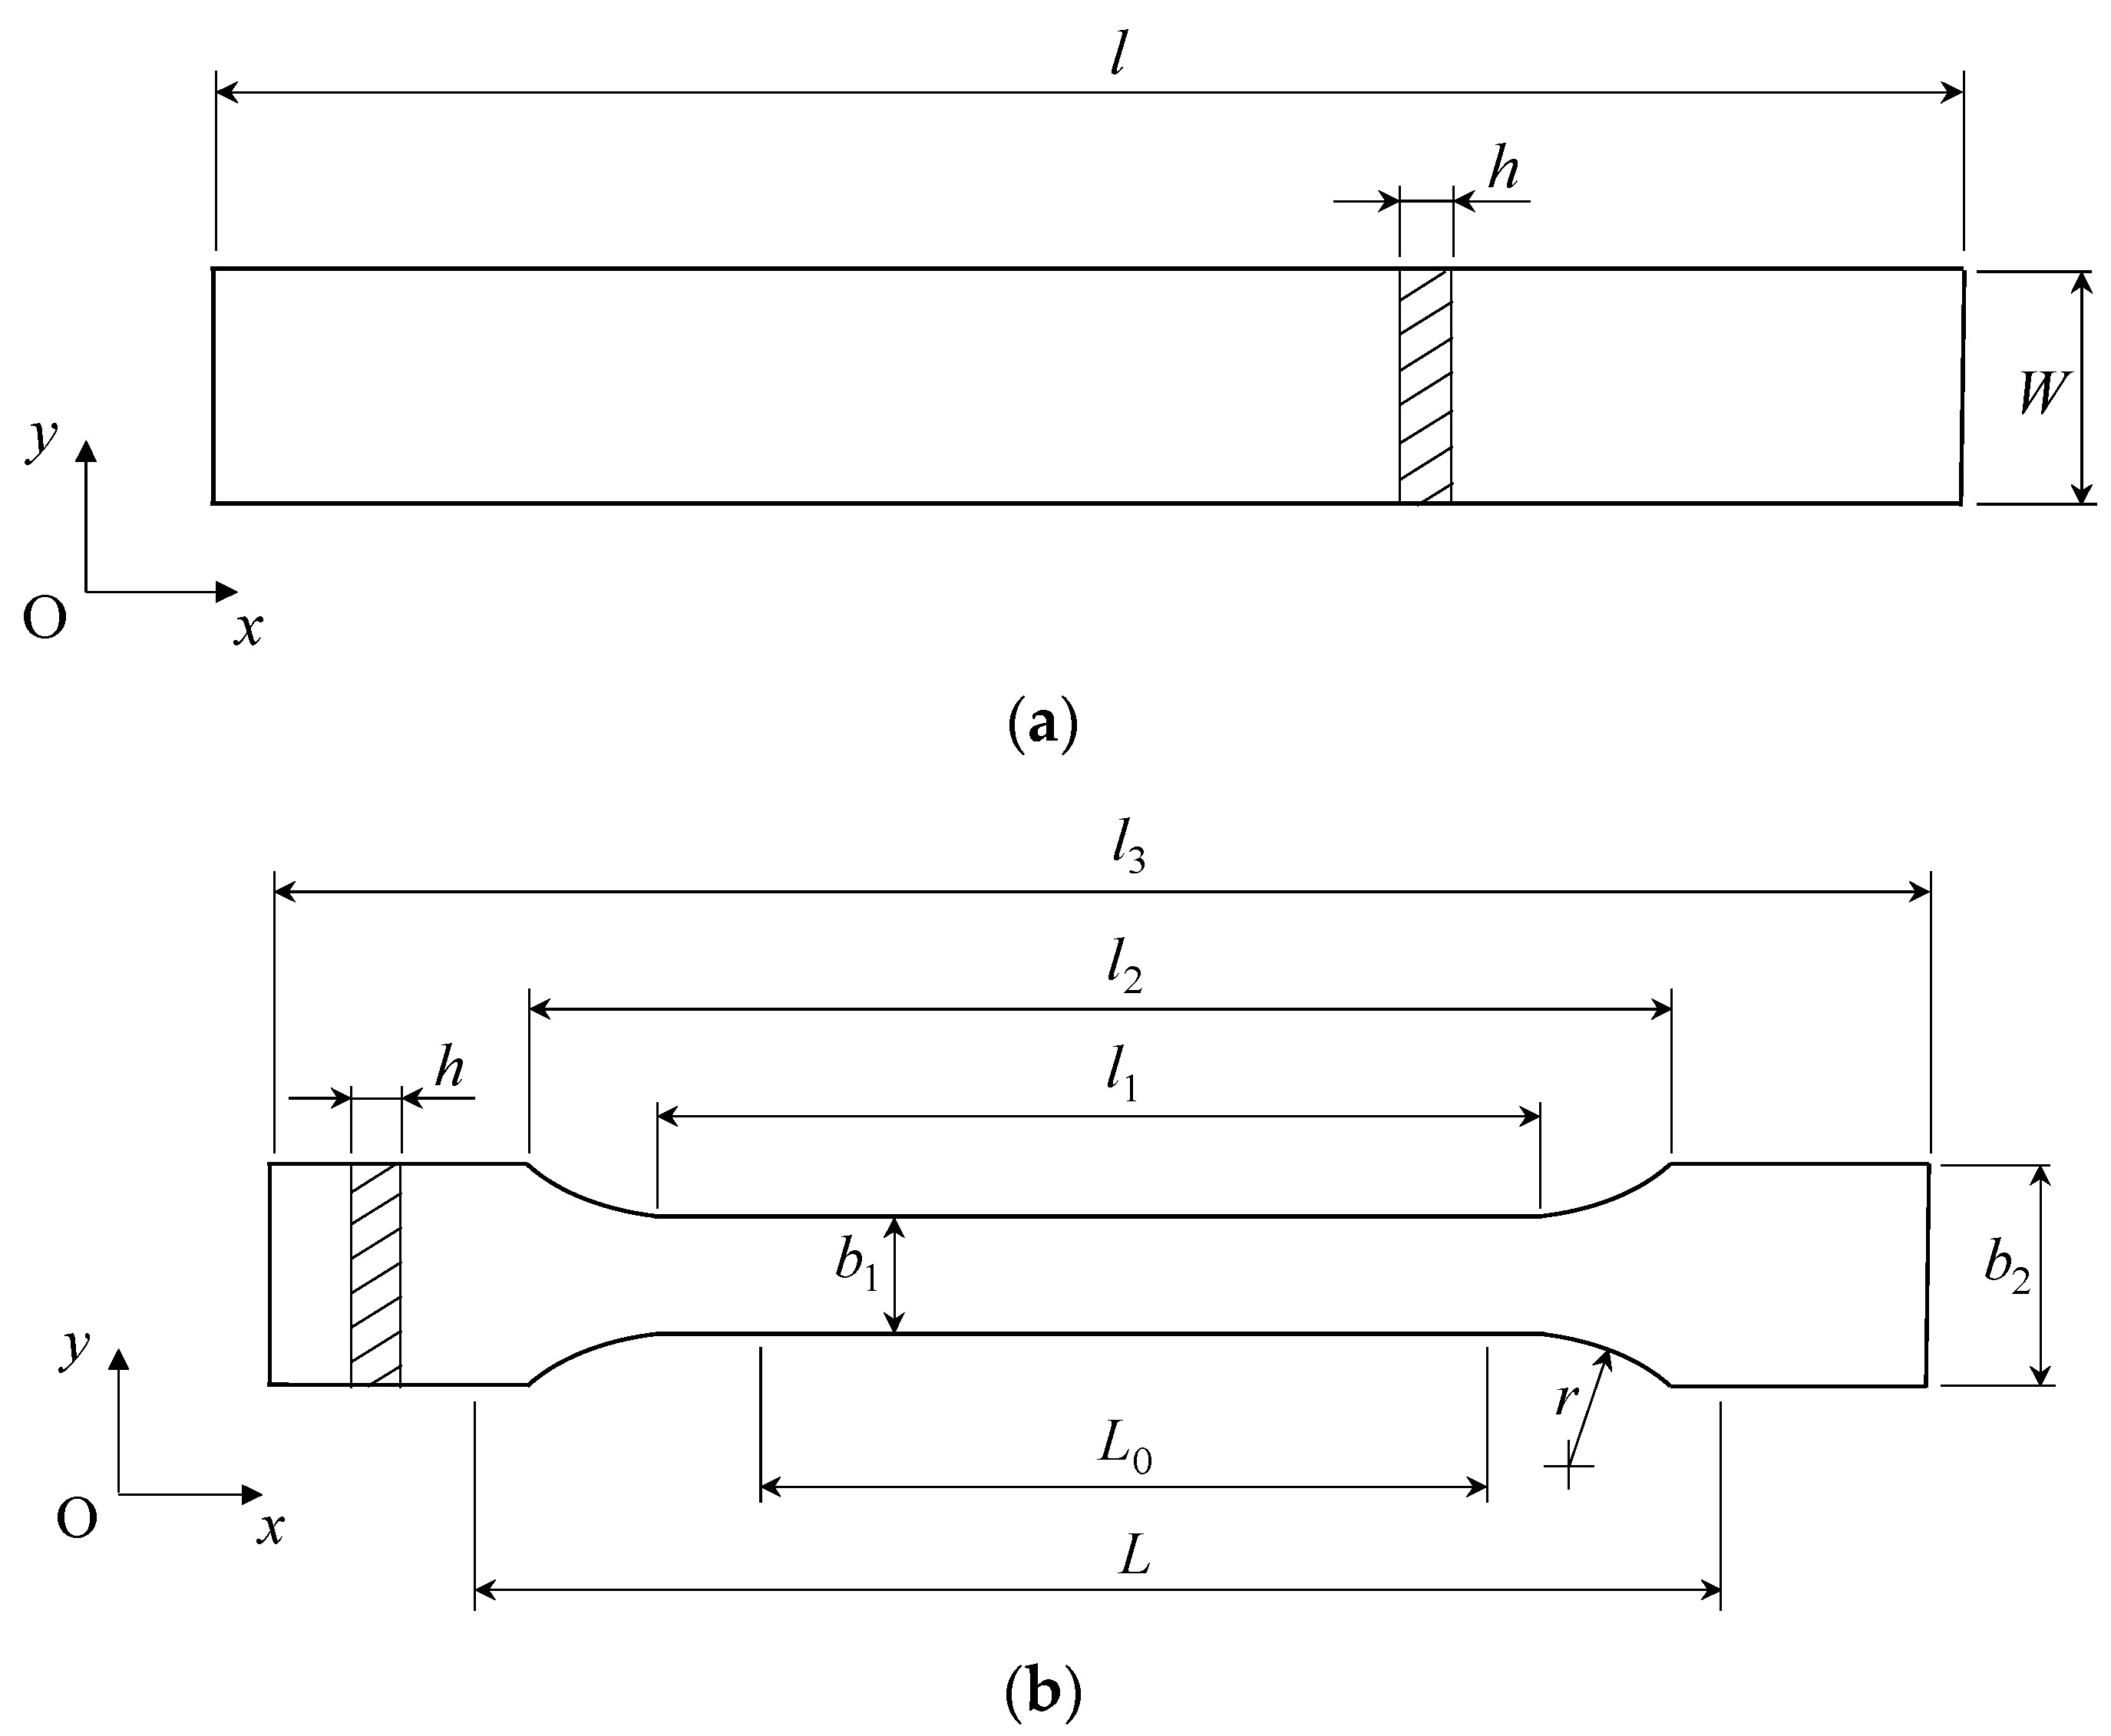
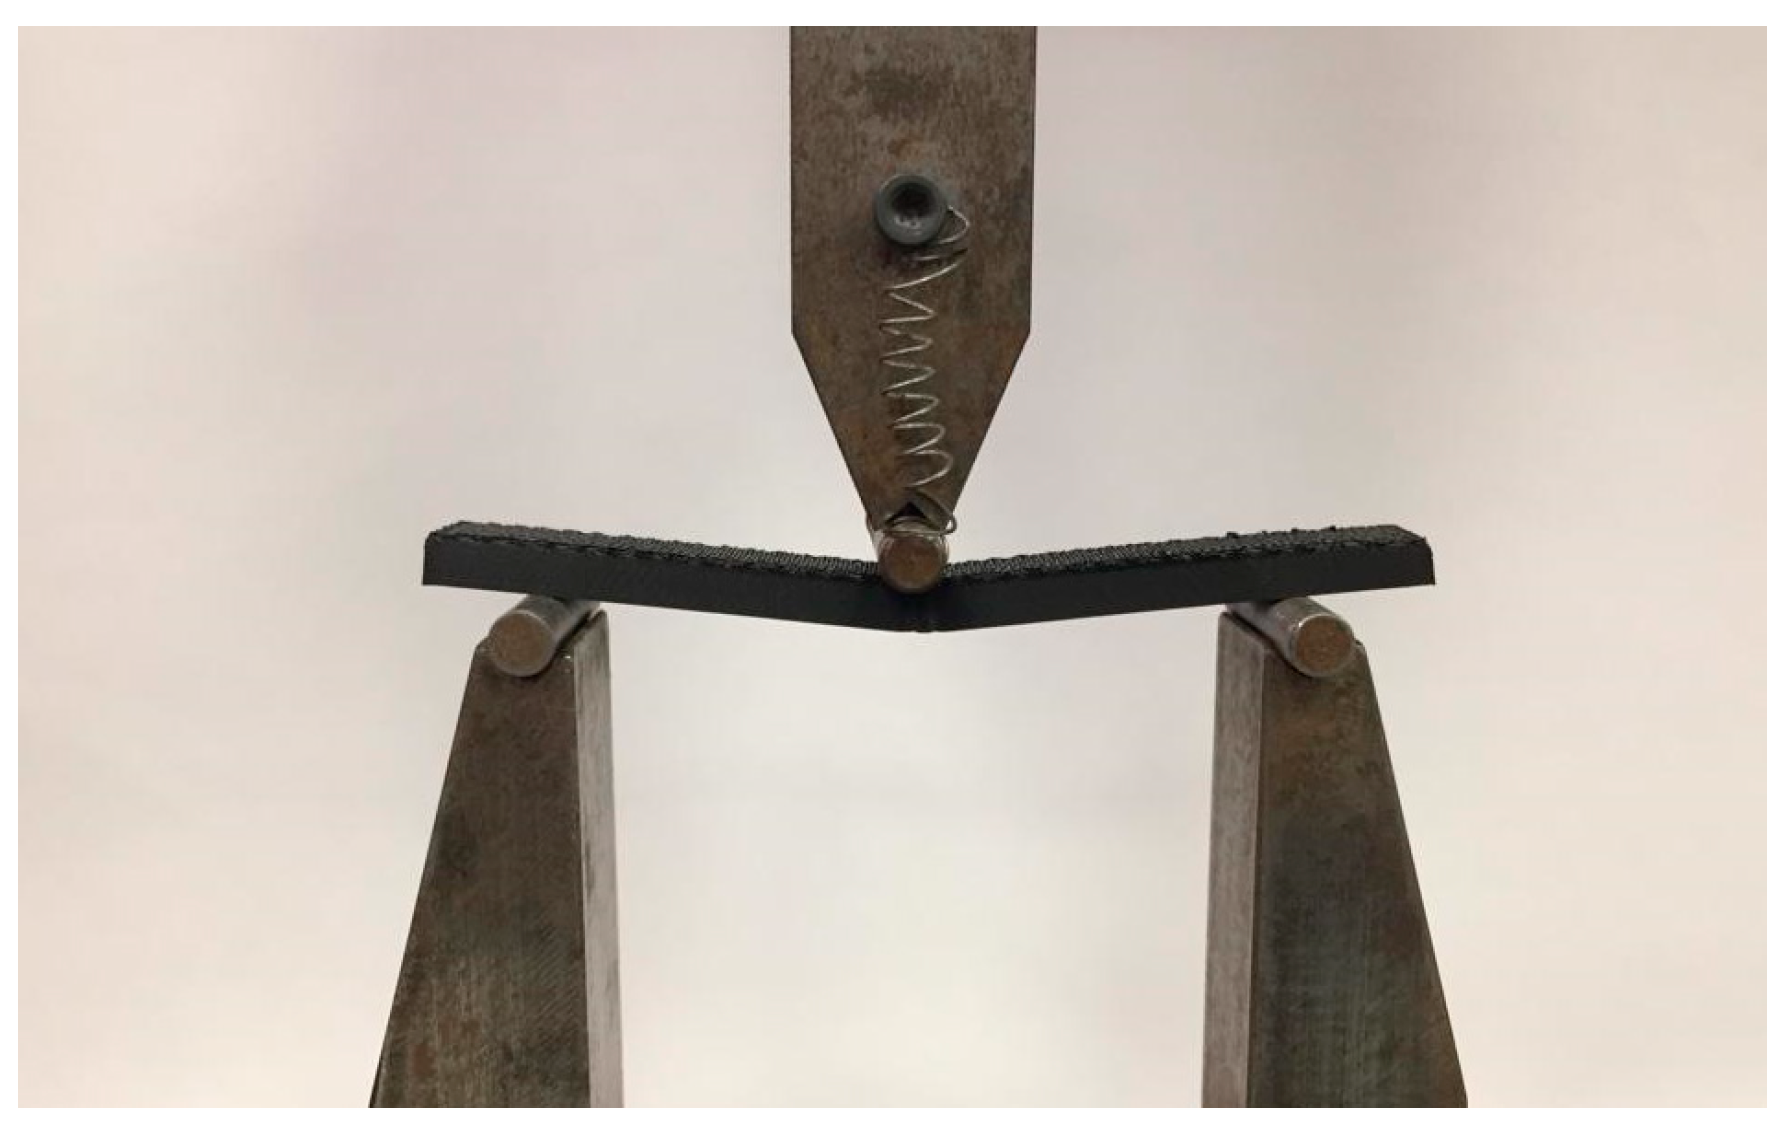
2.2.1. Three-Point Bending Tests

Bending tests were conducted according to the ISO 178 [19] standard using servo-electrical material testing equipment (MicroTester INSTRON 5848, Instron®, Norwood, MA, USA) under displacement control (5.0 mm/min). An acquisition frequency of 5 Hz was selected, and a 2 kN load cell was used. At room temperature (25 °C, 65°RH), the displacement {δ) and load (P) were recorded, and the loading span (L) was 60 mm. Twenty-four specimens were tested (for 30 and 100% infill percentages) in the linear elastic region (Figure 5).
The modulus of elasticity along the longitudinal direction was obtained considering the Bernoulli–Euler beam theory,
E x = R 0 L 3 4 W h 3
where R0 stands for the initial stiffness, W for the width, and h for the specimen height (Figure 2a).

2.2.2. Standard Tensile Tests

Tensile tests were accomplished at a displacement rate of 3 mm/min with a 25 kN load cell in an Instron® 8874 Universal Testing System. These tests were performed at room temperature (25 °C; 65°RH) following ISO 527-1 [20] & ISO 527-2 [21] standard directives. Using a gauge length L 0 of 25 mm, self-centering grips were implemented with a load-gripping distance L of 115 mm (Figure 2b). Tests were conducted on twenty-four specimens (Figure 6), with load (P) and displacement (d) being recorded at an acquisition frequency of 20 Hz.

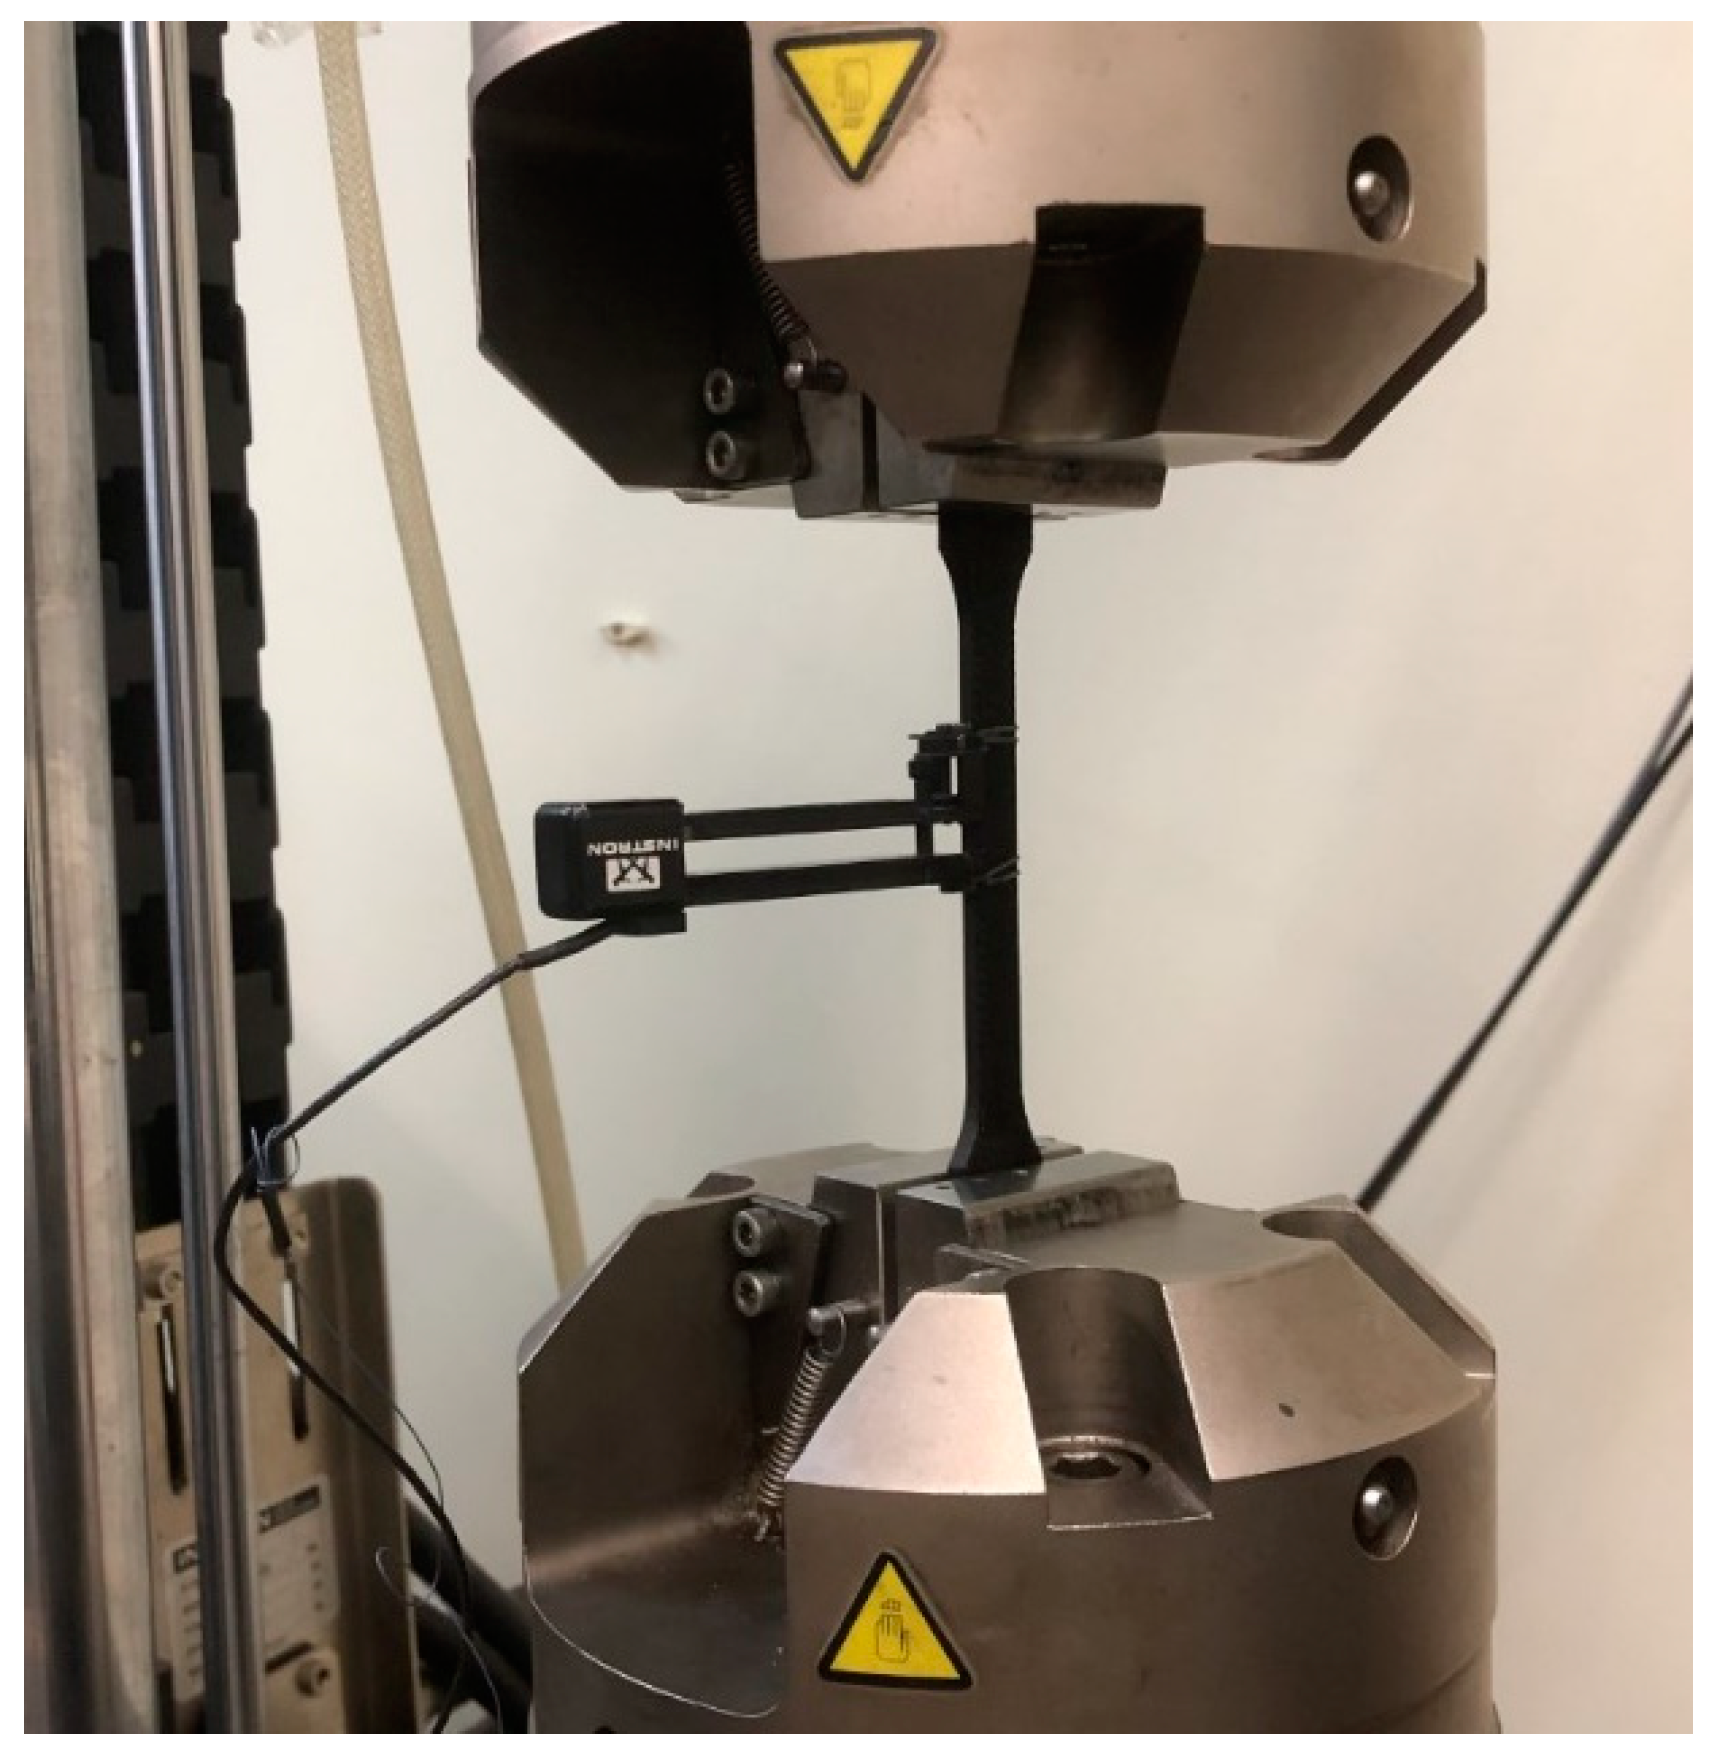
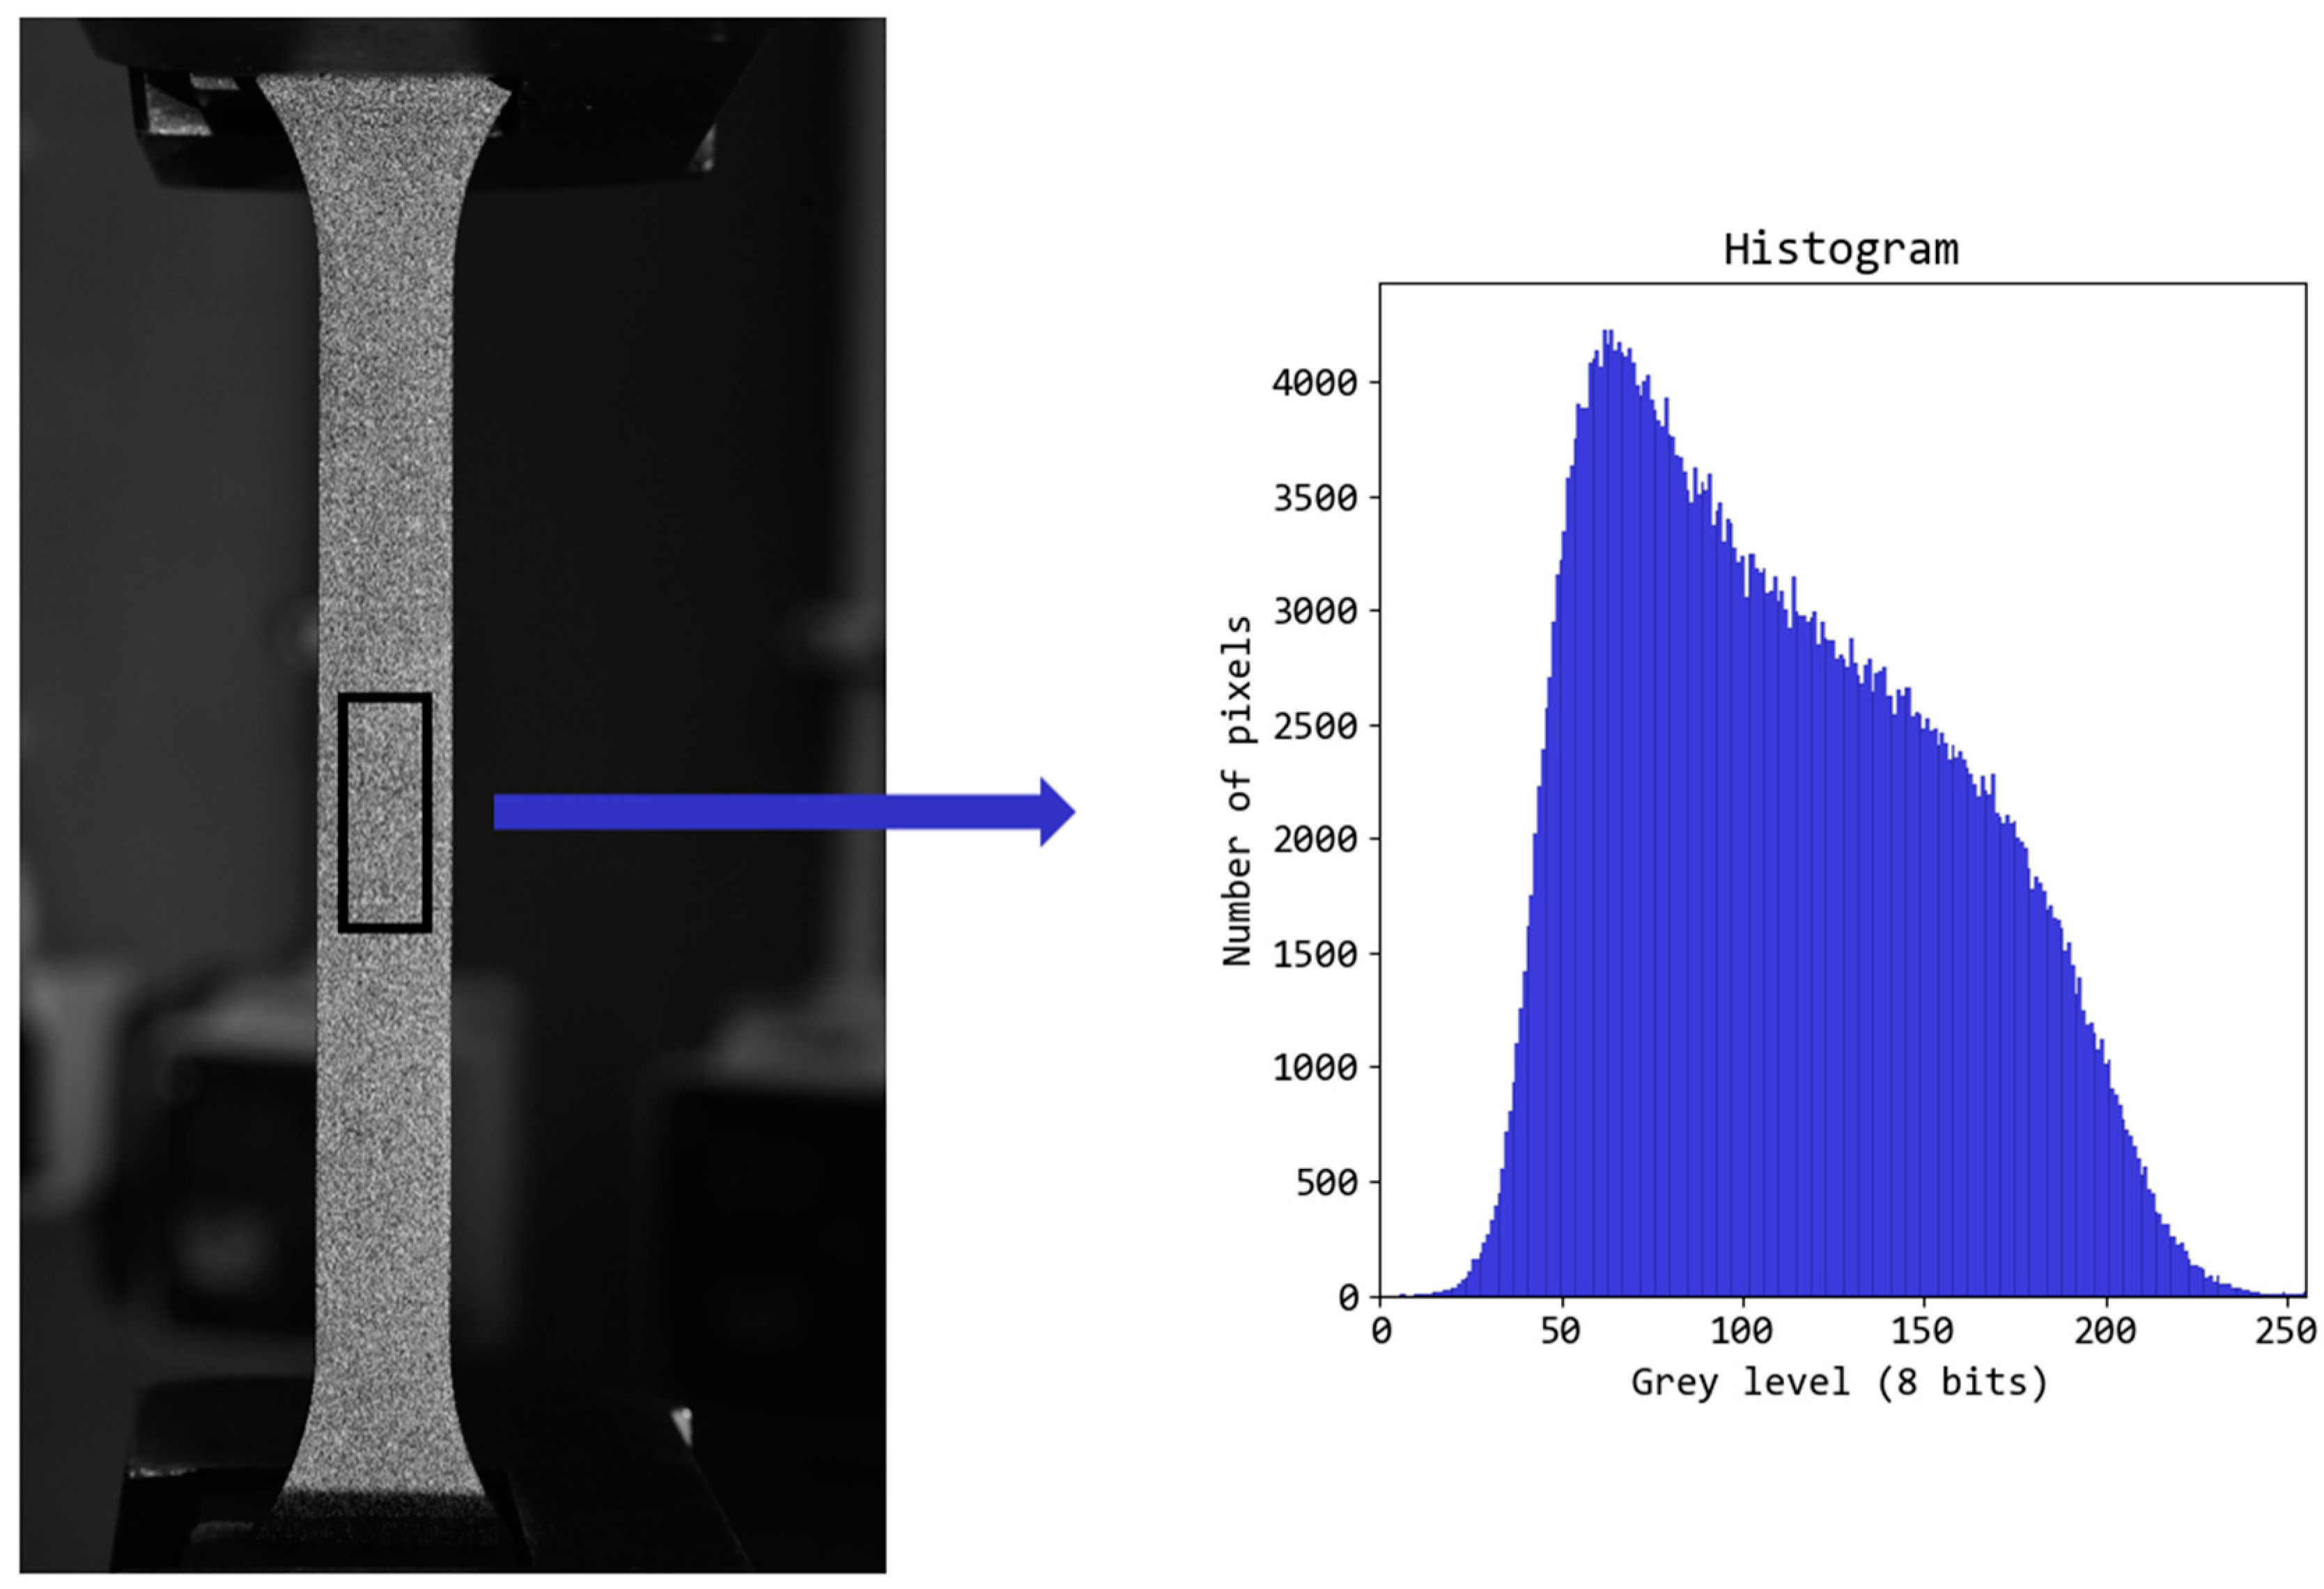
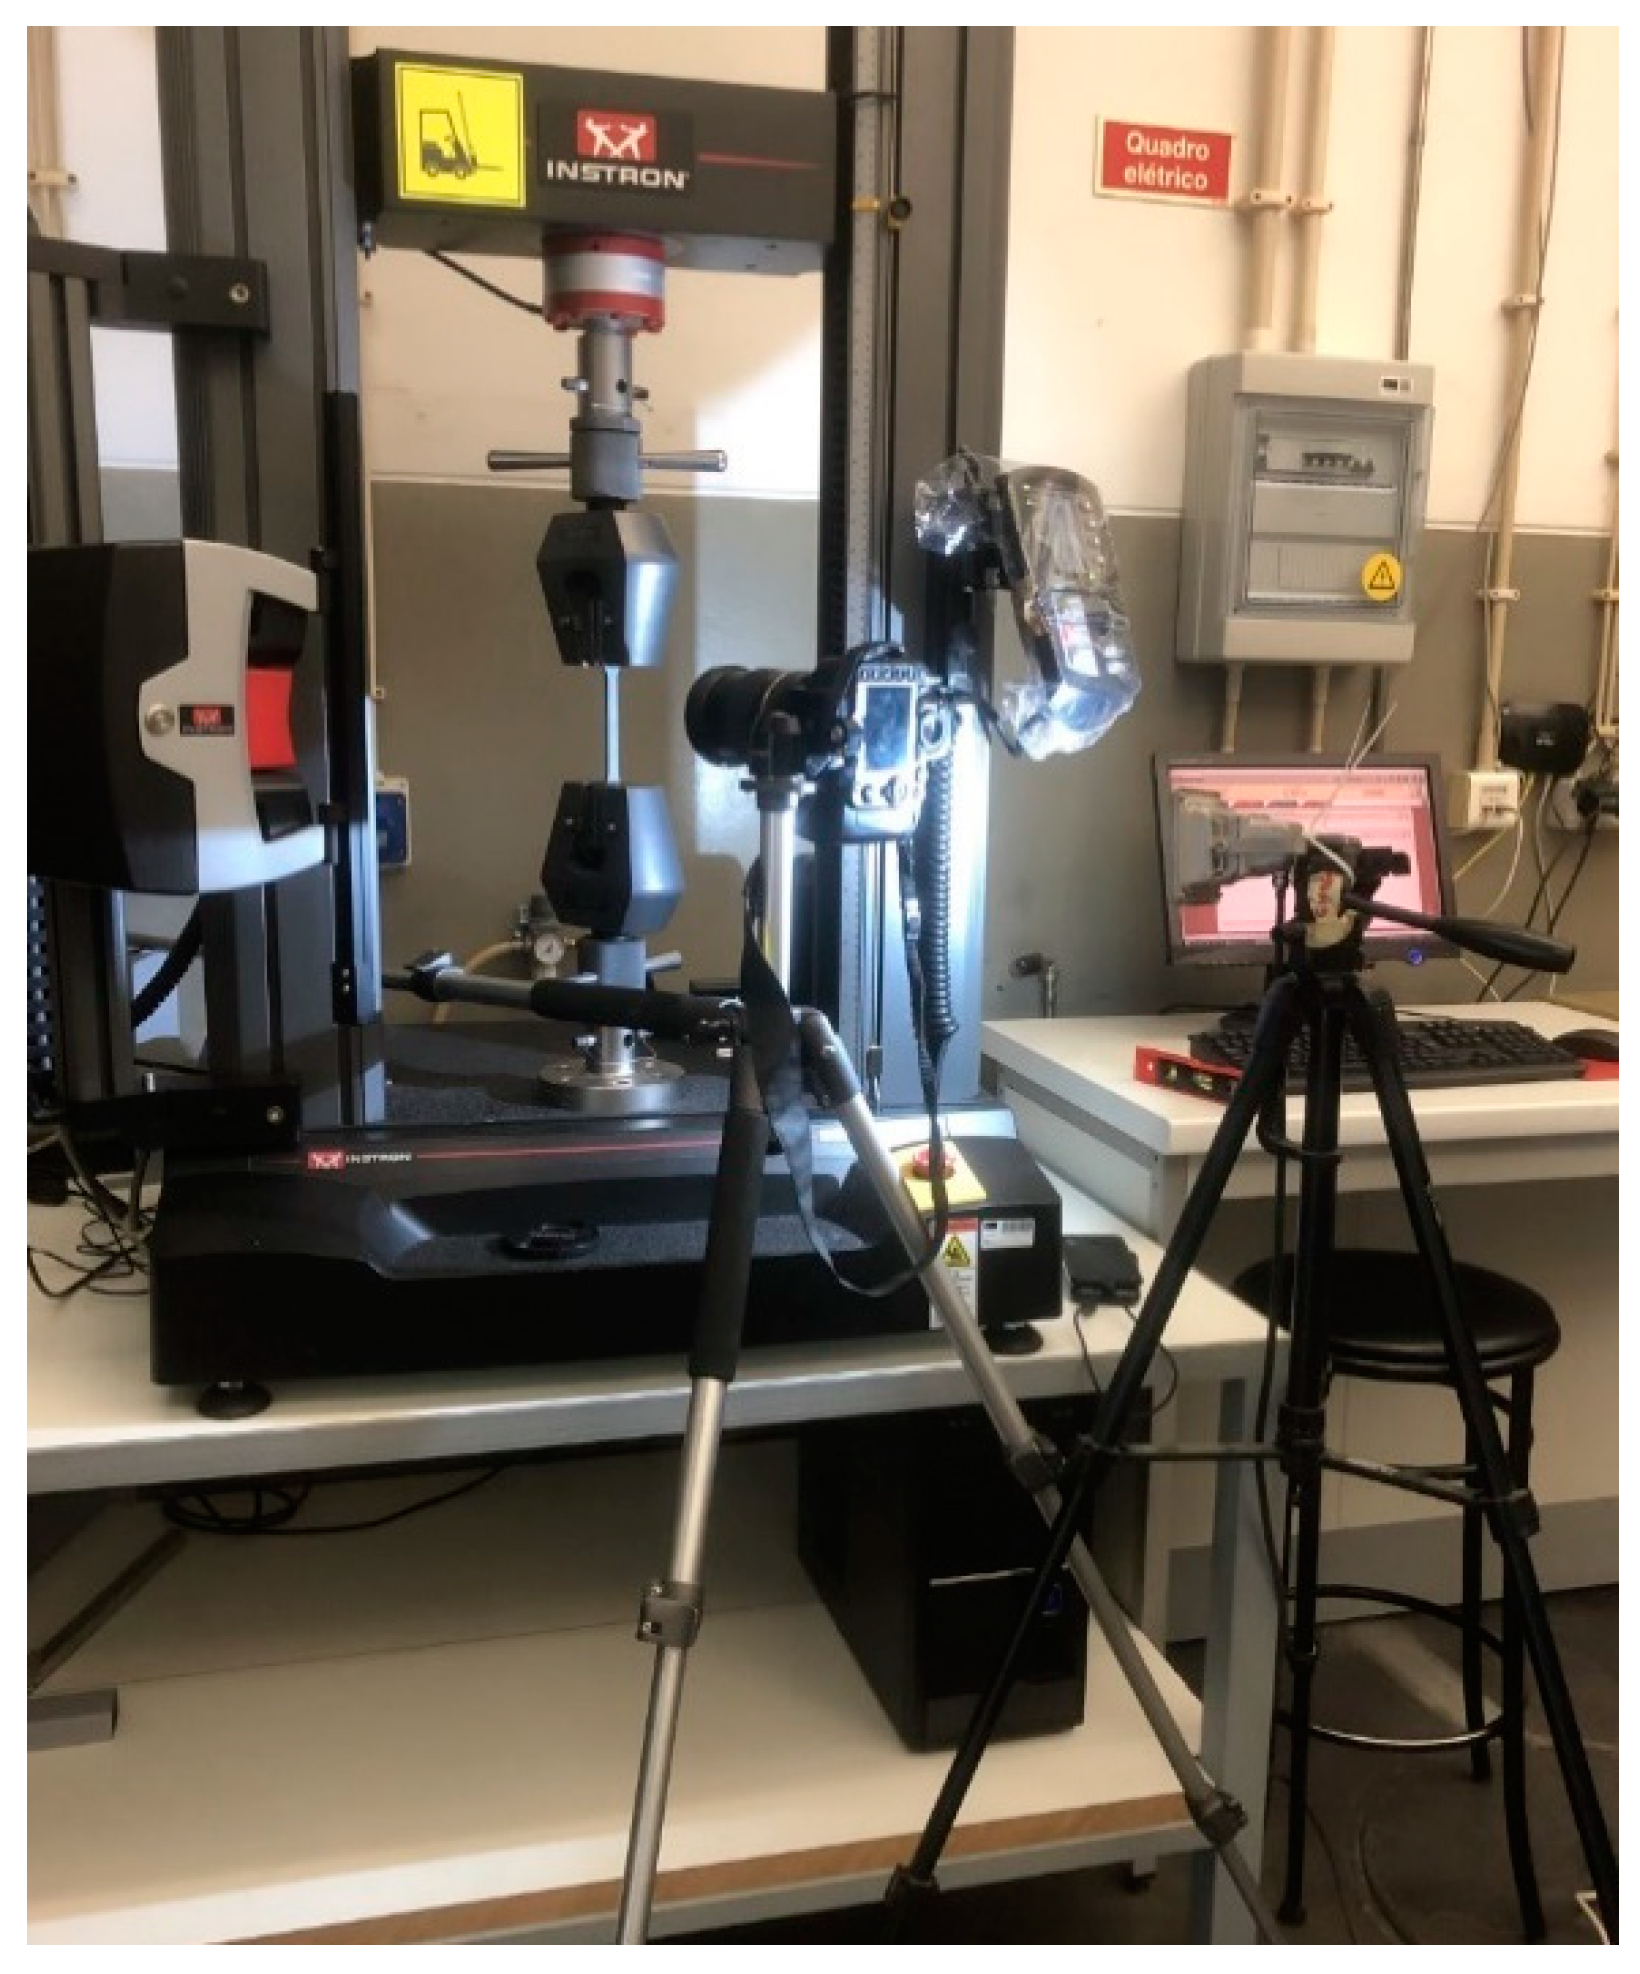
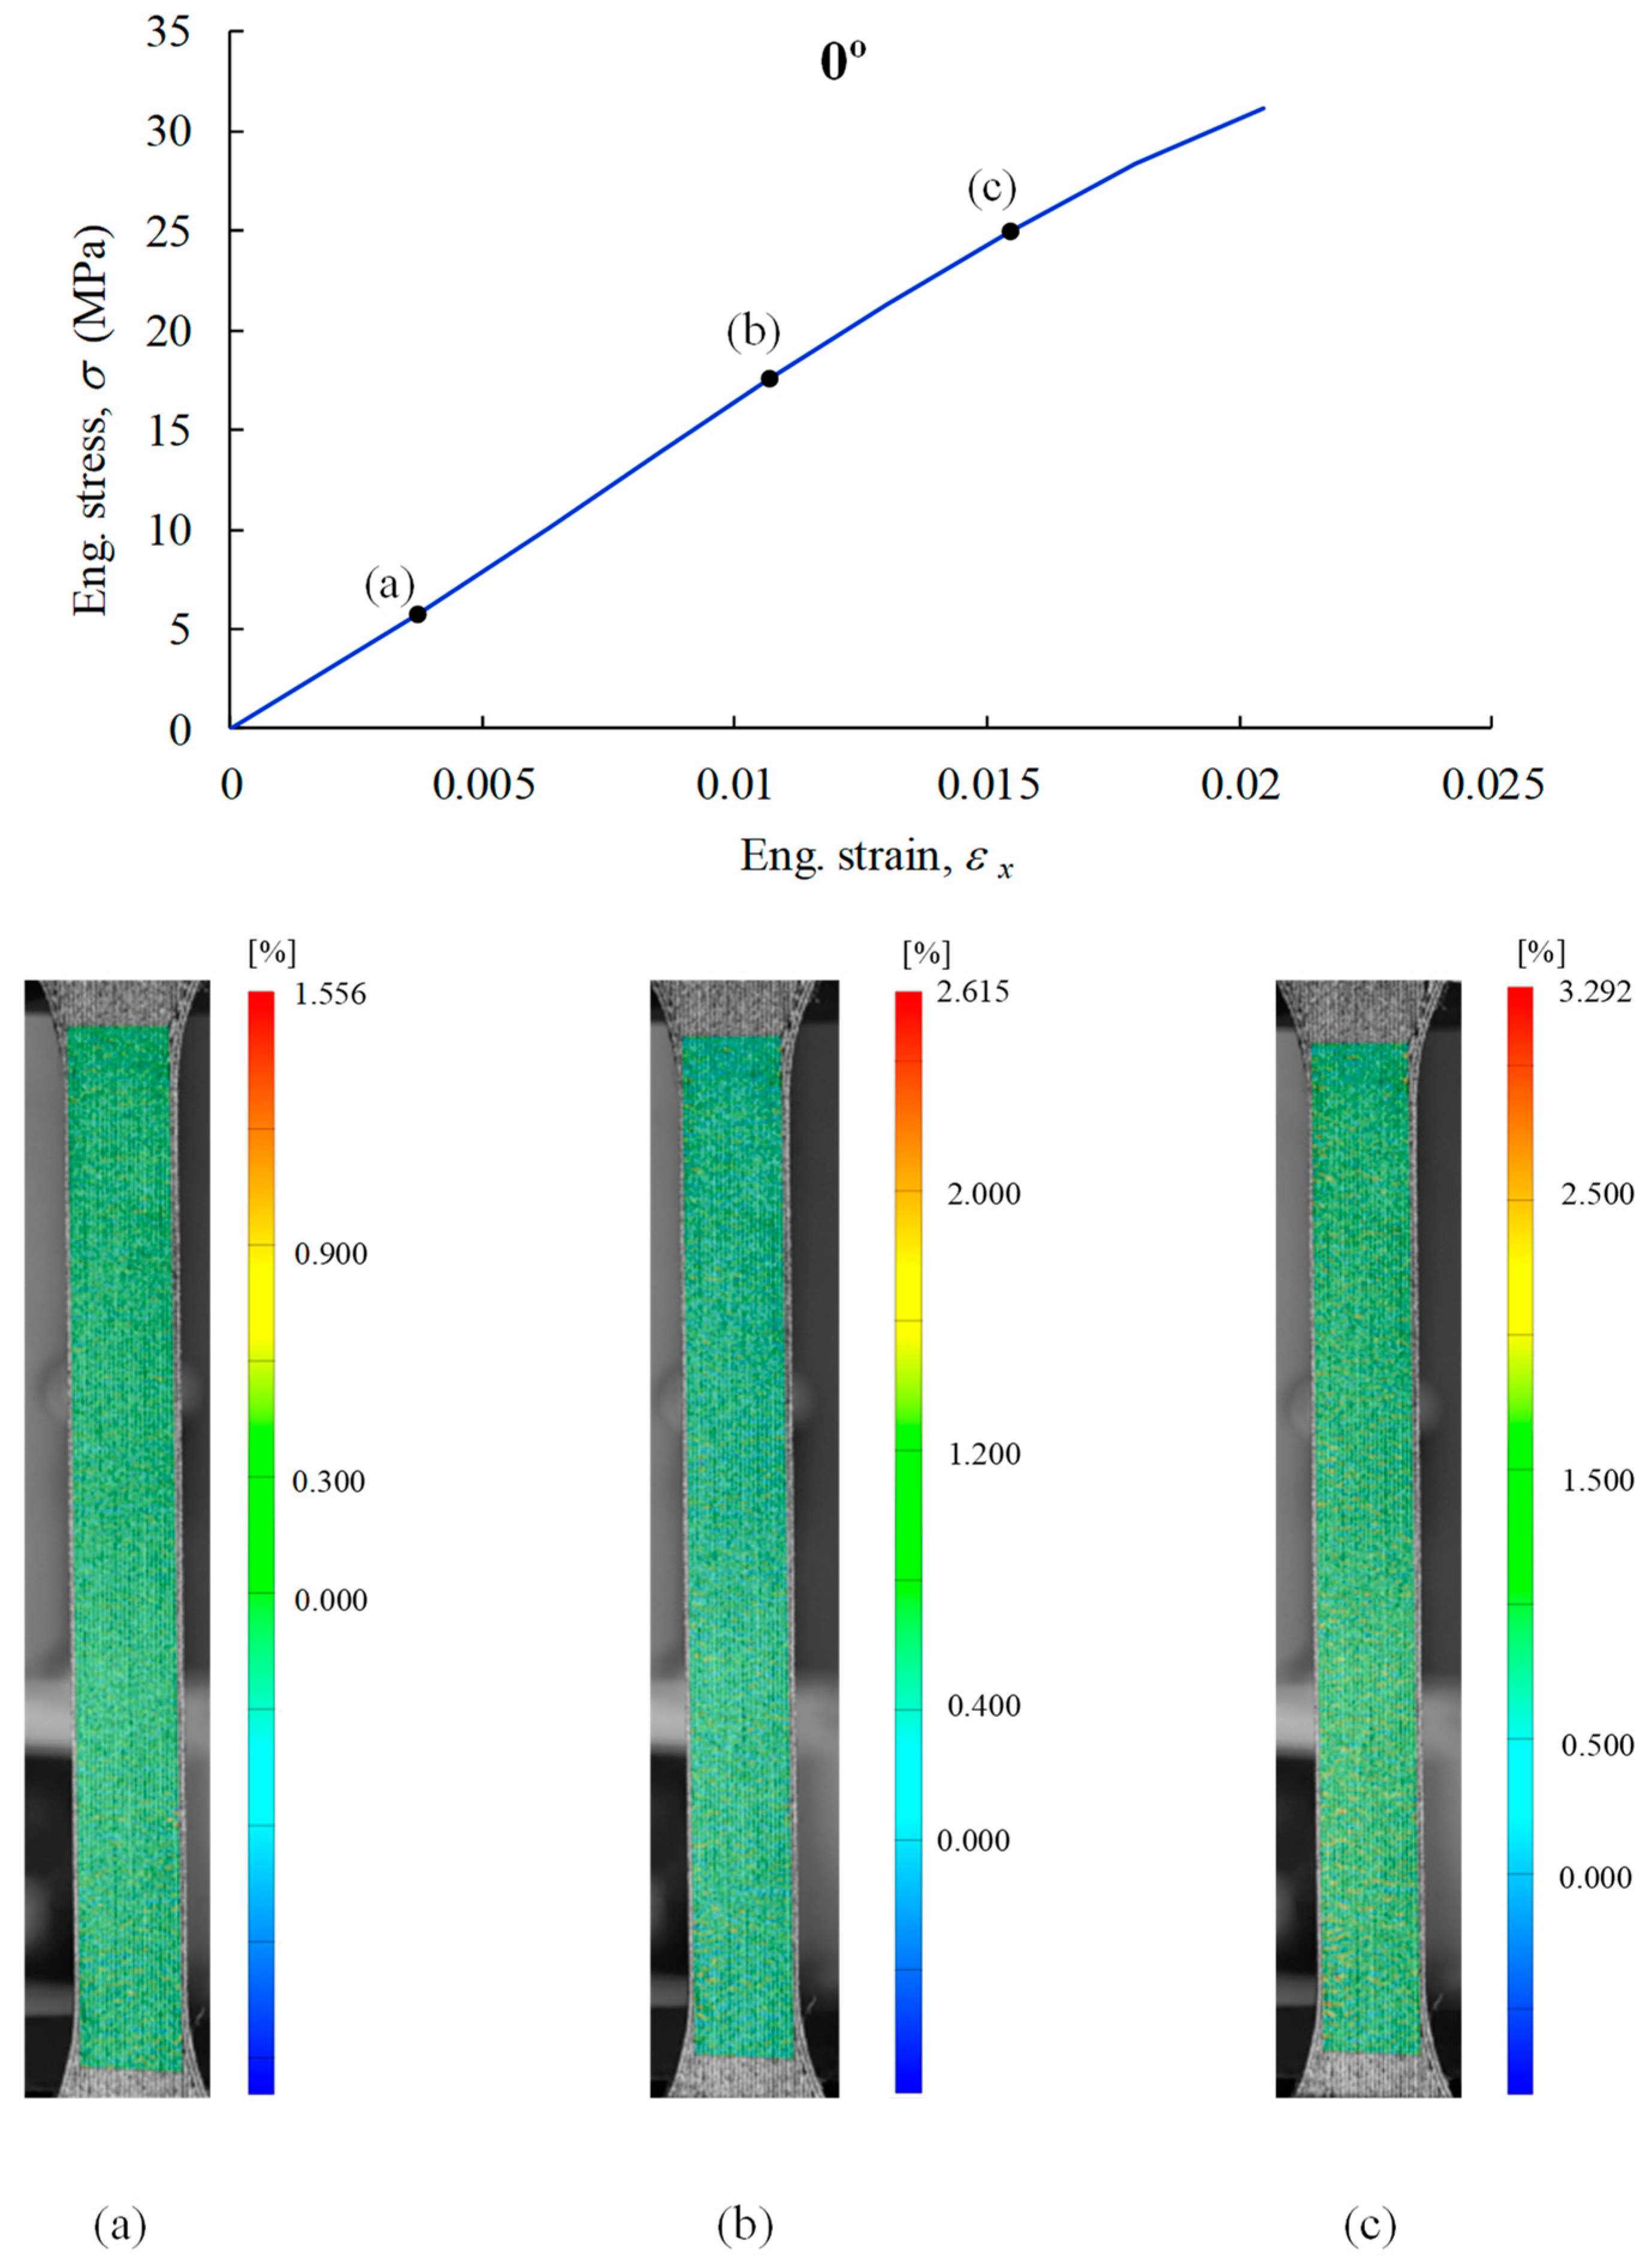
2.2.3. Tensile Tests with Digital Image Correlation

DIC measurements were employed at room temperature (25 °C; 65% RH) using an INSTRON® 5969 Universal Testing System equipped with a load cell of 5 kN and a displacement rate of 5 mm/min. The parameters that were established were load-gripping distance L (115 mm) and service length l 1 (80 mm) (Figure 2b). At the grips, the applied force P and displacement d were continuously measured at a 10 Hz acquisition rate. Since the strain field in the linear elastic domain must remain constant throughout the mechanical test, the central region of the specimen (located within l 1 in Figure 2b) is especially suited to measure elastic properties. This area was utilised specifically to create the speckle pattern due to the specimen surface being sufficiently flat and regular. To create a suitable carrier for DIC measurements, a fine matte coat was sprayed onto the specimen first, followed by an uneven spread of black marks (Figure 7). After this process, a distinct texture with the right isotropy and contrast could be defined due to the speckled pattern that was produced. In terms of the matching procedure, the reference image, or non-deformed configuration, is usually meshed into subsets designated as correlation domains, the size that determines the spatial resolution of the measurements. In this work, post-processing operations were carried out using the GOM Correlate 2018 software. The optical system was comprised of a TAMRON 24-70 MM F/2.8 lens (Saitama, Japan) and an 8-bit Nikon D800E camera (Tokyo, Japan) with a pixel resolution of 4912 × 7360 (Figure 8). The camera lens system was prudently placed in relation to the specimen surface, adopting a precision level, ensuring a working distance of 150 mm, which leads to a conversion factor of around 0.02 mm/pixel. By carefully opening the lens aperture (minimum depth of field), it was possible to focus and capture crisp photos of the speckled pattern. Still, to minimise diffraction effects (smallest apertures), the aperture was sealed throughout the loading procedure to produce a sufficient depth of field. By carefully controlling the shutter duration and illumination, motion blur and pixel saturation were prevented during movement. A specified 0.2 Hz was used for the picture capture rate, and 10–2 pixels (2 mm) was the displacement resolution achieved by setting the subset size and subset step to 15 × 15 pixels2 and 11 × 11 pixels2, respectively [22].

3. Numerical Models

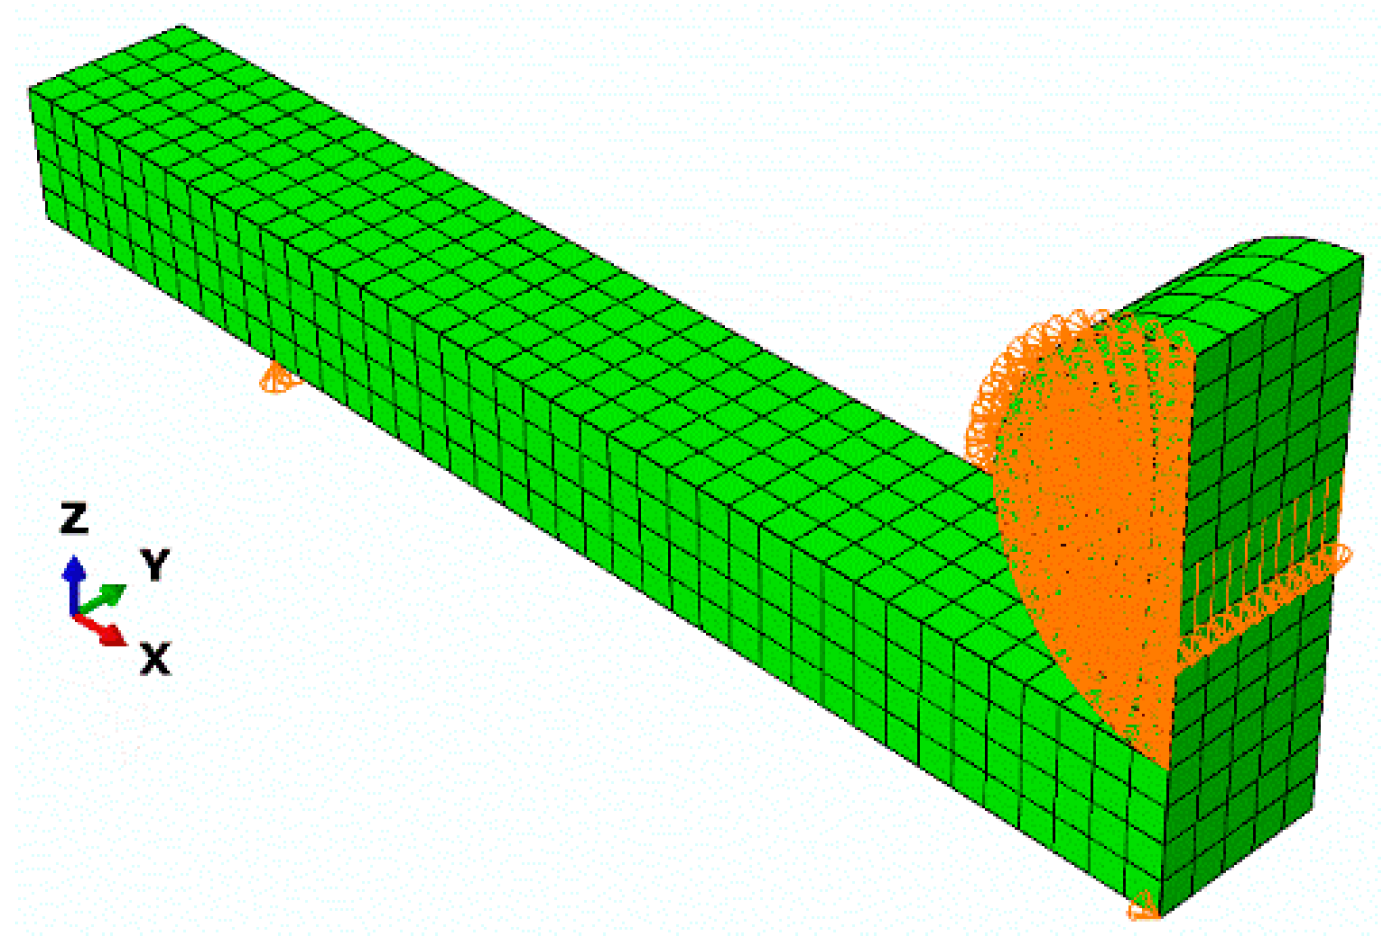
3.1. Three-Point Bending Model

A numerical model was developed to mimic the three-point bending test, taking advantage of geometrical and material symmetry, counting the actuator (Figure 9). Non-linear geometrical analyses were accomplished usinga model composed of 1070 20-node quadratic brick elements with 5896 nodes.
According to the mechanical test, boundary conditions (including symmetry) were imposed, and a vertical displacement of 5.0 mm was prescribed. The orthotropic behaviour of PLA-layered structures (Figure 3b) was modelled by taking each layer’s thickness and filament orientation into account. Regarding 0°/90°, the first layer was oriented at 0°, the second at 90°, and the remaining ones resulting from the copies of these two. For a total of 40 layers in 4 mm (h in Figure 2a), the thickness and height of each layer were set to 0.1 mm. PLA specimens (structures) were modelled for orthotropy taking into account the elastic properties E1, E2 = E3 (found experimentally in the section that follows), υ12, υ13, υ23, G12, G13, and G23 (Table 4). In order to replicate the mechanical behaviour of steel, elastic isotropy was taken into consideration for the actuator (E = 210 GPa, n = 0.3) [23].

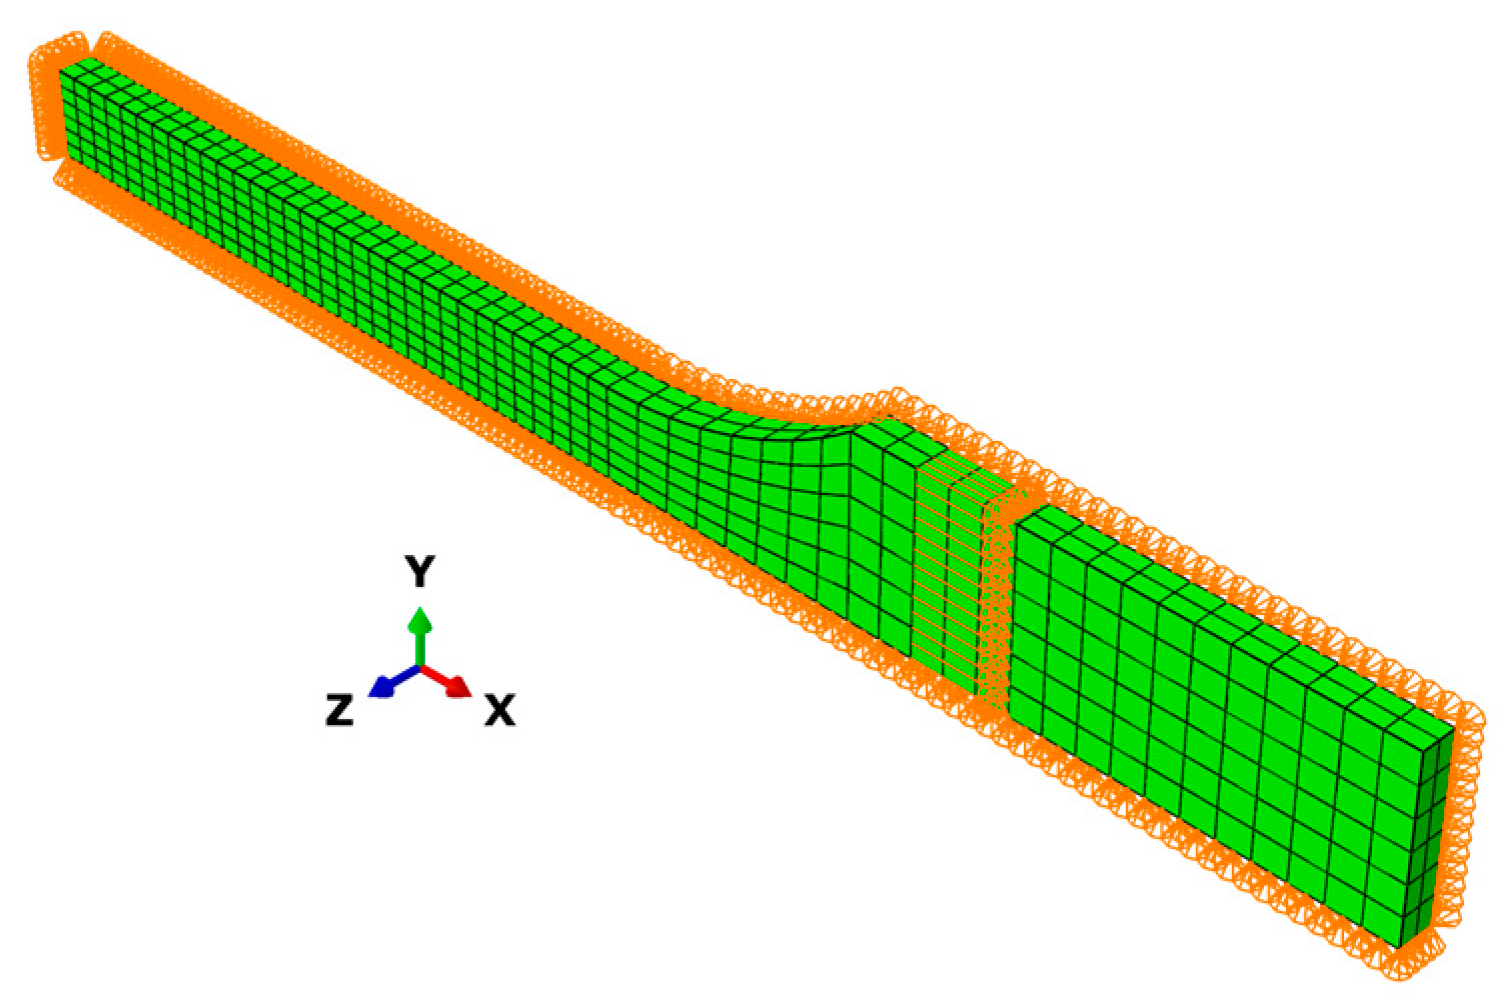
3.2. Tensile Test Model

Dogbone geometry was also simplified to a quarter model trying to decrease the computational cost. The 672 20-node quadratic brick elements were defined, with a total of 4197 nodes. Boundary conditions were defined to adequately mimic the mechanical test (Figure 8), with a vertical displacement of 5.0 mm (Figure 10). The orthotropic behaviour of PLA structures was mimicked using the same elastic properties as the TPB model.

4. Results and Discussion

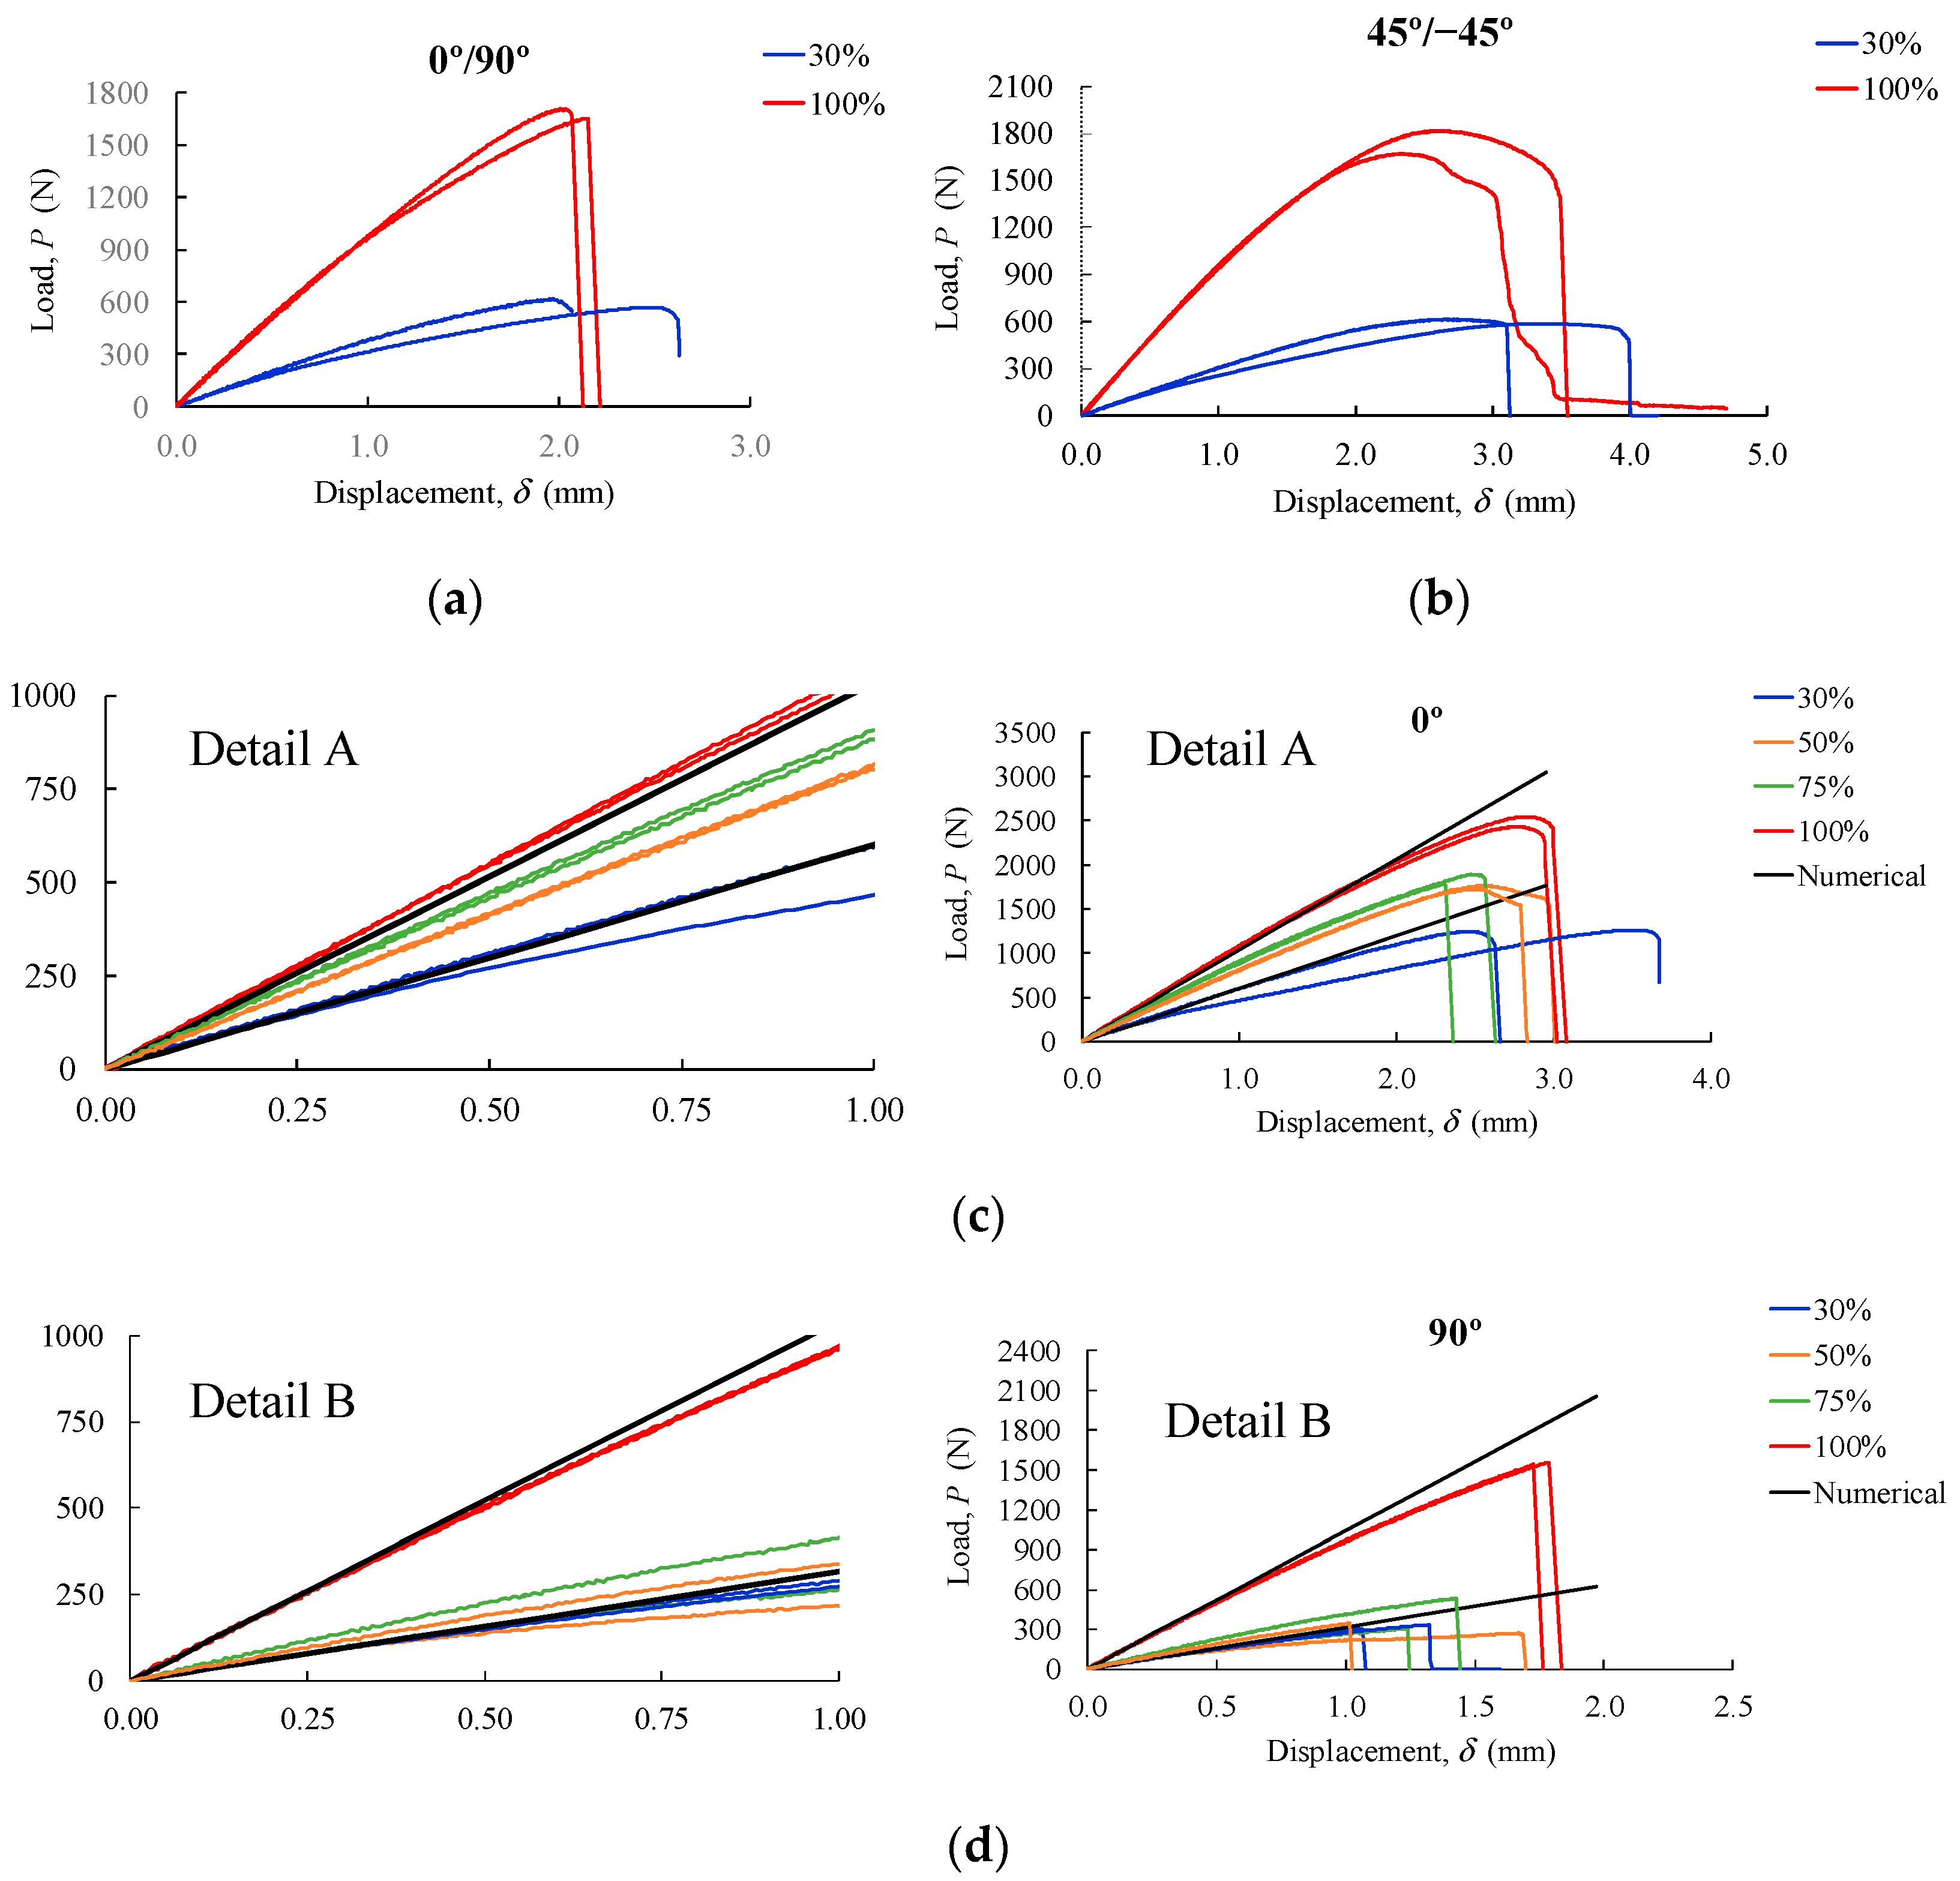
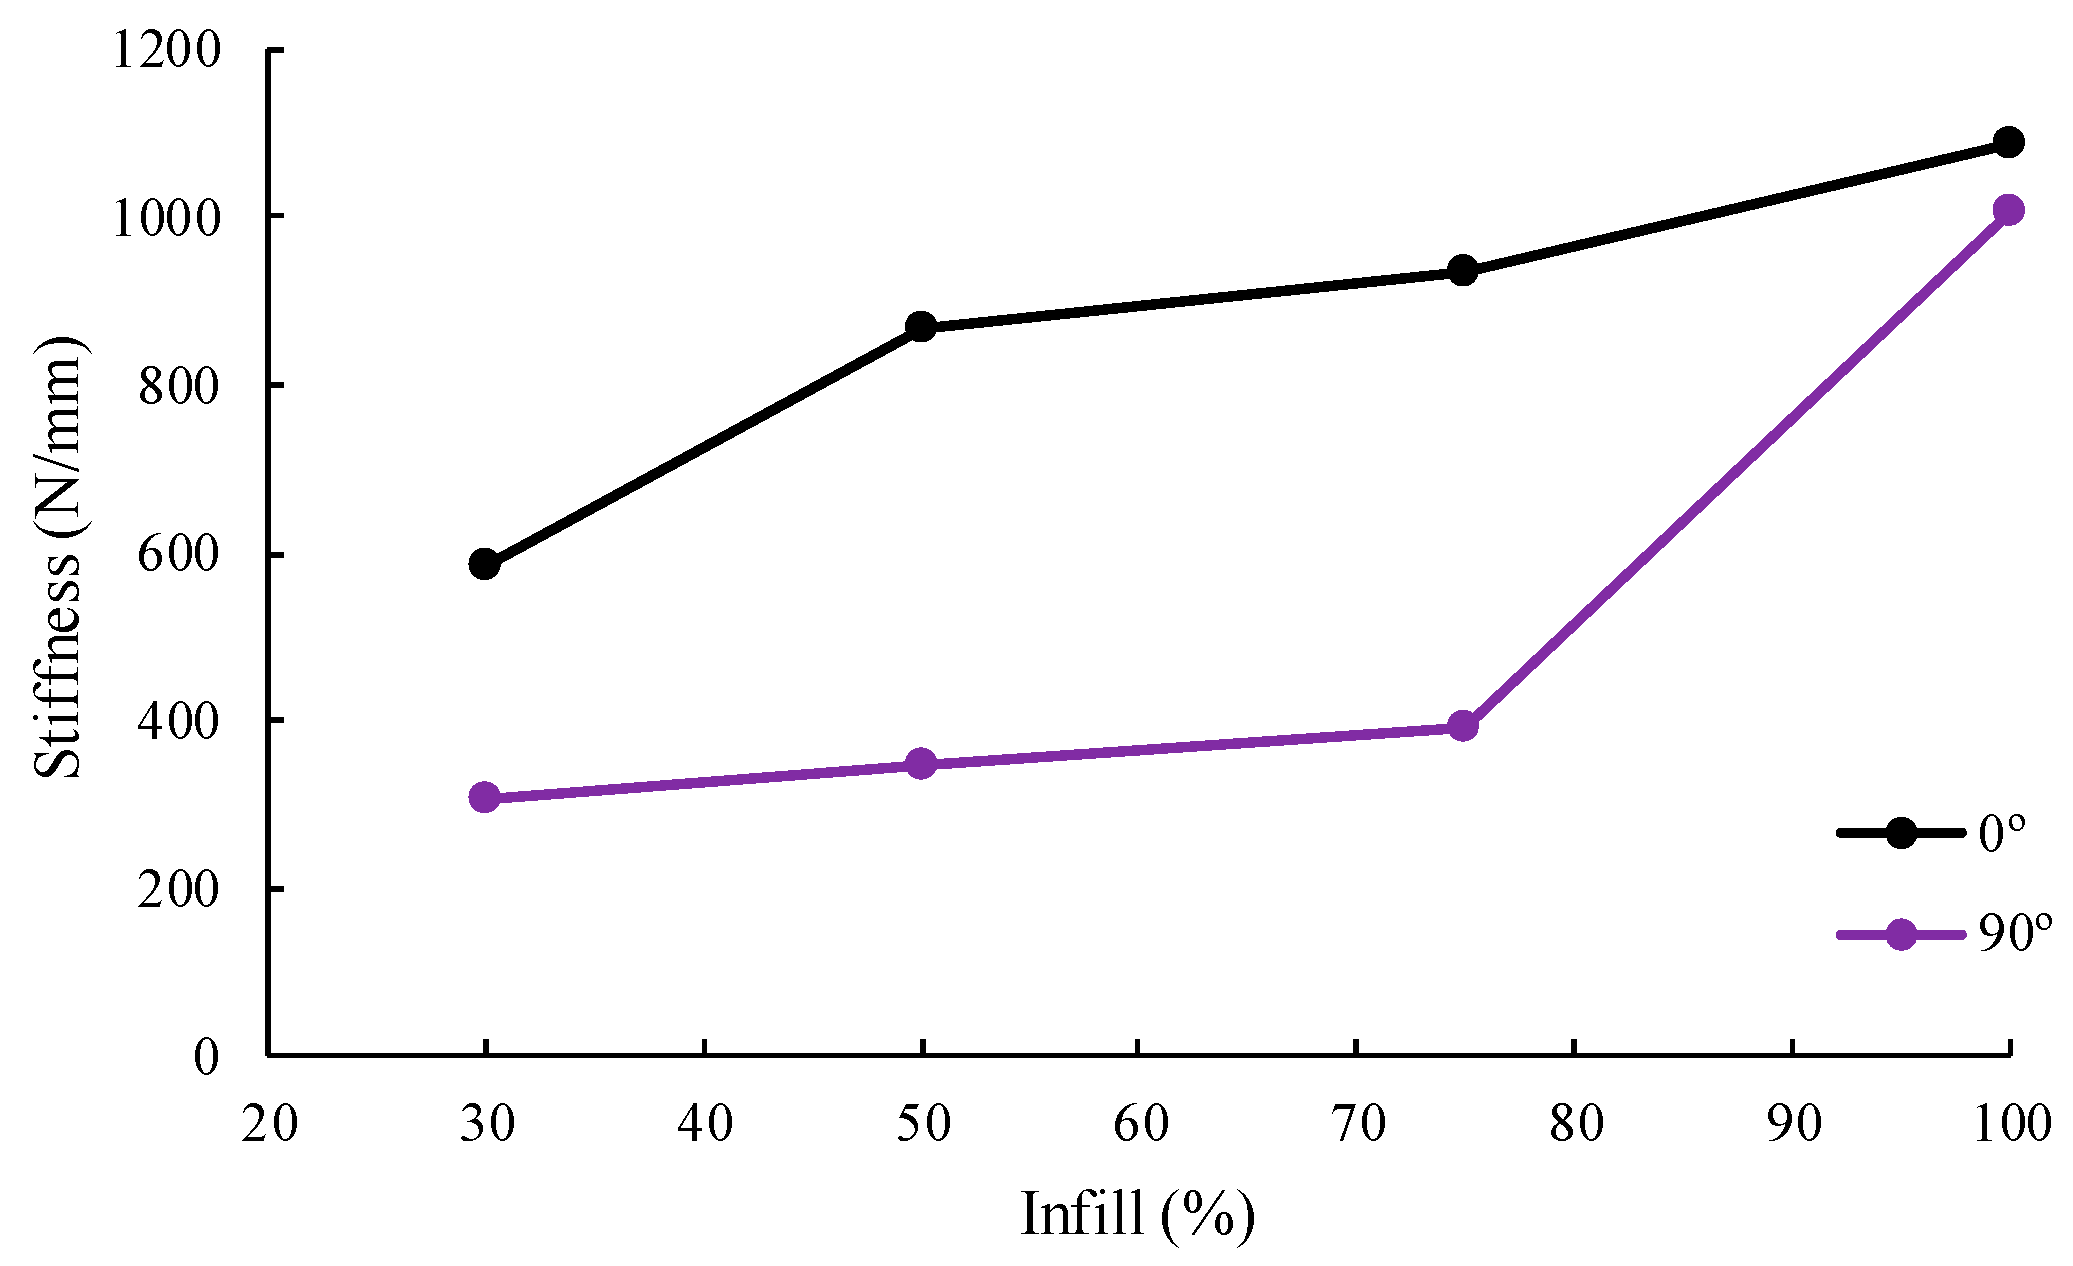
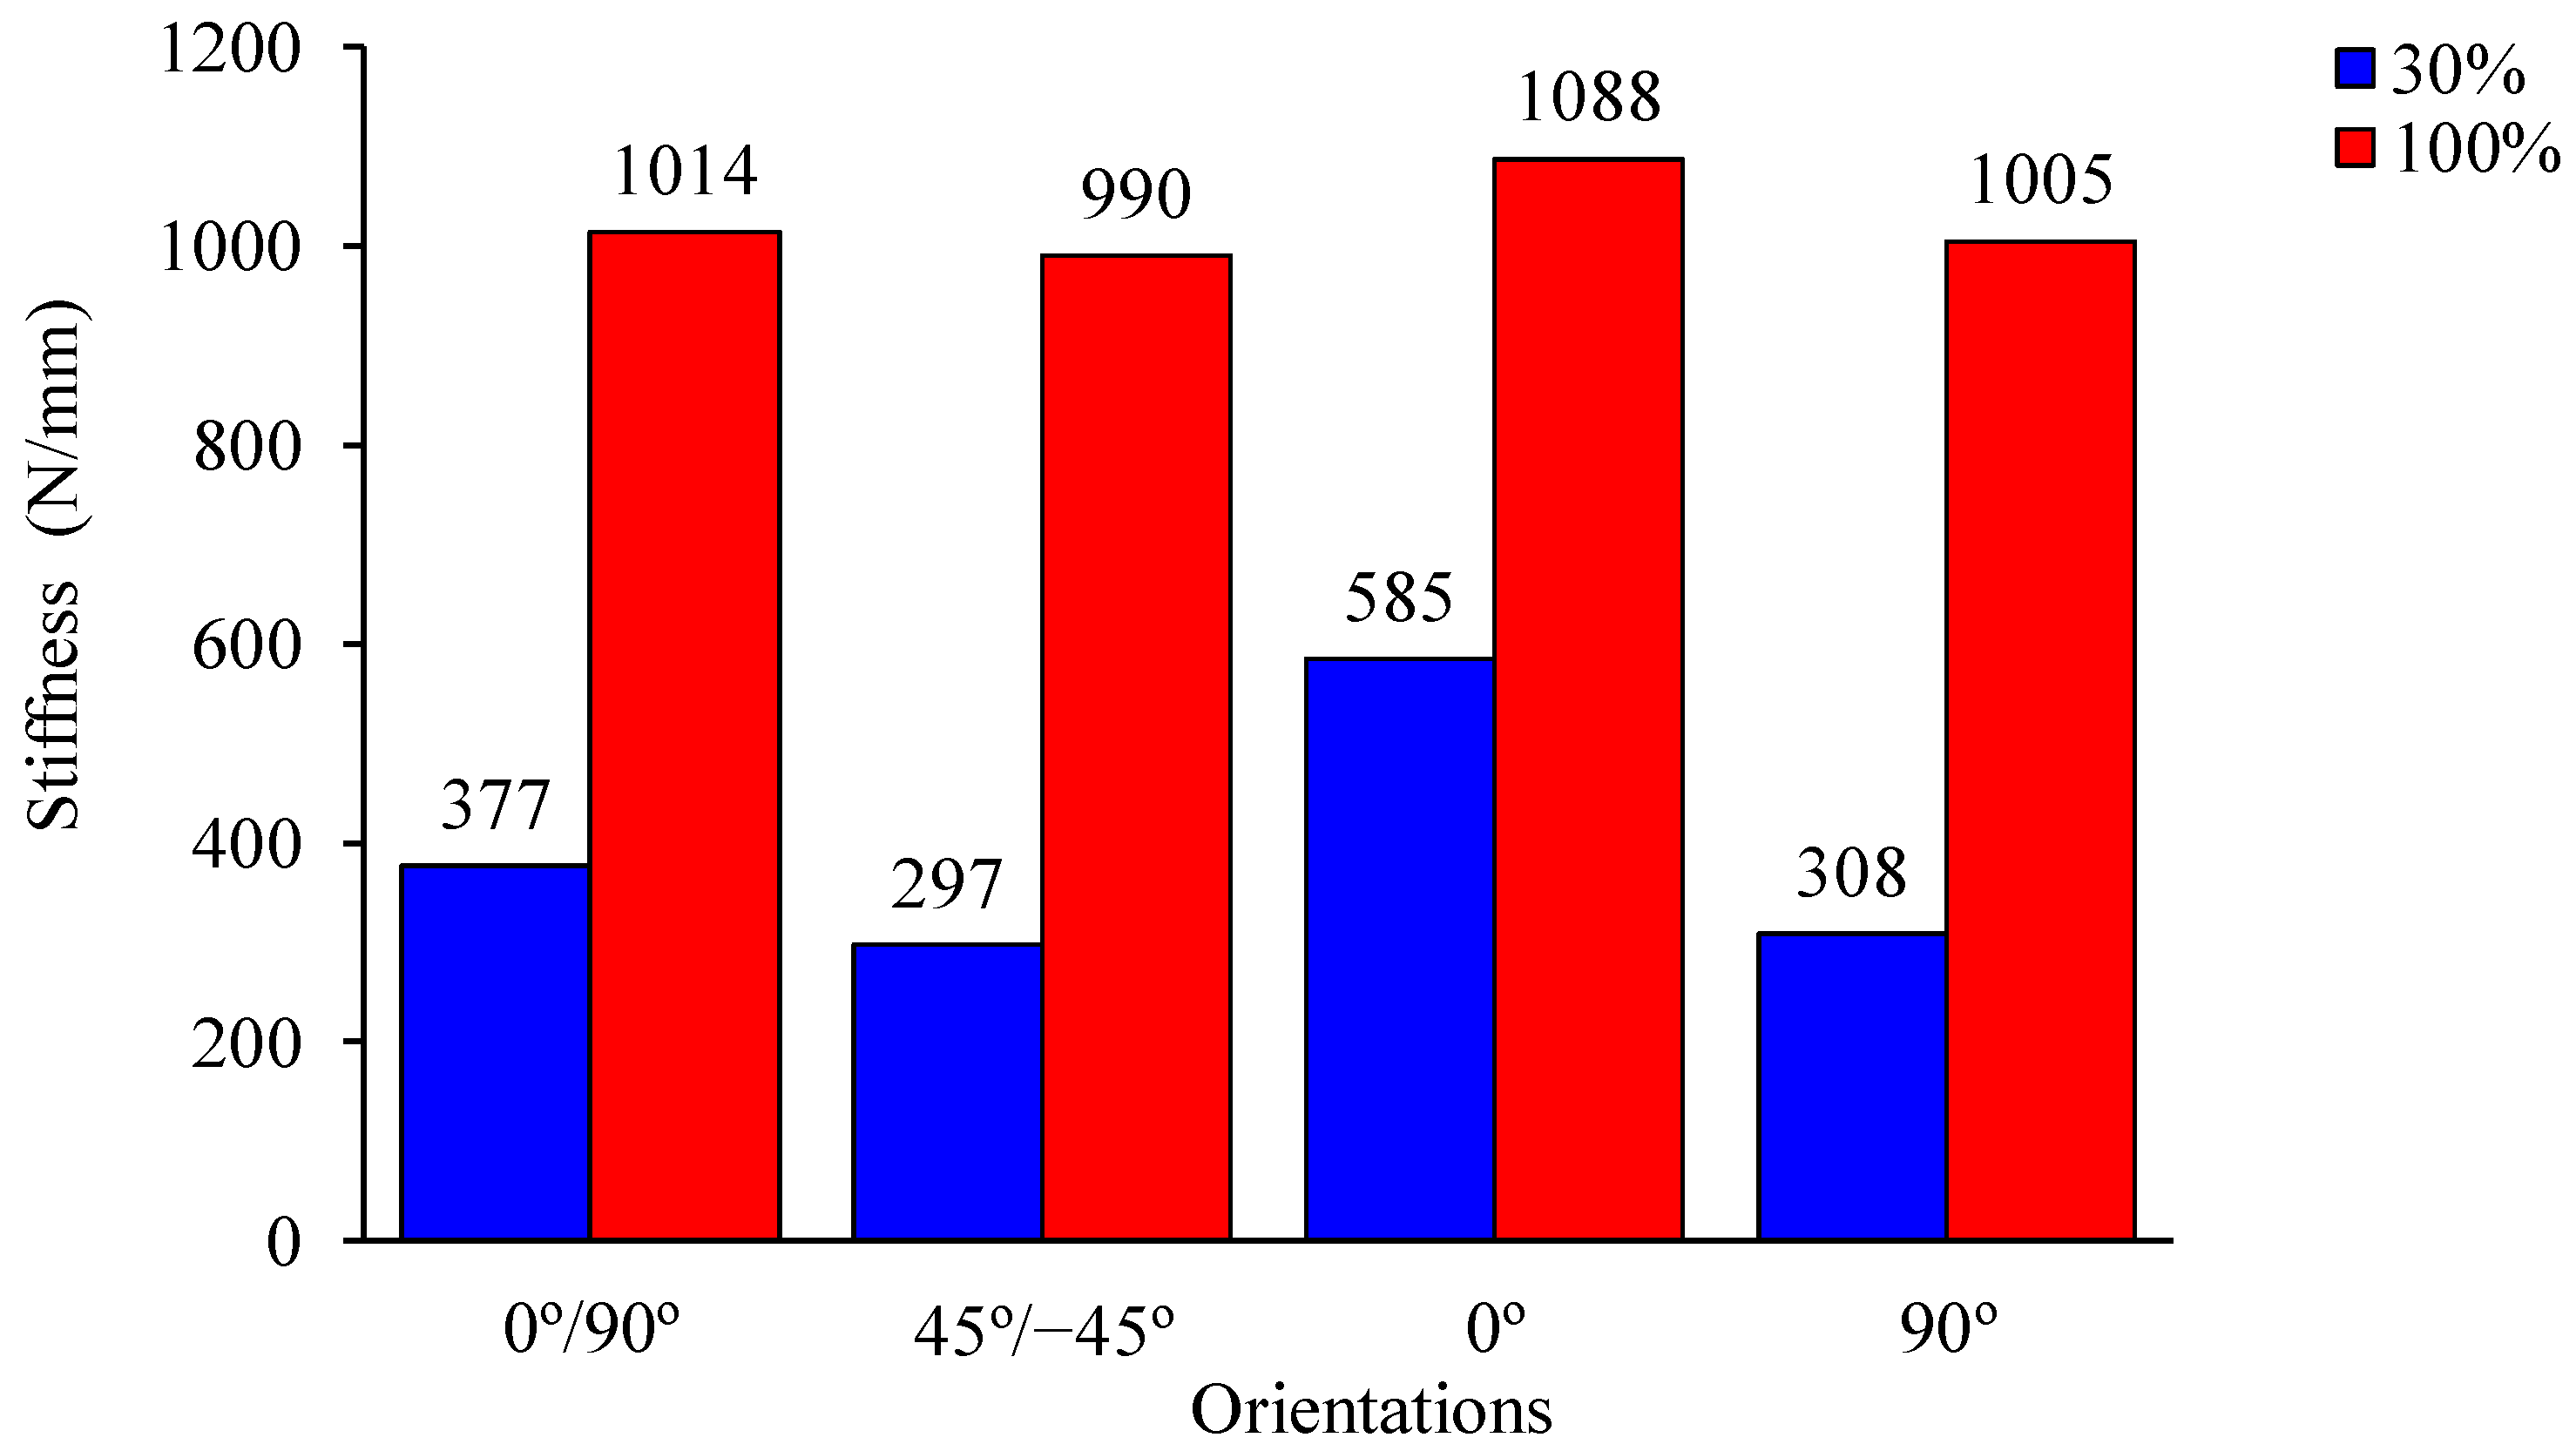
4.1. Three-Point Bending Tests
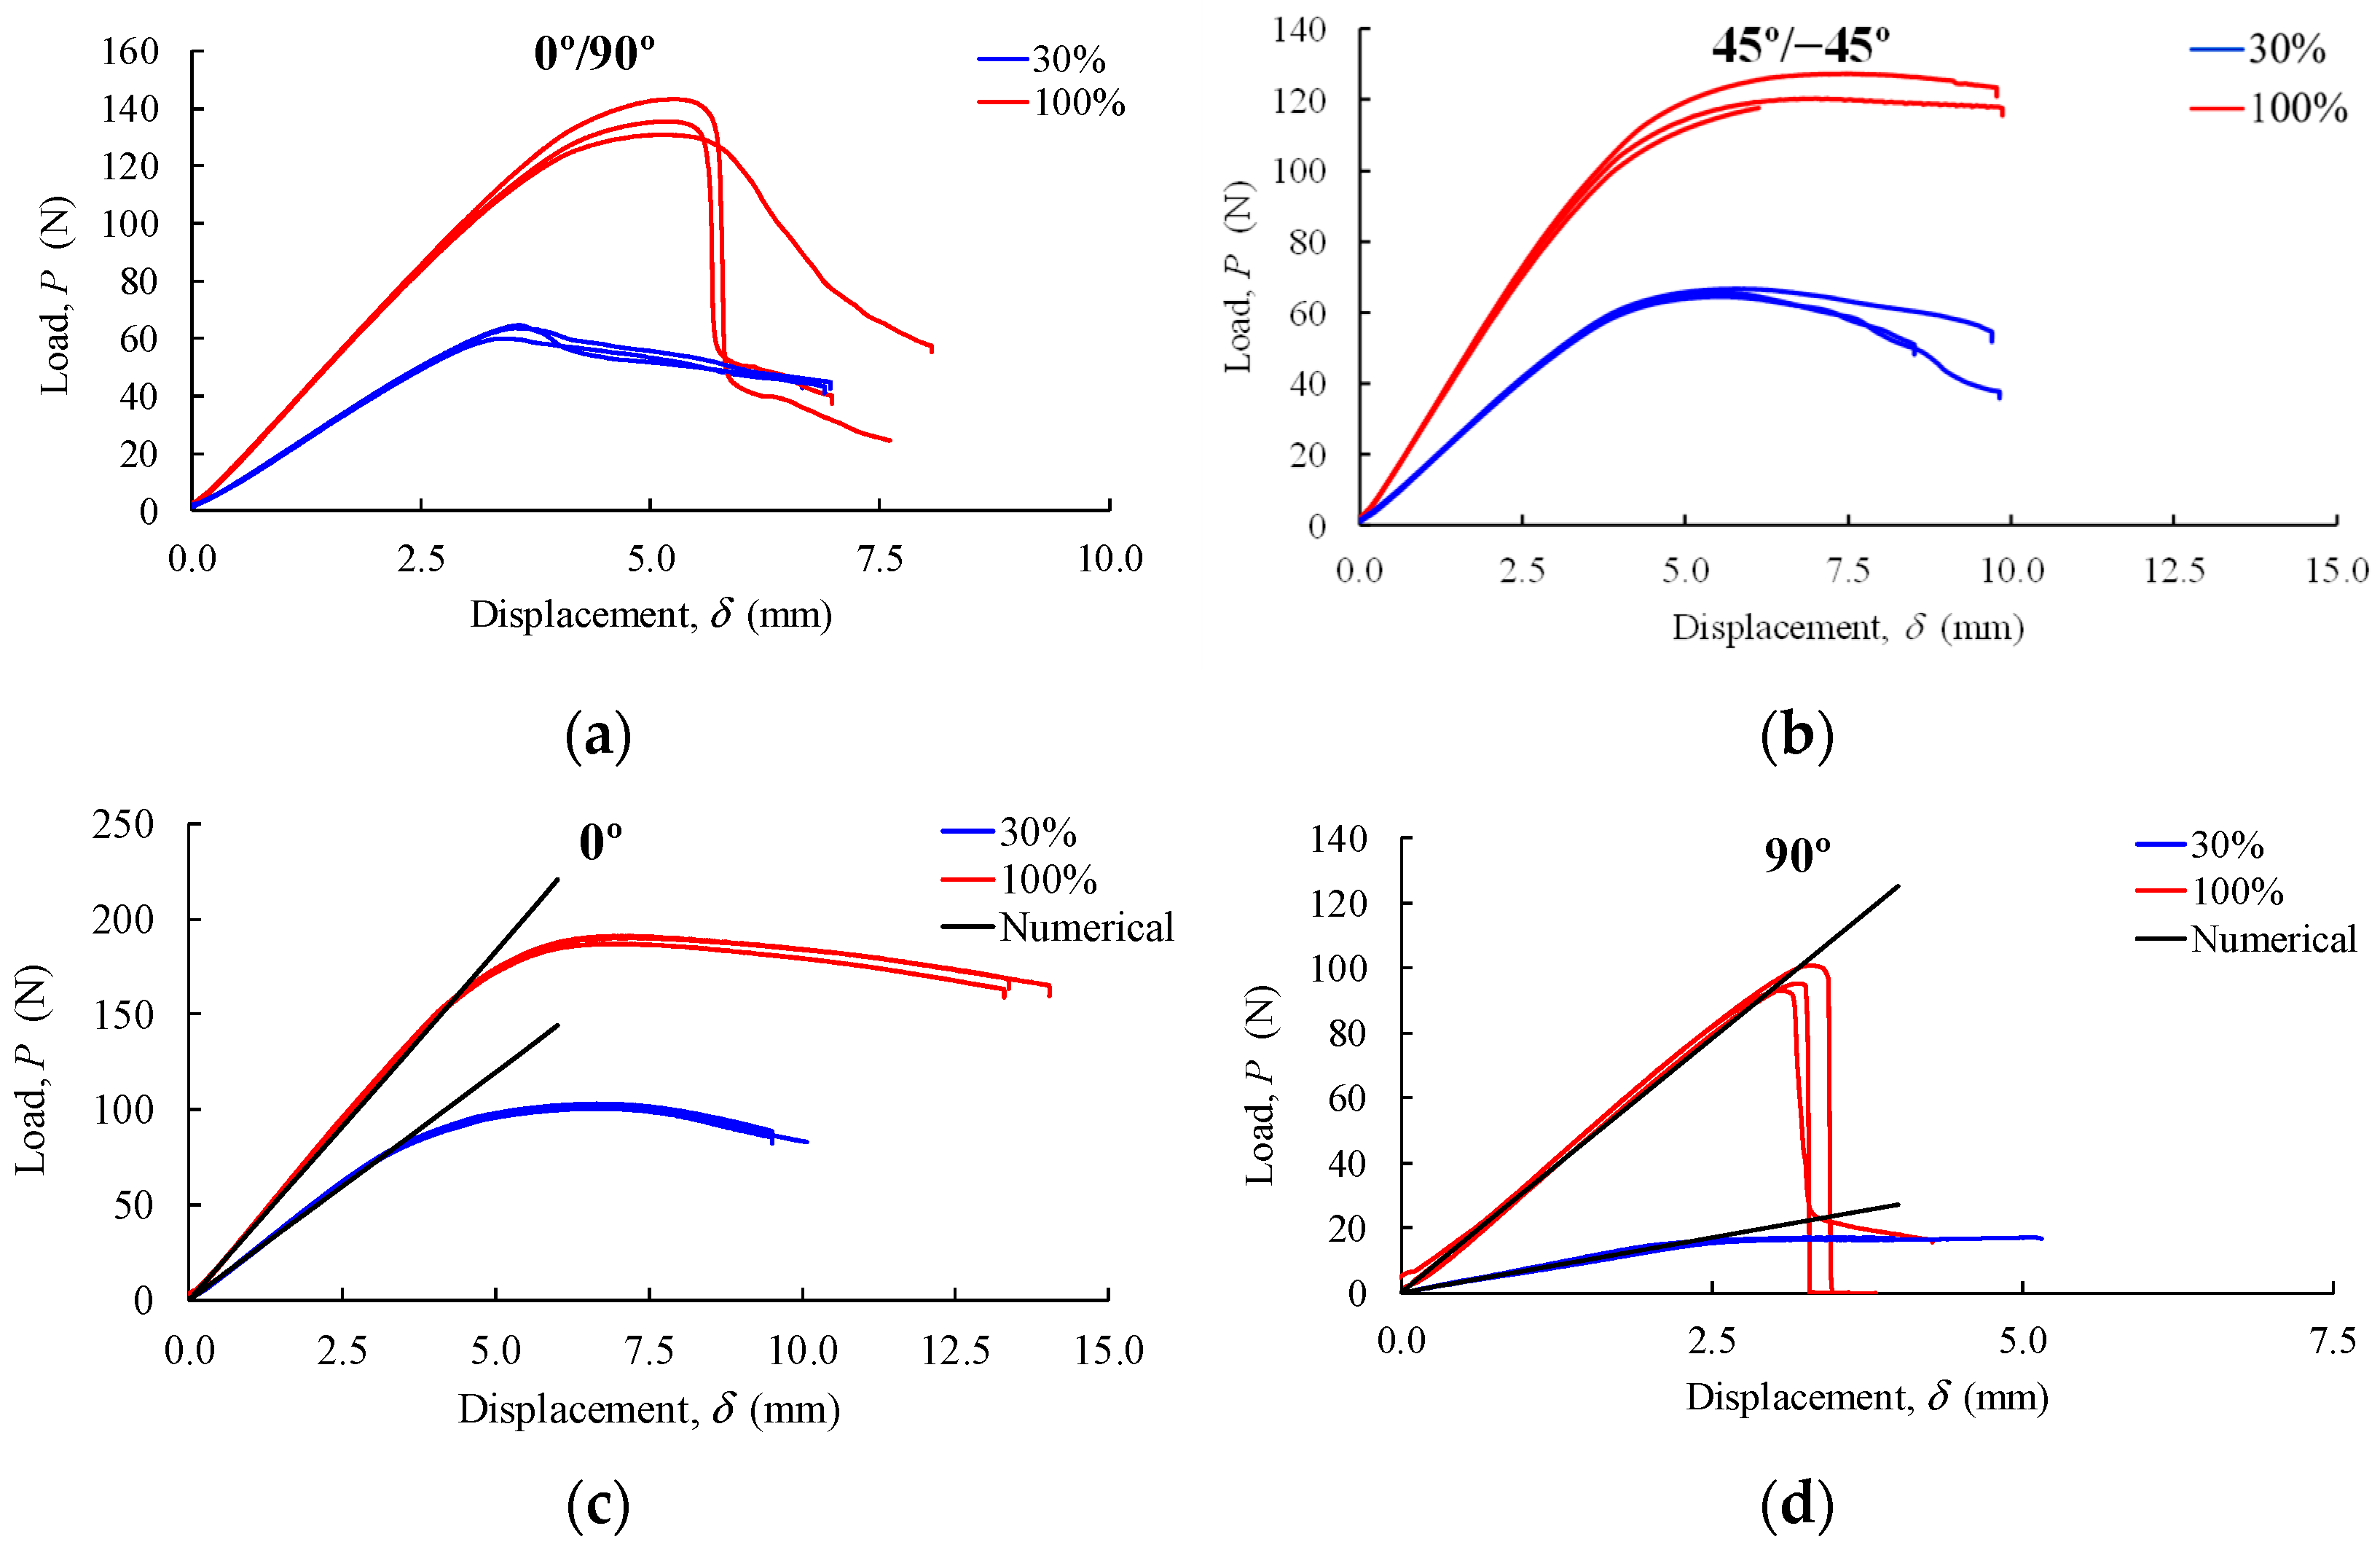
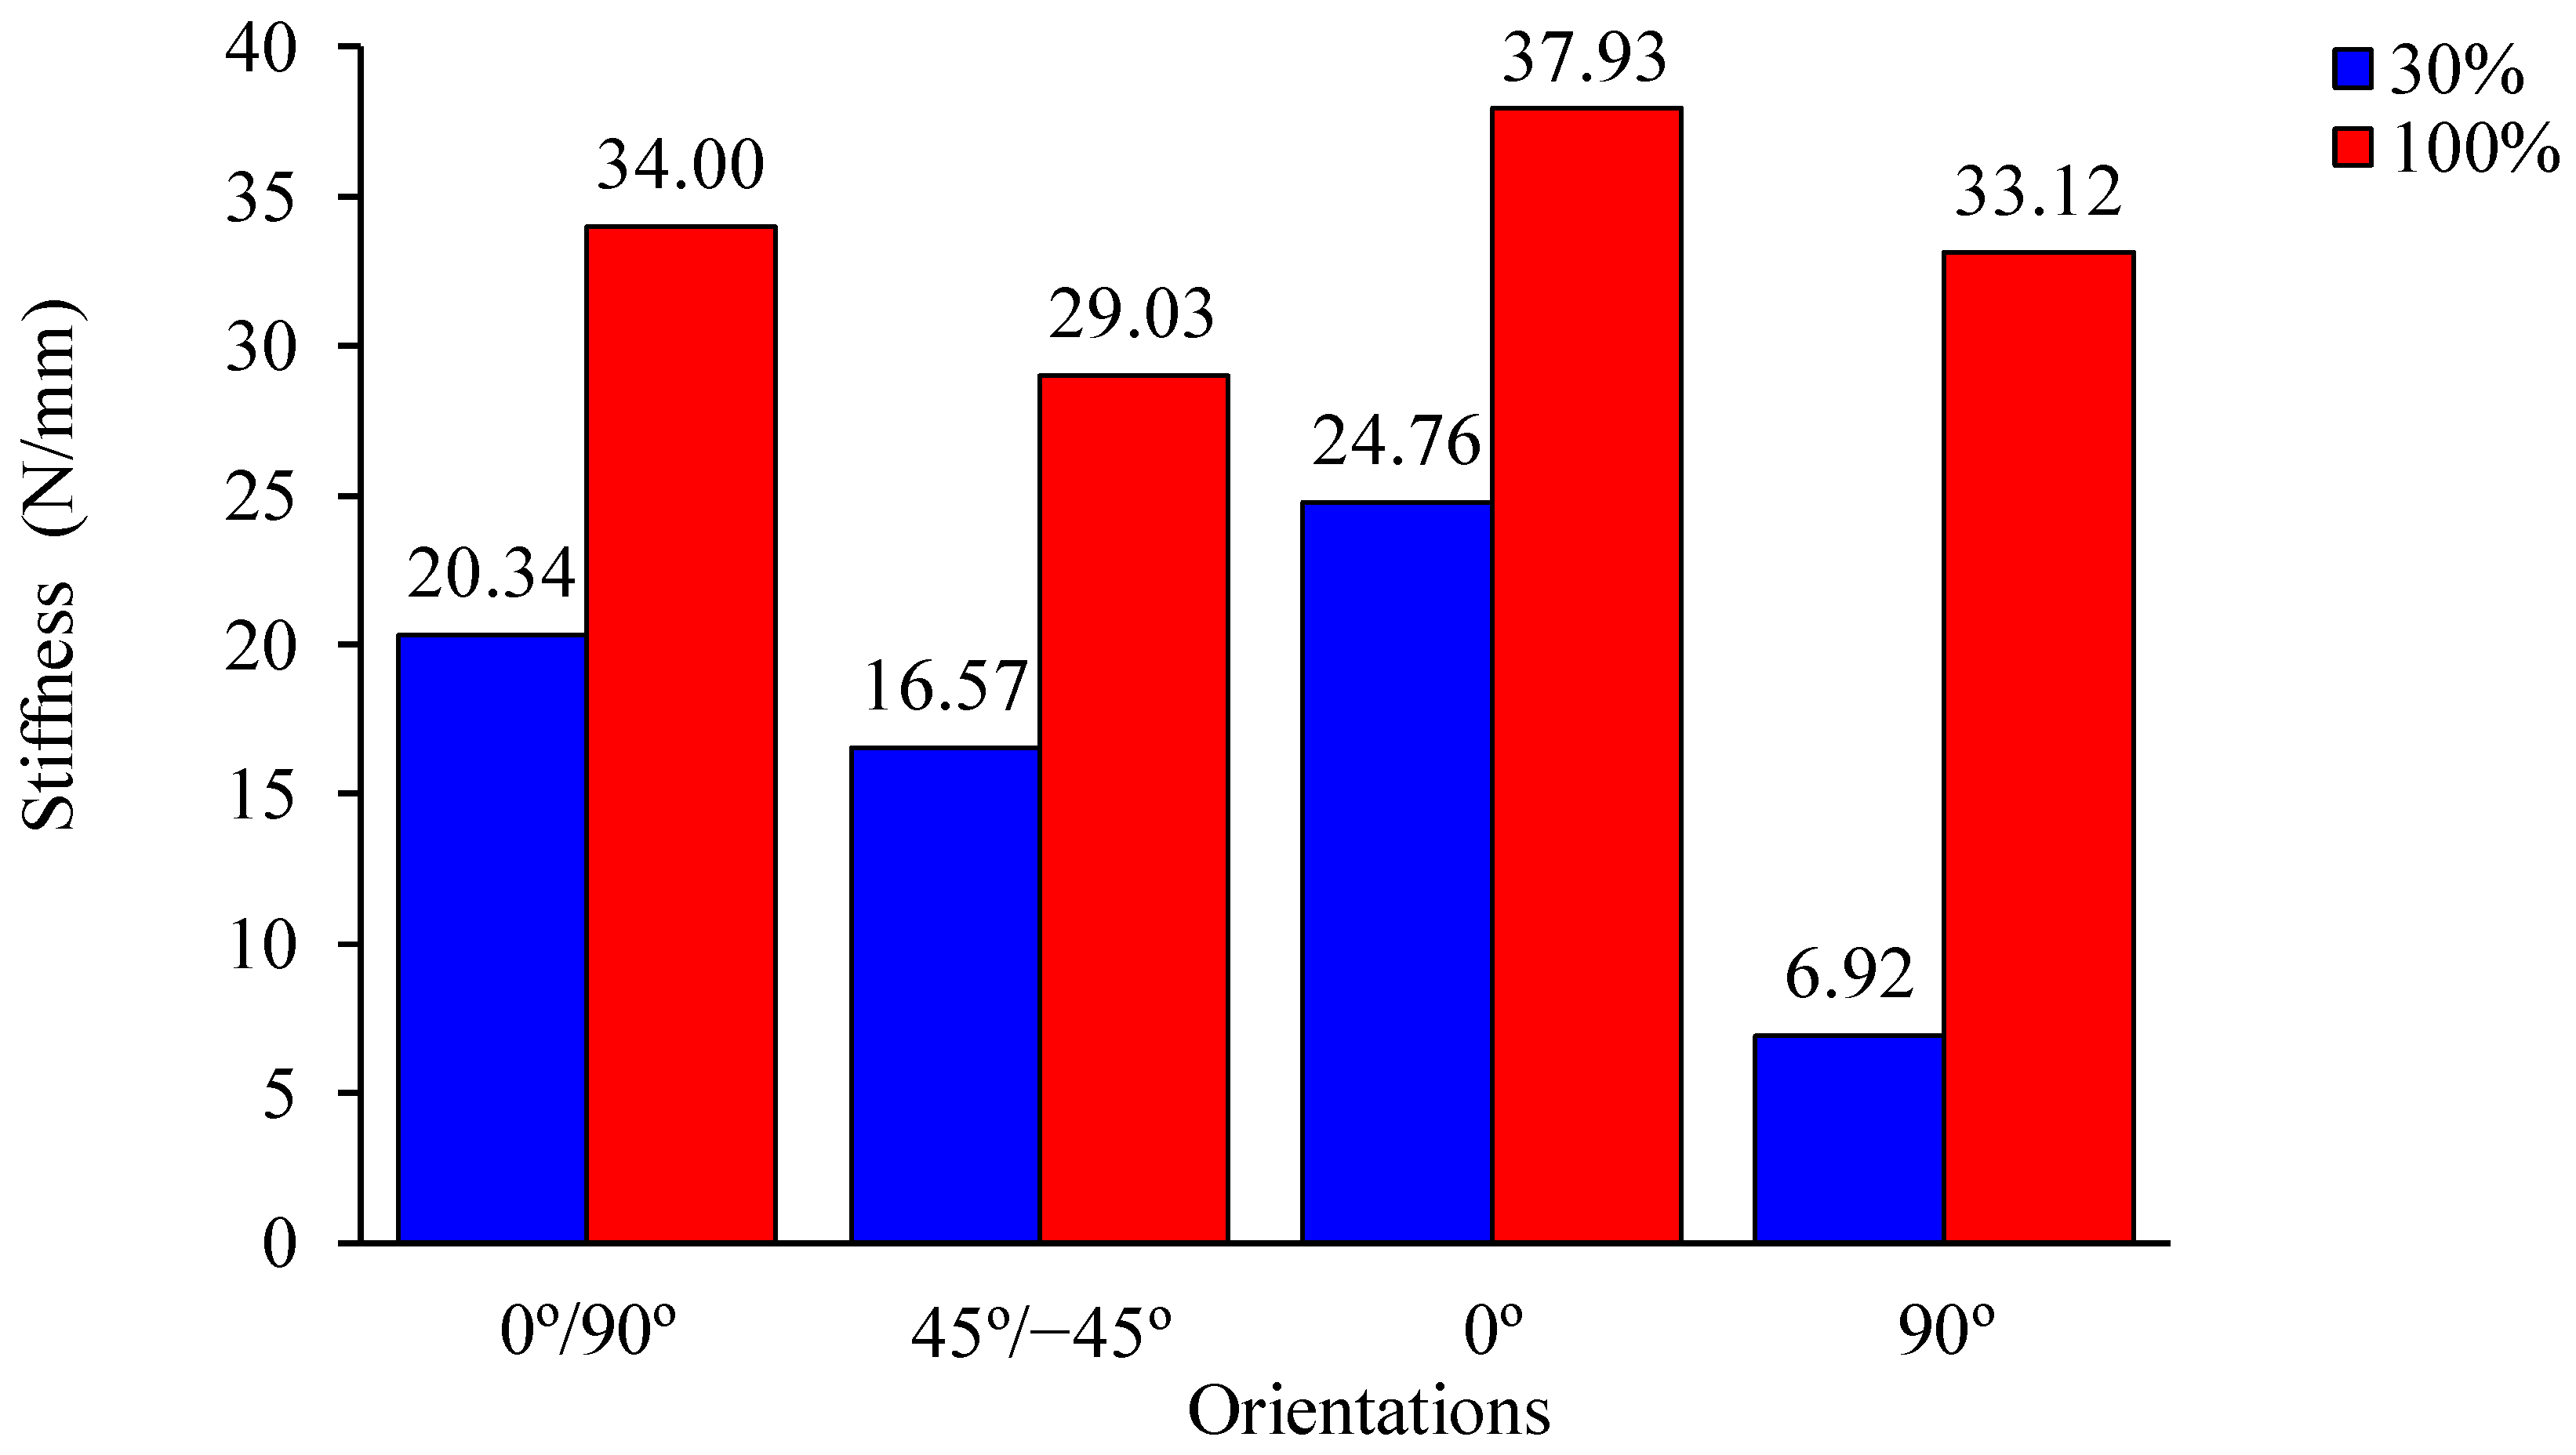
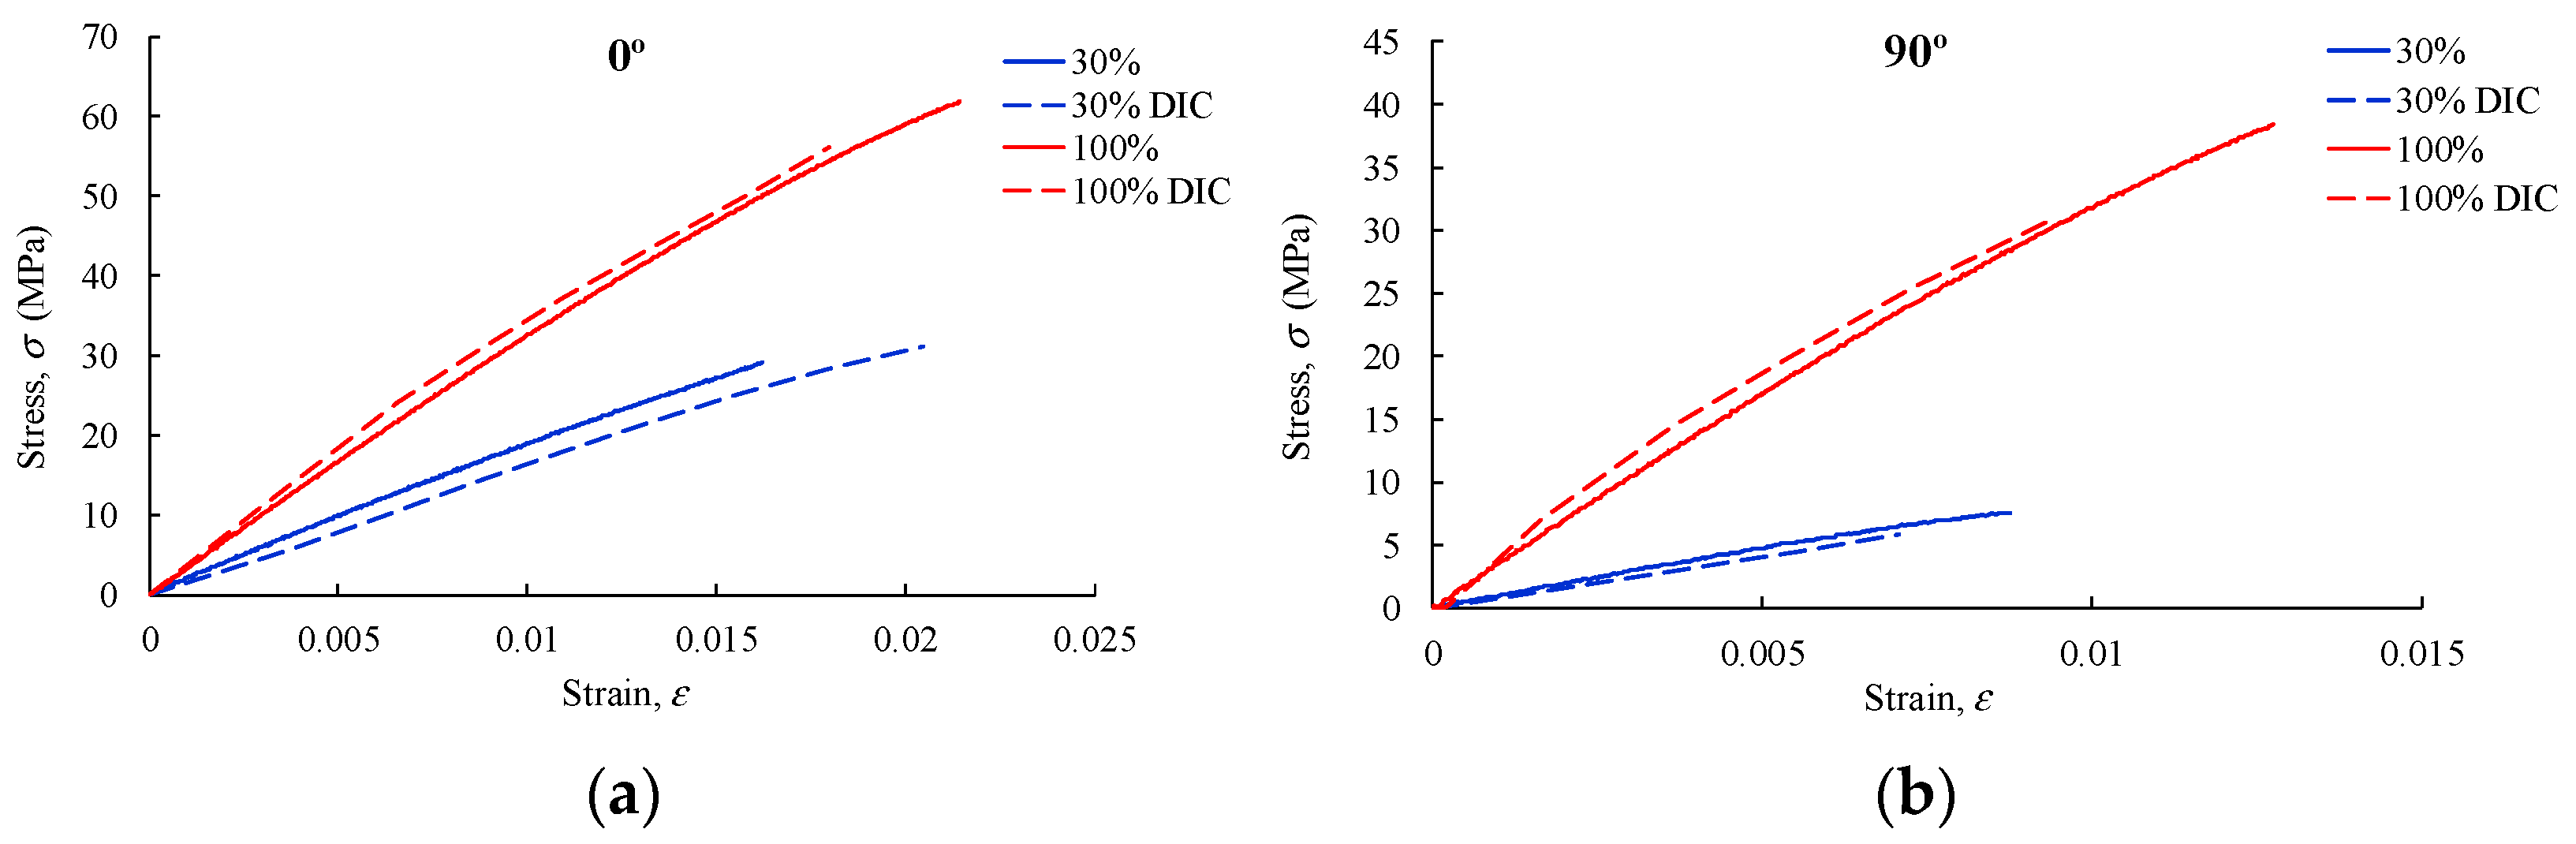
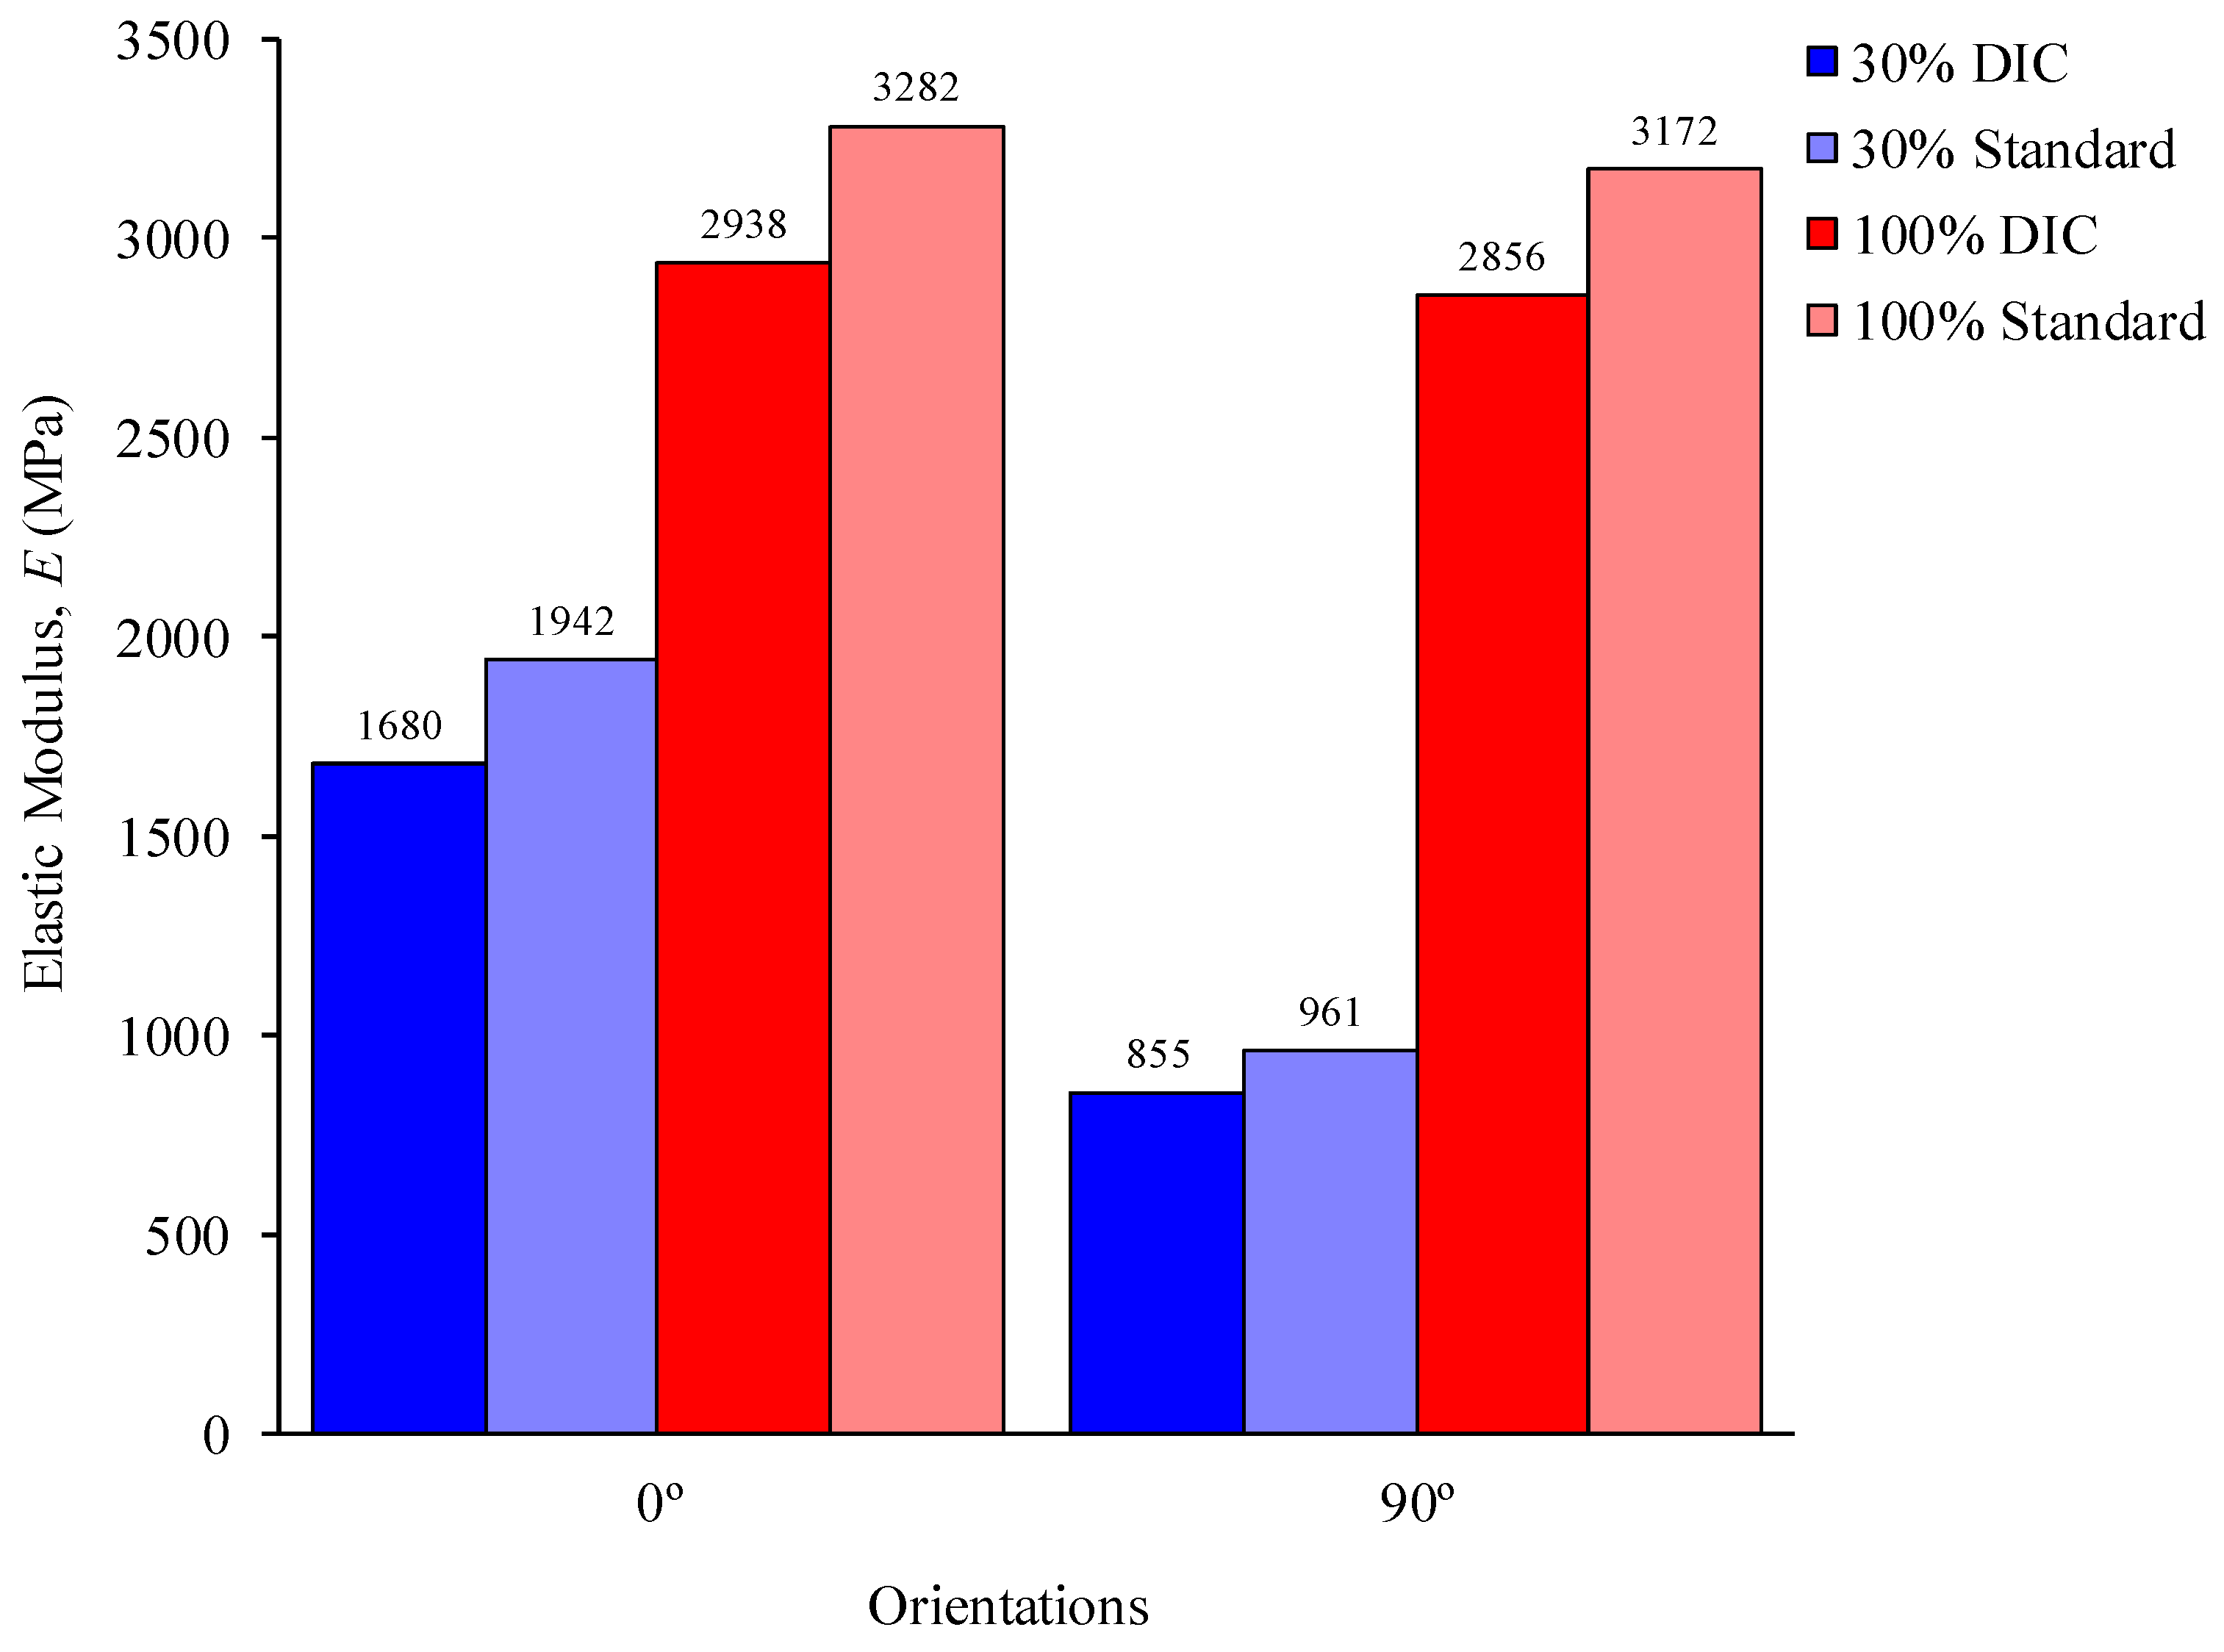
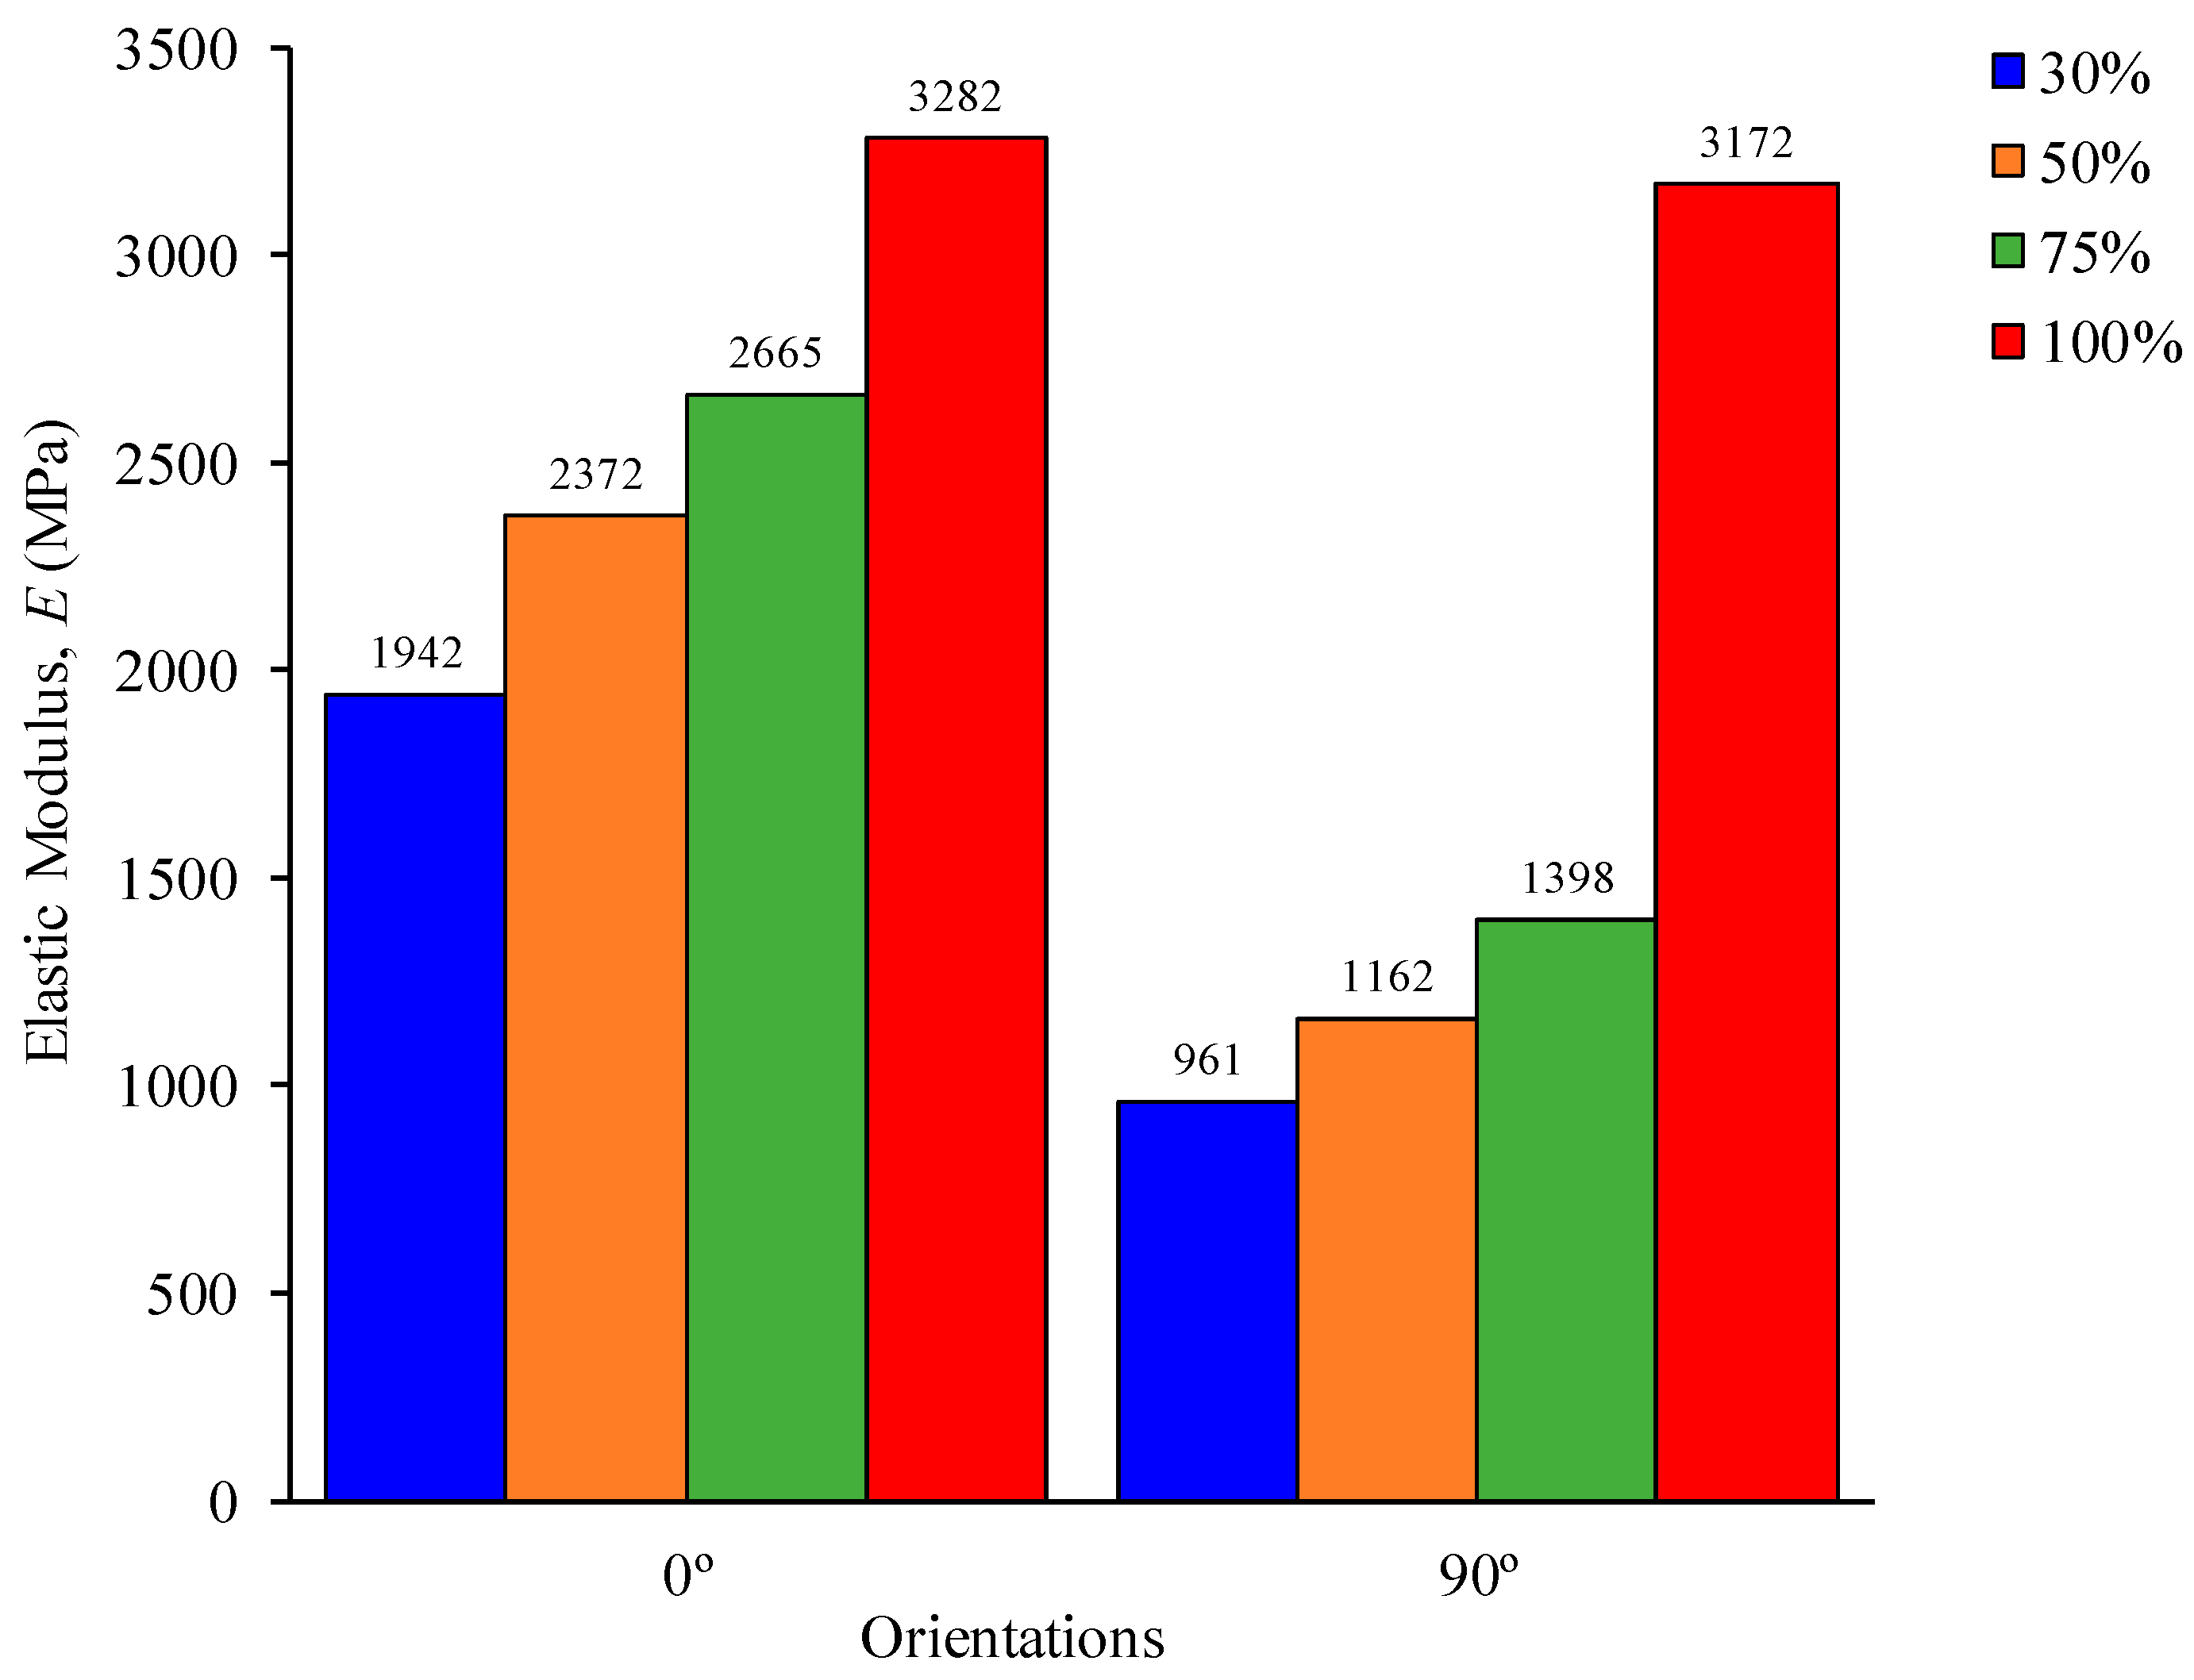
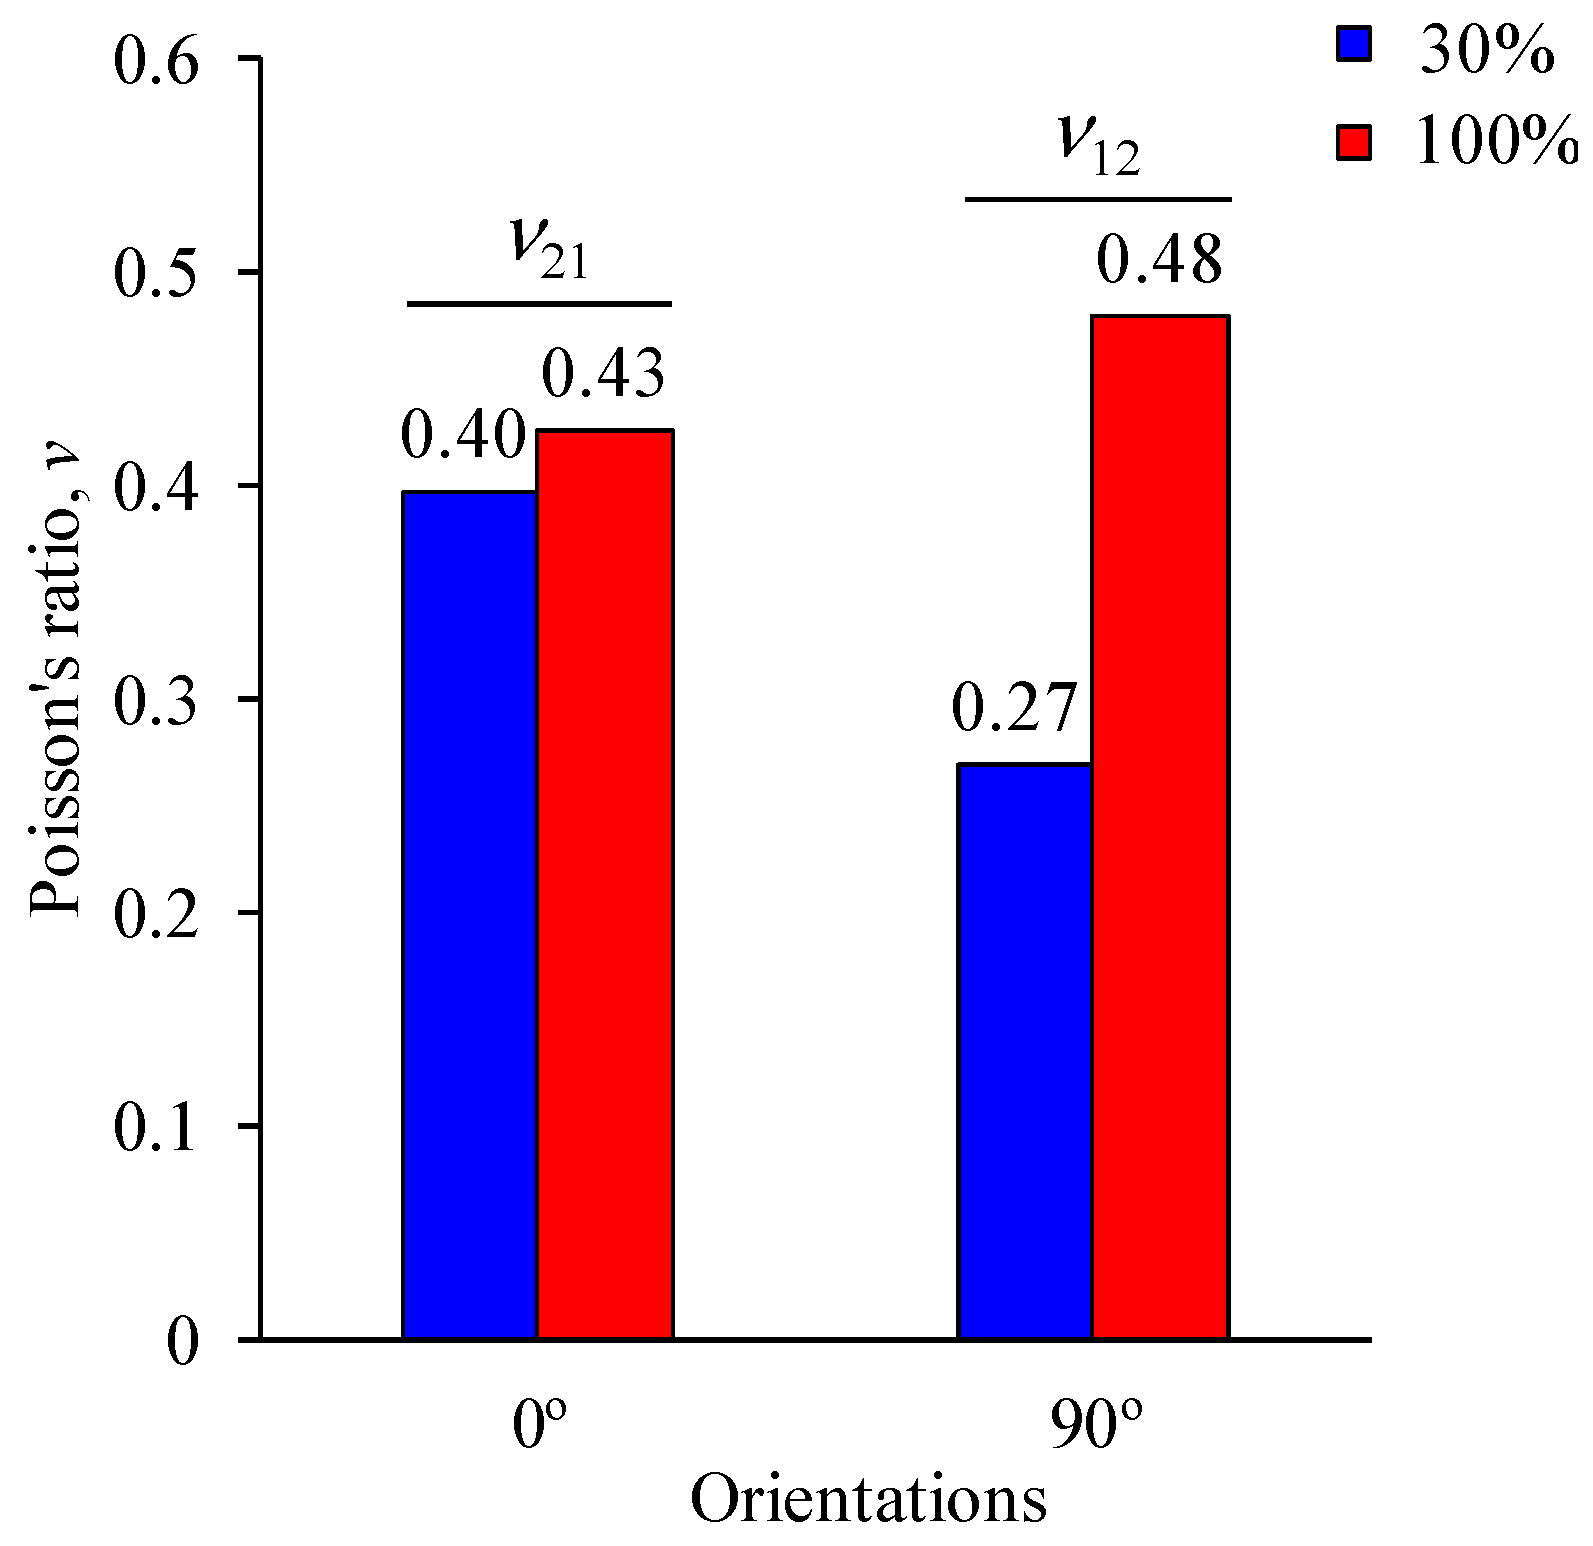
Load–displacement curves (Figure 11) showed an impressive degree of consistency for each processing condition (infill and orientation), both in terms of initial stiffness ( R 0 ) and ultimate load. This is the result of meticulous specimen preparation (implementing the same PLA coil), as well as extremely optimal conditions during the filament-making operation and the experimental work. Variances in the initial stiffness and ultimate load are perceived between processing conditions (0°/90°, 45°/−45°, 0°, and 90°, for 30% and 100% infill). Figure 11 and Figure 12 show the impact of infill percentage and filament orientation on the initial stiffness along the specimen longitudinal direction. The stiffness resulting from 100% infill is greater than that obtained for 30% infill, regardless of the orientation of the filament. The stiffness is found to reach its maximum value for the 0° orientation at 30% infill, and then to reach its lowest value for 90°, 45°/−45°, and the stacking sequence 0°/90°. This indicates that, if the infill percentage is set to 30%, an increase in stiffness of 258% is achieved when the filament is aligned with the load (0°) compared to the orientation 90°. With respect to the 100% infill, the referred order hardly varies for 90° and 45°/−45° orientations. For the orientation 90° and 100% infill, this variation can be explained by the presence of a more extensive and pronounced filament fusion, which is not confirmed for the 30% infill.

4.2. Tensile Tests

Figure 13 shows the set of load–displacement curves attained in tensile tests using different orientations of filament (0°/90°, 45°/−45°, 0°, and 90°) and infill percentages (30%, 50%, 75%, and 100%). The results show excellent reproducibility for every printing condition once more, indicating steady conditions for material production and meticulous preparation of test specimens. The filament orientations clearly differ from one another, especially in terms of the percentage of infill. With reference to the load orientation, P, the stress–strain curves from specimens with filaments oriented at 0° and 90°, respectively, were used to determine the elastic moduli E1 and E2.
According to Table 5, the initial stiffness (R0) and ultimate load (Pu) increase with infill percentage as well as filament alignment with the loading axis (from 90° to 0°). Despite the filament orientation, the stiffest structure is always the one with 100% infill (Figure 14). The smallest stiffness, on the other hand, is always the one corresponding to 30% infill, independent of the filament’s deposition orientation. The stiffest specimens have 100% infill and are oriented at 0°, while the most flexible have 30% infill and are oriented at 45°/−45°.
Additionally, filaments oriented at 0 degrees show a gradual increase in stiffness, whereas orientations at 90° and 100% infill show a more pronounced increase in stiffness in comparison to the remaining infills. Similar behaviours may be noted for the ultimate load.
Another point worth mentioning is the ductile behaviour observed for structures oriented at 45°/−45° and 100% infill, which contrast with the remaining ones that exhibit a more brittle nature (Figure 13b). A filament that is equally oriented relative to the loading axis could explain this behaviour. In contrast to the ductile behaviour, specimens with 90° oriented filaments are clearly brittle (Figure 13d). A reasonable explanation for the referred brittleness could be due to the sudden initiation and propagation of damage at the filament interface, which in this case is perpendicular to the load direction.
For the combined orientations, i.e., 0°/90° and 45°/−45°, the stiffness should appear in the range obtained for the principal directions 0° and 90°. As Figure 15 shows, it is not possible to estimate the elastic response of 3DP PLA for combined orientations (e.g., 0°/90° and 45°/−45°) using test results obtained at 0° and 90°. It is confirmed that for 100% infill this behaviour is not verified.
Using the DIC technique, full-field measurements of strain were carried out in both the x and y directions in the specimen’s central region (Figure 2b), displaying uniform measurements in the linear–elastic domain. The strain field in the x-direction obtained in the linear–elastic domain at three loading points on the stress–strain curve’s ascending branch is displayed in Figure 16.
Furthermore, in specimens for which DIC measurements were not performed, a strain gauge was employed within the service length l 1 for 30% and 100% infill, for all filament orientations (Figure 17). Although DIC is a more time-consuming technique compared to the employment of a strain gauge, it allows verifying whether the strain-field in the specimen central region is homogeneous. This technique was applied to a limited number of specimens, namely those with extreme values of infill (30% and 100%), since in those conditions it is possible to reveal more notorious mechanical differences in the material mechanical response. For the remaining specimens, with infill percentages of 30%, 50%, 75%, and 100%, the less time-consuming technique (strain gauge) was employed. The plotted curve for the strain gauge data was created by taking mean values into consideration. Once more, it is evident that the outcomes are highly consistent with one another. There is a discernible variation between the infill percentages, as would be predicted based on earlier findings. Effectively, more compact structures (100% infill) have higher tensile strength and elastic stiffness than less compact ones (30% infill).
The elastic modulus (E) was then obtained for filament orientated at 0° and 90° (Figure 17). One can notice that the obtained value of E is slightly higher in tests using a strain gauge (standard tests) compared to those carried out with DIC (13% on average). However, the latter technique yields more information (full-field measurements) than the former, based on measurements conducted in two specimen sections (gauge fittings).
Figure 18 reveals that the modulus of elasticity for 100% infill remains higher than that for 30%, regardless of filament orientation. Specimens with filaments oriented at 0° to the loading axis exhibit a higher elastic modulus than those oriented at 90°. Furthermore, differences among 30% infill are greater than those observed for 100% infill. A plausible reason for the behaviour observed for 30% infill in the orientation 0° may be due to a more effective contribution of the less constrained aligned filaments than the fully filled (fused filament) structures, i.e., 100%.
The elastic modulus was determined for filament aligned at 0° and 90° (Figure 19) thus enabling more precise analysis of the impact of the infill percentages (i.e., 50% and 75% infill, in addition to 30% and 100%), leading to E 1 and E 2 , respectively.
As a result, it was possible to determine that, for both orientations, the elastic modulus consistently increases with the infill percentage. Regarding the 90° filament orientation, only the first three infill percentages (30% to 75%) show a consistent trend, with the 100% infill showing a noticeably higher percentage. Again, the highest elastic modulus is obtained for the filament oriented at 0° (i.e., E 1 ) and 100% infill, while the lowest is obtained for 90° and 30% infill.
For the orientation at 90° (i.e., E 2 ), a less pronounced increase of the elastic modulus is observed in the infill interval 30–75%, compared to the one observed at 0° (i.e., E 1 ). In contrast to the remaining structures, the orientation at 90° exhibits a much more pronounced growth rate of E in the 75% to 100% transition than the orientation at 0°. This difference may be attributed to a greater amount of filament contact and a corresponding decrease in the percentage of air gap. It is possible to conclude that 100% infill structures are less affected by filament orientation than the others.
Poisson’s ratio values (nyx = −ey/ex) were measured for filaments oriented at 0° and 90° (n21 and n12, respectively), with 30% and 100% infill (Figure 20), i.e., structures evaluated with DIC. The result, that the Poisson’s ratio is lower in 30% infill than in 100% infill, is consistent with a more compliant structure when the number of filaments per unit volume is lower along the transverse direction (y-direction in Figure 2b). Figure 20 indicates that the orientation at 90° and 100% infill yielded the highest Poisson’s ratio value. This may be justified by the structure’s greater sensitivity to longitudinal loads resulting in transversal deformation for a considerable condensed material, i.e., 100% infill. Since less-compact structures (30% infill) exhibit more air gaps, such behaviour is not observed.

4.3. Numerical Modelling

For both the filament orientations of 0° and 90°, the elastic properties selected for the FE analysis to simulate the TPB test were meant to reproduce the initial stiffness R 0 that was measured experimentally (Figure 11). For the orientations 0° and 90° (Figure 11c,d), the values of the elastic moduli E 1 and E 2 were set to the ones obtained experimentally using Equation (1), taking into account the remaining parameters as in Table 4. The numerical approximation obtained was found to be reasonably close to the experimental data.
Analogously, DIC’s experimental results were used to set the elastic properties that were used to simulate the tensile test. Replicating the experimental elastic stiffness with accuracy, a distinct linear response (P-d curve) was obtained (Figure 13c,d). Notably, the obtained numerical agreement suggests that the elastic modulus of this material can be accurately determined using an inverse method that solely relies on the load–displacement curve.

5. Conclusions

Three-point bending tests were adopted to evaluate the initial stiffness of polylactic acid (PLA)-made parts obtained using material extrusion (MEX). The orientations of the tests were 0°/90°, 45°/−45°, 0°, and 90°, with 30% and 100% infill. Both the infill percentage and the measurements related to the filament orientation showed consistent variations. These results led to the conclusion that stiffness measurements in PLA parts are dependent upon the percentage of infill, specifically within the range of 30% to 100%. Apart from the previously mentioned experimental protocol, tensile tests were carried out using standard procedures (strain-gauge) for the studied orientations, with additional infill percentages in the range of 30–100% for filament oriented at 0° and 90°. To assess the elastic properties (Young moduli), digital image correlation technique (DIC) was used due to the accuracy of those methods depending on the homogeneity of the strain field. The subsequent findings demonstrated that using standard operating procedures made it possible to measure elastic properties accurately. Standard methods were then used to assess the influence of the infill on the elastic moduli for the investigated filament orientations in greater detail. This study also demonstrated that the failure mode (ductile or brittle) in 3D-printed PLA parts under tensile loading is determined by the filament arrangement (combined orientations) rather than the infill percentage. Remarkably, the effect of material orientation on the elastic modulus with regard to the loading axis can be determined more precisely using the uniaxial tensile test than is possible with the TPB test. Recognizing that TPB test results are highly sensitive to loading span provides a very plausible explanation for this. In addition, the elastic modulus was shown to increase with the infill percentage regardless of filament orientation. A clear linear response (P-δ curve) was obtained by properly reproducing the experimental elastic stiffness. By achieving a strict numerical agreement on the P-δ curves that emerged from the experimental testing, the inverse approach provided for the numerical determination of the material’s modulus of elasticity.

Author Contributions

M.P.S.: Methodology, Investigation, Writing—original draft, Writing—review & editing. F.A.M.P.: Methodology, Software, Supervision. C.L.F.: Methodology, Conceptualization. E.B.P. and J.A.P.P.A.: Conceptualisation, Methodology, Software. T.D.C.: Data curation, Investigation. Q.N.: Formal Analysis. C.F.: Software. A.Z.: Funding acquisition, Investigation. N.D.: Conceptualisation, Methodology, Writing—review & editing, Supervision. All authors have read and agreed to the published version of the manuscript.

Funding

National Innovation Agency (ANI) for MSc grant of Mariana Salgueiro nº POCI-01-0247-FEDER-039733 and Portuguese Foundations for Science and Technology. This project was co-financed by European Regional Development Fund (ERDF) through SI&IDT Projects in the framework of co-hosting—Competitiveness and Internationalisation Operational Programme (CIOP)—COMPETE 2020, Portugal 2020, with the National Innovation Agency (ANI) as the Intermediate Partner. Fabio Pereira acknowledges the Portuguese Foundation for Science and Technology, under the project UIDB/04033/2020. Mariana Salgueiro and Andrea Zille acknowledge the European Commission and the National Innovation Agency (ANI) for the financial support through the project “ARCHKNIT: Innovative smart textile interfaces for architectural applications”, Ref.: POCI-01-0247-FEDER-039733. This project was co-financed by European Regional Development Fund (ERDF) through SI&IDT Projects in the framework of co-hosting—Competitiveness and Internationalisation Operational Programme (CIOP)—COMPETE 2020, Portugal 2020, with the National Innovation Agency (ANI) as the Intermediate Partner. Nuno Dourado acknowledges FCT for the conceded financial support through the reference project UID/EEA/04436/2019 and “Programa bilateral de Portugal com a Tunísia”. Charii Fakher acknowledges the « Fondation pour la Recherche Scientifique” for the conceded financial support through “Programa bilateral de Portugal com a Tunísia”.

Data Availability Statement

The data supporting the findings of this study are available within the article.

Conflicts of Interest

The authors declare no conflicts of interest.

References

  1. Gardan, J. Additive Manufacturing Technologies for Polymer Composites: State-of-the-Art and Future Trends; Elsevier: Amsterdam, The Netherlands, 2020. [Google Scholar] [CrossRef]
  2. Ashley, S. Rapid prototyping systems. Mech. Eng. 1991, 113, 34–36. [Google Scholar]
  3. Vaezi, M.; Seitz, H.; Yang, S. A review on 3D micro-additive manufacturing technologies. Int. J. Adv. Manuf. Technol. 2012, 67, 1721–1754. [Google Scholar] [CrossRef]
  4. Jain, P.; Kuthe, A.M. Feasibility Study of Manufacturing Using Rapid Prototyping: FDM Approach. Procedia Eng. 2013, 63, 4–11. [Google Scholar] [CrossRef]
  5. Awasthi, P.; Banerjee, S.S. Fused deposition modeling of thermoplastic elastomeric materials: Challenges and opportunities. Addit. Manuf. 2021, 46, 102177. [Google Scholar] [CrossRef]
  6. Cano-Vicent, A.; Tambuwala, M.M.; Hassan, S.S.; Barh, D.; Aljabali, A.A.A.; Birkett, M.; Arjunan, A.; Serrano-Aroca, Á. Fused deposition modelling: Current status, methodology, applications and future prospects. Addit. Manuf. 2021, 47, 102378. [Google Scholar] [CrossRef]
  7. Liu, Z.; Wang, Y.; Wu, B.; Cui, C.; Guo, Y.; Yan, C. A critical review of fused deposition modeling 3D printing technology in manufacturing polylactic acid parts. Int. J. Adv. Manuf. Technol. 2019, 102, 2877–2889. [Google Scholar] [CrossRef]
  8. Relvas, C. O Mundo Da Impressão 3d E Do Fabrico Digital, Publindúst. 2017. Available online: www.engebook.com (accessed on 7 February 2022).
  9. Afonso, J.A.; Alves, J.L.; Caldas, G.; Gouveia, B.P.; Santana, L.; Belinha, J. Influence of 3D printing process parameters on the mechanical properties and mass of PLA parts and predictive models. Rapid Prototyp. J. 2021, 27, 487–495. [Google Scholar] [CrossRef]
  10. Onwubolu, G.C.; Rayegani, F. Characterization and Optimization of Mechanical Properties of ABS Parts Manufactured by the Fused Deposition Modelling Process. Int. J. Manuf. Eng. 2014, 2014, 598531. [Google Scholar] [CrossRef]
  11. Sood, A.K.; Ohdar, R.K.; Mahapatra, S.S. Parametric appraisal of mechanical property of fused deposition modelling processed parts. Mater. Des. 2010, 31, 287–295. [Google Scholar] [CrossRef]
  12. Baich, L.; Manogharan, G.; Marie, H. Study of infill print design on production cost-time of 3D printed ABS parts. Int. J. Rapid Manuf. 2015, 5, 308. [Google Scholar] [CrossRef]
  13. Harpool, T.D. Observing the Effect of Infill Shapes on the Tensile Characteristics of 3D Printed Plastic Parts. 2016. Available online: https://soar.wichita.edu/handle/10057/13504 (accessed on 20 January 2023).
  14. Alafaghani, A.; Qattawi, A.; Alrawi, B.; Guzman, A. Experimental Optimization of Fused Deposition Modelling Processing Parameters: A Design-for-Manufacturing Approach. Procedia Manuf. 2017, 10, 791–803. [Google Scholar] [CrossRef]
  15. Behzadnasab, M.; Yousefi, A.A. Effects of 3D printer nozzle head temperature on the physical and mechanical properties of PLA based product. In Proceedings of the 12th International Seminar on Polymer Science and Technology, Tehran, Iran, 2–5 November 2016. [Google Scholar]
  16. Johansson, F. Optimizing Fused Filament Fabrication 3D Printing for Durability Tensile Properties & Layer Bonding; Blekinge Institute of Technology: Karlskrona, Sweden, 2016. [Google Scholar]
  17. Bardiya, S.; Jerald, J.; Satheeshkumar, V. Effect of process parameters on the impact strength of fused filament fabricated (FFF) polylactic acid (PLA) parts. Mater. Today Proc. 2021, 41, 1103–1106. [Google Scholar] [CrossRef]
  18. Abeykoon, C.; Sri-Amphorn, P.; Fernando, A. Optimization of fused deposition modeling parameters for improved PLA and ABS 3D printed structures. Int. J. Light. Mater. Manuf. 2020, 3, 284–297. [Google Scholar] [CrossRef]
  19. ISO 178, 2019. DIN EN ISO ISO 178; Plastics-Determination of Flexural Properties. International Standard Organization Std.: Geneva, Switzerland, 2019. Available online: https://www.iso.org/standard/70513.html (accessed on 7 February 2022).
  20. ISO 527-1, 2012. DIN EN ISO 527-1; Plastics-Determination of Tensile Properties, Part 1: General Principles. International Standard Organization Std.: Geneva, Switzerland, 2012. Available online: https://www.iso.org/fr/standard/56045.html (accessed on 7 February 2022).
  21. ISO 527-2, 2012. DIN EN ISO 527-2; Plastics-Determination of Tensile Properties, Part 2: Test Conditions for Moulding and Extrusion Plastics. International Standard Organization Std.: Geneva, Switzerland, 2012.
  22. Xavier, J.; De Jesus, A.M.P.; Morais, J.J.L.; Pinto, J.M.T. Stereovision measurements on evaluating the modulus of elasticity of wood by compression tests parallel to the grain. Constr. Build. Mater. 2012, 26, 207–215. [Google Scholar] [CrossRef]
  23. Gere, J.M.; Goodno, B.J. Mechanics of Materials; Cengage Learning: Boston, MA, USA, 2009. [Google Scholar]
  24. Gonabadi, H.; Chen, Y.; Yadav, A.; Bull, S. Investigation of the effect of raster angle, build orientation, and infill density on the elastic response of 3D printed parts using finite element microstructural modeling and homogenization techniques. Int. J. Adv. Manuf. Technol. 2022, 118, 1485–1510. [Google Scholar] [CrossRef]
Figure 1. Schematic illustration of applicable analysed process parameters.
Jcs 08 00055 g001
Figure 2. Specimen geometries: (a) three-point bending: l = 80 ; h = 4 ; W = 10   ( mm ) and (b) dogbone: b 1 = 10 ; b 2 = 20 ; h = 4 ; l 1 = 80 ; l 2 = 110 ; l 3 = 170 ; r = 25 ; L 0 = 75 ; L = 115   ( mm ) .
Jcs 08 00055 g002
Figure 3. Specimens (a) infill percentage and filament orientations (data in parentheses represent specimen quantities); and (b) top-view of filament deposition (P represents the loading axis).
Jcs 08 00055 g003
Figure 4. Flowchart of the adopted inverse method.
Jcs 08 00055 g004
Figure 5. Experimental setup of TPB test.
Jcs 08 00055 g005
Figure 6. Experimental setup of standard tensile tests.
Jcs 08 00055 g006
Figure 7. Typical speckle pattern for DIC measurements and corresponding grey level histogram.
Jcs 08 00055 g007
Figure 8. Experimental setup of tensile tests using DIC system.
Jcs 08 00055 g008
Figure 9. Three-point bending test model exhibiting the boundary conditions.
Jcs 08 00055 g009
Figure 10. Numerical model of the tensile test showing the adopted boundary conditions.
Jcs 08 00055 g010
Figure 11. Experimental and numerical P-d curves for the orientations: (a) 0°/90°, (b) 45°/−45°, (c) 0°, and (d) 90° obtained in TPB tests.
Jcs 08 00055 g011
Figure 12. Initial stiffness for each filament orientation and infill percentage obtained in TPB tests.
Jcs 08 00055 g012
Figure 13. Experimental and numerical P-d curves for the orientations: (a) 0°/90°, (b) 45°/−45°, (c) 0°, and (d) 90° obtained in tensile tests.
Jcs 08 00055 g013
Figure 14. Evolution of initial stiffness with infill percentage.
Jcs 08 00055 g014
Figure 15. Stiffness for each filament orientation and infill percentage obtained in tensile tests.
Jcs 08 00055 g015
Figure 16. Strain field along the loading direction in tensile test relatively to 0°orientation and 30% infill obtained with DIC technique. (a), (b) and (c) correspond to indentified points in the above stress-strain curve.
Jcs 08 00055 g016
Figure 17. Stress–strain curves for the orientations: (a) 0° and (b) 90° obtained in standard tensile tests and with DIC.
Jcs 08 00055 g017
Figure 18. Elastic modulus corresponding to filament orientation considering 30% and 100% infill relatively standard tensile tests and with DIC (MPa).
Jcs 08 00055 g018
Figure 19. Elastic modulus for 0° and 90° filament orientation considering 30%, 50%, 75% and 100% infill relatively to standard tensile tests (values in MPa).
Jcs 08 00055 g019
Figure 20. Poisson’s ratio for different filaments orientation and infill corresponding to tensile tests using DIC analysis.
Jcs 08 00055 g020
Table 1. Printing parameters.
QualityLayer height (mm)0.1
Extrusion width (mm)0.4
Flow (%)100
Perimeters2
FillTop layers4
Print speed (mm/s)40
Speed and TemperatureBottom layers4
Print temperature (°C)210
Close bed after layer (°C)100
Bed temperature (°C)45
Table 2. Average values of specimen dimensions (height h and width W) printed with different orientations and infill percentages (values in mm).
Orientations
0°/90°45°/−45°90°
Infill30%h4.284.284.224.28
W9.9710.0110.0110.07
100%h4.124.224.154.18
W9.979.969.999.99
Table 3. Average values of specimen dimensions (thickness h and width b1) printed with different orientations and infill percentages (dimensions in mm).
Orientations
0°/90°45°/−45°90°
Infill30%h4.254.394.194.22
b19.989.9810.0410.09
100%h4.244.304.104.23
b110.0410.1010.0810.15
50%h--4.204.24
b1--10.0410.16
75%h--4.224.26
b1--10.0810.10
Table 4. Elastic properties of the printed PLA [24].
υ 12 υ 13 υ 23 G 12 (MPa) G 13 (MPa) G 23 (MPa)
0.3200.3100.25510191019917
Table 5. Resume of tensile tests.
Orientation (°)Infill (%) R 0 (N/mm) P u (N)
0/9030377593
10010141676
45/−4530297602
1009901743
0305851256
508681774
759351838
10010882490
9030308318
50346308
75394421
10010051549
Disclaimer/Publisher’s Note: The statements, opinions and data contained in all publications are solely those of the individual author(s) and contributor(s) and not of MDPI and/or the editor(s). MDPI and/or the editor(s) disclaim responsibility for any injury to people or property resulting from any ideas, methods, instructions or products referred to in the content.

