Article

The Potential of Replacing Concrete with Sand and Recycled Polycarbonate Composites: Compressive Strength Testing

1
Department of Mechanical and Materials Engineering, Western University, 1151 Richmond St. N., London, ON N6A 3K7, Canada
2
Department of Electrical & Computer Engineering, Western University, 1151 Richmond St. N., London, ON N6A 3K7, Canada
3
Ivey School of Business, Western University, 1151 Richmond St. N., London, ON N6A 3K7, Canada
*
Author to whom correspondence should be addressed.
J. Compos. Sci. 2023, 7(6), 249; https://doi.org/10.3390/jcs7060249
Submission received: 3 June 2023 / Revised: 8 June 2023 / Accepted: 12 June 2023 / Published: 15 June 2023
(This article belongs to the Special Issue Feature Papers in Journal of Composites Science in 2023)

Abstract

:
Concrete contributes 8% of all global carbon emissions, making the need to find substitutes critical for environmental sustainability. Research has indicated the potential for recycled plastics to be used as concrete substitutes. This study extends existing research by investigating the use of polycarbonate (PC) in plastic sand bricks as a mechanical equivalent to concrete. PC has high compressive strength, durability, impact strength, thermal resistivity, clarity, fatigue resistance, and UV resistance. This work provides a method and mold to produce a matrix of sand–plastic sample compositions with dimensions adhering to the ASTM D695 standard for compressive properties of rigid plastic. Compositions of 0% (control), 20%, 30%, 40%, and 50% sand by weight were tested. Samples were tested for compressive strength until yield and stress–strain behaviors were plotted. The results for 100% PC demonstrated an average and maximum compressive strength of 71 MPa and 72 MPa, respectively. The 50% PC and 50% sand composition yielded an average and maximum compressive strength of 71 MPa and 73 MPa, respectively, with an increase in compressive stiffness and transition to shear failure resembling concrete. With a composite density of 1.86 g/cm3 compared to concrete’s average of 2.4 g/cm3, and a compressive strength exceeding commercial concrete demands of 23.3 MPa to 30.2 MPa, this lightweight alternative meets the strength demands of concrete, reduces the need for new construction materials, and provides an additional recycling opportunity for nonbiodegradable waste plastic.

Graphical Abstract

1. Introduction

Accelerated plastic use over the years has created an enormous quantity of waste plastic. In 2021, 390.7 million metric tons of waste plastic was produced globally [1]. Despite the continued increase in plastic production, only 9% of this volume is recycled [2]. For the plastic that does not get recycled, 22% is mismanaged, 19% is incinerated, and the remaining 50% is directed to landfill [2]. This suboptimal waste plastic disposal has widespread negative environmental effects [3]. The vast amount of unrecycled plastic presents a substantial opportunity to profitably utilize available materials, reduce pollution, and redirect waste from landfills.
To take advantage of that opportunity, researchers have investigated methods to use waste plastic in new products. One such application of waste plastic that continues to be investigated is the use of polymers as a replacement aggregate or fiber reinforcement in concrete [4]. Traditional concrete is the most used material globally, with approximately 30 billion metric tons of concrete being consumed each year [5]. The manufacturing of concrete, however, also makes it one of the most detrimental materials to the environment [6]. A typical concrete mixture consists of 12% Portland cement, 34% sand, 28% crushed stone, and 6% water by weight [6]. Of this mixture, Portland cement alone makes concrete the contributor of 8% of all global carbon emissions [7,8]. If concrete were compared against global contributors of greenhouse gases as a country, it would be the third largest producer, surpassed only by the United States and China [8,9,10]. These large carbon emissions are almost exclusively a result of the manufacturing process of Portland cement [6]. Between the fossil fuel combustion to operate the rotary kiln and the high temperatures required for the calcination of limestone, every 1 ton of cement contributes to 1.25 tons of carbon dioxide (CO2) production [6]. The global emissions from cement production continue to grow annually, reaching a new peak of 1.7 billion metric tons of CO2 in 2021 [11].
To reduce the total emissions from concrete, many studies have been conducted in search of a less energy-intensive binder to replace Portland cement [12]. These existing studies have investigated the use of industrial waste products as supplementary cement materials (SCMs) and have already demonstrated some select successful replacements for Portland cement. These substitutes include, but are not limited to, palm oil fuel ash (POFA) [13], rice husk ash (RHA) [13], palm oil clinker powder (POCP) [14], ground granulated blast-furnace slag (GGBS) [15], pulverized fly ash (PFA) [16], corn cob ash [17]. While many of these materials have demonstrated merit, they are often associated with a lack of supply and localization of use. GGBS and PFA are both industrial waste products and are only produced in quantities that match 5–10% of cement production [18]. Another research study has shown that up to 70% of the concrete mix can be replaced by treated POFA while retaining average mechanical properties [14]. The use of up to 30% recycled concrete aggregate in the mixture has also shown a 29% decrease in CO2 emissions [13]. Despite these aggressive carbon contributions and a production rate by weight that eclipses all other materials including plastics, concrete is often not immediately associated with unsustainable environmental practices. The problem with concrete, however, is more severe than plastic, with the total weight of plastic produced in sixty years being matched by concrete in only two [10]. Beyond carbon emissions, concrete is also responsible for demanding 18% of global industrial water consumption and 9% of global industrial water withdrawal annually [19]. A direct correlation can be observed between regions that experience greater water stress and higher production of concrete, such as the United States, the Middle East, India, and China [19]. On all accounts, concrete works to remove natural spaces, decrease ecological diversity, and increase water demands on already stressed environments while aggressively contributing to global emissions.
Solutions that select an alternative aggregate material are restricted to targeting the lowest-value material. Instead, there is a larger economic incentive to investigate ways to achieve a complete material substitution. One such experimental replacement has used recycled plastic in conjunction with a sand aggregate in the development of plastic sand bricks [20]. Traditional bricks rely on cement as a key material in their manufacture and, therefore, also contribute to growing annual carbon emissions. By utilizing sand as the bulk aggregate and a liquid thermoplastic as the binder, plastic sand bricks have demonstrated potential as a new building material [20]. Together, these solutions work to offset the cost and emissions associated with the manufacture and use of virgin construction materials while also providing a new opportunity for recycling [4]. Using plastic composites to replace existing building materials can pave the way toward a more circular economy and reduce environmental impact [20].
The current research field surrounding plastic composites for use as building materials consists of combining cement with fine aggregate plastics, lightweight approaches for traditional concrete based on aggregate density, plastic additives in unfired clay brick, and soil–cement blocks [20]. Existing plastic sand brick studies have developed methods for producing to-scale bricks and subjecting them to compressive strength, tensile strength, efflorescence, thermal resistance, and water absorption tests [21,22]. The typical thermoplastics used across these studies were limited to polyethylene (PE), low-density polyethylene (LDPE), high-density polyethylene (HDPE), polyvinylchloride (PVC), polypropylene (PP), and polystyrene (PS) [23]. On average, these studies found that plastic sand bricks demonstrated an initial decline in compressive strength at low percentages of sand but experienced a peak in strength at 40% compositions and similar strength at 50% [21]. The highest strength was recorded at 32.7 MPa for a 3:1 LDPE sand material composition [24]. This places plastic sand bricks at a comparable compressive strength to residential concrete, which has a strength range from 23.3 MPa to 30.2 MPa in commercial structures [25]. High-strength concrete, however, is more difficult to replicate, as it can have compressive strength ratings exceeding 70–80 MPa [26].
This study builds on previous work that showed recycled plastic could be used as a substitute building material by investigating the use of polycarbonate (PC) in plastic sand bricks as a new material. The characteristics of PC make it a desirable material for applications demanding high compressive strength, durability, impact strength, thermal resistivity, clarity, fatigue resistance, and UV resistance [27]. It is readily used in commercial applications such as storefront windows, protective barriers and safety glass, vehicle components, electronic housings, and medical diagnostic equipment [27,28]. The highest demand for PC is in the automotive industry due to its high-performance strength properties in conjunction with its light weight [28]. In 2020, the global capacity for PC was 6.1 million tons annually, with a projected continued growth of 8% in upcoming years [29]. This high production rate and a potential source of waste plastic, coupled with the high compressive strength properties of PC (76–86.2 MPa for molded PC) as an engineering plastic, make it a desirable substitute for typically high-strength concrete applications [30]. This work provides a repeatable test method and mold to produce a matrix of sand–plastic sample compositions with dimensions adhering to the ASTM D695 standard test method for compressive properties of rigid plastics [31]. The testing consisted of compositions of 0% (control), 20%, 30%, 40%, and 50% sand by weight based on proven success ranges of sand–plastic ratios across previous studies with different plastics [24]. Each sample was subjected to compressive strength tests until yield, and their resulting stress–strain behaviors were plotted. The results are presented and discussed in the context of plastic recycling and the circular economy.

2. Materials and Methods
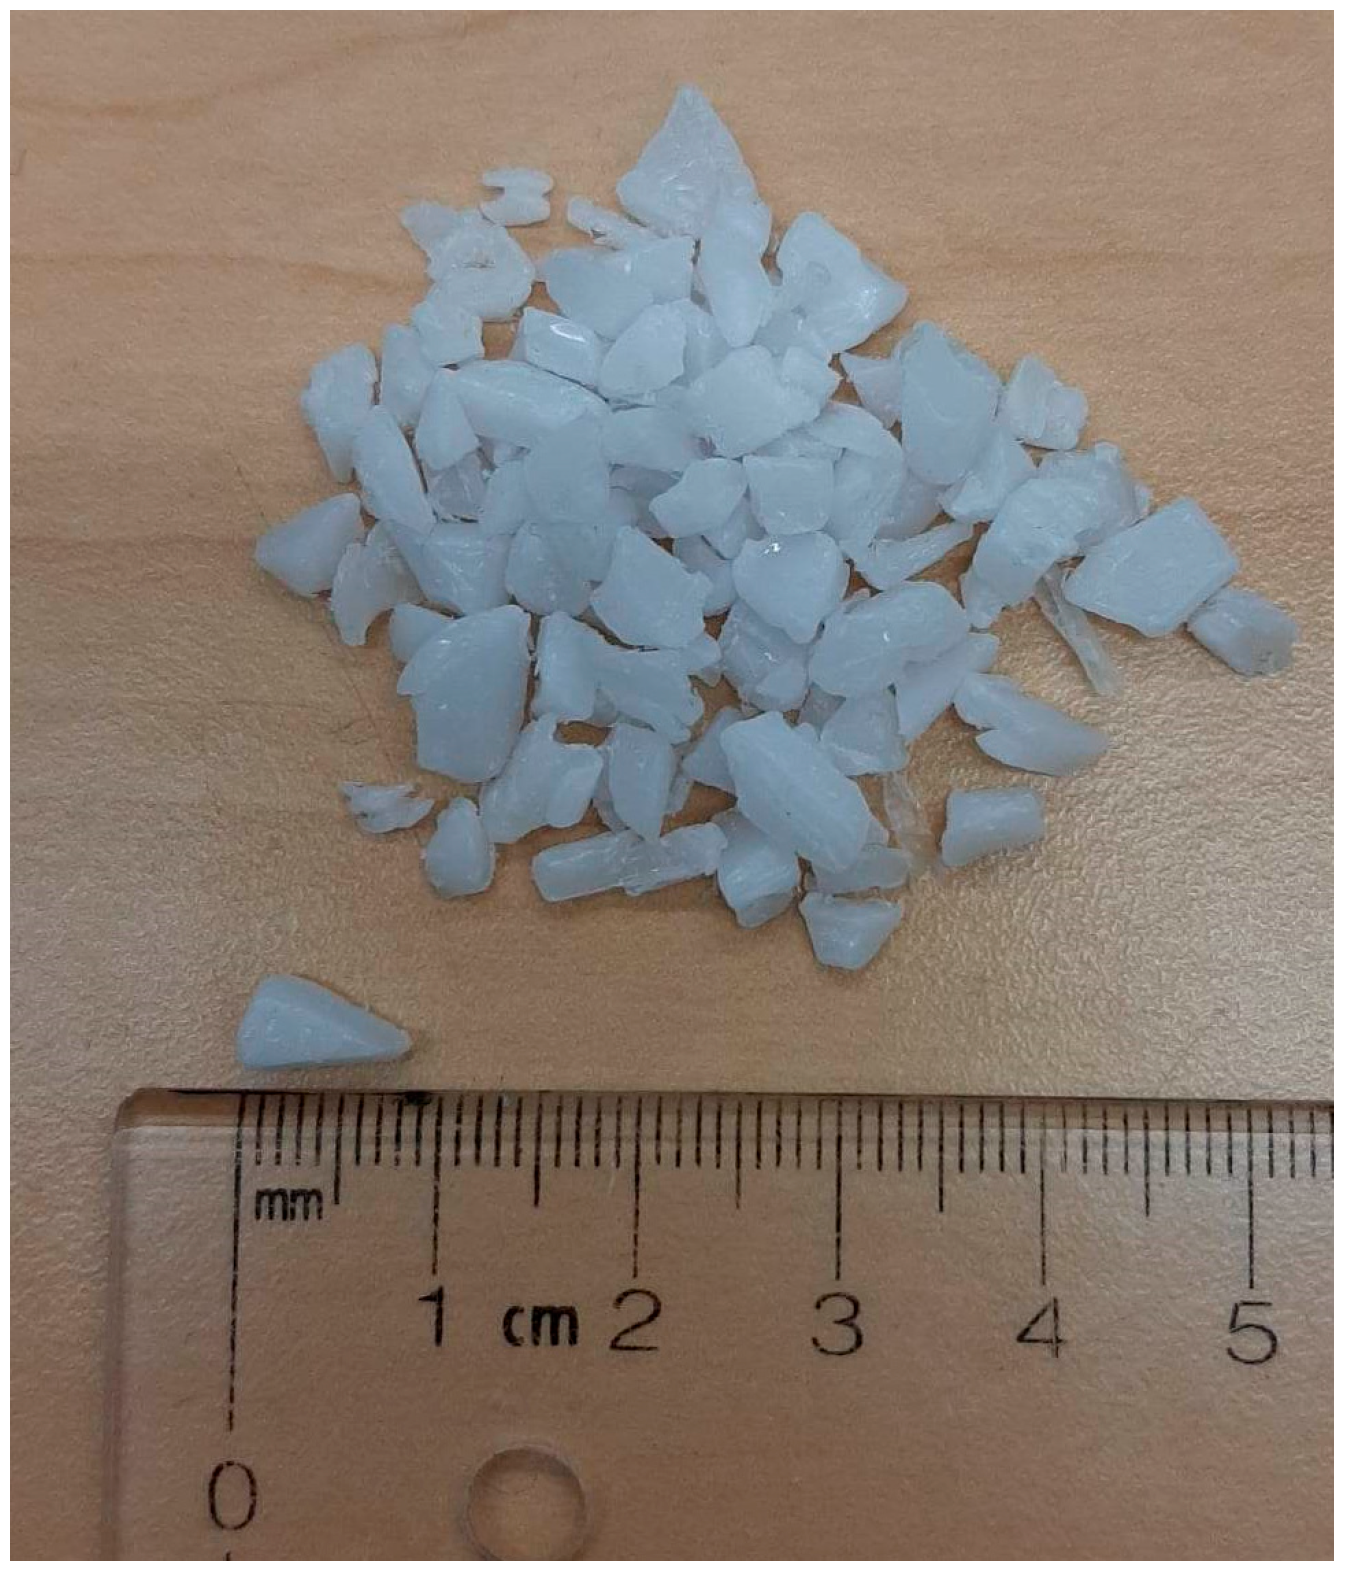
2.1. Materials

Recycled and reground PC available at a rate of CAD 2.03/kg from Post Plastics in Toronto, Ontario (non-spherical grain size up to approximately 10 mm in length) was used as a substitute binder, and uncategorized beach sand (allowable grain size between 0.06–2 mm) was mixed in as the aggregate. The size of the PC regrind used is shown in Figure 1.
An aluminum mold consisting of a 1/8″ base, 1/8″ lid, 1″ body, and ½″ plugs was laser-cut to provide a 3 × 4 matrix of 12 total ASTM D695 standard 1″ × 1” x ½″ samples, as seen in Figure 2. The designs for the mold are released under CERN OHL v2 and are available on the Open Science Framework [32,33,34].
Compositions of 0% (control), 20%, 30%, 40%, and 50% sand by weight were selected based on proven success ranges of sand–plastic ratios across previous studies with different polymers [24]. The appropriate ratios of sand and plastic were weighed using a digital scale (+/− 0.01 g). The mold was heated and samples were formed using the open-source scientific hot press in Figure 3 [35]. All handling of the aluminum mold and hot press was performed using thermally resistant gloves insulated up to 300 °C (minimum). Box fans were used for cooling but were not required if cycle time was not a user concern. Once set, the samples were ejected from the mold using a vice and tested in an Instron 5980 Series universal testing machine using a 100 KN load cell until failure.

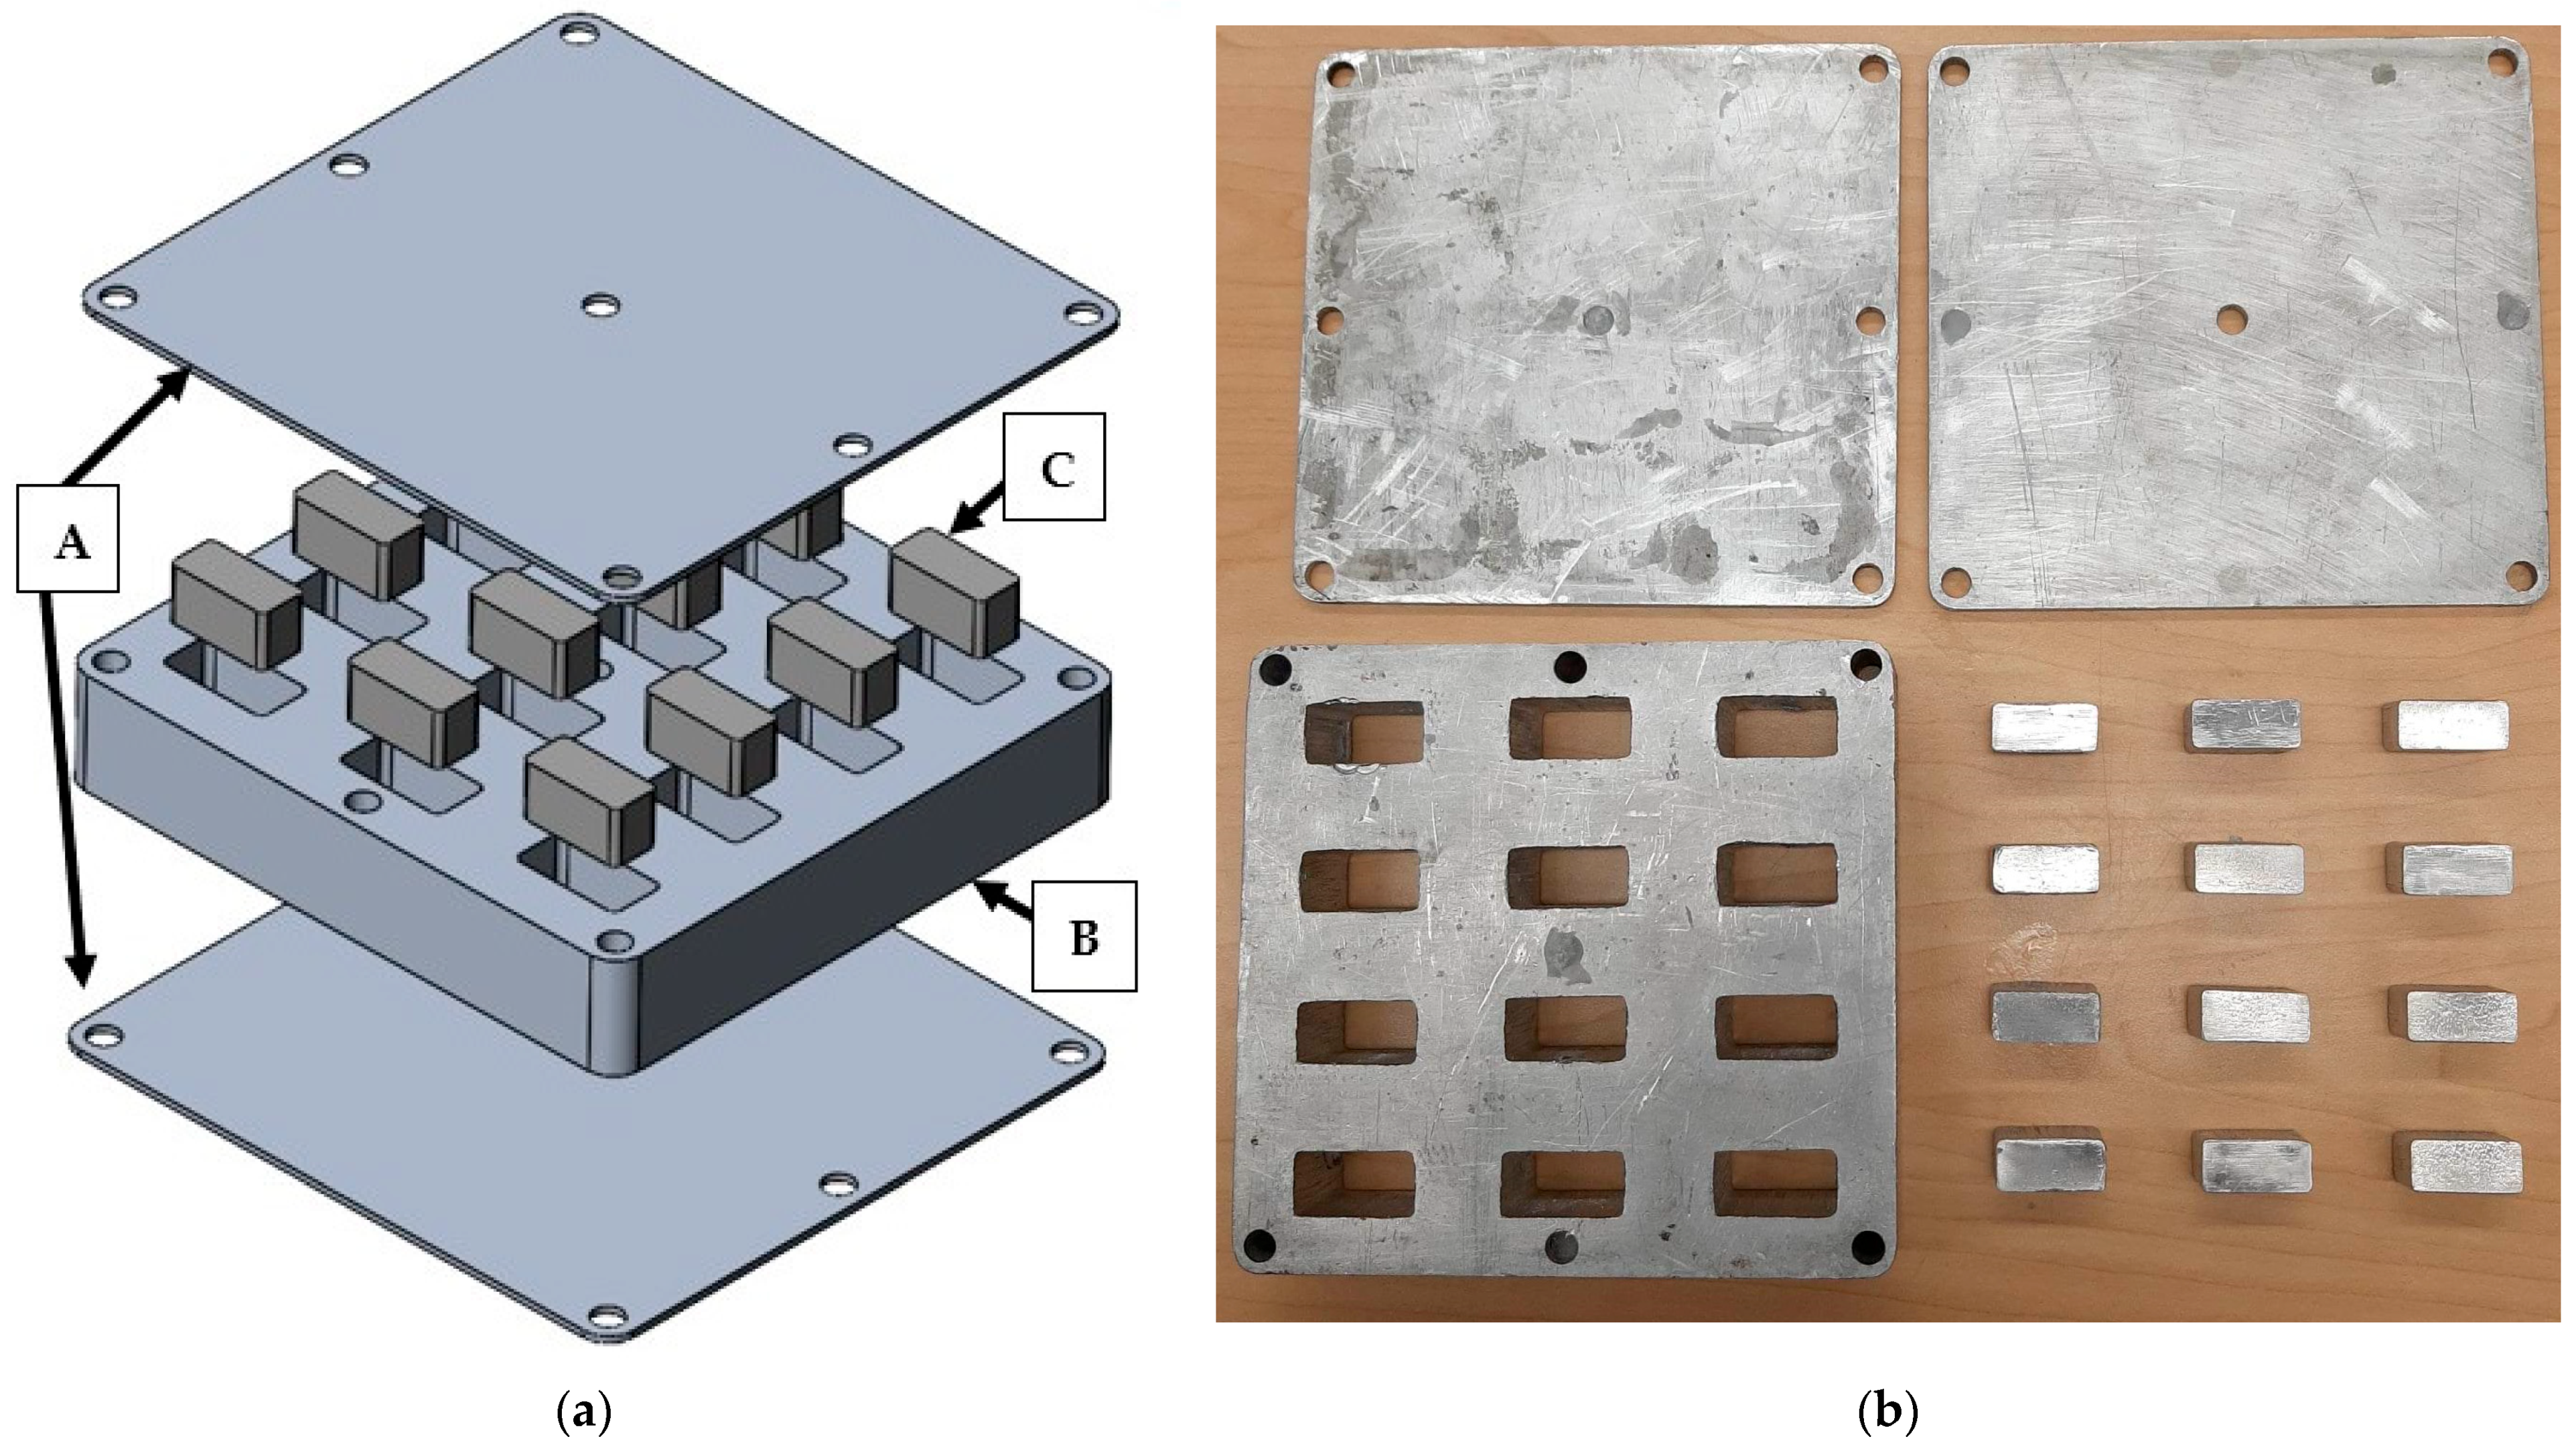
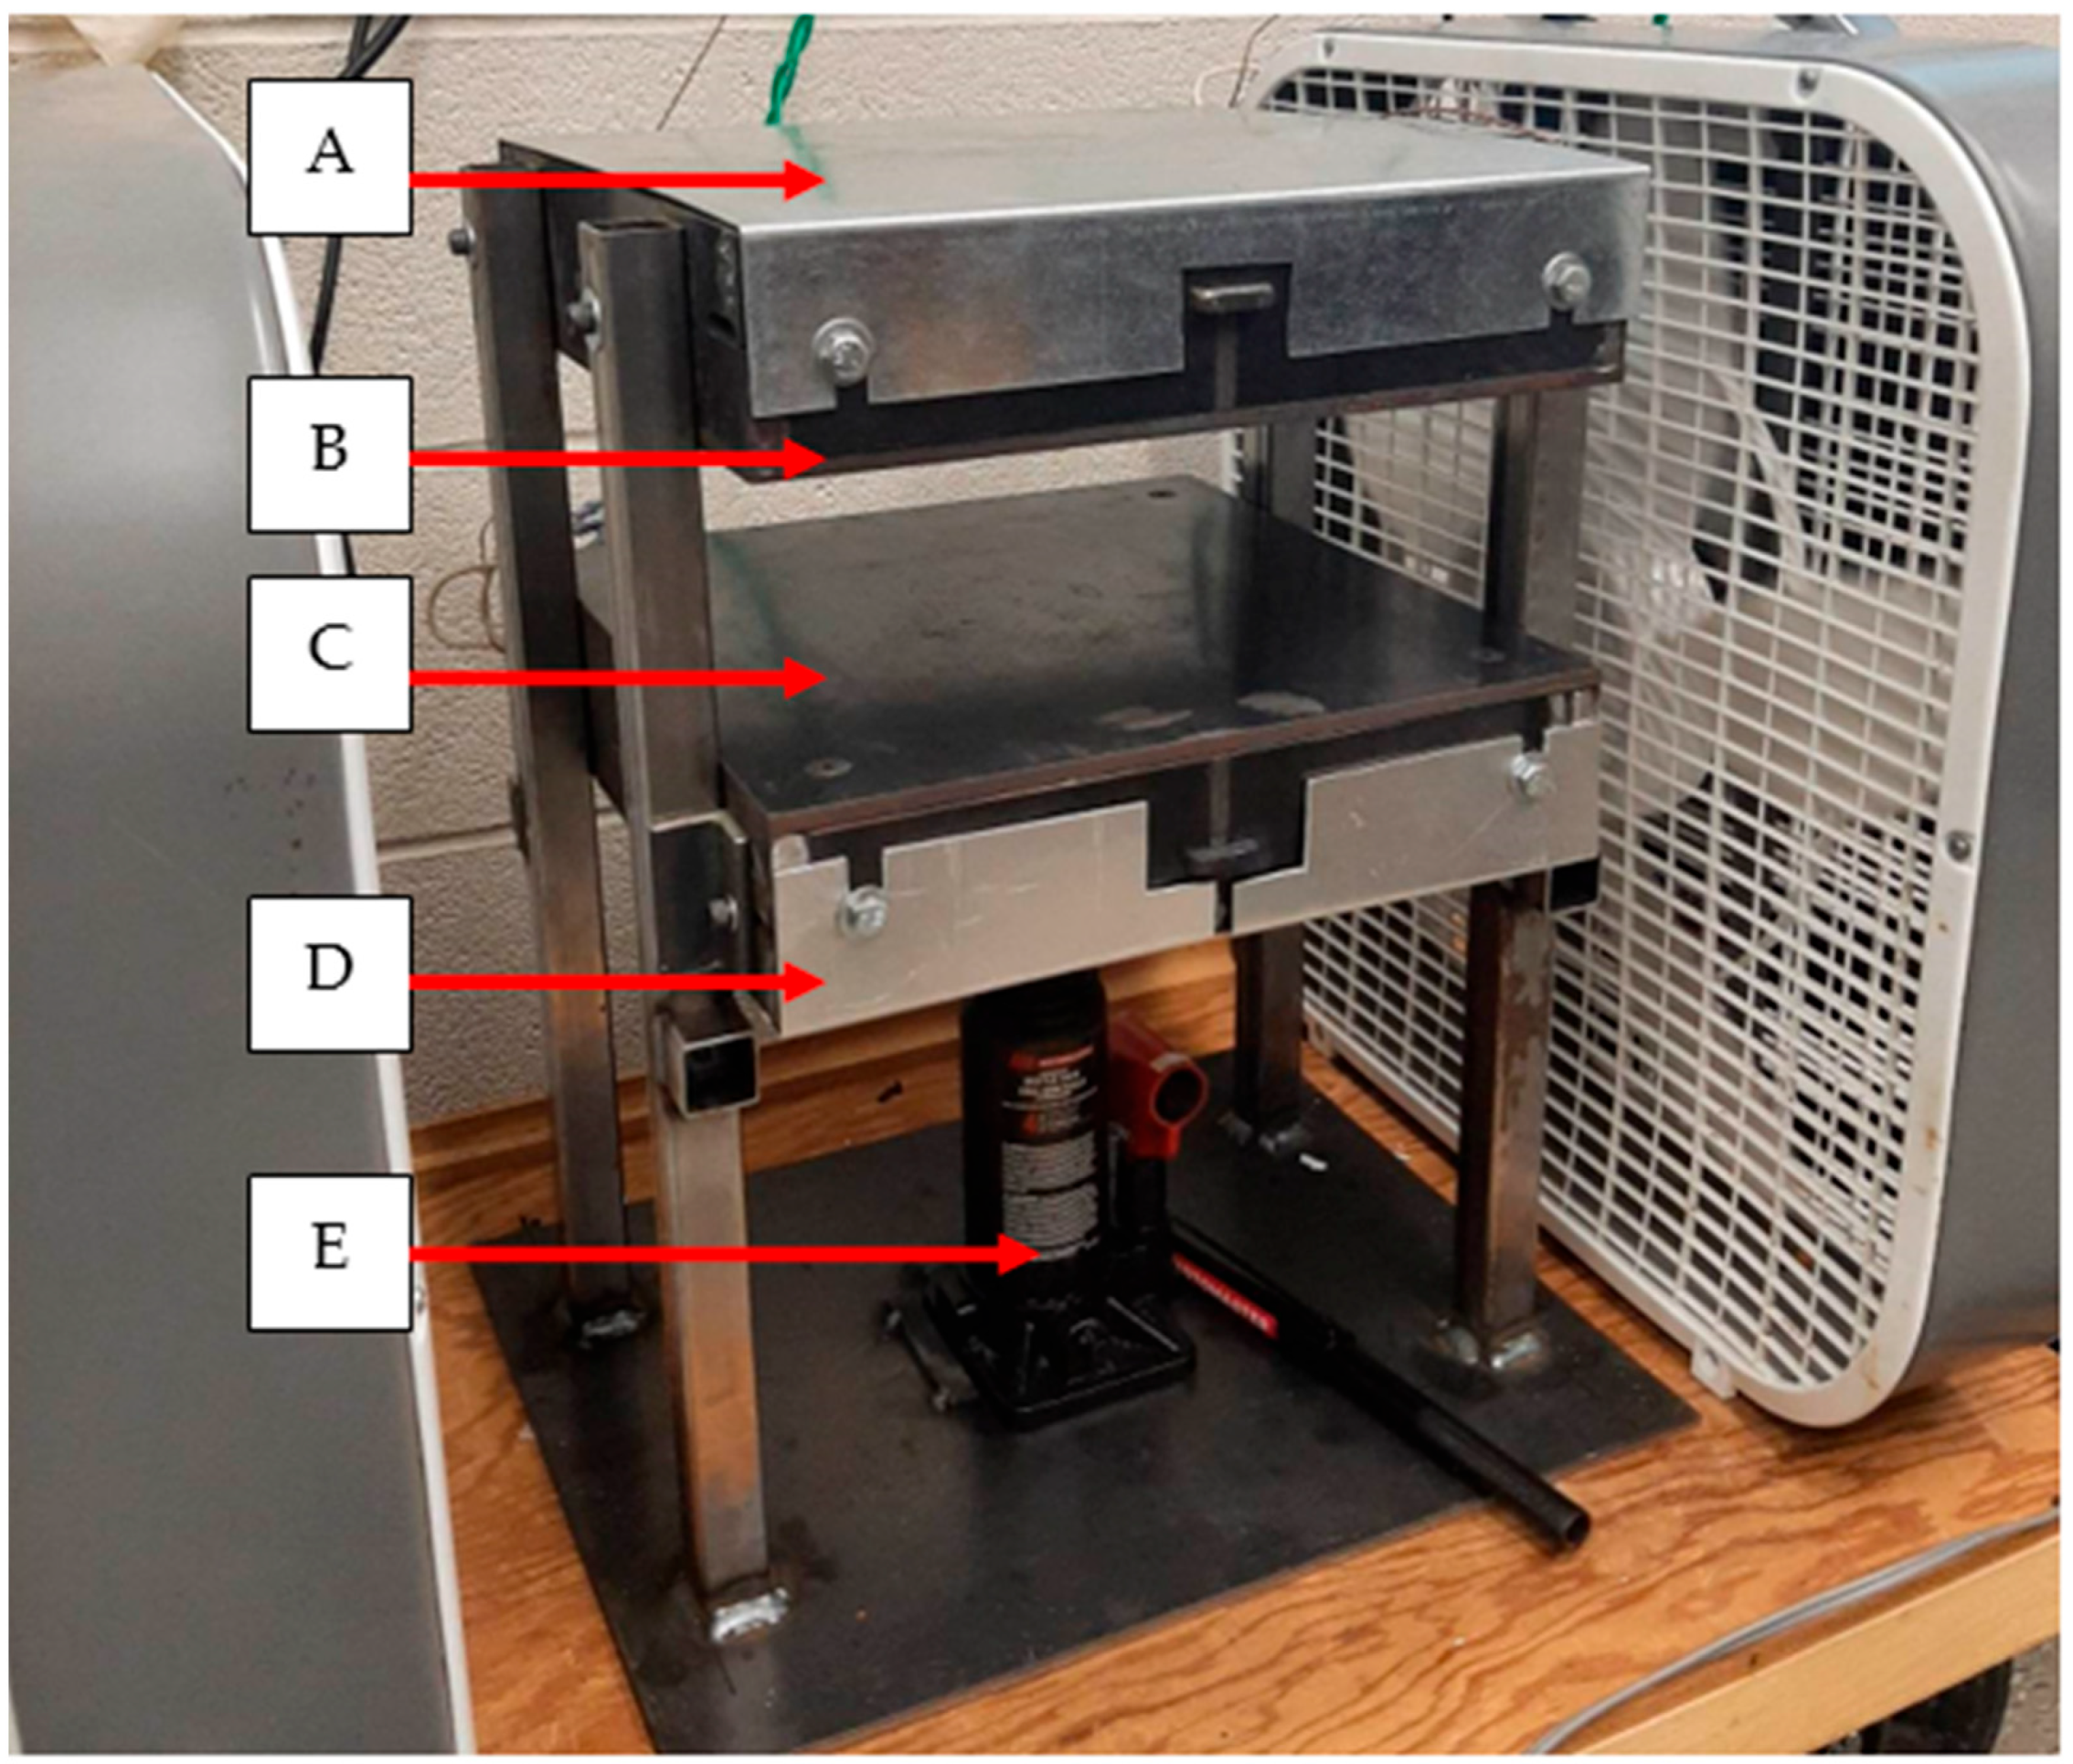
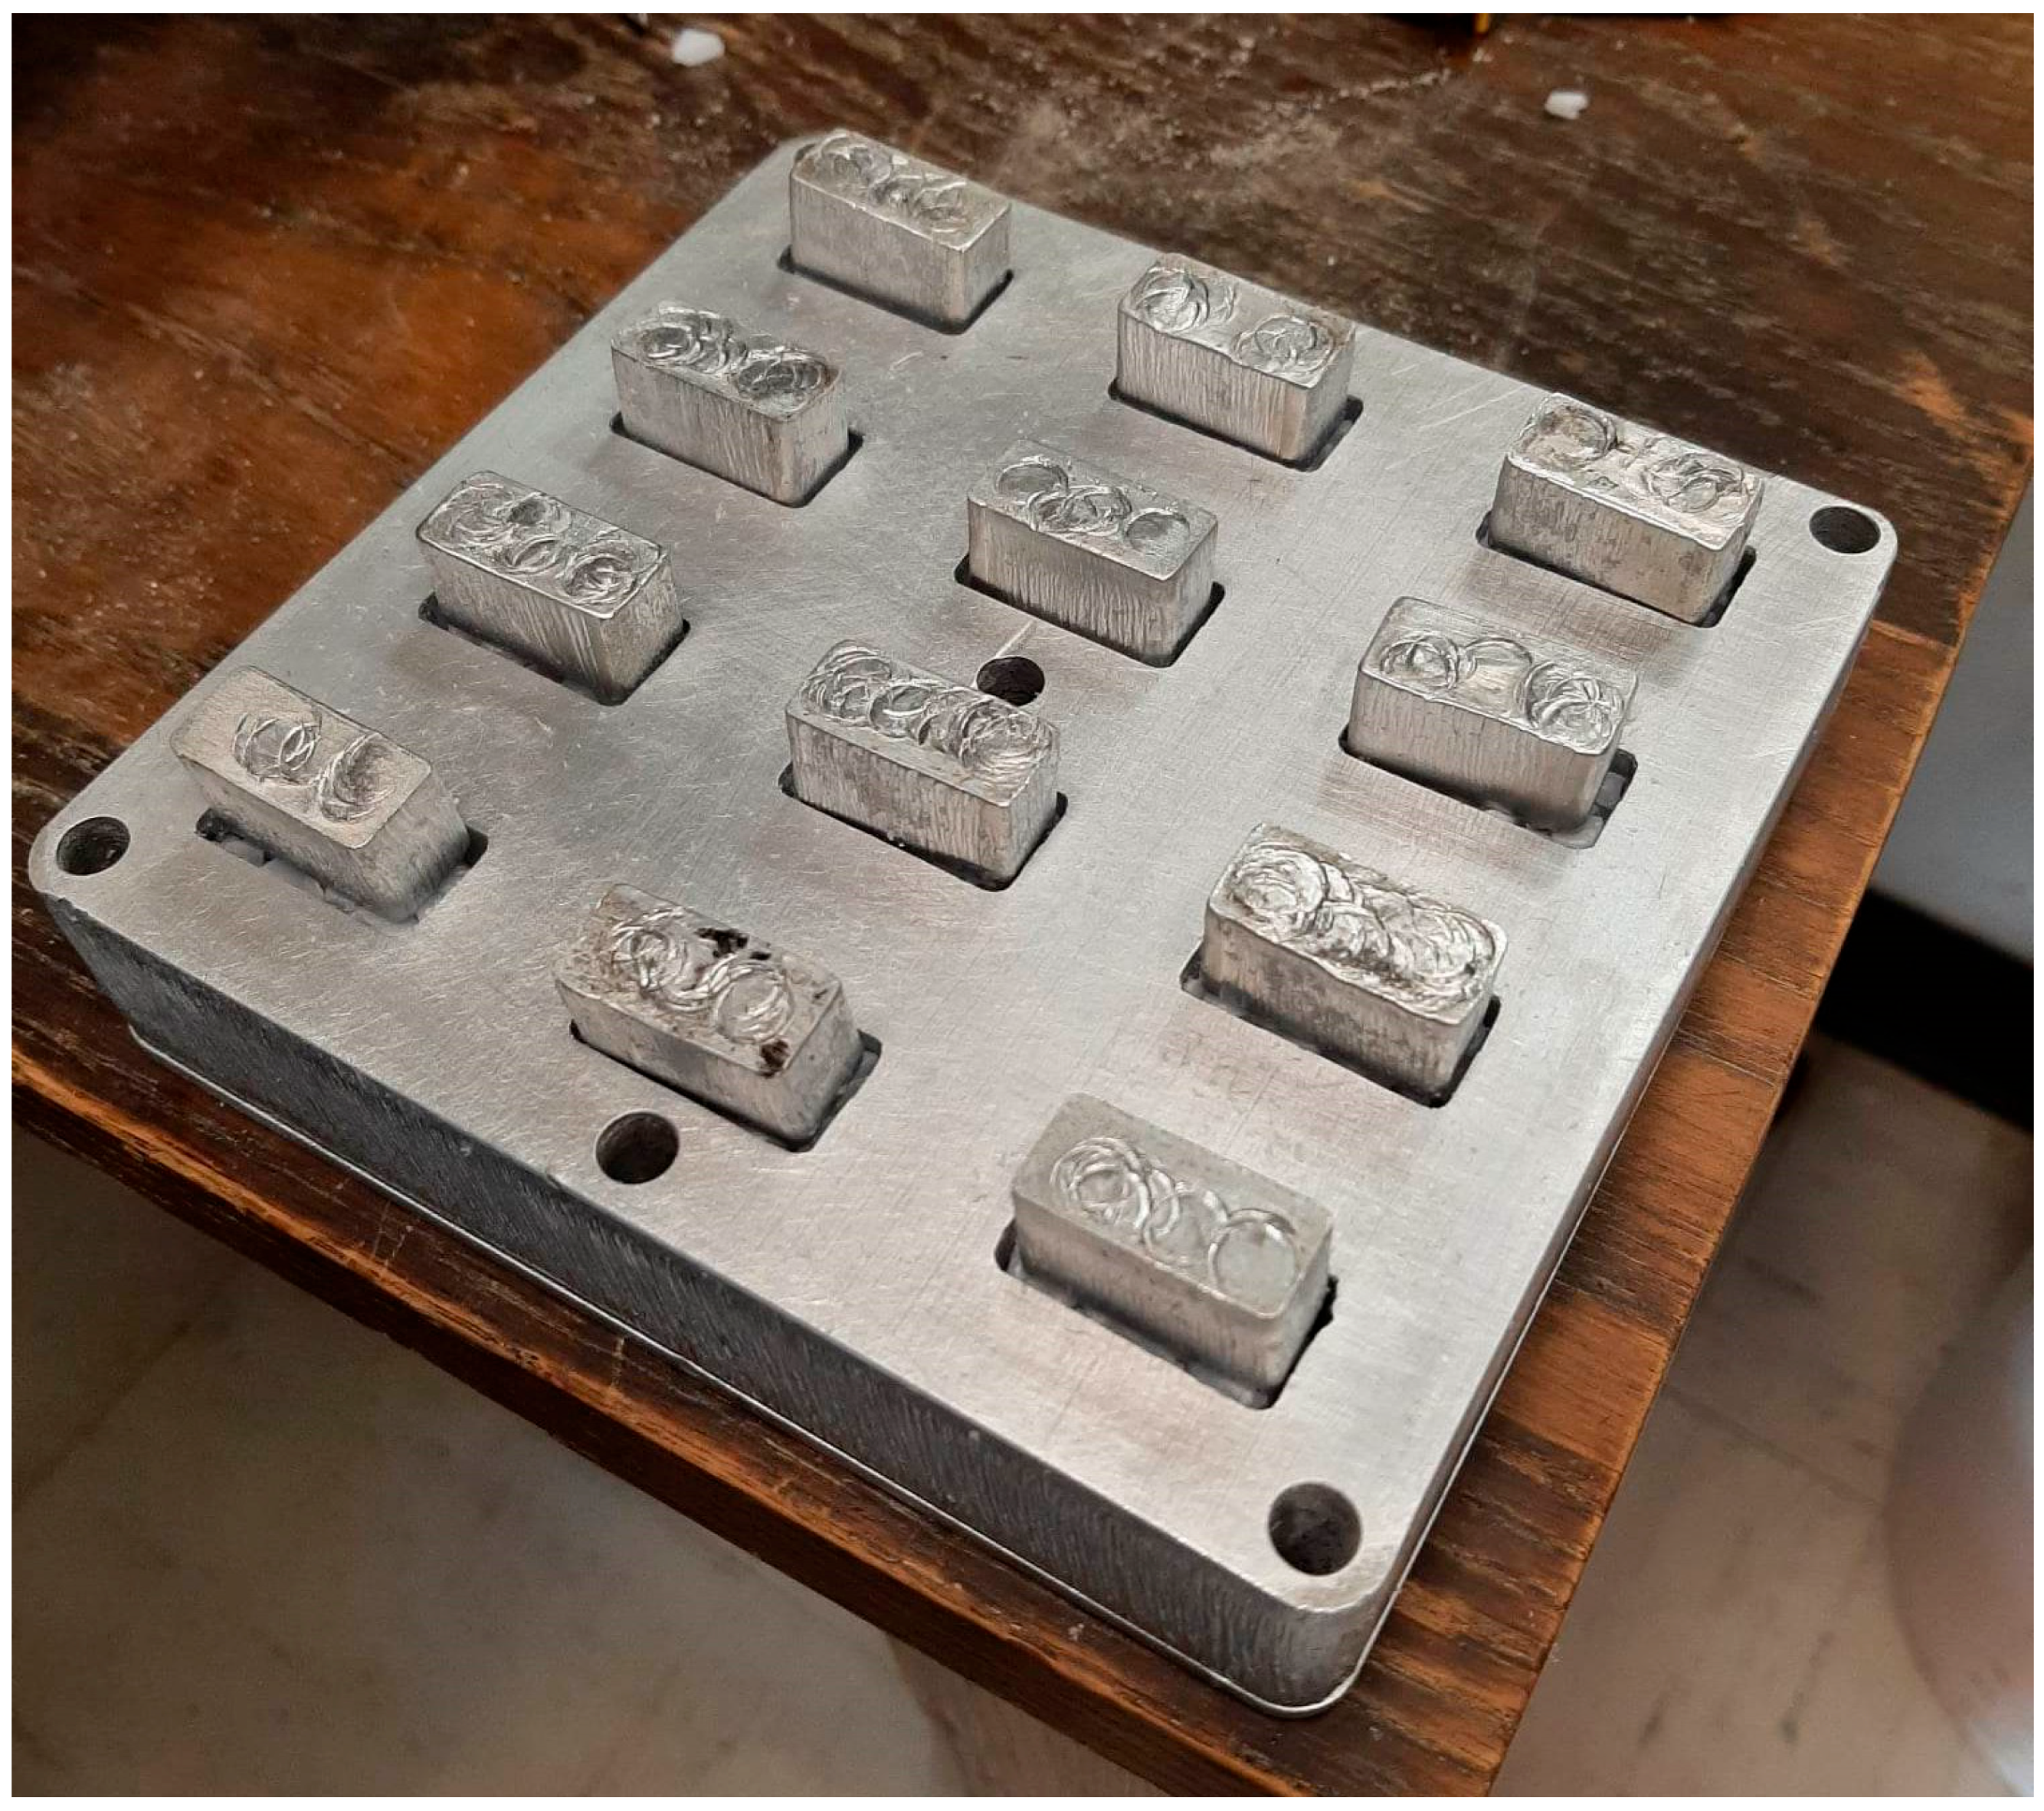
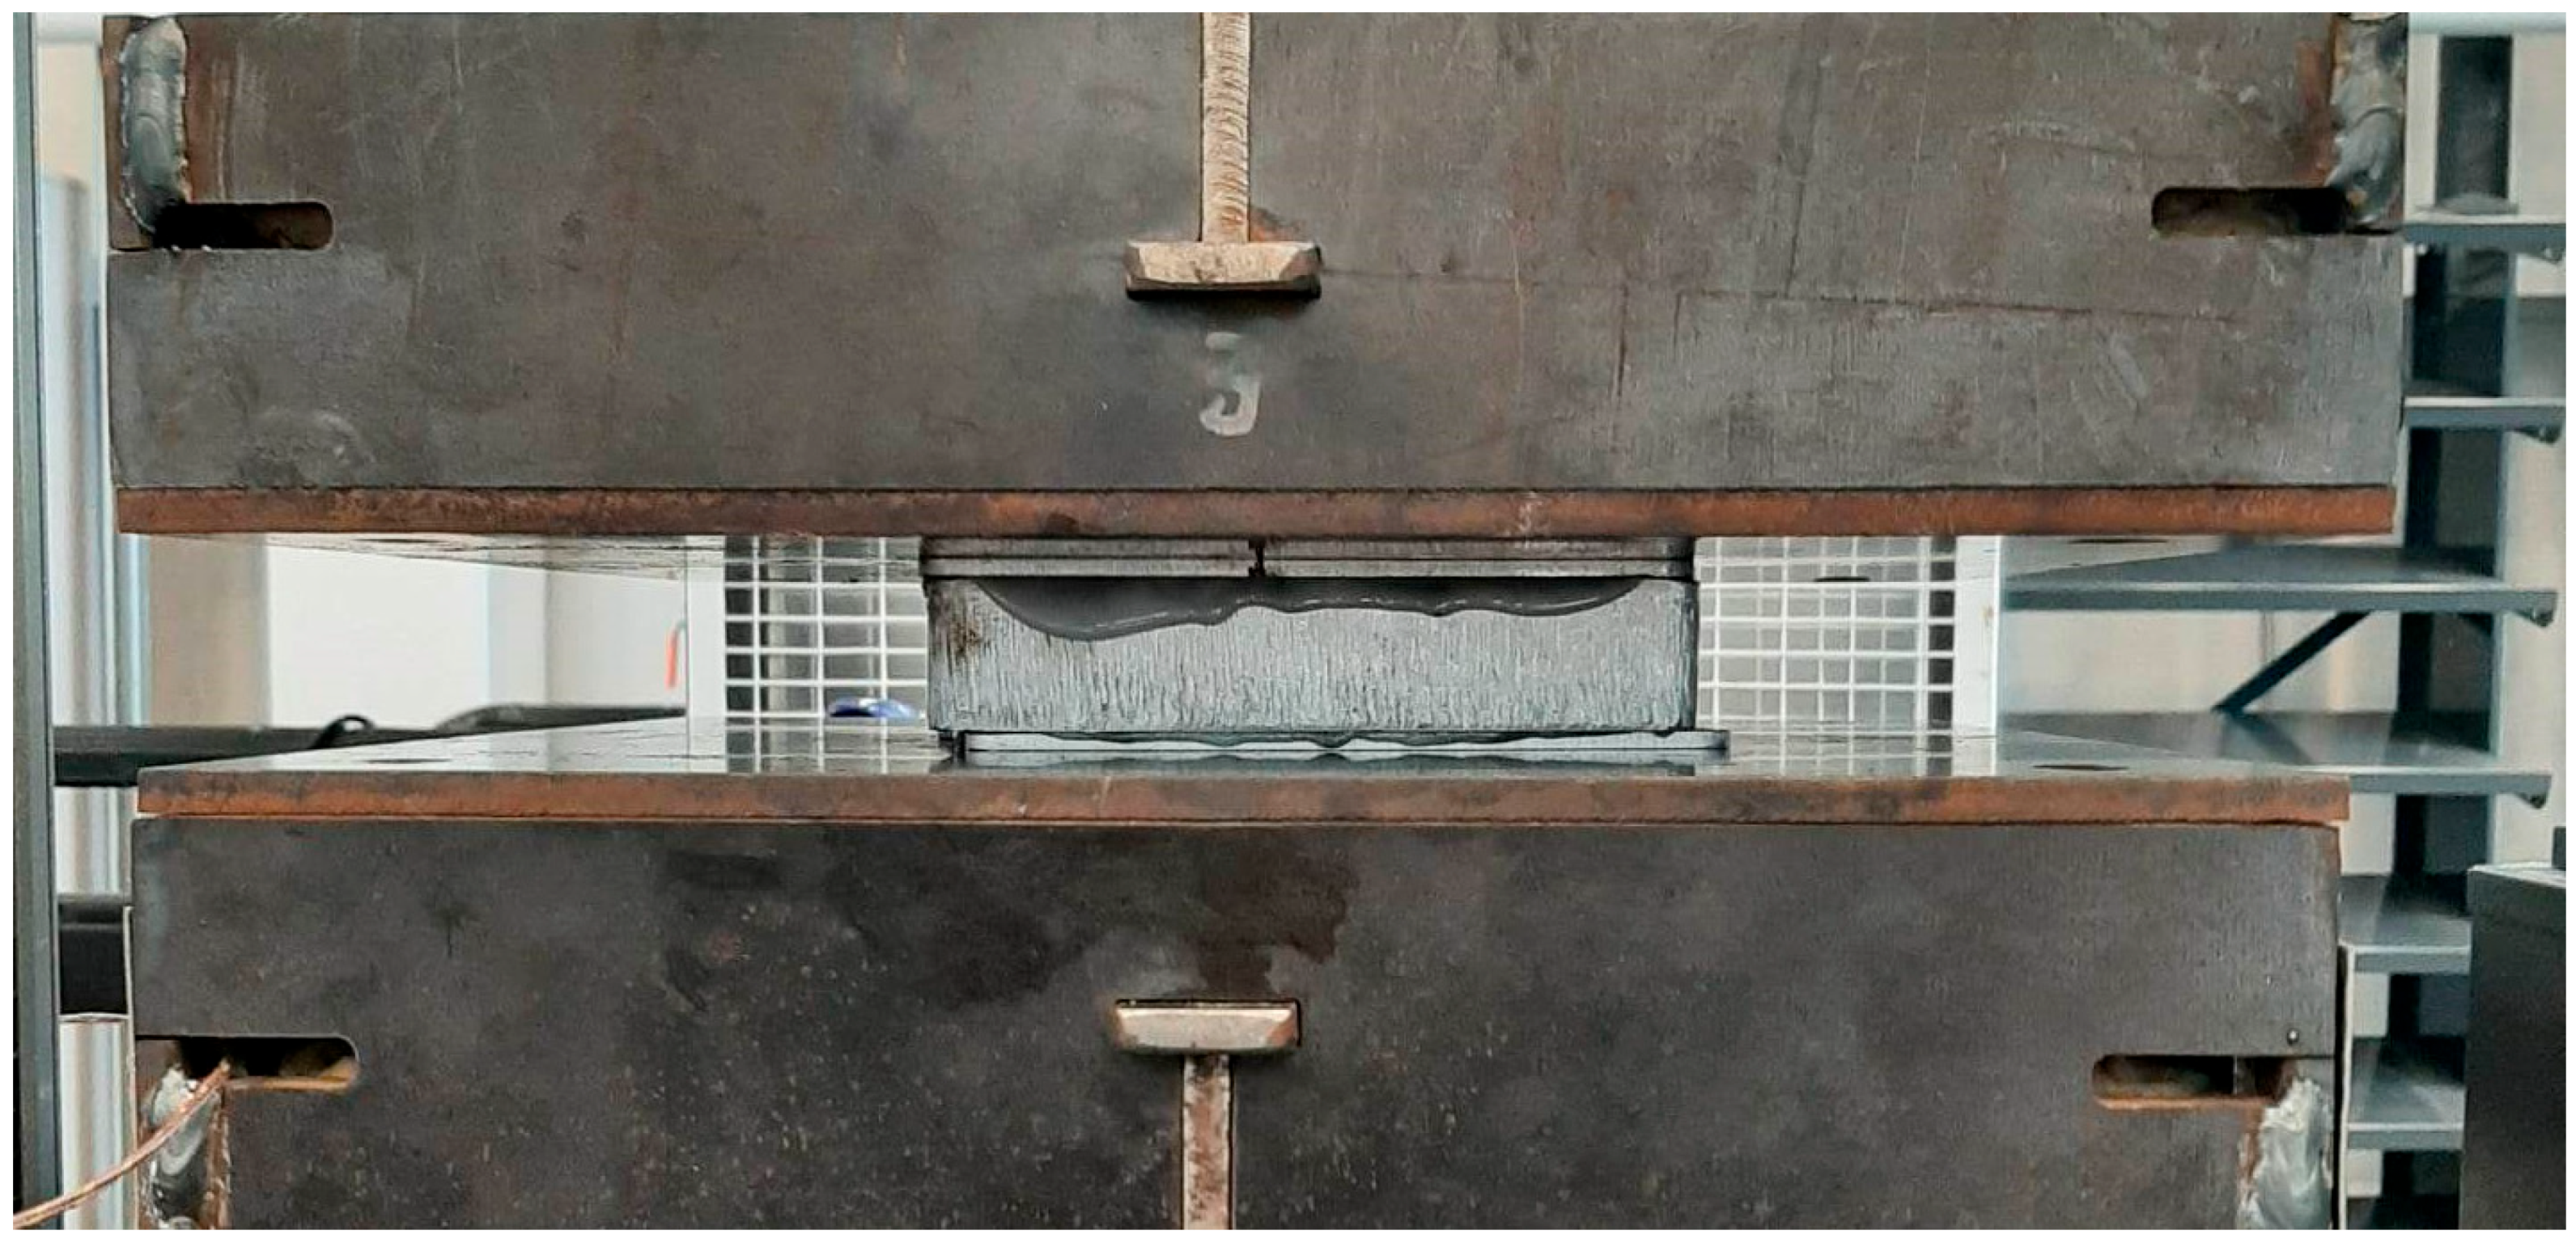
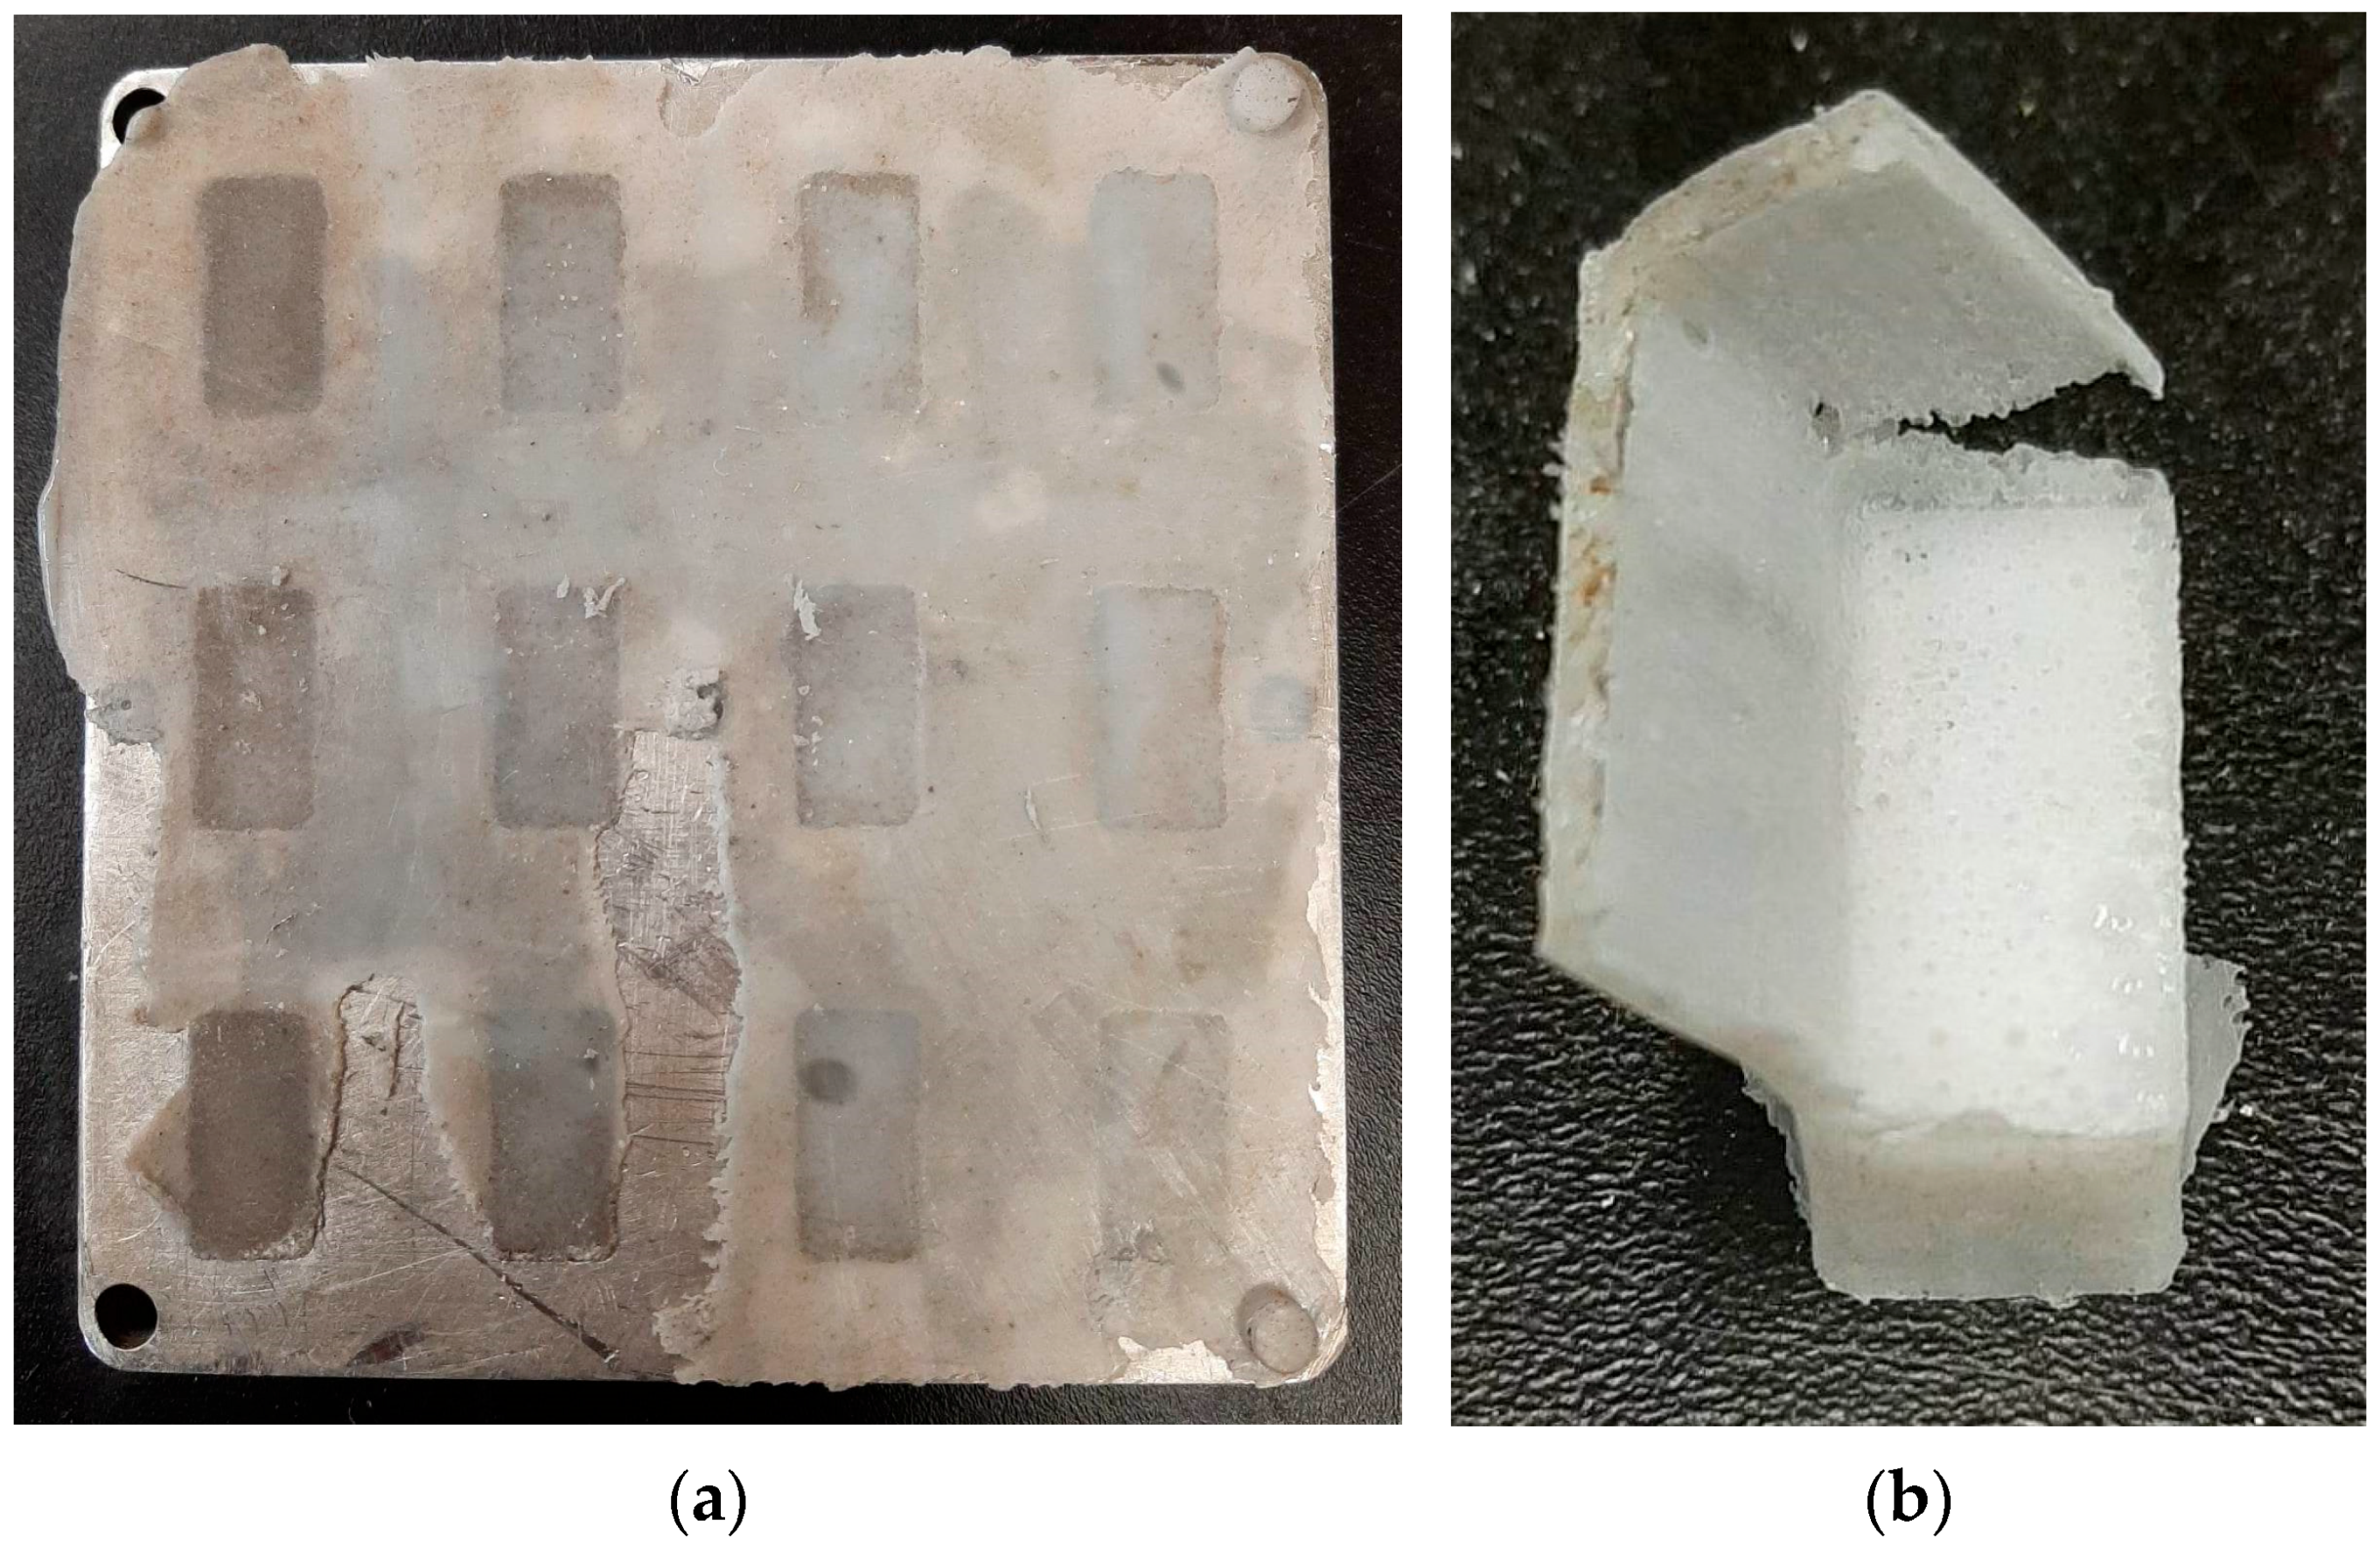
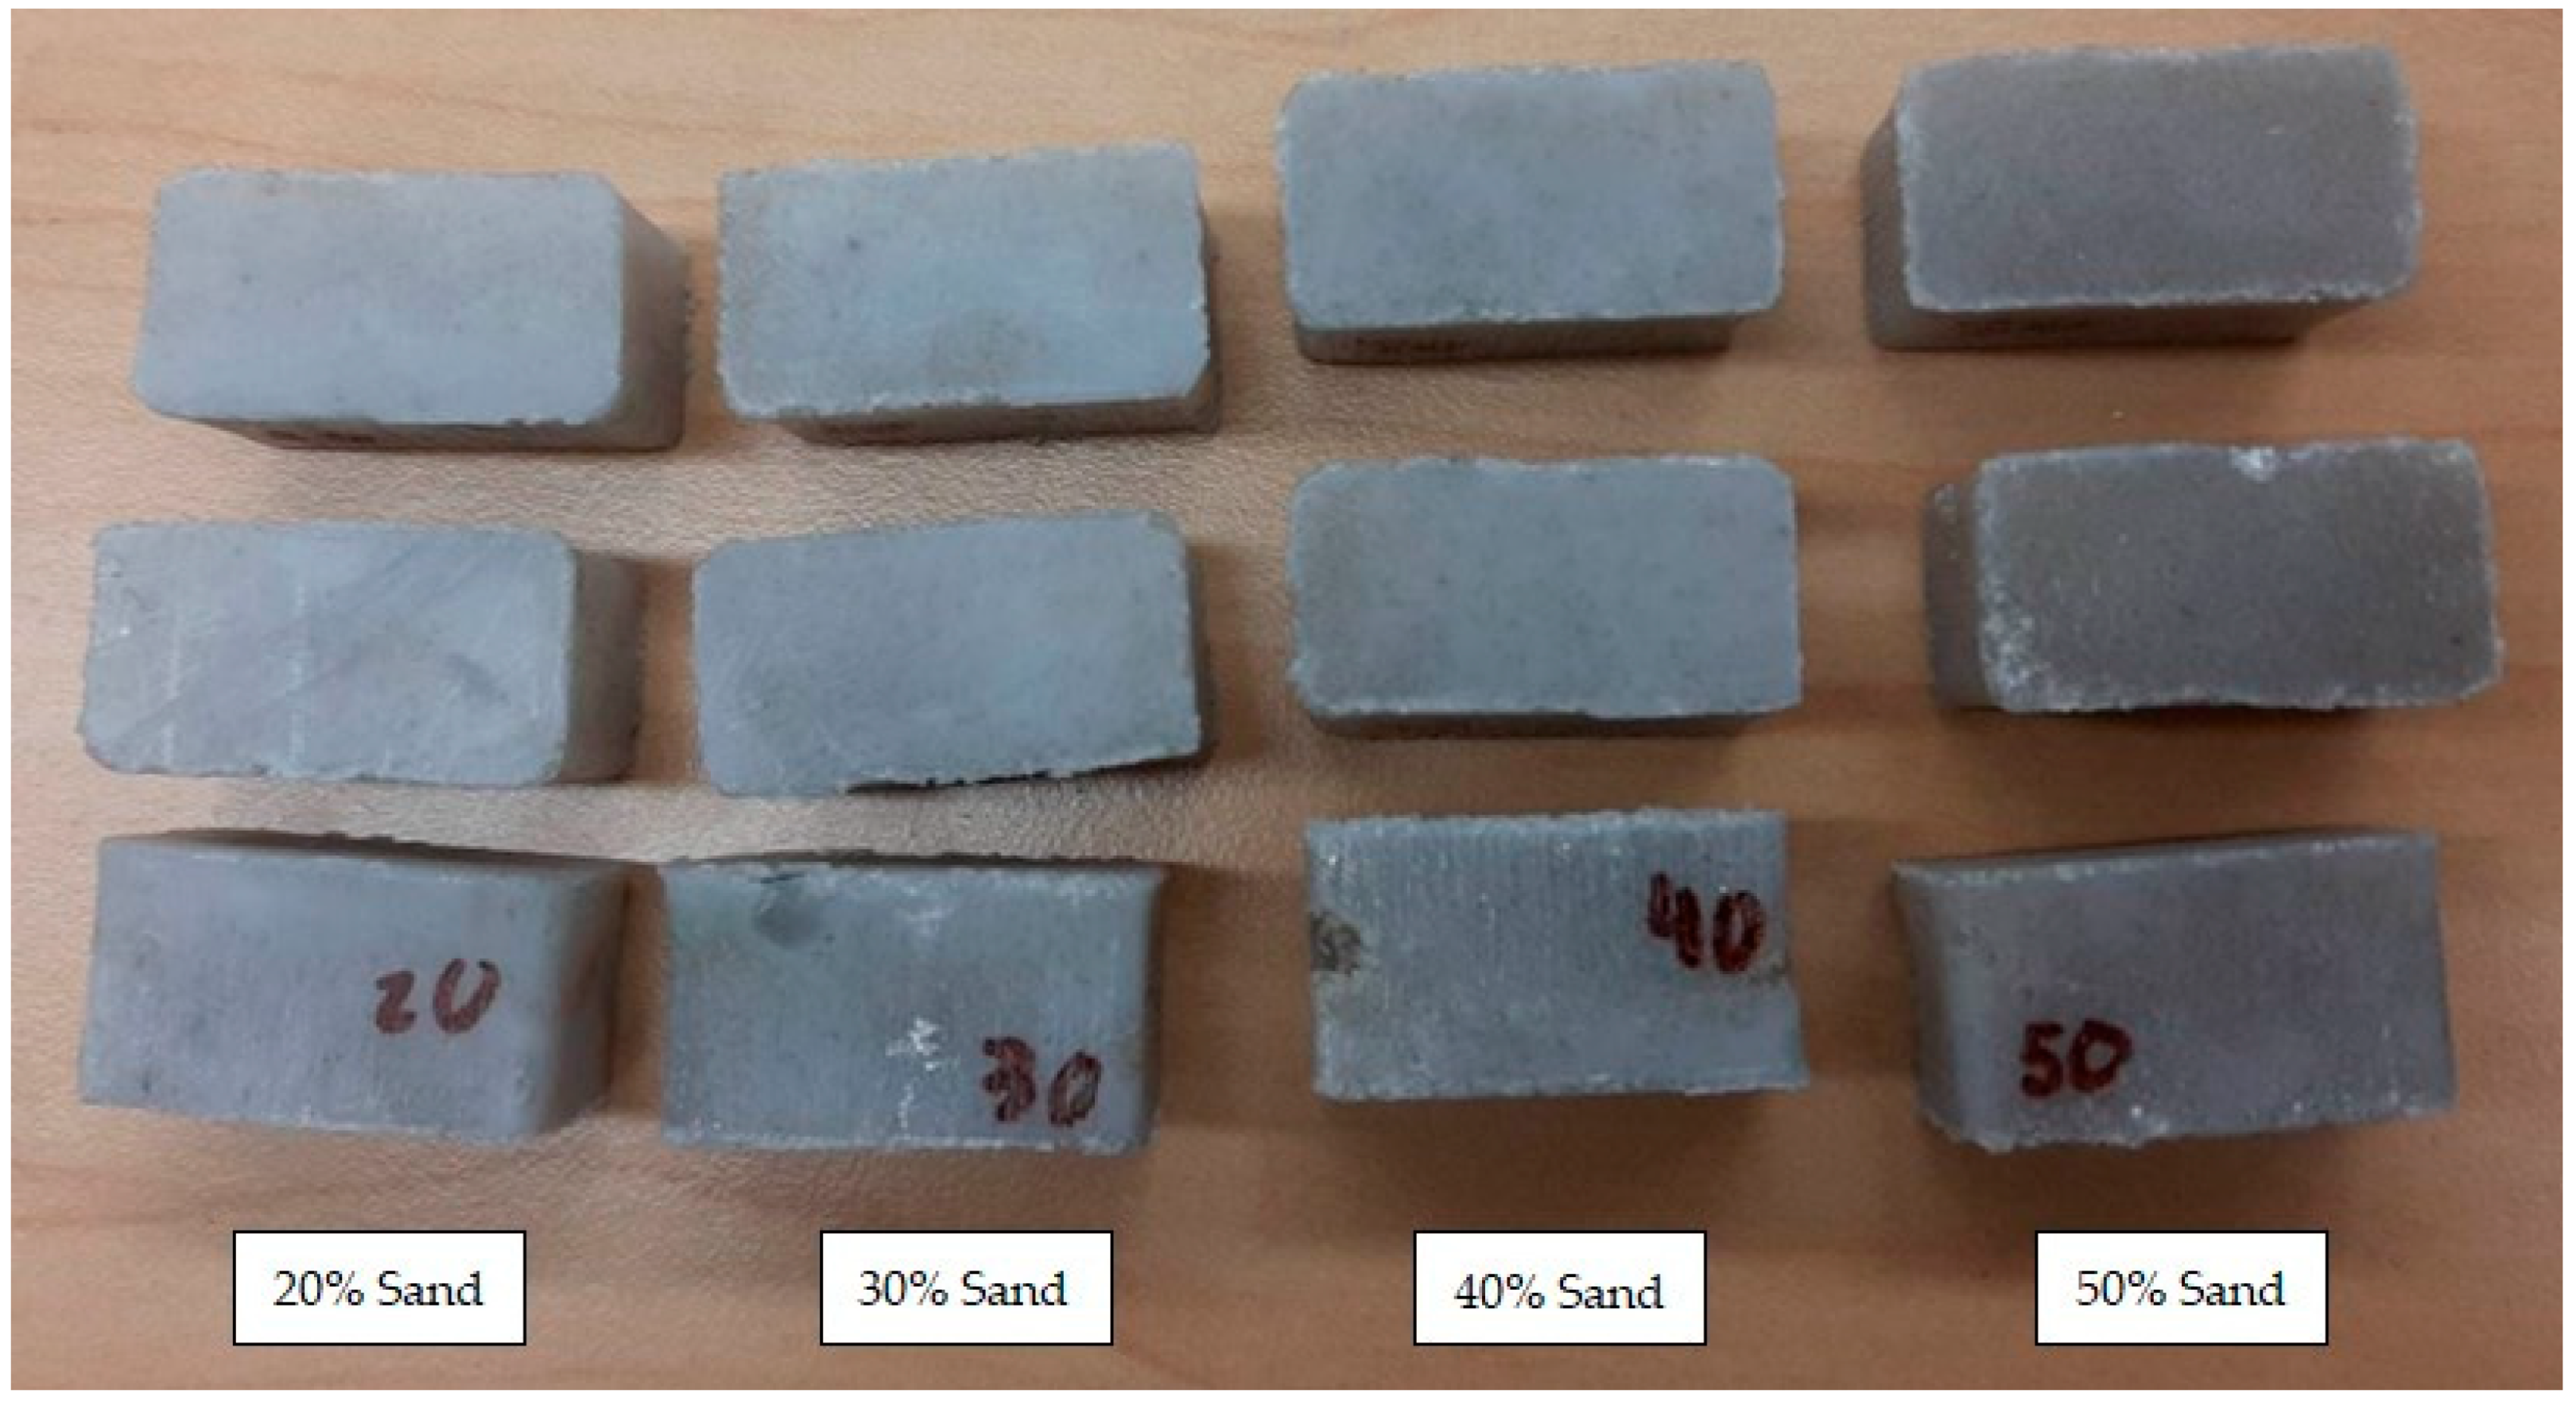
2.2. Production of Sand–Plastic Composite Samples

Before pressing any samples, the hot press was closed, and the plates were preheated to 300 °C. This temperature was chosen based on the melting temperature of the PC and previous testing with 100% recycled PC in the same mold, which demonstrated desirable flow behavior at this elevated temperature. During this time, the necessary quantities of sand and plastic to achieve each of the 20–50% sand compositions were weighed, and the mold was loaded. The ratio of masses required for each set of testing was calculated based on the density of the two materials comprising the sample and the volume of the mold being filled. It was assumed that the density of the PC and sand was 1.2 g/cm3 [30] and 1.6 g/cm3, respectively [36].
As the mold volume is small relative to the grain size of the PC, and there is no way to evenly mix the sand and plastic dry, the addition of the sand and plastic to the mold could not be performed all at once. As a result, the optimized procedure required measuring the plastic and sand in consistent ratios and adding them to the mold in batches so that the plastic could melt in between each addition. To begin, the pocket mold was set on top of the mold lid and ½ the amount of plastic for each of the four compositions was added to each pocket. The pocket mold and mold lid (lower) were then placed in the hot press and allowed to heat for 5 min or until the PC melted. Once complete, the mold was removed, and the missing ratio of sand was added. Working quickly, the sand was manually stirred into the viscous plastic until visual homogeneity was achieved. At this time, another batch of plastic was added on top, and the mold returned to the hot press. After an additional 5 min, the mold was removed, and the missing sand was added and stirred. This process was repeated until the mold was filled with the original calculated masses of sand based on mold volume with an additional excess of material to account for expelled flash. The resulting weights that were used are summarized in Table 1.
Once the mold was fully loaded, the plugs were placed on top of each pocket, followed by the lid. The complete mold was returned to the hot press and the platens were closed until just contacting the lid. The fully loaded mold before compression can be seen in Figure 4. Notice that the plugs are proud of the mold surface. This is to be expected, as the mixed plastic and sand will reduce in volume once compressed, and excess material will fill the void surrounding the plugs as a flash.
The freshly loaded mold was allowed to heat for 5–10 min before applying pressure. The pressure was incrementally increased to approximately 15,000 N based on the manually observed resistance of the mold as the plastic continued to flow. Once the lid of the mold was fully contacting the middle body, the system was maintained at a constant temperature and pressure for 30 min. After this time, the hot press was turned off, external box fans were turned on and aimed across the platen surface, and the mold was allowed to cool under pressure. The fully compressed mold can be seen in Figure 5.
Once the mold had reached room temperature and was safe to handle, the mold was cracked open (prying using thin putty knives and a hammer was most effective). Each sample was ejected by applying pressure to one plug at a time within a vice and forcing each completely through the mold. Damage to the samples was avoided by only contacting the plug surface during part removal. Once removed, all excess flash was trimmed from the samples using snips, and any irregularities were smoothed over with sandpaper. The results from pressing and ejecting the mold can be seen in Figure 6.
Once the parts were cleaned, they were each placed lengthwise in an Instron 5980 Series Universal Testing machine and subject to a compressive load at a strain rate of 1.3 mm/min until failure, in accordance with ASTM D695 [31]. The force and displacement for each sample were recorded until visible signs of failure were observed in the form of cracks or splits and the test stopped. This mold design allows for a total of 12 samples to be produced under the same process controls. As a result, once the loading procedure and temperatures were confirmed, the control for 100% PC was determined in a sample test using all 12 cells. Following PC, the four material compositions were tested simultaneously with 3 samples associated with each.

3. Results

The plastic sand bricks produced demonstrated macrohomogeneity and minimal porosity. At low sand compositions (30% sand and below), the samples’ viscosity and appearance were nearly identical to pure PC. The increase from 30% to 40% sand, however, showed a dramatic increase in both visible sand and working texture. While liquid and high sand compositions (40% and 50% sand) were more viscous than the low sand compositions, the cooled bricks retained a “gritty” texture. This resulting gradient is demonstrated in Figure 7, where the stark contrast between 20% sand and 50% sand can be seen.
After each sample was subjected to a compression test to failure, the resulting stress–strain curves were plotted and compared to a 100% recycled PC sample produced using the same mold and process. The resulting strength behavior in Figure 8 was observed.
Figure 8 shows that the addition of sand directly affects the compressive strength, compressive modulus, and failure mode of a PC sand brick. At low sand compositions, the compressive yield strength has notably lower averages than the 71 MPA recorded for 100% PC with a minimum of 51 MPa at 20% sand. As the percentage of sand increases, the compressive strength of the samples also increases until a maximum of 71 MPa at 50% sand is reached. The reduced strength at low sand compositions can be associated with an additive threshold for which sand behaves as an impurity at insufficient amounts and as a reinforcement above this threshold. The compressive modulus or compressive stiffness (slope of the linear region prior to plastic yield) of the low sand compositions has no change from the control at an average of 1.43 GPa but increases with higher sand contributions to ultimately exceed the control at 50% sand and achieve a modulus of 2.44 GPa. The maximum and average compressive strengths of each PC sand composition are summarized in Figure 9.
The 40% and 50% sand compositions experienced a more consistent response to stress between trials, and their strength was comparable to the 100% PC control more than samples with lower percentage contributions of sand. This is shown by the higher standard deviations for 20%, and 30% sand in comparison to the lower deviations for the 40% and 50% sand samples (Figure 10).
At 50% sand composition, the critical distinction from 100% recycled PC is the increase in compressive modulus and the change in failure mechanism. As the ratio of sand increases, the compressive stiffness of the brick increases, and the plastic region of the curve follows yield plateaus (Figure 8). This pattern deviates from the low sand compositions in which the higher PC ratio allows the sample to continue to deform and flow at increasingly high stresses and strains. This can be seen by comparing the control values at fracture to the sand samples in Figure 8. The 100% PC control has a smooth plastic region that increases exponentially until the sample fractures at a final strain of 0.63. Alternatively, the 50% sand samples achieve a strain of only 0.49 after a plateau, equivalent to the yield strength. A gradient of incrementally lower fracture stress and strains can be observed as the percentage of sand increases from 20% to 50% until a minimum is reached at 50%. This pattern is a product of the thermoplastic’s ability to flow and the tradeoff to the more brittle shear/cracking behavior of a concrete-like material as sand is added [37]. The high strains at fracture associated with lower sand compositions can only be achieved by having material flow outward to conserve the sample material and increase the effective cross-section capable of withstanding higher stresses. This change in the cross-section and flow behavior is emphasized in Figure 10. This high stress at fracture would suggest increased structural potential, and the severe strain and cross-sectional deformation make this plastic region largely inconsequential to most load-bearing cases. Alternatively, as the composition of sand is increased, the sample flows less, resulting in a lower strain and a less deformed neutral cross-section.
The failure mechanism of high sand compositions more closely reflects that observed in concrete due to the transition from ductile to shear failure. This can be seen in Figure 11 following the indicated shearing line of action. The PC acts as a binder for the sand and enables the sand to contribute to the rigidity of the sample. This explains the increase in strength and stiffness up to failure, at which point the sand begins to separate from the PC, causing cracks to propagate between the grains of sand and along the shear plane until the material crumbles to the same effect as concrete [37]. The contribution of sand to crack propagation and shear failure can be observed by comparing the curves in Figure 8. The control demonstrates smooth stress vs. strain behavior in the plastic region following yield as the material flows. Alternatively, all sand composites show visible fluctuations from a theoretical smooth curve in the plastic region, with more appearing as the percentage of sand increased. The moment sand is introduced to the material, the smooth flow behavior of the thermoplastic is interrupted to a varying degree, depending on the amount of sand used.
Therefore, it can be concluded that the 50% sand composition most closely mimics high-performance concrete at a reduced density of 1.86 g/cm3 and contributes to increased compressive stiffness, increased compressive strength, and shear failure at lower strains than 100% recycled PC.

4. Discussion

Utilizing ASTM standard test methods is an integral part of validating the use of recycled waste plastics in structural applications. Recycled polymers do not have guaranteed mechanical properties due to unknown batch characteristics, additives, and lifetime. As a result, utilizing the appropriate standard test methods following the methodology conducted in this paper is critical for pushing the use of recycled waste plastics.
The compressive strength tests performed in this study demonstrate the desirable mechanical properties of PC sand composites. Compared with previous studies reporting maximum compressive strengths of 32.7 MPa for 3:1 LDPE sand bricks [24], PC sand bricks at nearly any sand percentage doubled the compressive strength to an average of 51–71 MPa. Furthermore, the 40% and 50% sand composites support the viability of using PC sand composites as concrete substitutes in both general construction applications where strength demands do not exceed 30 MPa, and potentially even in mid-to-high-strength applications [26]. At 40% and 50% sand compositions, the strength of 70 MPa and 71 MPa, respectively, achieve and exceed the minimum threshold compressive strength of 70 MPa for high-performance concrete [26]. With a density of 77.5% of that of concrete, this lightweight alternative reduces the need for manufacturing new construction materials and provides an additional recycling opportunity for nonbiodegradable waste plastics.

4.1. Applications

Researchers have also used recycled plastics such as polyethylene terephthalate (PET), polypropylene (PP), expanded polystyrene (EPS), and recycled rubber (mechanically ground or cryogenically processed) to form concrete composites with a reduced density and improved thermal and sound isolating properties [38]. Other research has shown that plastics can also be used as microcrack stoppers in concrete [39]. Recycled materials, such as electroplating sludge and fly ash, have also been utilized to manufacture lightweight concrete, paver blocks, bricks, and structural components [40]. Limited studies have investigated the use of sand and an acrylonitrile styrene acrylate (ASA) polymer for outdoor applications, such as sidewalk paving bricks [41]. This has the potential to be further extended into road surfaces with PC due to the high durability, UV resistance, and high-temperature resistance of this material. Polycarbonate also demonstrated excellent flow behavior around the sand at high temperatures in molds. These various studies support the upscaling of this batch mixing method to achieve large bricks or tiles for path laying, cobbled roads, or housing. Furthermore, due to the variability in color, PC and sand could provide lighter paved products to offset much of the heat trapped by existing dark asphalt solutions [10].
With these promising results, the high-performance PC sand compositions can also be applied as footings for ground-mounted fixed and variable tilt solar photovoltaic systems. These footings would provide an opportunity to directly test the capabilities of PC and sand as a concrete substitute while also reducing the emissions associated with the manufacturing and installation of a clean energy source.
With appropriate testing, PC sand composite can also be used as a sustainably sourced material for construction applications. Moreover, with developments in distributed recycling and additive manufacturing (DRAM) [42], PC sand composite can be (i) 3D printed using a large-format 3D printer with a high-flow extruder [43,44], (ii) made into bricks and pick-and-placed [45,46,47,48], or (iii) extruded into molds [49]. Further, recycled plastic aggregates can also be used in mortars. Research has shown that polyolefin waste can be used as a partial replacement in hydraulic mortars for pavement blocks to improve thermal insulation as well as the water vapor permeability of the mortar [50].

4.2. Future Directions

The methodology applied here and the associated mold design provide a repeatable method for validating plastics against the ASTM D695 standard test [31] and will be used to further test additional waste polymers, such as HDPE and LDPE, in the future. Due to the availability of HPDE and existing studies citing LDPE as a strong composite alternative [24], these materials offer excellent next targets.
In these future tests, it is worth exploring alternative mixing strategies that could be employed to promote a more homogenous sample. Alternative research approaches have used an external mixing chamber to introduce the plastic to preheated sand under continuous agitation [51]. Once the mixture is homogenous, it can be poured directly into the mold and stamped down. This may help to avoid cases where pockets of unmixed sand were observed at the corners of the mold. An example of these edge defects formed by unmixed sand can be seen in Figure 12. With improved homogeneity, the mechanical properties of the samples will improve as well.
To continue pursuing concrete substitutions, these higher-percent sand compositions may also benefit from being tested against the ASTM C39 standard for compressive strength of cylindrical concrete specimens [52]. This study would need to be conducted using PC sand composites in addition to a concrete control to better quantify and compare the exact strength and stiffness behavior under the same strain rates. Stiffness acts as the primary distinguishing feature between concrete and PC sand composites at high sand proportions and must be further investigated. Concrete is also subject to shrinkage tests to determine the quality of the batch. These tests are normally conducted to determine shrinkage from water loss as the concrete dries, and a similar test must be completed for PC sand bricks to determine how much the thermoplastic shrinks as it cools and solidifies. The average shrinkage values for PC are 0.5–0.7% [53] for injection molding and must be validated after the introduction of sand. Further, concrete must be tested using ASTM C231 [54] and/or ASTM C173 [55] to determine the air content within the concrete. These tests are critical for determining how the material will sustain frost-related damage [56]. Concrete, on average, sees an air content of 6%, and these same tests can be extended to PC sand bricks.
To quantify the PC sand bricks’ response to environmental elements, additional testing will be required on all future samples. Principally, a water absorption test must be conducted should this material be used outdoors. This test can be extrapolated to include strength response under cold and frost conditions. This behavior is critical in determining their efficacy in northern communities and supporting their use as solar rack footings. Additional tests that can be run to maintain the standard tests upheld by other researchers on plastic sand bricks include a hardness test, thermal resistance test, efflorescence test, and 3-point bending test [22,51]. Finally, a full lifecycle analysis must be run on the system to quantify the environmental benefits of using this composite as an alternative to concrete. At the end of the lifecycle, it is anticipated that PC sand bricks can be sorted based on composition, reground, and used either as an alternative mixed aggregate in traditional concrete or recycled directly into new PC sand bricks. This investigation must be extended in the future to examine the economic viability of using waste PC as a cost competitor to fresh concrete mixes.

5. Conclusions

The preliminary results of this study demonstrate that PC can be mixed with varying amounts of sand to produce a viable composite for use as high-strength construction materials and concrete substitutes. The purpose of this study was to design a repeatable production method to manufacture and test PC and sand samples with compositions of 20%, 30%, 40%, and 50% sand in adherence with the ASTM standard D695 for rigid plastics in compression. The sample’s mechanical properties were then compared to a similarly produced 100% PC control to determine how sand influences the material properties of PC. The resulting stress and strain for each sample composition demonstrated that low sand compositions below 30% experience a reduced compressive strength in comparison to the control. At higher sand concentrations of 40% and 50%, the average compressive strength was comparable to the control. Furthermore, the addition of sand at these higher compositions contributed to an increase in compressive stiffness compared to the control. This increase in stiffness is critical as it transitions the material from a high-strain ductile failure to a low-strain shear failure that more closely mimics concrete failure behavior and maintains the material’s cross-section. Therefore, the following conclusions can be drawn about PC sand composites:
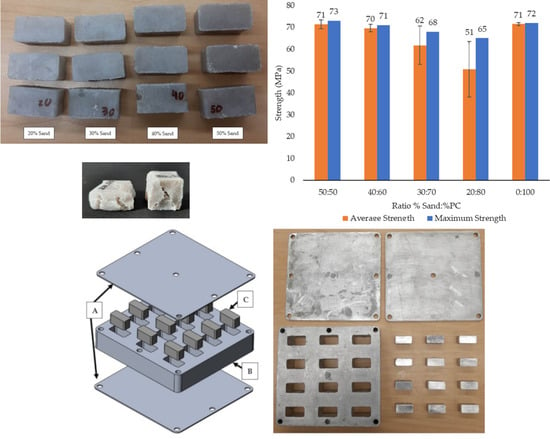
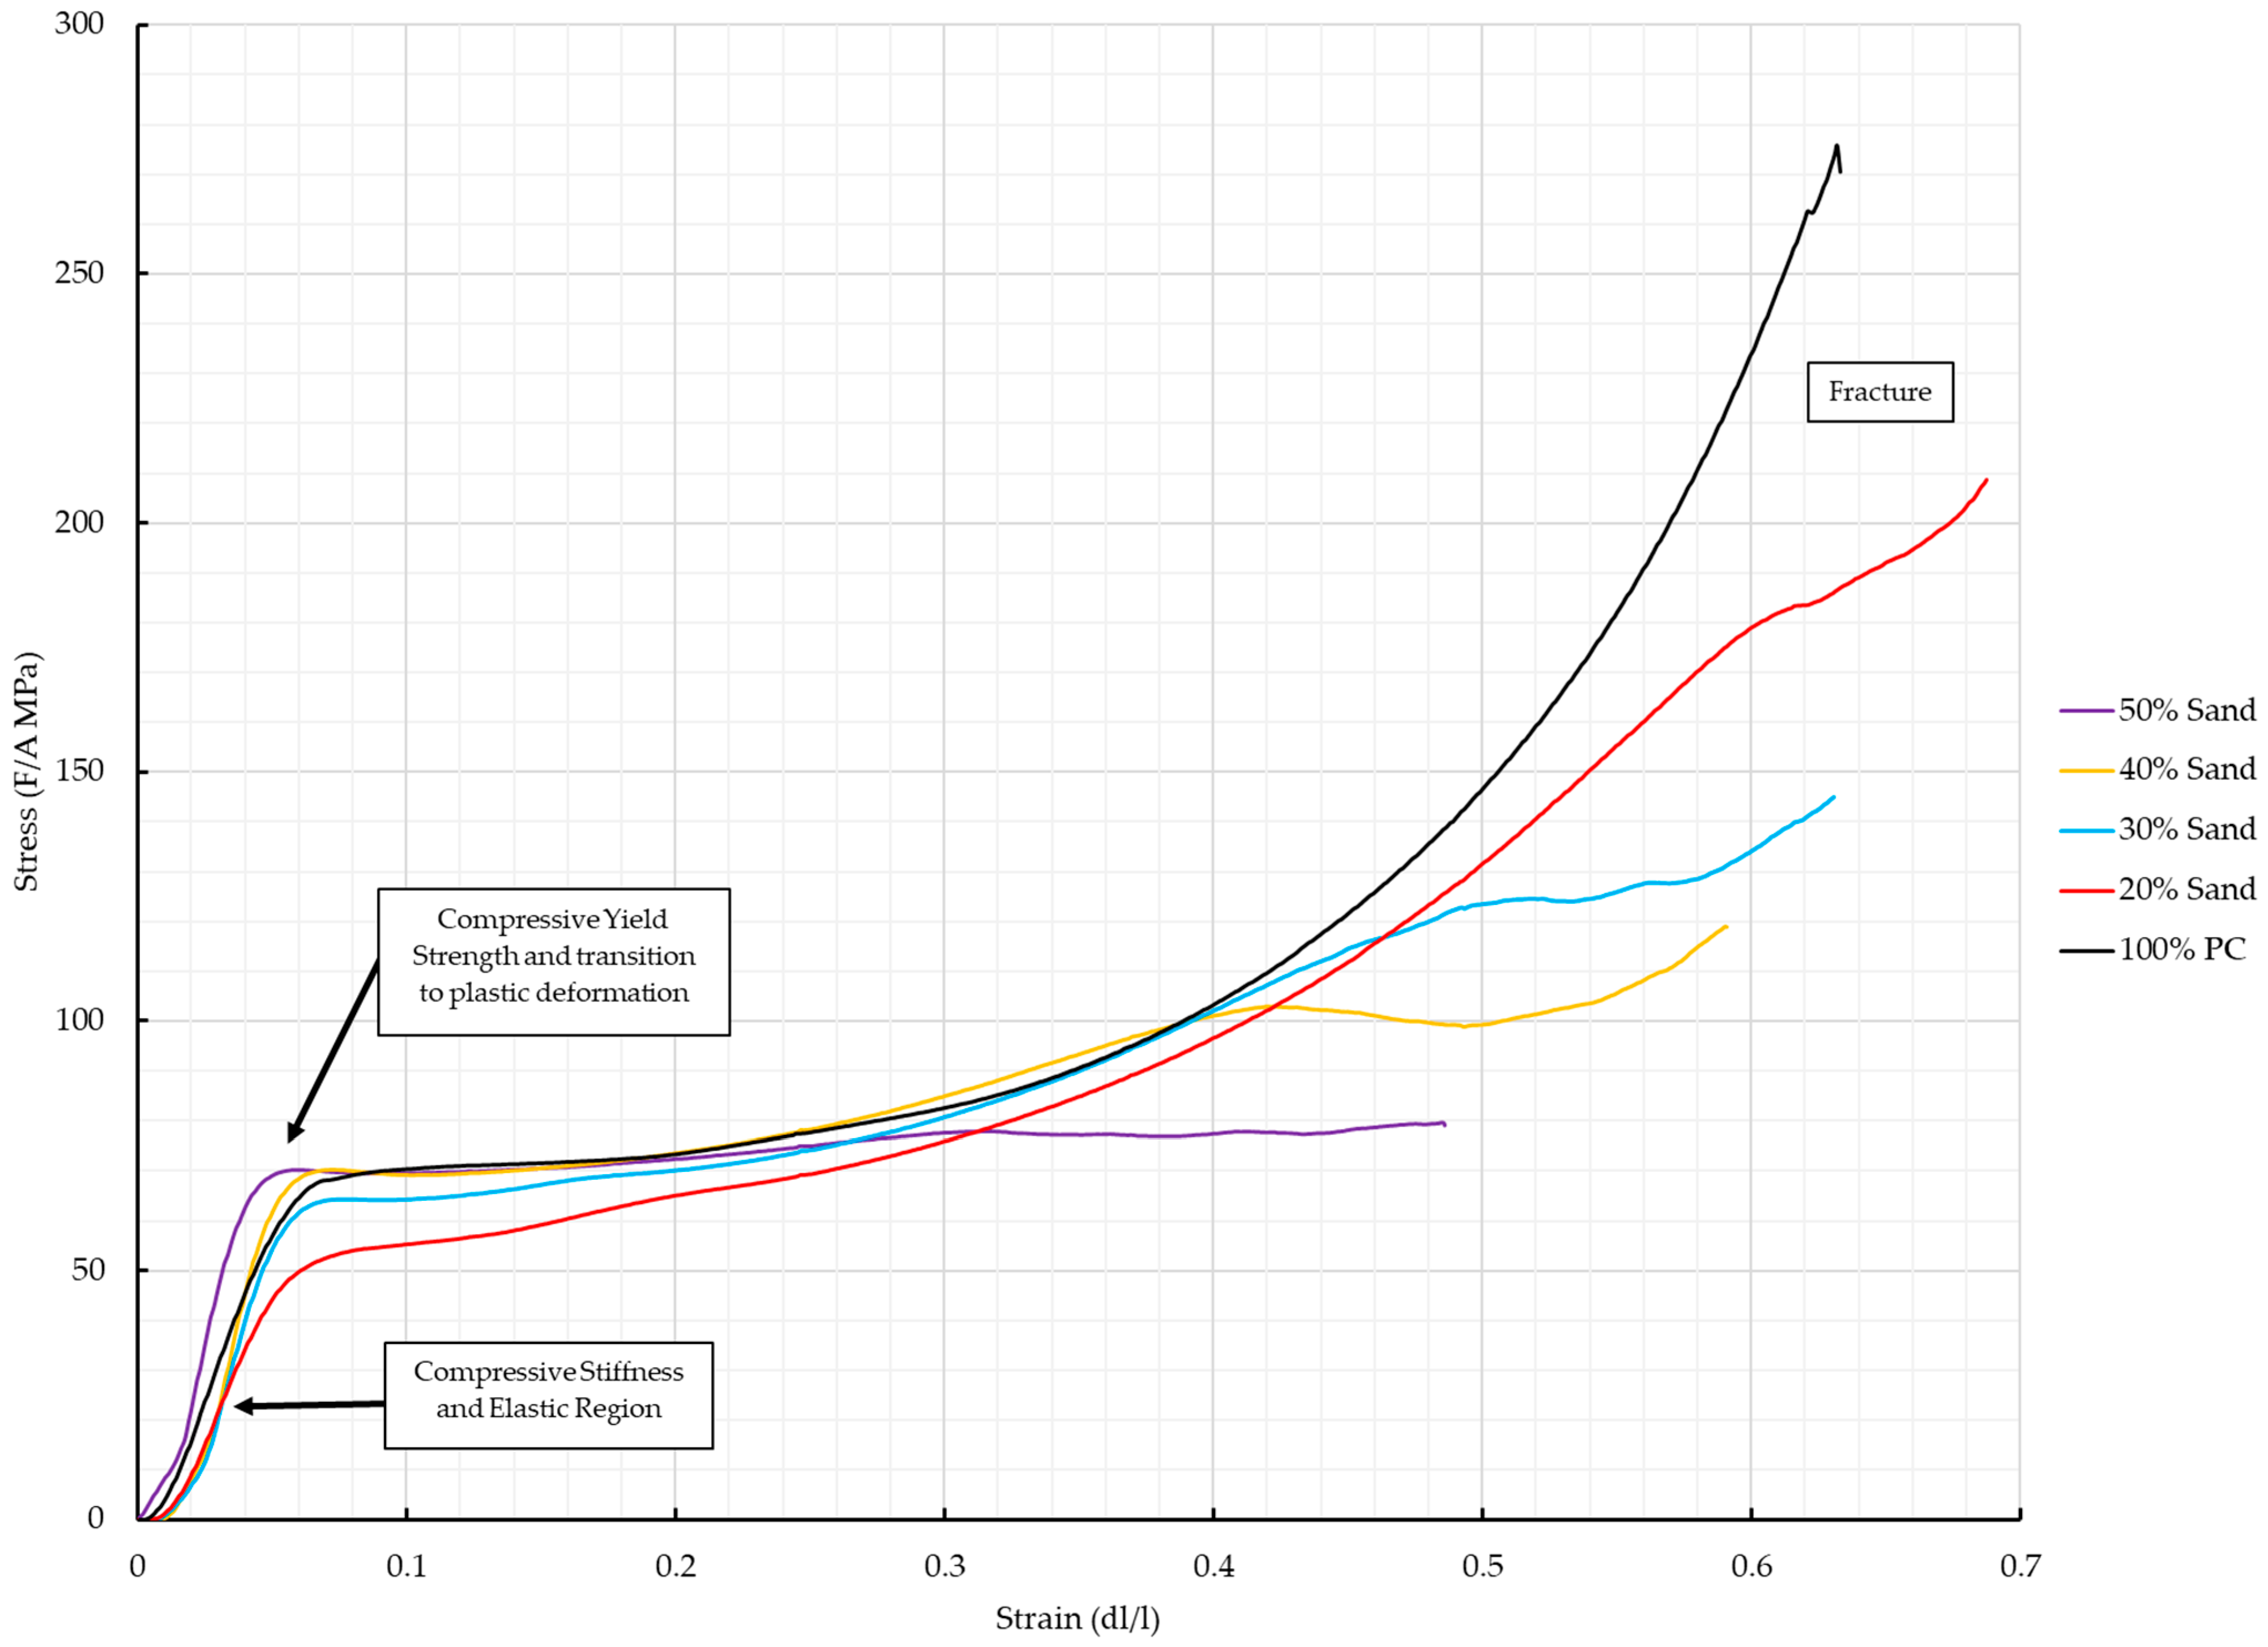
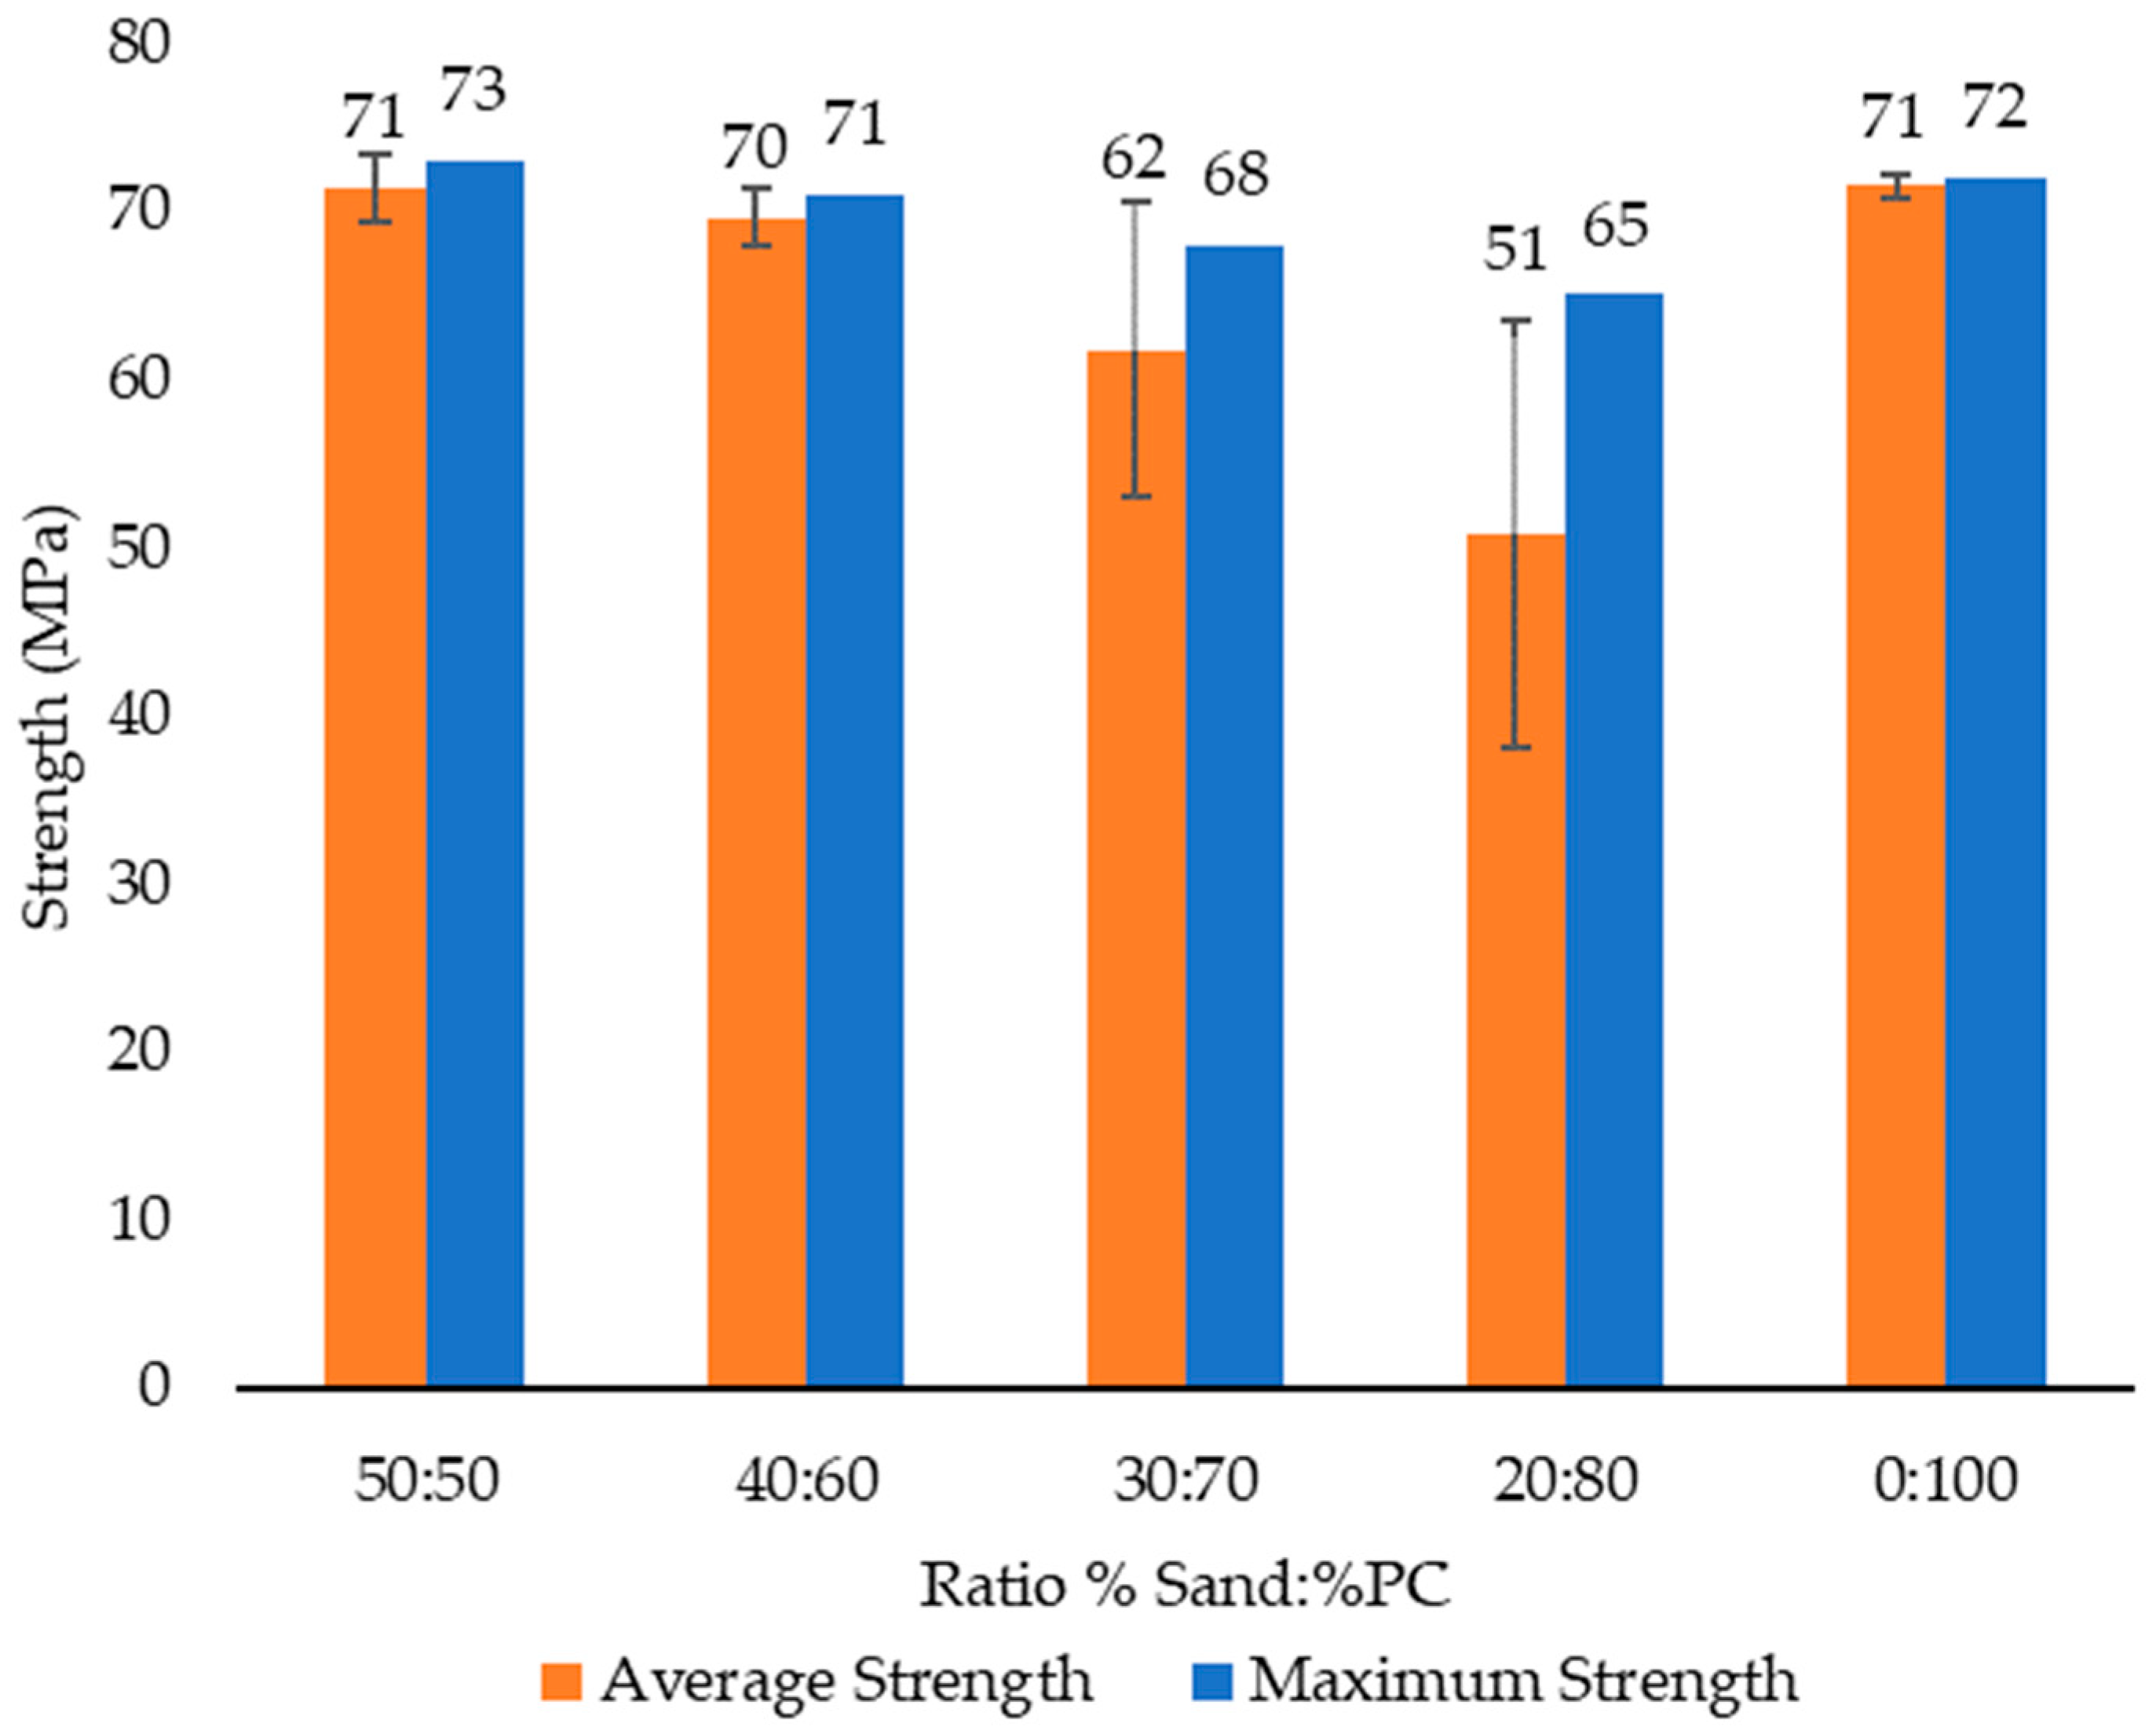
  • Compressive strength and stiffness values achieved for 50% sand samples both meet and exceed the results observed in the control, as well as the average strength demands of commercial concrete (23.3–30.2 MPa) and high-performance concrete (70–80 MPa minimum).
  • With an average density of 1.86 g/cm3, this lightweight alternative to concrete has the potential to be applied across a variety of construction applications, such as alternative bricks or paver blocks for use in path laying, walls, cobbled roads, or housing.
  • When combined with alternative manufacturing methods to pressing, the plastic sand composite could also be extended to applications as a mortar or structural footing.
Future work, however, is necessary for this composite to reach the potential indicated in these results. Additional tests should be run in the future to investigate the shrinkage of PC and sand during solidification and final air content to mirror concrete standard tests. Finally, a more thorough economic and lifecycle analysis must be conducted to determine a cost comparison of this PC sand solution to concrete and its complete environmental impact.

Author Contributions

Conceptualization, J.M.P.; methodology, M.C.W., A.K. and J.M.P.; validation, M.C.W., A.K. and J.M.P.; formal analysis, M.C.W. and A.K.; investigation, M.C.W. and A.K.; resources, J.M.P.; data curation, M.C.W., A.K. and J.M.P.; writing—original draft preparation, M.C.W., A.K. and J.M.P.; writing—review and editing, M.C.W., A.K. and J.M.P.; visualization, M.C.W.; supervision, J.M.P.; project administration, J.M.P.; funding acquisition, J.M.P. All authors have read and agreed to the published version of the manuscript.

Funding

This research was supported by the Thompson Endowment and Natural Sciences and Engineering Research Council of Canada.

Data Availability Statement

Data is available upon request.

Acknowledgments

The authors give their thanks to Melodie Richards and Rob Fox for providing their time, equipment, and expertise during material testing.

Conflicts of Interest

The authors declare no conflict of interest.

References

  1. Statista Research Department Global Plastic Production 1950–2021. Available online: https://www.statista.com/statistics/282732/global-production-of-plastics-since-1950/ (accessed on 8 May 2023).
  2. OECD. Global Plastics Outlook Database Plastic Pollution Is Growing Relentlessly as Waste Management and Recycling Fall Short, Says OECD. Available online: https://www.oecd.org/environment/plastic-pollution-is-growing-relentlessly-as-waste-management-and-recycling-fall-short.htm (accessed on 8 May 2023).
  3. Andrady, A.L. (Ed.) Plastics and the Environment, 1st ed.; Wiley: Hoboken, NJ, USA, 2003; ISBN 978-0-471-09520-0. [Google Scholar]
  4. Gu, L.; Ozbakkaloglu, T. Use of Recycled Plastics in Concrete: A Critical Review. Waste Manag. 2016, 51, 19–42. [Google Scholar] [CrossRef] [PubMed]
  5. Monteiro, P.J.M.; Miller, S.A.; Horvath, A. Towards Sustainable Concrete. Nat. Mater. 2017, 16, 698–699. [Google Scholar] [CrossRef] [PubMed]
  6. Babor, D.; Plian, D.; Judele, L. Environmental Impact of Concrete. Bul. Inst. Politeh. Din Lasi. Sect. Constr. Arhit. 2009, 55, 27. [Google Scholar]
  7. Ellis, L.D.; Badel, A.F.; Chiang, M.L.; Park, R.J.-Y.; Chiang, Y.-M. Toward Electrochemical Synthesis of Cement—An Electrolyzer-Based Process for Decarbonating CaCO3 While Producing Useful Gas Streams. Proc. Natl. Acad. Sci. USA 2020, 117, 12584–12591. [Google Scholar] [CrossRef] [PubMed] [Green Version]
  8. Cement Industry Accounts for about 8% of CO2 Emissions. One Startup Seeks to Change That. Available online: https://www.cbsnews.com/news/cement-industry-co2-emissions-climate-change-brimstone/ (accessed on 11 May 2023).
  9. Tiseo, I. Global Carbon Dioxide Emissions from Cement Manufacturing 1990–2021, by Country. Available online: https://www.statista.com/statistics/1091672/carbon-dioxide-emissions-global-cement-manufacturing/ (accessed on 10 May 2023).
  10. Watts, J. Concrete: The Most Destructive Material on Earth. The Guardian, 25 February 2019. [Google Scholar]
  11. Tiseo, I. Global CO₂ Emissions from Cement Manufacturing 1960–2021. Available online: https://www.statista.com/statistics/1299532/carbon-dioxide-emissions-worldwide-cement-manufacturing/ (accessed on 8 May 2023).
  12. Müller, H.S.; Haist, M.; Vogel, M. Assessment of the Sustainability Potential of Concrete and Concrete Structures Considering Their Environmental Impact, Performance and Lifetime. Constr. Build. Mater. 2014, 67, 321–337. [Google Scholar] [CrossRef]
  13. Alnahhal, M.F.; Alengaram, U.J.; Jumaat, M.Z.; Abutaha, F.; Alqedra, M.A.; Nayaka, R.R. Assessment on Engineering Properties and CO2 Emissions of Recycled Aggregate Concrete Incorporating Waste Products as Supplements to Portland Cement. J. Clean. Prod. 2018, 203, 822–835. [Google Scholar] [CrossRef]
  14. Alsubari, B.; Shafigh, P.; Ibrahim, Z.; Jumaat, M.Z. Heat-Treated Palm Oil Fuel Ash as an Effective Supplementary Cementitious Material Originating from Agriculture Waste. Constr. Build. Mater. 2018, 167, 44–54. [Google Scholar] [CrossRef]
  15. Nwankwo, C.O.; Bamigboye, G.O.; Davies, I.E.E.; Michaels, T.A. High Volume Portland Cement Replacement: A Review. Constr. Build. Mater. 2020, 260, 120445. [Google Scholar] [CrossRef]
  16. Beyond Portland Cement: Low-Carbon Alternatives—The Institution of Structural Engineers. Available online: https://www.istructe.org/resources/guidance/beyond-portland-cement-low-carbon-alternatives/ (accessed on 22 May 2023).
  17. Oliveira, T.C.F.; Dezen, B.G.S.; Possan, E. Use of Concrete Fine Fraction Waste as a Replacement of Portland Cement. J. Clean. Prod. 2020, 273, 123126. [Google Scholar] [CrossRef]
  18. Scrivener, K.; Martirena, F.; Bishnoi, S.; Maity, S. Calcined Clay Limestone Cements (LC3). Cem. Concr. Res. 2018, 114, 49–56. [Google Scholar] [CrossRef]
  19. Miller, S.A.; Horvath, A.; Monteiro, P.J.M. Impacts of Booming Concrete Production on Water Resources Worldwide. Nat. Sustain. 2018, 1, 69–76. [Google Scholar] [CrossRef]
  20. Al-Sinan, M.A.; Bubshait, A.A. Using Plastic Sand as a Construction Material toward a Circular Economy: A Review. Sustainability 2022, 14, 6446. [Google Scholar] [CrossRef]
  21. Suriyaa, M.; Hareharan, P.; Nageshwaran, J.; Nandhini, S.; Sathyamoorthy, R. Experimental Study on Strength Behaviour of Plastic Sand Bricks. Int. J. Sci. Eng. Res. 2020, 9, 6–9. [Google Scholar]
  22. Sahani, K.; Joshi, B.; Khatri, K.; Thapa Magar, A.; Chapagain, S.; Karmacharya, N. Mechanical Properties of Plastic Sand Brick Containing Plastic Waste. Adv. Civ. Eng. 2022, 2022, 8305670. [Google Scholar] [CrossRef]
  23. Bamigboye, G.; Ngene, B.; Ademola, D.; Jolayemi, K. Experimental Study on the Use of Waste Polyethylene Terephthalate (PET) and River Sand in Roof Tile Production. J. Phys. Conf. Ser. 2019, 1378, 042105. [Google Scholar] [CrossRef]
  24. Susila, I.M.; Suardana, N.P.G.; Kencanawati, C.I.P.K.; Thanaya, I.N.A.; Adnyana, I.W.B. The Effect of Composition of Plastic Waste Low Density Polythylene (LDPEI) with Sand to Pressure Strength and Density of Sand/LDPE Composites. IOP Conf. Ser. Mater. Sci. Eng. 2019, 539, 012043. [Google Scholar] [CrossRef]
  25. Yu, Q.L.; Spiesz, P.; Brouwers, H.J.H. Development of Cement-Based Lightweight Composites–Part 1: Mix Design Methodology and Hardened Properties. Cem. Concr. Compos. 2013, 44, 17–29. [Google Scholar] [CrossRef] [Green Version]
  26. Leung, C.K.Y. Concrete as a Building Material. In Encyclopedia of Materials: Science and Technology; Buschow, K.H.J., Cahn, R.W., Flemings, M.C., Ilschner, B., Kramer, E.J., Mahajan, S., Veyssière, P., Eds.; Elsevier: Oxford, UK, 2001; pp. 1471–1479. ISBN 978-0-08-043152-9. [Google Scholar]
  27. Bendler, J.T. Handbook of Polycarbonate Science and Technology; CRC Press: Boca Raton, FL, USA, 1999; ISBN 0-8247-9915-1. [Google Scholar]
  28. Gohil, M.; Joshi, G. Chapter 18—Perspective of Polycarbonate Composites and Blends Properties, Applications, and Future Development: A Review. In Green Sustainable Process for Chemical and Environmental Engineering and Science; Altalhi, T., Inamuddin, Eds.; Elsevier: Amsterdam, The Netherlands, 2022; pp. 393–424. ISBN 978-0-323-99643-3. [Google Scholar]
  29. Polycarbonate Industry Installed Capacity and Capital Expenditure (CapEx) Forecast by Region and Countries Including Details of All Active Plants, Planned and Announced Projects, 2021–2025; Report Code GDCH01222ICR; Market Research Reports & Consulting | GlobalData: London, UK, 2022; p. 97.
  30. Overview of Materials for Polycarbonate, Molded. Available online: https://www.matweb.com/search/DataSheet.aspx?MatGUID=84b257896b674f93a39596d00d999d77&ckck=1 (accessed on 11 May 2023).
  31. ASTM D695; Designation: D695—15 Standard Test Method for Compressive Properties of Rigid Plastics 1. ASTM: West Conshohocken, PA, USA, 2015.
  32. Woods, M.C. OSF. Available online: https://osf.io/jmvu2 (accessed on 11 May 2023).
  33. Woods, M.C. OSF. Available online: https://osf.io/7rbae (accessed on 11 May 2023).
  34. Woods, M.C. OSF. Available online: https://osf.io/tu7bd (accessed on 11 May 2023).
  35. Woods, M.C.; Brooks, C.; Kulkarni, A.; Pearce, J.M. Open Source Cold and Hot Scientific Sheet Press for Investigating Polymer-Based Material Properties. to be published.
  36. Kosmatka, S.H.; Wilson, M.L. Design and Control of Concrete Mixtures: The Guide to Applications, Methods, and Materials. In Engineering Bulletin; 15. Aufl.; Portland Cement Association: Skokie, IL, USA, 2011; ISBN 978-0-89312-272-0. [Google Scholar]
  37. Santiago, S.D.; Hilsdorf, H.K. Fracture Mechanisms of Concrete under Compressive Loads. Cem. Concr. Res. 1973, 3, 363–388. [Google Scholar] [CrossRef]
  38. Alyousef, R.; Ahmad, W.; Ahmad, A.; Aslam, F.; Joyklad, P.; Alabduljabbar, H. Potential Use of Recycled Plastic and Rubber Aggregate in Cementitious Materials for Sustainable Construction: A Review. J. Clean. Prod. 2021, 329, 129736. [Google Scholar] [CrossRef]
  39. Van Gemert, D.; Czarnecki, L.; Maultzsch, M.; Schorn, H.; Beeldens, A.; Łukowski, P.; Knapen, E. Cement Concrete and Concrete–Polymer Composites: Two Merging Worlds: A Report from 11th ICPIC Congress in Berlin, 2004. Cem. Concr. Compos. 2005, 27, 926–933. [Google Scholar] [CrossRef] [Green Version]
  40. Rupal, A.; Meda, S.R.; Gupta, A.; Tank, I.; Kapoor, A.; Sharma, S.K.; Sathish, T.; Murugan, P. Utilization of Polymer Composite for Development of Sustainable Construction Material. Adv. Mater. Sci. Eng. 2022, 2022, e1240738. [Google Scholar] [CrossRef]
  41. Jin, D.; Meyer, T.K.; Chen, S.; Ampadu Boateng, K.; Pearce, J.M.; You, Z. Evaluation of Lab Performance of Stamp Sand and Acrylonitrile Styrene Acrylate Waste Composites without Asphalt as Road Surface Materials. Constr. Build. Mater. 2022, 338, 127569. [Google Scholar] [CrossRef]
  42. Cruz Sanchez, F.A.; Boudaoud, H.; Camargo, M.; Pearce, J.M. Plastic Recycling in Additive Manufacturing: A Systematic Literature Review and Opportunities for the Circular Economy. J. Clean. Prod. 2020, 264, 121602. [Google Scholar] [CrossRef]
  43. Petsiuk, A.; Pearce, J.M. Towards Smart Monitored AM: Open Source in-Situ Layer-Wise 3D Printing Image Anomaly Detection Using Histograms of Oriented Gradients and a Physics-Based Rendering Engine. Addit. Manuf. 2022, 52, 102690. [Google Scholar] [CrossRef]
  44. Rattan, R.S.; Nauta, N.; Romani, A.; Pearce, J.M. Hangprinter for Large Scale Additive Manufacturing Using Fused Particle Fabrication with Recycled Plastic and Continuous Feeding. HardwareX 2023, 13, e00401. [Google Scholar] [CrossRef]
  45. Pritschow, G.; Dalacker, M.; Kurz, J.; Gaenssle, M. Technological Aspects in the Development of a Mobile Bricklaying Robot. Autom. Constr. 1996, 5, 3–13. [Google Scholar] [CrossRef]
  46. Dörfler, K.; Sandy, T.; Giftthaler, M.; Gramazio, F.; Kohler, M.; Buchli, J. Mobile Robotic Brickwork. In Robotic Fabrication in Architecture, Art and Design 2016; Reinhardt, D., Saunders, R., Burry, J., Eds.; Springer International Publishing: Cham, Switzerland, 2016; pp. 204–217. ISBN 978-3-319-26378-6. [Google Scholar]
  47. Basiri, M.; Gonçalves, J.; Rosa, J.; Vale, A.; Lima, P. An Autonomous Mobile Manipulator to Build Outdoor Structures Consisting of Heterogeneous Brick Patterns. SN Appl. Sci. 2021, 3, 558. [Google Scholar] [CrossRef]
  48. Anzai, T.; Zhao, M.; Nishio, T.; Shi, F.; Okada, K.; Inaba, M. Fully Autonomous Brick Pick and Place in Fields by Articulated Aerial Robot: Results in Various Outdoor Environments. IEEE Robot. Autom. Mag. 2023, 2–16. [Google Scholar] [CrossRef]
  49. Dertinger, S.C.; Gallup, N.; Tanikella, N.G.; Grasso, M.; Vahid, S.; Foot, P.J.S.; Pearce, J.M. Technical Pathways for Distributed Recycling of Polymer Composites for Distributed Manufacturing: Windshield Wiper Blades. Resour. Conserv. Recycl. 2020, 157, 104810. [Google Scholar] [CrossRef]
  50. De Luca, F.; Sernicola, G.; Shaffer, M.S.P.; Bismarck, A. “Brick-and-Mortar” Nanostructured Interphase for Glass-Fiber-Reinforced Polymer Composites. ACS Appl. Mater. Interfaces 2018, 10, 7352–7361. [Google Scholar] [CrossRef]
  51. Tsala-Mbala, C.; Hayibo, K.S.; Meyer, T.K.; Couao-Zotti, N.; Cairns, P.; Pearce, J.M. Technical and Economic Viability of Distributed Recycling of Low-Density Polyethylene Water Sachets into Waste Composite Pavement Blocks. J. Compos. Sci. 2022, 6, 289. [Google Scholar] [CrossRef]
  52. Standard Test Method for Compressive Strength of Cylindrical Concrete Specimens. Available online: https://www.astm.org/c0039_c0039m-21.html (accessed on 11 May 2023).
  53. Plastic Service Centers | Shrinkage Information. Available online: https://www.plasticservice.com/shrinkageinformation.aspx (accessed on 12 May 2023).
  54. Standard Test Method for Air Content of Freshly Mixed Concrete by the Pressure Method. Available online: https://www.astm.org/c0231_c0231m-22.html (accessed on 12 May 2023).
  55. Standard Test Method for Air Content of Freshly Mixed Concrete by the Volumetric Method. Available online: https://www.astm.org/c0173_c0173m-16.html (accessed on 12 May 2023).
  56. Concrete Testing Procedures—Tests for Slump & More—Concrete Network. Available online: https://www.concretenetwork.com/concrete-testing/ (accessed on 12 May 2023).
Figure 1. Waste PC regrind used to produce all samples.
Jcs 07 00249 g001
Figure 2. Laser-cut aluminum mold components and alignment orientation. (a) 3-D render and (b) physical components of (A) Mold Lid X2, (B) ASTM D695 Pocket Mold, (C) Mold Plug X12.
Jcs 07 00249 g002
Figure 3. Open-source scientific hot press used for manufacturing all samples. (A) Fixed upper plate insulated subassembly and heater enclosure. (B) Fixed upper pressing plate work surface. (C) Adjustable lower pressing plate work surface. (D) Adjustable lower plate insulated subassembly and heater enclosure. (E) A 4-ton bottle jack for vertical actuation.
Jcs 07 00249 g003
Figure 4. Loaded mold before compression.
Jcs 07 00249 g004
Figure 5. Compressed mold demonstrated by visible flash and sealed lid to mold body.
Jcs 07 00249 g005
Figure 6. (a) Released mold with visible flash. Mold was filled with 50% sand on the left and 20% sand on the right. (b) The 100% PC sample example immediately following part ejection and prior to cleanup.
Jcs 07 00249 g006
Figure 7. Plastic sand bricks matrix of samples. Columns are identified from left to right as 20%, 30%, 40%, and 50% sand-to-plastic ratios by weight.
Jcs 07 00249 g007
Figure 8. Stress vs. strain across a range of sand/PC compositions by weight compared to the optimal 100% PC control. The datasets shown are representative samples of the different compositions.
Jcs 07 00249 g008
Figure 9. Summary of the impact of sand % in the sand/PC composite on maximum strength and average strength (MPa).
Jcs 07 00249 g009
Figure 10. Deformed sample differences between high and low sand compositions. (a) Top view of the 20% sand (left) and 50% sand (right) samples demonstrating the increase in deformation contributing to larger cross-sections in lower sand compositions. (b) Side view of the 20% sand (left) and 50% sand (right) samples indicating higher strain associated with thermoplastic flow in lower sand compositions.
Jcs 07 00249 g010
Figure 11. Shear failure of the 50% sand sample during compression testing.
Jcs 07 00249 g011
Figure 12. Surface defects (circled) caused by plastic sand inhomogeneity during mixing. (a) The 40% sand sample front view, (b) the 40% sand sample side view.
Jcs 07 00249 g012
Table 1. Total mass and ratio of sand and plastic required to fill ASTM D695 standard size molds.
Set 1Set 2Set 3Set 4
Percent Sand (%)20304050
Percent PC (%)80706050
Mass sand (g)2.303.454.606.70
Mass Pc (g)6.655.824.994.16
Disclaimer/Publisher’s Note: The statements, opinions and data contained in all publications are solely those of the individual author(s) and contributor(s) and not of MDPI and/or the editor(s). MDPI and/or the editor(s) disclaim responsibility for any injury to people or property resulting from any ideas, methods, instructions or products referred to in the content.

