
Control-Oriented Electrochemical Model and Parameter Estimation for an All-Copper Redox Flow Battery
 , ,
, ,  and
and
Abstract
: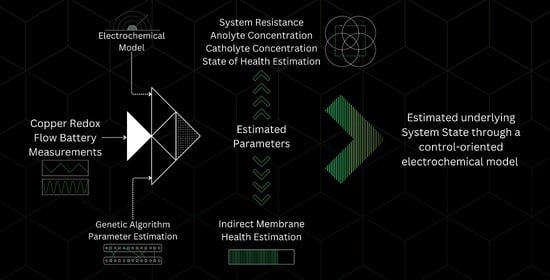
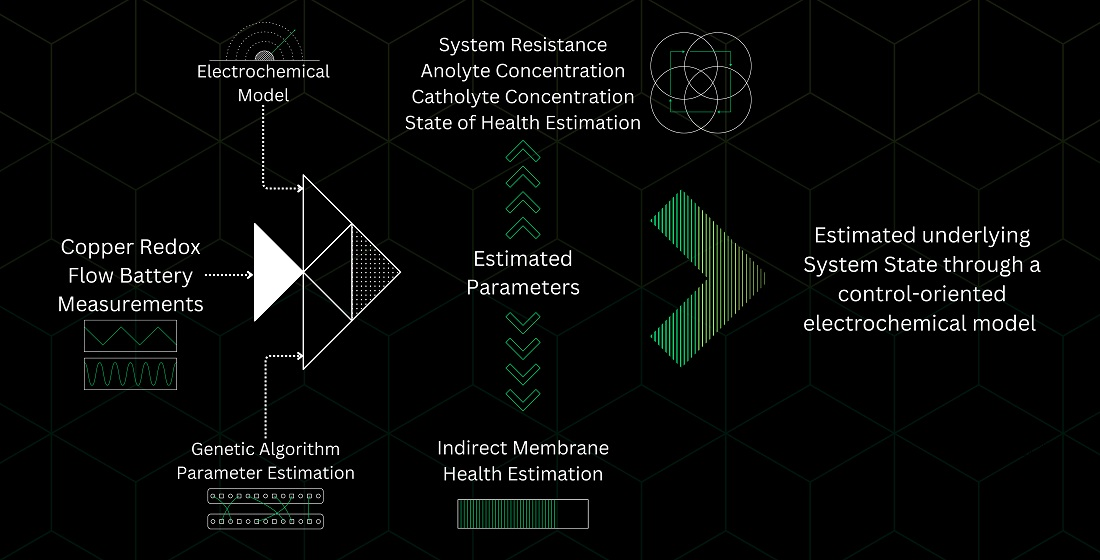
1. Introduction
2. CuRFB Dynamical Model
2.1. Copper Concentration Dynamics
2.2. Cell Voltage
2.3. State of Charge
2.4. Short-Term State of Health
2.5. Long-Term State of Health
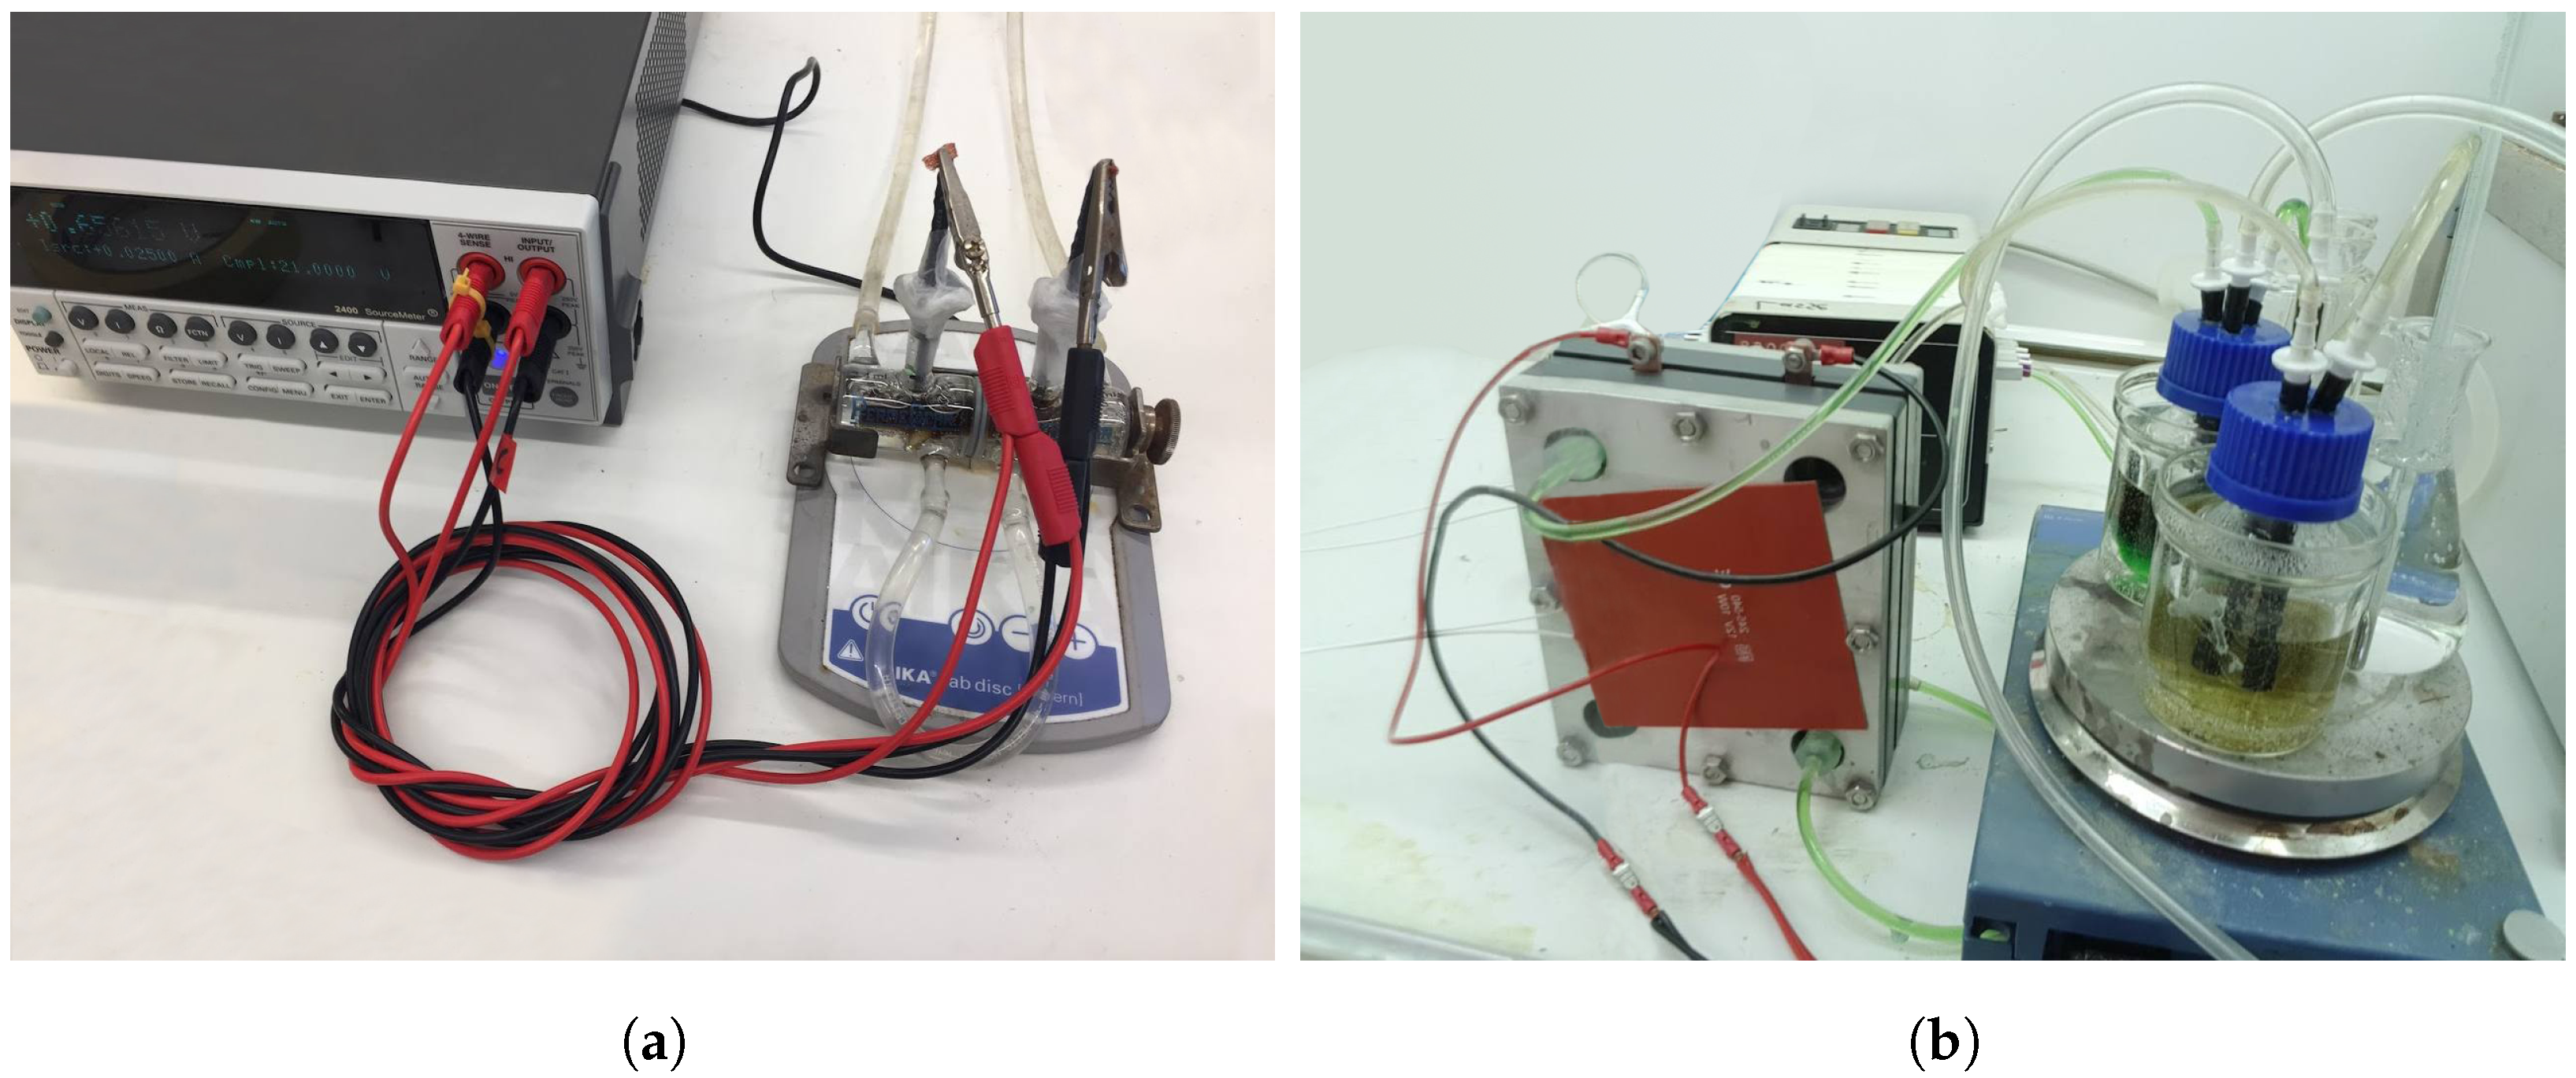
3. Materials and Methods
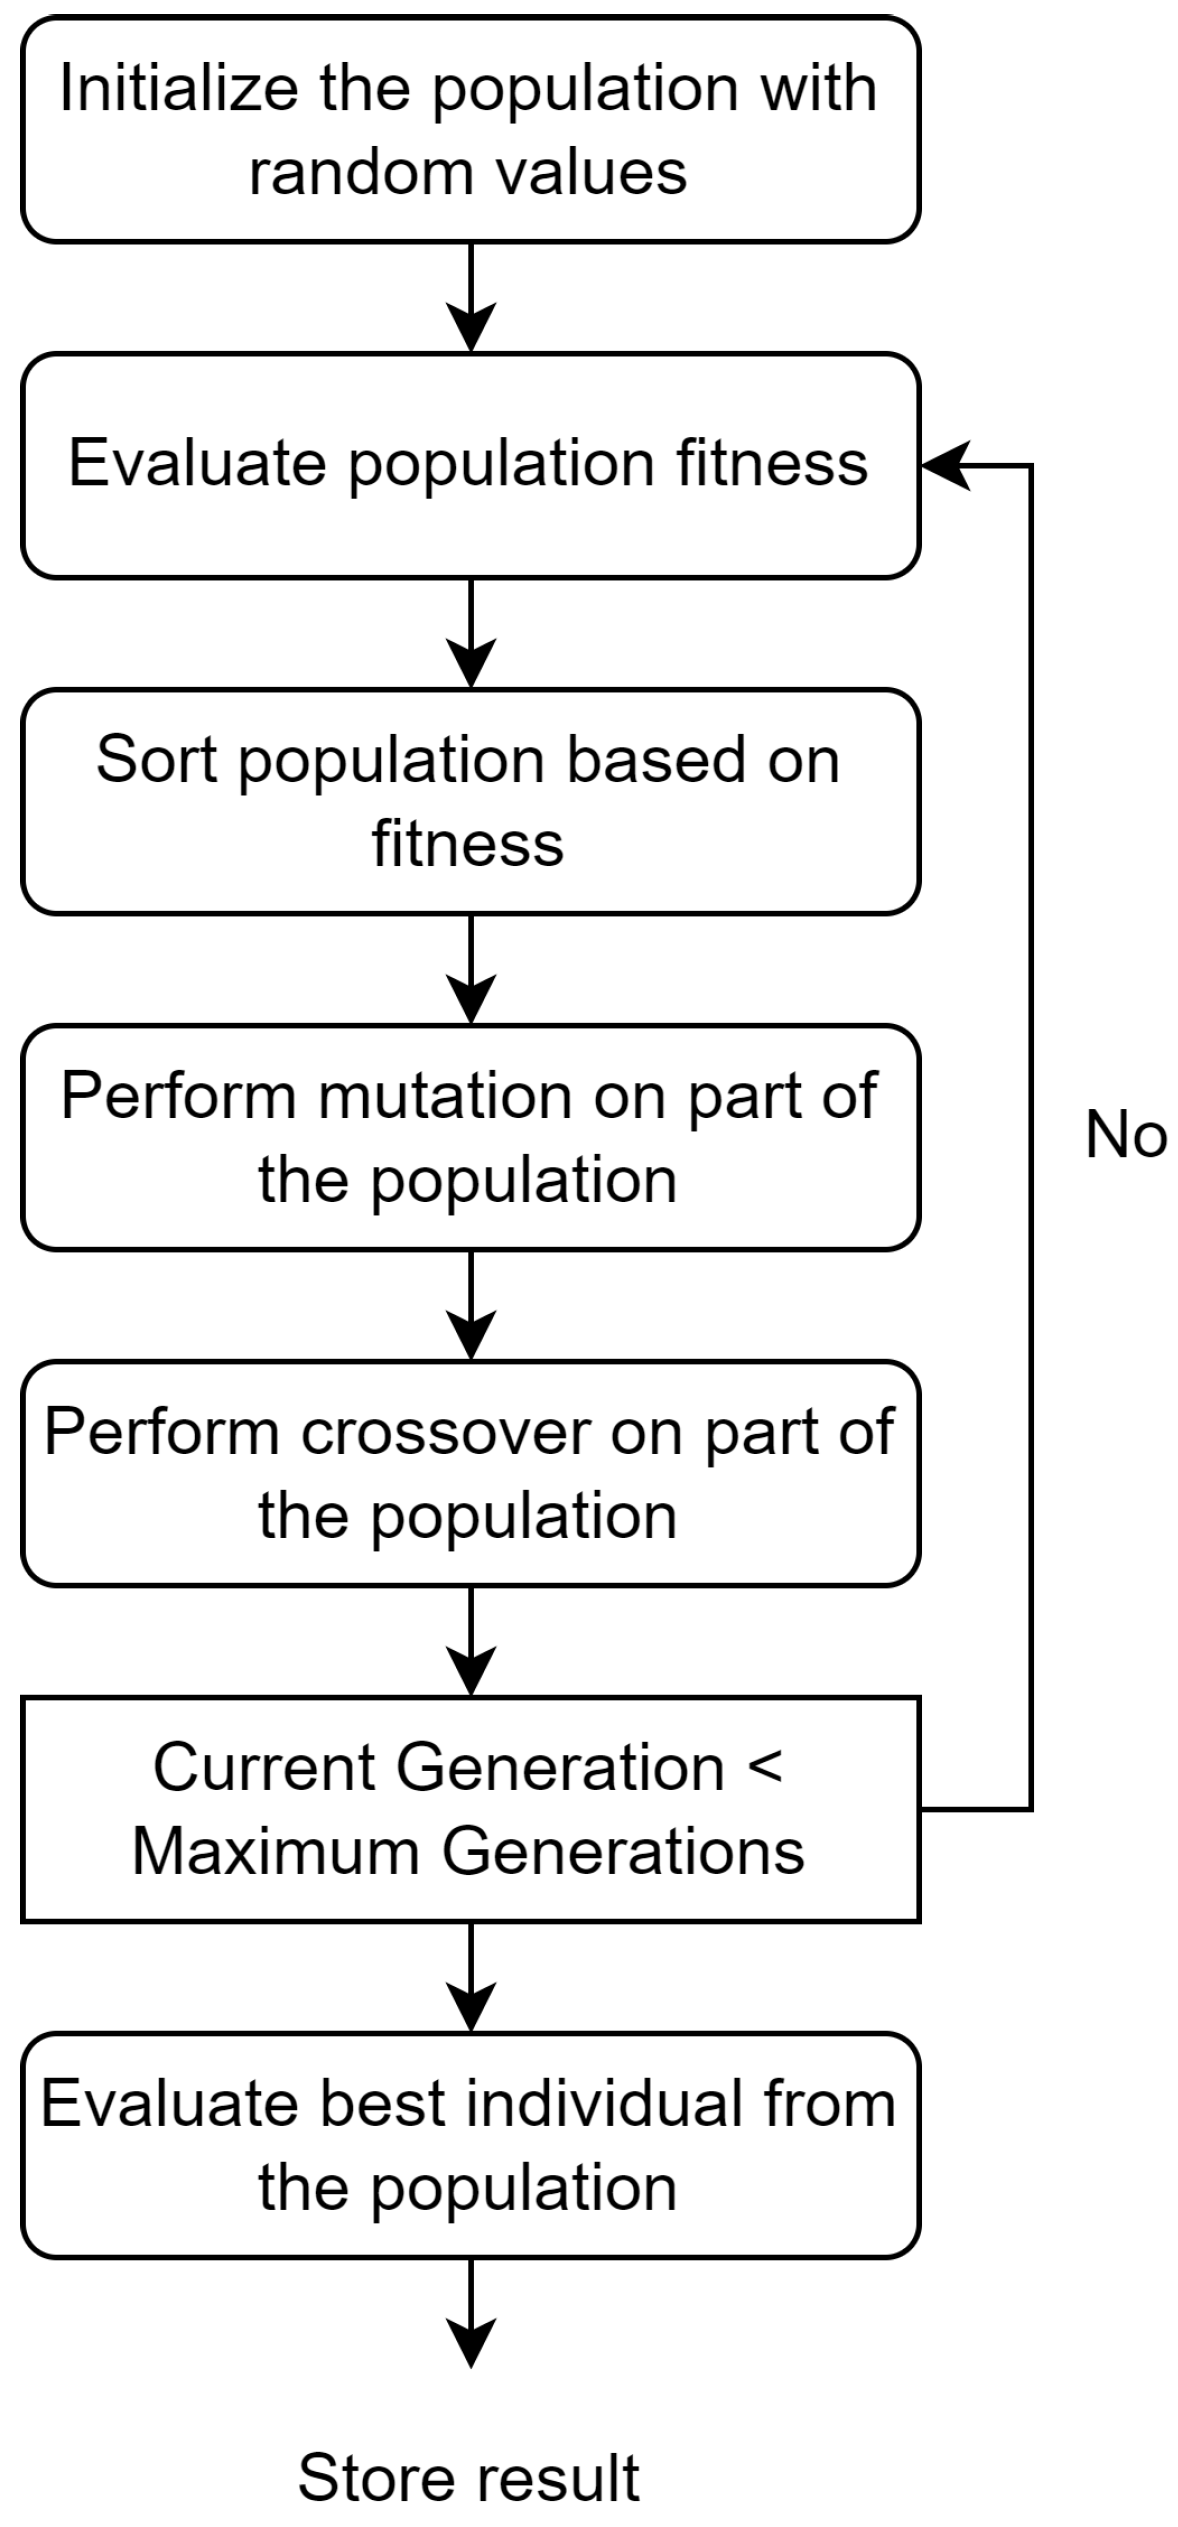
4. Genetic Algorithm
- : Rate of mutations.
- : Mutation intensity.
- : Maximum allowed number of generations.
- : Maximum allowed value for a given parameter.
- : Minimum allowed value for a given parameter.
- :
5. Experimental Verification
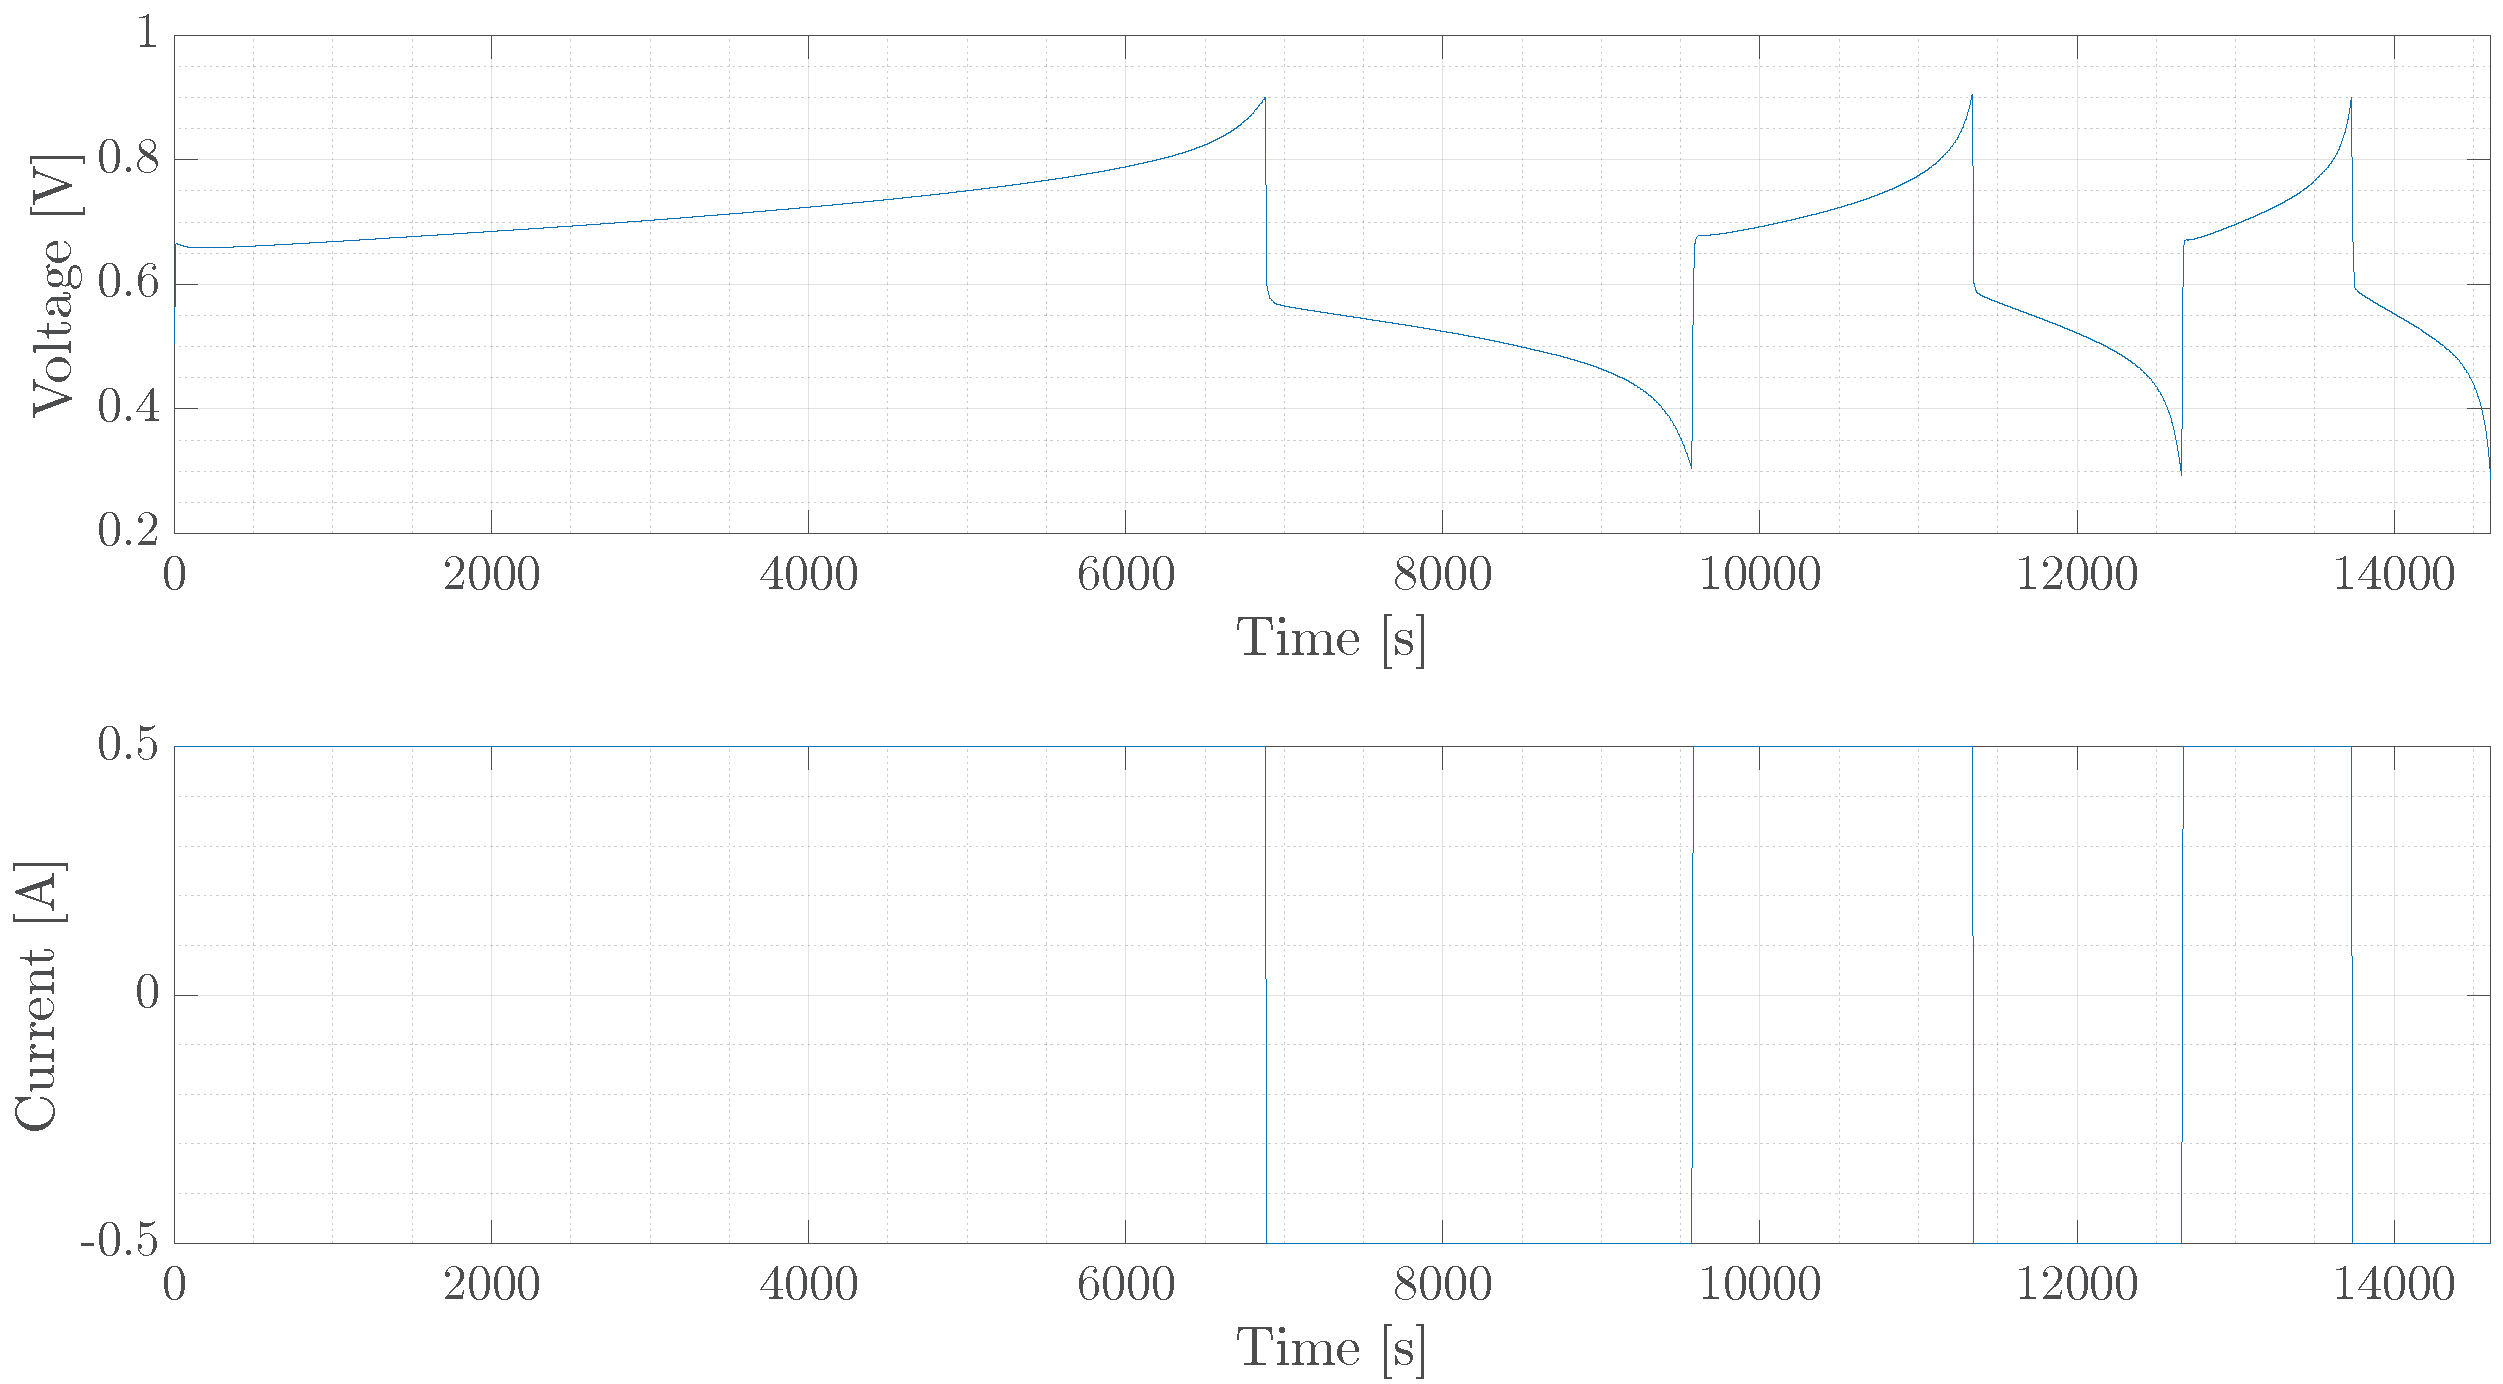
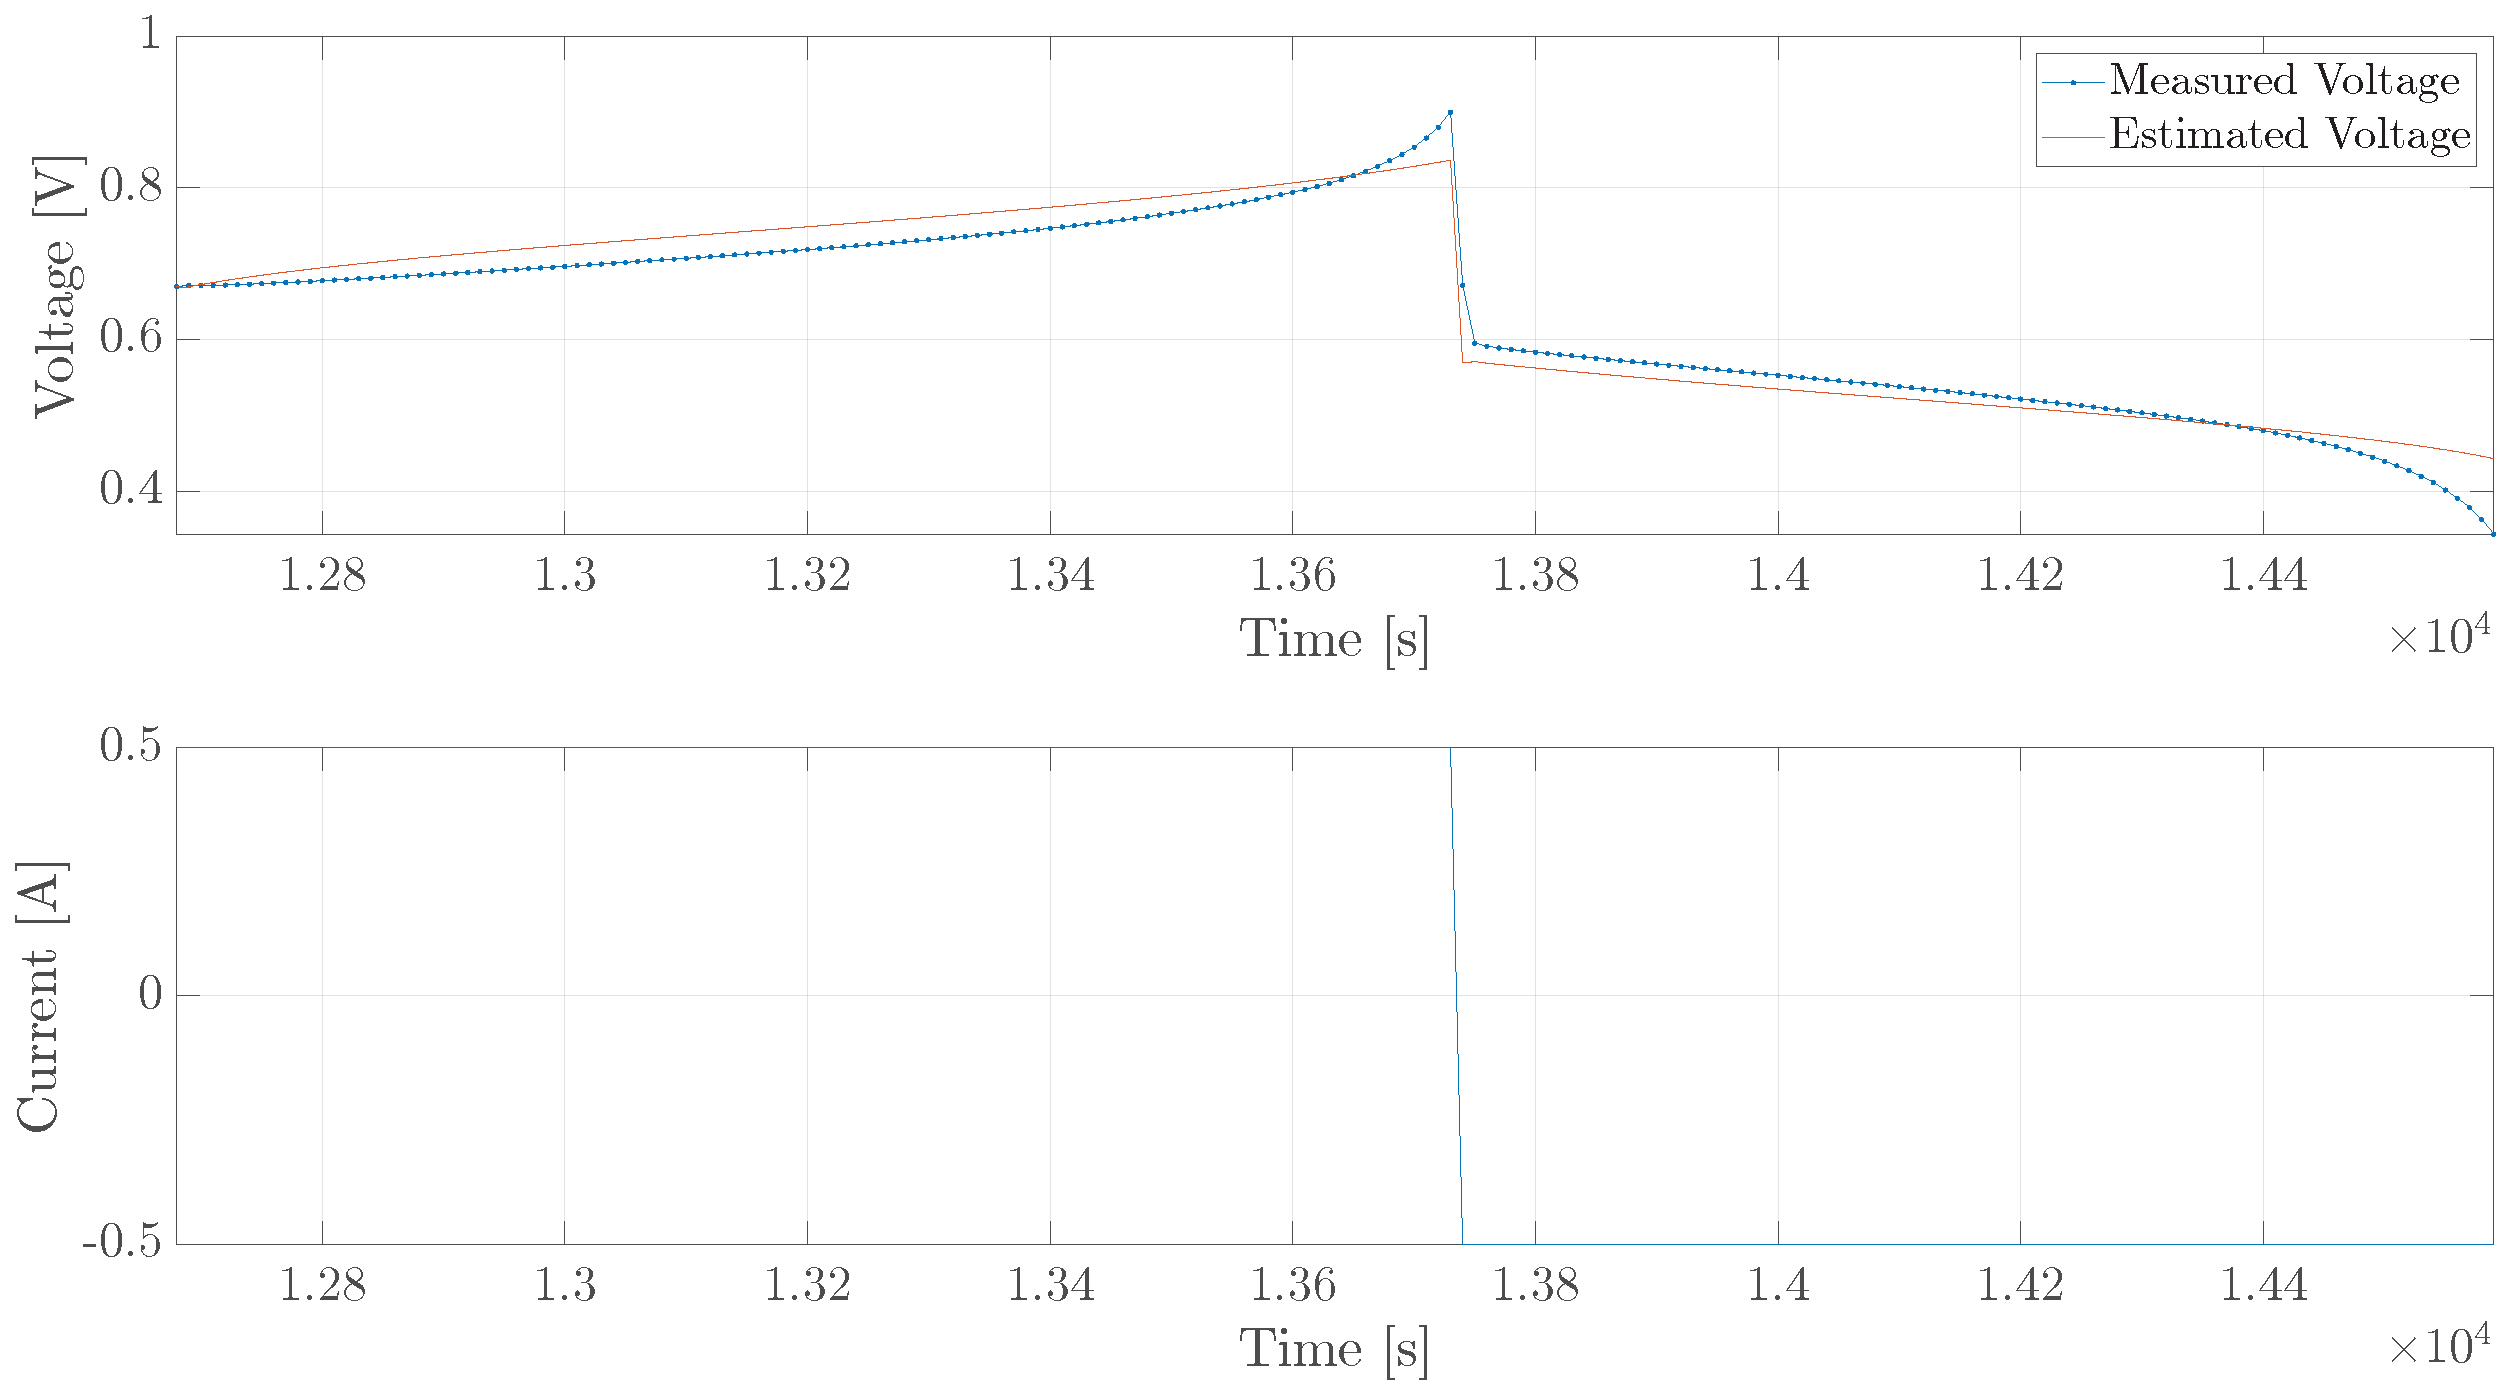
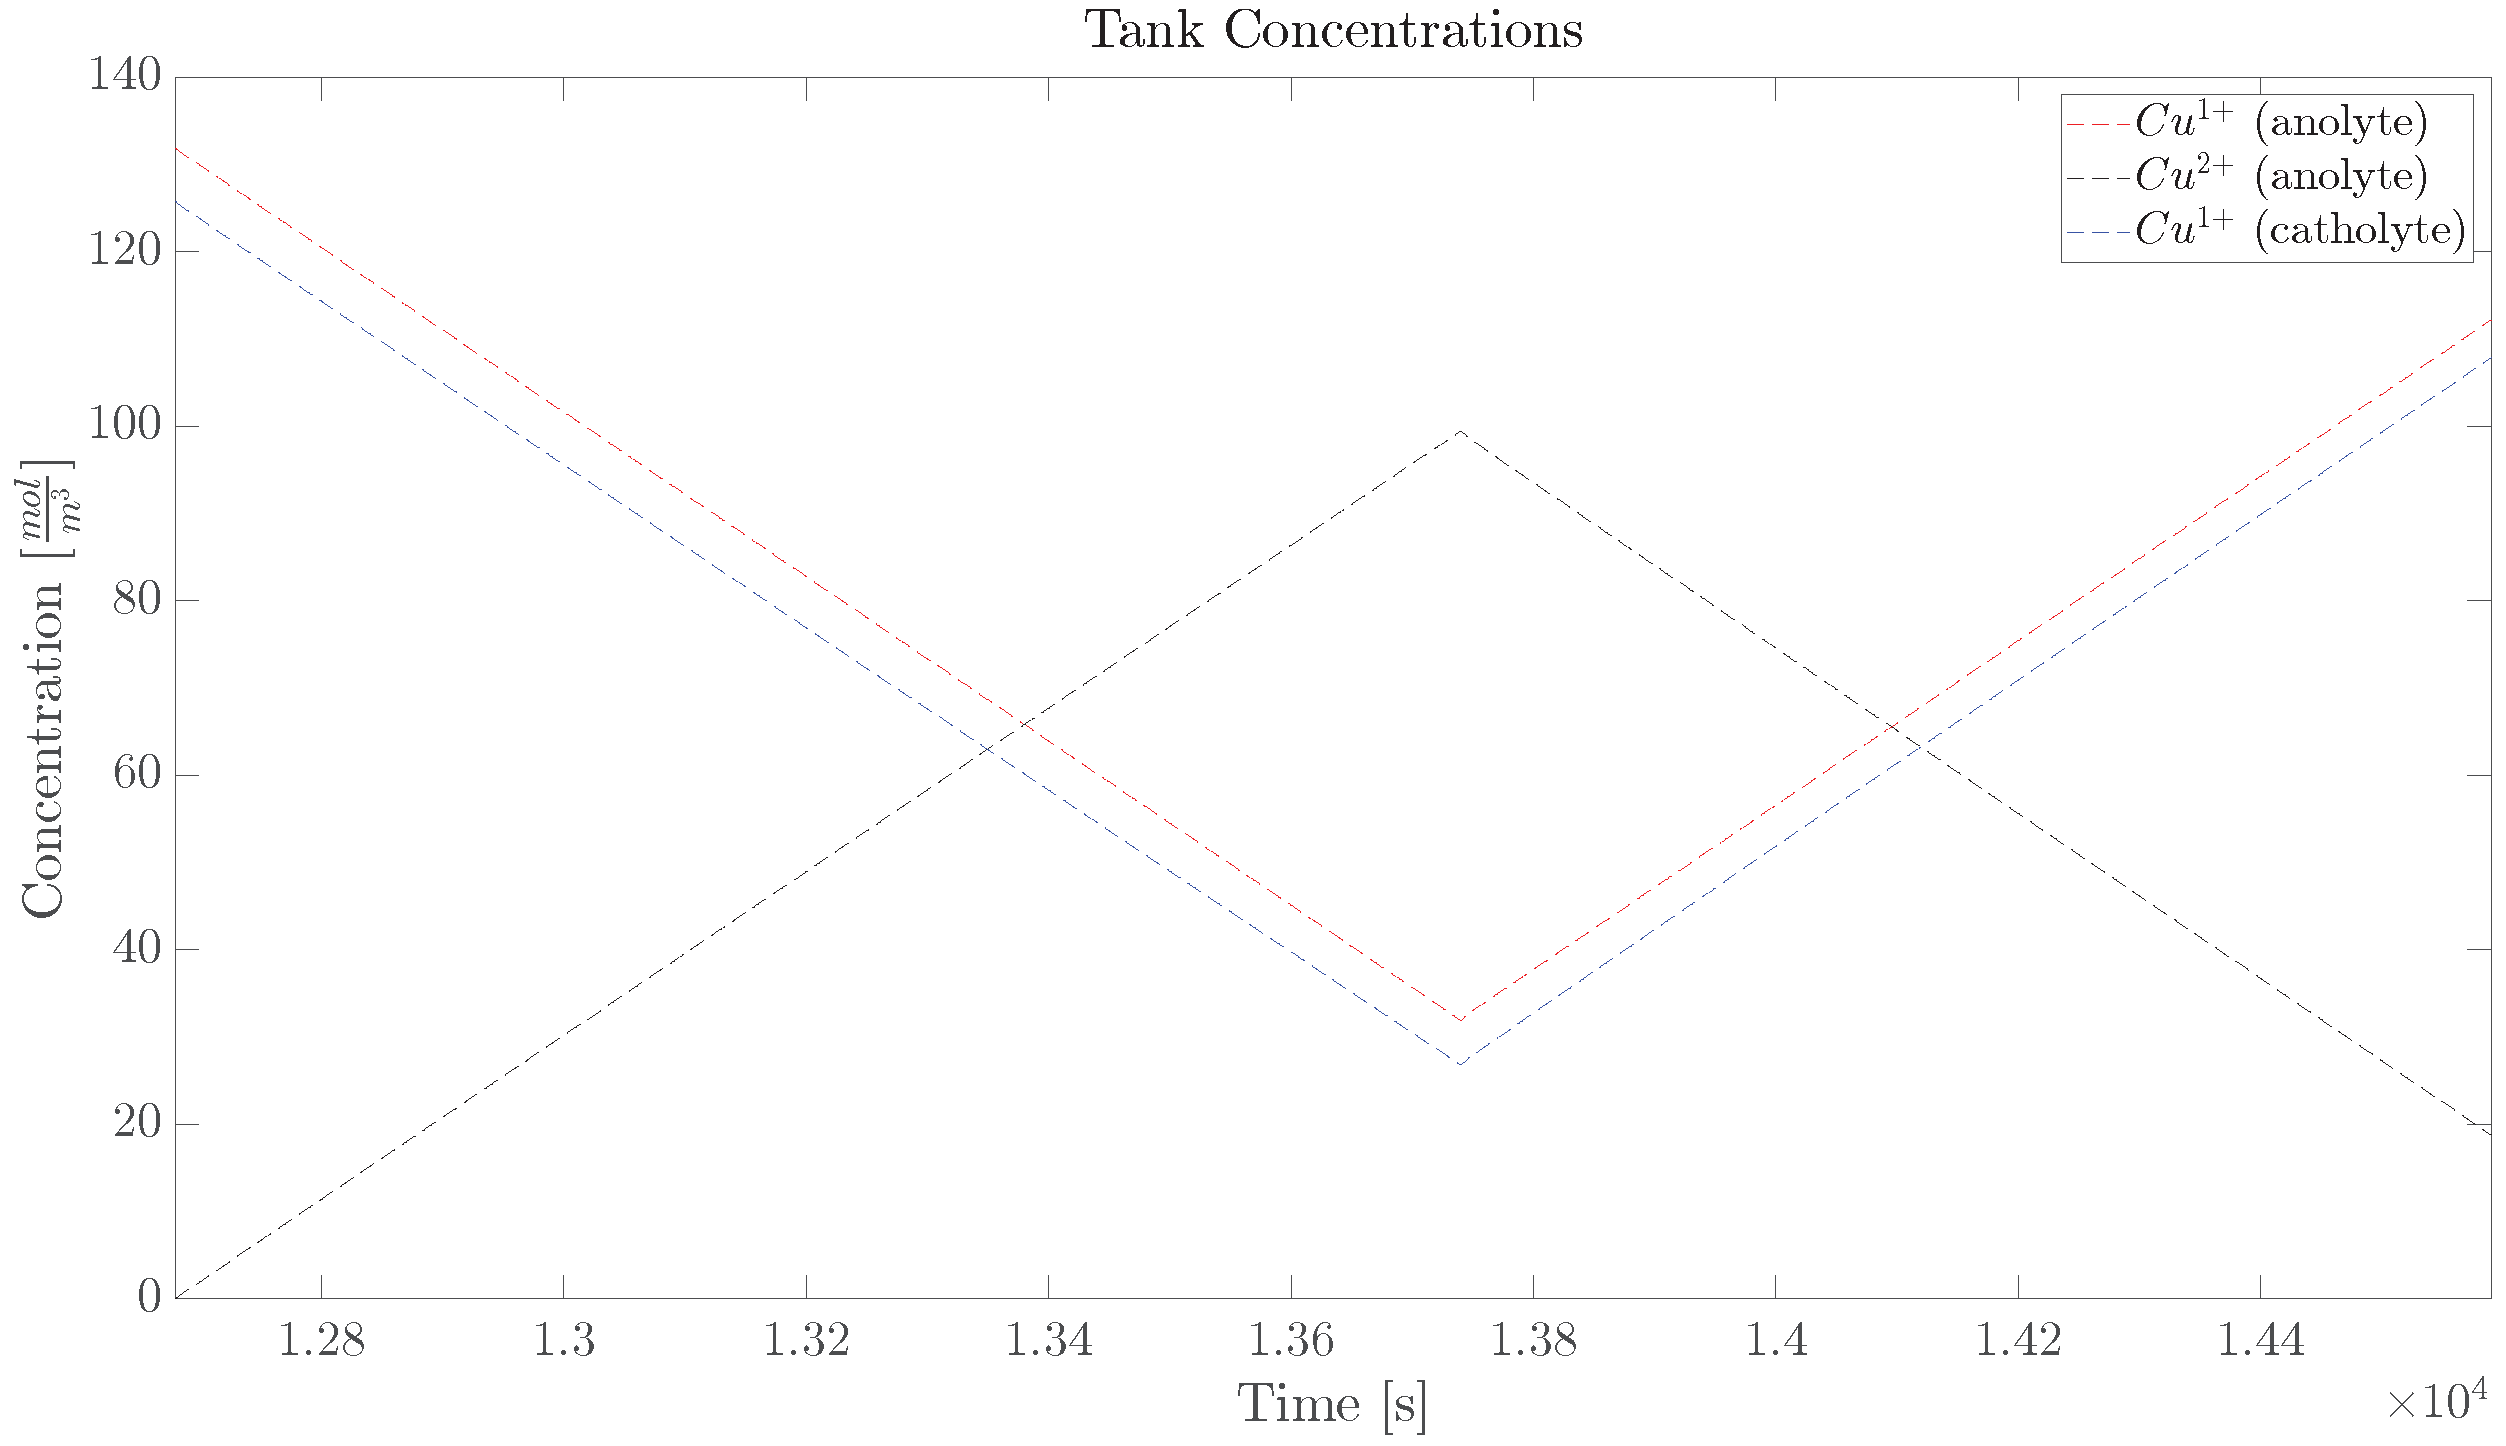
5.1. Single Cell
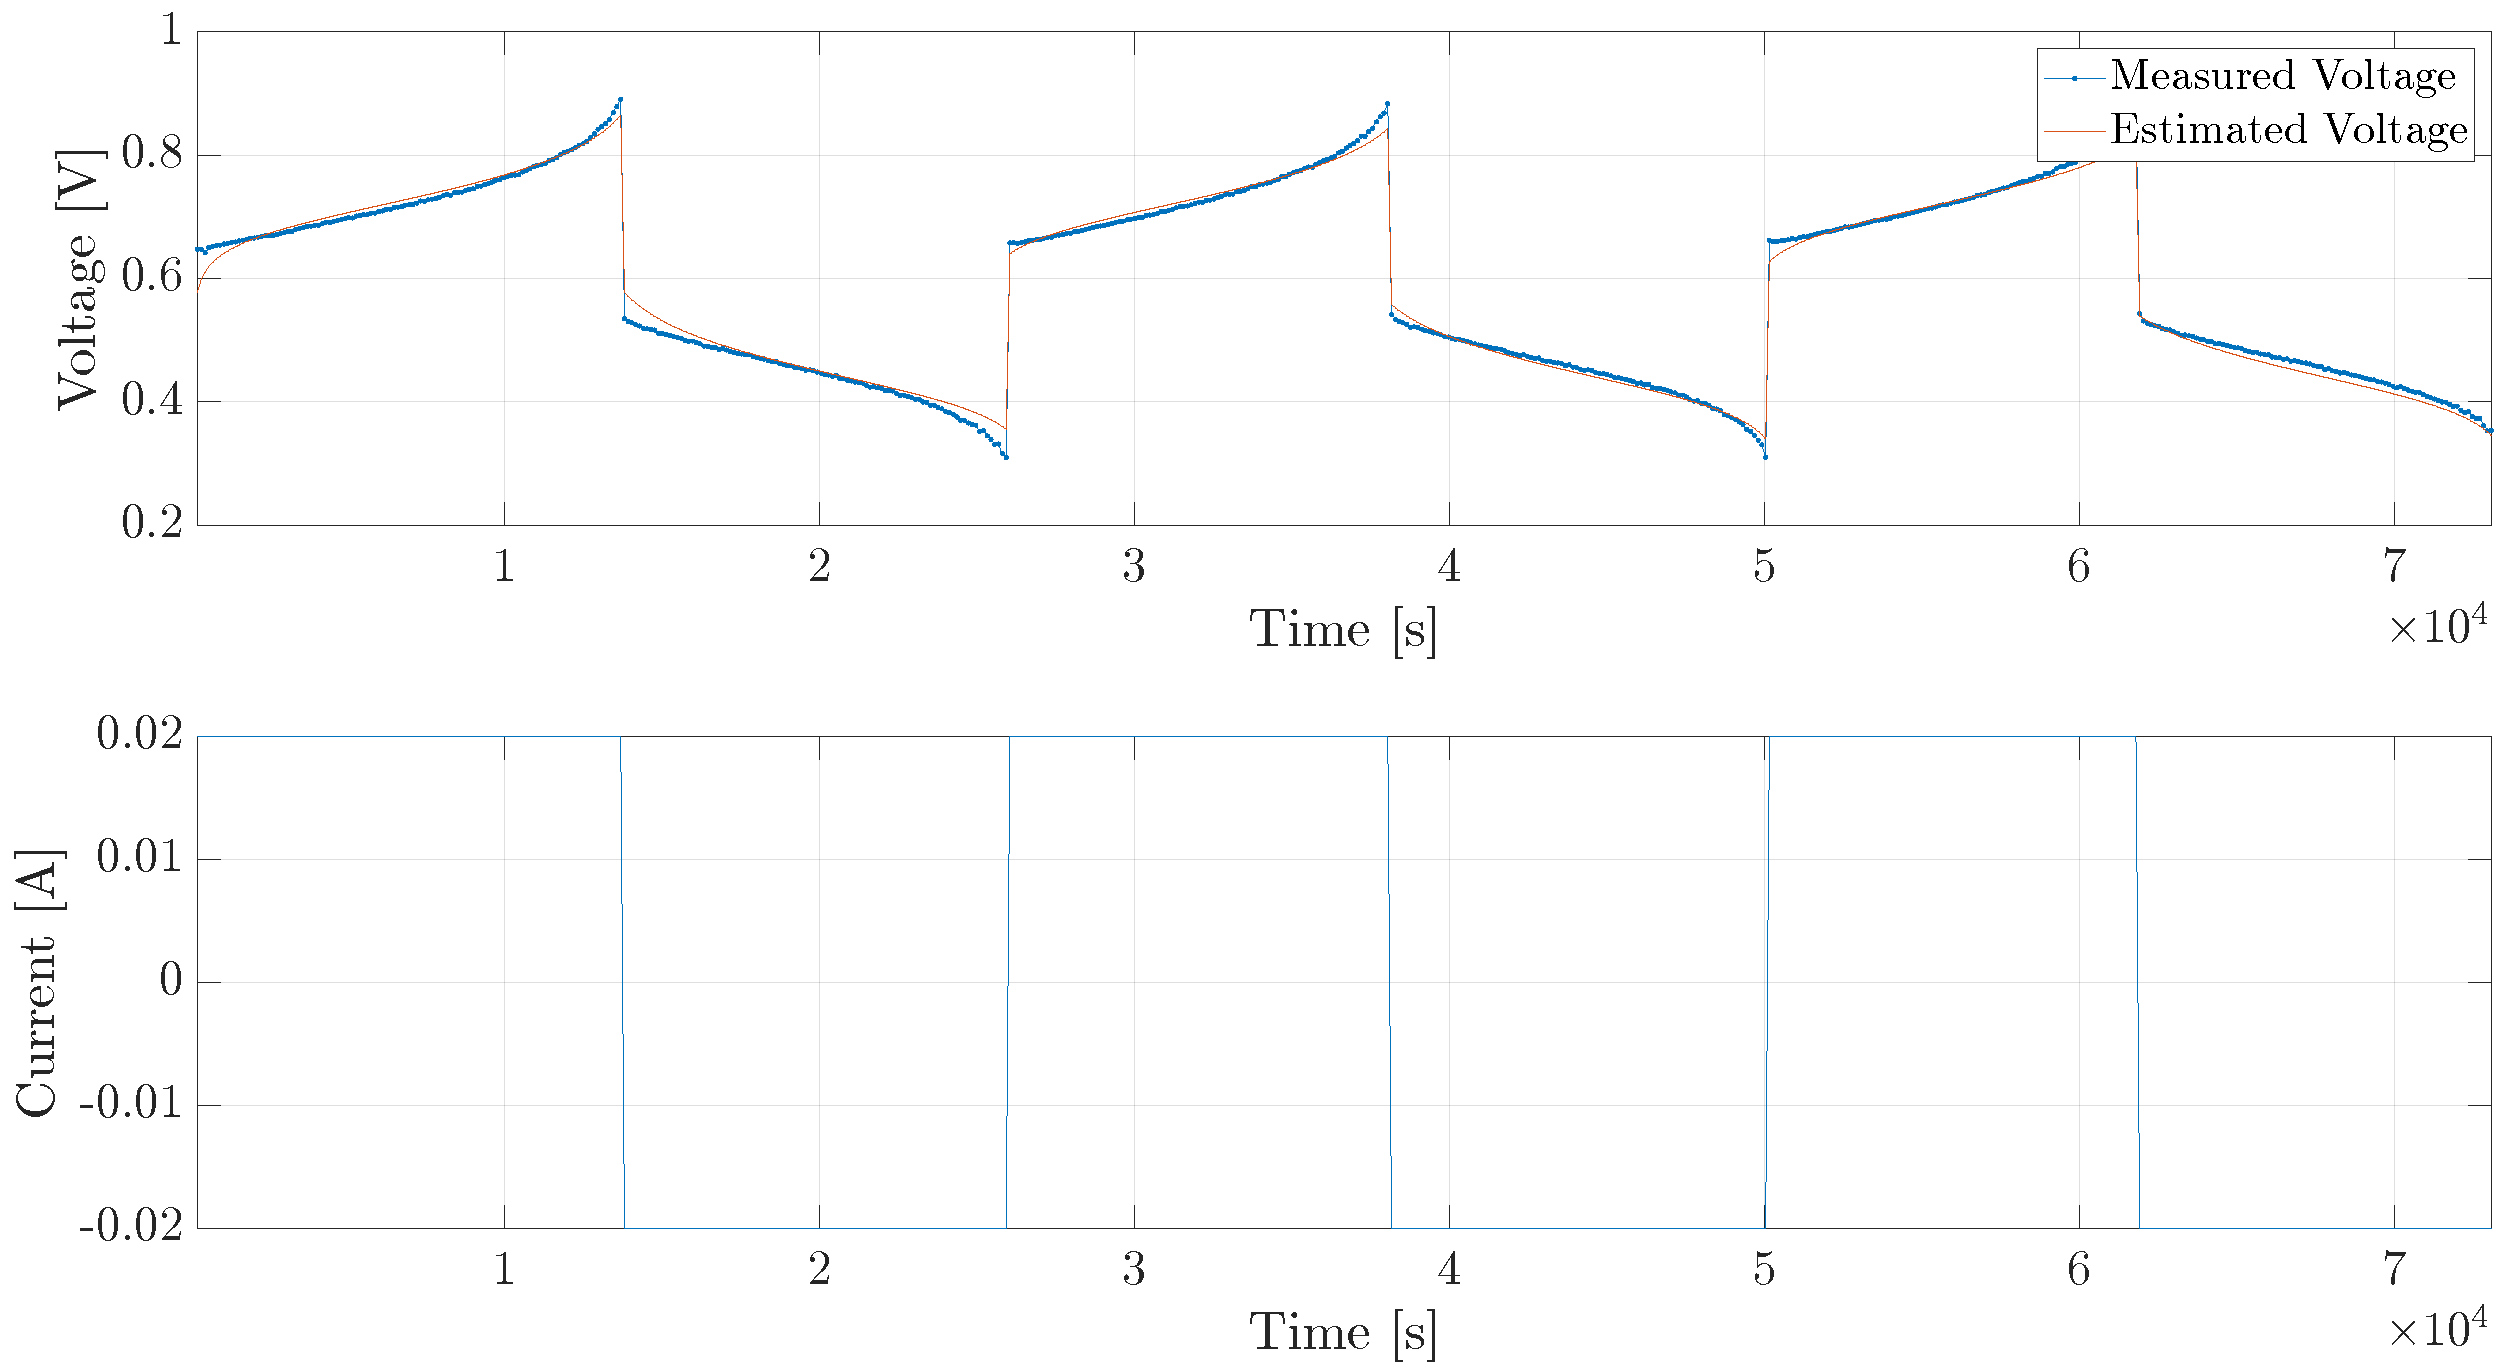
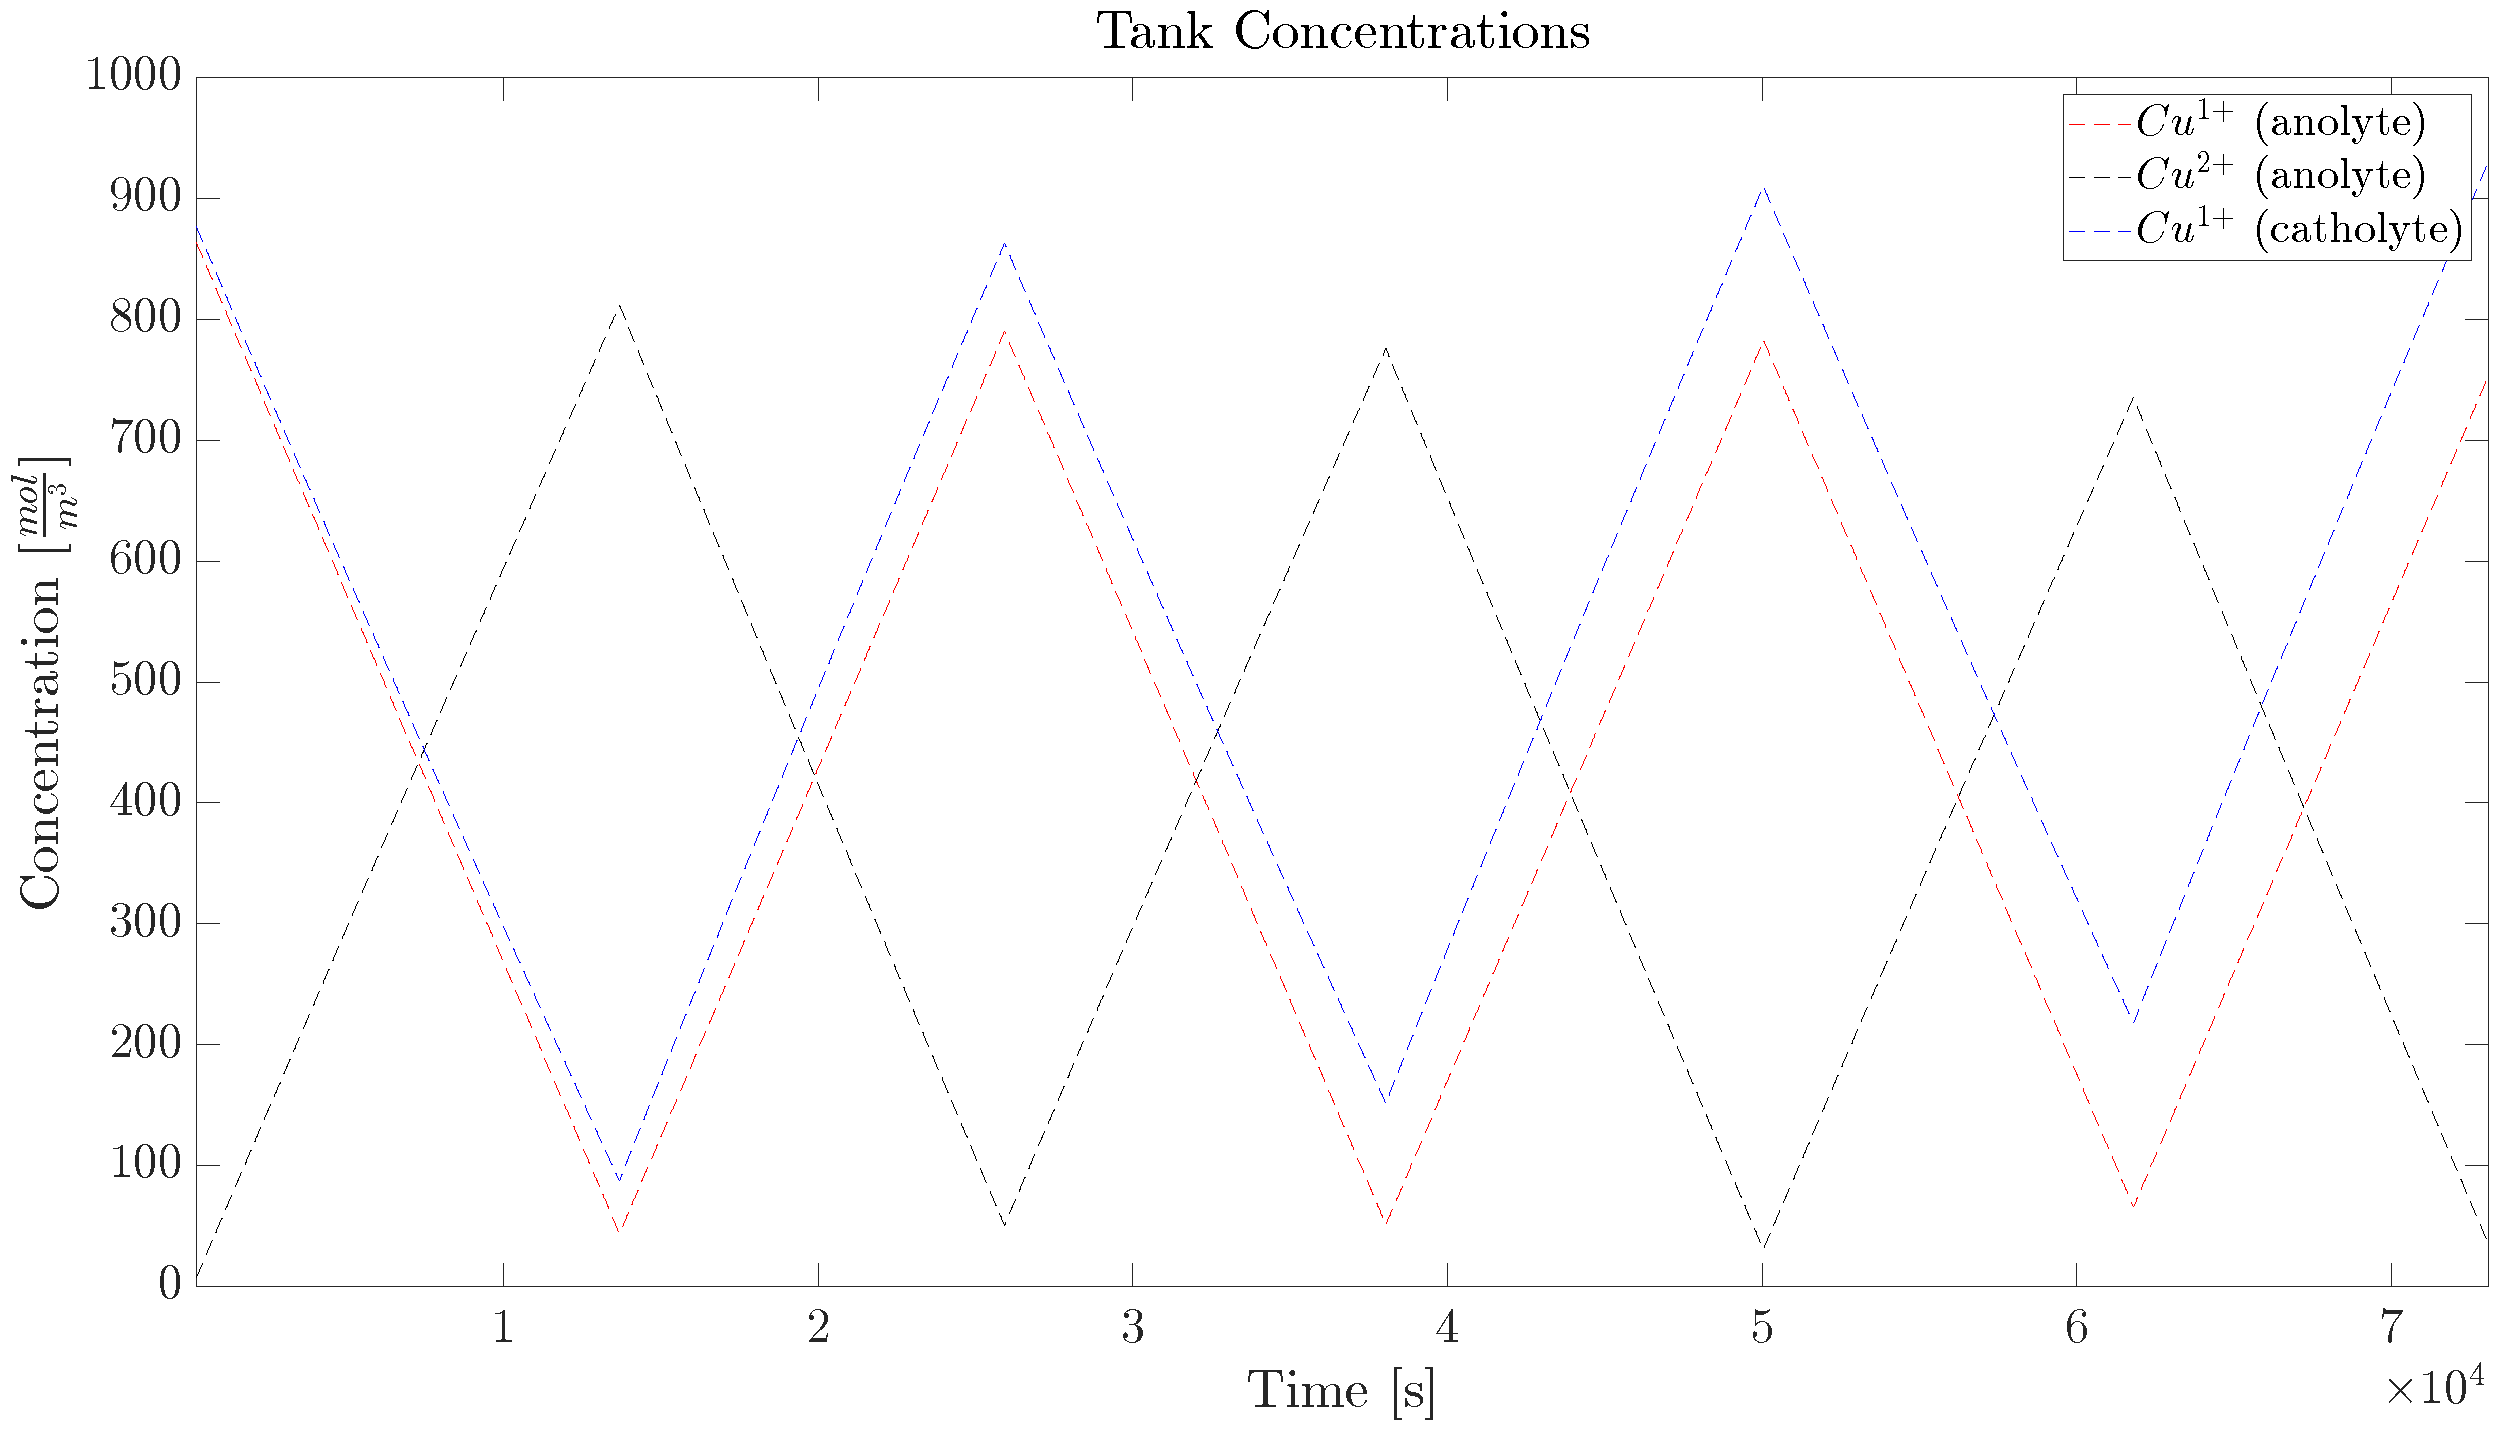
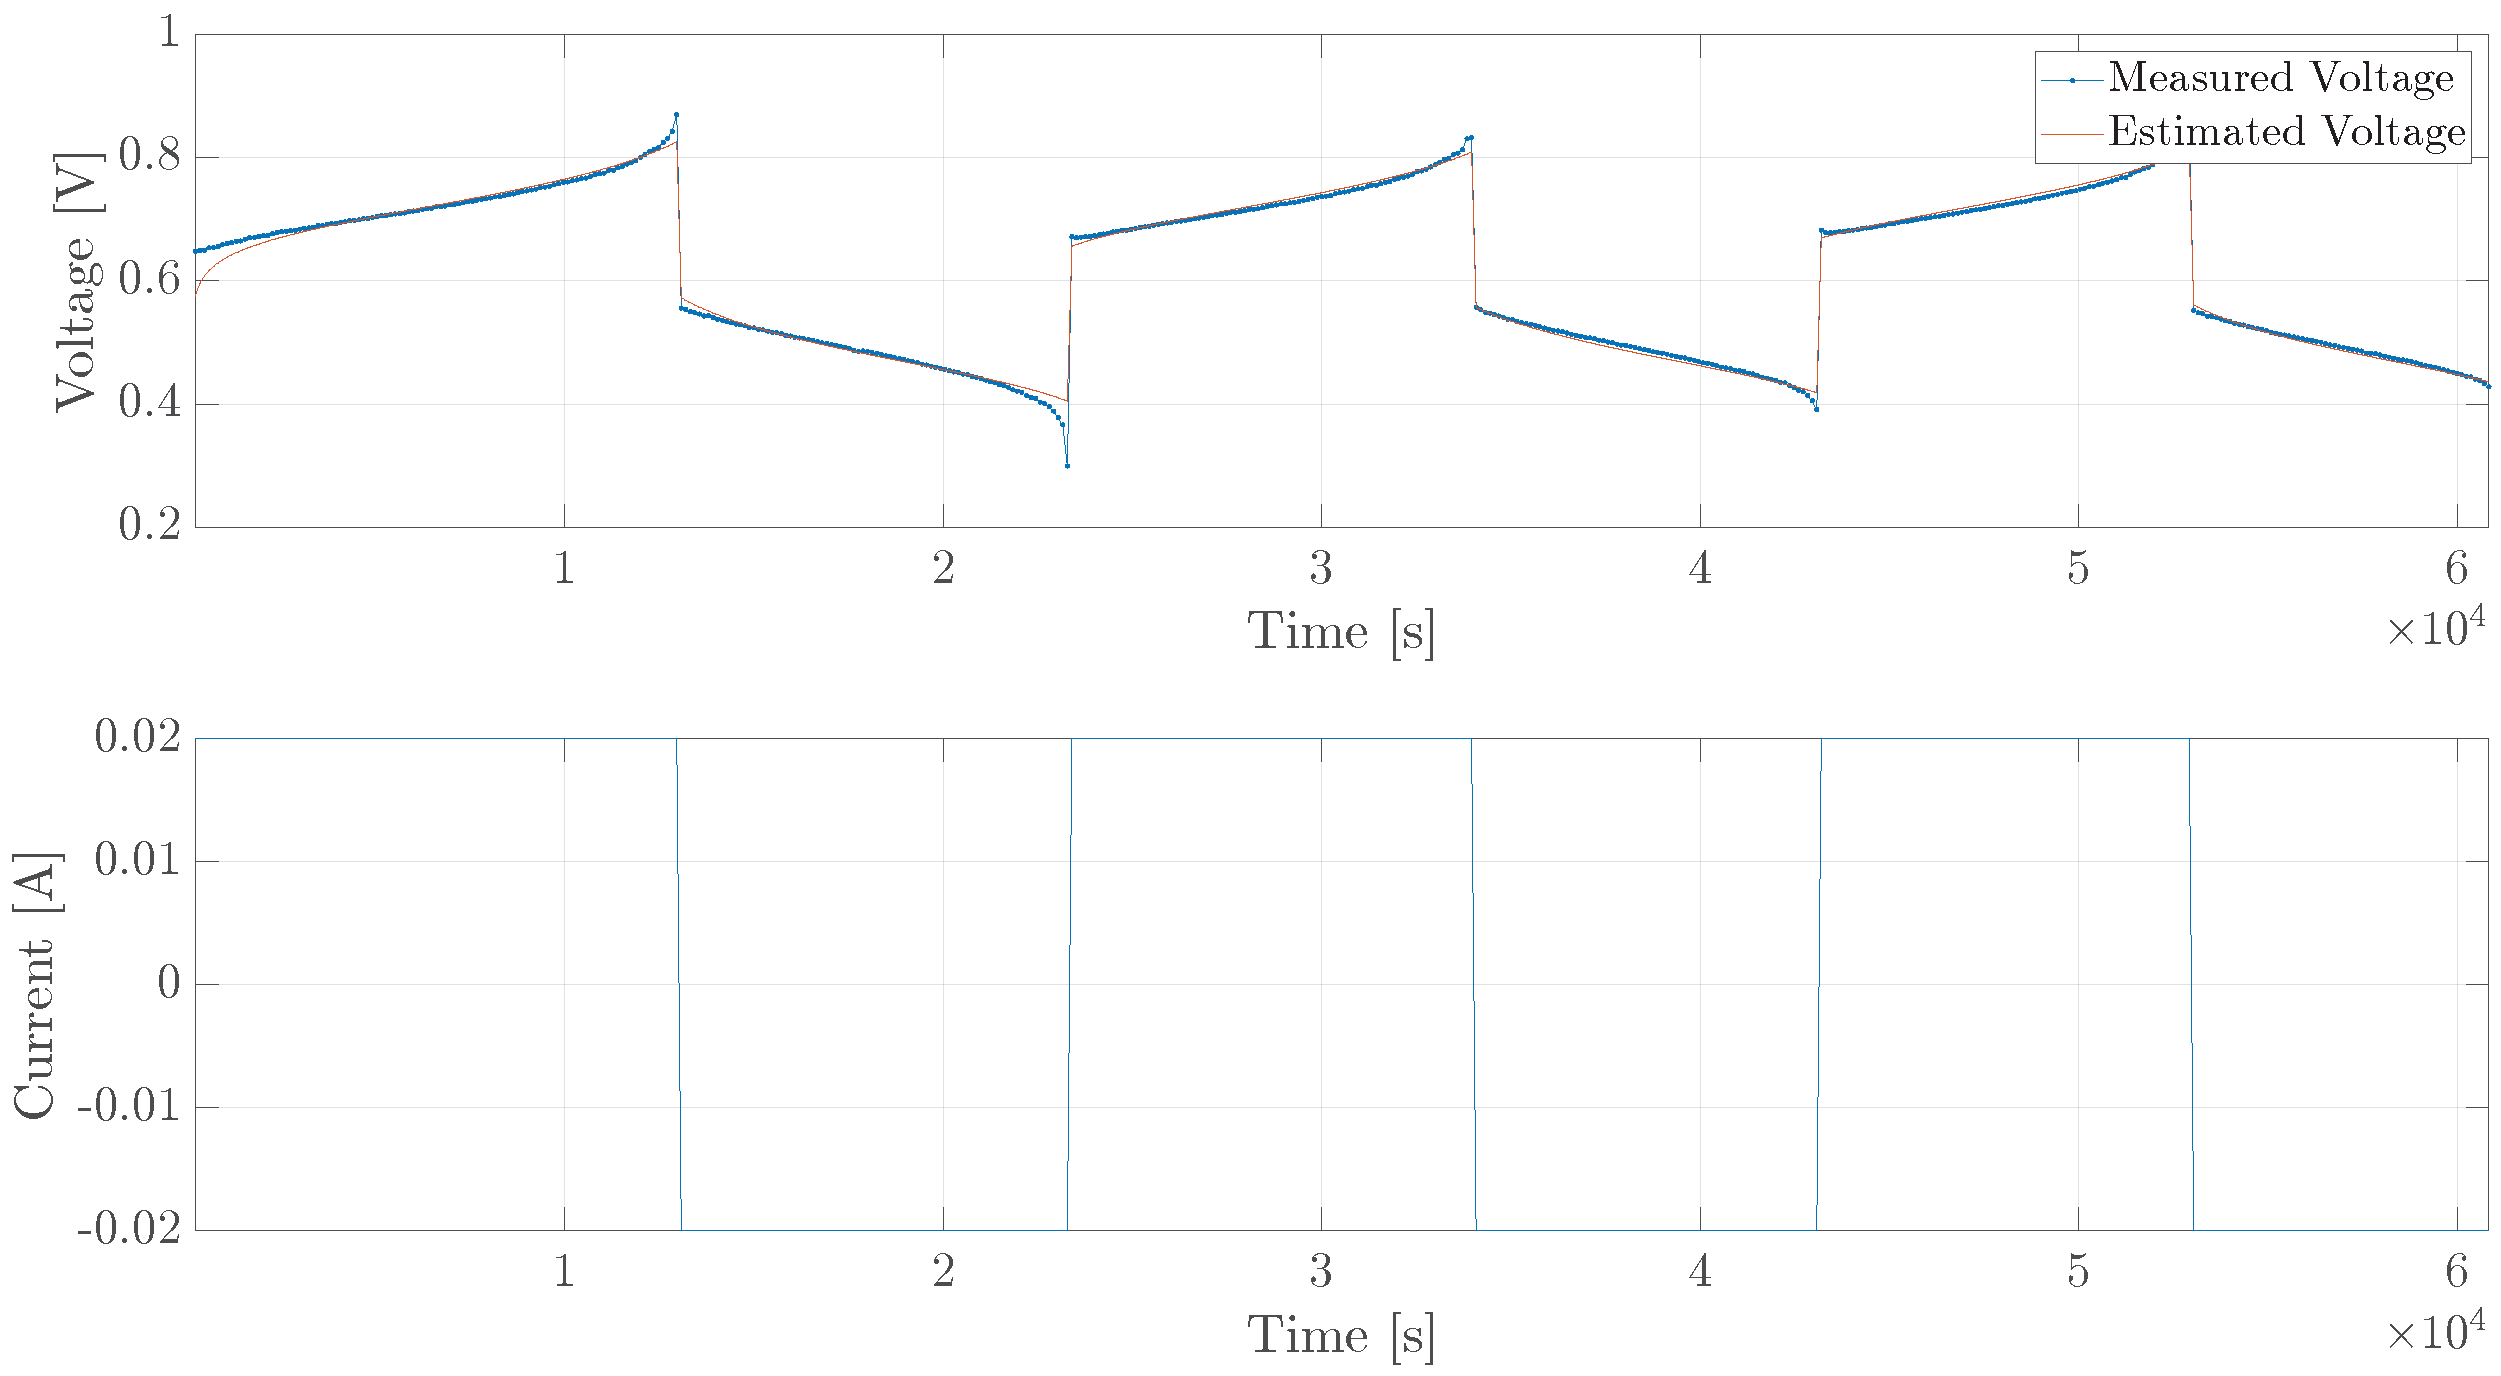
5.2. Diffusion Cell
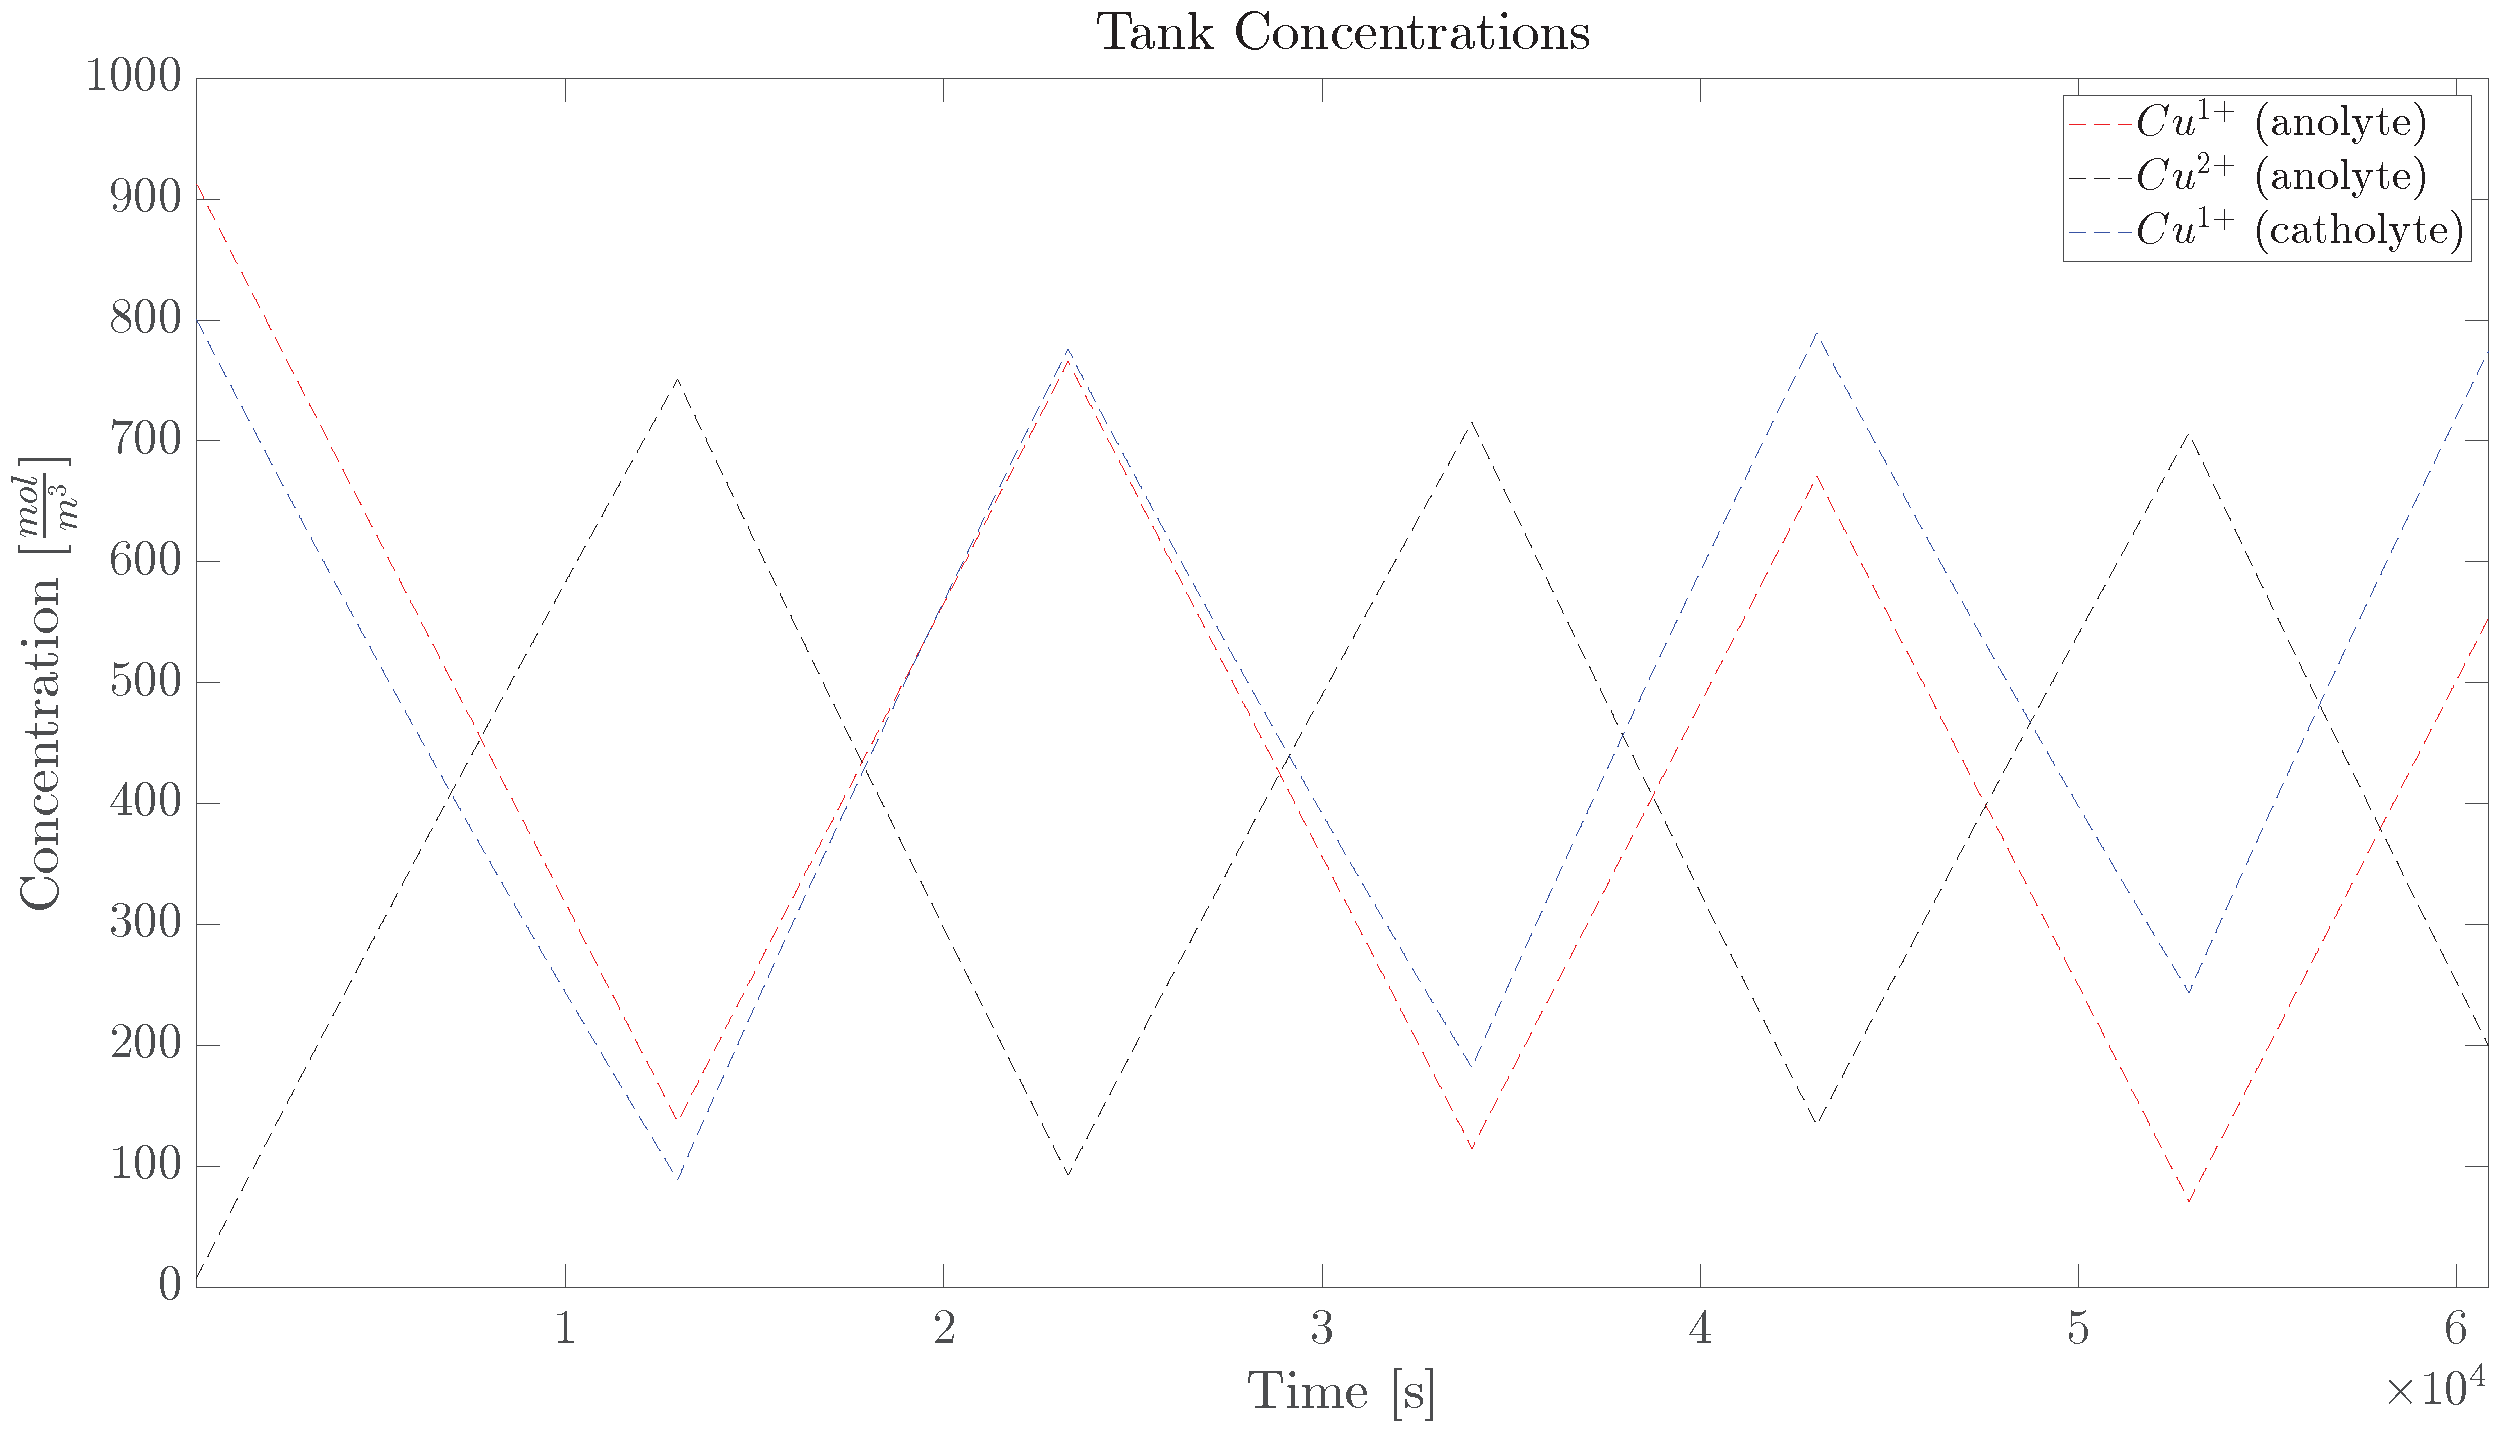
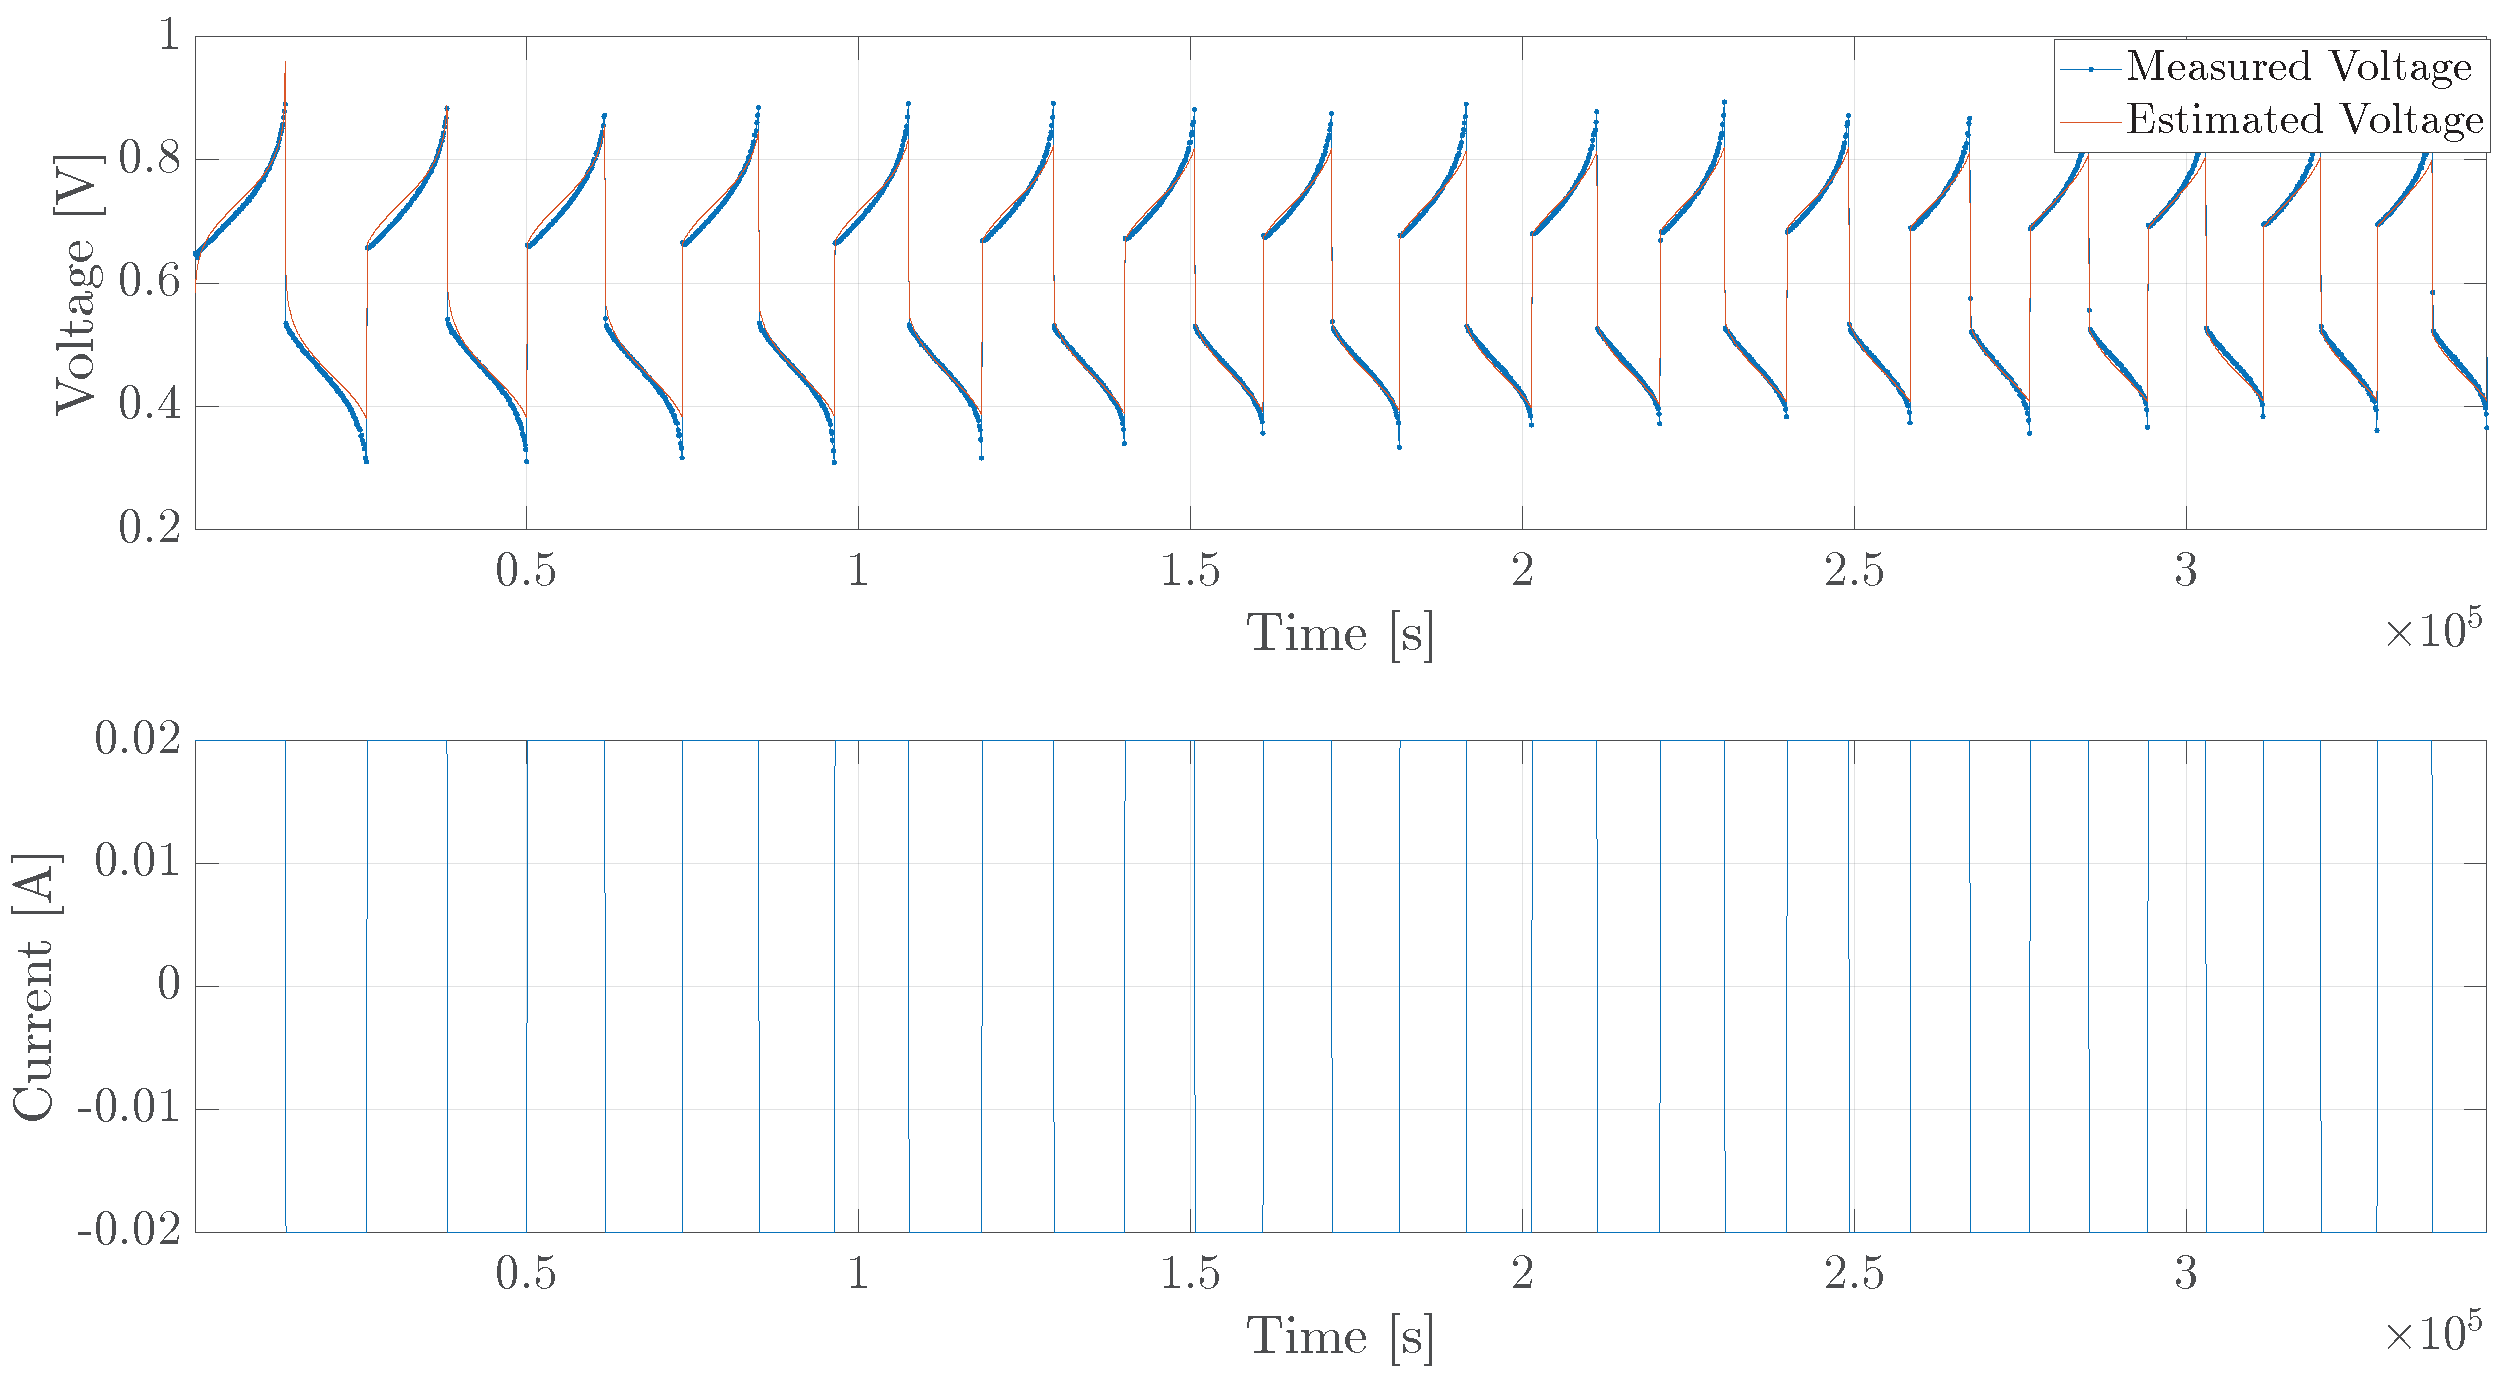
5.3. Diffusion Cell, Long Trajectory
6. Discussion
7. Conclusions
Author Contributions
Funding
Data Availability Statement
Conflicts of Interest
References
- Ruetschi, P. Energy storage and the environment: The role of battery technology. J. Power Sources 1993, 42, 1–7. [Google Scholar] [CrossRef]
- Ren, M.; Mitchell, C.R.; Mo, W. Managing residential solar photovoltaic-battery systems for grid and life cycle economic and environmental co-benefits under time-of-use rate design. Resour. Conserv. Recycl. 2021, 169, 105527. [Google Scholar] [CrossRef]
- Ahmed, A.; Ge, T.; Peng, J.; Yan, W.C.; Tee, B.T.; You, S. Assessment of the renewable energy generation towards net-zero energy buildings: A review. Energy Build. 2022, 256, 111755. [Google Scholar] [CrossRef]
- Vazquez, S.; Lukic, S.M.; Galvan, E.; Franquelo, L.G.; Carrasco, J.M. Energy storage systems for transport and grid applications. IEEE Trans. Ind. Electron. 2010, 57, 3881–3895. [Google Scholar] [CrossRef]
- Zhang, D.; Liu, Q.; Li, Y. Design of flow battery. In Reactor and Process Design in Sustainable Energy Technology; Elsevier: Amsterdam, The Netherlands, 2014; pp. 61–97. [Google Scholar]
- Zhang, H.; Li, X.; Zhang, J. Redox Flow Batteries: Fundamentals and Applications; CRC Press: Boca Raton, FL, USA, 2017. [Google Scholar]
- Ye, R.; Henkensmeier, D.; Yoon, S.J.; Huang, Z.; Kim, D.K.; Chang, Z.; Kim, S.; Chen, R. Redox flow batteries for energy storage: A technology review. J. Electrochem. Energy Convers. Storage 2018, 15, 010801. [Google Scholar] [CrossRef]
- Aluko, A.; Knight, A. A Review on Vanadium Redox Flow Battery Storage Systems for Large-Scale Power Systems Application. IEEE Access 2023, 11, 13773–13793. [Google Scholar] [CrossRef]
- Sanz, L.; Badenhorst, W.D.; Lacarbonara, G.; Faggiano, L.; Lloyd, D.; Kauranen, P.; Arbizzani, C.; Murtomäki, L. All-copper Flow Batteries. In Flow Batteries; John Wiley & Sons, Ltd.: Hoboken, NJ, USA, 2023; Chapter 38; pp. 855–873. [Google Scholar] [CrossRef]
- Faggiano, L.; Lacarbonara, G.; Badenhorst, W.; Murtomäki, L.; Sanz, L.; Arbizzani, C. Short thermal treatment of carbon felts for copper-based redox flow batteries. J. Power Sources 2022, 520, 230846. [Google Scholar] [CrossRef]
- Sanz, L.; Lloyd, D.; Magdalena, E.; Palma, J.; Kontturi, K. Description and performance of a novel aqueous all-copper redox flow battery. J. Power Sources 2014, 268, 121–128. [Google Scholar] [CrossRef]
- Zanzola, E.; Gentil, S.; Gschwend, G.; Reynard, D.; Smirnov, E.; Dennison, C.; Girault, H.H.; Peljo, P. Solid electrochemical energy storage for aqueous redox flow batteries: The case of copper hexacyanoferrate. Electrochim. Acta 2019, 321, 134704. [Google Scholar] [CrossRef]
- Badenhorst, W.D.; Sanz, L.; Arbizzani, C.; Murtomäki, L. Performance improvements for the all-copper redox flow battery: Membranes, electrodes, and electrolytes. Energy Rep. 2022, 8, 8690–8700. [Google Scholar] [CrossRef]
- Lloyd, D.; Magdalena, E.; Sanz, L.; Murtomäki, L.; Kontturi, K. Preparation of a cost-effective, scalable and energy efficient all-copper redox flow battery. J. Power Sources 2015, 292, 87–94. [Google Scholar] [CrossRef]
- Cruz-Zabalegui, A.; Antaño, R.; Rivera, F. Experimental Evaluation of Copper Redox Couples in Aqueous and Aprotic Electrolytes, for Their Application in A Flow Battery. Electrochim. Acta 2023, 448, 142189. [Google Scholar] [CrossRef]
- Badrinarayanan, R.; Zhao, J.; Tseng, K.; Skyllas-Kazacos, M. Extended dynamic model for ion diffusion in all-vanadium redox flow battery including the effects of temperature and bulk electrolyte transfer. J. Power Sources 2014, 270, 576–586. [Google Scholar] [CrossRef]
- Clemente, A.; Montiel, M.; Barreras, F.; Lozano, A.; Costa-Castello, R. Vanadium redox flow battery state of charge estimation using a concentration model and a sliding mode observer. IEEE Access 2021, 9, 72368–72376. [Google Scholar] [CrossRef]
- Liu, S.; Jiang, J.; Shi, W.; Ma, Z.; Guo, H. Butler–volmer-equation-based electrical model for high-power lithium titanate batteries used in electric vehicles. IEEE Trans. Ind. Electron. 2015, 62, 7557–7568. [Google Scholar] [CrossRef]
- Bosworth, J.; Foo, N.Y.; Zeigler, B.P. Comparison of Genetic Algorithms with Conjugate Gradient Methods; Technical Report; NASA: Washington, DC, USA, 1972. [Google Scholar]
- Golub, M. An Implementation of Binary and Floating Point Chromosome Representation in Genetic Algorithm. 1996. Available online: http://www.zemris.fer.hr/~golub/clanci/iti96.pdf (accessed on 17 March 2023).
- Janikow, C.Z.; Michalewicz, Z. An Experimental Comparison of Binary and Floating Point Representations in Genetic Algorithms. In Proceedings of the International Conference on Genetic Algorithms, San Diego, CA, USA, 13–16 July 1991. [Google Scholar]
- Kirkpatrick, S.; Gelatt, C.D., Jr.; Vecchi, M.P. Optimization by simulated annealing. Science 1983, 220, 671–680. [Google Scholar] [CrossRef] [PubMed]
- CuBER Parameter Estimation in Rust. Available online: https://github.com/uffejak/cuber_rust_ga (accessed on 12 March 2023).
- Kuldeep; Manzanares, J.A.; Kauranen, P.; Mousavihashemi, S.; Murtomäki, L. Determination of Ionic Diffusion Coefficients in Ion-Exchange Membranes: Strong Electrolytes and Sulfates with Dissociation Equilibria. ChemElectroChem 2022, 9, e202200403. [Google Scholar]
- Krzewska, S. Impedance investigation of the mechanism of copper electrodeposition from acidic perchlorate electrolyte. Electrochim. Acta 1997, 42, 3531–3540. [Google Scholar] [CrossRef]


| Parameter | Value (Single Cell) |
|---|---|
| 131 mol/m | |
| 125 mol/m | |
| D | |
| (charge) | V |
| (discharge) |
| Parameter | Bounds |
|---|---|
| mol/m | |
| mol/m | |
| D | |
| (charge) | |
| (discharge) |
| Parameter | Value (Diffusion Cell) |
|---|---|
| 870 mol/m | |
| 883 mol/m | |
| D | |
| (charge) | |
| (discharge) |
| Parameter | Value (Aged Diffusion Cell) |
|---|---|
| 919 mol/m | |
| 807 mol/m | |
| D | |
| (charge) | |
| (discharge) |
Disclaimer/Publisher’s Note: The statements, opinions and data contained in all publications are solely those of the individual author(s) and contributor(s) and not of MDPI and/or the editor(s). MDPI and/or the editor(s) disclaim responsibility for any injury to people or property resulting from any ideas, methods, instructions or products referred to in the content. |
© 2023 by the authors. Licensee MDPI, Basel, Switzerland. This article is an open access article distributed under the terms and conditions of the Creative Commons Attribution (CC BY) license (https://creativecommons.org/licenses/by/4.0/).
Share and Cite
Badenhorst, W.; Jensen, C.M.; Jakobsen, U.; Esfahani, Z.; Murtomäki, L. Control-Oriented Electrochemical Model and Parameter Estimation for an All-Copper Redox Flow Battery. Batteries 2023, 9, 272. https://doi.org/10.3390/batteries9050272
Badenhorst W, Jensen CM, Jakobsen U, Esfahani Z, Murtomäki L. Control-Oriented Electrochemical Model and Parameter Estimation for an All-Copper Redox Flow Battery. Batteries. 2023; 9(5):272. https://doi.org/10.3390/batteries9050272
Chicago/Turabian StyleBadenhorst, Wouter, Christian M. Jensen, Uffe Jakobsen, Zahra Esfahani, and Lasse Murtomäki. 2023. "Control-Oriented Electrochemical Model and Parameter Estimation for an All-Copper Redox Flow Battery" Batteries 9, no. 5: 272. https://doi.org/10.3390/batteries9050272