Article

The Effect of Varying the Air Flow in a Solar Collector on the Quality of Arabica Coffee Beans

by
Parulian Siagian
1,2,
Farel Hasiholan Napitupulu
1,*,
Himsar Ambarita
1,
Hendrik Voice Sihombing
1,
Yogie Probo Sibagariang
1 and
Horas Sotardodo Siagian
1
1
Department of Mechanical Engineering, Faculty of Engineering, Universitas Sumatera Utara, Jl. Almamater Kampus USU, Medan 20155, Indonesia
2
Mechanical Engineering, Universitas HKBP Nommensen, Medan 20234, Indonesia
*
Author to whom correspondence should be addressed.
Fluids 2024, 9(3), 75; https://doi.org/10.3390/fluids9030075
Submission received: 10 November 2023 / Revised: 14 January 2024 / Accepted: 22 January 2024 / Published: 15 March 2024
(This article belongs to the Topic Applied Heat Transfer)

Abstract

:
Agricultural commodity drying technology aims to maintain and improve the quality of agricultural products. Coffee quality is important for the welfare of coffee farmers, and drying technology plays an important role in determining the quality of coffee. Various drying models can be applied, including the traditional model that is still applied today: drying directly under solar radiation. One drying technology that can accelerate the drying time is varying the air velocity in the drying chamber. In this study, the air velocity was varied by 1–3 m/s over coffee bean samples with an initial weight of 1500 g that were dried in parallel simultaneously. The time required was 25 h, with a maximum radiation of 586.9 w/m2 and total solar energy over 3 days of 16.6 MJ/m2. It was found that good quality coffee was achieved using drying box 1, with a drying air velocity of 1.0 m/s, with which a final mass of 732.24 g was obtained with coffee moisture content of 12.0%, protein content of 11.7%, carbohydrate content of 21.7%, and free fatty acid content of 0.05%. Higher air velocities resulted in almost the same protein and carbohydrate content, as well as a fatty acid content of less than 0.1%, but a higher moisture content.

1. Introduction

Based on the latest data from the International Coffee Organization (ICO) and coffee reviews, Indonesia ranks fourth in the world in terms of coffee production, after Brazil, Vietnam, and Colombia. Indonesia is also the fifth largest coffee-exporting country in the world [1,2]. Based on data from the Central Statistics Agency (BPS), Indonesia’s coffee exports totaled USD 1.14 billion for a volume of 433,780 tons in 2022. The export value increased by 35.71% when compared to the previous year, which amounted to USD 842.52 million for a volume of 380,173 tons [3]. The drying process, which is one of the required stages in the processing of the crop, reduces the water content to a level that is suitable for storage for a longer period of time but still maintains the quality of the final product [4].
Solar energy—the main source of energy used today—is unrivalled due to the amount of energy it produces, its capacity, its environmentally friendly qualities, and its suitability as a clean energy source [5]. Compared to non-renewable sources, solar energy is considered the most beneficial renewable energy resource for drying industrial and agricultural products. The utilization of solar power in food drying technology can reduce costs associated to the use of fossil fuels [6]. The use of solar energy in the food production process has a great impact on the development of food technology, although there is currently a movement toward renewable energy storage due to the impacts of fossil fuel use on energy and climate change; furthermore, the demand to reduce post-harvest damage is growing. Drying farm products can maintain their shelf life, reduce packaging costs, increase transportability, and create a better appearance while maintaining flavor and nutritional content. By removing water from foodstuffs, bacteria, yeast, and mold which lead to food spoilage cannot grow [7]. This is accomplished through eliminating water from the food, resulting in a solid substance; however, this is a complicated procedure that combines mass and heat transfer simultaneously [8].
Drying in direct sunlight is a traditional method often used by farmers to preserve their agricultural produce. This technique has been used for a long time [9]. Using an open sun solar dryer (OSSD) is one way to dry foodstuffs. OSSDs have many drawbacks, such as degradation of the quality of professional air ducts, damage due to rain and wind, and production losses due to birds and dust [10]. Solar dryers can be considered to replace OSSDs, as they offer advantages over OSSDs if well-designed [11]. Therefore, indirect dryers have been widely researched as a sustainable solution to improve the quality of agricultural product [12,13].
The indirect drying method consists of a drying chamber and a solar collector. The solar collector absorbs heat from the sun and delivers the heat to the drying chamber naturally. Lingayat and Chandramohan conducted a numerical investigation of an indirect solar dryer for drying banana chips [14]. They designed a solar dryer integrated with a solar collector for drying green tea [15] and analyzed a solar dryer integrated with a double-sided solar collector for drying bananas. The results of the study showed that the efficiency obtained was 21.9% [16]. In the experiment, they used a solar dryer integrated with a solar collector along with heat storage materials to overcome the absence of sunlight at night. Their results showed that the highest drying efficiency was 41.66% [17]. Other researchers have numerically examined indirect solar stills integrated with solar collectors; the results of their research showed that the optimum output position was in the northern part [18]. In another study, the authors analyzed indirect dryers using flat plate collectors and finned collectors [19]. Based on the above studies, using plate collectors with a forced convection system is a fairly efficient and widely used method for drying various products.
Drying is a very complicated process involving mass transfer phenomena; furthermore, each commodity has its own special drying conditions in order to obtain the optimal quality from the process. For this reason, there is still a great need for research to determine the most effective forced convection drying conditions to obtain good quality drying results. With regard to solar drying using forced convection system plate collectors, the authors of [20] conducted research on the performance of forced convection solar cabinet dryers under different air mass flow rates. In that study, several air flow rates were used to dry clustered fig fruits. The results of this showed that the optimum air flow rate for drying clustered fig fruits in order to obtain good drying quality was 3.72 kg/min. In 2021, the authors of [21] analyzed a drying system for drying carob pulp based on a solar collector, using various flow velocity and temperature values. Based on their results, it was established that a drying temperature of 80 °C and drying air velocity of 0.18 m/s were the optimal conditions for drying carob pulp. In 2021, the authors of [22] conducted research on the effect of various air mass flow rates on drying pineapple using a mixed-mode solar dryer. In the study, a drying air mass flow rate of 0.0015 kg/s produced better exergy and drying efficiency. In 2022, the authors of [23] conducted research on variations in the mass flow rate of drying air on a V-groove double-pass collector to dry Pink Lady apples. They found that an air mass flow rate of 0.041 kg/s could remove the optimal amount of moisture; however, an air mass flow rate of 0.051 kg/s provided the maximum exergy efficiency.
According to the study of López-Vidaña [24], drying times for tomatoes are prolonged due to their high moisture content and structural features. To ensure better quality and a shorter drying time, the dryer should be used in either indirect mode with forced convection or direct mode with natural convection. Having a proper solar dryer design and an operating technique that permits the use of all the solar energy that can have an impact on the dryer is one of the major challenges in explaining the various efficiency values obtained in the solar dryer models described in technical reports. Most of these factors are uncontrollable.
There has still been no research on varying air flow velocity in a solar coffee dryer. For this reason, the novelty of this research is an analysis of the effects of varying air flow velocity (1, 1.5, 2, 2.5, and 3 m/s) and temperature in a solar collector on coffee quality. This study aimed to determine the most effective air velocity to use in a solar coffee dryer to obtain the best-quality coffee.

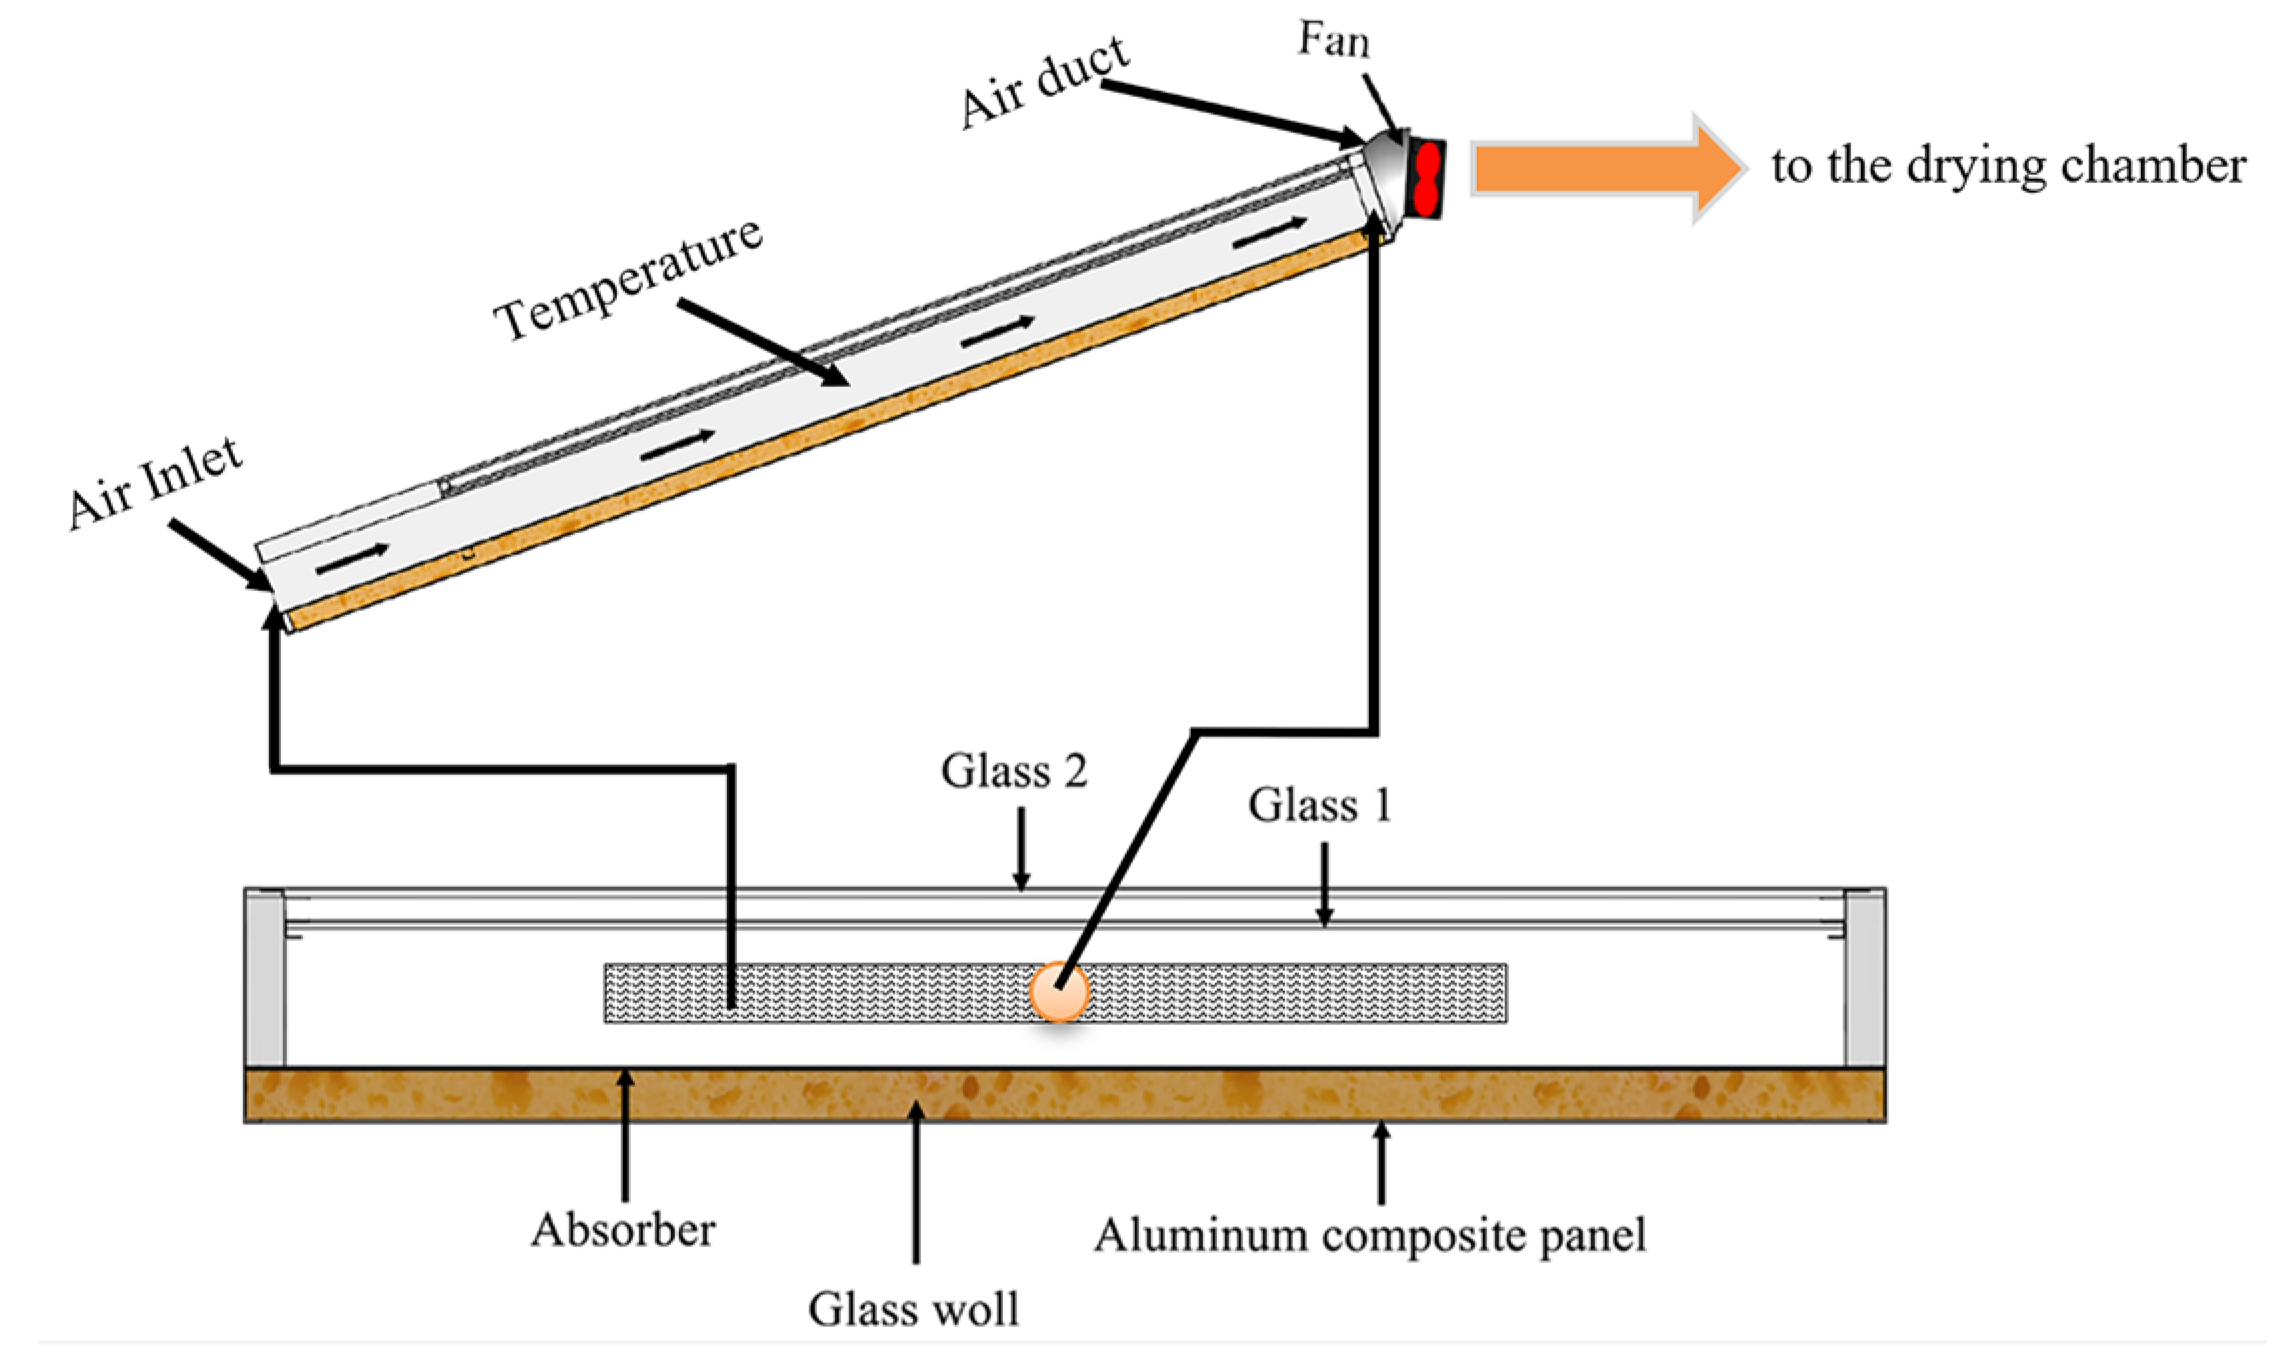
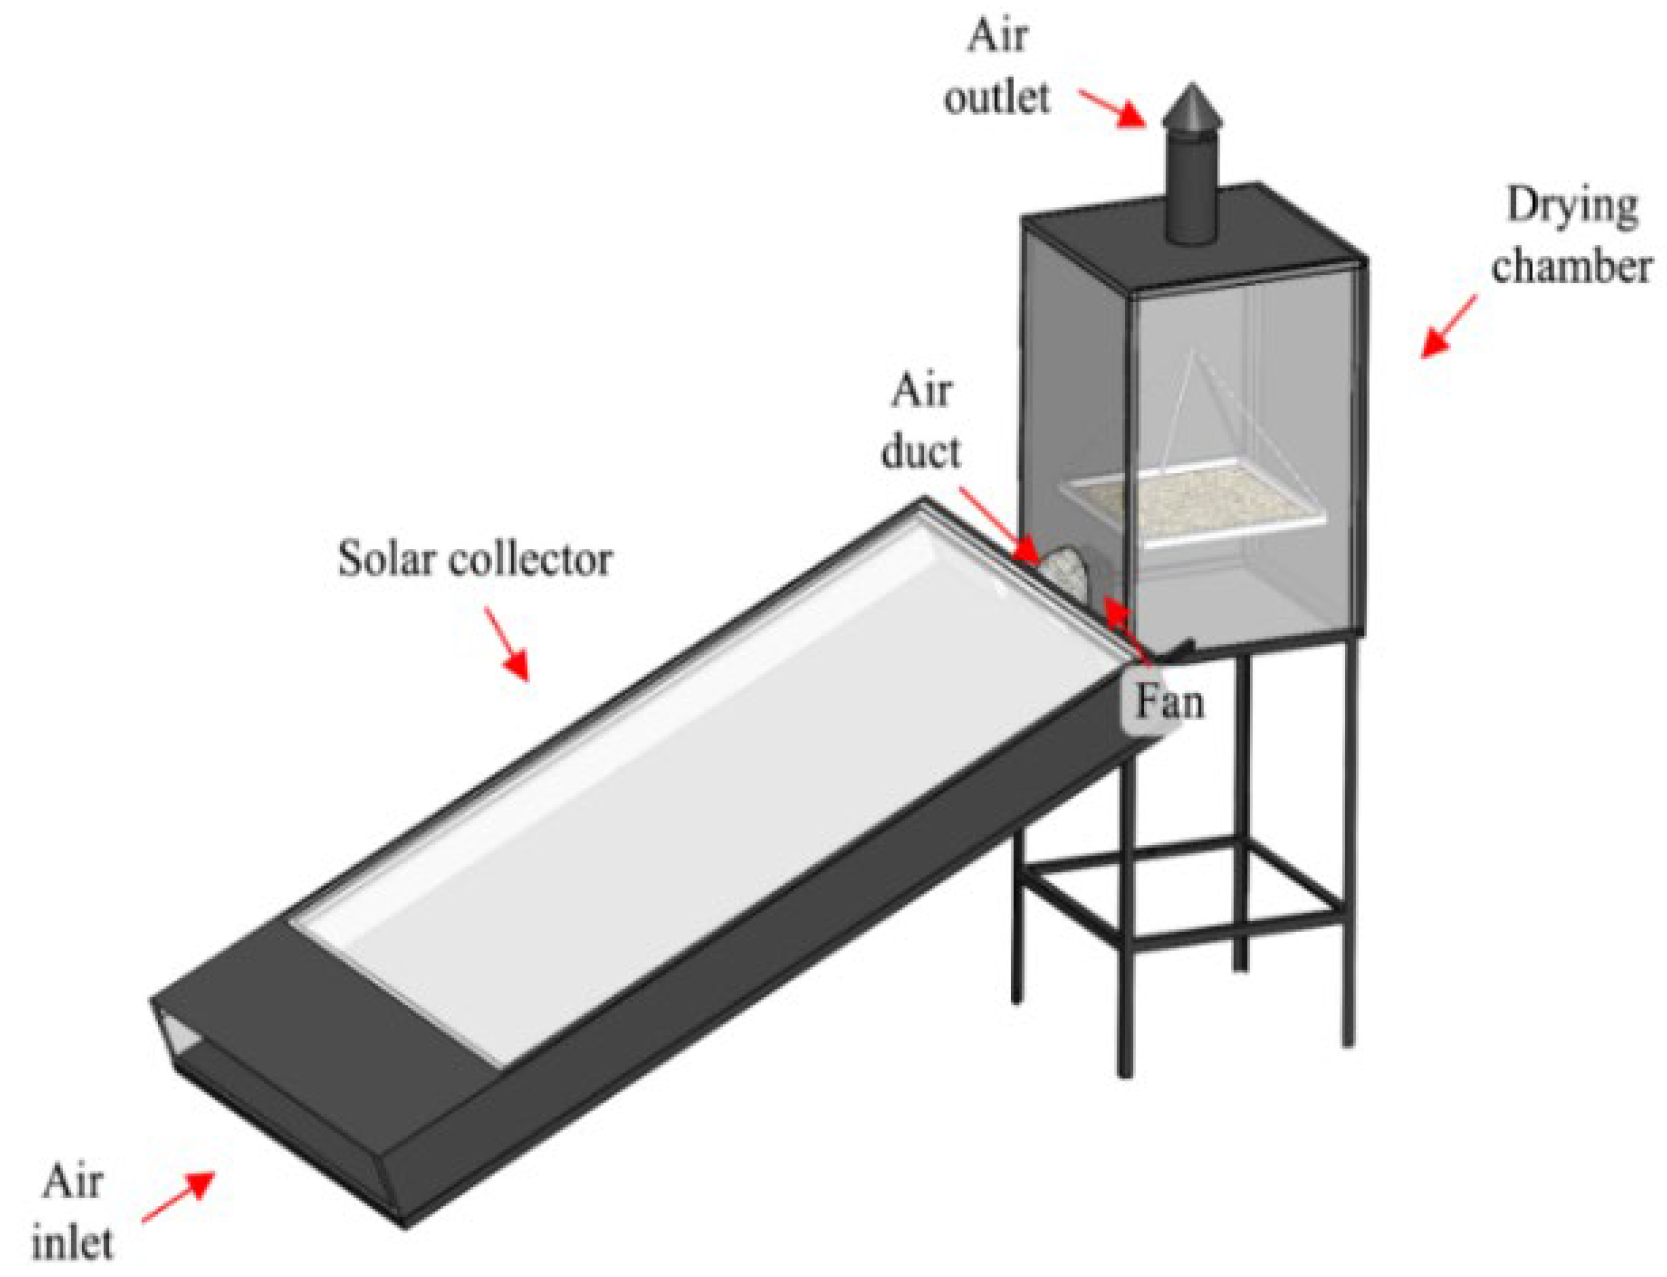
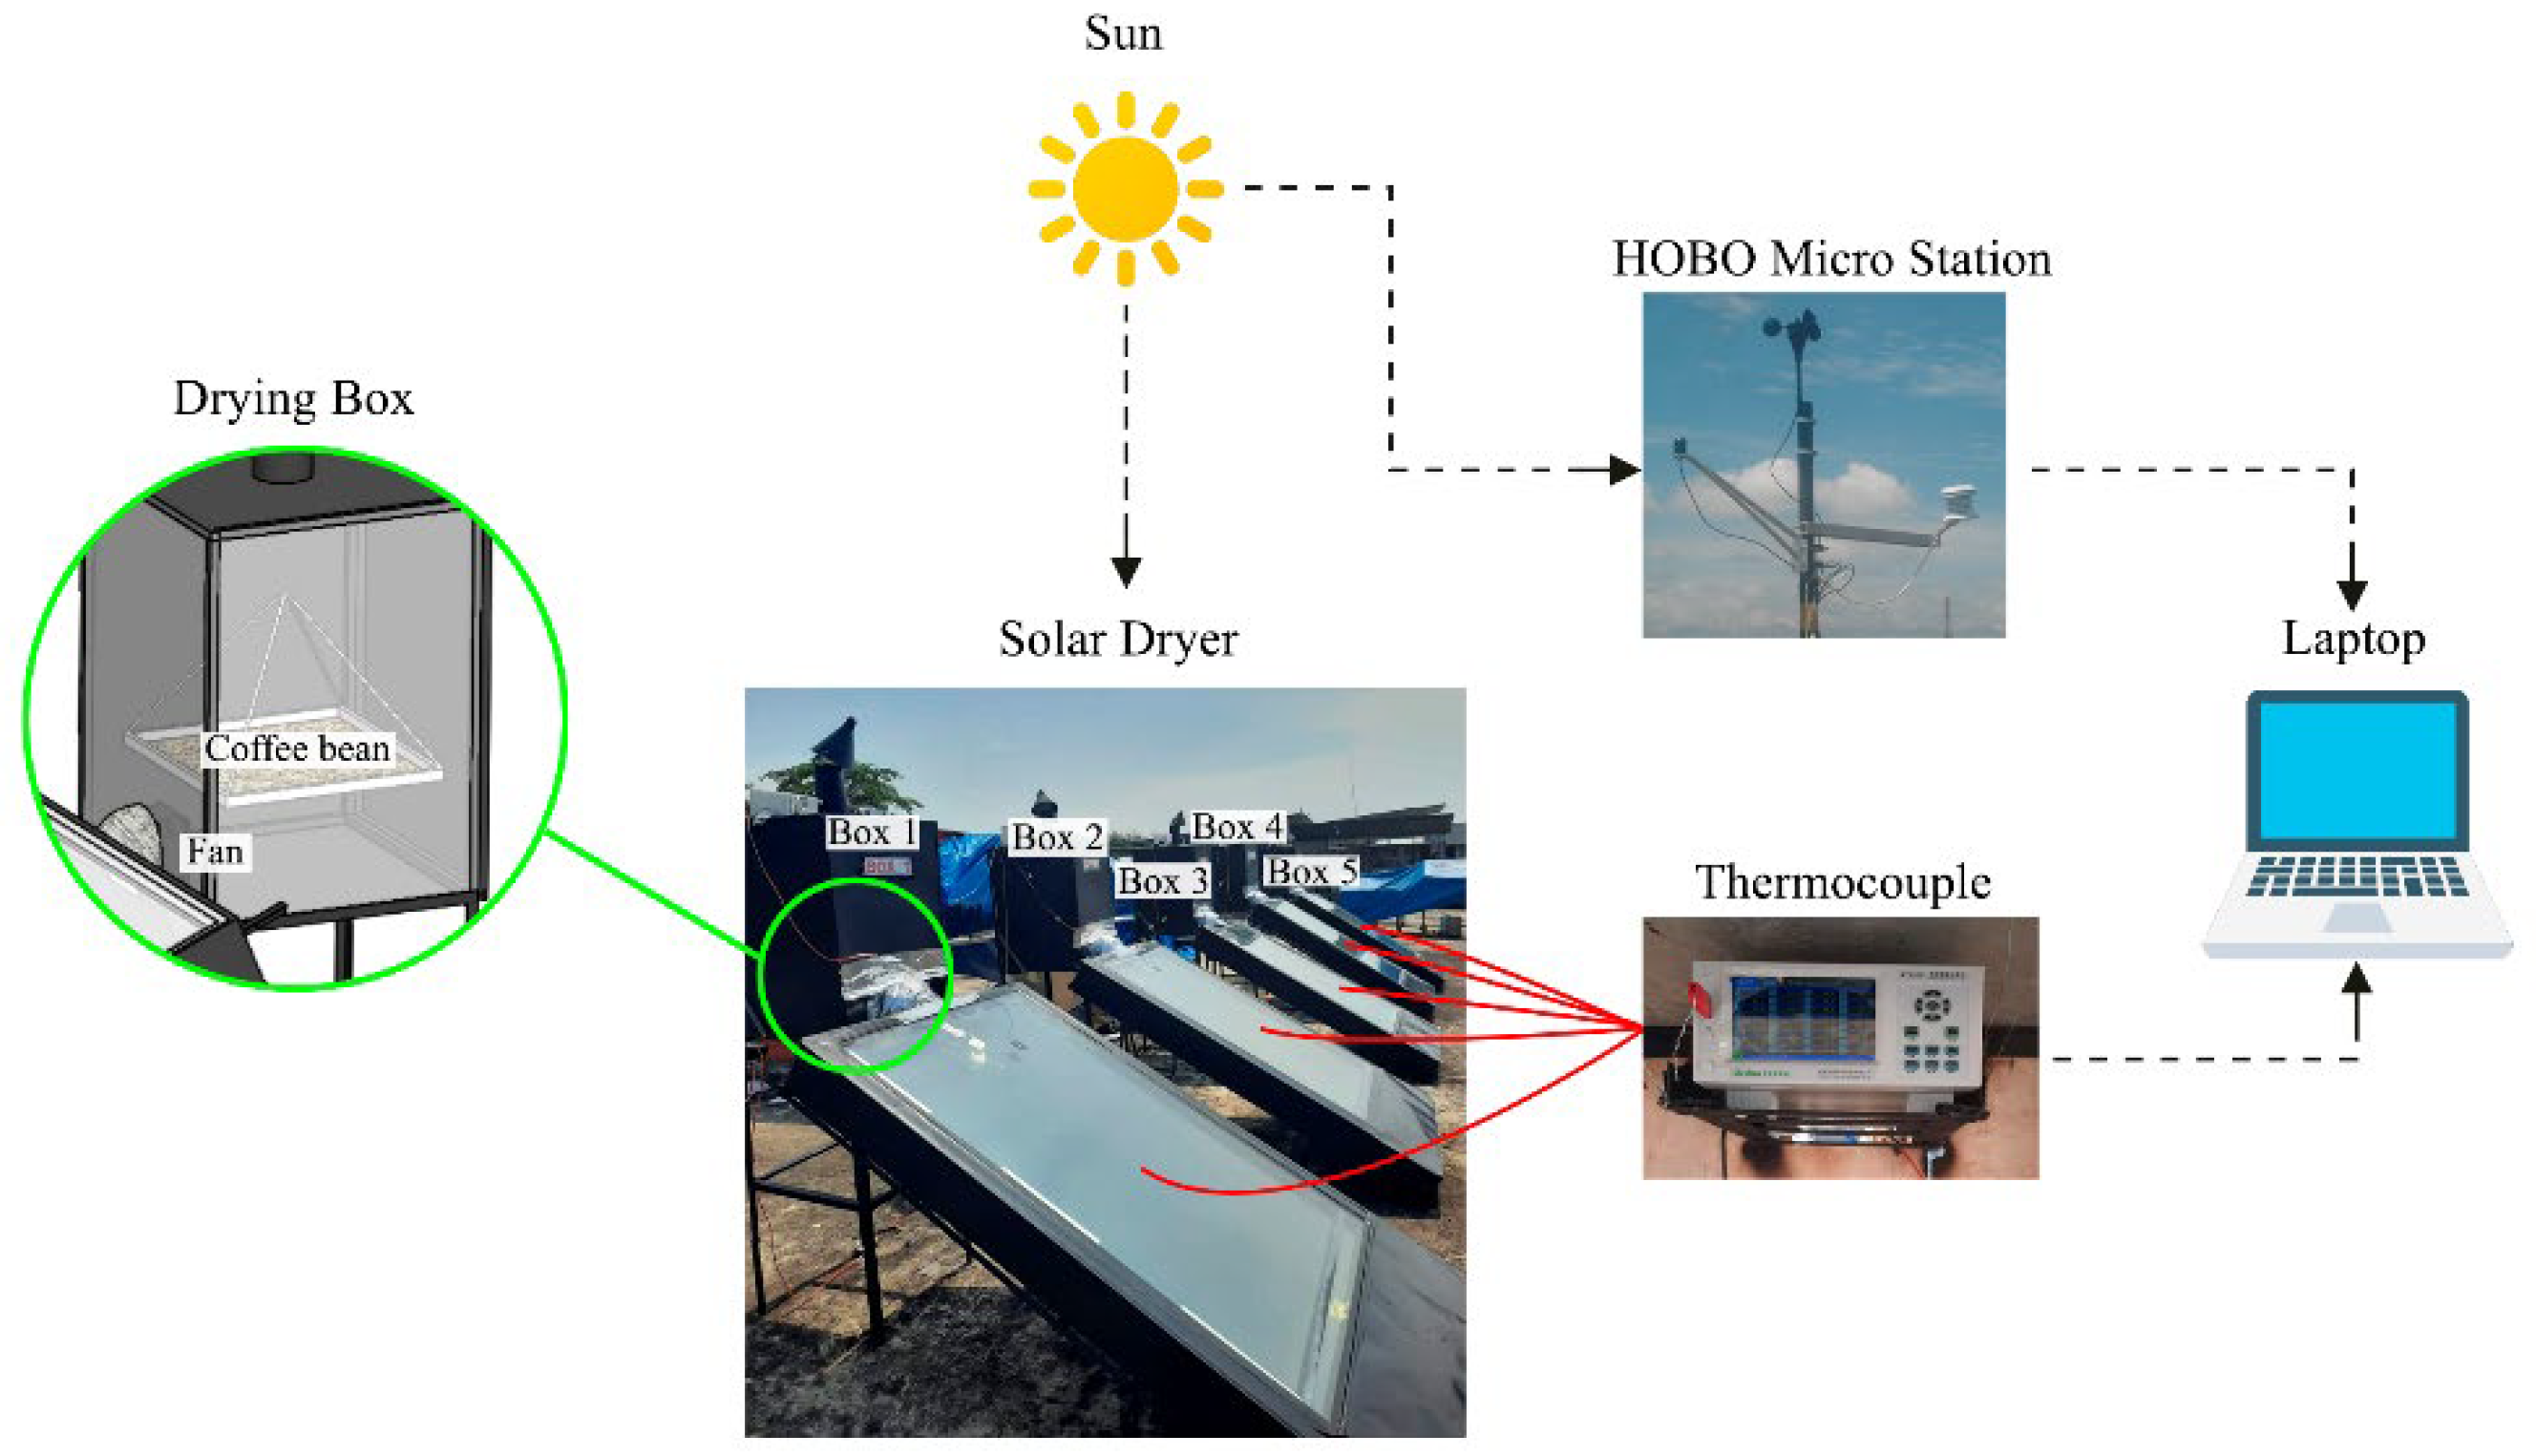
2. Materials and Methods

In this research, five solar coffee dryers of the same size and with the same components were used. The heat source used for drying coffee beans was solar radiation heat obtained from solar collectors as heat collectors. The arrangement of the solar coffee dryer components can be seen in Figure 1.
From Figure 1. the components of the solar coffee dryer consisted of two pieces of glass and a 3 mm flat-type absorbent plate painted black, functioning as a solar heat collector. To isolate the heat trapped in the solar collector, 50 mm thick glass wool was used around the body. The cover of the lower solar collector was made of 3 mm thick aluminum composite panel. On the two wider sides, the attached air inlets and outlets (dryer box direction) were made of flexible pipe material with a diameter of 120 mm and a length of 100 mm. The size of the dryer box was 800 mm × 890 mm × 600 mm.
The exterior of the drying box was made of a 3 mm flat zinc plate coated with 10 mm styrofoam, while the inside was coated with aluminum foil to maintain the cleanliness of the dried coffee bean samples and keep them free from surrounding dirt. In addition, a chimney with a diameter of 150 mm in the upper position functioned as an air outflow. The hot air from the solar collector was blown with a 12 V and 0.14 A DC fan with varying air velocity of 1, 1.5, 2, 2.5, and 3 m/s. Testing was carried out for 25 h on coffee with an initial moisture content of 95% until the final moisture content was 19%. In this experiment, the temperature was measured using an Agilent 34972A thermocouple (Agilent, Santa Clara, CA, USA) and mass loss, solar radiation, and ambient air velocity were measured using a Hobo Micro Station data logger. The humidity of the sample in the dryer box was measured using a GM1365 data logger (Benetech’s, Shenzhen, China), recorded every 10 min with a device connected to the computer. The solar coffee dryers were labeled as follows: DB1, intake air velocity of 1 m/s; DB2, intake air velocity of 1.5 m/s; DB3, intake air velocity of 2 m/s; DB4, intake air velocity of 2.5 m/s; and DB5, intake air velocity of 3 m/s. Each box contained 1500 g of dried coffee beans (Toba, Indonesia) and was placed on a 400 mm × 400 mm × 200 m aluminum shelf with holes at the bottom (wire mesh) that was directly connected to the load cell to record changes in coffee mass. The design of the dryer is shown in Figure 2. During the test, thermocouples directly connected to a computer were used to measure the adsorbent plate, solar collector components (glass 1 and glass 2), and the inner side wall. These measurements were taken every 10 min.
From Figure 2. coffee bean samples were obtained from Marsangap Village, Toba Regency. After the beans were picked from the garden, the outer skin was removed, they were sorted to select good beans for further drying, and the resulting samples were washed and fermented for 6 h. Coffee beans with the outer skins peeled that were dried without using solar heat or additional heat had a water content of 87%. Coffee bean samples were put into the drying rack in an even layer with a thickness of 0.5–1.0 cm. The rack filled with coffee beans was then put into drying boxes DB1, DB2, DB3, DB4, and DB5, each with the same weight. Measurements were taken from 08.00 a.m. to 18.00 p.m. Drying was carried out for 25 h until the beans reached 19% moisture content. The fan was turned on with different air velocity for each solar coffee dryer: DB1 = 1 m/s, DB2 = 1.5 m/s, DB3 = 2 m/s, DB4 = 2.5 m/s, and DB5 = 3 m/s. The energy source driving the fan was electrical energy, and the fan was set with a dimmer control (Bombay Electronics, India). The experimental setup used in this study is shown in Figure 3.

3. Thermal Analysis

This section describes the formulas that were used to analyze the heat transfer and drying that occur in the solar coffee drying equipment. The moisture content (M) of a substance is expressed as a percentage of weight on wet basis, calculated as:
M C = M w M d M w × 100 % ,
where Mw is the mass of the wet material and Md is the mass of the dry material. The amount of moisture to be removed can be calculated as:
M w = M c I M c F 100 M c F × M p ,
where Mw is the amount of water to be removed (kg), Mcl is the initial moisture content, and Mp is the initial mass of the product to be evaporated for the required time interval.
D R = M W t .
The drying efficiency of a forced convection solar dryer in the daytime is defined as the ratio of energy supplied to evaporate the moisture of the product to the energy supplied to the dryer, and is calculated using:
η s = M w × L A s × I × t + E × 100 ,
where L is latent heat (KJ/kg), I is solar intensity (W/m2), As is the surface area of the solar collector (m2), t is the total drying time (s), and E is the energy supplied to the blower (J). The effectiveness factor can be defined as the ratio of the drying rate in the solar dryer cabinet to the drying rate in the open sun:
E f = drying rate   in solar   dryer drying   rate   in open sun drying .
To analyze the thermal efficiency of a solar collector, the following equation is used:
η = Q u Q in , total ,
with incoming heat energy (Qin), where
Q in = I × A × τ × α ,
where I is solar radiation intensity (W/m2), A is the collector surface area, τ is the glass transmissivity (0.88), and α is the plate absorptivity (absorptivity of the black painted plate is assumed to be 0.97). The following equation is used to calculate the heat energy (Qu):
Q u = F × Q in , total Q loss , total .
In the calculation, the solar collector efficiency factor (F′) is assumed to be 90%, or the absorptivity value of the black painted plate. The following equations are used for calculating heat loss:
Total heat loss of the collector (Qloss):
Q total = Q wall + Q bottom + Q top + Q rad .
Radiation heat loss (Qrad):
Q rad = A × σ T p 4 T k 4 1 ε p + 1 ε c 1 + 1 ε c + 1 ε c 1 .
Top-side heat loss (Qtop):
Q top = U top × A × T p T a .
Overall heat transfer coefficient:
U t o p = N C T p T p T a N + f e + 1 h w 1 + σ T p T a + T p 2 + T a 2 ε p + 0 . 00591 × N × h w 1 + 2 N + F 1 + 0 . 1333 ε p ε k N .
Heat loss at the bottom (Qbottom):
Q bottom = U bottom × A × T p T u ,
1 U b o t t o m = 1 h 1 + t 1 K A C p + t 2 K G l a s s w o o l + t 3 K S t y r o f o a m + t 4 K S e n g .
Heat loss at the wall (Qside):
Q s i d e = U s i d e × A T p T u ,
1 U s i d e = 1 h 1 + t 1 K A c p + t 2 K G l a s s w o o l + t 3 K S t y r o f o a m + t 4 K S e n g
where N is the amount of glass, F = (1 + 0.089hw – 0.1166hw εp)(1 + 0.07866N), C = 520 (1 – 0.000051β2), E = 0.430 (1 − 100/Tpm), β is the collector angle (°), εg is the emissivity of acrylic (0.88), εp is the plate emissivity (0.97), Ta is the ambient temperature (K), Tp is the plate temperature (K), and hw is the convection heat transfer coefficient (W/m2 °C).

4. Results and Discussion

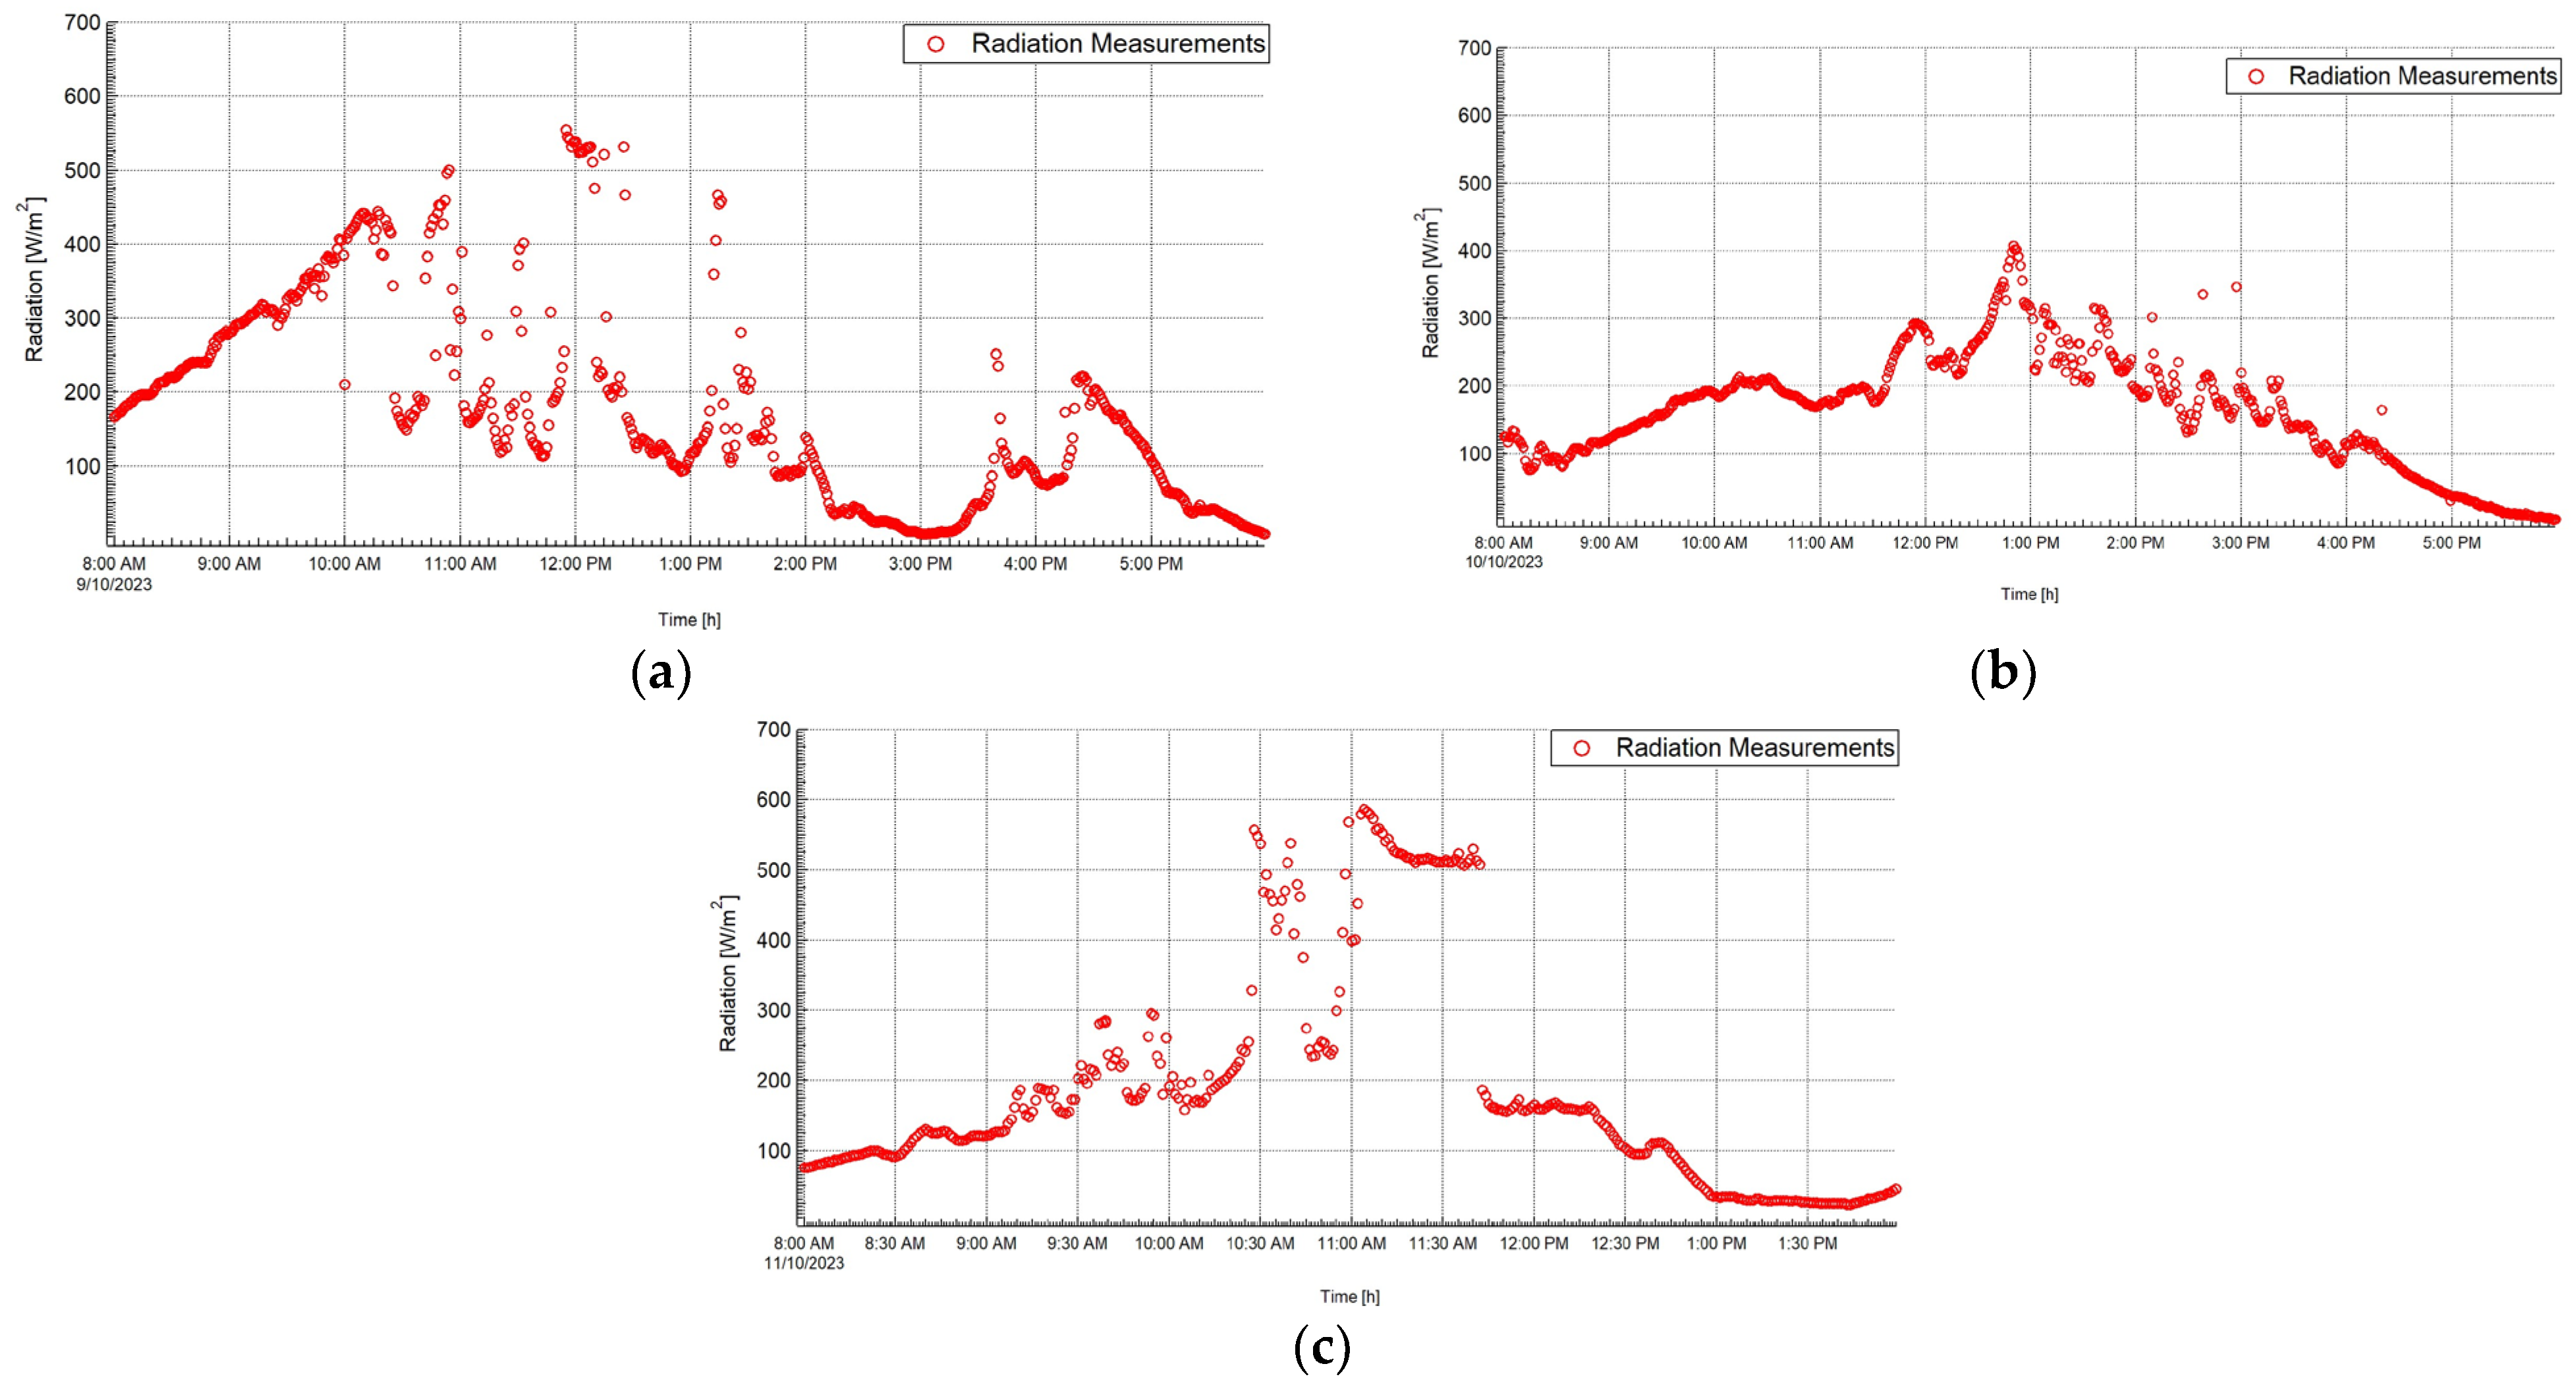
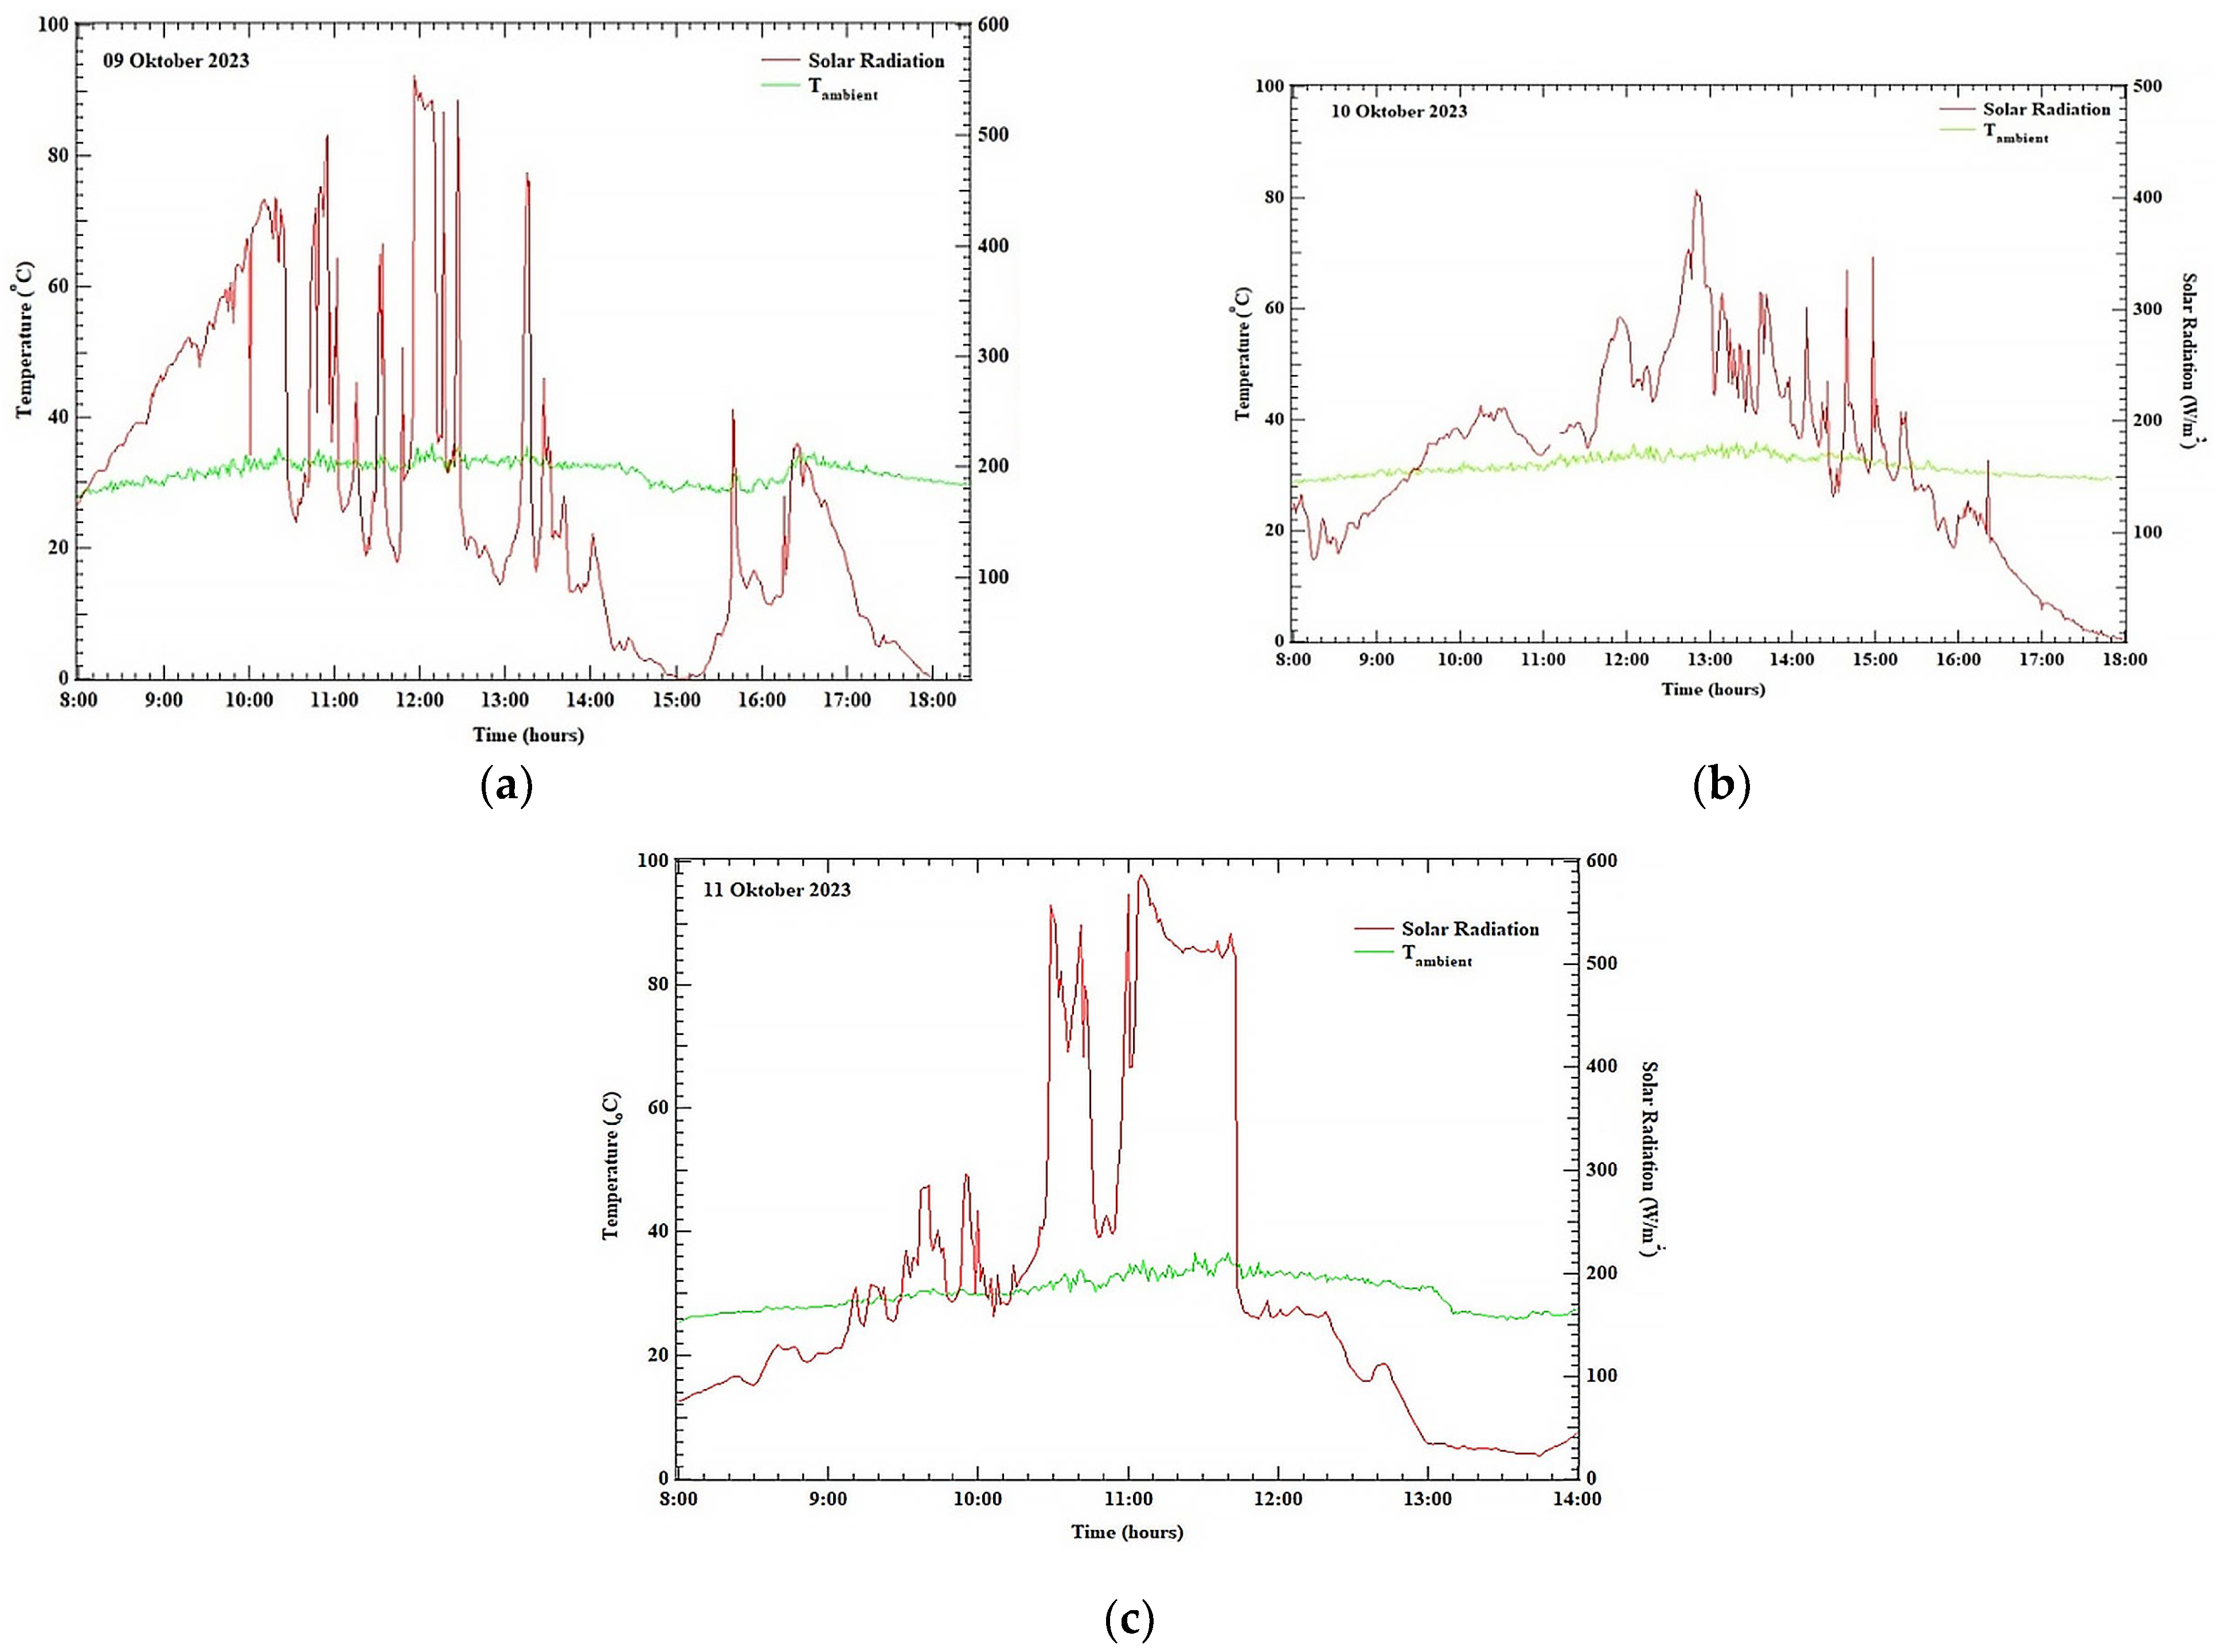
4.1. Solar Irradiation

The experimental testing of varying air velocity on the solar coffee dryer was carried out for 3 days (9–11 October 2023). The solar irradiation measured during the experimental testing is shown in Figure 4.
From Figure 4. the solar radiation measured during the experimental testing period reflects that the sky tended to be cloudy. On 9 October 2023, from 08.00 a.m. to 10.00 a.m., the sky conditions tended to be sunny; meanwhile, from noon to evening, the sky tended to be cloudy, so the obtained solar radiation tended to fluctuate. Only a few moments of higher irradiation were obtained: at 12.00 solar radiation increased to 538.1 W/m2, and until 15.00 p.m. radiation fell and increased again in the afternoon. However, on 10 October 2023, from morning to evening, the sky tended to be a little cloudy, so the obtained solar radiation tended to be constant but rose slowly until 13.00 p.m., with a value of 398.1 W/m2, then slowly decreased toward 18.00 p.m. On 11 October 2023, in the morning, the sky tended to be cloudy with a radiation value of 171.1 W/m2; however, from 11:00 a.m. to noon, the sky became bright, reaching 568.1 W/m2. Then, until 14:00 p.m., the sky became cloudy and overcast.
The total energy coming from the sun during the experimental testing is given in Table 1.
From Table 1. it was found that the total solar energy during the experimental testing (measured using the Hobo Micro Station data logger) was 6.5 MJ/m2 on the first day, 5.9 MJ/m2 on the second day, and 4.2 MJ/m2 on the third day. This indicates cloudy sky conditions during the test.
From Figure 5. the ambient temperature seemed to follow the same trend as solar radiation during the test: the higher the solar radiation, the higher the ambient temperature, and vice versa. On the first day, the average ambient temperature was 31.8 °C and the maximum was 36.1 °C. On the second day, the average ambient temperature was 31.6 °C and the maximum was 35.8 °C and, on the third day, the average ambient temperature was 30.1 °C and the maximum was 36.6 °C. During the 3 days of testing, the ambient temperature tended to be evenly high at 35.0–36.0 °C.

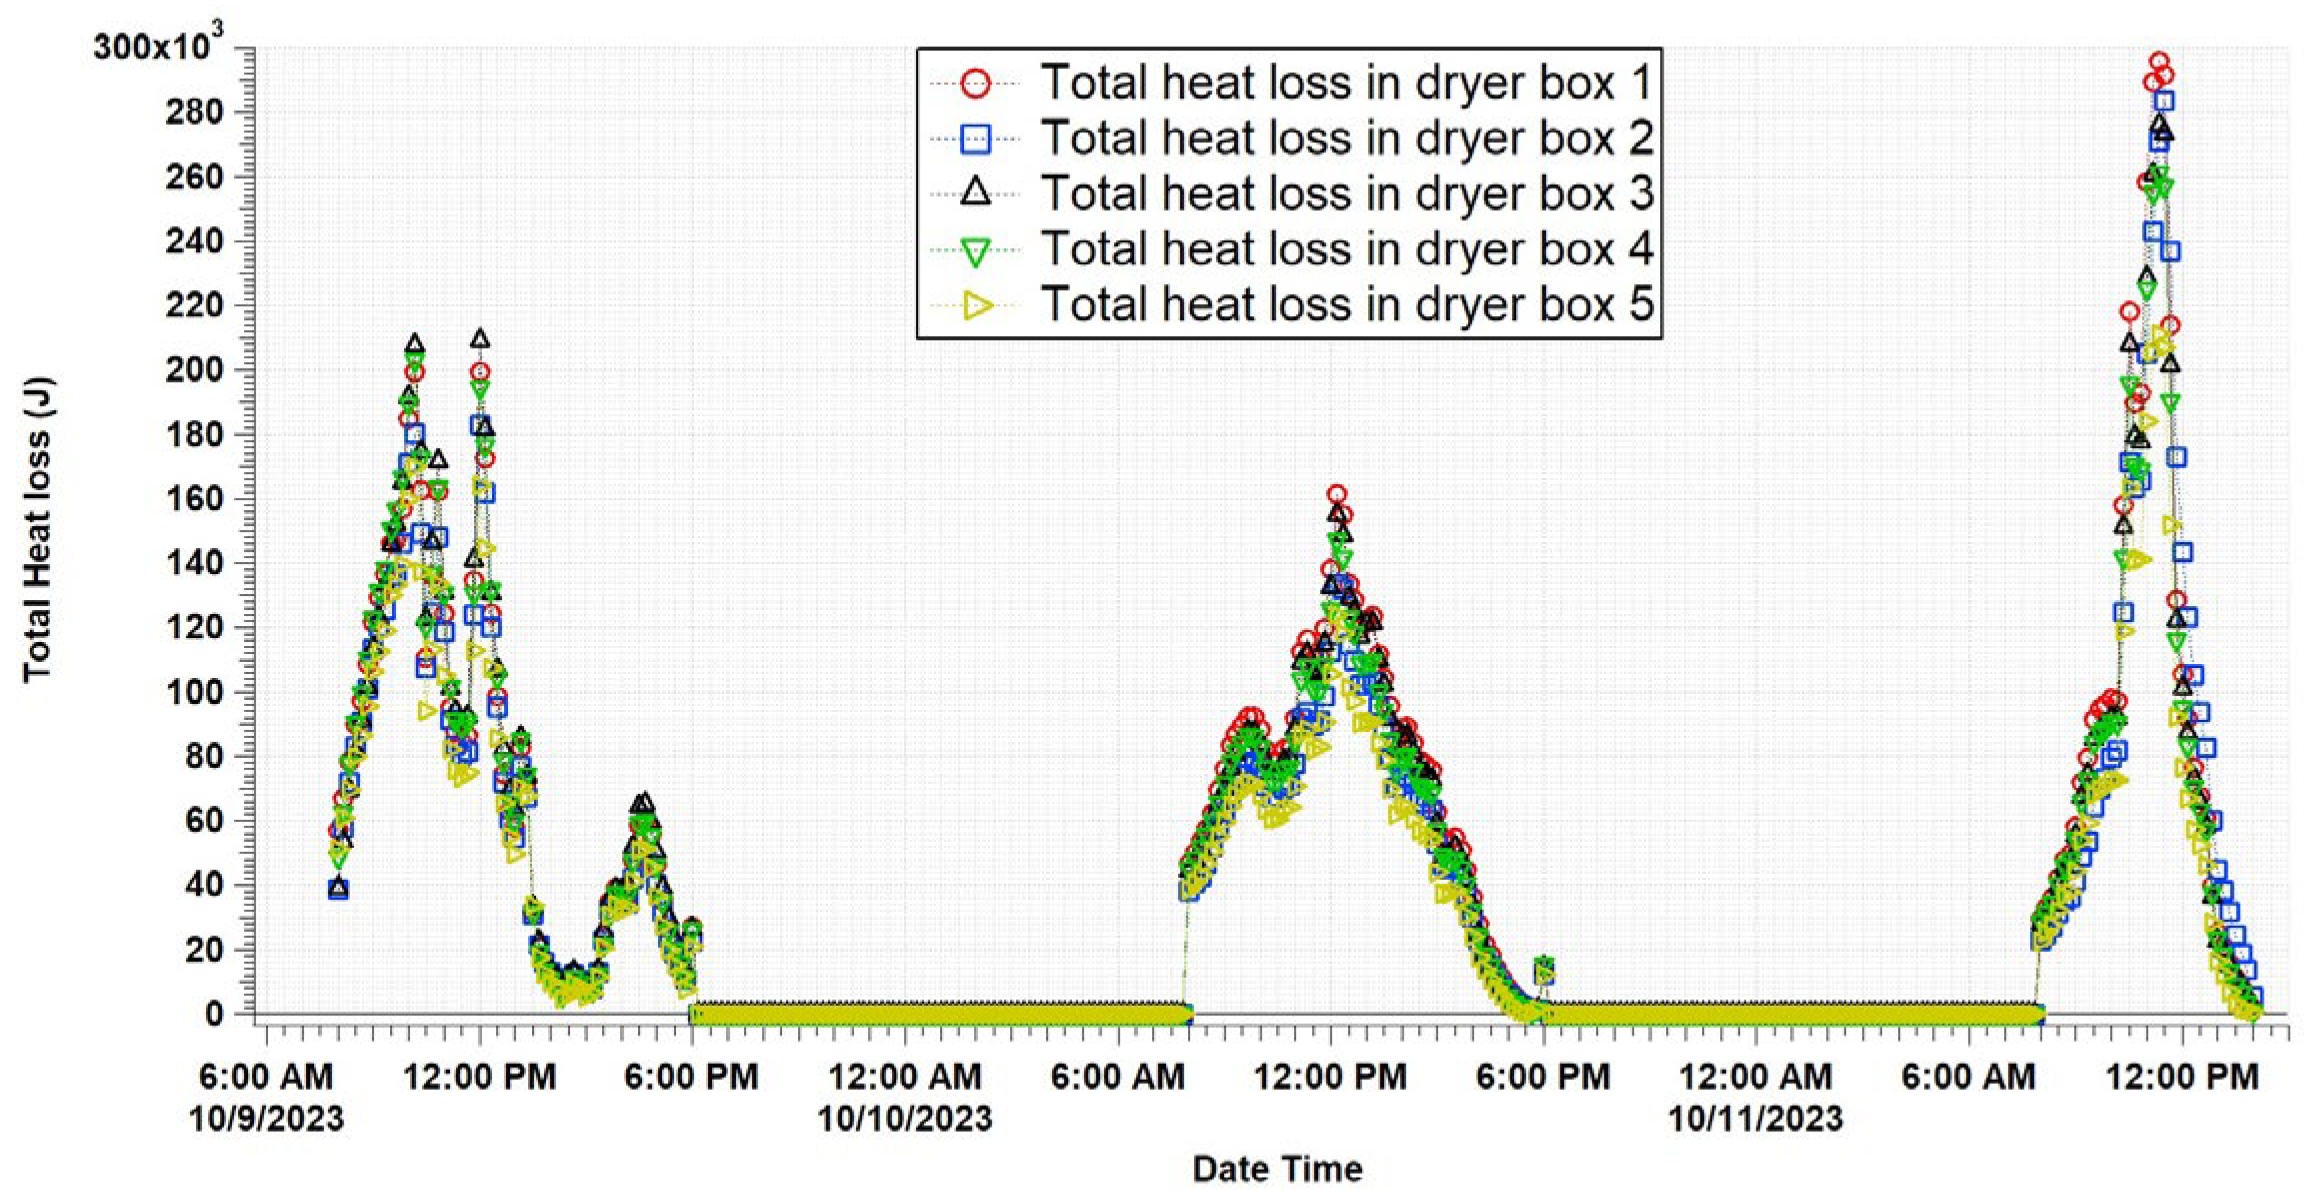
4.2. Solar Coffee Dryer Performance

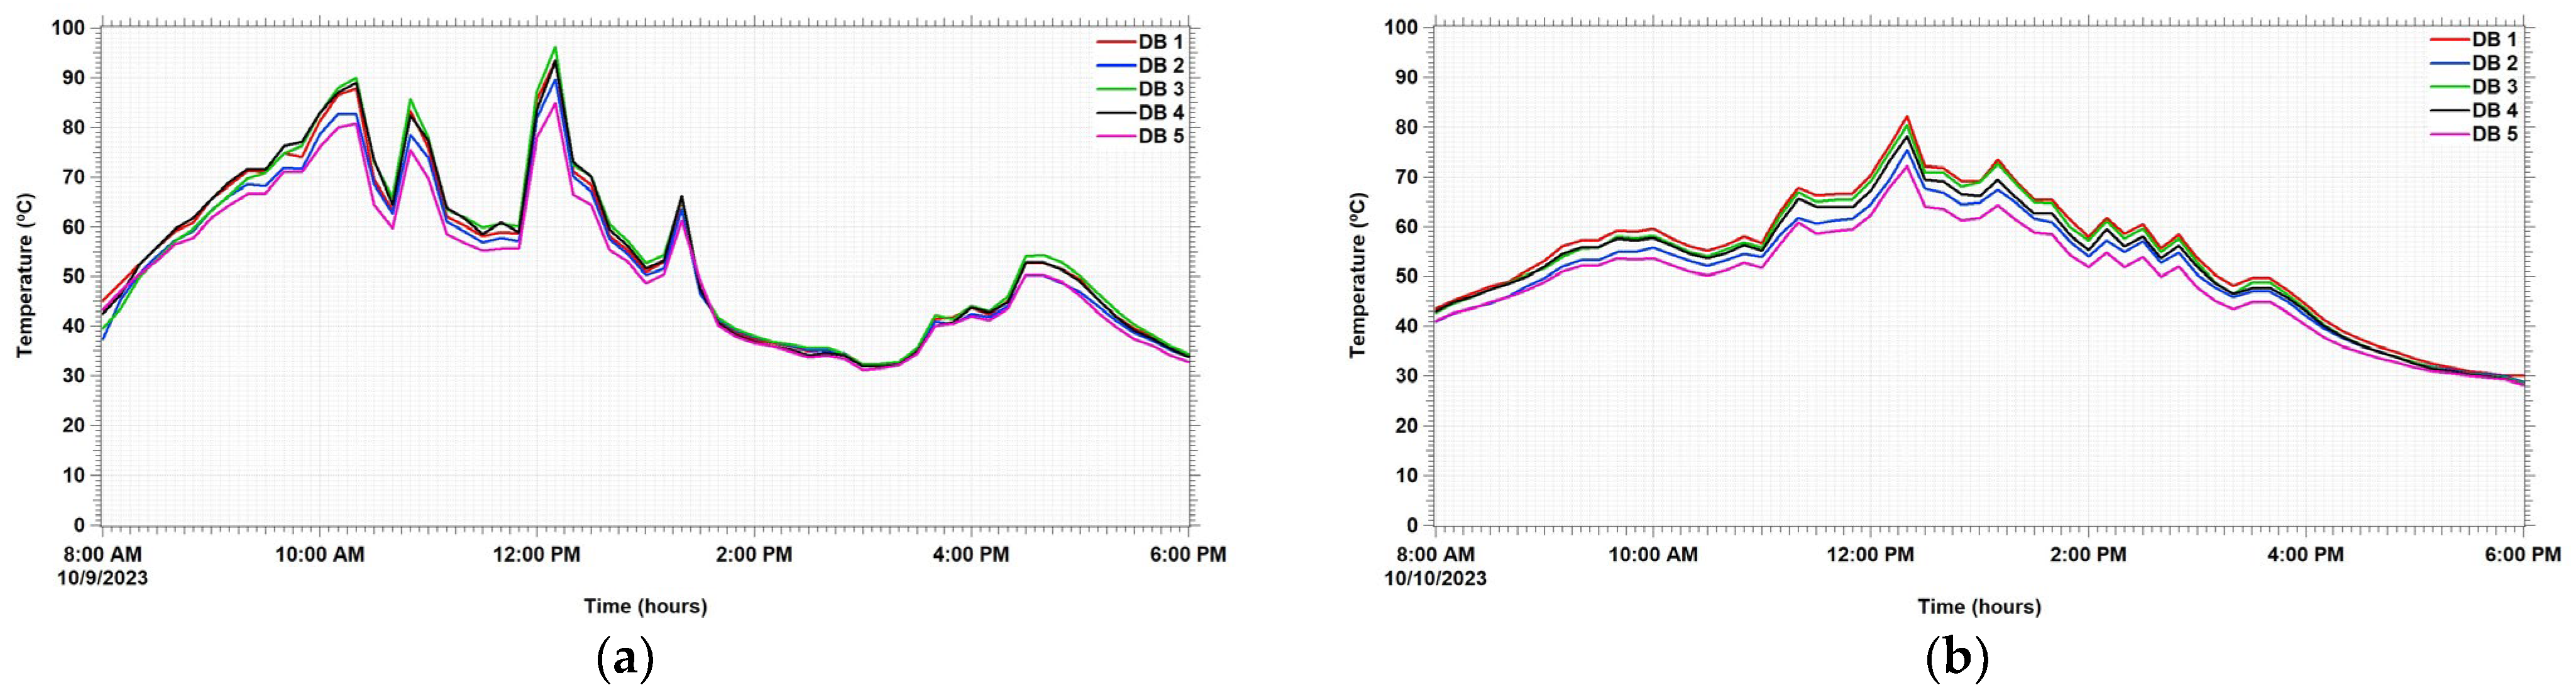
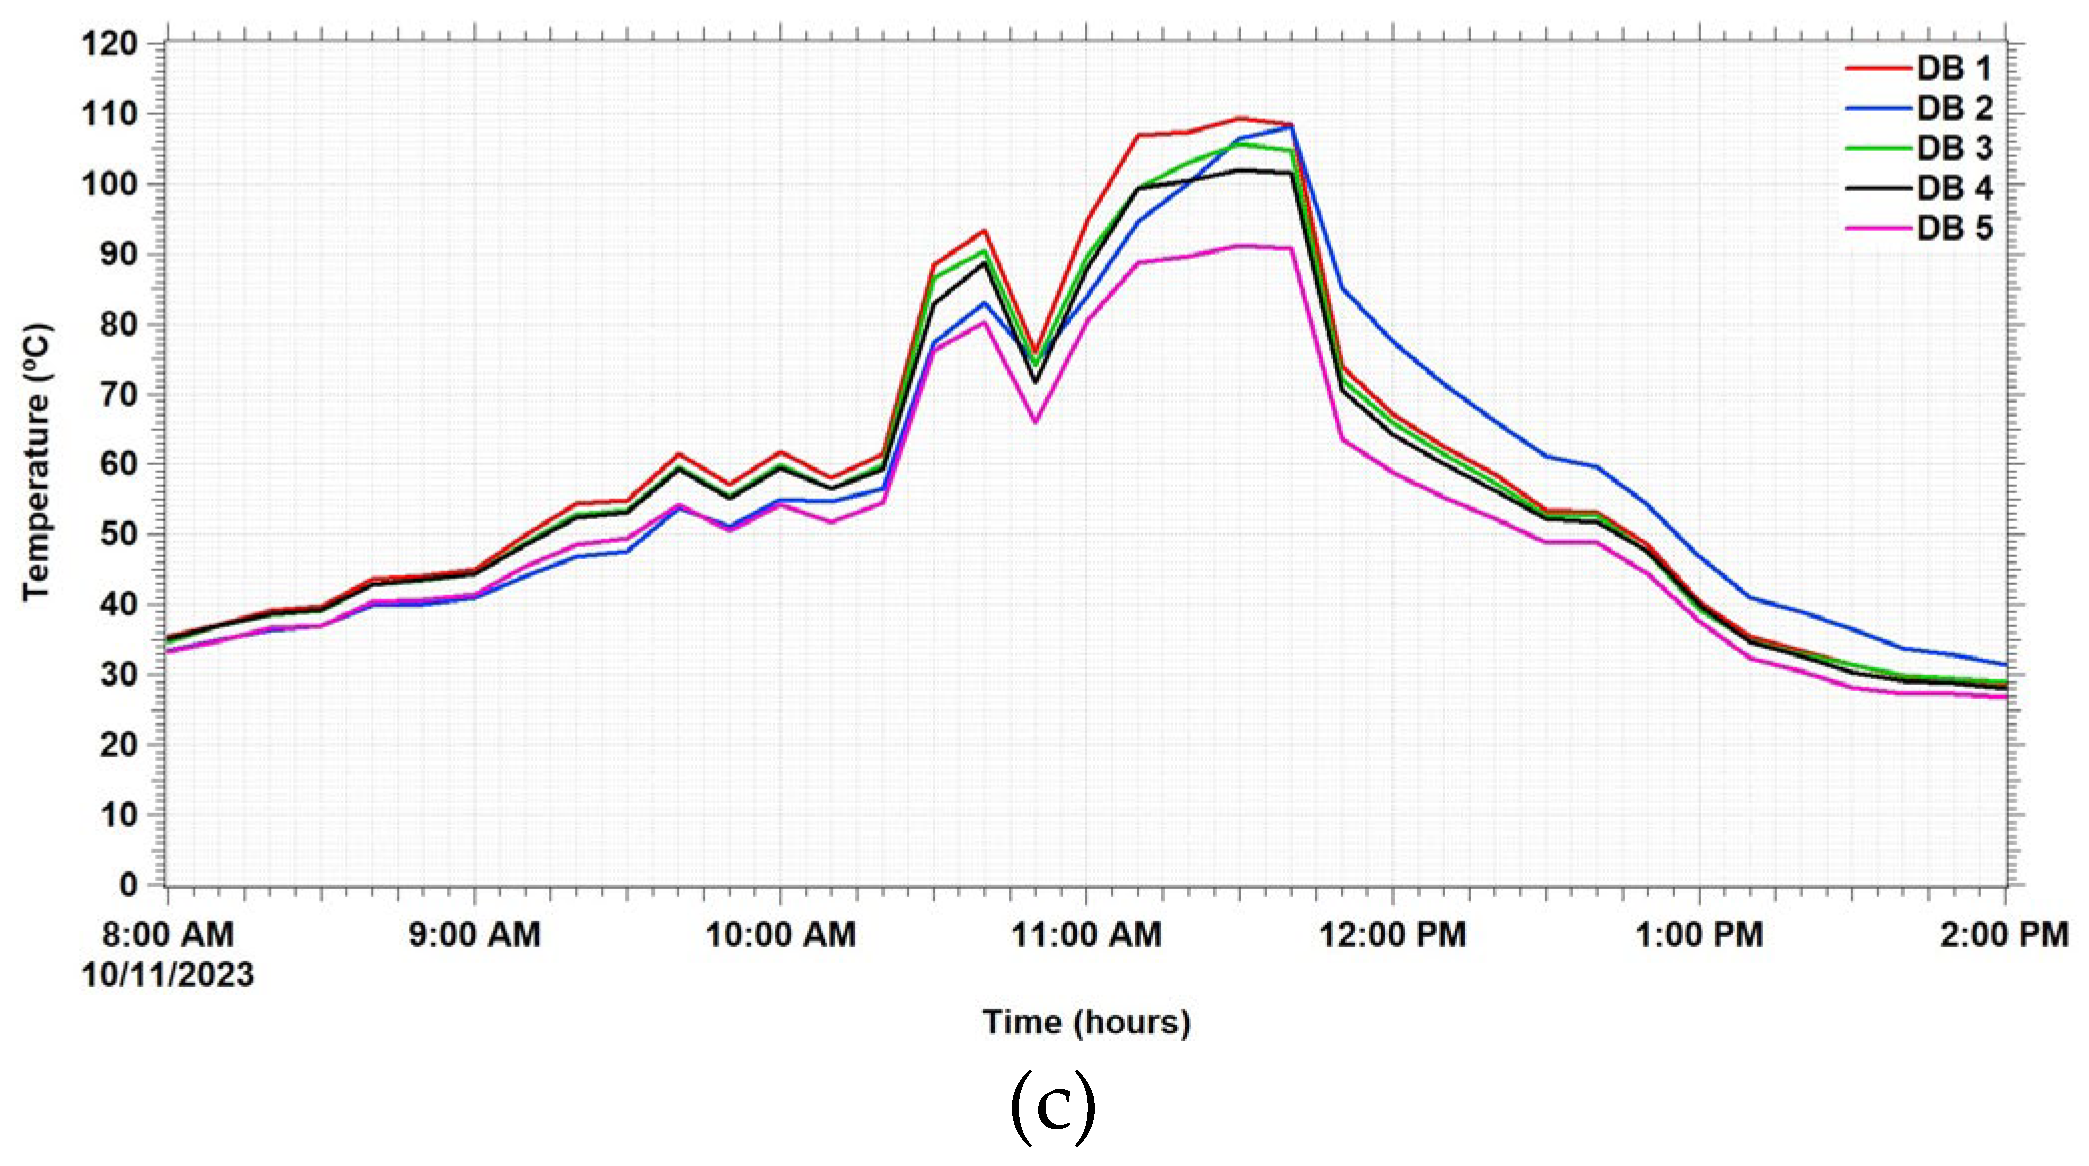
4.2.1. Absorber Temperature

The absorber plate on the solar coffee dryer has the most important function in absorbing solar radiation to dry the coffee. The absorber plate temperature measurements for each solar coffee dryer are shown in Figure 6.
Figure 6 shows a temperature graph of the absorber plate on the first day. It can be seen that the temperature in DB1, DB2, DB3, DB4, and DB5 increased until 10:20 a.m., reaching 87.8 °C, and then decreased at 11:20 a.m. At 12:10 p.m., the highest temperature was 96.1 °C in DB3, 93.3 °C in DB4, and then 93.5 °C in DB1, 93.3 °C in DB4, 89.2 °C in DB2, and 84.9 °C in DB5 until 18:00. It can be seen that, on the second day, the highest temperature was 82.1 °C in DB1, followed by 80.3 °C in DB3, 78.3 °C in DB4, and 72.1 °C in DB5. In the last test, on 11 October, the highest absorbent temperature was 109.4 °C in DB1, followed by 108.2 °C in DB2, 105.6 °C in DB3, 102.0 °C in DB4, and 91.2 °C in DB5. The cumulative average temperature for 3 days of testing in each solar coffee dryer was 55.35 °C in DB1, 53.25 °C in DB2, 54.80 °C in DB3, 54.17 °C in DB4, and 50.69 °C in DB5. It is observed that there is a difference in absorber temperature in the five solar coffee dryers due to variations in air flow velocity into the drying chamber. DB1 had a higher absorber temperature than DB5, because low air velocity can reduce convection heat transfer so that the absorber temperature in DB1 tended to be higher than the absorber temperature in a box with a higher air velocity.

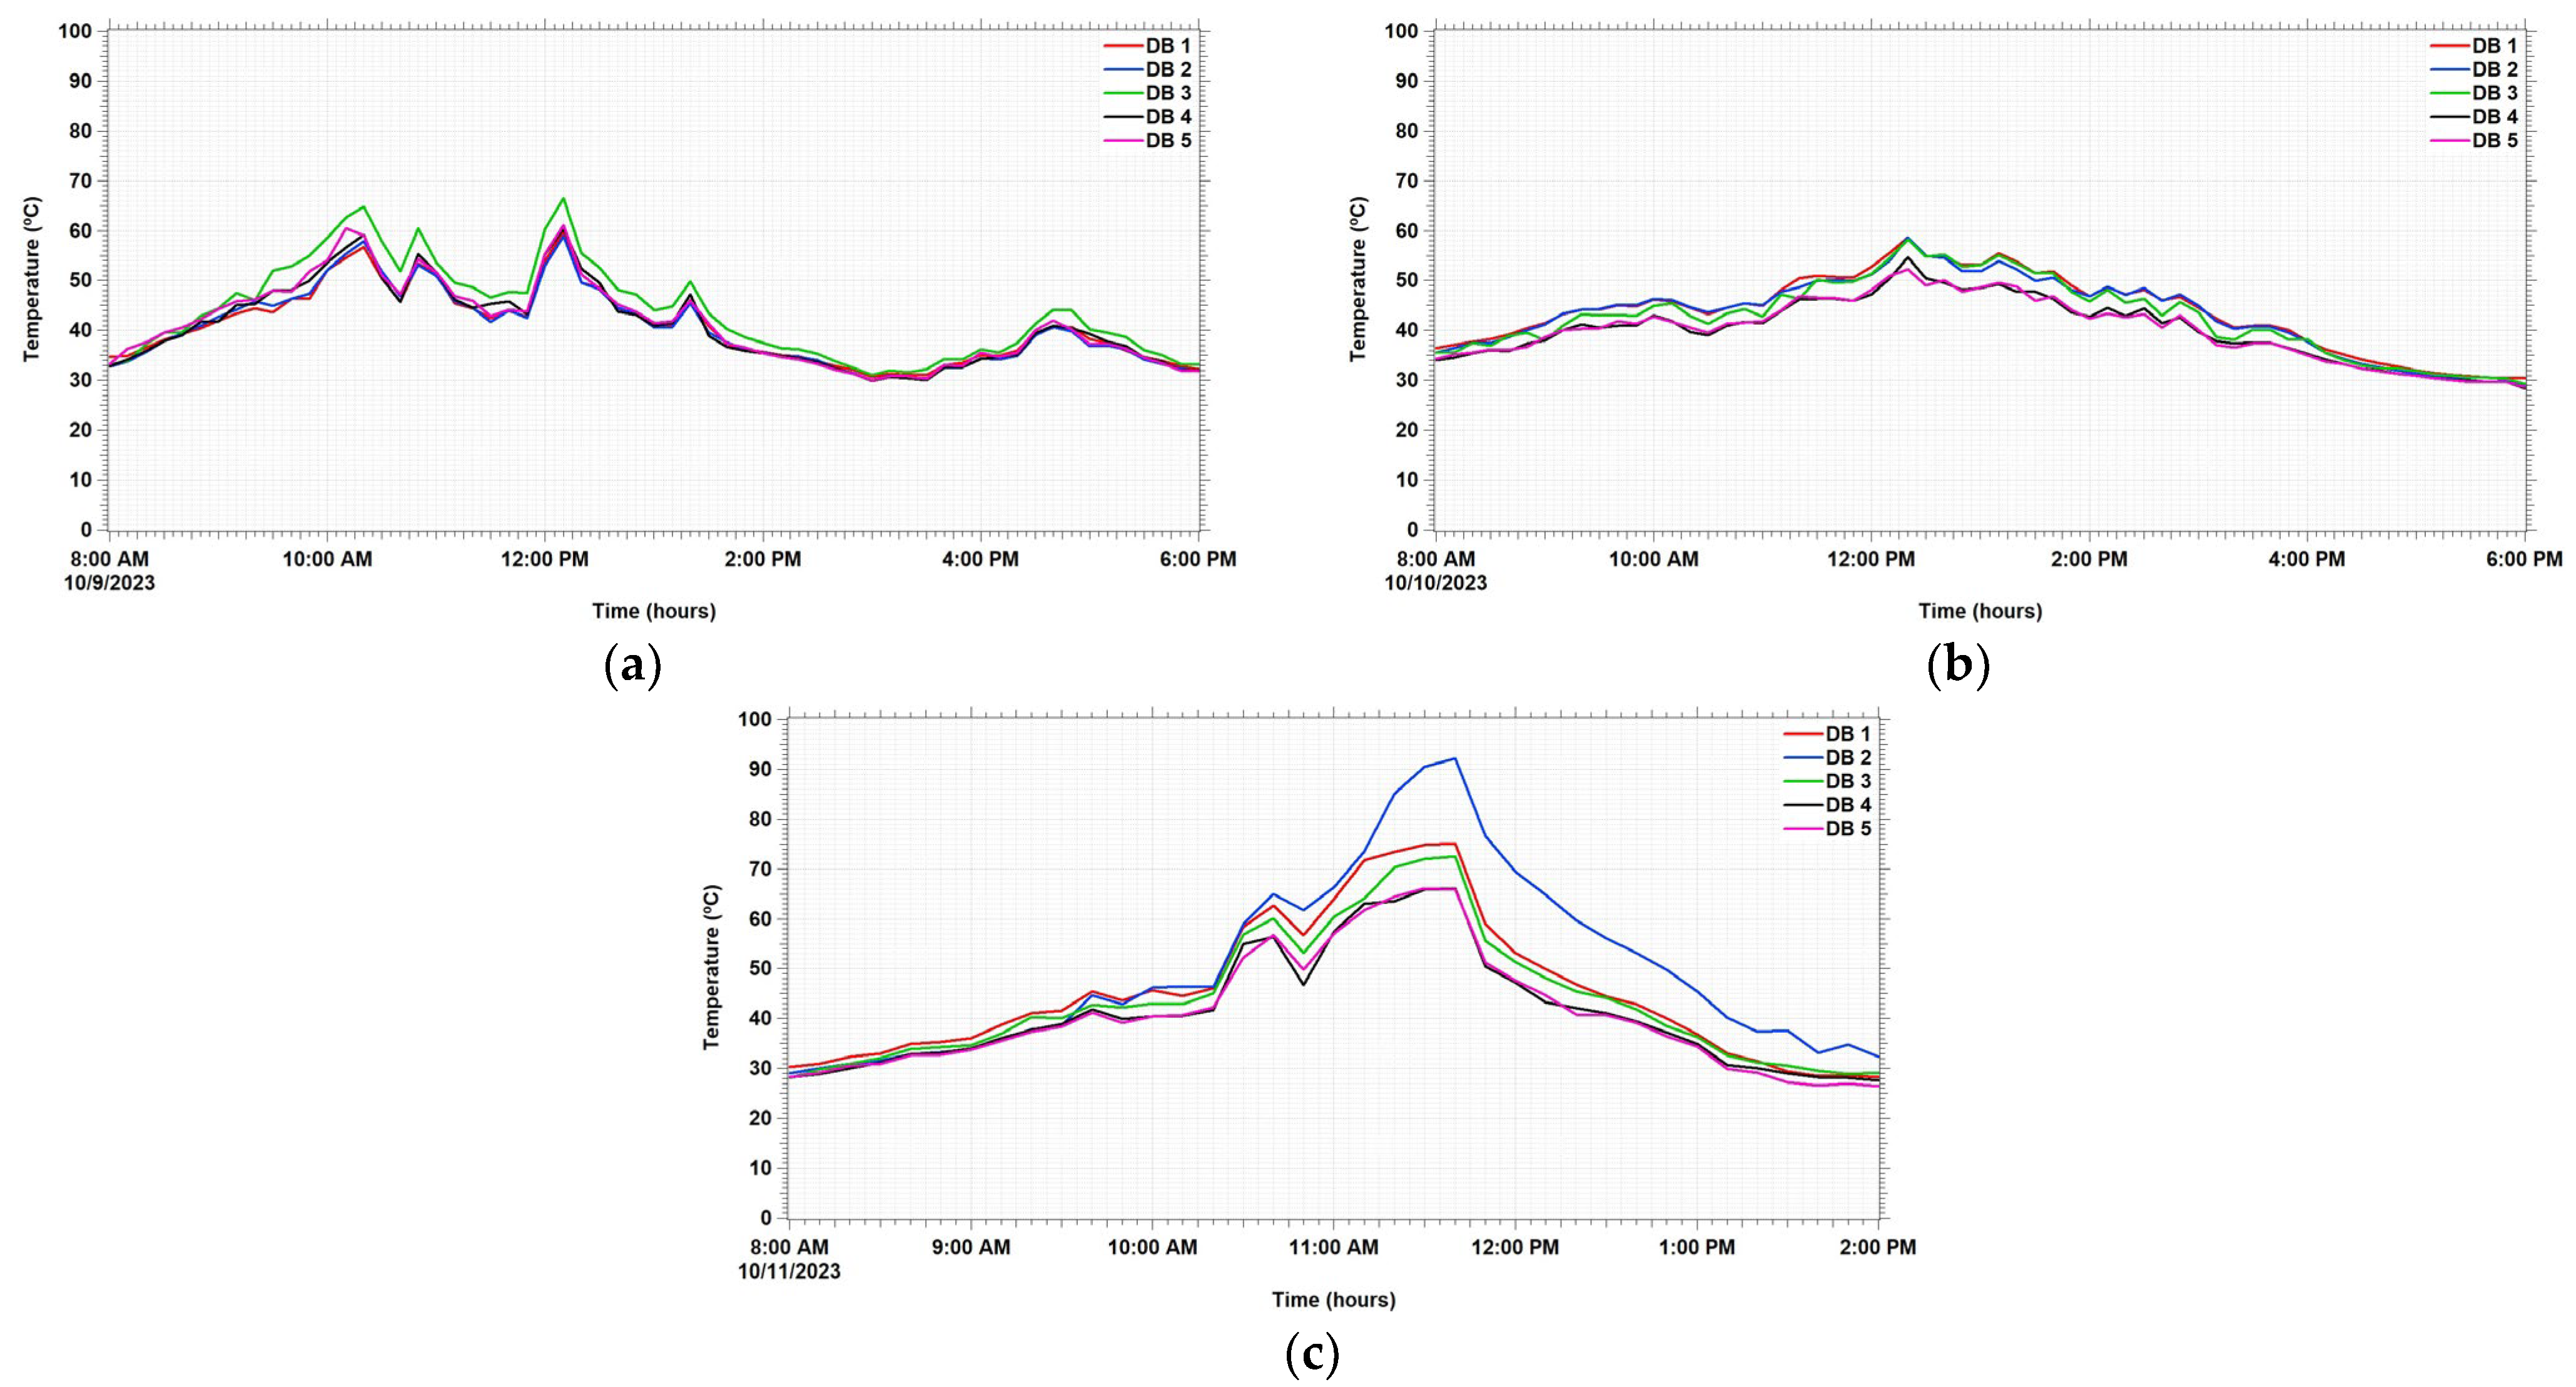
4.2.2. Drying Chamber Temperature

The temperature of the drying chamber greatly affects the drying process in coffee. The drying chamber temperature comes from the heat collected from the solar absorber, as discussed in the previous section. The drying chamber temperature measurements for the five solar coffee dryers are shown in Figure 7.
From Figure 7. on the first day, DB3 had an average initial temperature in the drying chamber of 43.70 °C, followed by DB5 at 41.3 °C, DB4 at 41.0 °C, DB1 at 40.69 °C, and DB2 at 40.4 °C. During the test on 10 October, the highest temperature was 42.7 °C in DB1, followed by 42.20 °C in DB2, 40.70 °C in DB3, 39.86 °C in DB5, and 39.80 °C in DB4. On day 3, the highest temperature was 46.19 °C in DB2 followed by 44.9 °C in DB1, 40.7 °C in DB4, and 37.76 °C in DB3.
The temperature in the drying chamber during experimental testing did not differ greatly between the drying chambers. The temperature of the drying chamber is strongly influenced by the absorber temperature: the higher the absorber temperature, the higher the temperature flowing into the drying chamber. For collector efficiency calculations, analytical analysis based on the incoming heat, used heat, and wasted heat was conducted. A graph of the total heat loss in the five solar coffee dryers can be seen in Figure 8.
From Figure 8. high collector temperatures will increase heat loss, so varying the air velocity in a solar coffee dryer can affect solar collector efficiency. The solar coffee dryer DB1 used a lower air velocity than other dryers, so it had a higher temperature on the absorber plate and increased wasted heat. The total heat loss in each solar coffee dryer during experimental testing was 12.75, 11.49, 12.44, 12.05, and 9.98 MJ for DB1, DB2, DB3, DB4, and DB5, respectively.
The average collector efficiency was obtained for each box, as given in Table 2.
From Table 2 dryer box 5 (with air velocity of 3 m/s) had the highest collector efficiency, as the use of a high air velocity can better move and utilize the heat that enters the collector, compared to a dryer box with a lower air velocity.

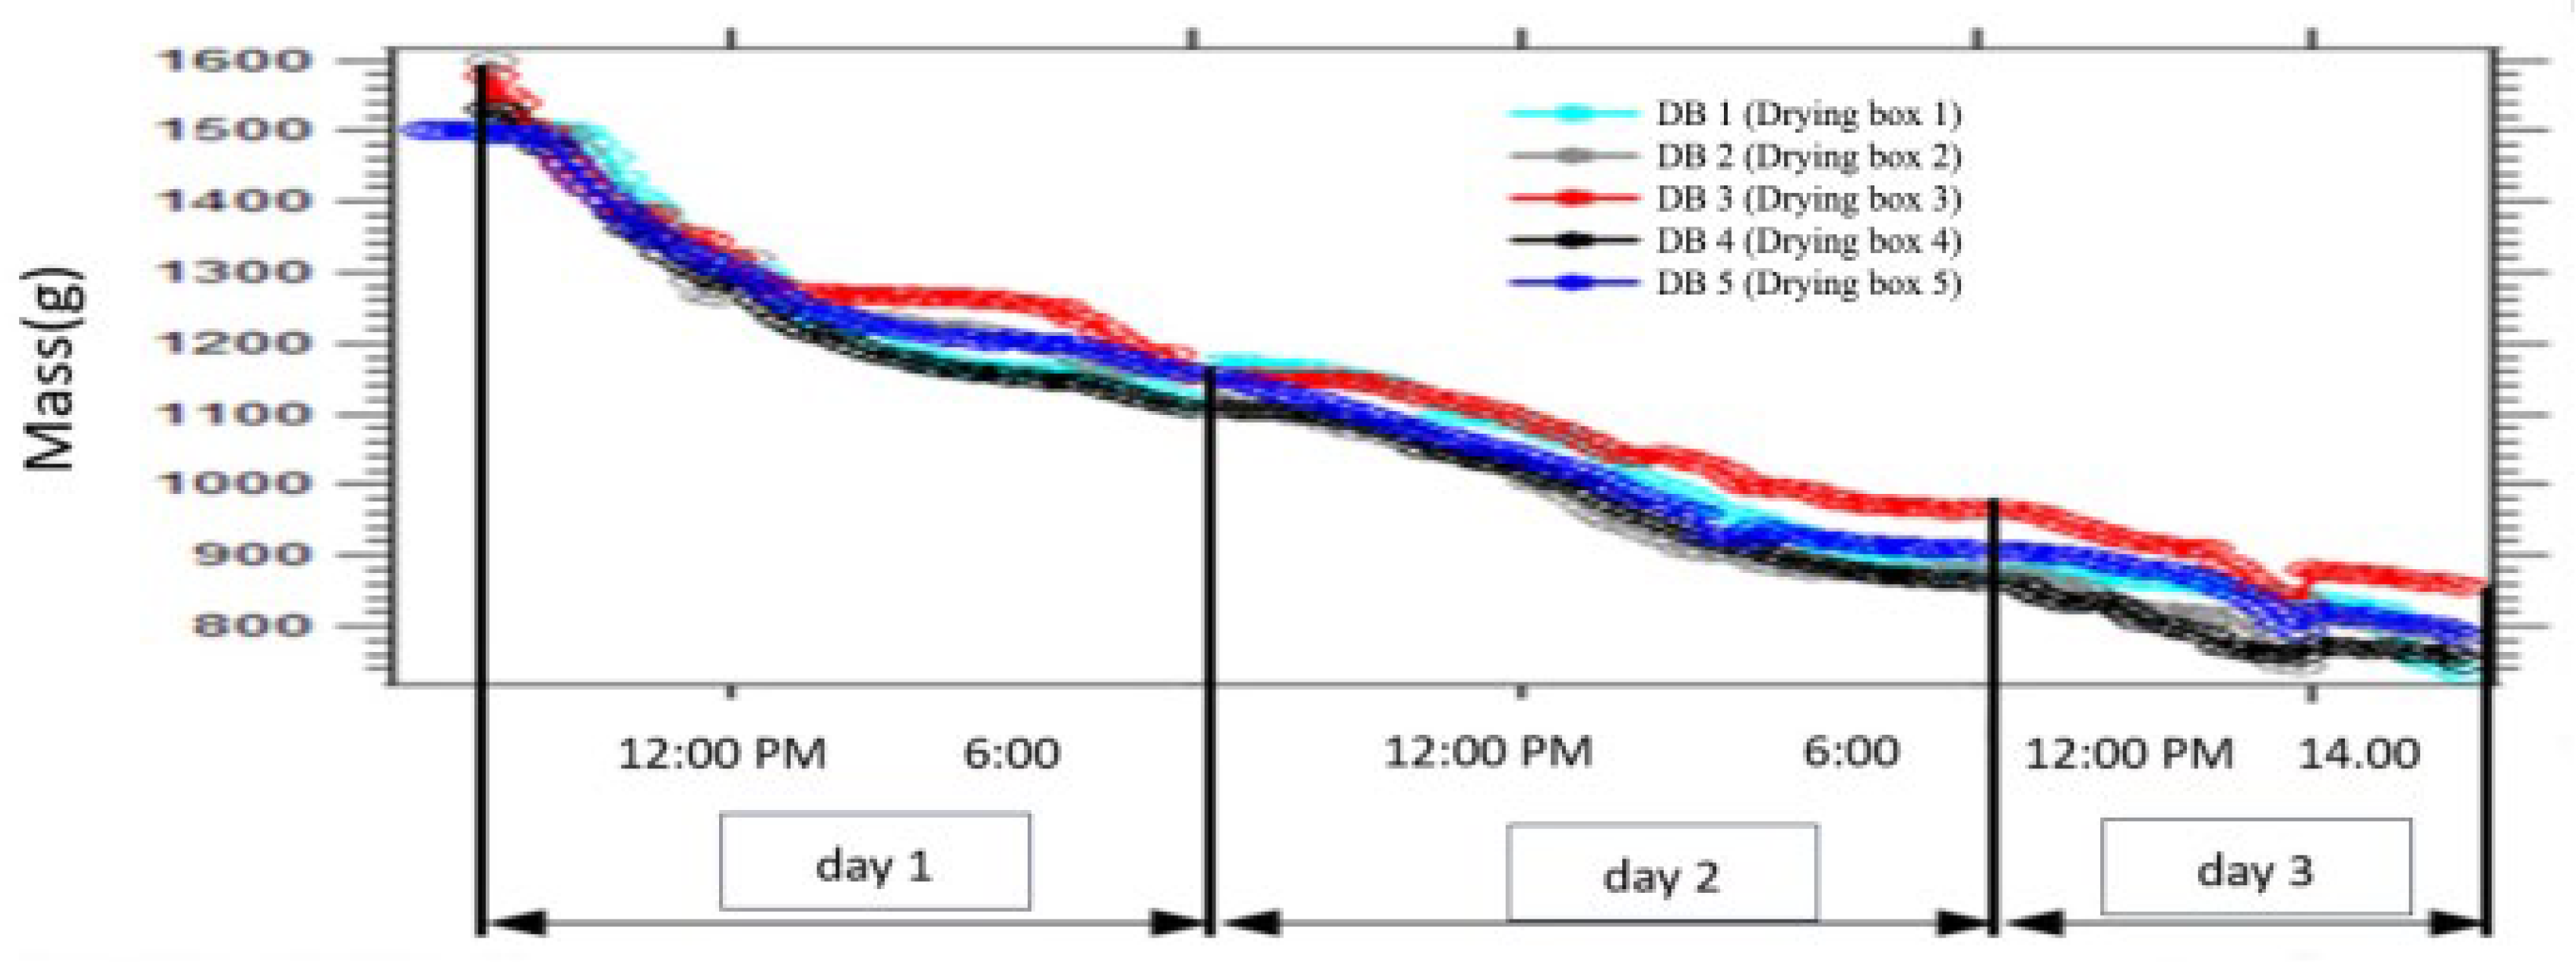
4.3. Coffee Drying Quality

4.3.1. Reduction in the Amount of Moisture

One of the qualities of coffee beans is the water content. A lower water content will prevent spoilage, so coffee beans that have little water will last longer. The mass of beans to be dried in each solar coffee dryer was 1500 g, and the mass decreased due to the drying process of water evaporating with temperature and air flow in the drying chamber. The decrease in coffee mass during experimental testing can be seen in Figure 9.
From Figure 9. coffee that has been dried using air at varying velocities on a solar coffee dryer will decrease in mass due to the evaporation of water content. On the first day, the final mass of coffee beans was 1109.08 and 1117.34 g in DB4 and DB1, respectively, and they were the solar dryers that dried the coffee mass faster. On the second day, the final mass was 863.12, 876.13, and 877.71 g in DB4, DB2, and DB1, respectively. On the third day, the final mass of coffee beans after drying was 732.24, 774.70, 855.10, 745.79, and 786.40 g in DB1, DB2, DB3, DB4, and DB5, respectively. The coffee mass was reduced by 51.18%, 48.35%, 42.96%, 50.28%, and 47.57%, respectively. Based on this research, DB1, with air velocity of 1 m/s, dried coffee beans faster than dryer boxes with higher air velocity. Varying the air velocity in solar coffee dryers can affect the process of drying coffee beans, even though the results obtained between air velocity and mass reduction are not linear, due to the drying process being a very complicated phenomenon. Every object being dried requires different temperature conditions and flow velocities to obtain effective drying results. The graph in Figure 8 appears flat or constant when there was a constant absence of solar radiation, specifically between 6:00 p.m. and 8:00 a.m.

4.3.2. Quality of Coffee Content

Finally, coffee beans that were dried for 3 days were tested for proximate content and quality at the Medan Industrial Standardization and Service Center. In particular, the water, protein, carbohydrate, and free fatty acid contents were measured. Water content is used to determine the quality of coffee, as water content can affect the preservation or degradation of coffee. A high water content will accelerate the process of decay. Protein and carbohydrates are components that have important roles in human growth, so higher protein and carbohydrate content is desirable. Free fatty acid is a component that can cause flatulence; thus, low content indicates better coffee quality. The test results of coffee bean content are given in Table 3.
From Table 3. based on the test data, compared to the other drying boxes, DB1 provided the best coffee content corresponding to the dry standard for coffee, with water content of 12.0%, protein content of 11.7%, carbohydrate content of 21.7%, and free fatty acid content of 0.05%. Based on these data, we can see that, in order to produce the best coffee content, special drying conditions are needed; specifically, an air velocity of 1.0 m/s.
The sample size used for drying in this research was on the laboratory scale; however, the quality testing followed the approximate test standards at the Medan Industry Standardization and Service Center.

5. Conclusions

In this research, we analyzed the effect of variations in air flow velocity in a solar collector dryer on coffee quality. We used air flow velocities of 1, 1.5, 2, 2.5, and 3 m/s in DB1, DB2, DB3, DB3, DB4, and DB5, respectively, in order to dry coffee samples with an initial mass of 1500 g in parallel and simultaneously. The radiation time required was 25 h, with maximum radiation of 586.9 w/m2 and total solar energy of 16.6 MJ/m2 over the 3 days of the experiment.
It was found that variations in air flow velocity affected the performance of the solar collector coffee dryer: the higher the air velocity flow, the better the performance of the solar dryer. This performance was influenced by the absorber plate temperature, drying chamber temperature, and solar dryer efficiency. DB5 had the highest collector efficiency of 44.8%, while DB1 had the lowest collector efficiency of 32.3%. This is because, with higher air velocity, more heat is transferred from the collector to be utilized to the drying chamber. Based on the experimental testing results, DB5 produced lower collector and drying chamber temperatures than DB1.
In addition, according to the results, the best coffee quality was found in DB1, characterized by a drying air velocity of 1.0 m/s and average drying room temperature of 41.8 °C. This level of air flow reduced the moisture content to the dry standard of 12.0%. The final coffee mass was 732.24 g, with protein, carbohydrate, and free fatty acid content of 11.7%, 21.7%, and 0.05%, respectively. Higher air velocities resulted in almost the same protein and carbohydrate content, as well as a fatty acid content of less than 0.1%, but a higher moisture content.

Author Contributions

Conceptualization, P.S. and F.H.N.; methodology, P.S. and H.A.; software, H.A. and H.S.S.; validation, Y.P.S.; formal analysis, H.V.S. and Y.P.S.; investigation, H.V.S. and Y.P.S.; resources, P.S.; data curation, H.S.S.; writing—original draft preparation, P.S.; writing—review and editing, P.S.; visualization, H.S.S.; supervision, F.H.N. and H.A.; project administration, H.S.S.; funding acquisition, H.V.S. and Y.P.S. All authors have read and agreed to the published version of the manuscript.

Funding

This research received no external funding.

Data Availability Statement

Data are contained within the article.

Conflicts of Interest

The authors declare no conflicts of interest.

References

  1. International Coffee Organization (ICO). Available online: https://icocoffee.org/ (accessed on 2 October 2023).
  2. Coffee Review. Available online: https://www.coffeereview.com/ (accessed on 2 October 2023).
  3. Badan Pusat Statistic Indonesia (BPS). Available online: https://www.bps.go.id/ (accessed on 3 October 2023).
  4. Menya, E.; Komakec, A.J. Investigating the effect of different loading densities on selected properties of dried coffee using a GHE dryer. Agric. Eng. Int. CIGR J. 2013, 15, 231–237. [Google Scholar]
  5. Essalhi, H.; Tadili, R.; Bargach, M.N. Conception of a Solar Air Collection for an Indirect Solar Dryer. Pear Dry. Test 2017, 141, 29–33. [Google Scholar]
  6. Ortiz-Rodríguez, N.; García-Valladares, O.; Pilatowsky-Figueroa, I.; Menchaca-Valdez, A. Solar-LP Gas Hybrid Plant for Dehydration of Food. Appl. Therm. Eng. 2020, 177, 115496. [Google Scholar] [CrossRef]
  7. Atalay, H. Assesment of energy and cost analysis of packed bed and phase change material thermal Energy storage system for the solar energy-sissted drying process. Sol. Energy 2020, 198, 124–138. [Google Scholar] [CrossRef]
  8. Ghaffari, A. Solar dryer performance simulation: Experimental and numerical study. J. Food Process Eng. 2021, 44, e13875. [Google Scholar]
  9. Siagian, P.; Setyawan, E.Y.; Gultom, T.; Napitupulu, F.H.; Ambarita, H. A field survey on coffee beans drying methods of Indonesian small holder farmers. In 1st Nommensen International Conference on Technology and Engineering IOP Publishing IOP Conference Series: Materials Science and Engineering; IOP Publishing: Bristol, UK, 2017; Volume 237, p. 012037. [Google Scholar] [CrossRef]
  10. Nukulwar, M.R.; Tungikar, V.B. Design and Development of Steam-Based Solar Dryer for Agricultural Products. Smart Innov. Syst. Technol. 2020, 174, 365–375. [Google Scholar]
  11. Cormio, C.; Dicorato, M.; Minoia, A.; Trovato, M. A regional energy planning methodology including renewable energy sources and environmental constraints. Renew. Sustain. Energy Rev. 2003, 7, 99–130. [Google Scholar] [CrossRef]
  12. Singh, P.; Pandey, B.K.; Gaur, M.K. Performance evaluation of evacuated solar collector assisted hybrid greenhouse solar dryer under active and passive mode. Mater. Today Proc. 2022, 57, 2002–2008. [Google Scholar] [CrossRef]
  13. Singh, S.; Gill, R.; Hans, V.; Mittal, T. Experimental performance and economic viability of evacuated tube solar collector assisted greenhouse dryer for sustainable development. Energy 2022, 241, 122794. [Google Scholar] [CrossRef]
  14. Lingayat, A.; Chandramohan, V.P. Numerical investigation on solar air collector and its practical application in the indirect solar dryer for banana chips drying with energy and exergy analysis. Therm. Sci. Eng. Prog. 2021, 26, 101077. [Google Scholar] [CrossRef]
  15. Gupta, A.; Biswas, A.; Das, B.; Reddy, B.V. Development and testing of novel photovoltaic-thermal collector-based solar dryer for green tea drying application. Sol. Energy 2022, 231, 1072–1091. [Google Scholar] [CrossRef]
  16. Pruengam, P.; Pathaveerat, S.; Pukdeewong, P. Fabrication and testing of double-sided solar collector dryer for drying banana. Case Stud. Therm. Eng. 2021, 27, 101335. [Google Scholar] [CrossRef]
  17. Murali, S.; Delfiya, D.S.A.; Alfiya, P.V.; Samuel, M.P.; Ninan, G. Development of sensible heat storage based solar hybrid dryer with evacuated tube collector and biomass gasifier for shrimp drying. Sol. Energy 2023, 262, 111836. [Google Scholar] [CrossRef]
  18. Salhi, M.; Chaatouf, D.; Raillani, B.; Bria, A.; Amraqui, S.; Mezrhab, A. Numerical investigation of an indirect solar dryer equipped with two solar air collectors using computational fluid dynamics. J. Stored Prod. Res. 2023, 104, 102189. [Google Scholar] [CrossRef]
  19. Rani, P.; Tripathy, P.P. CFD coupled heat and mass transfer simulation of pineapple drying process using mixed-mode solar dryers integrated with flat plate and finned collector. Renew. Energy 2023, 217, 119210. [Google Scholar] [CrossRef]
  20. Ekka, J.P.; Muthukumar, P.; Bala, K.; Kanaujiya, D.K.; Pakshirajan, K. Performance studies on mixed-mode forced convection solar cabinet dryer under different air mass flow rates for drying of cluster fig. Sol. Energy 2021, 229, 39–51. [Google Scholar] [CrossRef]
  21. Tagnamas, Z.; Lamsyehe, H.; Moussaoui, H.; Bahammou, Y.; Kouhila, M.; Idlimam, A.; Lamharrar, A. Energy and exergy analyses of carob pulp drying system based on a solar collector. Renew. Energy 2021, 163, 495–503. [Google Scholar] [CrossRef]
  22. Rani, P.; Tripathy, P.P. Drying characteristics, energetic and exergetic investigation during mixed-mode solar drying of pineapple slices at varied air mass flow rates. Renew. Energy 2021, 167, 508–519. [Google Scholar] [CrossRef]
  23. Hassan, A.; Nikbahkt, A.M.; Welsh, Z.; Yarlagadda, P.; Fawzia, S.; Karim, A. Experimental and thermodynamic analysis of solar air dryer equipped with V-groove double pass collector: Techno-economic and exergetic measures. Energy Convers. Manag. X 2022, 16, 100296. [Google Scholar] [CrossRef]
  24. César, L.V.; Lilia, C.M.; Octavio, G.V.; Isaac, P.F.; Rogelio, B.O. Thermal performance of a passive, mixed-type solar dryer for tomato slices (Solanum lycopersicum). Renew. Energy 2019, 147, 845–855. [Google Scholar] [CrossRef]
Figure 1. Component arrangement of solar coffee dryer equipment.
Fluids 09 00075 g001
Figure 2. Coffee dryer with forced convection.
Fluids 09 00075 g002
Figure 3. Setup of experimental solar collector.
Fluids 09 00075 g003
Figure 4. Measured solar radiation: (a) 9 October 2023, (b) 10 October 2023, (c) 11 October 2023.
Fluids 09 00075 g004
Figure 5. Solar radiation and ambient temperature: (a) 9 October 2023, (b) 10 October 2023, (c) 11 October 2023.
Fluids 09 00075 g005
Figure 6. Absorbent plate temperature: (a) first day, (b) second day, (c) third day.
Fluids 09 00075 g006aFluids 09 00075 g006b
Figure 7. Temperature chamber: (a) day 1, (b) day 2, (c) day 3.
Fluids 09 00075 g007
Figure 8. Total heat loss in a solar coffee dryer.
Fluids 09 00075 g008
Figure 9. Decrease in coffee bean mass during experiment.
Fluids 09 00075 g009
Table 1. Total solar irradiation per day during drying process.
No.TimeTotal Solar Irradiation (MJ/m2)
1Day 16.5
2Day 25.9
3Day 34.2
Table 2. Average collector efficiency.
NoDryerCollector Efficiency
1Dryer box 132.3%
2Dryer box 238.1%
3Dryer box 333.7%
4Dryer box 435.5%
5Dryer box 544.8%
Table 3. Test results of proximate content of Arabica coffee beans.
CompositionSample and Proximate Test
DB1DB2DB3DB4DB5
Water (%)12.013.618.512.915.2
Protein (%)11.712.211.511.611.3
Carbohydrate (%)21.722.819.918.120.4
Free fatty acid (%)0.050.050.090.090.08
Disclaimer/Publisher’s Note: The statements, opinions and data contained in all publications are solely those of the individual author(s) and contributor(s) and not of MDPI and/or the editor(s). MDPI and/or the editor(s) disclaim responsibility for any injury to people or property resulting from any ideas, methods, instructions or products referred to in the content.

