
Sadness and Loneliness in Adolescents with Physical, Sensory or Health Problems in Low/Middle-Income Countries
 , , and
Abstract
:1. Introduction
2. Materials and Methods
2.1. Design and Data
2.2. Procedure and Variants
2.3. Participants
2.4. Statistical Analysis
3. Results
4. Discussion
5. Conclusions
Supplementary Materials
Author Contributions
Funding
Institutional Review Board Statement
Informed Consent Statement
Data Availability Statement
Acknowledgments
Conflicts of Interest
References
- Pengpid, S.; Peltzer, K. Prevalence and Associated Factors of Loneliness among National Samples of In-School Adolescents in Four Caribbean Countries. Psychol. Rep. 2021, 124, 2669–2683. [Google Scholar] [CrossRef] [PubMed]
- Hards, E.; Loades, M.E.; Higson-Sweeney, N.; Shafran, R.; Serafimova, T.; Brigden, A.; Reynolds, S.; Crawley, E.; Chatburn, E.; Linney, C.; et al. Loneliness and Mental Health in Children and Adolescents with Pre-existing Mental Health Problems: A Rapid Systematic Review. Br. J. Clin. Psychol. 2022, 61, 313–334. [Google Scholar] [CrossRef] [PubMed]
- Zhao, B.; Kong, F.; Nam, E.W. Assessing Knowledge, Preventive Practices, and Depression among Chinese University Students in Korea and China during the COVID-19 Pandemic: An Online Cross-Sectional Study. Healthcare 2021, 9, 433. [Google Scholar] [CrossRef] [PubMed]
- Goodfellow, C.; Hardoon, D.; Inchley, J.; Leyland, A.H.; Qualter, P.; Simpson, S.A.; Long, E. Loneliness and Personal Well-being in Young People: Moderating Effects of Individual, Interpersonal, and Community Factors. J. Adolesc. 2022, 94, 554–568. [Google Scholar] [CrossRef]
- Assari, S. Family Socioeconomic Status and Exposure to Childhood Trauma: Racial Differences. Children 2020, 7, 57. [Google Scholar] [CrossRef]
- Ferreira, C.; Lima, C.; Freitas, B.H.B.M.d.; Gaíva, M.A.M.; Diogo, P.M.J.; Bortolini, J. Emotional and Behavioral Problems in Adolescents in the Context of COVID-19: A Mixed Method Study. Rev. Lat. Am. Enferm. 2022, 30, e3744. [Google Scholar] [CrossRef]
- Mauriño, M.Á.; Eymann, A.; Santarsieri, N.; Vainman, S.; Krauss, M.; Catsicaris, C.; Mullia, V. Adolescent Behaviors during the Preventive and Mandatory Social Isolation in Argentina in 2020. Arch. Argent. Pediatr. 2022, 120, 39–45. [Google Scholar] [CrossRef]
- Sawyer, I.; Fardghassemi, S.; Joffe, H. How the Home Features in Young Adults’ Representations of Loneliness: The Impact of COVID-19. Br. J. Soc. Psychol. 2022, 61, 1351–1375. [Google Scholar] [CrossRef]
- Windarwati, H.D.; Lestari, R.; Supianto, A.A.; Wicaksono, S.A.; Ati, N.A.L.; Kusumawati, M.W.; Humayya, A.; Ekawati, D. A Narrative Review into the Impact of COVID-19 Pandemic on Senior High School Adolescent Mental Health. J. Child Adolesc. Psychiatr. Nurs. 2022, 35, 206–217. [Google Scholar] [CrossRef]
- Maftei, A.; Merlici, I.-A.; Roca, I.-C. Implications of the COVID-19 Pandemic on Children and Adolescents: Cognitive and Emotional Representations. Children 2022, 9, 359. [Google Scholar] [CrossRef]
- Śniadach, J.; Szymkowiak, S.; Osip, P.; Waszkiewicz, N. Increased Depression and Anxiety Disorders during the COVID-19 Pandemic in Children and Adolescents: A Literature Review. Life 2021, 11, 1188. [Google Scholar] [CrossRef]
- Chaabane, S.; Doraiswamy, S.; Chaabna, K.; Mamtani, R.; Cheema, S. The Impact of COVID-19 School Closure on Child and Adolescent Health: A Rapid Systematic Review. Children 2021, 8, 415. [Google Scholar] [CrossRef]
- De Castro, F.; Cappa, C.; Madans, J. Anxiety and Depression Signs Among Adolescents in 26 Low- and Middle-Income Countries: Prevalence and Association With Functional Difficulties. J. Adolesc. Health 2023, 72, S79–S87. [Google Scholar] [CrossRef] [PubMed]
- Rokach, A.; Lechcier-Kimel, R.; Safarov, A. Loneliness of People with Physical Disabilities. Soc. Behav. Personal. Int. J. 2006, 34, 681–700. [Google Scholar] [CrossRef]
- Kwan, C.; Gitimoghaddam, M.; Collet, J.-P. Effects of Social Isolation and Loneliness in Children with Neurodevelopmental Disabilities: A Scoping Review. Brain Sci. 2020, 10, 786. [Google Scholar] [CrossRef] [PubMed]
- Nyirahabimana, M.L.; Tuyishimire, B.; Niyonsenga, J.; Ntete, J.M.; Mukarusanga, I.; Mutabaruka, J. Emotions and Feelings as Predictors of Depression and Attention Deficit Hyperactivity Disorders among Children and Adolescents with Complete Blindness. Rwanda J. Med. Health Sci. 2022, 5, 340–349. [Google Scholar] [CrossRef]
- Sorokowska, A.; Janczak, A.; Ferdenzi, C.; Baldovini, N.; Oleszkiewicz, A. Blindness, But not HMHA Anosmia, Predicts Loneliness: A Psychophysical Study. Pers. Soc. Psychol. Bull. 2022, 48, 1167–1176. [Google Scholar] [CrossRef]
- Helin, M.; Karukivi, M.; Haataja, L.; Rautava, P.; Junttila, N.; Salomäki, S.; Lehtonen, L.; Setänen, S. Motor Performance in Association with Perceived Loneliness and Social Competence in 11-Year-Old Children Born Very Preterm. Children 2022, 9, 660. [Google Scholar] [CrossRef] [PubMed]
- Youssef, N.N.; Atienza, K.; Langseder, A.L.; Strauss, R.S. Chronic Abdominal Pain and Depressive Symptoms: Analysis of the National Longitudinal Study of Adolescent Health. Clin. Gastroenterol. Hepatol. 2008, 6, 329–332. [Google Scholar] [CrossRef]
- Mullarkey, M.C.; Marchetti, I.; Beevers, C.G. Using Network Analysis to Identify Central Symptoms of Adolescent Depression. J. Clin. Child Adolesc. Psychol. 2019, 48, 656–668. [Google Scholar] [CrossRef]
- Gijzen, M.W.M.; Rasing, S.P.A.; Creemers, D.H.M.; Smit, F.; Engels, R.C.M.E.; De Beurs, D. Suicide Ideation as a Symptom of Adolescent Depression. a Network Analysis. J. Affect. Disord. 2021, 278, 68–77. [Google Scholar] [CrossRef] [PubMed]
- Pritchett, L.; Viarengo, M. The Learning Crisis of Developing Country Elites: Lessons from PISA-D. World Bank Econ. Rev. 2023, 37, 177–204. [Google Scholar] [CrossRef]
- OECD PISA-D Por Development. Available online: https://www.oecd.org/pisa/aboutpisa/PISA-D_brochure_2016_ENG.pdf (accessed on 3 May 2023).
- OECD Sampling.Pdf. In PISA-D Technical Report. 2016. Available online: https://www.oecd.org/pisa/data/pisa2018technicalreport/ (accessed on 1 June 2022).
- Scherer, N.; Bright, T.; Musendo, D.J.; O’Fallon, T.; Kubwimana, C.; Eaton, J.; Kakuma, R.; Smythe, T.; Polack, S. Mental Health Support for Children and Adolescents with Hearing Loss: Scoping Review. BJPsych Open 2021, 8, e9. [Google Scholar] [CrossRef]
- Van Eldik, T. Mental Health Problems of Dutch Youth With Hearing Loss as Shown on the Youth Self Report. Am. Ann. Deaf. 2005, 150, 11–16. [Google Scholar] [CrossRef]
- Das, R.R.; Sankar, M.J.; Agarwal, R. Bed Sharing versus no Bed Sharing for Healthy Term Neonates. Cochrane Database Syst. Rev. 2017, 2017, CD012866. [Google Scholar] [CrossRef]
- Marschark, M.; Lang, H.G.; Albertini, J.A. Educating Deaf Students: From Research to Practice; Oxford University Press: Oxford, UK, 2001; ISBN 978-0-19-802835-2. [Google Scholar]
- Marschark, M.; Clark, M.D. Perspectivas Psicológicas Sobre La Sordera: Volumen II. Available online: https://eprints.ucm.es/id/eprint/38881/1/T37682.pdf (accessed on 1 June 2022).
- Zachrisson, H.D.; Rödje, K.; Mykletun, A. Utilization of Health Services in Relation to Mental Health Problems in Adolescents: A Population Based Survey. BMC Public Health 2006, 6, 34. [Google Scholar] [CrossRef]
- Casas, D.; Linares, M.; Lemos, M.; Restrepo, D. Depresión y Ansiedad En Personas Con Deficiencia Auditiva: Revisión de Literatura. Rev. Virtual Univ. Catol. Norte 2009, 28, 1–15. [Google Scholar]
- Cambra, C. Feelings and Emotions in Deaf Adolescents. Deaf. Educ. Int. 2005, 7, 195–205. [Google Scholar] [CrossRef]
- Leigh, I.W.; Maxwell-McCaw, D.; Bat-Chava, Y.; Christiansen, J.B. Correlates of Psychosocial Adjustment in Deaf Adolescents With and Without Cochlear Implants: A Preliminary Investigation. J. Deaf Stud. Deaf Educ. 2008, 14, 244–259. [Google Scholar] [CrossRef]
- Peral, M.V.; Atutxa, G.Y. Personas con discapacidad y soledad. Educ. Soc. Rev. Interv. Socioeducativa 2022, 80, 97–116. [Google Scholar] [CrossRef]
- Dabbagh Rollán, V.O. Un acercamiento a la soledad no deseada en las personas con discapacidad visual. RED Vis. Rev. Espec. En Discapac. Vis. 2022, 79, 9–54. [Google Scholar] [CrossRef]
- Gürcan, M.; Atay Turan, S. The Experiences of Adolescents Receiving Cancer Treatment in Turkey: A Qualitative Study. Eur. J. Cancer Care 2020, 29, e13239. [Google Scholar] [CrossRef] [PubMed]
- Los Adolescentes Con Discapacidades Son 5 Veces Más Propensos a Sufrir Trastornos Mentales, Emocionales y de Salud Conductual, Dicen Investigadores–Chicago Tribune. Available online: https://www.chicagotribune.com/espanol/sns-es-adolescentes-discapacitados-mas-propensos-sufrir-trastornos-mentales-20220106-llk5dlis6jaexcrl5sp2yqlnfu-story.html (accessed on 2 May 2023).
- González, S.; Tello, J.; Silva, P.; Lüders, C.; Butelmann, S.; Fristch, R.; Solar, F.; Rigo-Righi, C.; David, P. Calidad de Vida En Pacientes Con Discapacidad Motora Según Factores Sociodemográficos y Salud Mental. Rev. Chil. Neuro-Psiquiatr. 2012, 50, 23–34. [Google Scholar] [CrossRef]
- Barbero, M.I.; García, E.; Holgado, F.; Vila, E. Psicometría; Editorial UNED: Madrid, Spain, 2015. [Google Scholar]
- Knoke, J.; Burau, J.; Roehrle, B. Attachment Styles, Loneliness, Quality, and Stability of Marital Relationships. J. Divorce Remarriage 2010, 51, 310–325. [Google Scholar] [CrossRef]
- DiTommaso, E.; Brannen-McNulty, C.; Ross, L.; Burgess, M. Attachment Styles, Social Skills and Loneliness in Young Adults. Personal. Individ. Differ. 2003, 35, 303–312. [Google Scholar] [CrossRef]


| Overall = 34,604 | Men = 16,796 | Women = 17,808 | ||||
|---|---|---|---|---|---|---|
| Variables | Median | IQR | Median | IQR | Median | IQR |
| Age (Years) | 15.8 | (0.5) | 15.8 | (0.5) | 15.8 | (0.5) |
| Country | n | % | n | % | n | % |
| Cambodia | 5162 | 14.9 | 2434 | 47.2 | 2728 | 52.8 |
| Ecuador | 5664 | 16.4 | 2887 | 51.0 | 2777 | 49.0 |
| Guatemala | 5100 | 14.7 | 2641 | 51.8 | 2459 | 48.2 |
| Honduras | 4773 | 13.8 | 2216 | 46.4 | 2557 | 53.6 |
| Paraguay | 4510 | 13.0 | 2219 | 49.2 | 2291 | 50.8 |
| Senegal | 5182 | 15.0 | 2385 | 46.0 | 2797 | 54.0 |
| Zambia | 4213 | 12.2 | 2014 | 47.8 | 2199 | 52.2 |
| Rural/Urban | ||||||
| Urban | 21,659 | 62.6 | 10,321 | 47.7 | 11,338 | 52.3 |
| Rural | 12,945 | 37.4 | 6475 | 50.0 | 6470 | 50.0 |
| Students with Difficulties and/or Disabilities | ||||
|---|---|---|---|---|
| No | Yes | |||
| Variables | OR | CI 95% | ||
| Dissatisfied in life | Ref. | 2.63 * | 2.43 | 2.85 |
| More fun than me | Ref. | 1.95 * | 1.84 | 2.07 |
| Loneliness | Ref. | 2.20 * | 2.07 | 2.34 |
| Sadness | Ref. | 2.36 * | 2.22 | 2.51 |
| Crying | Ref. | 2.88* | 2.66 | 3.11 |
| Sight problems | ||||
| Dissatisfied in life | Ref. | 1.38 * | 1.25 | 1.52 |
| More fun than me | Ref. | 1.53 * | 1.42 | 1.65 |
| Loneliness | Ref. | 1.72 * | 1.60 | 1.85 |
| Sadness | Ref. | 1.79 * | 1.66 | 1.93 |
| Crying | Ref. | 2.07 * | 1.90 | 2.27 |
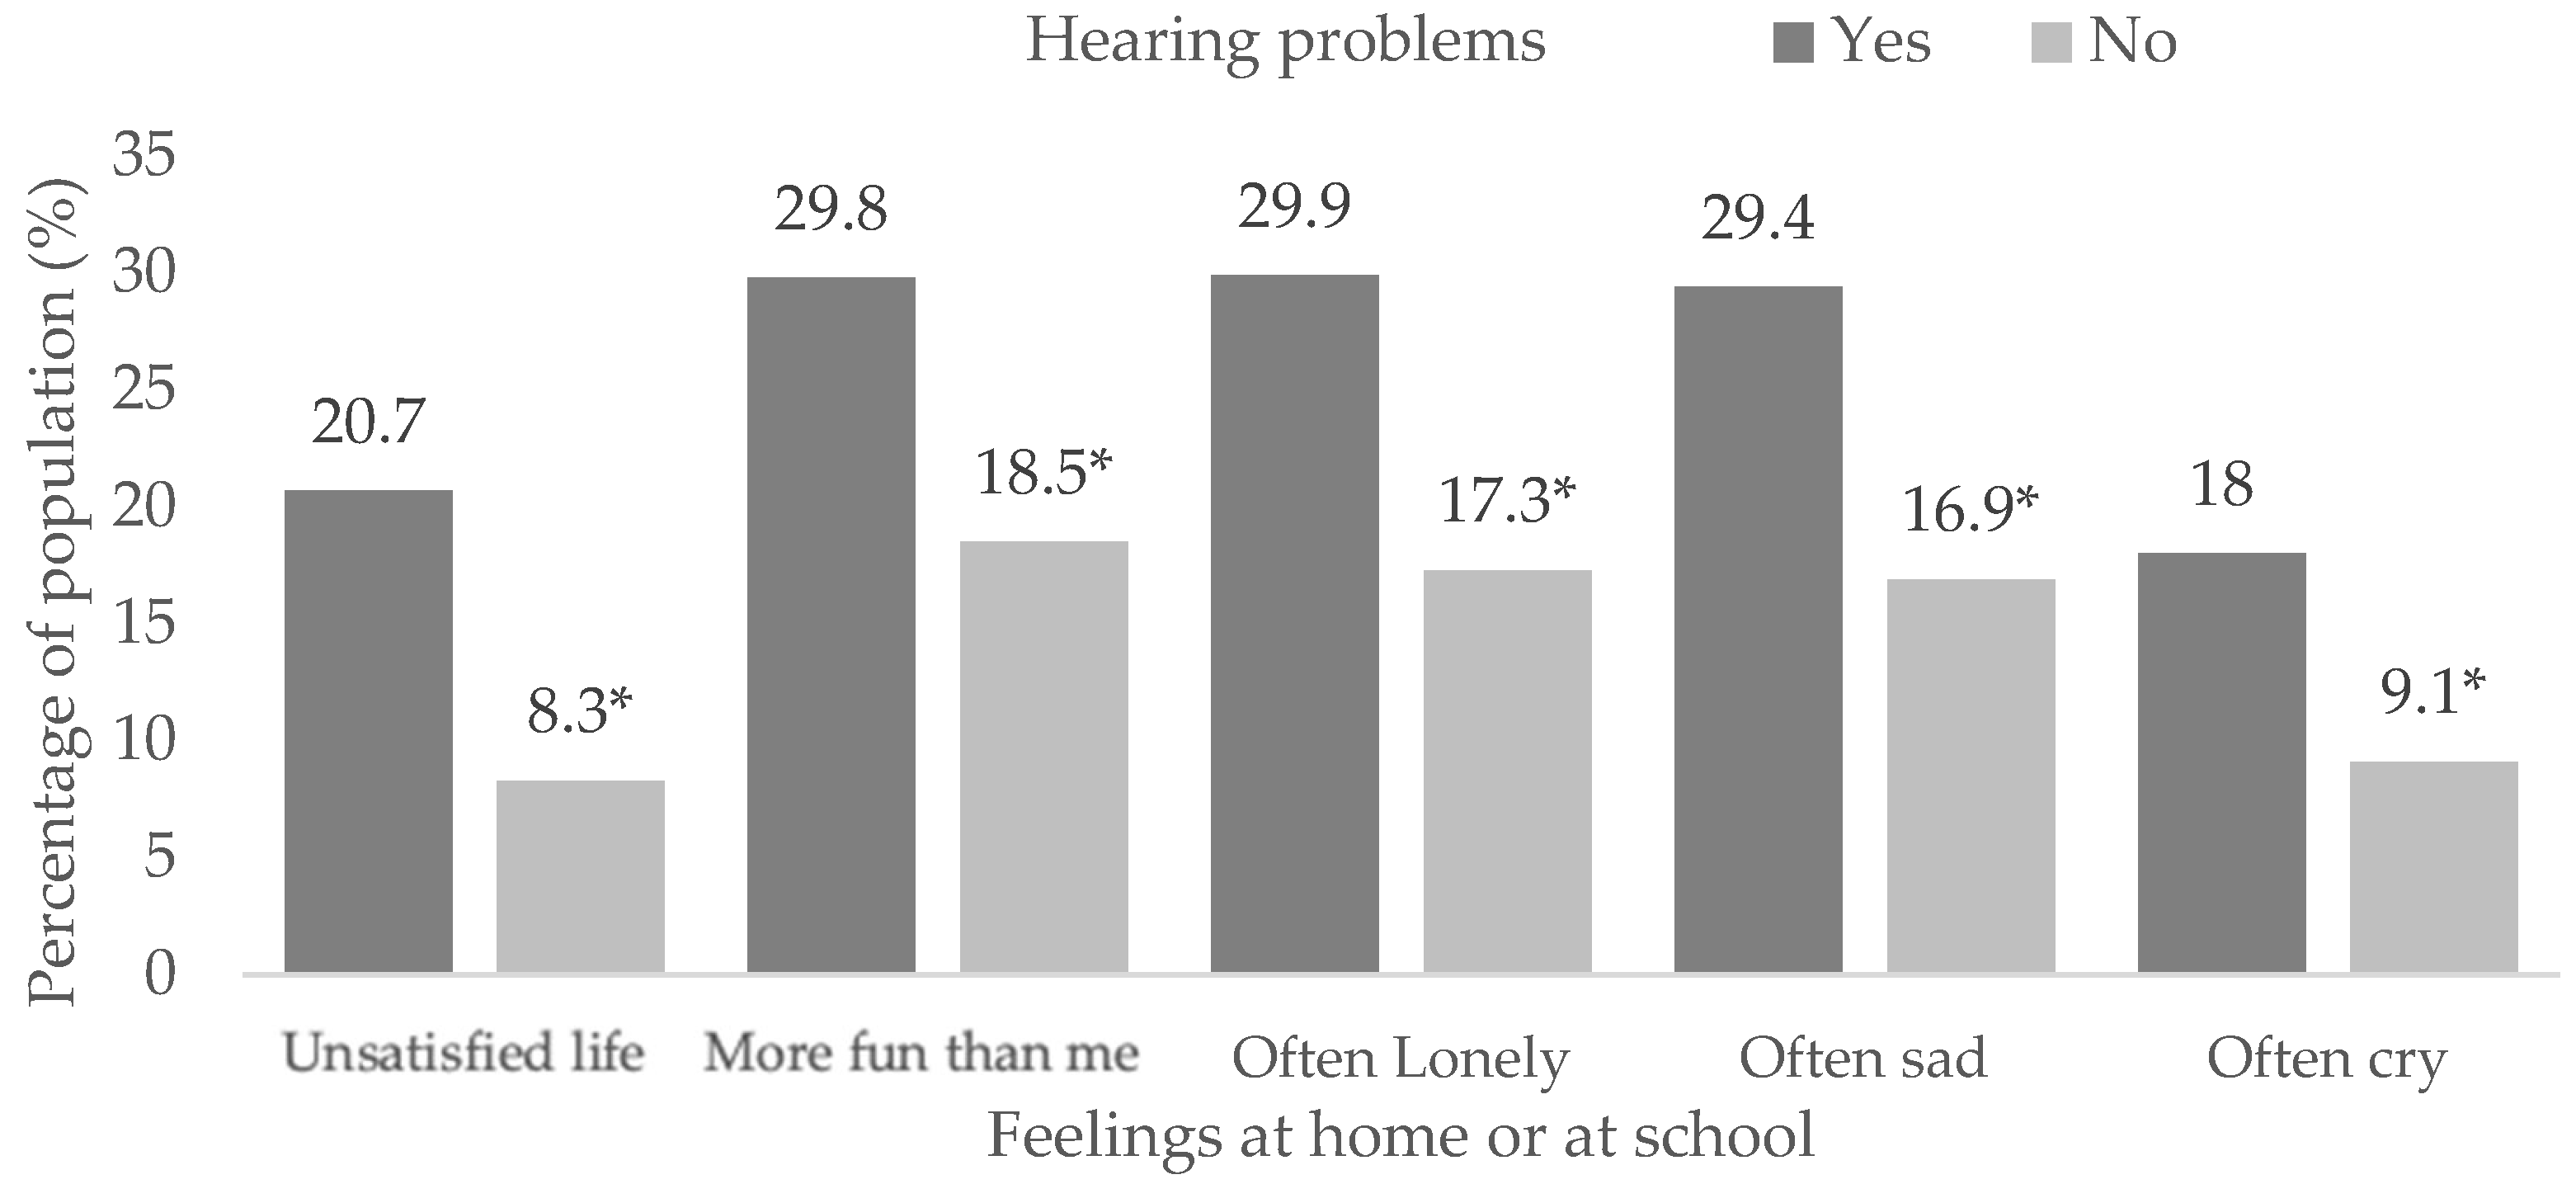
| Hearing issues | ||||
| Dissatisfied in life | Ref. | 3.37 * | 2.94 | 3.86 |
| More fun than me | Ref. | 1.97 * | 1.74 | 2.22 |
| Loneliness | Ref. | 2.26 * | 2.00 | 2.55 |
| Sadness | Ref. | 2.28 * | 2.01 | 2.58 |
| Crying | Ref. | 2.42 * | 2.10 | 2.78 |
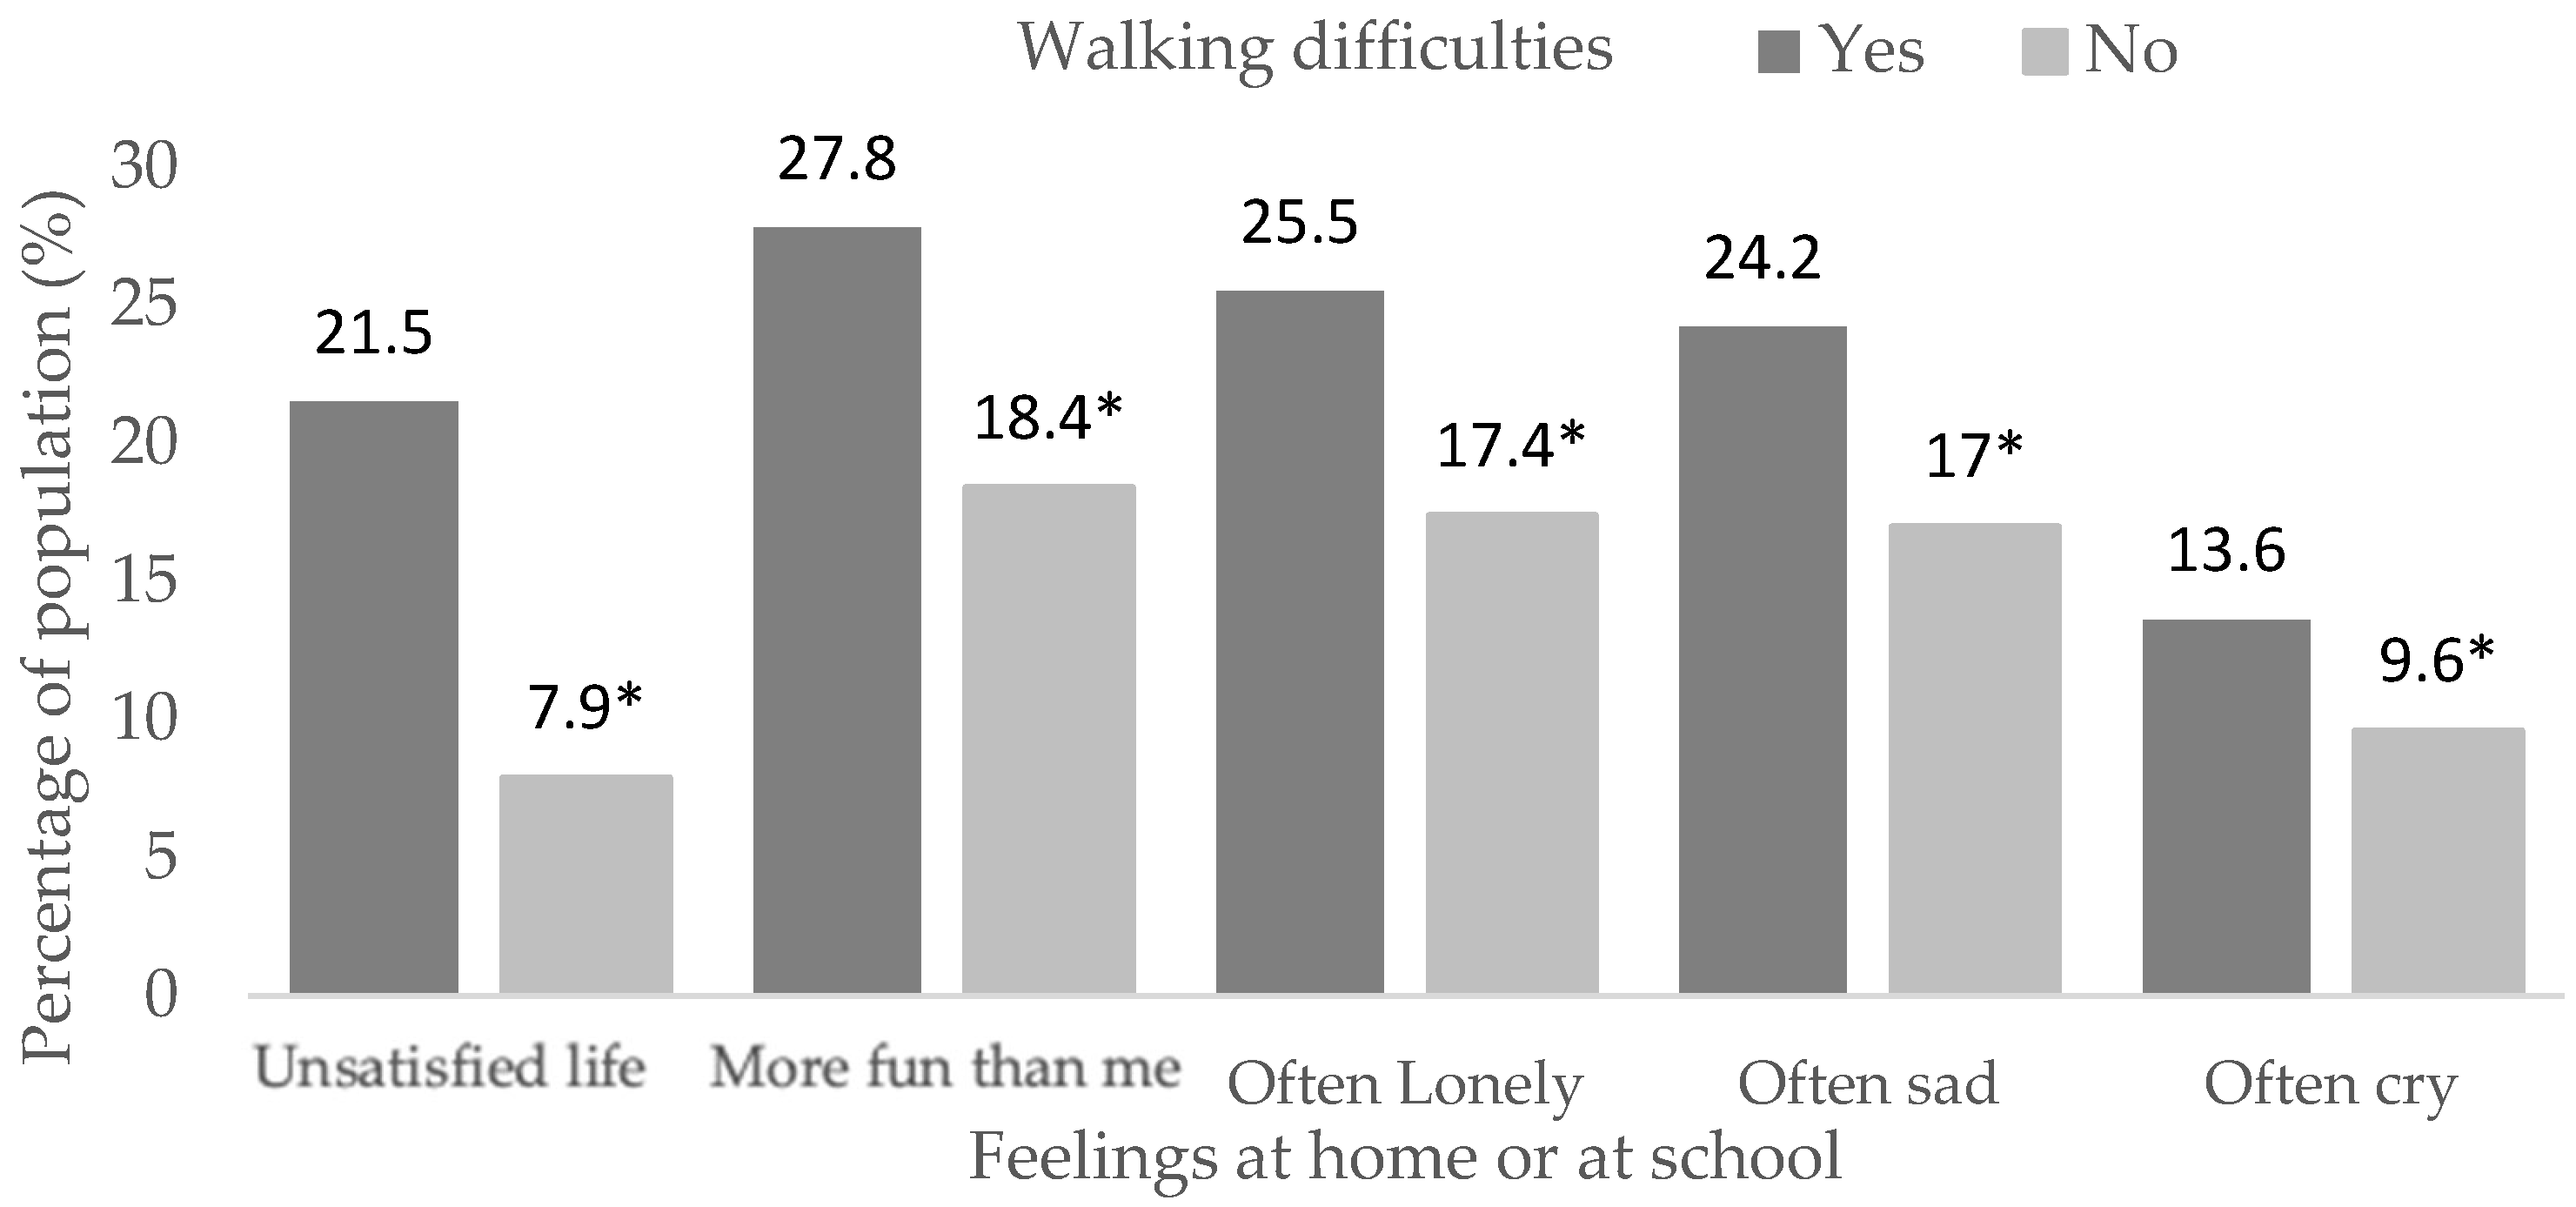
| Walking problems | ||||
| Dissatisfied in life | Ref. | 3.49 * | 3.11 | 3.92 |
| More fun than me | Ref. | 1.76 * | 1.58 | 1.95 |
| Loneliness | Ref. | 1.72 * | 1.55 | 1.92 |
| Sadness | Ref. | 1.68 * | 1.50 | 1.88 |
| Crying | Ref. | 2.33 * | 2.06 | 2.63 |
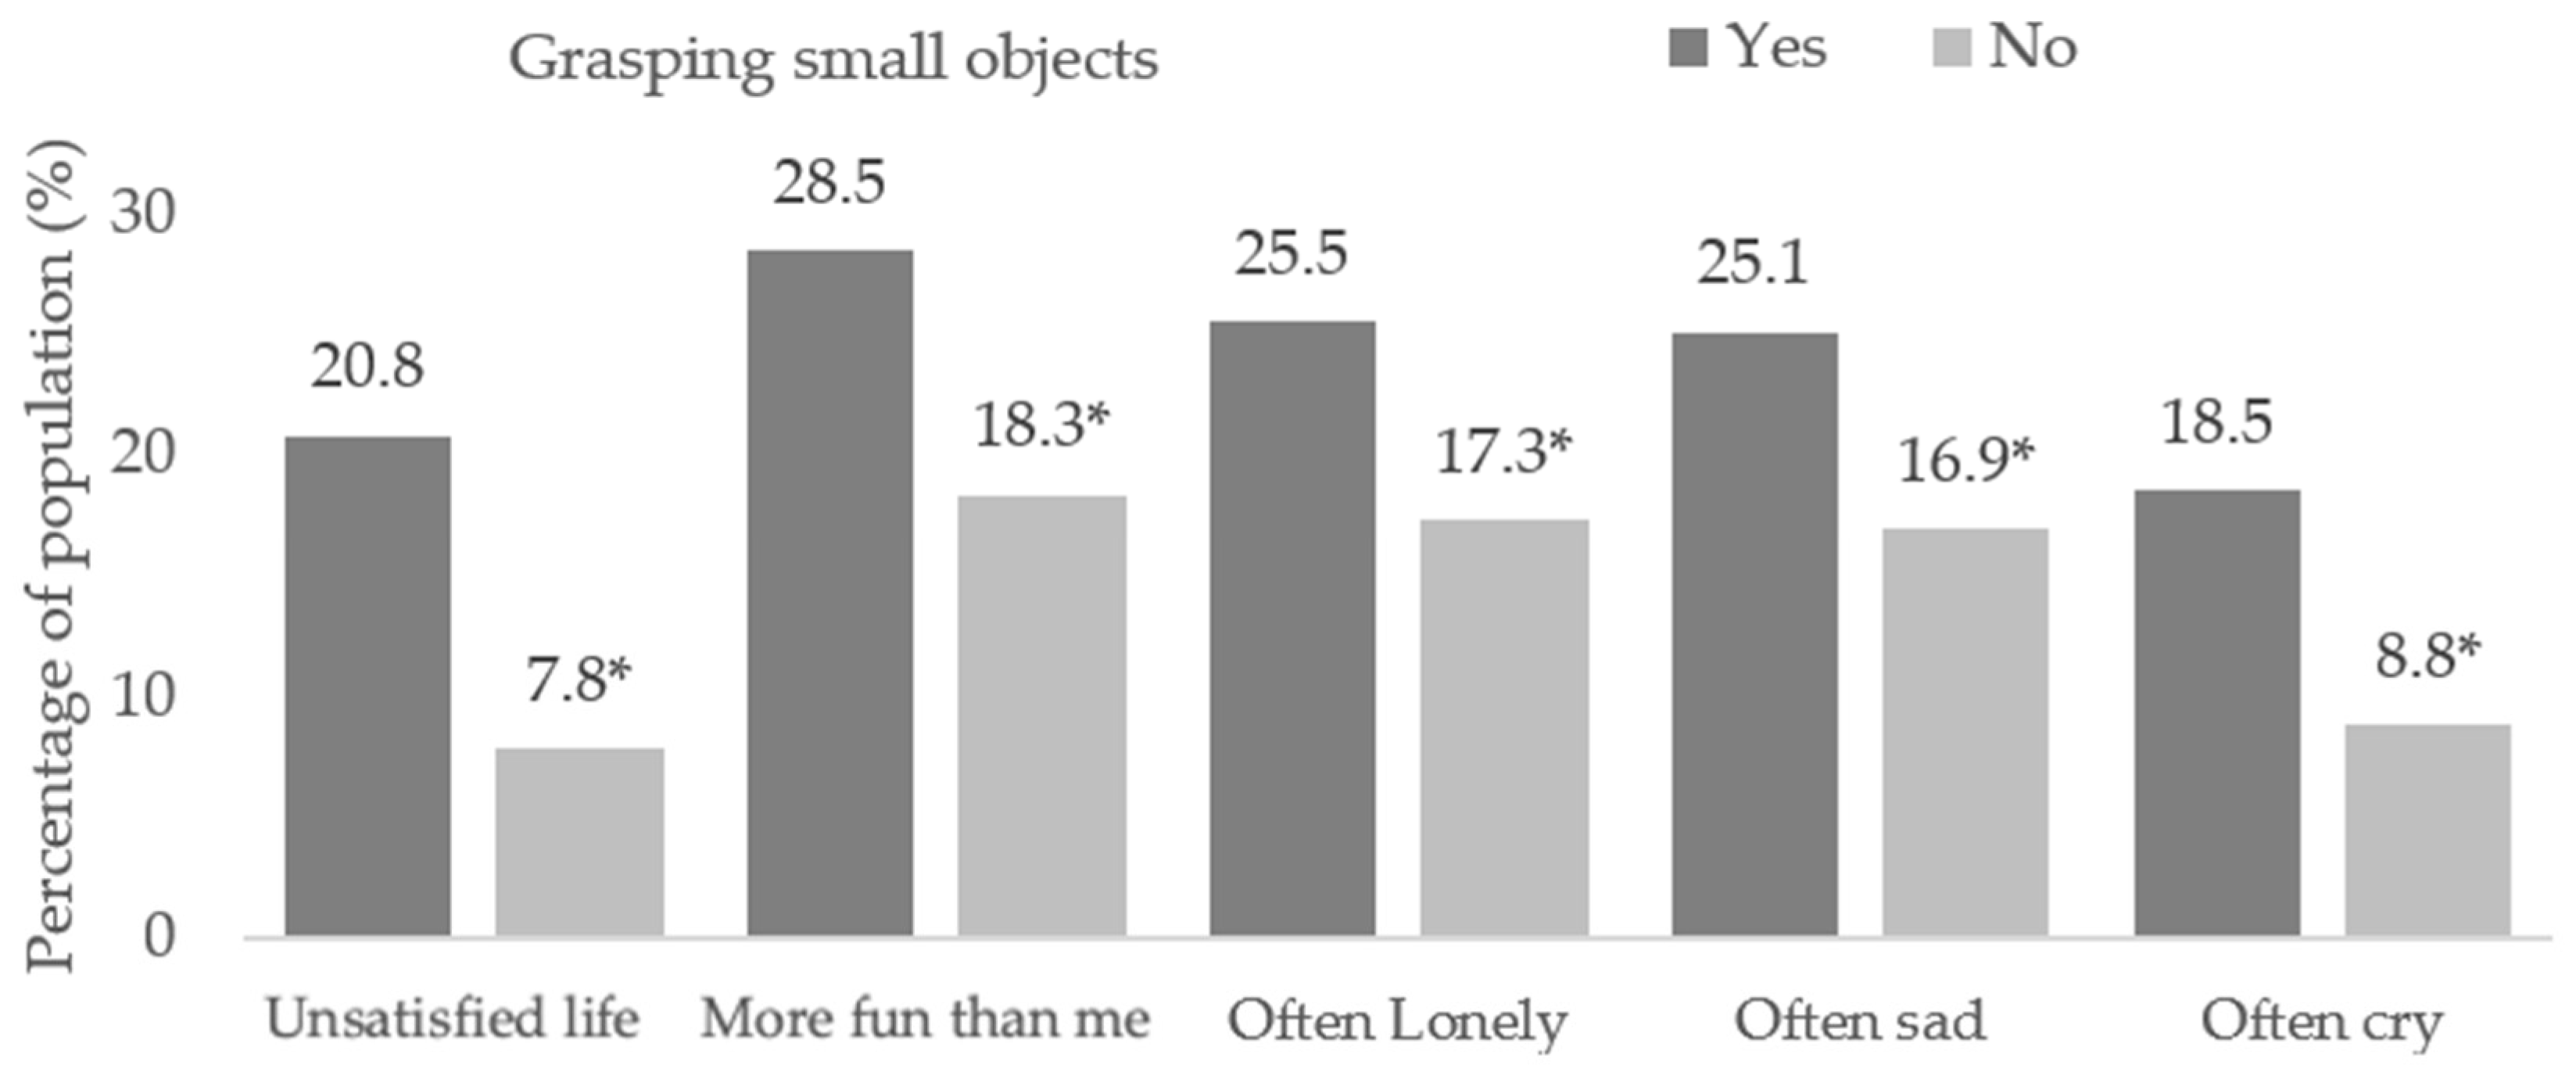
| Grasping small objects problems | ||||
| Dissatisfied in life | Ref. | 3.28 * | 2.93 | 3.68 |
| More fun than me | Ref. | 1.81 * | 1.63 | 2.01 |
| Loneliness | Ref. | 1.77 * | 1.59 | 1.97 |
| Sadness | Ref. | 1.77 * | 1.59 | 1.97 |
| Crying | Ref. | 2.55 * | 2.27 | 2.86 |
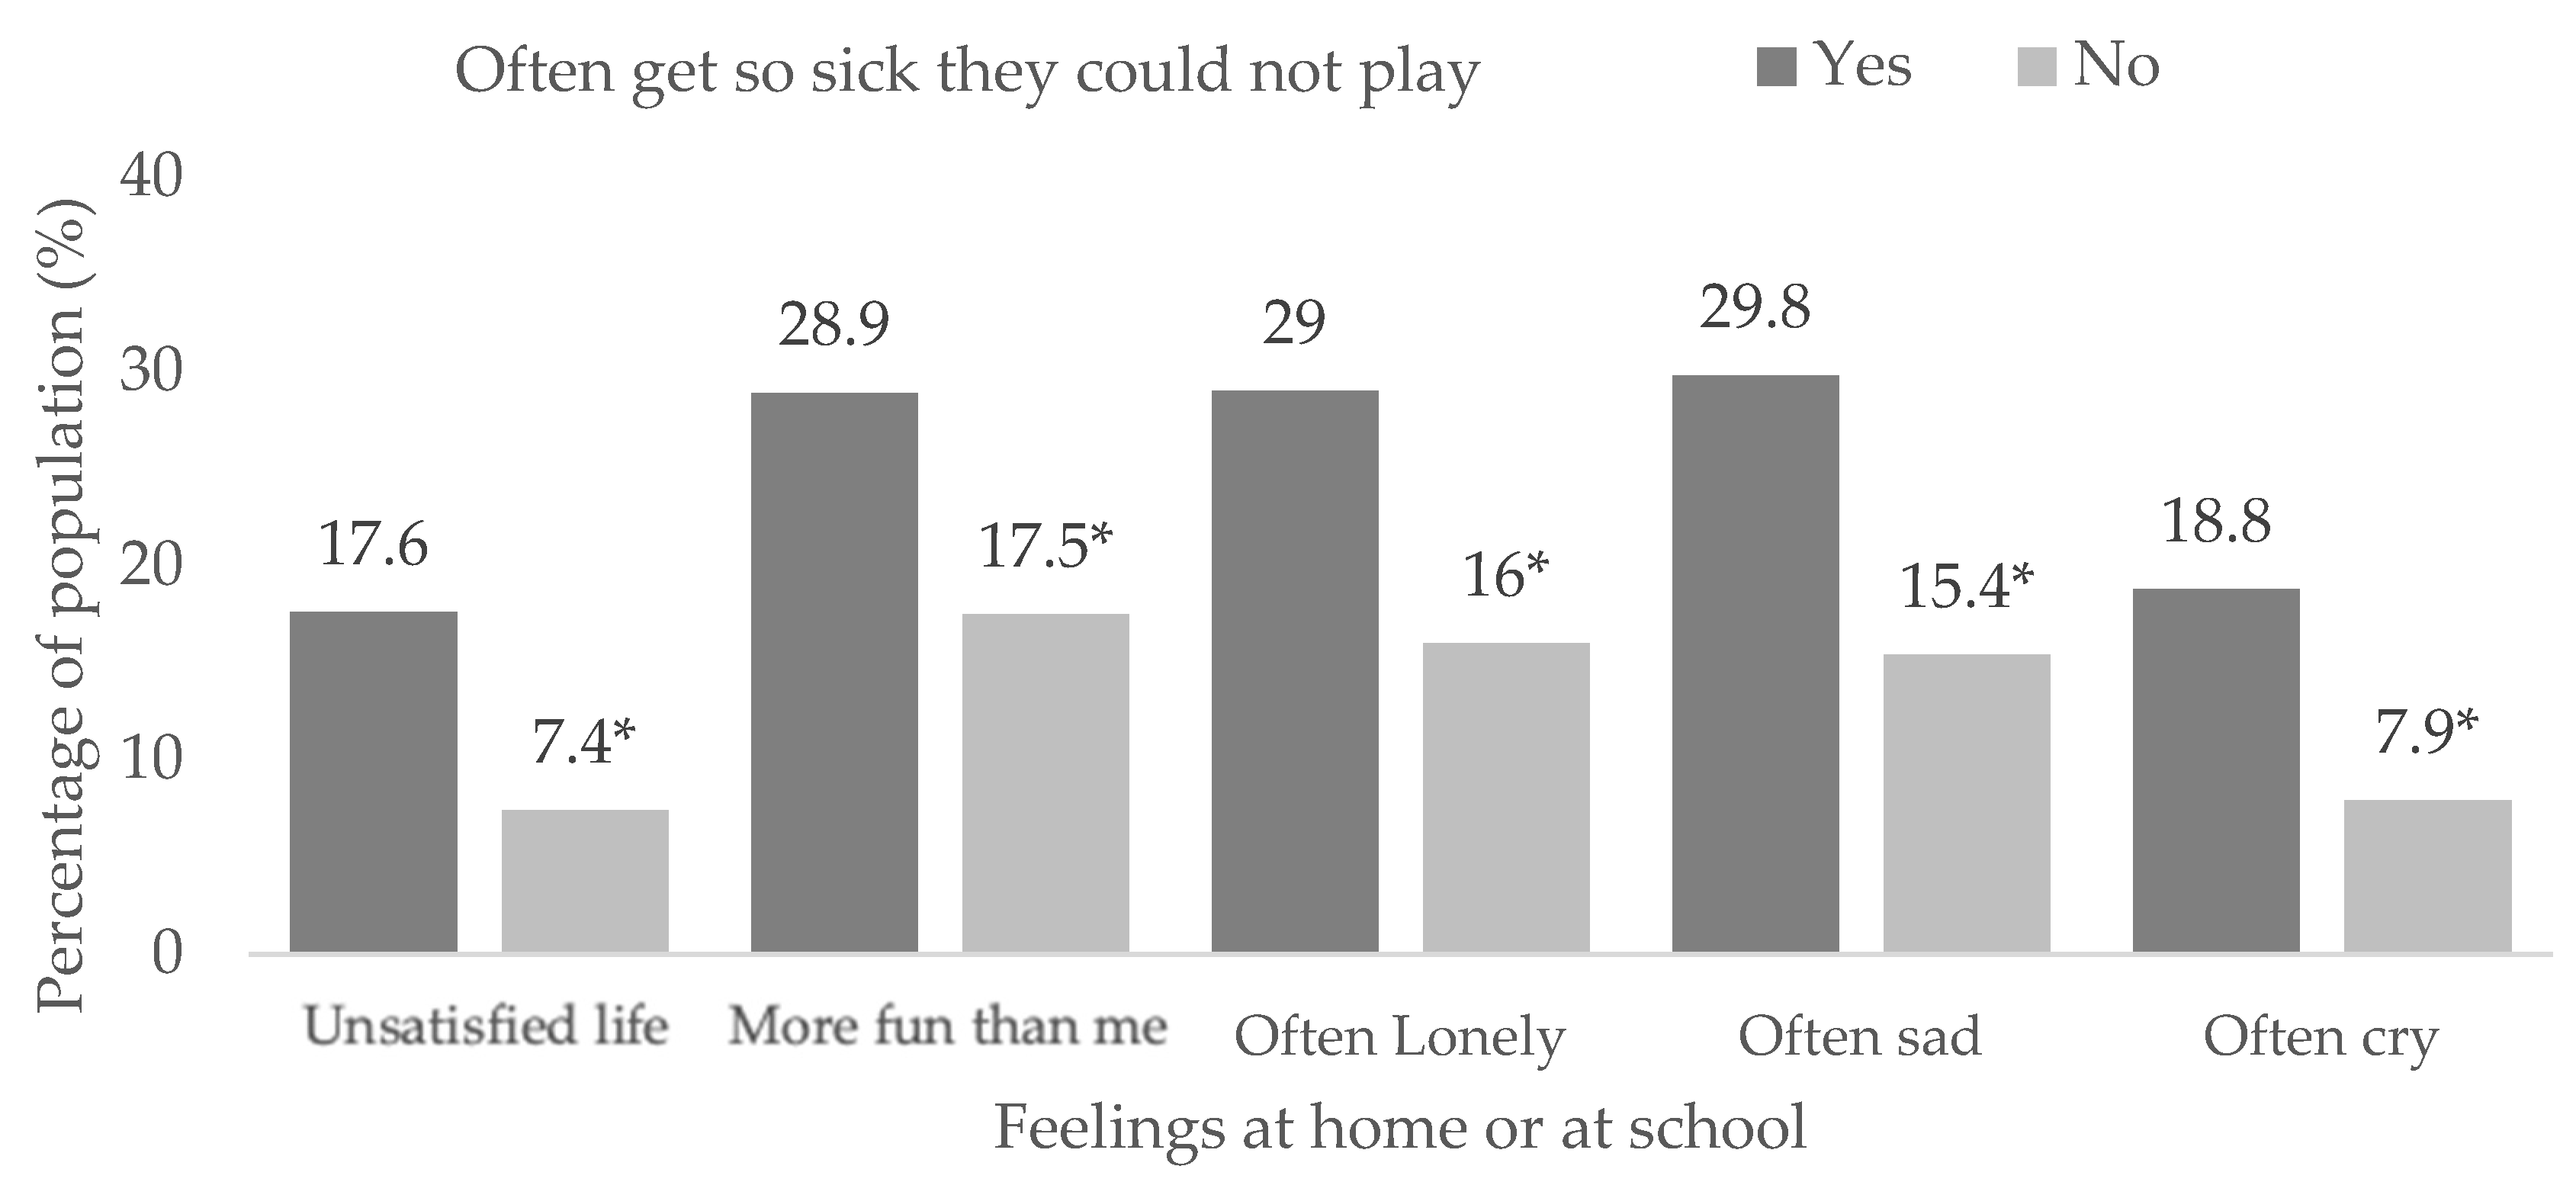
| Often getting sick | ||||
| Dissatisfied in life | Ref. | 2.95 * | 2.70 | 3.24 |
| More fun than me | Ref. | 2.04 * | 1.89 | 2.20 |
| Loneliness | Ref. | 2.36 * | 2.18 | 2.54 |
| Sadness | Ref. | 2.66 * | 2.47 | 2.88 |
| Crying | Ref. | 2.94 * | 2.69 | 3.21 |
Disclaimer/Publisher’s Note: The statements, opinions and data contained in all publications are solely those of the individual author(s) and contributor(s) and not of MDPI and/or the editor(s). MDPI and/or the editor(s) disclaim responsibility for any injury to people or property resulting from any ideas, methods, instructions or products referred to in the content. |
© 2023 by the authors. Licensee MDPI, Basel, Switzerland. This article is an open access article distributed under the terms and conditions of the Creative Commons Attribution (CC BY) license (https://creativecommons.org/licenses/by/4.0/).
Share and Cite
Denche-Zamorano, A.; García-Gil, M.Á.; Mendoza-Muñoz, M.; Barrios-Fernandez, S. Sadness and Loneliness in Adolescents with Physical, Sensory or Health Problems in Low/Middle-Income Countries. Children 2023, 10, 996. https://doi.org/10.3390/children10060996
Denche-Zamorano A, García-Gil MÁ, Mendoza-Muñoz M, Barrios-Fernandez S. Sadness and Loneliness in Adolescents with Physical, Sensory or Health Problems in Low/Middle-Income Countries. Children. 2023; 10(6):996. https://doi.org/10.3390/children10060996
Chicago/Turabian StyleDenche-Zamorano, Angel, María Ángeles García-Gil, María Mendoza-Muñoz, and Sabina Barrios-Fernandez. 2023. "Sadness and Loneliness in Adolescents with Physical, Sensory or Health Problems in Low/Middle-Income Countries" Children 10, no. 6: 996. https://doi.org/10.3390/children10060996