Next Issue
Volume 8, July
Previous Issue
Volume 8, May


Climate, Volume 8, Issue 6 (June 2020) – 16 articles

Cover Story (view full-size image): 
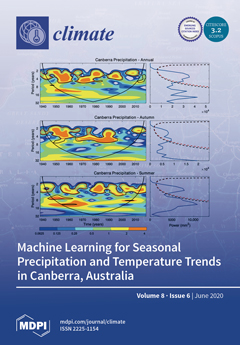
Southeast Australia is frequently impacted by drought, highlighting the need to monitor how drought drivers change over time. Analysis of seasonal precipitation and temperature trends for Canberra, Australia, revealed increasing drought vulnerability. Wavelet analysis suggests El Niño Southern Oscillation (ENSO) influences precipitation and temperature in Canberra, although its impact on precipitation declines from the 2000s. Linear regression (LR) and support vector regression (SVR) detected annual precipitation attributes including ENSO, southern annular mode (SAM), Indian Ocean Dipole (DMI), and Tasman Sea SST anomalies. Drivers of mean maximum temperature (TMax) include DMI and global warming. SVR outperformed LR in predicting precipitation and TMax trends on testing data. View this paper.
  • Issues are regarded as officially published after their release is announced to the table of contents alert mailing list.
  • You may sign up for e-mail alerts to receive table of contents of newly released issues.
  • PDF is the official format for papers published in both, html and pdf forms. To view the papers in pdf format, click on the "PDF Full-text" link, and use the free Adobe Reader to open them.
Order results
Result details
Section
Select all
Export citation of selected articles as:
29 pages, 15454 KiB  
Article
Canopy Urban Heat Island and Its Association with Climate Conditions in Dubai, UAE
by Afifa Mohammed, Gloria Pignatta, Evangelia Topriska and Mattheos Santamouris
Climate 2020, 8(6), 81; https://doi.org/10.3390/cli8060081 - 26 Jun 2020
Cited by 23 | Viewed by 6115
Abstract
The impact that climate change and urbanization are having on the thermal-energy balance of the built environment is a major environmental concern today. Urban heat island (UHI) is another phenomenon that can raise the temperature in cities. This study aims to examine the [...] Read more.
The impact that climate change and urbanization are having on the thermal-energy balance of the built environment is a major environmental concern today. Urban heat island (UHI) is another phenomenon that can raise the temperature in cities. This study aims to examine the UHI magnitude and its association with the main meteorological parameters (i.e., temperature, wind speed, and wind direction) in Dubai, United Arab Emirates. Five years of hourly weather data (2014–2018) obtained from weather stations located in an urban, suburban, and rural area, were post-processed by means of a clustering technique. Six clusters characterized by different ranges of wind directions were analyzed. The analysis reveals that UHI is affected by the synoptic weather conditions (i.e., sea breeze and hot air coming from the desert) and is larger at night. In the urban area, air temperature and night-time UHI intensity, averaged on the five year period, are 1.3 °C and 3.3 °C higher with respect to the rural area, respectively, and the UHI and air temperature are independent of each other only when the wind comes from the desert. A negative and inverse correlation was found between the UHI and wind speed for all the wind directions, except for the northern wind where no correlation was observed. In the suburban area, the UHI and both temperatures and wind speed ranged between the strong and a weak negative correlation considering all the wind directions, while a strong negative correlation was observed in the rural area. This paper concludes that UHI intensity is strongly associated with local climatic parameters and to the changes in wind direction. Full article
Show Figures

Figure 1

21 pages, 3857 KiB  
Article
Discontinuities in Wintertime Warming in Northern Europe during 1951–2016
by Mikhail M. Latonin, Vladimir A. Lobanov and Igor L. Bashmachnikov
Climate 2020, 8(6), 80; https://doi.org/10.3390/cli8060080 - 21 Jun 2020
Cited by 5 | Viewed by 3600
Abstract
Although there is a general consensus about the trends of current climate change, the North Atlantic region deserves special attention, as it is the key region for many climate processes. The aim of this study is to assess the climatic changes in this [...] Read more.
Although there is a general consensus about the trends of current climate change, the North Atlantic region deserves special attention, as it is the key region for many climate processes. The aim of this study is to assess the climatic changes in this region for the period 1951–2016, based on the analysis of surface air temperature (SAT) observations from weather stations, and the North Atlantic Oscillation (NAO). Statistical modeling of time series for January, February and March shows a stepwise increase of SAT in Northern Europe in 1987–1989, with the stationarity increasing towards spring. The divided trends of the NAO and SAT indicate a good coherence at the level of climate tendencies. This research reveals the discontinuity of the present-day wintertime warming in Northern Europe, with a warming of about 2 °C after the stepwise jump of the SAT. Full article
(This article belongs to the Special Issue The North Atlantic Ocean Dynamics and Climate Change)
Show Figures

Figure 1

19 pages, 5447 KiB  
Article
Urban Heat Island in Mediterranean Coastal Cities: The Case of Bari (Italy)
by Alessandra Martinelli, Dionysia-Denia Kolokotsa and Francesco Fiorito
Climate 2020, 8(6), 79; https://doi.org/10.3390/cli8060079 - 19 Jun 2020
Cited by 26 | Viewed by 5909
Abstract
In being aware that some factors (i.e. increasing pollution levels, Urban Heat Island (UHI), extreme climate events) threaten the quality of life in cities, this paper intends to study the Atmospheric UHI phenomenon in Bari, a Mediterranean coastal city in Southern Italy. An [...] Read more.
In being aware that some factors (i.e. increasing pollution levels, Urban Heat Island (UHI), extreme climate events) threaten the quality of life in cities, this paper intends to study the Atmospheric UHI phenomenon in Bari, a Mediterranean coastal city in Southern Italy. An experimental investigation at the micro-scale was conducted to study and quantify the UHI effect by considering several spots in the city to understand how the urban and physical characteristics of these areas modify air temperatures and lead to different UHI configurations. Air temperature data provided by fixed weather stations were first compared to assess the UHI distribution and its daily, monthly, seasonal and annual intensity in five years (from 2014 to 2018) to draw local climate information, and then compared with the relevant national standard. The study has shown that urban characteristics are crucial to the way the UHI phenomenon manifests itself. UHI reaches its maximum intensity in summer and during night-time. The areas with higher density (station 2—Local Climate Zone (LCZ) 2) record high values of UHI intensity both during daytime (4.0 °C) and night-time (4.2 °C). Areas with lower density (station 3—LCZ 5) show high values of UHI during daytime (up to 4.8 °C) and lower values of UHI intensity during night-time (up to 2.8 °C). It has also been confirmed that sea breezes—particularly noticeable in the coastal area—can mitigate temperatures and change the configuration of the UHI. Finally, by analysing the frequency distribution of current and future weather scenarios, up to additional 4 °C of increase of urban air temperature is expected, further increasing the current treats to urban liveability. Full article
Show Figures

Figure 1

20 pages, 6973 KiB  
Technical Note
A Comparative Study on the Performances of Flat Plate and Evacuated Tube Collectors Deployable in Domestic Solar Water Heating Systems in Different Climate Areas
by Adriana Greco, Edison Gundabattini, Darius S. Gnanaraj and Claudia Masselli
Climate 2020, 8(6), 78; https://doi.org/10.3390/cli8060078 - 15 Jun 2020
Cited by 26 | Viewed by 7354
Abstract
Using TRNSYS software, a comparison of the energy performances of flat-plate collectors (FPCs) and evacuated-tube collectors (ETCs) in domestic solar water heating systems located in different climate areas was carried out in order to ascertain solar energy utilization. Investigations were carried out on [...] Read more.
Using TRNSYS software, a comparison of the energy performances of flat-plate collectors (FPCs) and evacuated-tube collectors (ETCs) in domestic solar water heating systems located in different climate areas was carried out in order to ascertain solar energy utilization. Investigations were carried out on single FPCs and ETCs and also for strings of four panels connected in series. Tests were conducted using simulations for water as heat transfer fluid with a fixed fluid flow rate and varying the temperature of the collector’s returning fluid. The maximum power peak decreases with the increase in the inlet temperature of the fluid to the collector in the FPC. The maximum outlet temperature of the FPC is higher than the ETC, most of the time. The evacuated-tube collector performs better only in cold climate areas. Simulations suggest that the use of the FPC is strongly discouraged in cold climatic areas due to thermal losses, whereas the ETC works well with reduced dispersion of heat. In warm seasons, on the contrary, the FPC takes advantage of the high environmental temperature which heats the fluid. The maximum yearly outlet temperature and useful power peak predicted in different climatic areas were investigated by varying the temperature of the fluid inlet fed to the two strings of four FPCs and ETCs. In all cases, the outlet temperature is higher in the ETC technology. Full article
Show Figures

Figure 1

17 pages, 5044 KiB  
Article
Assessment of Seasonal Winter Temperature Forecast Errors in the RegCM Model over Northern Vietnam
by Hoa Vo Van, Tien Du Duc, Hung Mai Khanh, Lars Robert Hole, Duc Tran Anh, Huyen Luong Thi Thanh and Quan Dang Dinh
Climate 2020, 8(6), 77; https://doi.org/10.3390/cli8060077 - 14 Jun 2020
Viewed by 3312
Abstract
This study verified the seasonal six-month forecasts for winter temperatures for northern Vietnam in 1998–2018 using a regional climate model (RegCM4) with the boundary conditions of the climate forecast system Version 2 (CFSv2) from the National Centers for Environmental Prediction (NCEP). First, different [...] Read more.
This study verified the seasonal six-month forecasts for winter temperatures for northern Vietnam in 1998–2018 using a regional climate model (RegCM4) with the boundary conditions of the climate forecast system Version 2 (CFSv2) from the National Centers for Environmental Prediction (NCEP). First, different physical schemes (land-surface process, cumulus, and radiation parameterizations) in RegCM4 were applied to generate 12 single forecasts. Second, the simple ensemble forecasts were generated through the combinations of those different physical formulations. Three subclimate regions (R1, R2, R3) of northern Vietnam were separately tested with surface observations and a reanalysis dataset (Japanese 55-year reanalysis (JRA55)). The highest sensitivity to the mean monthly temperature forecasts was shown by the land-surface parameterizations (the biosphere−atmosphere transfer scheme (BATS) and community land model version 4.5 (CLM)). The BATS forecast groups tended to provide forecasts with lower temperatures than the actual observations, while the CLM forecast groups tended to overestimate the temperatures. The forecast errors from single forecasts could be clearly reduced with ensemble mean forecasts, but ensemble spreads were less than those root-mean-square errors (RMSEs). This indicated that the ensemble forecast was underdispersed and that the direct forecast from RegCM4 needed more postprocessing. Full article
(This article belongs to the Section Climate Dynamics and Modelling)
Show Figures

Figure 1

20 pages, 2500 KiB  
Article
Application of Machine Learning to Attribution and Prediction of Seasonal Precipitation and Temperature Trends in Canberra, Australia
by Joshua Hartigan, Shev MacNamara and Lance M. Leslie
Climate 2020, 8(6), 76; https://doi.org/10.3390/cli8060076 - 11 Jun 2020
Cited by 11 | Viewed by 3408
Abstract
Southeast Australia is frequently impacted by drought, requiring monitoring of how the various factors influencing drought change over time. Precipitation and temperature trends were analysed for Canberra, Australia, revealing decreasing autumn precipitation. However, annual precipitation remains stable as summer precipitation increased and the [...] Read more.
Southeast Australia is frequently impacted by drought, requiring monitoring of how the various factors influencing drought change over time. Precipitation and temperature trends were analysed for Canberra, Australia, revealing decreasing autumn precipitation. However, annual precipitation remains stable as summer precipitation increased and the other seasons show no trend. Further, mean temperature increases in all seasons. These results suggest that Canberra is increasingly vulnerable to drought. Wavelet analysis suggests that the El-Niño Southern Oscillation (ENSO) influences precipitation and temperature in Canberra, although its impact on precipitation has decreased since the 2000s. Linear regression (LR) and support vector regression (SVR) were applied to attribute climate drivers of annual precipitation and mean maximum temperature (TMax). Important attributes of precipitation include ENSO, the southern annular mode (SAM), Indian Ocean Dipole (DMI) and Tasman Sea SST anomalies. Drivers of TMax included DMI and global warming attributes. The SVR models achieved high correlations of 0.737 and 0.531 on prediction of precipitation and TMax, respectively, outperforming the LR models which obtained correlations of 0.516 and 0.415 for prediction of precipitation and TMax on the testing data. This highlights the importance of continued research utilising machine learning methods for prediction of atmospheric variables and weather pattens on multiple time scales. Full article
(This article belongs to the Section Climate and Environment)
Show Figures

Figure 1

22 pages, 637 KiB  
Review
Towards Indicators for a Negative Emissions Climate Stabilisation Index: Problems and Prospects
by Mathias Fridahl, Anders Hansson and Simon Haikola
Climate 2020, 8(6), 75; https://doi.org/10.3390/cli8060075 - 11 Jun 2020
Cited by 29 | Viewed by 5265
Abstract
The incongruence between the United Nations objective to hold global warming well below 2 °C and the rate of global emission reductions has intensified interest in negative emissions. Previous research has explored several pros and cons of individual negative emissions technologies. Systematised approaches [...] Read more.
The incongruence between the United Nations objective to hold global warming well below 2 °C and the rate of global emission reductions has intensified interest in negative emissions. Previous research has explored several pros and cons of individual negative emissions technologies. Systematised approaches to comparing and prioritising among them are, however, largely lacking. In response to this gap in the literature, this article reviews the scientific literature on indicators for designing negative emissions climate stabilisation value indexes. An index typically provides summary measures of several components, often denoted indicators. Utilizing a narrative review methodology, the article derives five categories of indicators underpinned by overlapping and often mutually reinforcing environmental and socio-economic values. A list of 21 indicators are proposed to capture both positive and negative values associated with effectiveness, efficiency, scale, risk, and synergies. While discussing indicators capable of providing guidance on negative emissions is timely, given the emerging shift away from pure emission reduction targets towards net-zero targets, numerous complexities are involved in determining their relative values. The results herein serve to inform policy making on the prioritisation and incentivisation of negative emissions technologies capable of delivering on the new objectives, and the results highlight the many risks and uncertainties involved in such exercises. The article concludes that systematic research on the comparison of NETs is incomplete. An iterative, interdisciplinary research programme exploring such questions has the potential to be extremely rewarding. Full article
Show Figures

Figure 1

20 pages, 3603 KiB  
Article
Methane Emission Factors from Vietnamese Rice Production: Pooling Data of 36 Field Sites for Meta-Analysis
by Thi Bach Thuong Vo, Reiner Wassmann, Van Trinh Mai, Duong Quynh Vu, Thi Phuong Loan Bui, Thi Hang Vu, Quang Hieu Dinh, Bui Tan Yen, Folkard Asch and Bjoern Ole Sander
Climate 2020, 8(6), 74; https://doi.org/10.3390/cli8060074 - 10 Jun 2020
Cited by 14 | Viewed by 7130 | Correction
Abstract
Rice production is a significant source of greenhouse gas (GHG) emissions in the national budget of many Asian countries, but the extent of emissions varies strongly across agro-environmental zones. It is important to understand these differences in order to improve the national GHG [...] Read more.
Rice production is a significant source of greenhouse gas (GHG) emissions in the national budget of many Asian countries, but the extent of emissions varies strongly across agro-environmental zones. It is important to understand these differences in order to improve the national GHG inventory and effectively target mitigation options. This study presents a meta-analysis of CH4 database emission factors (EFs) from 36 field sites across the rice growing areas of Vietnam and covering 73 cropping seasons. The EFs were developed from field measurements using the closed chamber technique. The analysis for calculating baseline EFs in North, Central and South Vietnam in line with the Intergovernmental Panel on Climate Change (IPCC) Tier 2 methodology was specified for the three cropping seasons being early-(E), mid-(M) and late-year (L) seasons. Calculated average CH4 EFs are given in kg ha−1 d−1 and reflect the distinct seasons in North (E: 2.21; L: 3.89), Central (E: 2.84; M+L: 3.13) and South Vietnam (E: 1.72; M: 2.80; L: 3.58). Derived from the available data of the edapho-hydrological zones of the Mekong River Delta, season-based EFs are more useful than zone-based EFs. In totality, these average EFs indicate an enormous variability of GHG emissions in Vietnamese rice production and represent much higher values than the IPCC default. Seasonal EFs from Vietnam exceeded IPCC defaults given for Southeast Asia corresponding to 160% (E), 240% (M) and 290% (L) of the medium value, respectively. Full article
(This article belongs to the Section Climate and Environment)
Show Figures

Figure 1

17 pages, 5386 KiB  
Perspective
Building Resilience of Critical Infrastructure: A Case of Impacts of Cyclones on the Power Sector in Odisha
by Sujit Kumar Mohanty, Ranit Chatterjee and Rajib Shaw
Climate 2020, 8(6), 73; https://doi.org/10.3390/cli8060073 - 05 Jun 2020
Cited by 24 | Viewed by 9004
Abstract
Odisha is multi-hazard-prone state in the eastern part of India. Among the various disasters, the frequency and severity of cyclones have increased at an alarming rate in the last two decades, which is attributed to climatic change. The state government of Odisha has [...] Read more.
Odisha is multi-hazard-prone state in the eastern part of India. Among the various disasters, the frequency and severity of cyclones have increased at an alarming rate in the last two decades, which is attributed to climatic change. The state government of Odisha has made great strides in reducing the lives lost in the state, but an increase in economic losses and damage to critical infrastructure has become a point of worry. Considering the power sector as the most crucial of all critical infrastructures, this paper explores the impact that cyclones have had on the sector in the last two decades in Odisha. The 4R concept of robustness, redundancy, rapidity and resourcefulness is applied to the power sector, and how this is supported by governance is studied. The study points towards need for the master planning of critical infrastructure, based on the risk assessment, establishment of funding mechanisms for mitigation measures and the standardization and quality checking of power sector equipment to withstand the wind speeds of category 4 and above. There needs to be a good coordination between the power sector and the disaster management sector with proper legislative provision. Knowledge management, training and capacity building is another important issue which needs to be focused on. Full article
Show Figures

Figure 1

13 pages, 4258 KiB  
Technical Note
Microclimate Analysis as a Design Driver of Architecture
by Jonathan Graham, Umberto Berardi, Geoffrey Turnbull and Robert McKaye
Climate 2020, 8(6), 72; https://doi.org/10.3390/cli8060072 - 03 Jun 2020
Cited by 10 | Viewed by 13604
Abstract
In the context of global climate change, it is increasingly important for architects to understand the effects of their interventions on indoor and outdoor thermal comfort. New microclimate analysis tools which are gaining appreciation among architects enable the assessment of different design options [...] Read more.
In the context of global climate change, it is increasingly important for architects to understand the effects of their interventions on indoor and outdoor thermal comfort. New microclimate analysis tools which are gaining appreciation among architects enable the assessment of different design options in terms of biometeorological parameters, such as the Universal Thermal Climate Index (UTCI) and the Outdoor Thermal Comfort Autonomy. This paper reflects on some recent experiences of an architectural design office attempting to incorporate local climatic considerations as a design driver in projects. The investigation shows that most of the available tools for advanced climatic modelling have been developed for research purposes and are not optimized for architectural and urban design; consequently, they require adaptations and modifications to extend their functionality or to achieve interoperability with software commonly used by architects. For this scope, project-specific Python scripts used to extract design-consequential information from simulation results, as well as to construct meteorological boundary conditions for microclimate simulations, are presented. This study describes the obstacles encountered while implementing microclimate analysis in an architectural office and the measures taken to overcome them. Finally, the benefits of this form of analysis are discussed. Full article
(This article belongs to the Section Climate Dynamics and Modelling)
Show Figures

Figure 1

15 pages, 2901 KiB  
Article
Effect of Surface Temperature on Energy Consumption in a Calibrated Building: A Case Study of Delhi
by Priyanka Kumari, Sukriti Kapur, Vishal Garg and Krishan Kumar
Climate 2020, 8(6), 71; https://doi.org/10.3390/cli8060071 - 02 Jun 2020
Cited by 16 | Viewed by 3785
Abstract
Rapid urbanization and associated land-use changes in cities cause an increase in the demand for electricity by altering the local climate. The present study aims to examine the variations in total energy and cooling energy demand in a calibrated building energy model, caused [...] Read more.
Rapid urbanization and associated land-use changes in cities cause an increase in the demand for electricity by altering the local climate. The present study aims to examine the variations in total energy and cooling energy demand in a calibrated building energy model, caused by urban heat island formation over Delhi. The study used Sentinel-2A multispectral imagery for land use and land cover (LULC) of mapping of Delhi, and Moderate Resolution Imaging Spectroradiometer (MODIS) imagery for land surface temperature (LST) mapping during March 2018. It was observed that regions with dense built-up areas (i.e., with built-up area greater than 90%) had a higher annual land surface temperature (LST), i.e., 293.5 K and urban heat island intensity (UHII) ranging from 0.9 K–5.9 K. In contrast, lower annual values of LST (290K) and UHII (0.0–0.4 K) were observed in regions with high vegetation cover (53%). Statistical analysis reveals that a negative correlation exists between vegetation and nighttime LST, which is further confirmed by linear regression analysis. Energy simulations were performed on a calibrated building model placed at three different sites, identified on the basis of land use and land cover percentage and annual LST. Simulation results showed that the site located in the central part of Delhi displayed higher annual energy consumption (255.21 MWh/y) compared to the site located in the rural periphery (235.69 MWh/y). For all the three sites, the maximum electricity consumption was observed in the summer season, while the minimum was seen in the winter season. The study indicates that UHI formation leads to increased energy consumption in buildings, and thus UHI mitigation measures hold great potential for energy saving in a large city like Delhi. Full article
Show Figures

Figure 1

23 pages, 3635 KiB  
Article
Analysis of the Spatio-Temporal Variability of Precipitation and Drought Intensity in an Arid Catchment in South Africa
by Achamyeleh G. Mengistu, Weldemichael A. Tesfuhuney, Yali E. Woyessa and Leon D. van Rensburg
Climate 2020, 8(6), 70; https://doi.org/10.3390/cli8060070 - 01 Jun 2020
Cited by 8 | Viewed by 4128
Abstract
Water deficit is high and precipitation varies spatio-temporally in arid areas. This study was conducted to analyse the spatio-temporal variability of precipitation and drought intensity in an arid catchment in South Africa. The Soil and Water Assessment Tool (SWAT) was used to estimate [...] Read more.
Water deficit is high and precipitation varies spatio-temporally in arid areas. This study was conducted to analyse the spatio-temporal variability of precipitation and drought intensity in an arid catchment in South Africa. The Soil and Water Assessment Tool (SWAT) was used to estimate the spatio-temporal precipitation where nine meteorological stations were used as input to the model. The model was calibrated and validated by regionalization with a physical similarity approach. SWAT only predicts precipitation at sub-basin level. Hence, the mean precipitation was further interpolated by using the inverse distance weighted method (IDW). The Mann–Kendall trend test shows that there was no trend in annual precipitation whereas in the monthly precipitation there was a 0.01 mm decrease. Daily precipitation varied from 0.1 to 4 mm whereas in a monthly basis, it varied from 6 mm (September) to 43.4 mm (February). The annual precipitation varied from 169 mm (1983) to 415 mm (2003) with a long-term mean of 280.8 mm. Precipitation is also highly variable in space throughout the catchment. Generally, annual precipitation decreased from north to south; however, during the winter season, the reverse was true due to the influence of rain-bearing condition from the south- western direction. Based on the aridity index (AI), the catchment is categorized as arid. The SPI shows that the 1983 drought was the worst whereas the 2003 and 2004 years were relatively wet. The results from this study provide baseline information for further research in climate change adaptation and environmental monitoring programs in the region. Full article
(This article belongs to the Special Issue Precipitation: Forecasting and Climate Projections)
Show Figures

Figure 1

17 pages, 5041 KiB  
Article
On the Efficiency of Using Transpiration Cooling to Mitigate Urban Heat
by Kai Gao, Mattheos Santamouris and Jie Feng
Climate 2020, 8(6), 69; https://doi.org/10.3390/cli8060069 - 01 Jun 2020
Cited by 10 | Viewed by 3924
Abstract
Trees are considered to be effective for the mitigation of urban overheating, and the cooling capacity of trees mainly comes from two mechanisms: transpiration and shading. This study explores the transpiration cooling of large trees in urban environments where the sea breeze dominates [...] Read more.
Trees are considered to be effective for the mitigation of urban overheating, and the cooling capacity of trees mainly comes from two mechanisms: transpiration and shading. This study explores the transpiration cooling of large trees in urban environments where the sea breeze dominates the climate. In the experiment, sap flow sensors were used to measure the transpiration rate of two large trees located in Sydney over one year. Also, the temperature difference between the inside and outside of the canopy, as well as the vertical temperature distribution below the canopy, were measured during summer. In this experiment, the temperature under the canopies decreased by about 0.5 degrees from a 0.5 m height to a 3.5 m height, and the maximum temperature difference between the inside and outside of the canopy was about 2 degrees. After applying a principal component analysis of multiple variables, we found that when a strong sea breeze is the primary cooling mechanism, the sap flow still makes a considerable contribution to cooling. Further, the sea breeze and the transpiration cooling of trees are complementary. In conclusion, the characteristics of synoptic conditions must be fully considered when planting trees for mitigation purposes. Since the patterns of sea breeze and sap often do not coincide, the transpiration cooling of trees is still effective when the area is dominated by sea breeze. Full article
Show Figures

Graphical abstract

24 pages, 8009 KiB  
Article
Surface Temperature Trend Estimation over 12 Sites in Guinea Using 57 Years of Ground-Based Data
by René Tato Loua, Hassan Bencherif, Nelson Bègue, Nkanyiso Mbatha, Thierry Portafaix, Alain Hauchecorne, Venkataraman Sivakumar and Zoumana Bamba
Climate 2020, 8(6), 68; https://doi.org/10.3390/cli8060068 - 31 May 2020
Cited by 1 | Viewed by 3760
Abstract
Trend-Run model was performed to estimate the trend in surface temperatures recorded at 12 sites in Guinea from 1960 to 2016 and to examine the contribution of each climate forcing. The coefficient of determination (R2) calculated varies between 0.60 and 0.90, [...] Read more.
Trend-Run model was performed to estimate the trend in surface temperatures recorded at 12 sites in Guinea from 1960 to 2016 and to examine the contribution of each climate forcing. The coefficient of determination (R2) calculated varies between 0.60 and 0.90, it provides total information about the simulation capability of the model. The decadal trend values also calculated show an upward trend (between 0.04 °C ± 0.06 °C decade−1 and 0.21 °C ± 0.06 °C decade−1). In addition, forcings’ contributions were quantified, and the annual oscillation (AO) contribution is higher for most of the stations, followed by semiannual oscillation (SAO). Among the forcings, the tropical Northern Atlantic (TNA) contribution is greater than that of the sunspot number (SSN), Niño3.4 and Atlantic Niño (AN). Moreover, the Mann-Kendall test revealed a positive significant trend for all stations except at the Macenta site. Additionally, with sequential Mann-Kendall test, trend turning points were found only for the stations of Mamou, Koundara and Macenta at different dates. The temperature anomalies depict warming episodes (1970s, 1980s, 1984 and 1990s). Since then, the temperature is consistently increasing over the country. A significant warming has been shown, which might be further investigated using these models with additional contributing factors. Full article
Show Figures

Figure 1

28 pages, 7618 KiB  
Article
An Investigation into the Future Changes in Onset and Cessation of Rain and Their Variability over the Aswa Catchment, Uganda
by Michael Iwadra, P. T. Odirile, B. P. Parida and D. B. Moalafhi
Climate 2020, 8(6), 67; https://doi.org/10.3390/cli8060067 - 29 May 2020
Viewed by 2848
Abstract
Future global warming may result in extreme precipitation events leading to crop, environment and infrastructure damage. Rainfall is a major input for the livelihood of peasant farmers in the Aswa catchment where the future rainfall variability, onset and cessation are also likely to [...] Read more.
Future global warming may result in extreme precipitation events leading to crop, environment and infrastructure damage. Rainfall is a major input for the livelihood of peasant farmers in the Aswa catchment where the future rainfall variability, onset and cessation are also likely to be affected. The Aswa catchment has limited rainfall data; therefore, use of secondary datasets from Tropical Rainfall Measuring Mission (TRMM) is considered in this study, based on the close correlation of the recorded and TRMM rainfall. The latter was used to calibrate the statistical downscaling model for downscaling of two general circulation models to simulate future changes in rainfall. These data were analyzed for trends, wet and dry conditions/variability; onset and cessations of rain using the Mann–Kendall test, Standardized Precipitation Index (SPI) and the cumulative percentage mean rainfall method, respectively. Results show future rainfall is likely to increase, accompanied by increasing variability reaching as high as 118.5%. The frequency of SPI values above 2 (extreme wetness) is to increase above current level during mid and end of the century. The highest rainfall variability is expected especially during the onset and cessation months, which are generally expected to come earlier and later, by up to four and five weeks, respectively. The reliability worsens from the midterm (2036–2065) to long term (2066–2099). These likely changes in rainfall quantities, variability, onset and cessation months are some of the key rainfall dynamics that have implications for future arable agriculture, environment and water resource availability and planning over the Aswa catchment, as is increasingly the case elsewhere. Full article
(This article belongs to the Special Issue Climate Change and Water-Related Agricultural Risks)
Show Figures

Figure 1

33 pages, 1430 KiB  
Article
Stakeholders’ Perception of Climate Actions in Some Developing Economies
by Oluwaseun Fadeyi and Petra Maresova
Climate 2020, 8(6), 66; https://doi.org/10.3390/cli8060066 - 27 May 2020
Cited by 6 | Viewed by 4337
Abstract
Resilience, adaptation and mitigation are unique but complimentary actions in the fight against climate change (CC), particularly in developing countries. Although evidence suggest the inclusion of stakeholder opinions as part of the frameworks for combating CC, this evidence is not well substantiated, and [...] Read more.
Resilience, adaptation and mitigation are unique but complimentary actions in the fight against climate change (CC), particularly in developing countries. Although evidence suggest the inclusion of stakeholder opinions as part of the frameworks for combating CC, this evidence is not well substantiated, and is not extensively described in sub-Sahara African CC literature. While language remains a big issue in CC discussions, processes comprised within climate actions are equally as important as both the language and the results. It is on the basis of the confusion surrounding the language adopted as actions geared towards combating CC that this study seeks to examine the opinions/perception of CC actors in three West African nations. It looks at perceived and/or suitable solutions to selected CC-imposed challenges in the midst of socio-economic and environmental concerns. A total of 475 individuals, representing NGOs, public and private organizations involved with CC issues, as well as private persons concerned about CC, were recruited across Nigeria, Niger, and Benin, over a two-year period (April 2017–April 2019). A questionnaire containing 15 items was administered. The results of data analysis using chi-square and Fischer’s exact tests show that the mean number of CC actors differs within and across all three countries for all climate action types against CC-imposed challenges. While CC adaptive plans and projects are thought to yield immediate results, they are also observed to be cheaper in comparison to mitigation and resilience projects. Full article
(This article belongs to the Special Issue Fighting Climate Change with Circular Economy)
Show Figures

Figure 1

Previous Issue
Next Issue
Back to TopTop