Next Issue
Volume 8, November
Previous Issue
Volume 8, September


Climate, Volume 8, Issue 10 (October 2020) – 19 articles

Cover Story (view full-size image): 
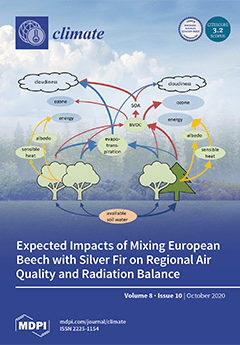
In view of climate change, the resilience of forests urgently needs to be strengthened. Therefore, current monocultures will be transformed into mixed forests by introducing new tree species. However, it is not only the vulnerability that is altered, but also the biosphere–atmosphere exchange of energy and matter. On a regional scale, radiation balance, aerosol concentration (SOA), and cloudiness are affected, which was investigated here for the Black Forest, Germany, where Abies alba was introduced into stands of Fagus sylvatica. Differences in energy exchange (albedo), water balance (evapotranspiration), and emission (biogenic volatile organic compounds, BVOCs) were measured and modelled. The results indicate impacts on ozone concentration and cloud condensation nuclei that originate from different tree species traits. View this paper.
  • Issues are regarded as officially published after their release is announced to the table of contents alert mailing list.
  • You may sign up for e-mail alerts to receive table of contents of newly released issues.
  • PDF is the official format for papers published in both, html and pdf forms. To view the papers in pdf format, click on the "PDF Full-text" link, and use the free Adobe Reader to open them.
Order results
Result details
Section
Select all
Export citation of selected articles as:
25 pages, 1840 KiB  
Article
Attribution and Prediction of Precipitation and Temperature Trends within the Sydney Catchment Using Machine Learning
by Joshua Hartigan, Shev MacNamara, Lance M. Leslie and Milton Speer
Climate 2020, 8(10), 120; https://doi.org/10.3390/cli8100120 - 20 Oct 2020
Cited by 6 | Viewed by 2766
Abstract
Droughts in southeastern Australia can profoundly affect the water supply to Sydney, Australia’s largest city. Increasing population, a warming climate, land surface changes and expanded agricultural use increase water demand and reduce catchment runoff. Studying Sydney’s water supply is necessary to manage water [...] Read more.
Droughts in southeastern Australia can profoundly affect the water supply to Sydney, Australia’s largest city. Increasing population, a warming climate, land surface changes and expanded agricultural use increase water demand and reduce catchment runoff. Studying Sydney’s water supply is necessary to manage water resources and lower the risk of severe water shortages. This study aims at understanding Sydney’s water supply by analysing precipitation and temperature trends across the catchment. A decreasing trend in annual precipitation was found across the Sydney catchment area. Annual precipitation also is significantly less variable, due to fewer years above the 80th percentile. These trends result from significant reductions in precipitation during spring and autumn, especially over the last 20 years. Wavelet analysis was applied to assess how the influence of climate drivers has changed over time. Attribute selection was carried out using linear regression and machine learning techniques, including random forests and support vector regression. Drivers of annual precipitation included Niño3.4, Southern Annular Mode (SAM) and DMI, and measures of global warming such as the Tasman Sea sea surface temperature anomalies. The support vector regression model with a polynomial kernel achieved correlations of 0.921 and a skill score compared to climatology of 0.721. The linear regression model also performed well with a correlation of 0.815 and skill score of 0.567, highlighting the importance of considering both linear and non-linear methods when developing statistical models. Models were also developed on autumn and winter precipitation but performed worse than annual precipitation on prediction. For example, the best performing model on autumn precipitation, which accounts for approximately one quarter of annual precipitation, achieved an RMSE of 418.036 mm2 on the testing data, while annual precipitation achieved an RMSE of 613.704 mm2. However, the seasonal models provided valuable insights into whether the season would be wet or dry compared to the climatology. Full article
(This article belongs to the Section Climate and Environment)
Show Figures

Figure 1

10 pages, 214 KiB  
Communication
Climate-Friendly Ethics Prescribed by Top World Airlines: Empirical Evidence
by Dmitry A. Ruban and Natalia N. Yashalova
Climate 2020, 8(10), 119; https://doi.org/10.3390/cli8100119 - 19 Oct 2020
Cited by 4 | Viewed by 3203
Abstract
The aviation industry contributes substantially to the global climate change, and, thus, airline companies need development of climate-friendly ethics. The content of the codes of conduct of 16 airline companies boasting either the greatest number of daily departures or the largest air fleet [...] Read more.
The aviation industry contributes substantially to the global climate change, and, thus, airline companies need development of climate-friendly ethics. The content of the codes of conduct of 16 airline companies boasting either the greatest number of daily departures or the largest air fleet (or both) are analyzed. It is established that 25% of these companies prescribe climate-friendly behavior often focusing on emissions. Moreover, many other companies prescribe pro-environmental behavior. The situation seems to be promising, although improvements of the existing corporate ethical prescriptions are necessary. Despite its tentative character and certain limitations, this study permits putting the climate-friendly ethics of airlines on the international agenda. Practically, it is important to add climate-related notions to those codes of conduct where these do not exist and to use successful examples as ethical templates for the entire aviation industry. Full article
Show Figures

Graphical abstract

24 pages, 4173 KiB  
Article
Implications of Development Cooperation and State Bureaucracy on Climate Change Adaptation Policy in Bangladesh
by Md Saifur Rahman, Pradip Kumar Sarker, Ryokichi Hirono and Lukas Giessen
Climate 2020, 8(10), 118; https://doi.org/10.3390/cli8100118 - 19 Oct 2020
Cited by 10 | Viewed by 5814
Abstract
Policy action is visible in national and international climate governance. However, policy-making and its implementation often fail to generate the desired outcomes that aim to adapt to the adverse impact of climate change in a developing nation, such as Bangladesh—a country highly vulnerable [...] Read more.
Policy action is visible in national and international climate governance. However, policy-making and its implementation often fail to generate the desired outcomes that aim to adapt to the adverse impact of climate change in a developing nation, such as Bangladesh—a country highly vulnerable to the impact of climate change. Against this backdrop, the study aims to analyze the implication of development cooperation and bureaucratic politics on the policy-making and implementation of climate change adaptation policy in Bangladesh. In doing so, the research uses national and international climate adaptation funds and the existing state administrative framework of the climate adaptation regime. Methodologically, it follows a mixed qualitative–quantitative research approach. The study discusses the following key findings: (1) the general cross-sectoral nature and thrusts of domestic and external climate adaptation funding; (2) how Bangladesh technical departments, such as that for water management, have reacted successfully to ensure the utilization of the funds is for implementing adaptation policy; (3) simultaneously, how Bangladesh bureaucracy, made of the elite, together with politics, have maintained their traditional values, practices, and structures in responding to the administrative requirements of climate adaptation funders, especially bilateral and multilateral development agencies, and (4) what changes should be brought to the bureaucratic cadre and added to the administrative setup in Bangladesh to provide a better overall impact of the adaptation policy and funding. Full article
Show Figures

Figure 1

20 pages, 2411 KiB  
Article
Climate Drivers and Sources of Sediment and Organic Matter Fluxes in Intermittent Rivers and Ephemeral Streams (IRES) of a Subtropical Watershed, USA
by Janet Dewey, Jeff Hatten, Byoungkoo Choi, Clay Mangum and Ying Ouyang
Climate 2020, 8(10), 117; https://doi.org/10.3390/cli8100117 - 16 Oct 2020
Cited by 5 | Viewed by 3009
Abstract
Climate-driven hydrological models rarely incorporate intermittent rivers and ephemeral streams (IRES) due to monitoring difficulties and their perceived minor effect on river networks. Worldwide, IRES represent approximately 50% of river networks and up to 60% of annual flow and are recognized as conduits [...] Read more.
Climate-driven hydrological models rarely incorporate intermittent rivers and ephemeral streams (IRES) due to monitoring difficulties and their perceived minor effect on river networks. Worldwide, IRES represent approximately 50% of river networks and up to 60% of annual flow and are recognized as conduits and processors of organic matter (OM). Climate induced changes in precipitation and discharge (Q) may impact OM fluxes from IRES. We assessed storm-driven source and flux of total suspended solids (TSS) and OM from small IRES in Mississippi, USA. We used linear Pearson correlations to evaluate relationships between water and storm characteristics (e.g., discharge). Stepwise regression was used to predict change in flux. Dissolved OM was derived from saturated flow through soil whereas particulate OM was derived from channel extension during storms. A power log relationship between Q and materials flux indicated that Q was the driver for flux. A 5% increase in Q within IRES may result in flux increase of 2% TSS and 1.7–2.8% OM. Climate change projections of increased storm intensity over a shorter water year will increase channel extension and soil water transfer resulting in higher material flux to downstream reaches. Climate-driven hydrological models of OM flux should incorporate IRES. Full article
Show Figures

Figure 1

20 pages, 3709 KiB  
Article
Assessing Property Level Economic Impacts of Climate in the US, New Insights and Evidence from a Comprehensive Flood Risk Assessment Tool
by Saman Armal, Jeremy R. Porter, Brett Lingle, Ziyan Chu, Michael L. Marston and Oliver E. J. Wing
Climate 2020, 8(10), 116; https://doi.org/10.3390/cli8100116 - 12 Oct 2020
Cited by 23 | Viewed by 10356
Abstract
Hurricanes and flood-related events cause more direct economic damage than any other type of natural disaster. In the United States, that damage totals more than USD 1 trillion in damages since 1980. On average, direct flood losses have risen from USD 4 billion [...] Read more.
Hurricanes and flood-related events cause more direct economic damage than any other type of natural disaster. In the United States, that damage totals more than USD 1 trillion in damages since 1980. On average, direct flood losses have risen from USD 4 billion annually in the 1980s to roughly USD 17 billion annually from 2010 to 2018. Despite flooding’s tremendous economic impact on US properties and communities, current estimates of expected damages are lacking due to the fact that flood risk in many parts of the US is unidentified, underestimated, or available models associated with high quality assessment tools are proprietary. This study introduces an economic-focused Environmental Impact Assessment (EIA) approach that builds upon an our existing understanding of prior assessment methods by taking advantage of a newly available, climate adjusted, parcel-level flood risk assessment model (First Street Foundation, 2020a and 2020b) in order to quantify property level economic impacts today, and into the climate adjusted future, using the Intergovernmental Panel on Climate Change’s (IPCC) Representative Concentration Pathways (RCPs) and NASA’s Global Climate Model ensemble (CMIP5). This approach represents a first of its kind—a publicly available high precision flood risk assessment tool at the property level developed completely with open data sources and open methods. The economic impact assessment presented here has been carried out using residential buildings in New Jersey as a testbed; however, the environmental assessment tool on which it is based is a national scale property level flood assessment model at a 3 m resolution. As evidence of the reliability of the EIA tool, the 2020 estimated economic impact (USD 5481 annual expectation) was compared to actual average per claim-year NFIP payouts from flooding and found an average of USD 5540 over the life of the program (difference of less than USD 100). Additionally, the tool finds a 41.4% increase in average economic flood damage through the year 2050 when environmental change is included in the model. Full article
(This article belongs to the Section Climate and Economics)
Show Figures

Graphical abstract

17 pages, 4726 KiB  
Article
Characteristics of Climate Change in the Lancang-Mekong Sub-Region
by Han Li and Wei Song
Climate 2020, 8(10), 115; https://doi.org/10.3390/cli8100115 - 10 Oct 2020
Cited by 17 | Viewed by 4734
Abstract
The Lancang-Mekong River is an important international river in Southeastern Asia. In recent years, due to climate change, natural disasters, such as drought and flooding, have frequently occurred in the region, which has a negative effect on the sustainable development of the social [...] Read more.
The Lancang-Mekong River is an important international river in Southeastern Asia. In recent years, due to climate change, natural disasters, such as drought and flooding, have frequently occurred in the region, which has a negative effect on the sustainable development of the social economy. Due to the lack of meteorological monitoring data in the six countries across the region, the study of the characteristics of climate change in this area is still scarce. In this paper, we analyze the characteristics of climate change in the Lancang-Mekong sub-region (LMSR) during 2020–2100 based on the climatic data of CMIP5, using the linear trend rate method, cumulative anomaly method, the Mann–Kendall test, and Morlet wavelet analysis. The results showed that the annual mean temperature and annual precipitation in the LMSR increased significantly. The annual average temperature in this area increased at a rate of 0.219 °C/10a (p < 0.05) and 0.578 °C/10a (p < 0.05) in the RCP4.5 and RCP8.5 scenarios, respectively; the annual precipitation in the area was 29.474 mm/10a (p < 0.05) and 50.733 mm/10a (p < 0.05), respectively. The annual average temperature in the region changed abruptly from low to high temperatures in 2059 for the RCP4.5 scenario and 2063 for RCP8.5. The annual precipitation in the area changed from less to more in 2051 for the RCP4.5 scenario and 2057 for RCP8.5. The results of wavelet analysis showed that the annual mean temperature in the LMSR had no significant change period at the 95% confidence level under the scenario of RCP4.5 and RCP8.5. Under the scenario of RCP4.5 and RCP8.5, the annual precipitation had a significant 3.5-year and 2.5-year periodicity, respectively. Extreme climate events tended to increase against the background of global warming, especially in high emission scenarios. Full article
Show Figures

Figure 1

22 pages, 12090 KiB  
Article
Impact of Climate Change on Vegetation Cover at South Port Sudan Area
by Pei Sun Loh, Hussien Ibrahim Mohammed Alnoor and Shuangyan He
Climate 2020, 8(10), 114; https://doi.org/10.3390/cli8100114 - 10 Oct 2020
Cited by 8 | Viewed by 3568
Abstract
Arid regions worldwide, for example, Sudan, are affected by climate change and susceptible to environmental deterioration. In this study, temperature and rainfall data from 1985 to 2015 obtained from the Sudan Meteorological Authority were compared with satellite images of vegetation coverage in southern [...] Read more.
Arid regions worldwide, for example, Sudan, are affected by climate change and susceptible to environmental deterioration. In this study, temperature and rainfall data from 1985 to 2015 obtained from the Sudan Meteorological Authority were compared with satellite images of vegetation coverage in southern Port Sudan. The objective of this study was to determine the impact of climate change on the vegetation cover in this area. Results showed significant increases in the annual maximum, minimum and average temperatures with time, and precipitation showed a slight but not significant decrease from 1985 to 2015. The rates of increase for the annual maximum, minimum and average temperatures were 0.08 °C/year, 0.03 °C/year and 0.06 °C/year, respectively, and precipitation decreased at a rate of 0.12 mm/year. Higher shrub abundance and greater water area in 2013, 1995 and 1990 were probably due to high rainfall in the years preceding these years. Decreased shrub abundance in the year 2000 could be due to the significantly higher temperatures after 1998. There was no decreasing trend in shrub coverage from 1985 to 2015, but the overall increase in temperature and decrease in precipitation from 1985 to 2015 indicate a potential threat to vegetation in this area in the future. Full article
(This article belongs to the Section Climate and Environment)
Show Figures

Figure 1

2 pages, 162 KiB  
Correction
Correction: Vo, T.B.T., et al. Methane Emission Factors from Vietnamese Rice Production: Pooling Data of 36 Field Sites for Meta-analysis. Climate 2020, 8, 74
by Thi Bach Thuong Vo, Reiner Wassmann, Van Trinh Mai, Duong Quynh Vu, Thi Phuong Loan Bui, Thi Hang Vu, Quang Hieu Dinh, Bui Tan Yen, Folkard Asch and Bjoern Ole Sander
Climate 2020, 8(10), 113; https://doi.org/10.3390/cli8100113 - 07 Oct 2020
Cited by 1 | Viewed by 1977
Abstract
The authors wish to make the following corrections to this paper [...] Full article
19 pages, 4339 KiB  
Article
Convection Parametrization and Multi-Nesting Dependence of a Heavy Rainfall Event over Namibia with Weather Research and Forecasting (WRF) Model
by Sieglinde Somses, Mary-Jane M. Bopape, Thando Ndarana, Ann Fridlind, Toshihisa Matsui, Elelwani Phaduli, Anton Limbo, Shaka Maikhudumu, Robert Maisha and Edward Rakate
Climate 2020, 8(10), 112; https://doi.org/10.3390/cli8100112 - 07 Oct 2020
Cited by 10 | Viewed by 3865
Abstract
Namibia is considered to be one of the countries that are most vulnerable to climate change due to its generally dry climate and the percentage of its population that rely on subsistence agriculture for their livelihoods. Early-warning systems are an important aspect of [...] Read more.
Namibia is considered to be one of the countries that are most vulnerable to climate change due to its generally dry climate and the percentage of its population that rely on subsistence agriculture for their livelihoods. Early-warning systems are an important aspect of adapting to climate change. Weather forecasting relies on the use of numerical weather prediction models and these need to be configured properly. In this study, we investigate the effects of using multi-nests and a convection scheme on the simulation of a heavy rainfall event over the north-western region of Kunene, Namibia. The event, which was associated with a cut-off low system, was short-lived and resulted in over 45 mm of rainfall in one hour. For the multi-nest, a 9 km grid-length parent domain is nested within the Global Forecast System (GFS) simulations, which in turn forces a 3 km grid spacing child domain. A different set of simulations are produced using a single nest of 3 km grid spacing, nested directly inside the GFS data. The simulations are produced with the convection scheme switched on and off. The impact of a single versus multi-nest is found to be small in general, with slight differences in the location of high rainfall intensity. Switching off the convection schemes results in high rainfall intensity and increased detail in the simulations, including when a grid spacing of 9 km is used. Using a grid spacing of 3 km with the convection scheme on, results in a loss of detail in the simulations as well as lower rainfall amounts. The study shows a need for different configurations to be tested before an optimum configuration can be selected for operational forecasting. We recommend further tests with different synoptic forcing and convection schemes to be conducted to identify a suitable configuration for Namibia. Full article
(This article belongs to the Special Issue Precipitation: Forecasting and Climate Projections)
Show Figures

Figure 1

18 pages, 7823 KiB  
Article
West African Summer Monsoon Precipitation Variability as Represented by Reanalysis Datasets
by Kwesi Akumenyi Quagraine, Francis Nkrumah, Cornelia Klein, Nana Ama Browne Klutse and Kwesi Twentwewa Quagraine
Climate 2020, 8(10), 111; https://doi.org/10.3390/cli8100111 - 06 Oct 2020
Cited by 25 | Viewed by 5700
Abstract
Focusing on West Africa, a region riddled with in situ data scarcity, we evaluate the summer monsoon monthly rainfall characteristics of five global reanalysis datasets: ERA5, ERA-Interim, JRA-55, MERRA2, and NCEP-R2. Their performance in reproducing the West African monsoon (WAM) climatology, interannual variability, [...] Read more.
Focusing on West Africa, a region riddled with in situ data scarcity, we evaluate the summer monsoon monthly rainfall characteristics of five global reanalysis datasets: ERA5, ERA-Interim, JRA-55, MERRA2, and NCEP-R2. Their performance in reproducing the West African monsoon (WAM) climatology, interannual variability, and long-term trends for the main monsoon months are compared to gauge-only and satellite products. We further examine their ability to reproduce teleconnections between sea surface temperatures and monsoon rainfall. All reanalyses are able to represent the average rainfall patterns and seasonal cycle; however, regional biases can be marked. ERA5, ERA-Interim, and NCEP-R2 underestimate rainfall over areas of peak rainfall, with ERA5 showing the strongest underestimation, particularly over the Guinea Highlands. The meridional northward extent of the monsoon rainband is well captured by JRA-55 and MERRA2 but is too narrow in ERA-Interim, for which rainfall stays close to the Guinea Coast. Differences in rainband displacement become particularly evident when comparing strong El Niño Southern Oscillation (ENSO) years, where all reanalyses except ERA-Interim reproduce wetter Sahelian conditions for La Niña, while overestimating dry conditions at the coast except for NCEP-R2. Precipitation trends are not coherent across reanalyses and magnitudes are generally overestimated compared to observations, with only JRA-55 and NCEP-R2 displaying the expected positive trend in the Sahel. ERA5 generally outperforms ERA-Interim, highlighting clear improvements over its predecessor. Ultimately, we find the strengths of reanalyses to strongly vary across the region. Full article
Show Figures

Figure 1

13 pages, 3751 KiB  
Article
New Data Center Performance Index: Perfect Design Data Center—PDD
by Alexandre F. Santos, Pedro D. Gaspar and Heraldo J. L. de Souza
Climate 2020, 8(10), 110; https://doi.org/10.3390/cli8100110 - 04 Oct 2020
Cited by 9 | Viewed by 3797
Abstract
Data Centers (DC) are specific buildings that require large infrastructures to store all the information needed by companies. All data transmitted over the network is stored on CDs. By the end of 2020, Data Centers will grow 53% worldwide. There are methodologies that [...] Read more.
Data Centers (DC) are specific buildings that require large infrastructures to store all the information needed by companies. All data transmitted over the network is stored on CDs. By the end of 2020, Data Centers will grow 53% worldwide. There are methodologies that measure the efficiency of energy consumption. The most used metric is the Power Usage Effectiveness (PUE) index, but it does not fully reflect efficiency. Three DC’s located at the cities of Curitiba, Londrina and Iguaçu Falls (Brazil) with close PUE values, are evaluated in this article using the Energy Usage Effectiveness Design (EUED) index as an alternative to the current method. EUED uses energy as a comparative element in the design phase. Infrastructure consumption is the sum of energy with Heating, Ventilating and Air conditioning (HVAC) equipment, equipment, lighting and others. The EUED values obtained were 1.245 (kWh/yr)/(kWh/yr), 1.313 (kWh/yr)/(kWh/yr) and 1.316 (kWh/yr)/(kWh/yr) to Curitiba, Londrina and Iguaçu Falls, respectively. The difference between the EUED and the PUE Constant External Air Temperature (COA) is 16.87% for Curitiba, 13.33% for Londrina and 13.30% for Iguaçu Falls. The new Perfect Design Data center (PDD) index prioritizes efficiency in increasing order is an easy index to interpret. It is a redefinition of EUED, given by a linear equation, which provides an approximate result and uses a classification table. It is a decision support index for the location of a Data Center in the project phase. Full article
Show Figures

Graphical abstract

21 pages, 4920 KiB  
Article
Potential Effects of Climate and Human Influence Changes on Range and Diversity of Nine Fabaceae Species and Implications for Nature’s Contribution to People in Kenya
by Risper Nyairo and Takashi Machimura
Climate 2020, 8(10), 109; https://doi.org/10.3390/cli8100109 - 03 Oct 2020
Cited by 8 | Viewed by 4124
Abstract
Climate and land-use changes are the main drivers of species distribution. On the basis of current and future climate and socioeconomic scenarios, species range projections were made for nine species in the Fabaceae family. Modeled species have instrumental and relational values termed as [...] Read more.
Climate and land-use changes are the main drivers of species distribution. On the basis of current and future climate and socioeconomic scenarios, species range projections were made for nine species in the Fabaceae family. Modeled species have instrumental and relational values termed as nature’s contribution to people (NCP). For each species, five scenarios were analyzed resulting in 45 species range maps. Representative concentration pathway (RCP) 4.5 and three shared socioeconomic pathways (SSPs 1, 2, and 3) were used in the analysis. Species ranges under these scenarios were modeled using MaxEnt; a niche modeling software that relates species occurrence with environmental variables. Results were used to compute species richness and evenness based on Shannon’s diversity Index. Results revealed a mix of range expansion and contraction for the modeled species. The findings highlighted which species may remain competitive in an urbanized future and which ones are detrimentally affected by climate. Parts of the country where species abundances are likely to change due to climate and socioeconomic changes were identified. Management of species will be required in people-dominated landscapes to maintain interactions between nature and society, while avoiding natural resource degradation and loss of NCP. Full article
(This article belongs to the Special Issue The Interaction of Climate Change with Landscape and Environment)
Show Figures

Figure 1

21 pages, 2676 KiB  
Article
Selection of Effective GCM Bias Correction Methods and Evaluation of Hydrological Response under Future Climate Scenarios
by Yaogeng Tan, Sandra M. Guzman, Zengchuan Dong and Liang Tan
Climate 2020, 8(10), 108; https://doi.org/10.3390/cli8100108 - 30 Sep 2020
Cited by 17 | Viewed by 3622
Abstract
Global climate change is presenting a variety of challenges to hydrology and water resources because it strongly affects the hydrologic cycle, runoff, and water supply and demand. In this study, we assessed the effects of climate change scenarios on hydrological variables (i.e., evapotranspiration [...] Read more.
Global climate change is presenting a variety of challenges to hydrology and water resources because it strongly affects the hydrologic cycle, runoff, and water supply and demand. In this study, we assessed the effects of climate change scenarios on hydrological variables (i.e., evapotranspiration and runoff) by linking the outputs from the global climate model (GCM) with the Soil and Water Assessment Tool (SWAT) for a case study in the Lijiang River Basin, China. We selected a variety of bias correction methods and their combinations to correct the lower resolution GCM outputs of both precipitation and temperature. Then, the SWAT model was calibrated and validated using the observed flow data and corrected historical GCM with the optimal correction method selected. Hydrological variables were simulated using the SWAT model under emission scenarios RCP2.6, RCP4.5, and RCP8.5. The results demonstrated that correcting methods have a positive effect on both daily precipitation and temperature, and a hybrid method of bias correction contributes to increased performance in most cases and scenarios. Based on the bias corrected scenarios, precipitation annual average, temperature, and evapotranspiration will increase. In the case of precipitation and runoff, projection scenarios show an increase compared with the historical trends, and the monthly distribution of precipitation, evapotranspiration, and runoff shows an uneven distribution compared with baseline. This study provides an insight on how to choose a proper GCM and bias correction method and a helpful guide for local water resources management. Full article
Show Figures

Figure 1

15 pages, 5294 KiB  
Article
Frequency Associations between East Asian Jet Streams and the Temperature over the Barents–Kara Sea Region/Arctic Oscillation in Winter
by Yuefeng Li, Yuxiang Zhu and Wei Song
Climate 2020, 8(10), 107; https://doi.org/10.3390/cli8100107 - 29 Sep 2020
Viewed by 2013
Abstract
The frequency associations between jet streams over East Asia and the Arctic key temperature at 2 m (AKT2m) in the Barents–Kara Sea region (40°–75° E, 66°–82° N) and the Arctic Oscillation in winter are investigated using continuous wavelet transform, cross-wavelet transform, and wavelet [...] Read more.
The frequency associations between jet streams over East Asia and the Arctic key temperature at 2 m (AKT2m) in the Barents–Kara Sea region (40°–75° E, 66°–82° N) and the Arctic Oscillation in winter are investigated using continuous wavelet transform, cross-wavelet transform, and wavelet coherence. The cross-wavelet transforms between the AKT2m/Arctic Oscillation and the East Asian polar front jet stream (EAPJ) suggest that the EAPJ is closely related to the AKT2m and Arctic Oscillation on an interannual (3–5-year band) timescale, but the variation in the phase angle denotes a complex frequency connection between the EAPJ and Arctic Oscillation. The squared wavelet coherence suggests that weakening of the EAPJ is associated with the rise in AKT2m during the period of abrupt climate change in East Asia. The EAPJ contains more forced components from the Arctic than the East Asian subtropical jet stream. By comparison, the relationship between AKT2m and the EAPJ is closer than that between the Arctic Oscillation and EAPJ, especially during the period of abrupt climate change in East Asia. This suggests that the EAPJ serves as a bridge for Arctic warming to affect the weather and climate over East Asia in winter. By contrast, the Arctic Oscillation does not play an important part, although it also contains information about the Arctic. Full article
(This article belongs to the Section Climate and Environment)
Show Figures

Figure 1

25 pages, 2108 KiB  
Article
Assessing the Adaptive Capacity of Households to Climate Change in the Central Rift Valley of Ethiopia
by Demamu Mesfin, Belay Simane, Abrham Belay, John W. Recha and Ute Schmiedel
Climate 2020, 8(10), 106; https://doi.org/10.3390/cli8100106 - 29 Sep 2020
Cited by 15 | Viewed by 4902
Abstract
This paper explores the different components of the adaptive capacity of households in the Central Rift Valley (CRV) of Ethiopia and quantifies their relative contributions. The data were derived from a survey of 413 households randomly selected from four Kebeles (the smallest government [...] Read more.
This paper explores the different components of the adaptive capacity of households in the Central Rift Valley (CRV) of Ethiopia and quantifies their relative contributions. The data were derived from a survey of 413 households randomly selected from four Kebeles (the smallest government administrative units) in the CRV. The adaptive capacity of the households was assessed using the Local Adaptive Capacity (LAC) framework and measured in terms of both aggregate and composite indices, with sixty indicators distributed across five major components and subcomponents. The index score for major components shows that intangible variables such as institutions and entitlements, knowledge and information, and innovation contributed to adaptive capacity better than decision–making and governance and asset–base. The composite indices for sub–components showed that the contribution of woodlands to adaptive capacity was positive and superior to other natural assets. Grazing land was the next best contributor, while farmland and water resources made a much lower contribution. The findings of this study are useful to better understand the nature of adaptive capacity and its components at the household level. This study suggests the need for an integrated assessment and enhancement of adaptive capacity with all its components rather than focusing only on asset possession as an indicator of adaptive capacity. Full article
Show Figures

Figure 1

20 pages, 3623 KiB  
Article
Expected Impacts of Mixing European Beech with Silver Fir on Regional Air Quality and Radiation Balance
by Boris Bonn, Jürgen Kreuzwieser, Ruth-Kristina Magh, Heinz Rennenberg, Dirk Schindler, Dominik Sperlich, Raphael Trautmann, Rasoul Yousefpour and Rüdiger Grote
Climate 2020, 8(10), 105; https://doi.org/10.3390/cli8100105 - 26 Sep 2020
Cited by 3 | Viewed by 3335
Abstract
The anticipated climate change during the next decades is posing crucial challenges to ecosystems. In order to decrease the vulnerability of forests, introducing tree species’ mixtures are a viable strategy, with deep-rooting native Silver fir (Abies alba) being a primary candidate [...] Read more.
The anticipated climate change during the next decades is posing crucial challenges to ecosystems. In order to decrease the vulnerability of forests, introducing tree species’ mixtures are a viable strategy, with deep-rooting native Silver fir (Abies alba) being a primary candidate for admixture into current pure stands of European beech (Fagus sylvatica) especially in mountainous areas. Such a change in forest structure also has effects on the regional scale, which, however, have been seldomly quantified. Therefore, we measured and modeled radiative balance and air chemistry impacts of admixing Silver fir to European beech stands, including changes in biogenic volatile organic compound emissions. An increased fraction of Silver fir caused a smaller albedo and a (simulated) larger evapotranspiration, leading to a dryer and warmer forest. While isoprene emission was negligible for both species, sesquiterpene and monoterpene emissions were larger for fir than for beech. From these differences, we derived that ozone concentration as well as secondary organic aerosols and cloud condensation nuclei would increase regionally. Overall, we demonstrated that even a relatively mild scenario of tree species change will alter the energy balance and air quality in a way that could potentially influence the climate on a landscape scale. Full article
Show Figures

Graphical abstract

21 pages, 3239 KiB  
Article
Modeling and Analysis of Barriers to Climate Change Adaptation in Tehran
by Behnam Ghasemzadeh and Ayyoob Sharifi
Climate 2020, 8(10), 104; https://doi.org/10.3390/cli8100104 - 24 Sep 2020
Cited by 10 | Viewed by 3851
Abstract
Since the impacts of climate change will last for many years, adaptation to this phenomenon should be prioritized in urban management plans. Although Tehran, the capital of Iran, has been subject to a variety of climate change impacts in recent years, appropriate adaptation [...] Read more.
Since the impacts of climate change will last for many years, adaptation to this phenomenon should be prioritized in urban management plans. Although Tehran, the capital of Iran, has been subject to a variety of climate change impacts in recent years, appropriate adaptation measures to address them are yet to be taken. This study primarily aims to categorize the barriers to climate change adaptation in Tehran and analyze the way they interact with each other. The study was done in three steps: first, the focus group discussion (FGD) method was used to identify the barriers; next, the survey and the structural equation modeling (SEM) were used to validate the barriers, identify their importance, and examine their possible inter-relationships; and finally, the interpretive structural modeling (ISM) was applied to categorize and visualize the relationships between the barriers. Results show that barriers related to the ‘structure and culture of research’, ‘laws and regulations’, and ‘planning’ belong to the cluster of independent barriers and are of greater significance. The ‘social’ barrier and barriers related to ‘resources and resource management’ are identified as dependent barriers and are of lesser importance. Barriers related to ‘governance’, ‘awareness’, ‘education and knowledge’, ‘communication and interaction’, and ‘economy’ are identified at the intermediate cluster. The findings of this study can provide planners and decision makers with invaluable insights as to how to develop strategies for climate change adaptation in Tehran. Despite the scope of the study being confined to Tehran, its implications go far beyond this metropolis. Full article
Show Figures

Figure 1

23 pages, 5127 KiB  
Article
Performance Evaluation of Satellite-Based Rainfall Products over Nigeria
by Kingsley N. Ogbu, Nina Rholan Hounguè, Imoleayo E. Gbode and Bernhard Tischbein
Climate 2020, 8(10), 103; https://doi.org/10.3390/cli8100103 - 24 Sep 2020
Cited by 11 | Viewed by 4318
Abstract
Understanding the variability of rainfall is important for sustaining rain-dependent agriculture and driving the local economy of Nigeria. Paucity and inadequate rain gauge network across Nigeria has made satellite-based rainfall products (SRPs), which offer a complete spatial and consistent temporal coverage, a better [...] Read more.
Understanding the variability of rainfall is important for sustaining rain-dependent agriculture and driving the local economy of Nigeria. Paucity and inadequate rain gauge network across Nigeria has made satellite-based rainfall products (SRPs), which offer a complete spatial and consistent temporal coverage, a better alternative. However, the accuracy of these products must be ascertained before use in water resource developments and planning. In this study, the performances of Climate Hazards Group Infrared Precipitation with Station data (CHIRPS), Precipitation estimation from Remotely Sensed Information using Artificial Neural Networks–Climate Data Record (PERSIANN-CDR), and Tropical Applications of Meteorology using SATellite data and ground-based observations (TAMSAT), were evaluated to investigate their ability to reproduce long term (1983–2013) observed rainfall characteristics derived from twenty-four (24) gauges in Nigeria. Results show that all products performed well in terms of capturing the observed annual cycle and spatial trends in all selected stations. Statistical evaluation of the SRPs performance show that CHIRPS agree more with observations in all climatic zones by reproducing the local rainfall characteristics. The performance of PERSIANN and TAMSAT, however, varies with season and across the climatic zones. Findings from this study highlight the benefits of using SRPs to augment or fill gaps in the distribution of local rainfall data, which is critical for water resources planning, agricultural development, and policy making. Full article
(This article belongs to the Section Climate and Environment)
Show Figures

Figure 1

19 pages, 6152 KiB  
Article
Impacts of Climate Change on the Water Resources of the Kunduz River Basin, Afghanistan
by Noor Ahmad Akhundzadah, Salim Soltani and Valentin Aich
Climate 2020, 8(10), 102; https://doi.org/10.3390/cli8100102 - 23 Sep 2020
Cited by 8 | Viewed by 6577
Abstract
The Kunduz River is one of the main tributaries of the Amu Darya Basin in North Afghanistan. Many communities live in the Kunduz River Basin (KRB), and its water resources have been the basis of their livelihoods for many generations. This study investigates [...] Read more.
The Kunduz River is one of the main tributaries of the Amu Darya Basin in North Afghanistan. Many communities live in the Kunduz River Basin (KRB), and its water resources have been the basis of their livelihoods for many generations. This study investigates climate change impacts on the KRB catchment. Rare station data are, for the first time, used to analyze systematic trends in temperature, precipitation, and river discharge over the past few decades, while using Mann–Kendall and Theil–Sen trend statistics. The trends show that the hydrology of the basin changed significantly over the last decades. A comparison of landcover data of the river basin from 1992 and 2019 shows significant changes that have additional impact on the basin hydrology, which are used to interpret the trend analysis. There is considerable uncertainty due to the data scarcity and gaps in the data, but all results indicate a strong tendency towards drier conditions. An extreme warming trend, partly above 2 °C since the 1960s in combination with a dramatic precipitation decrease by more than −30% lead to a strong decrease in river discharge. The increasing glacier melt compensates the decreases and leads to an increase in runoff only in the highland parts of the upper catchment. The reduction of water availability and the additional stress on the land leads to a strong increase of barren land and a reduction of vegetation cover. The detected trends and changes in the basin hydrology demand an active management of the already scarce water resources in order to sustain water supply for agriculture and ecosystems in the KRB. Full article
(This article belongs to the Special Issue Climate Change and Food Insecurity)
Show Figures

Figure 1

Previous Issue
Next Issue
Back to TopTop