Article

Modeling and Analysis of Barriers to Climate Change Adaptation in Tehran

by
Behnam Ghasemzadeh
1 and
Ayyoob Sharifi
2,3,4,*
1
PhD in Urban Planning, Science and Research Branch, Islamic Azad University, Tehran 19395/1495, Iran
2
Graduate School of Humanities and Social Sciences, Hiroshima University, Higashi-Hiroshima 739–8530, Japan
3
Graduate School of Advanced Science and Engineering, Hiroshima University, Higashi-Hiroshima 739–8530, Japan
4
Network for Education and Research on Peace and Sustainability (NERPS), Hiroshima University, Higashi-Hiroshima 739–8530, Japan
*
Author to whom correspondence should be addressed.
Climate 2020, 8(10), 104; https://doi.org/10.3390/cli8100104
Submission received: 18 August 2020 / Revised: 16 September 2020 / Accepted: 21 September 2020 / Published: 24 September 2020

Abstract

:
Since the impacts of climate change will last for many years, adaptation to this phenomenon should be prioritized in urban management plans. Although Tehran, the capital of Iran, has been subject to a variety of climate change impacts in recent years, appropriate adaptation measures to address them are yet to be taken. This study primarily aims to categorize the barriers to climate change adaptation in Tehran and analyze the way they interact with each other. The study was done in three steps: first, the focus group discussion (FGD) method was used to identify the barriers; next, the survey and the structural equation modeling (SEM) were used to validate the barriers, identify their importance, and examine their possible inter-relationships; and finally, the interpretive structural modeling (ISM) was applied to categorize and visualize the relationships between the barriers. Results show that barriers related to the ‘structure and culture of research’, ‘laws and regulations’, and ‘planning’ belong to the cluster of independent barriers and are of greater significance. The ‘social’ barrier and barriers related to ‘resources and resource management’ are identified as dependent barriers and are of lesser importance. Barriers related to ‘governance’, ‘awareness’, ‘education and knowledge’, ‘communication and interaction’, and ‘economy’ are identified at the intermediate cluster. The findings of this study can provide planners and decision makers with invaluable insights as to how to develop strategies for climate change adaptation in Tehran. Despite the scope of the study being confined to Tehran, its implications go far beyond this metropolis.

1. Introduction

Hosting more than half of the world population, cities are exposed to the threats and consequences of climate change. While many countries and cities are increasingly developing and implementing mitigation plans, it is argued that, due to historical greenhouse gas emissions, climate change impacts cannot be avoided [1,2]. There is also strong evidence suggesting that climate change will increase intensity and frequency of adverse events that may threaten urban lives and livelihoods [3]. Accordingly, it would not be a stretch to claim that climate change is the most outstanding environmental challenge of this era [4]. Among others, flash floods, storms, hails, tropical storms, rising sea levels, shrinking arctic sea ice, and heat and cold waves are induced and/or intensified by climate change [5]. Accordingly, recognizing the potentially dire consequences of these climatic events, cities around the globe are increasingly taking a more active role in developing plans and policies for climate change adaptation [6,7].
Planning for climate change adaptation is among the most complex challenges confronting many cities around the world [8]. There is a growing consensus that adaptation to climate change impacts is now a necessity for cities [9,10]. Although, understanding this need, many cities have made significant progress in this regard and have developed adaptation strategies, climate change adaptation is yet to be at the top of city governors and planners’ agenda, particularly in developing countries. Therefore, there is a need for more research to understand the underlying complexities and barriers to adaptation, provide effective responses to challenges, and identify opportunities for enhanced adaptation [9]. Overall, it can be said that although some progress has been made in finding a common language about climate change adaptation, the path is still fraught with many challenges when it comes to providing frameworks to identify and evaluate the adaptation actions and developing criteria to assess the progress towards adaptation [7,11].
Recognizing the need to better understand the challenges and barriers to adaptation, the literature on this topic has been expanding over the past few years. Existing literature provides useful information related to various barriers linked with governance, institutions, resources, finance, policies, communication, and culture [12]. Barrier in this context refers to any undesirable factor that may undermine efforts aimed at adaptation to climate change impacts. However, the existing literature is mainly focused on identifying barriers without analyzing their interrelations. Due to the space limit, only a brief summary is provided here. Biesbroek, et al. [13] conducted semi-structured interviews with policy makers and scientists in the field of climate change adaptation in different sectors and administrative levels to identify and categorize barriers. The main questions were: “(1) What barriers to adaptation can be identified from the literature? and (2) what do actors in the governance of adaptation experience as the most important barriers to adaptation?” Their study proposed seven clusters of adaptation barriers, of which the most important one was the “conflicting timescales”. Other clusters included: “conflicting interests, lack of financial resources, unclear division of tasks and responsibilities, uncertain societal costs and future benefits; and fragmentation within and between scales of governance”. The analysis indicated that the respondents’ position in the hierarchy affects the understanding of the barriers so that actors from the lower levels of government consider the barriers more serious than those in the higher levels.
Measham, et al. [14] tried to identify the barriers to adaptation in Sydney, Australia, in 2008. The data were gathered through in-depth interviews with 33 participants from three municipal councils of Mosman, Leichhardt, and Sutherland. The identified barriers were related to leadership, competing priorities, planning processes, information constraints, and institutional constraints. Among these, lack of information, lack of resources, and institutional constraints stood out. Lack of resources, in terms of skilled personnel and economic capacities, is also highlighted in a recent study of England’s coastal urban areas [15].
Similarly, in the San Francisco Bay Area, California, USA, Ekstrom and Moser [16] performed 43 interviews with key informants, observed public meetings relevant to climate change adaptation, and performed document analysis to identify barriers to climate change adaptation. The identified barriers were related to: “(1) institutions and governance, (2) attitudes, values, and motivations, (3) resources and funding, (4) politics, (5) leadership, (6) adaptation options/processes, (7) understanding, (8) science, (9) expertise, (10) communication, (11) personality issues, and (12) technology”.
Examining activities and processes in Norwegian municipalities, Amundsen, et al. [17] identified four key barriers to climate change adaptation at the municipal level, namely: “unfamiliarity with existing data on climate change, lack of concrete data, lack of local expertise for dealing with effects of climate change, and an unclear role for local governments when working with adaptation policies and measures.”
Some studies have only highlighted barriers related to the planning process. For instance, Rivera, et al. [18] stated that fragmentation in disaster risk management systems is a barrier to achieving integrated planning for climate change adaptation in Nicaragua. Taking a similar approach, Aylett [19] analyzed the challenges of climate change planning and implementation. The top 10 challenges identified in his study were: “lack of funding for implementation, competing priorities, lack of funding to hire sufficient staff, lack of staff or staff time, difficulty factoring climate change into infrastructure budgeting procedures, political focus on short-term goals, lack of understanding of local government responses, lack of understanding among staff, local government’s lack of jurisdiction over key policies areas, and difficulty mainstreaming climate change into existing departmental functions”.
In the same vein, Anguelovski, Chu and Carmin [8] analyzed three approaches to climate change adaptation in three cities of Quito, Surat, and Durban and found similar results. They also found that continued and strong leadership commitment and sustained stakeholder involvement are critical for effective climate change adaptation. Finally, analyzing a large geographical scale, Whitney and Ban [20] assessed the social-ecological barriers in coastal British Columbia and identified “Policy action, management understanding, management action, scientific research, policy understanding, and community uptake” as the major barriers.
What can be understood from this overview of the literature is that the barriers and their importance vary across cities and areas. This variation may arise from differences in socio-economic structures, as well as, differences in the nature of climate change threats that they are faced with. This indicates the need for more research to identify locally-specific barriers. Yet, despite such variations, lack of funding and financial resources, inadequate awareness and understanding, and institutional and governance barriers can serve as common themes linking all these studies together. This brief literature review also reveals that most studies have only identified the barriers; however, how all these barriers might interact with one another is far from clear and settled [7]. To fill this gap, by focusing on Tehran, the capital city of Iran, this study aims to contribute to the context-specific knowledge of adaptation barriers and to provide insights into potential interactions between them.
Iran has been subject to several impacts and consequences of climate change in recent years [21]. The capital city, Tehran, has been singled out as one of the most high-risk cities in Iran in terms of environmental challenges [22]. Environmental issues such as climate change and the necessity to scale up effective measures towards it are some of the challenges facing the urban management of Tehran more than ever. By some estimates, the worst is yet to come with Tehran’s average temperature projected to rise even further [21]. Tehran is located in a basin area surrounded by mountains, exposing it to acute air pollution and local climate change. Studies also suggest that Tehran is prone to climate change-induced events such as floods, sandstorms, unprecedented heat, and water scarcity [23,24]. Despite this, urban managers are yet to provide appropriate responses to these threats. The fact that there is a lack of research exploring barriers to climate change adaptation and analyzing the interrelationships between the barriers may have contributed to this issue. To our best understanding, there is only one study identifying barriers to climate change adaptation in Tehran [7]. To build on that study, here the barriers are further explored and possible interrelationships between them are also examined. The main objectives of this study are as follows: 1) to discuss the barriers to climate change adaptation in Tehran; 2) to examine the significance of different barriers; 3) to confirm the factor structure of the barriers using confirmatory factor analysis (CFA); 4) to analyze the interrelationships between the barriers using interpretive structural modeling (ISM); 5) to classify the barriers into various categories; and 6) to experimentally test the model using the ISM.

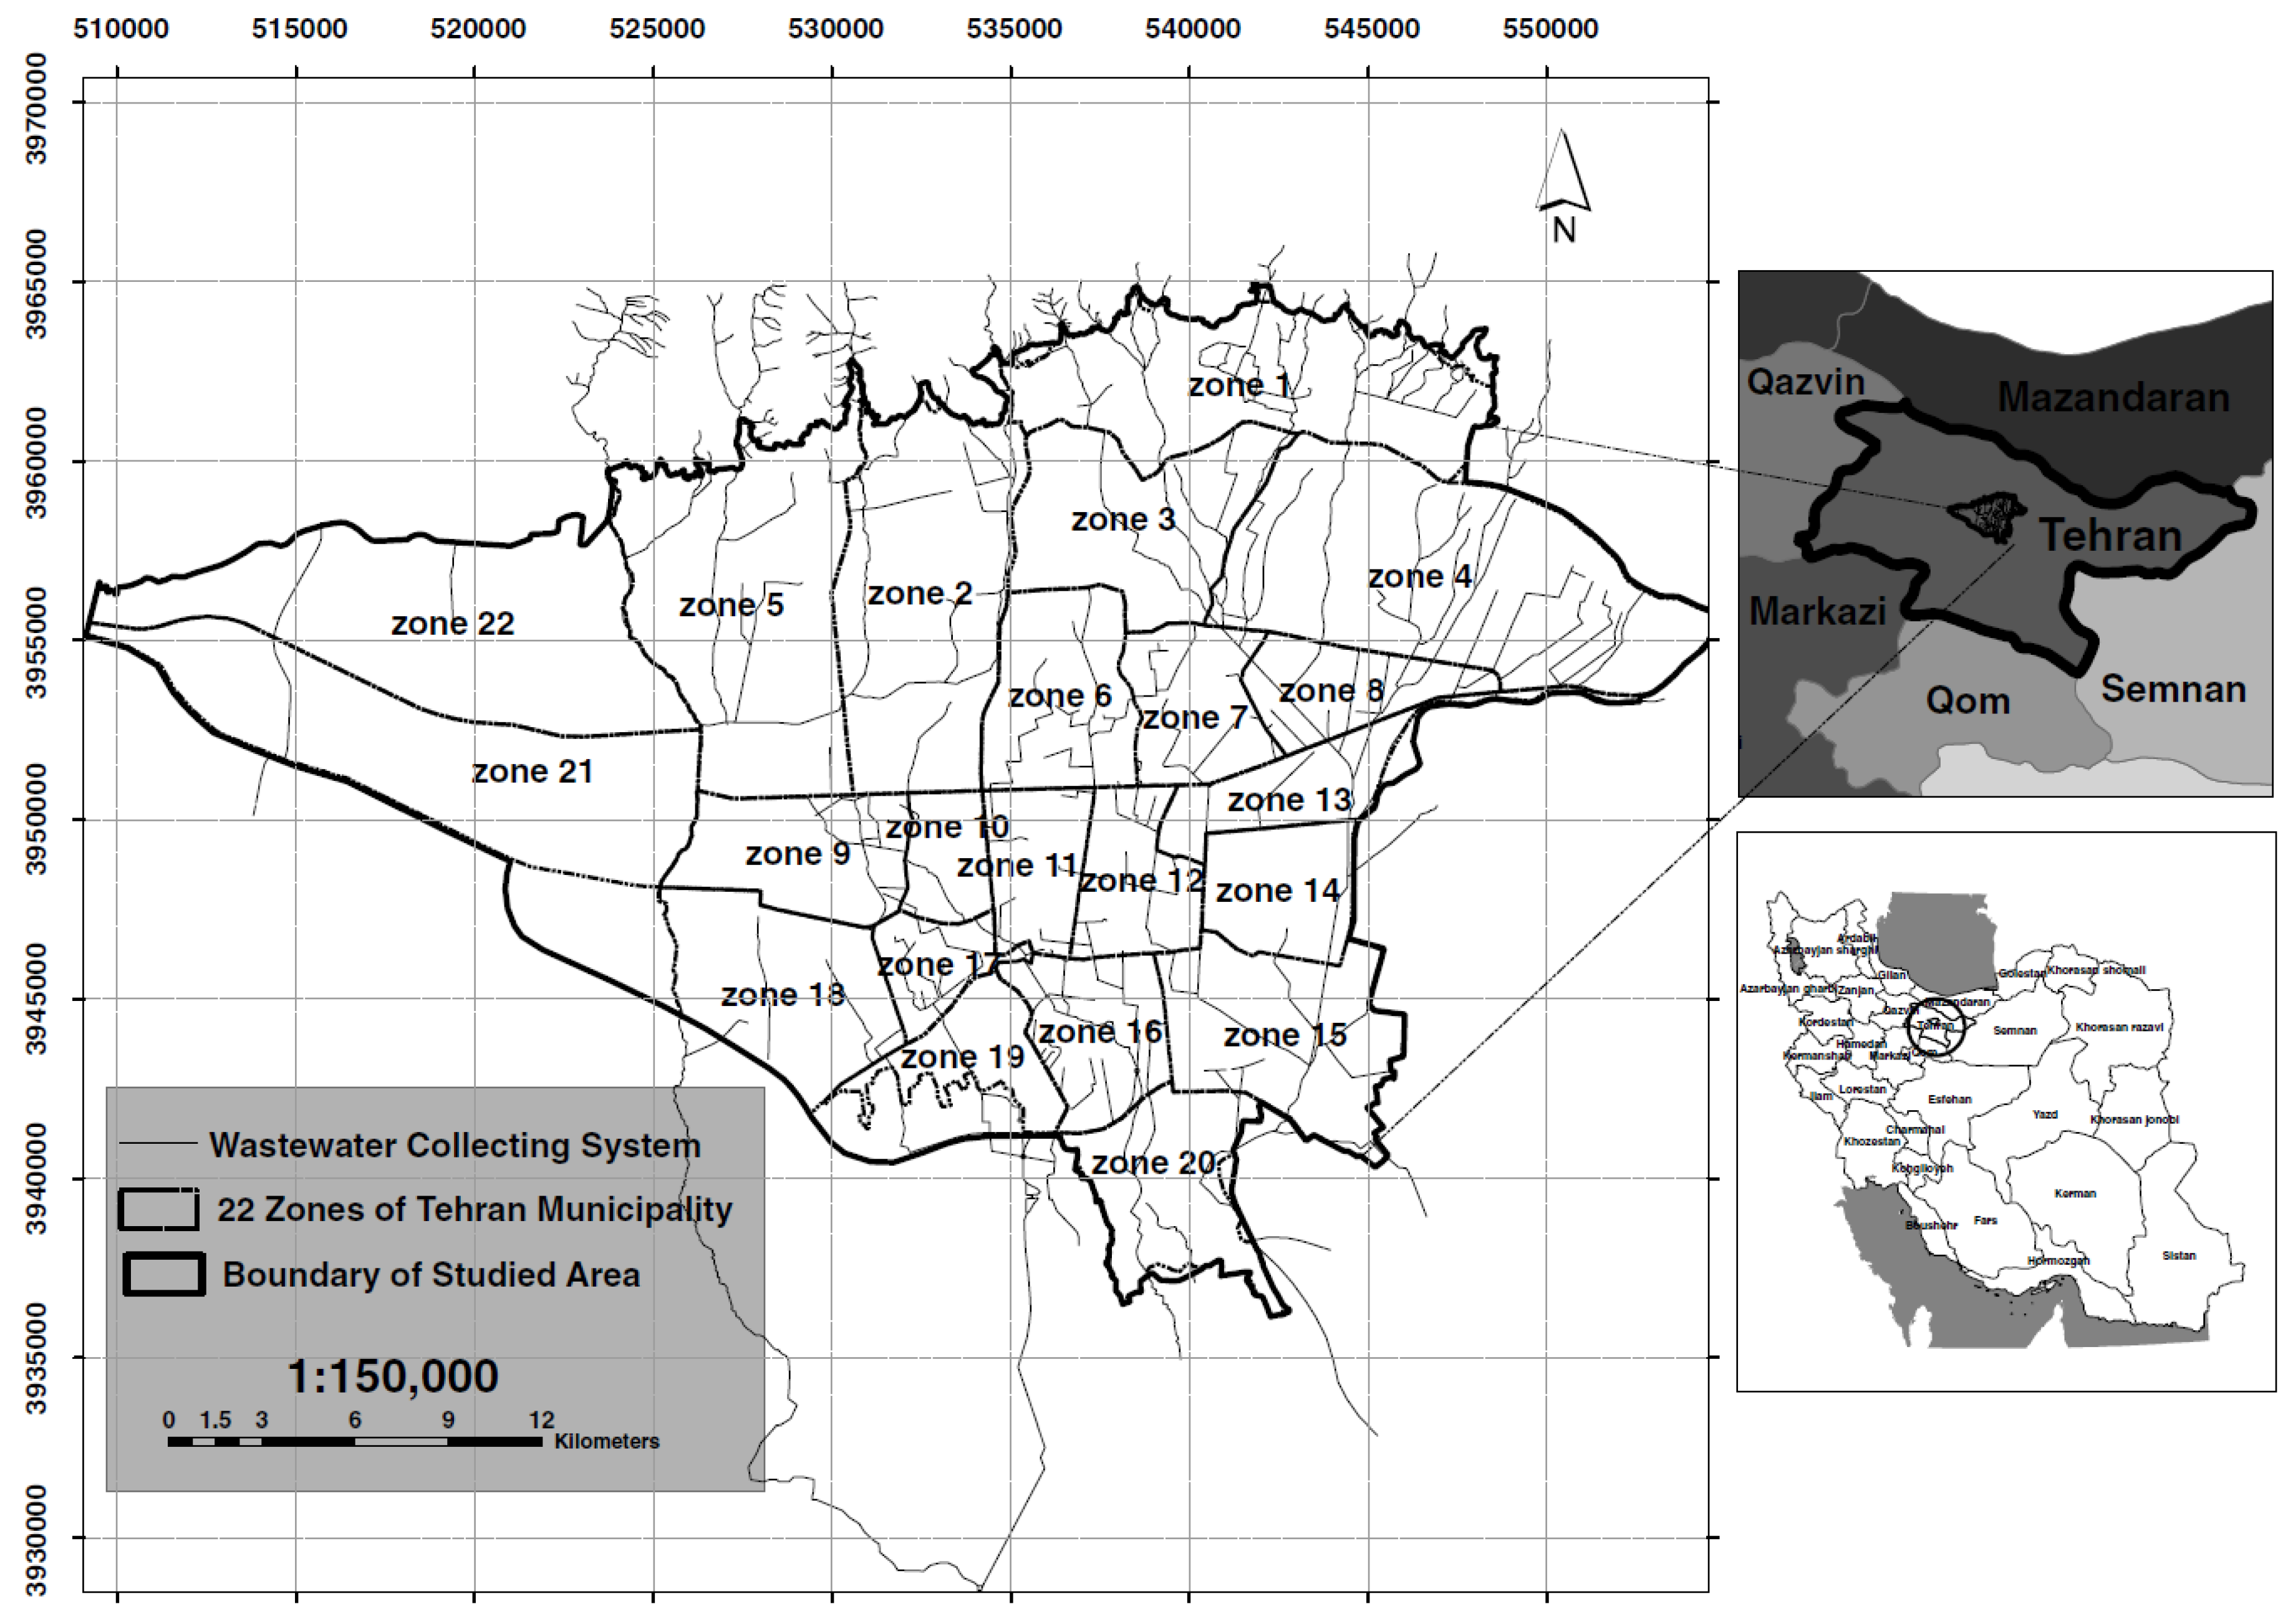
2. The Case Study Area

Tehran is located between 51°5′ and 51°37′ Eastern longitude and 35°32′ and 35°49′ Northern latitude [24]. It is the most populous city in Iran with a population of over 13 million people. Geographically, it touches Alborz mountains in the north and the plains of Shahriar and Varamin in the south [25]. Figure 1 shows the geographical location of Tehran [7].
Tehran also serves as the economic and political hub of the country. Additionally, characteristics such as diverse ethnic and cultural makeup due to massive migrations from all around the country; the existence of industrial zones, valuable historical buildings, and natural tourism attractions; and problems such as the inequitable access to utilities and opportunities in the city [26], make Tehran an ideal case for studying urban issues.
Tehran was selected as the subject of our study for the following reasons:
  • Due to the top-down nature of planning in Iran, Tehran is considered as a model city and therefore its policies are copied [27]. Therefore, the identification and analysis of the barriers in Tehran can also serve as a model for other cities.
  • Tehran is subject to both direct and indirect climate threats such as flash floods and extreme heat events. Such threats have caused significant damages over the past few years [28].
  • Low resilience of many districts of Tehran has been demonstrated in previous studies [29].

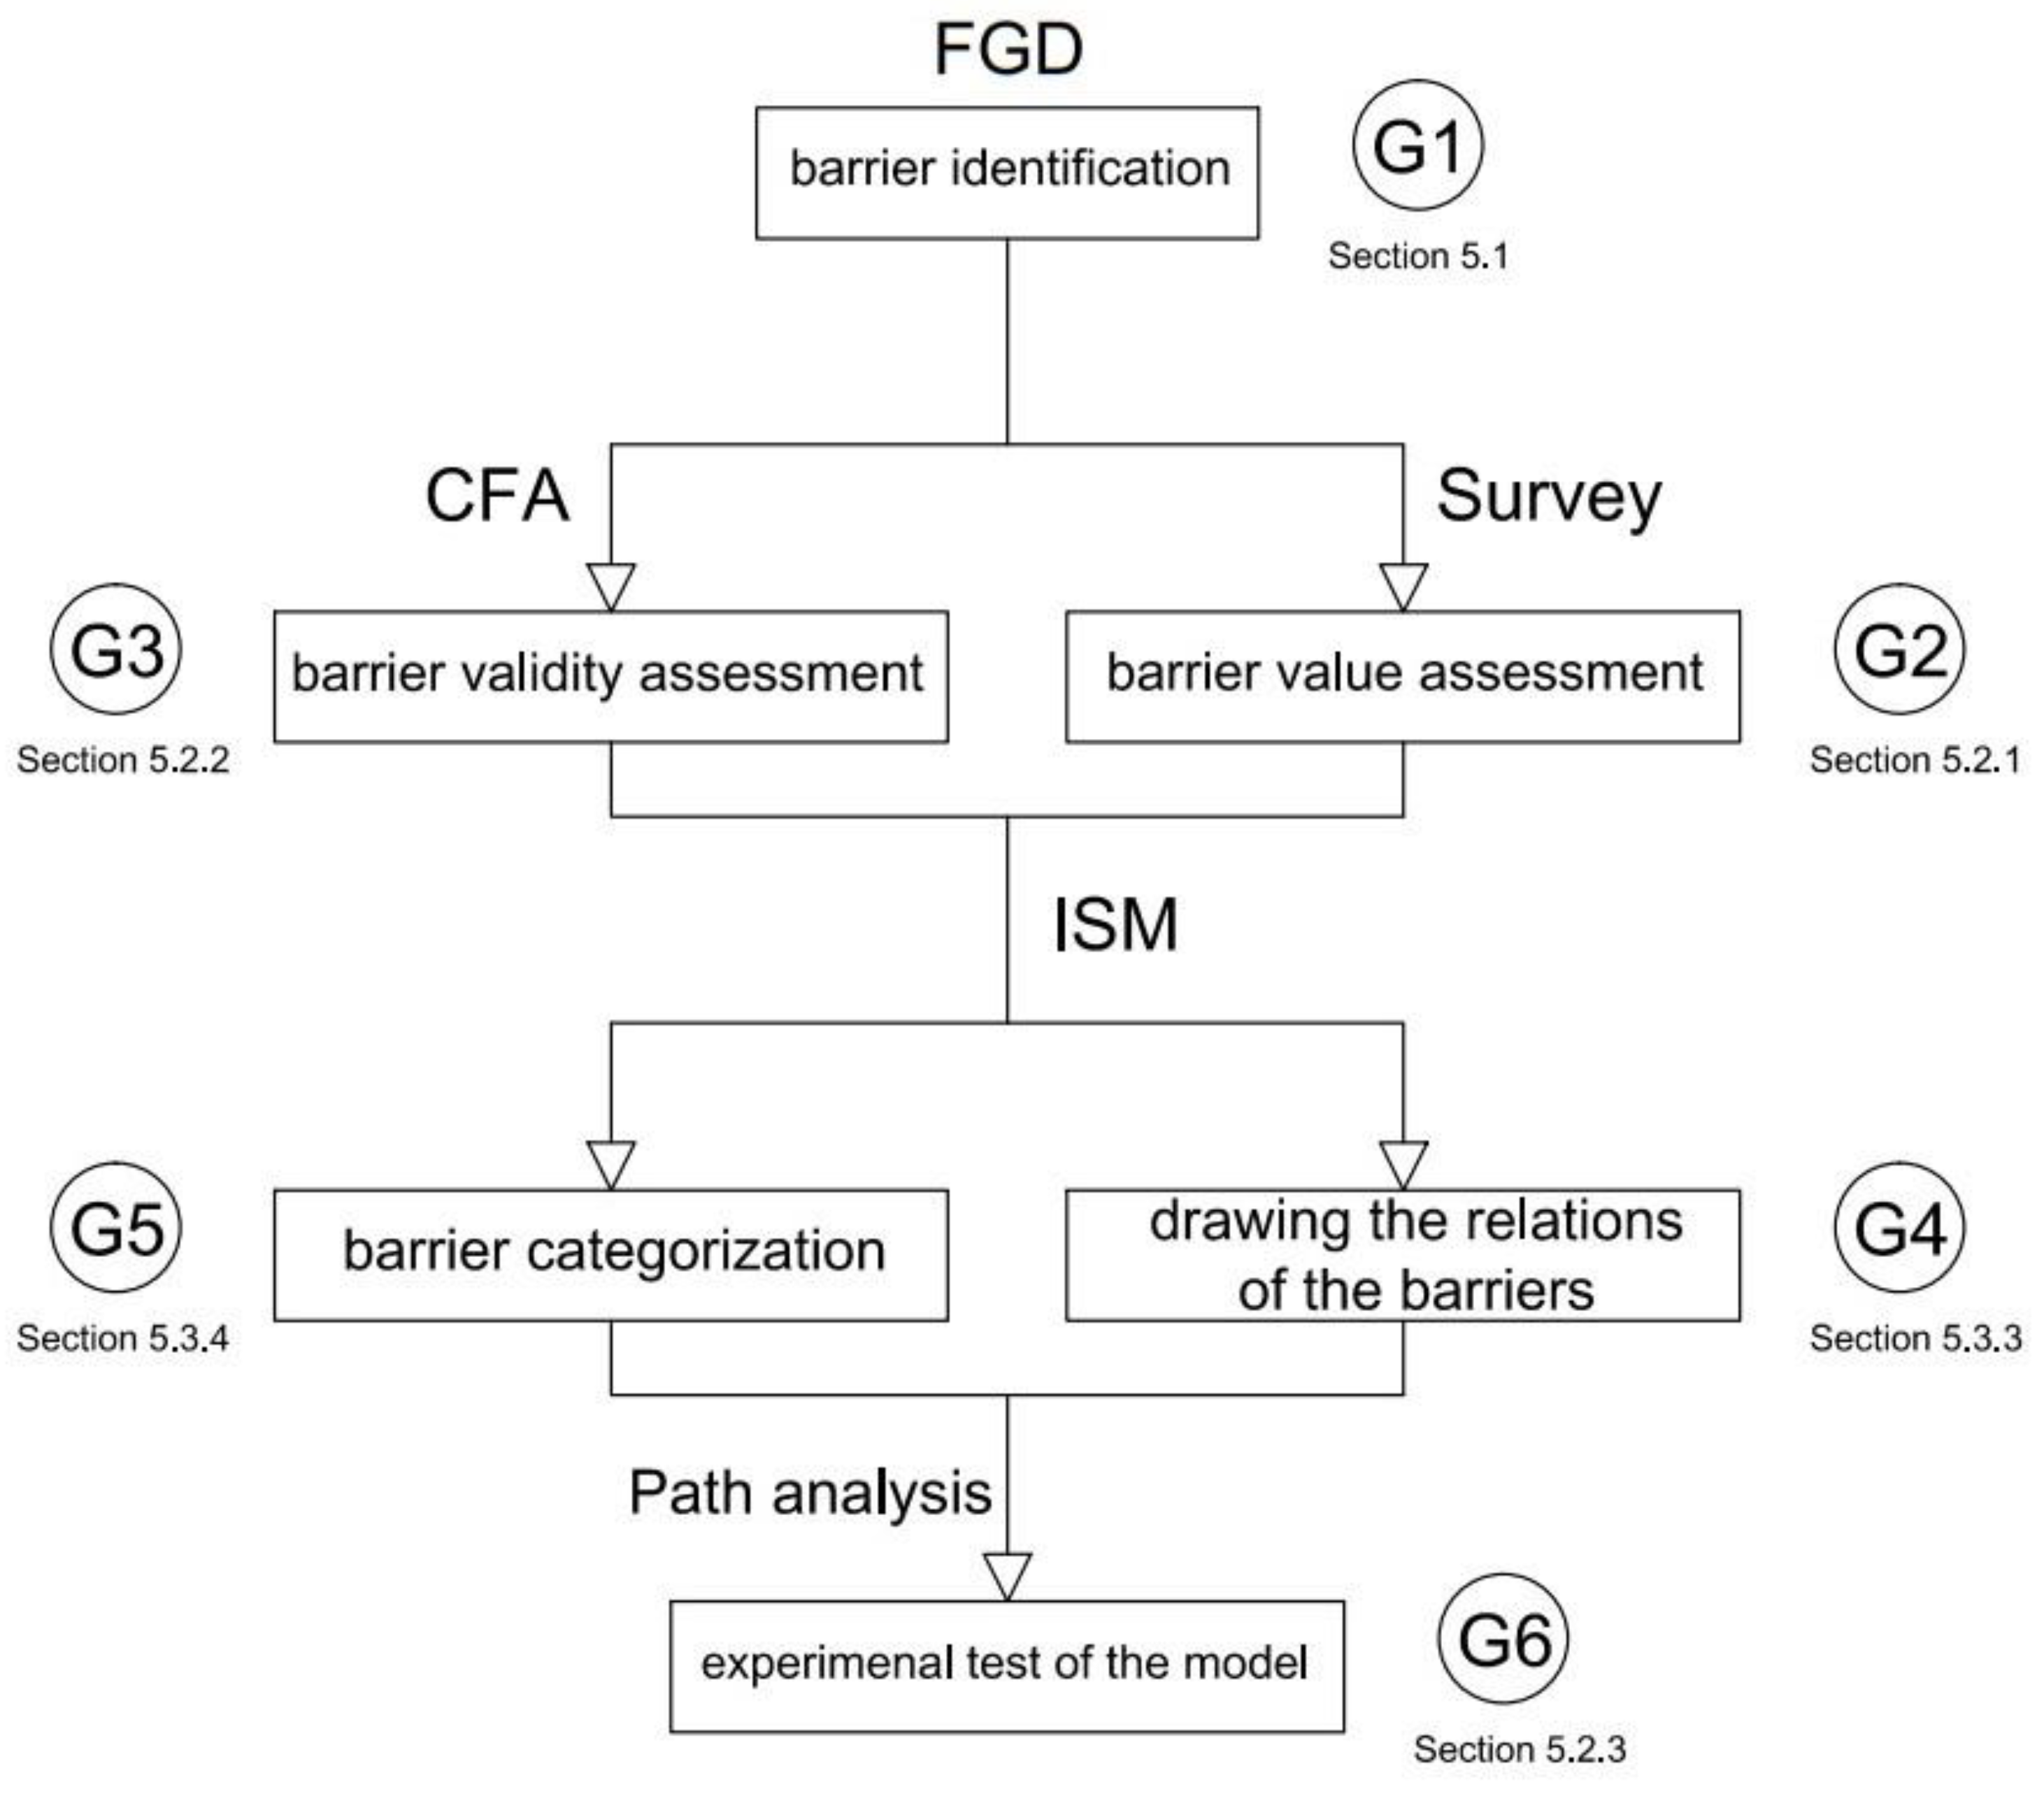
3. Materials and Methods

This study adopts a mixed-methods approach, including a focus group discussion (FGD) approach [7], a questionnaire-survey, interpretive structural modeling (ISM) approach, and CFA and path analysis approach to accomplish its objectives. An overview of the adopted methods and their correspondence to the research objectives is shown in Figure 2. These methods are separately discussed in the following sections.
The FGD was used to identify the barriers [7,31]. The survey method was used to assess the importance and validity of the identified variables. To this end, the importance of each barrier was first determined using the one-sample t-test. Their validity and reliability were then assessed using the CFA and Cronbach’s alpha [32,33]. The path analysis was also used to examine the causal relationships between the variables [34]. The ISM was applied to determine the hierarchical levels of the variables, to draw the structural model of the relations, and to categorize them into four groups of autonomous, independent, dependent, intermediate [35,36]. The final categorization of the barriers was based on their driving power and their level of dependence.

3.1. Step1: Identification of Barriers (FGD)

Barriers were identified in a qualitative research method that relied on FGDs [7]. Nine FGDs of 4 to 8 people were held where, overall, 59 experts participated in the process (specifically, one four-member FGD, three seven-member FGDs, three six-member FGDs, and two eight-member FGDs). According to the literature, this size range allows distilling diverse opinions from the participants in an effective and efficient manner [31]. The experts represented diverse fields ranging from architecture, urban design, urban economy, urban development, urban sociology, urban environment, and urban planning. They were selected using the purposeful sampling method [37], and on the basis of their age, education and technical, scientific, and executive backgrounds. Participants were selected based on the authors’ knowledge about their expertise and the aims of the study. As will be explained in the remainder of this section, sample size was determined based on the state of progress in achieving the aims of the activity. In other words, the activity continued until reaching data saturation. Table S1 of the Supplementary material shows the characteristics of the FGD participants [7].
The FGDs were held at the Urban Development and Architecture Research Center of the Science and Research Branch of Islamic Azad University. The time and place of the FGDs were chosen in consultation with the participants. All FGDs were held in the morning and conducted in Persian as the official language of the country. Each session lasted for about 90 to 120 minutes. At the beginning of each session, after introducing the researchers to the participants, the process of the FGD and the objectives of the study were explained to them. The interview questions were semi-structured and developed based on expert opinions and literature review. The questions were assessed in terms of content validity and approved by a panel of experts with academic degrees in related fields. The discussions began with the general and open question of “What do you know about climate change?” Then, the opinions expressed determined the course of the interview. When discussions seemed to veer off track, some more direct and relevant questions were asked by the facilitator to put them back on track. Some explorative questions, such as “please provide some examples,” were also asked to deepen the discussions. Further, some other techniques were also used to elicit the highest possible amount of information from the participants; some examples of such techniques were providing feedback, asking for further clarification and elaboration, and the use of non-verbal language [7].
The questions were asked by the first author as the interviewer and all discussions and non-verbal communications were noted by the two trained facilitators acting as transcribers and observers. Discussions were recorded by a digital voice recorder. The interviewer did his best to ensure that all participants contributed to the discussions and the facilitators noted the discussion process and the non-verbal behaviors such as movements, postures, gestures, silence, tone of speech, emphasis, eye contacts, and changes in facial expression. To further consolidate and substantiate the accuracy of the data, at the end of each FGD session, the above-mentioned key issues were reviewed so that the participants could confirm what they meant and modify the statements, if needed. This respondent validation was performed with the aim of increasing the internal validity of the research. After each FGD session, the recordings were transcribed in the MS Word 2010 program and checked with the field notes made during the FGDs [7].
Data collection continued until reaching data saturation, which is an indicator of the adequacy of sample size in qualitative research. Data saturation is reached when: a) it seems that no new ideas will be identified in subsequent interviews; b) the discussions have been rich enough; c) the relations between the ideas are in place [38,39]. In this research, data saturation was reached after 7 sessions of FGDs, but for good measure, two more sessions were held, which generated no new data.
The steps involved in the data analysis were as follows: debriefing the facilitators and the field notes, listening to the recorded voices and transcribing them, comparing the transcriptions with the notes of the FGD, and considering the non-verbal observations [40].
Data analysis and coding were performed manually, using the inductive content analysis method [41]. This method is based on not separating the data collection from the analysis so that the analysis is performed simultaneously with the data collection. In other words, after conducting the first interview, the transcribed text of the interview was read carefully in order to formulate categories of barriers to climate change adaptation. While reading the first text passage, whenever material that can be considered as a barrier was found, a barrier category was constructed (using a short sentence as a label to represent the barrier category). As the next passage was examined, it was checked whether the barrier that is discussed falls under the previously defined barrier category or should be categorized as a distinct one. This way, a set of barrier categories was developed upon finishing the coding process for the first round of the survey. Following this, the next survey was performed, and similar procedures were taken for coding and barrier categorization. In other words, new barrier categories were only constructed when the identified barriers could not be subsumed to one of the previously formulated barrier categories. This process was continued for each interview until data saturation was reached. In other words, the categorization was finalized when additional interviews did not result in the formulation of new barrier categories.
In the Supplementary material, measures taken to comply with ethical issues, when conducting the FGDs, have been explained.

3.2. Step2: Validation of the Barriers (Survey)

After the identification of the barriers through FGDs, they were validated by a questionnaire-based survey. The purposes of the survey were: (1) identifying the less important barriers, (2) assessing the construct validity of the items through the confirmatory factor analysis, and (3) studying the effects of the barriers on each other. To do so, a self-administered questionnaire was developed which consisted of 31 items related to the 9 main barriers identified by the FGDs. In the first part of the questionnaire, respondents’ personal information was recorded, namely their field of study, age, gender, education level, work experience. Descriptive statistics related to the 200 respondents are presented in Table S2 of the Supplementary material. The procedures related to the sample size selection and also the way the survey was administered are explained later in this section.
In the second part, they were asked to make their own judgments on the importance of the barriers on the basis of their experience in climate change adaptation in Tehran’s urban management activities. The questions were multiple-choice and had been designed based on a five-point Likert scale, ranging from very high to very low [42]. The initial questionnaire was sent to three municipal experts and three academics of the related domain for their likely revision. The experts’ suggestions were incorporated in the modified/final questionnaire to improve the understanding of the question statements.
Once verbal consent was obtained from the respondents, the questionnaires were delivered or sent to them by email. Respondents were selected from the pool of experts who had sufficient experience in research and administrative fields related to climate change adaptation. To the best of the authors’ knowledge, there is no consensus about the required sample size for confirmatory factor analysis and structural models. However, when calculating the sample size for confirmatory factor analysis, the number of variables does not matter so much as the number of factors. Therefore, when using the structural equation modeling (SEM), 20 respondents are needed for each factor (latent variable) [33]. Since there were 9 latent variables in this study, the minimum sample size was 180. Overall, 280 questionnaires were distributed, only 200 of which were analyzed because there were missing items in the other 80. The studies that have applied interpretive sequential modeling (ISM) often suggest the use of the SEM for validating the variables and for better understanding the relations between them [32]. In addition, the SEM was used as a complementary method of validation in this study. Reliability of the constructs was evaluated by Cronbach’s alpha, where values greater than 0.7 were acceptable [43].

3.3. Step3: Analysis of the Barriers (ISM)

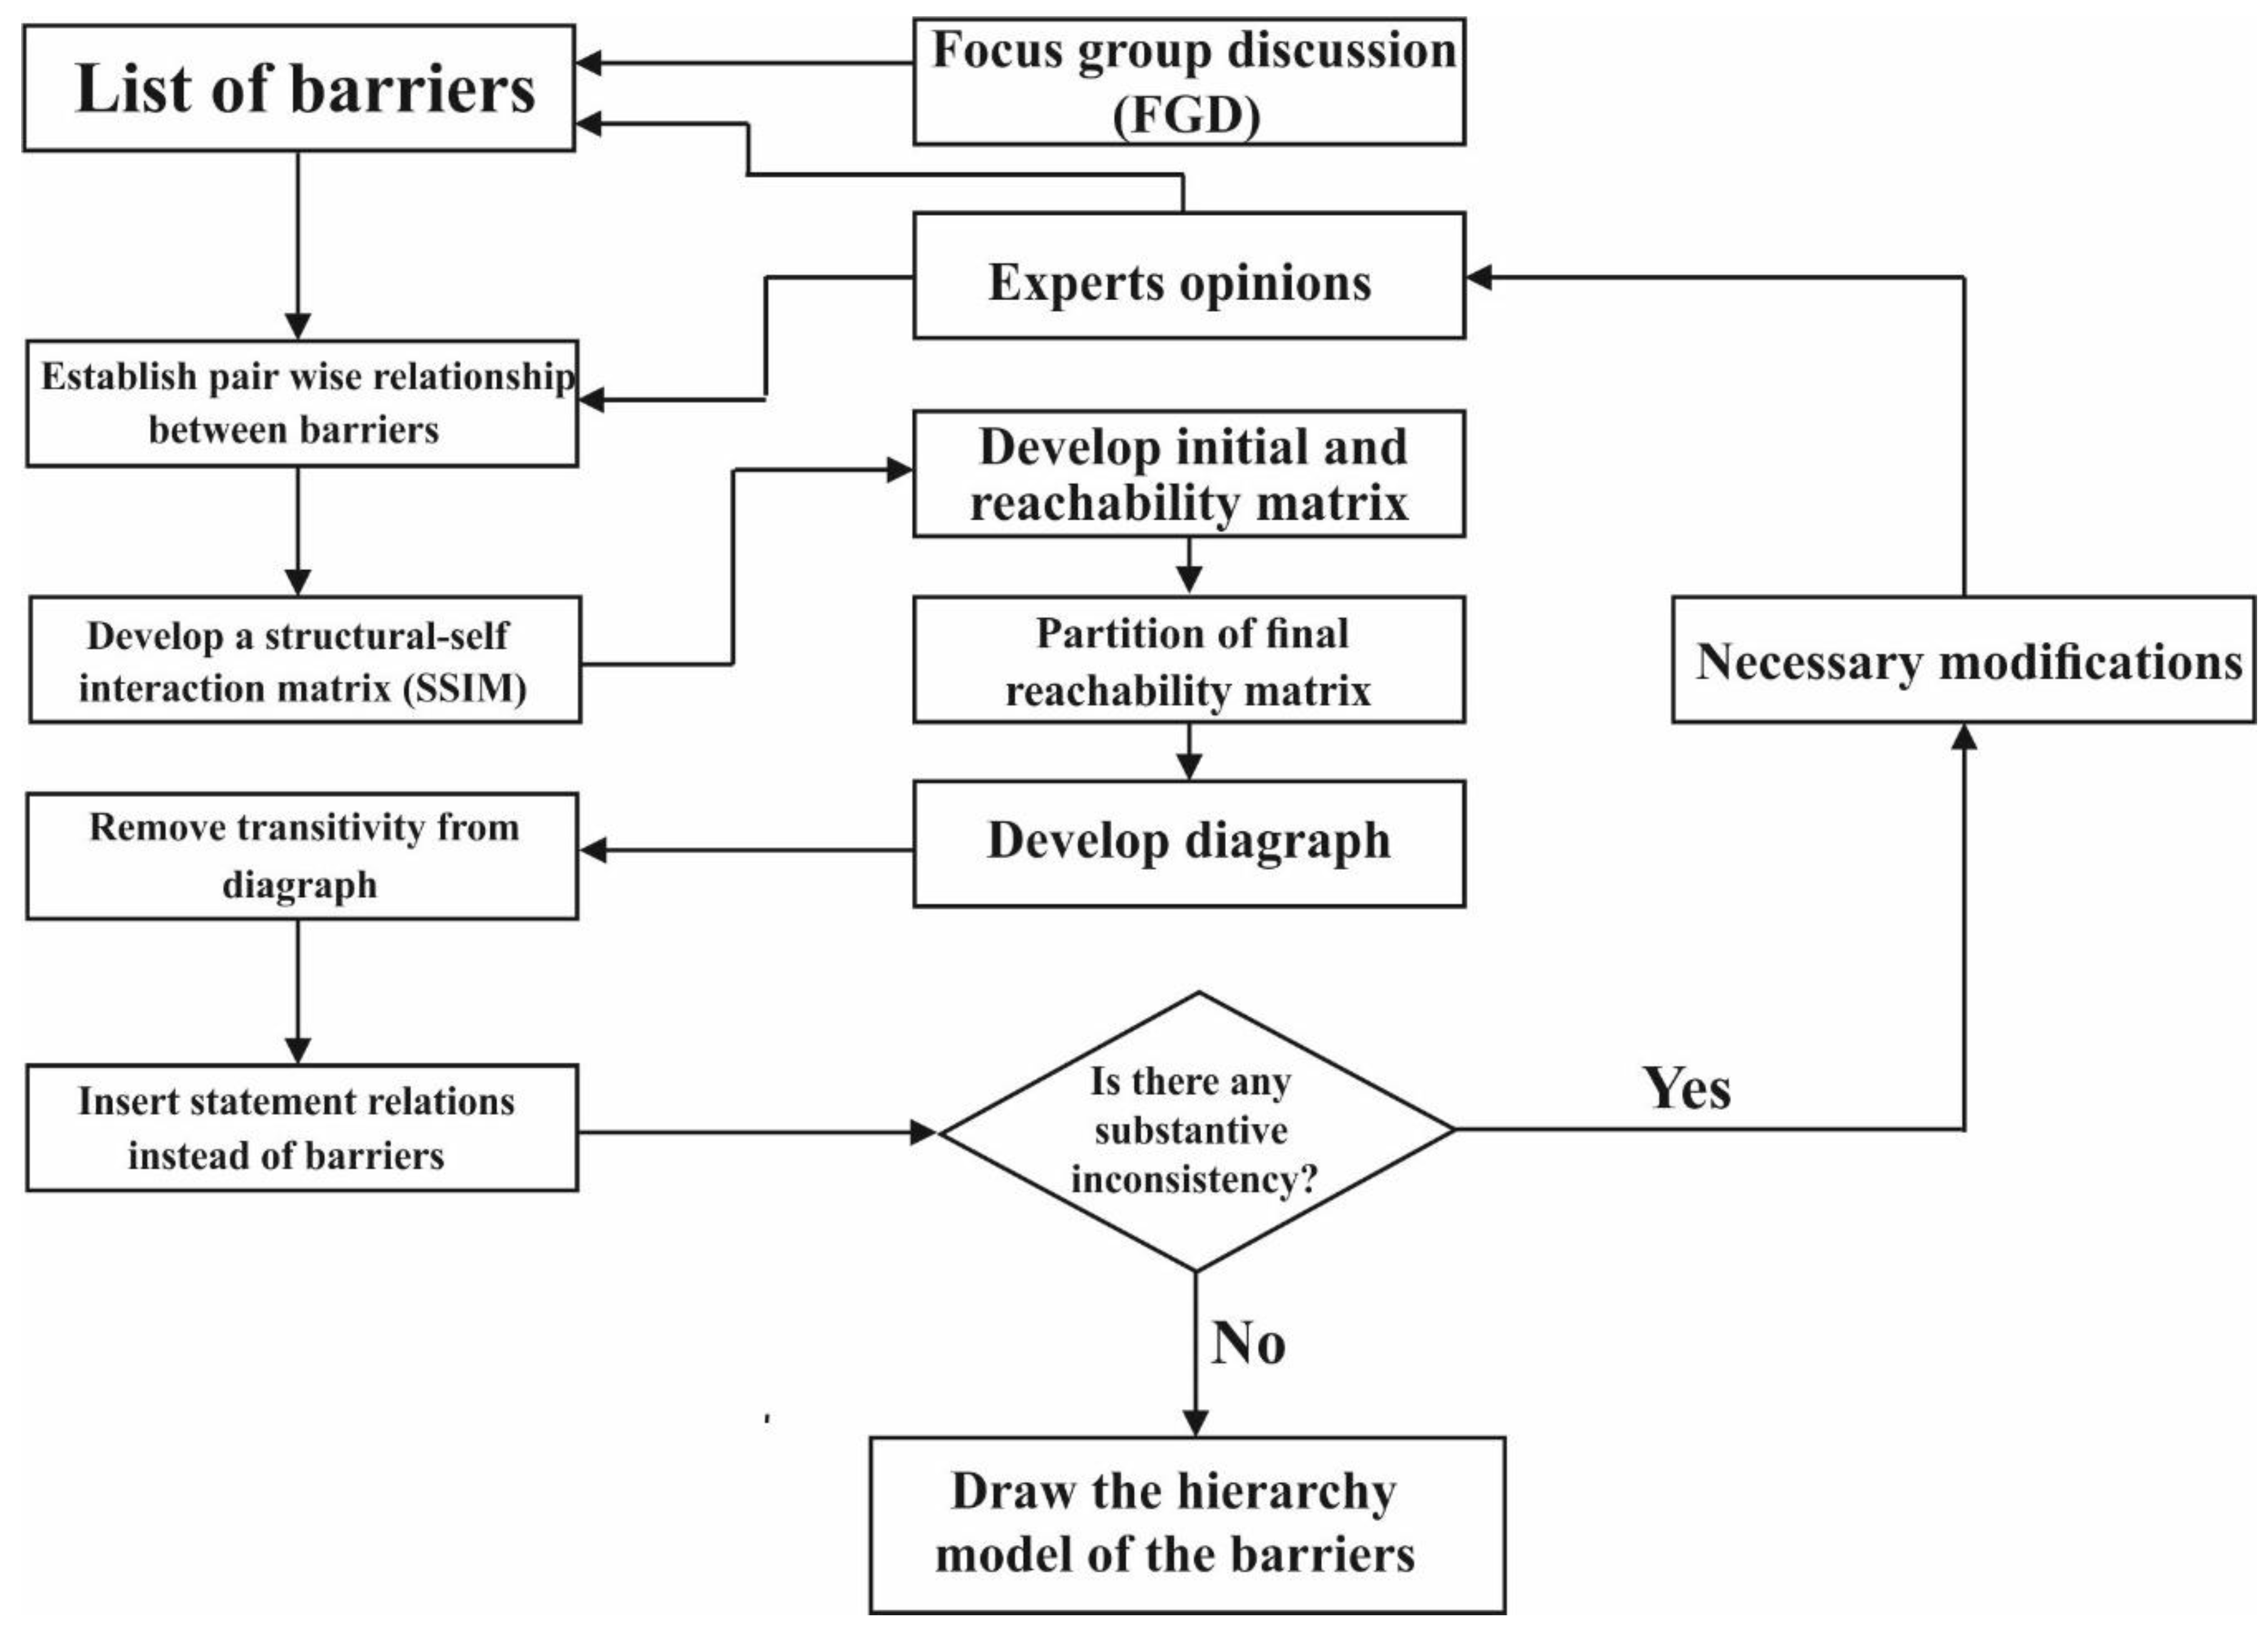
3.3.1. Introducing the ISM

The barriers to climate change adaptation were analyzed by the ISM. This approach enables one to understand complicated issues by transforming them into a multi-level structural model. It also enables decision makers to level the complex relations between the elements of an issue in terms of importance and size. The steps involved in the ISM are [35,36,44]:
  • Listing the barriers;
  • Establishing a contextual relationship between the barriers;
  • Developing a structural self-interaction matrix (SSIM) for the barriers that shows pairwise relation of the barriers;
  • “Framing the reachability matrix from the SSIM and verifying the matrix for transitivity. The transitivity of the contextual relations is a basic assumption for the ISM and means that if variable A is related to B and B to C, variable A is, then, related to variable C” [44];
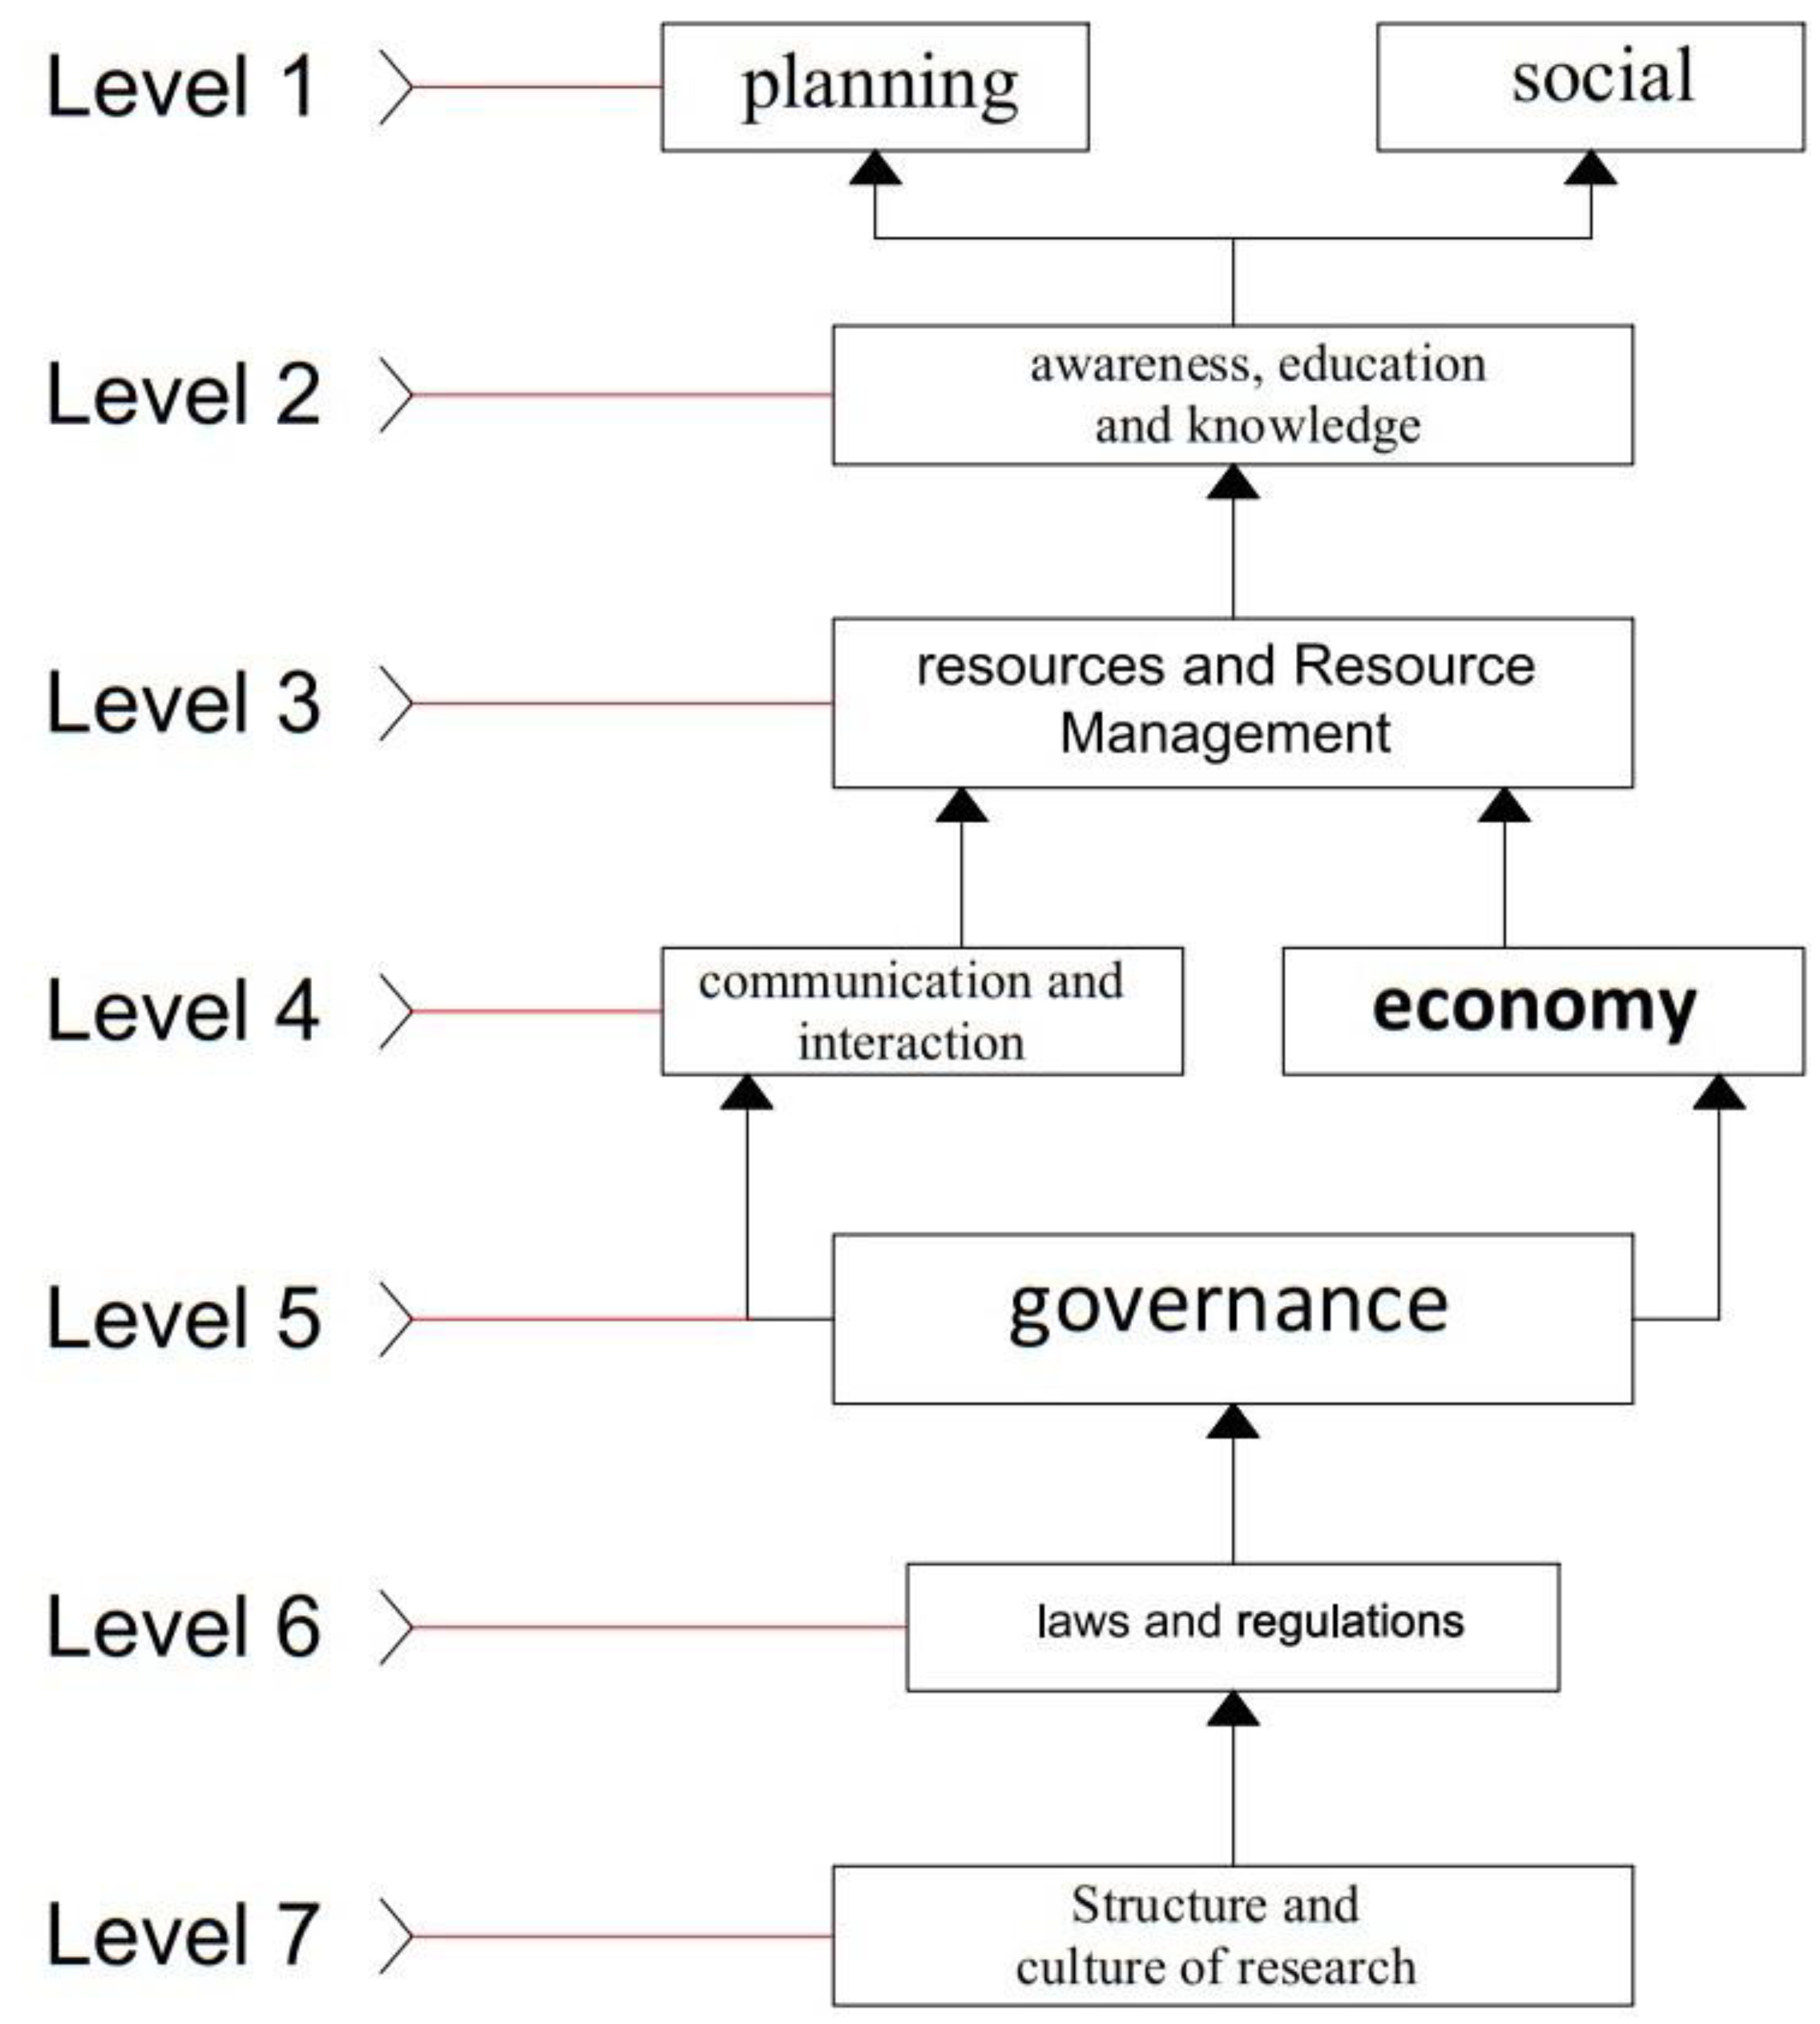
  • “Partitioning the reachability matrix into various levels” [44];
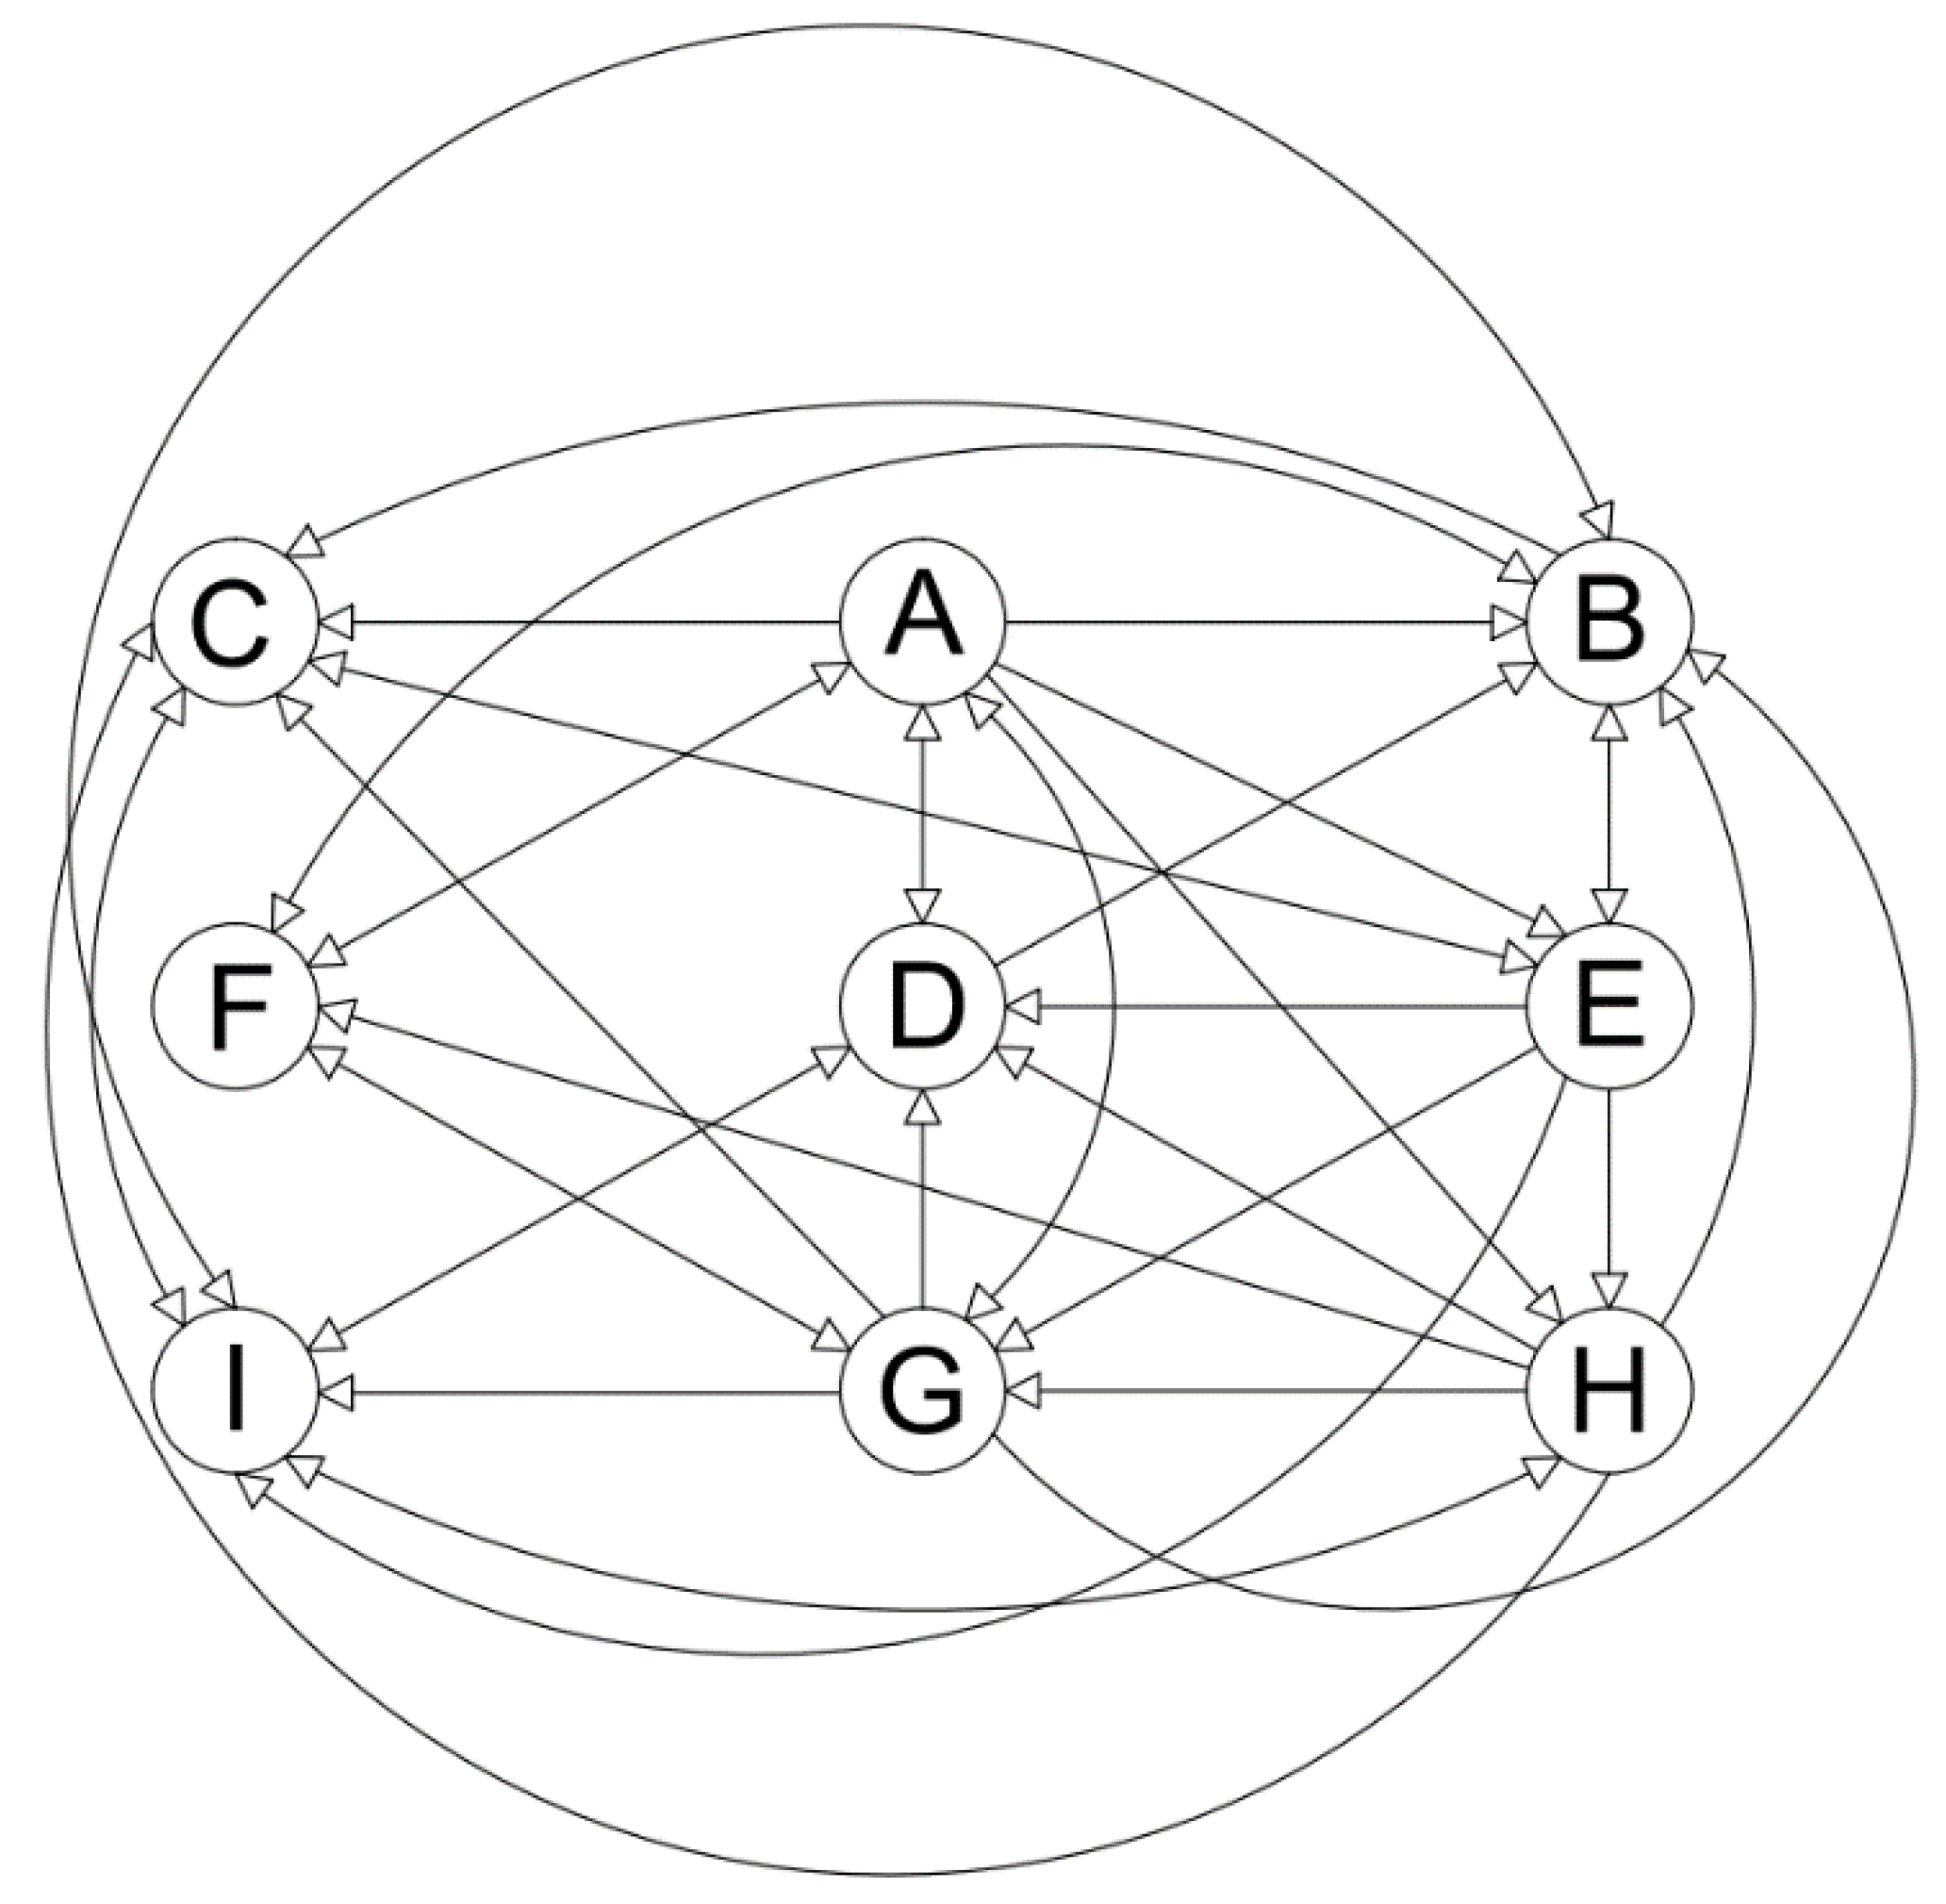
  • Drawing a directed graph based on the relations achieved in the reachability matrix and removing the transitive links;
  • Transforming the graph drawn in step 7 into an ISM by replacing the barrier nodes with a statement; and finally
  • Examining the ISM framework to check any likely conceptual inconsistencies and to make any necessary modifications [45,46]. Figure 3 shows the steps involved in the ISM.

3.3.2. Data Collection in the ISM

Previous studies using ISM have relied on the opinions of 5 to 10 experts [46,47]. In this study, the group of experts included 7 participants and they were asked to state their opinions about the pair matrix comparisons of the impact of variables on each other. In case of disagreement between the experts, the issue was discussed till consensus was reached. Inclusion criteria for selecting the experts were: theoretical mastery, practical experience, ability and willingness to participate, and availability. Characteristics of the experts who participated in the ISM are shown in Table S3 of the Supplementary material.

4. Results

4.1. Findings of FGDs

Nine themes and 31 sub-themes emerged from the FGDs, which are presented in Table 1. The theme ‘structure and culture of research’ highlights the lack of research institutes that specifically work on climate change adaptation and inform planners and decision makers of the adaptation needs and priorities. This issue is further exacerbated by the limited academic capacity related to developing/implementing climate adaptation plans and/or limited opportunities for climate–policy interactions. As the focus of the second theme indicates, these issues are probably partly rooted in the lack of awareness of climate change and its impacts among planners, policy makers, and citizens, and limited education and communication efforts to enhance their awareness. Overcoming these awareness-related barriers is hampered by the lack of society-wide efforts that can increase citizens’ interest in climate action. In particular, limited capacity of non-governmental organizations (NGOs) is a key social barrier. Issues related to limited availability of resources for developing and implementing climate adaptation plans are also critical and constitute a major theme. These include issues such as lack of comprehensive local databases, and difficulties in accessing and processing data.
In terms of laws and regulations, the key barriers are the lack of mechanisms to update laws and regulations and align them with climatic concerns and priorities, lack of compatibility and consistency between local and national regulations, and the weaknesses in terms of enforcement of plans and regulations. The sixth theme highlights the lack of efforts and platforms for communication and experience/knowledge sharing with other countries and organizations with expertise related to climate action planning. Such interactions would be essential for awareness raising and may also provide opportunities for updating planning laws and regulations.
The last three themes are concerned with barriers related to governance, management, and planning. Limited economic capacity of municipalities and their lack of access to financial resources makes it difficult for them to allocate a budget for research and practice related to climate change adaptation. Furthermore, urban planning and governance are suffering from major barriers such as outdated management approaches, dominance of engineering-based approaches that fail to consider socio-economic factors, limited local authority and independence, absence of integrated management approaches that consider interactions between various planning and design activities that may influence the capacity to adapt to climate change impacts, lack of appropriate skills for climate adaptation planning, absence of evaluation and assessment programs, and limited local capacity to develop and implement context-specific adaptation plans.

4.2. Findings of the Survey

As stated above, this step of the study aimed to assess the importance of the variables, their validity, and their effects on each other. The findings are separately presented here.

4.2.1. Barrier Value Assessment

The first goal of the survey was to evaluate the importance of the variables. In doing so, the one-sample t-test was applied, the results of which are presented in Table 2 and Figure S1 of the Supplementary material. Results show that all identified barriers have an importance score of above 3 and the average score of the barriers is significantly higher than the threshold 3 (all significant at P < 0.01). Table 2 shows that all variables had a Cronbach’s alpha above 0.7, indicating good reliability. Based on the t coefficient and the average score of the variables, the most important variable themes were social (t = 11.096, mean = 3.71), communication and interaction (t = 8.683, mean = 3.71), and resources and resource management (t = 7.570, mean = 3.51). The less important ones, on the other hand, were laws and regulations (t = 3.179, mean = 3.24), and the economy (t = 5.423, mean = 3.47).

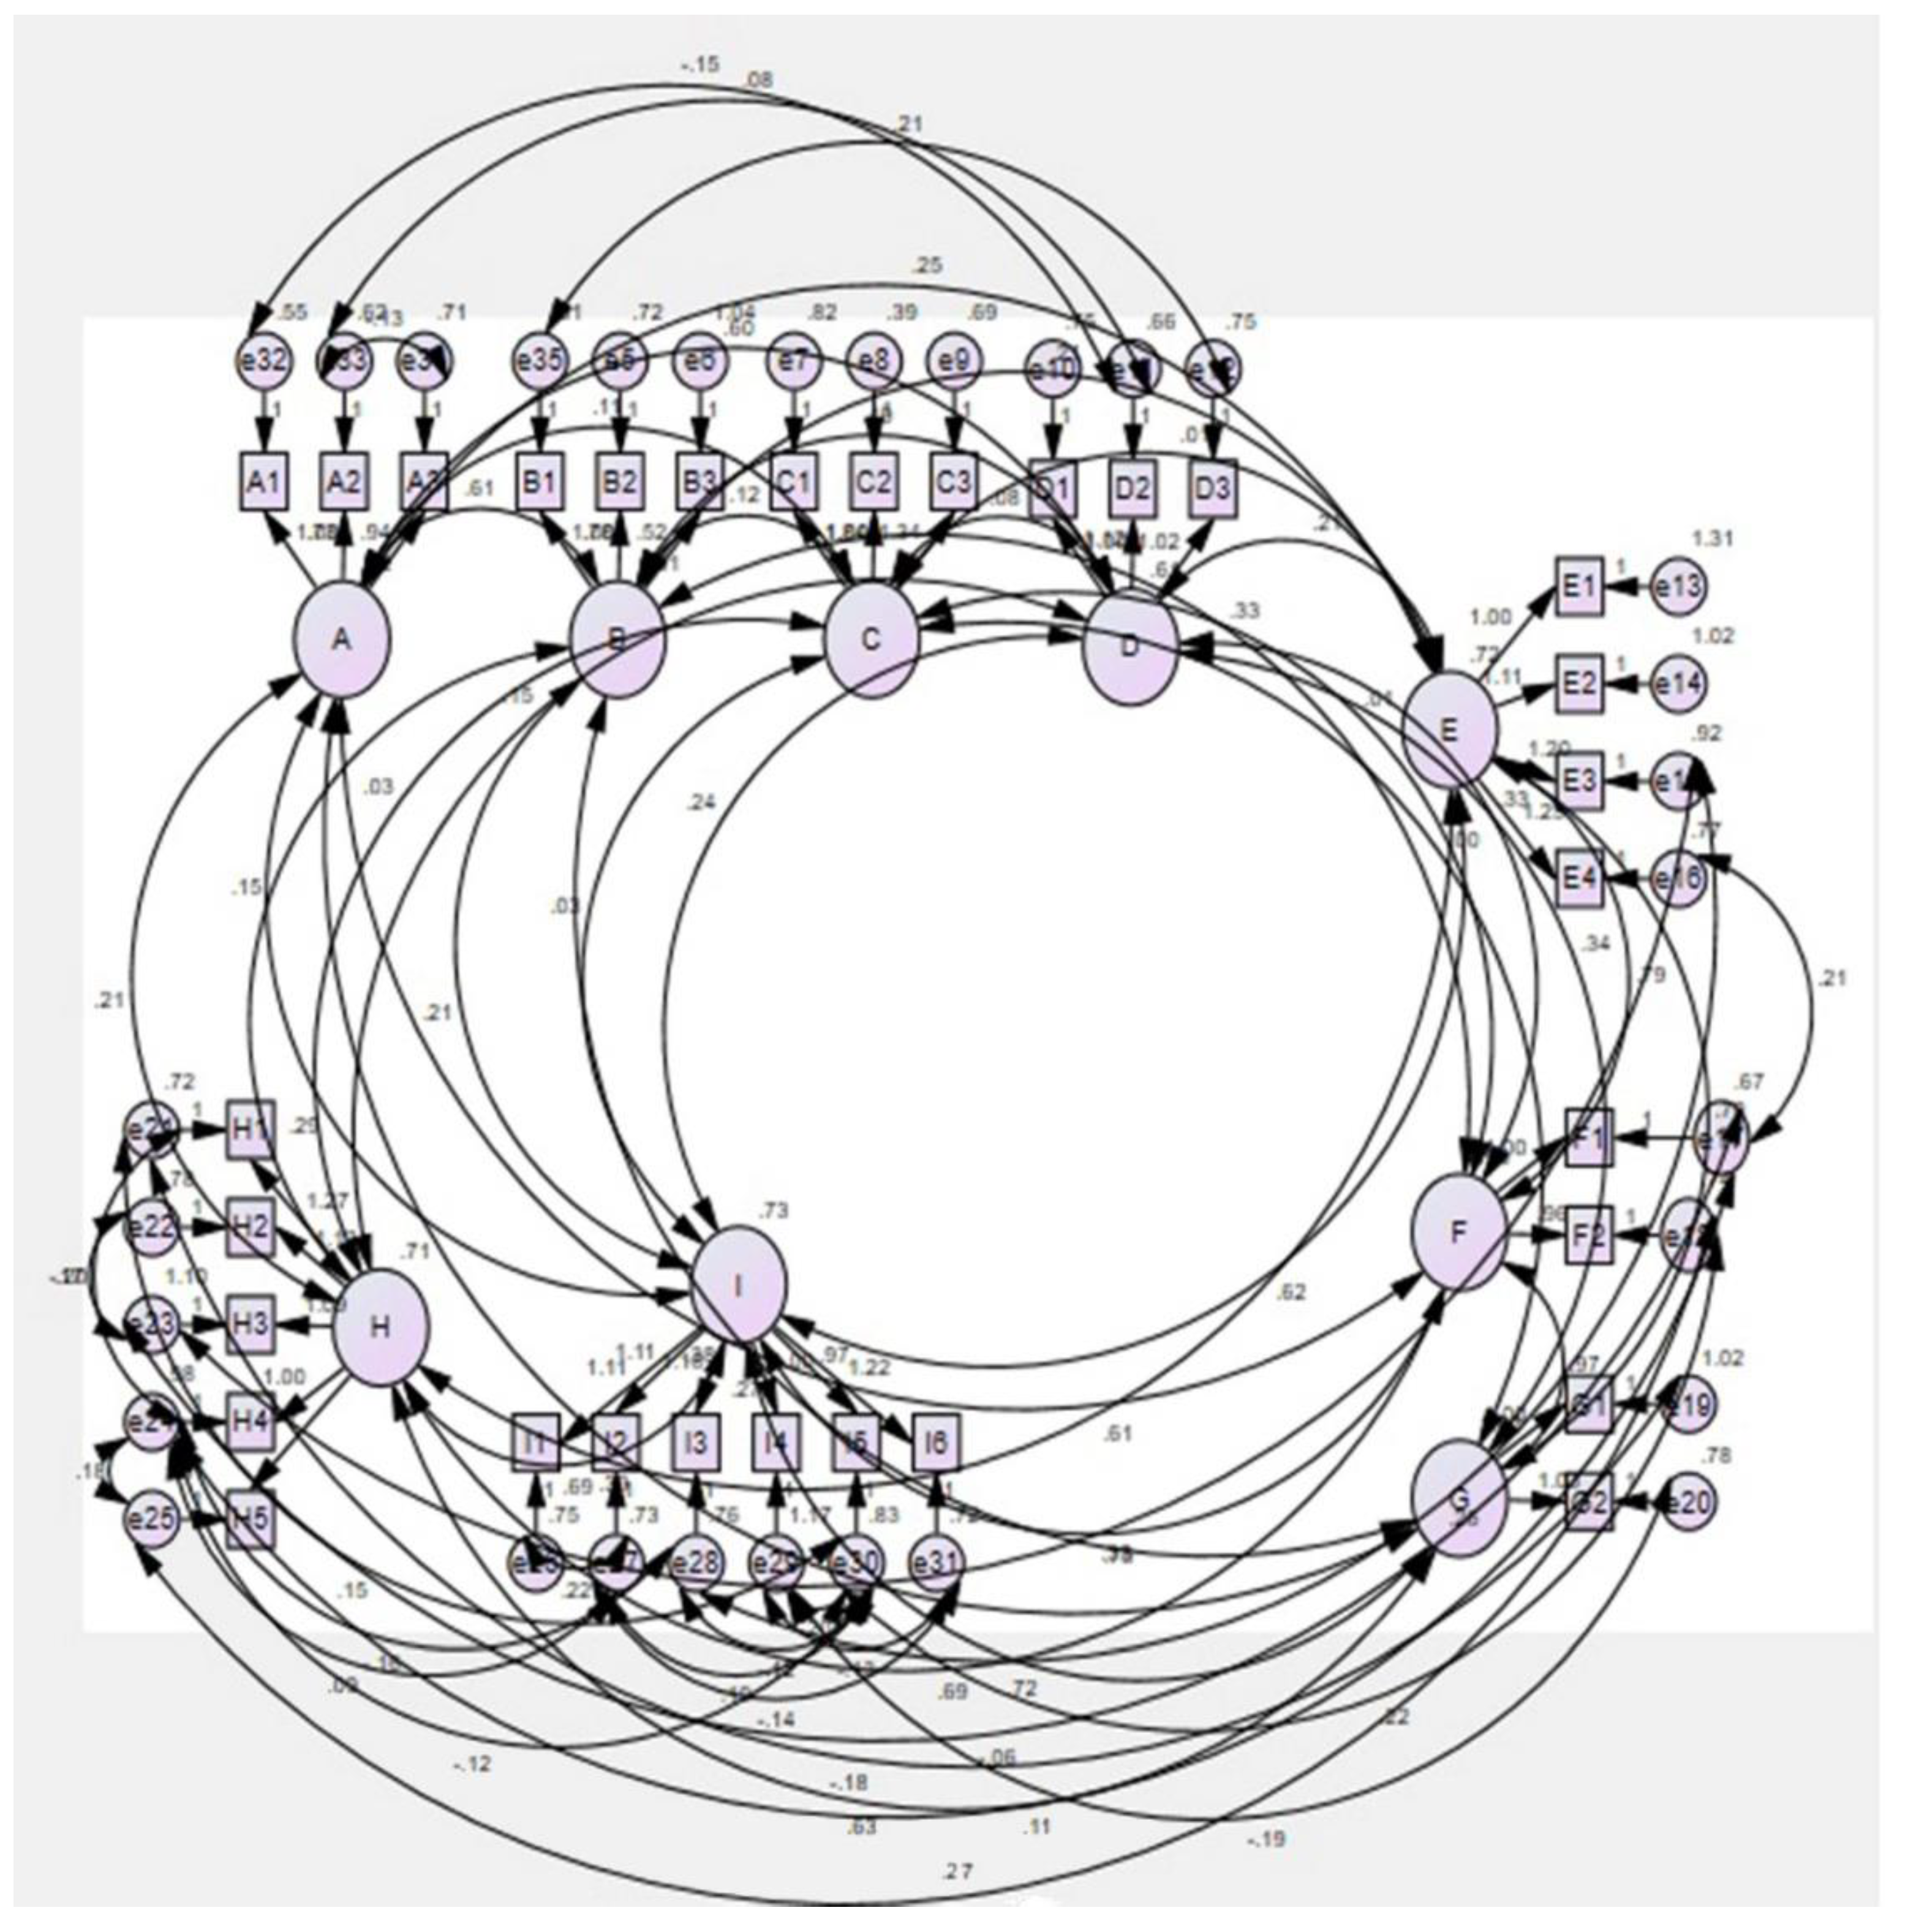
4.2.2. Validity of the Variables

The second goal of the survey was to assess the validity of the variables. In doing so, the CFA, which is a major component of the SEM, was applied. The SEM is a technique to determine, estimate, and evaluate the linear correlation models among a set of observed variables that are fewer than unobserved ones [34]. The SEM includes endogenous or dependent, and exogenous or independent variables with an observable or non-observable categorization. Since the SEM enables us to make assessments at the structural level, it is more flexible than other statistical methods. On the other hand, it is also referred to as causal modeling because it can assess causal relations [43]. Path analysis and CFA are two common forms of the SEM. Confirmatory factor analysis is used to confirm the structure of a set of observed variables. The SEM is similar to path analysis and makes parameter estimates based on direct and indirect relations between observed variables [34].
In this study, the validity of the variables was assessed in terms of face validity, convergent validity, and discriminant validity as parts of construct validity. Construct validity is the extent to which a set of measured variables reflects the latent construct for which it is designed [48]. Since the identified barriers and their measures are the results of the unanimous consensus of a group of experts with good face validity, it can be said that the measures reflect their latent construct. Convergent validity was calculated through factor loadings and average variance extracted (AVE) (Table 3). All standardized factor loadings were statistically significant (p < 0.01). Moreover, the AVE for each construct is above 0.5, which points to the convergent validity of that construct. Discriminant or divergent validity is calculated through comparing the AVE and the correlation coefficients of the corresponding inter-construct squared correlation estimates [34,49].
Table 4 shows the discriminant validity, where the diameter refers to the AVE and the other cell values represent inter-construct squared correlation. To satisfy the discriminant validity criterion, inter-construct squared correlation values should not exceed the AVEs of either the constructs [49]. As seen in Table 4, all inter-construct combinations, except one (i.e., combination of F and G) are in line with this criterion. This points to the discriminant validity of the factors. Figure 4 illustrates the results of the CFA.

4.2.3. Impact of the Variables on Each Other

The third goal of the survey was to investigate the impacts of the variables on each other. In doing so, the path analysis was used. Results of the path analysis are shown in Table 5. The table shows that the effect of variable A (structure and culture of research) on variable E (laws and regulations) was 0.051, which means as A goes up by 1 standard deviation, E increases by 0.051 standard deviation.
Other paths, where the barriers affect each other are presented in Table 5 and Figure S2 of the Supplementary material. The effect of variable E (laws and regulations) on H (governance) was 0.723, H on G (economy) was 0.785, H on F (communication and interaction) was 0.875, G on D (resources and its management) was 0.068, F on D was 0.089, D on B (awareness, education, and knowledge) was 0.466, B on C (social) was 0.149, and B on I (planning) was 0.053. The highest values observed was for the effects of governance (H) on communication and interaction (F) and economy (G). This could be explained by the power structure of the country and the top-down nature of the urban governance system that play significant roles in determining the nature of communication and interaction, as well as, the economic capacity of municipalities. The lowest values were obtained for the effect of the structure and culture of research (A) on laws and regulations (E) and the awareness, education, and knowledge (B) on Planning (I). The former is likely an indication of the traditional disconnect between regulations and research activities (lack of research-informed regulations). Therefore, the effect is likely to be limited. Similarly, planning follows a top-down manner and is not informed by knowledge. While raising awareness would be essential for achieving improved planning, these two are currently not directly linked due to the top-down structure of urban governance. Overall, the high effects of urban governance may indicate the importance of making improvements in the governance structure. However, it should be mentioned that further research is needed to better explain the reasons behind these relationships.
The path analysis model indicated an acceptable model fit of chi square (χ2) = 34.905; degree of freedom (DF) = 17; probability of an exact fit (p) = 0.000; χ2/DF = 2.053 (<5); comparative fit index (CFI) = 0.98; Tucker–Lewis index (TLI) = 0.957; incremental fit index (IFI) = 0.98; normed-fit index (NFI) = 0.962; relative fit index (RFI) = 0.920; goodness-of-fit index (GFI) = 0.964; root mean square residual (RMR) = 0.106; and root mean square error of approximation (RMSEA) = 0.073. The values of the fit indices indicate a reasonable fit of the path analysis model with the data [50].
Kendall’s tau-b two-tailed correlation was applied to the barriers to climate change adaptation in Tehran’s urban management to check the possible multi-collinearity. Results show no multi-collinearity between the barriers (see Table S4 of the Supplementary material). Multi-collinearity occurs when two or more independent variables show a high correlation in a multivariate regression. Correlation here means the existence of a linear relation between independent variables. Based on the extent of the correlation, the collinearity will differ. In fact, when there is no multi-collinearity between the variables, we are sure that the observed impacts of the variables on each other are not due to their interactions and correlations.

4.3. Findings of the ISM

4.3.1. Structural Self-Interaction Matrix

To make the self-interaction matrix, the experts were asked to state the relationships among the variables in the form of pairwise comparisons. The agreed relationships among the barriers are presented in Table 6. Four symbols are usually used to express the relationships among the factors in the ISM method as follows:
  • “V indicates that factor i directly affects factor j;
  • A indicates that factor j directly affects factor i;
  • X indicates that factor i and factor j interact with each other; and
  • O indicates that factor i has nothing to do with factor j” [51].

4.3.2. Final Reachability Matrix

The SSIM was converted into a binary matrix (known as initial reachability matrix) through replacing V, A, X, and O symbols by 1 and 0 digits. The rules are as follows [47]:
  • “Put 1 in (i, j) entry and 0 in (j, i) entry of the reachability matrix, if (i, j) entry in SSIM is V;
  • Put 0 in (i, j) entry and 1 in (j, i) entry of the reachability matrix, if (i, j) entry in SSIM is A;
  • Put 1 in (i, j) entry and 1 in (j, i) entry of the reachability matrix, if (i, j) entry in SSIM is X; and
  • Put 0 in (i, j) entry and 0 in (j, i) entry of the reachability matrix, if (i, j) entry in SSIM is O”.
Then, the final reachability matrix was developed by introducing the concept of transitivity. The final reachability matrix is shown in Table S5 of the Supplementary material. Driving power in this table refers to the number of other factors (i.e., barriers) that one particular factor affects, whereas dependency refers to the number of other factors affecting one particular factor. According to this table, the highest driving powers belong to “structure and culture of research” and “laws and regulations” with a score of 8 and the lowest belongs to “social” with a score of 3. While more in-depth analysis is needed to explain these results, a likely explanation could be the significance of research for facilitating science-based policy making and the essential role that updated regulations can play in streamlining adaptation in urban planning. The low value for “social” may indicate that, within the context of Tehran, its driving power is comparatively lower and it is mainly dependent and influenced by other factors.

4.3.3. Level Partitions

The reachability set and antecedent set for each factor were obtained from the reachability matrix. The reachability set includes the element and other elements that are all affected by one particular element. The antecedent set includes the element and all elements that affect that particular element. Then, the common elements of these sets are identified. The element that is common in reachability and antecedent sets is located on the first level of the ISM hierarchy. Leveling helps us identify the higher- and lower-importance barriers. Results of level partitioning are shown in Table S6 of the supplementary material. Since the first element in the ISM hierarchy does not affect any other elements above it, it was removed and the leveling continued with the other elements. Finally, the determined levels were used to draw a causal diagram, which is presented in Figure 5 and Figure 6.
The “social” and “planning” barriers are located on the first level. The “awareness, education, and knowledge” barrier is located on the second level, “resources and resource management” on the third level, “communication and interaction” and “economy” on the fourth level, “governance” on the fifth level, “laws and regulations” on the sixth level, and the “structure and culture of research” on the seventh level.

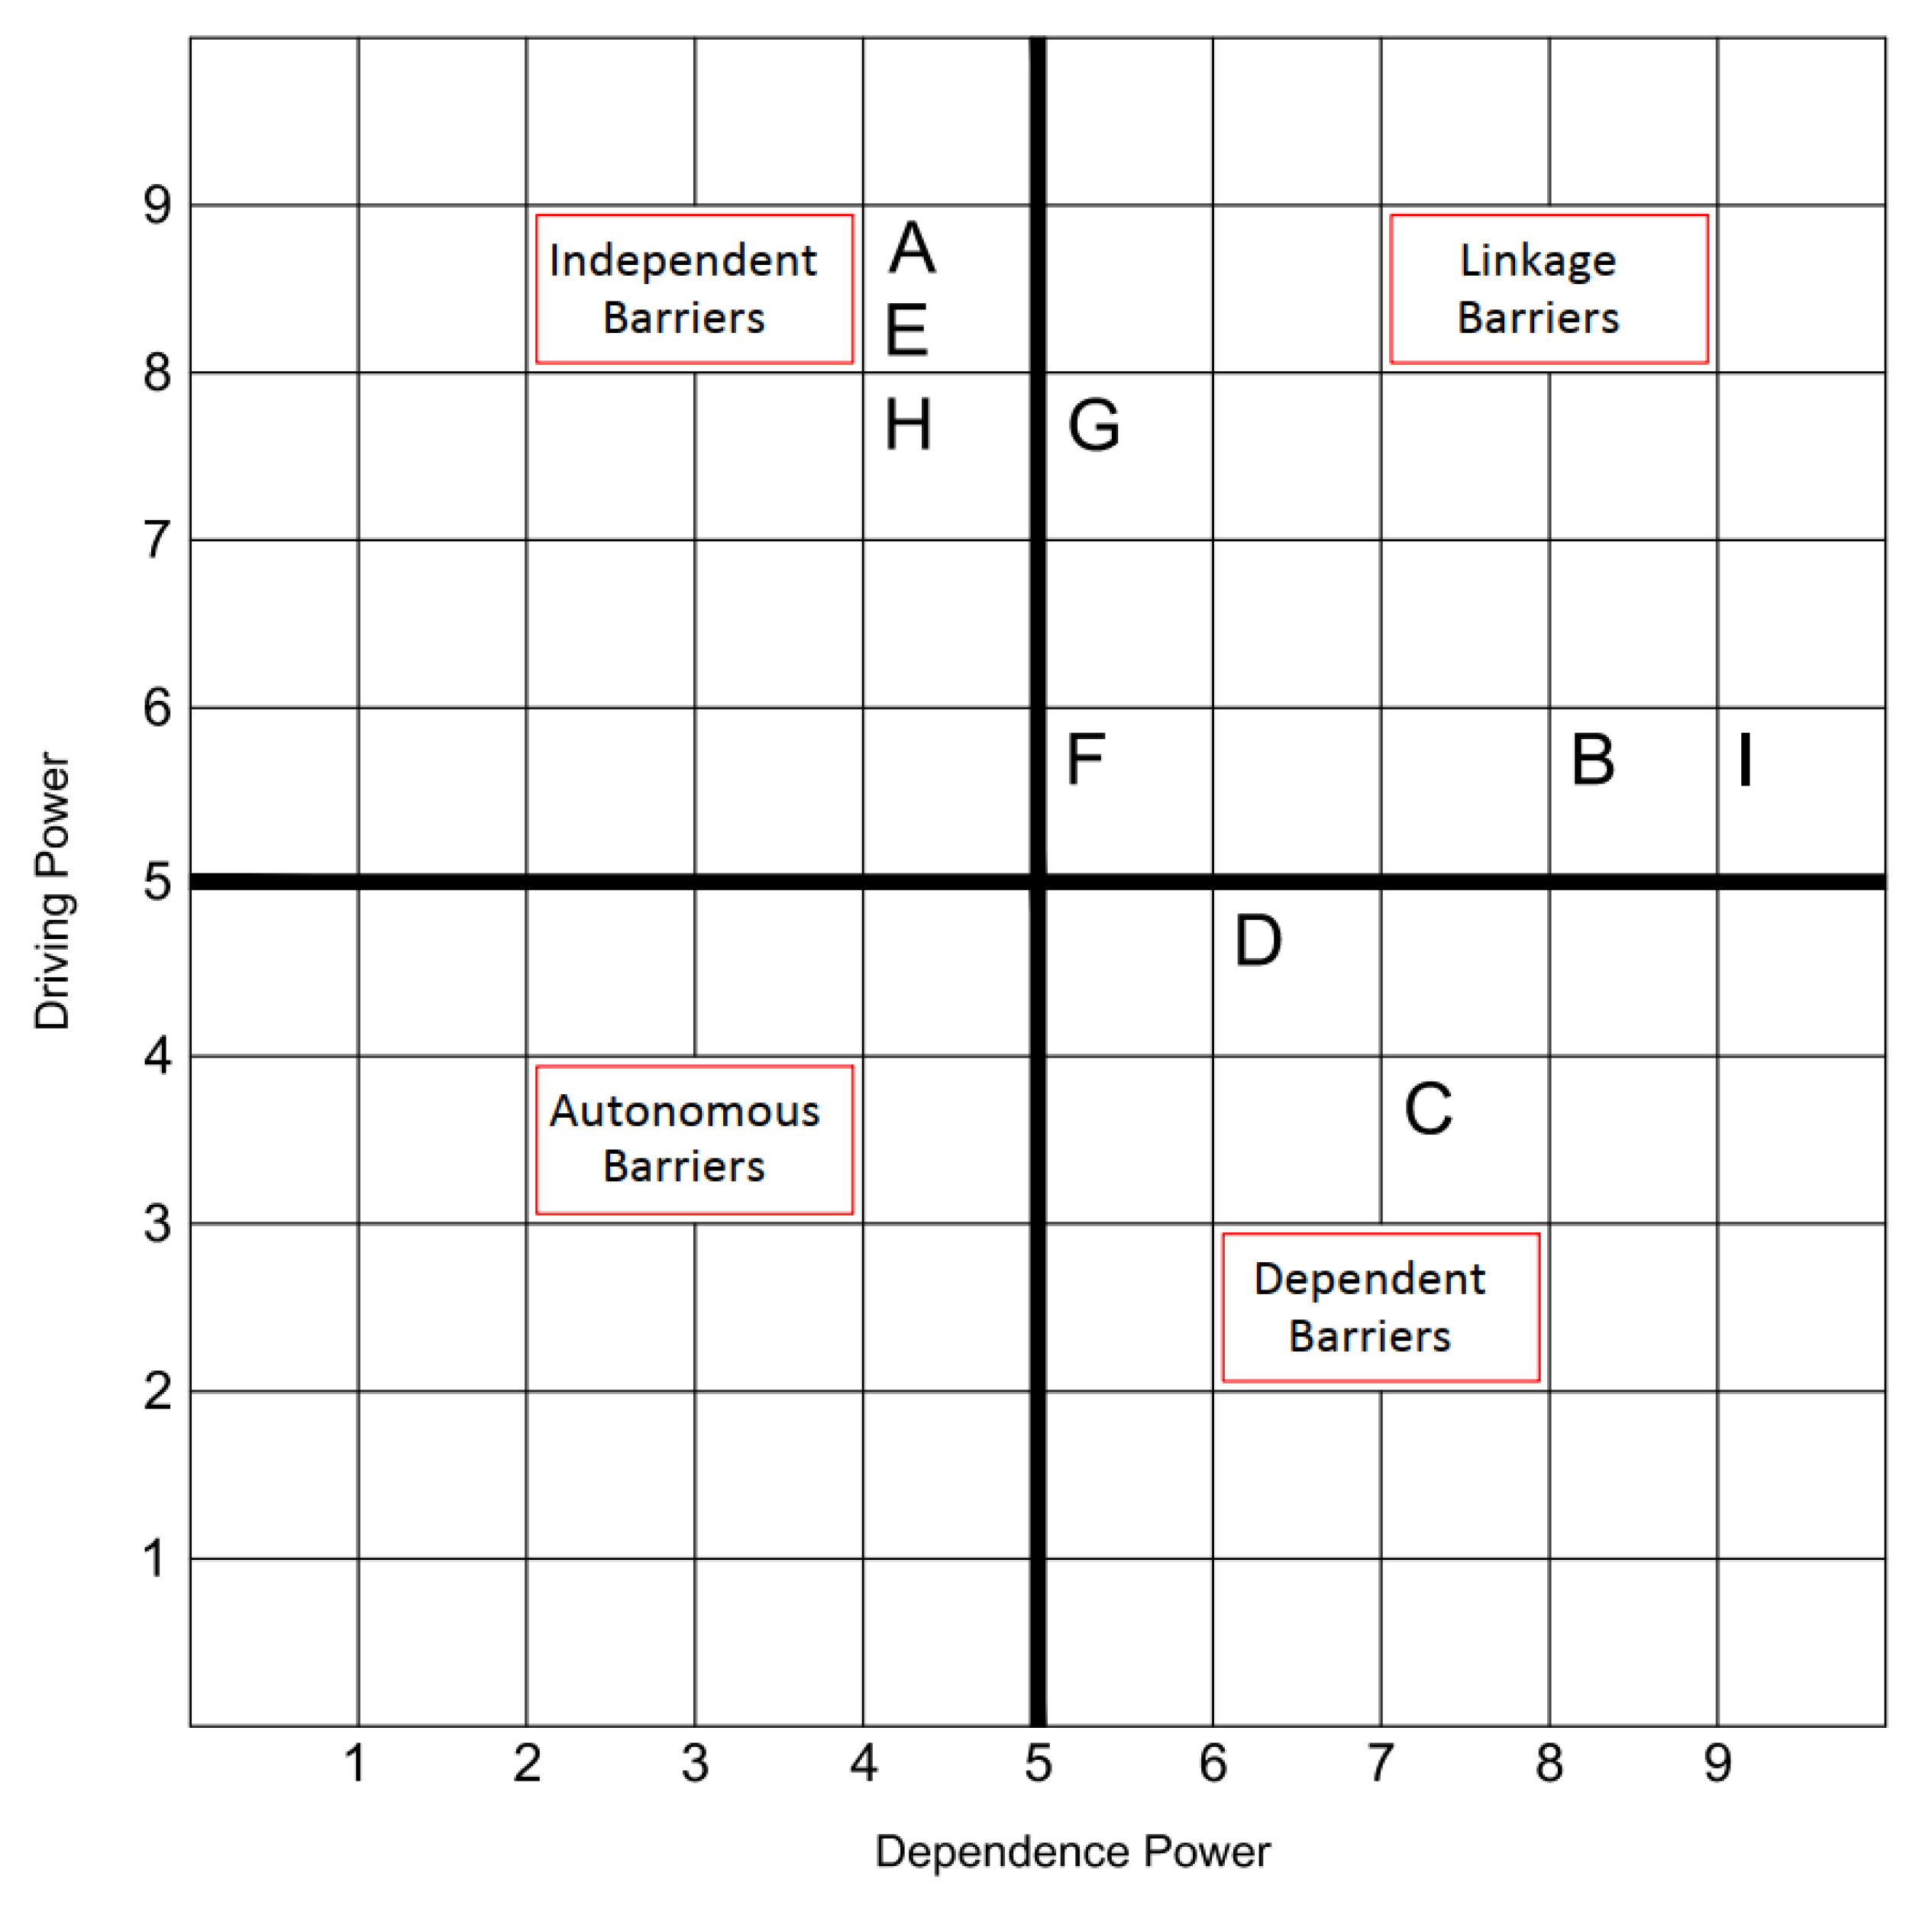
4.3.4. Cross-Impact Matrix Multiplication Applied to Classification (Matrice d’impacts croisés multiplication appliquée á un classment (MICMAC)) Analysis

As mentioned in Section 3, one of the outputs of the ISM is the classification of the barriers into four categories, namely, autonomous, dependent, linkage, and independent. Figure 7 shows this categorization of the barriers. The first category is the autonomous barriers with a poor driving power and dependency. Barriers in this category are almost apart from the system and their relationship with the system is poor and insignificant. The barriers in the dependent category have a poor driving power and strong dependency. The third category includes the linkage barriers with both a strong driving power and strong dependency. These barriers were not steady and any changes in them could affect the other barriers; and in return, the feedback of the effect is seen in the linkage barrier itself. Category four is the independent barriers with a strong driving power but poor dependency. This categorization shows that the “structure and culture of research”, “laws and regulations”, and “planning” have a high driving power and are located in the category of independent barriers. The “social” and “resources and resource management” with a poor driving power and strong dependency are located in the category of dependent barriers. Further, the barriers of “governance”, “awareness, education, and knowledge”, “communications and interactions”, and “economy” are located in the category of linkage barriers, with both a high driving power and high dependency. No barrier is located in the category of autonomous, which means that all the barriers can be inserted in the causal relations.

5. Discussion

This study primarily aimed to explore different barriers to climate change adaptation in Tehran and analyze their inter-relationships. Cities in general, and metropolitan areas specifically, are complex systems that need to grapple with multiple challenges, only one of which is climate change [52]. To gain improved insights into the significance and magnitude of the problem, one needs to identify and analyze the barriers prior to any decision making or policy considerations as to how to adapt to it.
Among others, the current study had hypothesized that Tehran’s urban management is facing some barriers that prevents it from appropriate adaptation to climate change impacts. On the other hand, the absence of a comprehensive study in Iran to investigate the barriers to climate change adaptation and explore their relative importance and inter-relationships is another reason for doing this study. Although some studies have already identified the barriers to climate change adaptation, none has assessed the interactions of the barriers with each other [7,13,14,53]. Sketching out the relationships among the different barriers schematically and classifying them into different categories can enable planners and policy makers to gain a hierarchical insight into the way these diverse barriers might interact. This can be helpful as the intricate and multifarious relationships across the barriers could be hard to manage without a schematic representation.
As mentioned in Table 1, nine themes of ‘structure and culture of research’; ‘awareness, education, and knowledge’; ‘social’; ‘resources and resource management’; ‘laws and regulations’; ‘communication and interaction’; ‘economy’; ‘governance’; and ‘planning’ have been identified in a related research as major barriers. Then, drawing on a mixed interpretative-experimental method, the relationships across these barriers and their impact on each other were schematically represented and tested. The barriers of “structure and culture of research”, “laws and regulations”, and “governance” were identified as key barriers because they had a high driving power to affect the other barriers. These barriers are important in terms of the structures of urban management. In other words, these barriers make up the basis for structural relationships across all barriers and should receive more weight in a causal hierarchy of the barriers. Tehran’s authorities should pay greater attention to these three barriers in all policies and plans aimed to adapt to climate change. These barriers are deeply rooted in fundamental weaknesses and in the macro-structure of planning and policy making in the whole country. Therefore, given the universality of the causes of such barriers, the issue should by no means be confined to Tehran. To mitigate the problem, all players in Iran’s urban management sector, including municipalities, city councils, and the citizens should take some measures and play a crucial role.
Tehran’s city council, as an observer and local legislator, can demand actions from the municipality as well as revise the regulations and develop new ones with incentives and necessary measures to promote adaptation. Creating a working group in the city council for continuous monitoring of the actions can also go a long way. The municipality can further create a multi-disciplinary team to develop policies and executive plans, communicate with educational and research organizations involved in climate change adaptation, benefit from the economic, institutional, and legal capacities of the three institutional powers (i.e., executive, legislative, and judiciary) and the ministries, and identify the conflicting and incongruous regulations to request their amendment.
The barriers of “economy”, “communication and interaction”, “planning”, and “awareness, education, and knowledge” were classified into the ‘linkage’ category, which means that they have a moderate driving power and moderate dependency. The importance of these barriers lies in the role they play in an interface loop between the independent and dependent barriers. Although the dependent barriers were found to have a poor driving power, the correlation coefficient matrix showed that they had significant positive correlation with some independent and linkage barriers. None of the barriers were classified as autonomous, which means that all the identified barriers have an impact and should not be excluded from the causal relationship structure.
Goodness of fit index of the path analysis model showed that the model had a good fitness according to the experimental data. This means that the interpretive structure of the relationships drawn by the ISM is compatible with the experimental data. The path analysis model also indicated that some barriers have a causal effect on others. For example, the model showed that the “laws and regulation”, “governance”, “economy”, and “resources and resource management” had a significant impact on other barriers.
Finally, the low priority assigned to the problem of climate change is a fundamental weakness of Tehran’s urban management sector that can have irreversible physical, social, political, geographical, and ecological consequences. Measures such as integrated urban-regional planning, applying locally-relevant ideas, mainstreaming the policies and actions, and citizen participation can go a long way toward mitigating the problem [6,54].

6. Conclusions

Stressing the importance of looking at the issue of climate change adaptation as a multi-dimensional problem, this study provided new insights into barriers to climate change adaptation. In view of Tehran’s social, economic, physical, political, and geographic status, it has always served as a model for other cities in Iran. Therefore, the findings of this study may also be useful for other Iranian cities. The findings may also be applicable to other metropolises outside Iran with similar problems. At least, the methods used in this study can be adopted by researchers and planners in other contexts to better understand the relative importance of climate change adaptation barriers and realize how they may influence each other.
A limitation of this study, however, was the restricted evidence, especially experimental evidence, which caused some difficulties in identifying the barriers. To overcome this problem, the barriers identified using FGDs were used. Another restriction was our limited access to the key informant participants to take part in the survey part of the study, as they held highly-ranked governmental positions with little time to spare. To ensure this limitation would not prove a formidable challenge, the authors first contacted them and obtained their consent and commitment to the study before sending them the questionnaires. Despite this, the researchers sometimes had to lean over backwards to secure a time with them.
In light of the undeniable significance of studying the barriers to climate change adaptation, one line of research that future studies can pursue is to pick where this study has left out by studying this problem in other metropolises around the world, especially those in the Global South. The simultaneous application of quantitative and qualitative methods and drawing on residents’ living experiences might also help us better understand this problem and better interpret the findings. Using other methods and approaches such as fuzzy Delphi, Decision Making Trial and Evaluation Laboratory (DEMATEL), neural networks, Shannon entropy, and graph theory along with the ISM and the SEM may enable the researchers to better understand and compare the results. Finally, in view of the numerous stakeholders and actors involved in Tehran’s urban management, future studies might want to focus on the stakeholder analysis of adaptation to climate change.

Supplementary Materials

The following are available online at https://www.mdpi.com/2225-1154/8/10/104/s1, Figure S1: Average importance scores of the barriers (see Table 1 for the codes), Figure S2: Path diagram of the SEM for the barriers to climate change adaptation, Table S1: Characteristics of the participants in the FGDs to identify the barriers to climate change adaptation, Table S2: Demographics of the survey respondents, Table S3: Demographics of the participants, Table S4: Correlation coefficients for barriers, Table S5: Final reachability matrix, Table S6: Results of level partitions.

Author Contributions

Conceptualization, B.G. and A.S.; methodology, B.G.; software, B.G.; validation, B.G.; formal analysis, B.G.; investigation, B.G.; resources, B.G.; data curation, B.G.; writing—original draft preparation, B.G. and A.S.; writing—review and editing, B.G. and A.S.; visualization, B.G. All authors have read and agreed to the published version of the manuscript.

Funding

This research received no external funding.

Conflicts of Interest

The authors declare no conflict of interest.

References

  1. Bulkeley, H. Navigating climate’s human geographies: Exploring the whereabouts of climate politics. Dialogues Hum. Geogr. 2019, 9, 3–17. [Google Scholar] [CrossRef] [Green Version]
  2. Sharifi, A. Co-benefits and synergies between urban climate change mitigation and adaptation measures: A literature review. Sci. Total Environ. 2020, 750, 141642. [Google Scholar] [CrossRef] [PubMed]
  3. Paterson, B.; Charles, A. Community-based responses to climate hazards: Typology and global analysis. Clim. Chang. 2019, 152, 327–343. [Google Scholar] [CrossRef] [Green Version]
  4. Makondo, C.C.; Thomas, D.S. Climate change adaptation: Linking indigenous knowledge with western science for effective adaptation. Environ. Sci. Policy 2018, 88, 83–91. [Google Scholar] [CrossRef]
  5. Haghtalab, N.; Goodarzi, M.; Habib, N.M.; Yavari, A.R.; Jafari, H.R. Climate modeling in Tehran & Mazandaran provinces by LARSWG and comparing changes in northern and southern central Alborz hillside. J. Environ. Sci. Technol. 2013, 15, 38–49. [Google Scholar]
  6. Araos, M.; Berrang-Ford, L.; Ford, J.D.; Austin, S.E.; Biesbroek, R.; Lesnikowski, A. Climate change adaptation planning in large cities: A systematic global assessment. Environ. Sci. Policy 2016, 66, 375–382. [Google Scholar] [CrossRef]
  7. Ghasemzadeh, B.; SaeidehZarabadi, Z.S.; Majedi, H.; Behzadfar, M.; Sharifi, A. Assessment of the impacts of barriers to climate change adaptation in the urban management of tehran: A midex-methods approach. J. Geogr. Space 2020, 81. [Google Scholar]
  8. Anguelovski, I.; Chu, E.; Carmin, J. Variations in approaches to urban climate adaptation: Experiences and experimentation from the global South. Glob. Environ. Chang. 2014, 27, 156–167. [Google Scholar] [CrossRef]
  9. Carter, J.G. Climate change adaptation in European cities. Curr. Opin. Environ. Sustain. 2011, 3, 193–198. [Google Scholar] [CrossRef]
  10. Sharifi, A. Trade-offs and conflicts between urban climate change mitigation and adaptation measures: A literature review. J. Clean. Prod. 2020, 276, 122813. [Google Scholar] [CrossRef]
  11. Ramesh, A.; Banwet, D.; Shankar, R. Modeling the barriers of supply chain collaboration. J. Model. Manag. 2010, 5, 176–193. [Google Scholar]
  12. Valente, S.; Veloso-Gomes, F. Coastal climate adaptation in port-cities: Adaptation deficits, barriers, and challenges ahead. J. Environ. Plan. Manag. 2020, 63, 389–414. [Google Scholar] [CrossRef]
  13. Biesbroek, R.; Klostermann, J.; Termeer, C.; Kabat, P. Barriers to climate change adaptation in the Netherlands. Clim. Law 2011, 2, 181–199. [Google Scholar]
  14. Measham, T.G.; Preston, B.L.; Smith, T.F.; Brooke, C.; Gorddard, R.; Withycombe, G.; Morrison, C. Adapting to climate change through local municipal planning: Barriers and challenges. Mitig. Adapt. Strateg. Glob. Chang. 2011, 16, 889–909. [Google Scholar]
  15. Young, D.; Essex, S. Climate change adaptation in the planning of England’s coastal urban areas: Priorities, barriers and future prospects. J. Environ. Plan. Manag. 2020, 63, 912–934. [Google Scholar] [CrossRef]
  16. Ekstrom, J.A.; Moser, S.C. Identifying and overcoming barriers in urban climate adaptation: Case study findings from the San Francisco Bay Area, California, USA. Urban Clim. 2014, 9, 54–74. [Google Scholar]
  17. Amundsen, H.; Berglund, F.; Westskog, H. Overcoming barriers to climate change adaptation—A question of multilevel governance? Environ. Plan. C Gov. Policy 2010, 28, 276–289. [Google Scholar]
  18. Rivera, C.; Tehler, H.; Wamsler, C. Fragmentation in disaster risk management systems: A barrier for integrated planning. Int. J. Disaster Risk Reduct. 2015, 14, 445–456. [Google Scholar]
  19. Aylett, A. Institutionalizing the urban governance of climate change adaptation: Results of an international survey. Urban Clim. 2015, 14, 4–16. [Google Scholar] [CrossRef] [Green Version]
  20. Whitney, C.K.; Ban, N.C. Barriers and opportunities for social-ecological adaptation to climate change in coastal British Columbia. Ocean Coast. Manag. 2019, 179, 104808. [Google Scholar]
  21. Daneshvar, M.R.M.; Ebrahimi, M.; Nejadsoleymani, H. An overview of climate change in Iran: Facts and statistics. Environ. Syst. Res. 2019, 8, 7. [Google Scholar]
  22. Navazi, A.; Navazi, S. Prioritizing climate change risks with fuzzy-AHP method and providing prevention, reduction, and adaption strategies in Tehran Metropolis. Socio Cult. Strategy J. 2017, 5, 123–142. [Google Scholar]
  23. Ghazal, R.; Ardeshir, A.; Rad, I.Z. Climate change and stormwater management strategies in Tehran. Procedia Eng. 2014, 89, 780–787. [Google Scholar] [CrossRef] [Green Version]
  24. Delfani, S.; Karami, M.; Pasdarshahri, H. The effects of climate change on energy consumption of cooling systems in Tehran. Energy Build. 2010, 42, 1952–1957. [Google Scholar] [CrossRef]
  25. Keikhosravi, Q. The effect of heat waves on the intensification of the heat island of Iran′s metropolises (Tehran, Mashhad, Tabriz, Ahvaz). Urban Clim. 2019, 28, 100453. [Google Scholar] [CrossRef]
  26. Aliakbari, E.; Akbari, M. Interpretive-structural modeling of the factors that affect the viability of Tehran Metropolis. Spat. Plan. (Modares Hum. Sci.) 2017, 21, 1–31. [Google Scholar]
  27. Ziari, K.; Mehrabani, B.F.; Farhadikhah, H. Investigating of reorganization and decentralization strategies of Tehran and offering the optimal pattern. Town Ctry. Plan. 2016, 8, 1–34. [Google Scholar]
  28. Ahmadi, M.; Motamedvaziri, B.; Ahmadi, H.; Moeini, A.; Zehtabiyan, G.R. Assessment of climate change impact on surface runoff, statistical downscaling and hydrological modeling. Phys. Chem. Earth Parts A/B/C 2019, 114, 102800. [Google Scholar]
  29. Moghadas, M.; Asadzadeh, A.; Vafeidis, A.; Fekete, A.; Kötter, T. A multi-criteria approach for assessing urban flood resilience in Tehran, Iran. Int. J. Disaster Risk Reduct. 2019, 35, 101069. [Google Scholar] [CrossRef]
  30. Radmehr, A.; Araghinejad, S. Developing strategies for urban flood management of Tehran city using SMCDM and ANN. J. Comput. Civ. Eng. 2014, 28, 05014006. [Google Scholar] [CrossRef]
  31. Hennink, M.M. Focus Group Discussions; Oxford University Press: Oxford, UK, 2014; 221p. [Google Scholar]
  32. Gupta, A.; Suri, P.K.; Singh, R.K. Analyzing the interaction of barriers in e-governance implementation for effective service quality: Interpretive structural modeling approach. Bus. Perspect. Res. 2019, 7, 59–75. [Google Scholar] [CrossRef]
  33. Jackson, D.L. Revisiting sample size and number of parameter estimates: Some support for the N: Q hypothesis. Struct. Equ. Model. 2003, 10, 128–141. [Google Scholar] [CrossRef]
  34. Jain, V.; Raj, T. Modelling and analysis of FMS productivity variables by ISM, SEM and GTMA approach. Front. Mech. Eng. 2014, 9, 218–232. [Google Scholar] [CrossRef]
  35. Watson, R.H. Interpretive structural modeling—A useful tool for technology assessment? Technol. Forecast. Soc. Chang. 1978, 11, 165–185. [Google Scholar] [CrossRef]
  36. Janes, F. Interpretive structural modelling: A methodology for structuring complex issues. Trans. Inst. Meas. Control 1988, 10, 145–154. [Google Scholar] [CrossRef]
  37. Creswell, J.W.; Poth, C.N. Qualitative Inquiry and Research Design: Choosing Among Five Approaches; Sage Publications: Singapore, 2016. [Google Scholar]
  38. Palinkas, L.A.; Horwitz, S.M.; Green, C.A.; Wisdom, J.P.; Duan, N.; Hoagwood, K. Purposeful sampling for qualitative data collection and analysis in mixed method implementation research. Adm. Policy Ment. Health Ment. Health Serv. Res. 2015, 42, 533–544. [Google Scholar] [CrossRef] [Green Version]
  39. Saunders, B.; Sim, J.; Kingstone, T.; Baker, S.; Waterfield, J.; Bartlam, B.; Burroughs, H.; Jinks, C. Saturation in qualitative research: Exploring its conceptualization and operationalization. Qual. Quant. 2018, 52, 1893–1907. [Google Scholar] [CrossRef]
  40. Sharif, F.; Masoumi, S. A qualitative study of nursing student experiences of clinical practice. Bmc Nurs. 2005, 4, 6. [Google Scholar] [CrossRef] [Green Version]
  41. Mayring, P. Qualitative Content Analysis: Theoretical Foundation, Basic Procedures and Software Solution, GESIS– Leibniz Institute for the Social Sciences. Available online: https://www.ssoar.info/ssoar/bitstream/handle/document/39517/ssoar-2014-mayring-Qualitative_content_analysis_theoretical_foundation.pdf (accessed on 11 September 2020).
  42. Joshi, A.; Kale, S.; Chandel, S.; Pal, D.K. Likert scale: Explored and explained. Curr. J. Appl. Sci. Technol. 2015, 7, 396–403. [Google Scholar] [CrossRef]
  43. Thirupathi, R.; Vinodh, S. Application of interpretive structural modelling and structural equation modelling for analysis of sustainable manufacturing factors in Indian automotive component sector. Int. J. Prod. Res. 2016, 54, 6661–6682. [Google Scholar] [CrossRef]
  44. Joshi, K.; Kant, R. Structuring the underlying relations among the enablers of supply chain collaboration. Int. J. Collab. Enterp. 2012, 3, 38–59. [Google Scholar] [CrossRef]
  45. Sivaprakasam, R.; Selladurai, V.; Sasikumar, P. Implementation of interpretive structural modelling methodology as a strategic decision making tool in a Green Supply Chain Context. Ann. Oper. Res. 2015, 233, 423–448. [Google Scholar] [CrossRef]
  46. Avinash, A.; Sasikumar, P.; Murugesan, A. Understanding the interaction among the barriers of biodiesel production from waste cooking oil in India-an interpretive structural modeling approach. Renew. Energy 2018, 127, 678–684. [Google Scholar] [CrossRef]
  47. Attri, R.; Singh, B.; Mehra, S. Analysis of interaction among the barriers to 5S implementation using interpretive structural modeling approach. Benchmarking Int. J. 2017, 24, 1834–1853. [Google Scholar] [CrossRef]
  48. Morrison, D.F. Multivariate Statistical Methods; McGraw-Hill: New York, NY, USA, 1976. [Google Scholar]
  49. Fornell, C.; Larcker, D.F. Evaluating structural equation models with unobservable variables and measurement error. J. Mark. Res. 1981, 18, 39–50. [Google Scholar] [CrossRef]
  50. Byrne, B.M. Structural equation modeling with AMOS, EQS, and LISREL: Comparative approaches to testing for the factorial validity of a measuring instrument. Int. J. Test. 2001, 1, 55–86. [Google Scholar] [CrossRef]
  51. Ma, G.; Jia, J.; Ding, J.; Shang, S.; Jiang, S. Interpretive structural model based factor analysis of BIM adoption in Chinese construction organizations. Sustainability 2019, 11, 1982. [Google Scholar] [CrossRef] [Green Version]
  52. Ruth, M.; Coelho, D. Understanding and managing the complexity of urban systems under climate change. Clim. Policy 2007, 7, 317–336. [Google Scholar] [CrossRef]
  53. Chanza, N.; Chigona, A.; Nyahuye, A.; Mataera-Chanza, L.; Mundoga, T.; Nondo, N. Diagnosing barriers to climate change adaptation at community level: Reflections from Silobela, Zimbabwe. GeoJournal 2019, 84, 771–783. [Google Scholar] [CrossRef]
  54. Calthorpe, P. Urbanism in the Age of Climate Change; Island Press: Washington, DC, USA, 2015. [Google Scholar]
Figure 1. Tehran’s geographical position [30].
Climate 08 00104 g001
Figure 2. Flowchart of the study (G refers to research goals).
Climate 08 00104 g002
Figure 3. Flowchart for preparing interpretive structural modeling (ISM).
Climate 08 00104 g003
Figure 4. Results of the confirmatory factor analysis (see Table 1 for the codes).
Climate 08 00104 g004
Figure 5. Interrelationships among nine barriers to climate change adaptation in Tehran.
Climate 08 00104 g005
Figure 6. ISM based framework for barriers to climate change adaptation in Tehran’s urban management.
Climate 08 00104 g006
Figure 7. Driving power-dependence diagram for the barriers to climate change adaptation.
Climate 08 00104 g007
Table 1. Themes and sub-themes identified through focus group discussions (FGDs) as barriers to climate change adaptation [7].
RowThemesSub-Themes
1Structure and culture of research (A)A1: The absence of a center or research institute to support decision making and policy making.
A2: The absence of a centralized and specialized mechanism for defining, assessing, and applying studies on climate change and adaptation to it.
A3: Failed attempts, unsavory experiences, and the inability of academics in conducting research on climate change adaptation.
2Awareness, education, and knowledge (B)B1: Low awareness of climate change and its related strategies.
B2: The absence of appropriate programs for continuous advancement of knowledge and awareness.
B3: The underperformance of specialized and public media.
3Social (C)C1: Citizens’ disinterest.
C2: The limited number of NGOs.
C3: Low responsibility and commitment.
4Resources and resource management (D)D1: Grudging governmental institutes in granting access to data.
D2: Insufficient national and local data.
D3: Logistical challenges both in terms of software and hardware.
5Laws and regulations (E)E1: Drastic underrepresentation of climate change and adaptation to it in laws and regulations.
E2: Incongruity of local and national plans and regulations.
E3: Legal loopholes in regulations on climate change.
E4: The lack of supervision of the performance of municipalities.
6Communication and interaction (F)F1: The lack of communication with other countries with successful experience.
F2: Poor interaction of the related bodies with domestic and foreign experts.
7Economy (G)G1: The lack of research funds for climate change adaptation.
G2: The low and unstable incomes of municipalities.
8Governance (H)H1: Structural characteristics and old-fashioned management procedures.
Contradictions in engineering standards and instructions.
H2: The lack of integrated urban management.
H3: Previous failed attempts.
H4: The poor participation and utilization of municipalities in related programs.
9Planning (I)I1: The absence of a local independent body within municipalities for policy making.
I2: Fragmented approaches toward land use planning.
I3: The absence of a domestic model of adaptation.
I4: The poor performance of authorities in charge of tackling climate change.
I5: The absence of proper mechanisms for the evaluation of urban programs.
I6: The absence of an integrated local plan for climate change adaptation.
Table 2. Statistics of barriers.
BarriersNotationMeanQuestionsMedianModeStandard
Deviation
RangeCronbach’s AlphaOne Sample t-test
Test Value = 3
Structure and culture of researchA3.39831–33.3330.9131440.7256.169
Awareness, education, and knowledgeB3.44834–63.6740.9185740.7146.902
Social C3.71177–9440.90740.7211.096
Resources and resource managementD3.5110–123.6740.9527740.737.57
Laws and regulationsE3.24513–163.2531.0898640.7853.179
Communication and interactionF3.717517–18451.1686640.7548.683
EconomyG3.47519–203.551.2387740.7145.423
GovernanceH3.50921–253.641.0146340.8147.095
PlanningI3.49526–313.6751.0152340.8666.895
Table 3. Results of confirmatory factor analysis.
No.BarriersVariables/ItemsStandardized EstimateAVE
1


A


A10.7730.77
A20.643
A30.711
2

B

B10.8760.68
B20.678
B30.455
3

C

C10.5260.7
C20.854
C30.67
4

D

D10.6710.69
D20.733
D30.677
5


E


E10.5961.12
E20.684
E30.727
E40.766
6
F
F10.7710.65
F20.744
7
G
G10.7070.59
G20.764
8


H


H10.6491.13
H20.659
H30.735
H40.784
H50.95
9


I


I111.69
I21.176
I31.109
I41.114
I50.971
I61.22
Table 4. Discriminant validity.
ABCDEFGHI
A0.77
B0.46240.68
C0.0466560.0424360.7
D0.7106490.3906250.0376360.69
E0.1062760.0610090.0001440.1017611.12
F0.1806250.1115560.0001690.1814760.8723560.65
G0.1789290.0702250.0000160.1900960.6707610.9467290.59
H0.0756250.0309760.0029160.0501760.7259040.6740410.5550251.13
I0.1398760.0580810.0038440.1267360.7191040.7867690.6955560.9235211.61
Table 5. Discriminant validity of the barriers to climate change adaptation.
Relations EstimateS.E.C.R.Standardized Regression Weights
E<---A0.6740.0551.10.051
H<---E0.9610.04614.760.723
G<---H1.010.09210.4370.785
F<---H0.0510.0812.6350.875
D<---G0.0710.0580.8880.068
D<---F0.4570.0621.1430.089
B<---D0.1480.0627.4370.466
C<---B0.0590.072.1180.149
I<---B0.6740.0481.2470.053
<--- Means the causal path from variable A to E.
Table 6. Structural self-interaction matrix (SSIM).
PlanningGovernanceEconomy Communication and InteractionLaws and RegulationsResources and Their ManagementSocial Awareness, Education, and KnowledgeStructure and Culture of Research
XVXVOAVX
XVAXXAAX
X OXOAAX
V AAAAV
V VVVV
V XAV
V AV
X X

