
Influence of Light Intensity and Spectrum on Duckweed Growth and Proteins in a Small-Scale, Re-Circulating Indoor Vertical Farm

 , , , and
Abstract
:1. Introduction
2. Materials and Methods
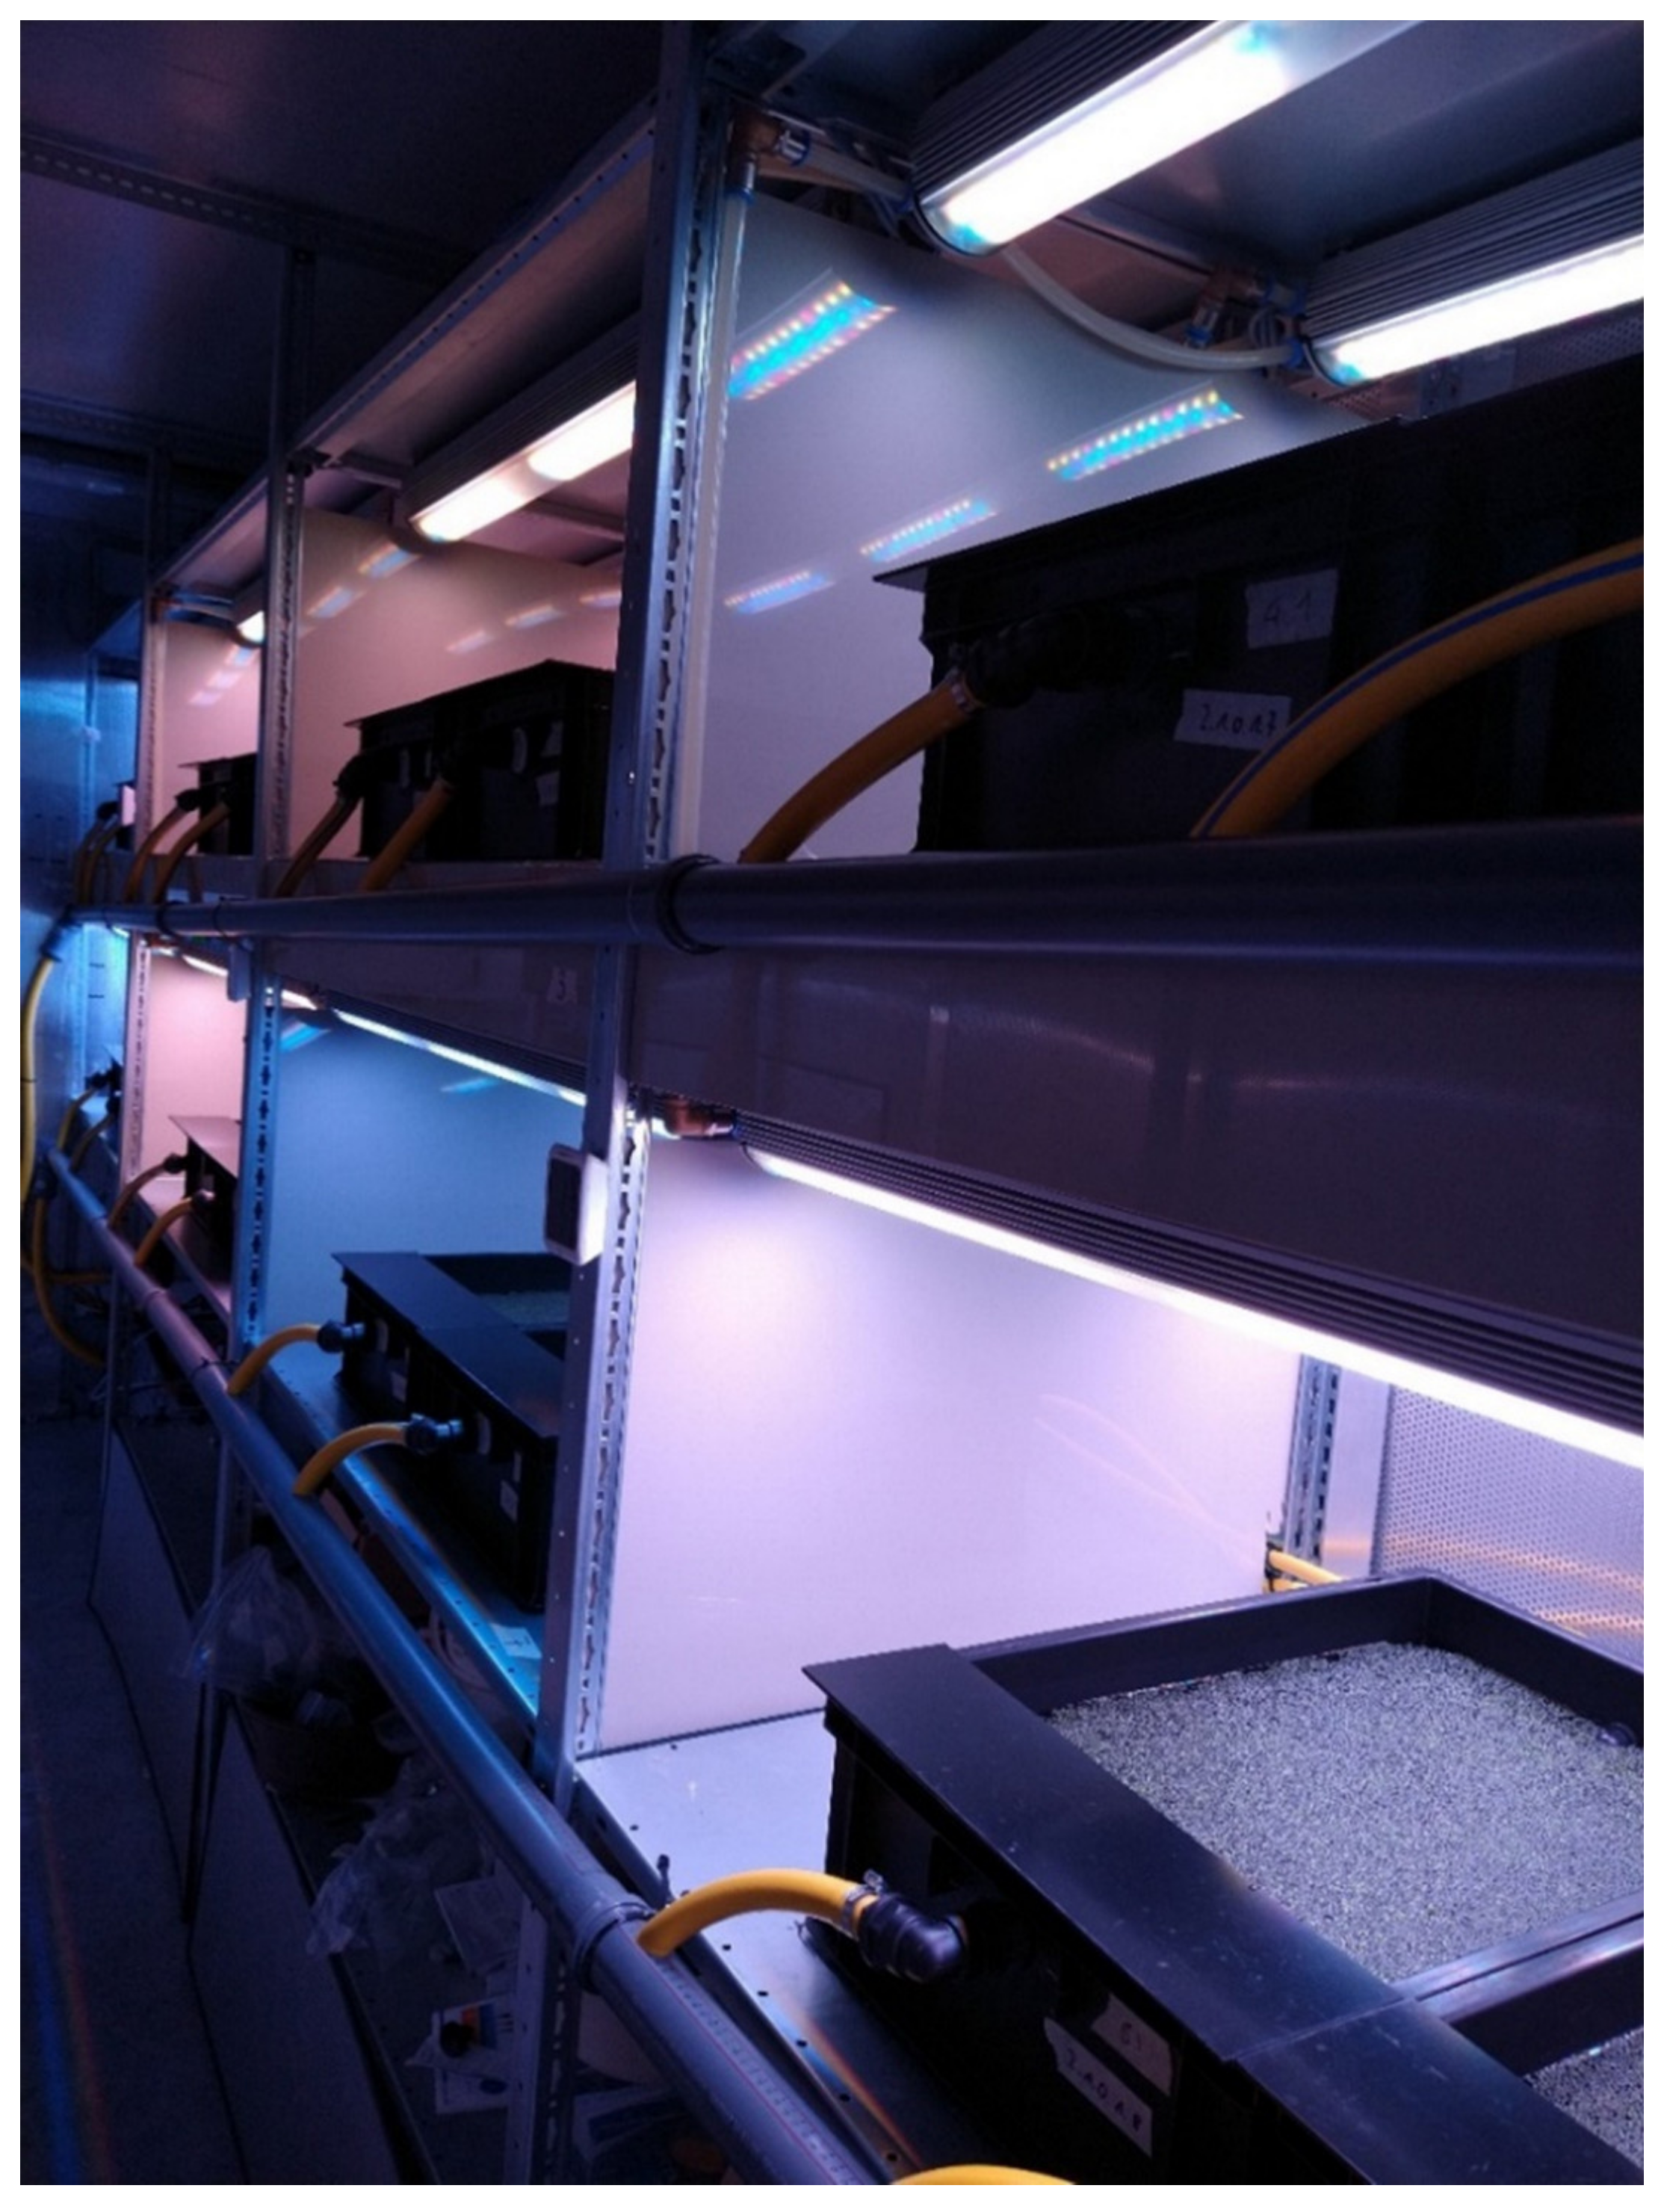
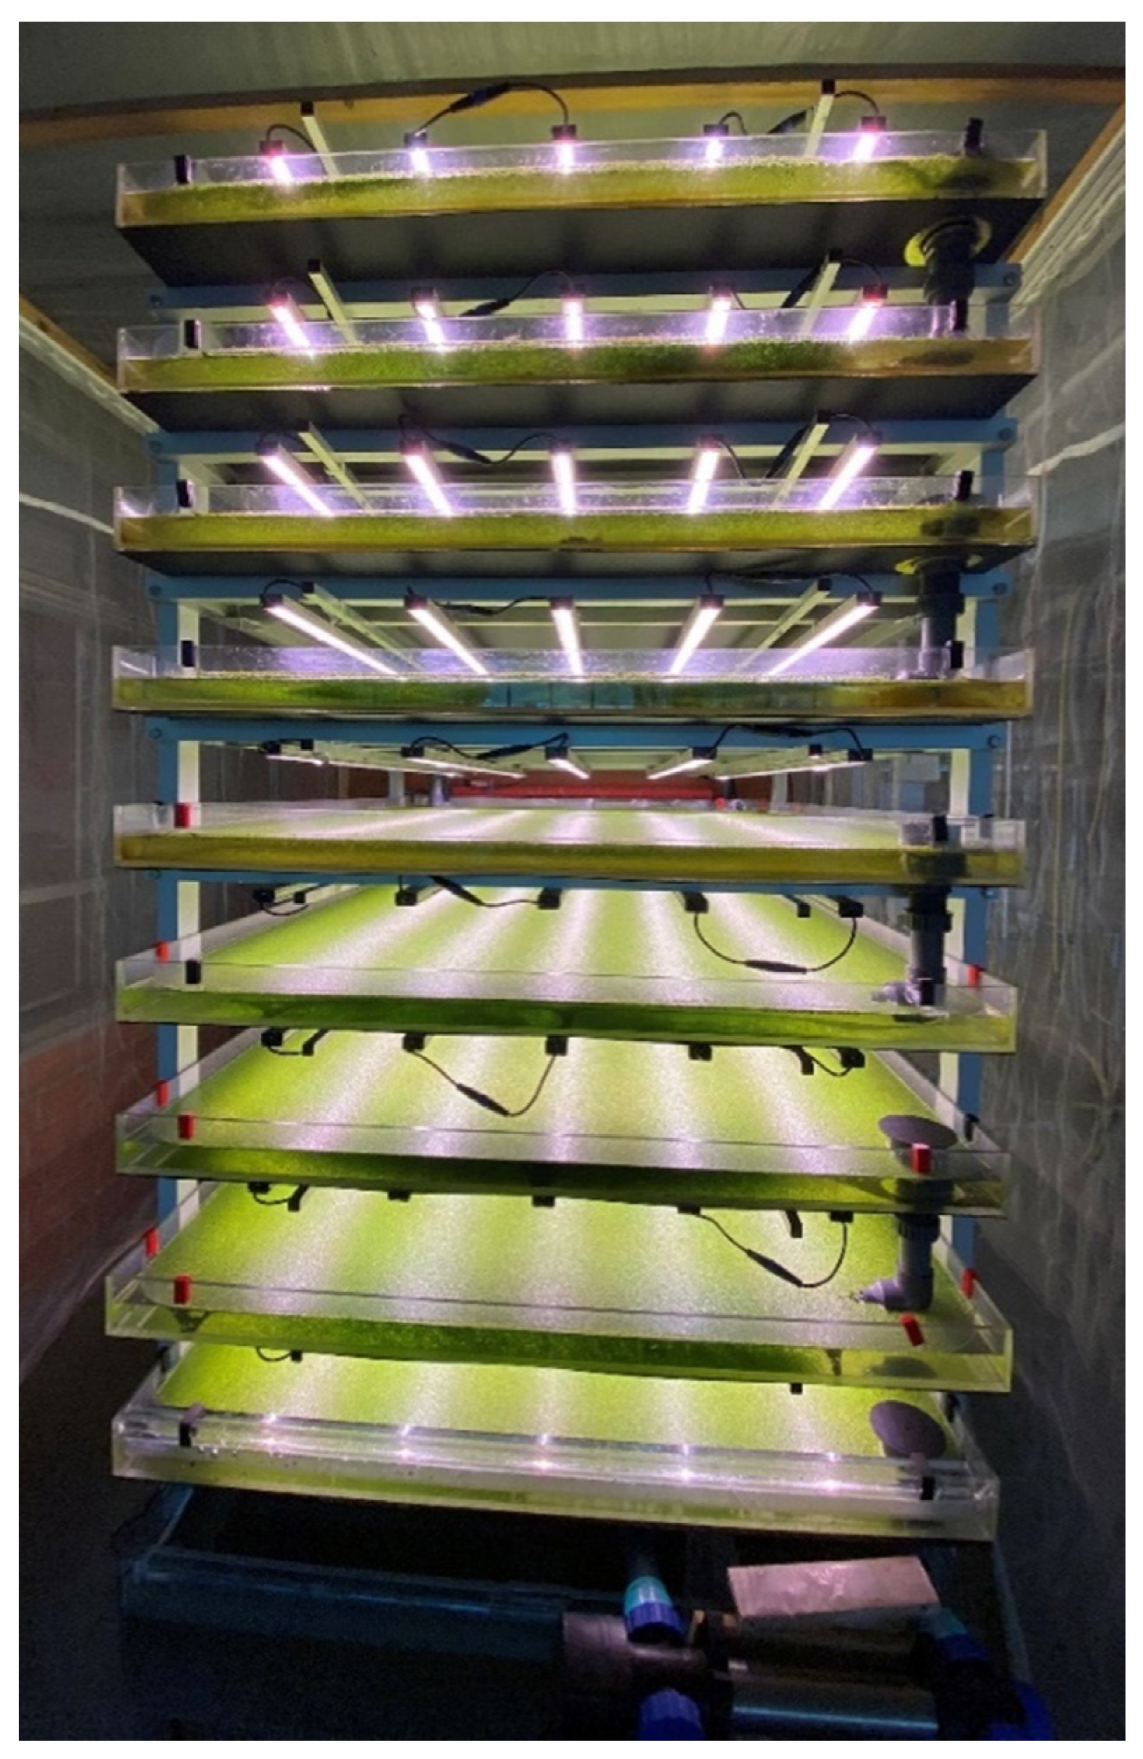
2.1. Indoor Vertical Farm
2.2. Experimental Design
2.3. Analytical Methods
2.3.1. Relative Growth Rate
2.3.2. Crude Protein Content and Relative Protein Yield
2.3.3. Chlorophyll a
- ωChlorophyll-a: Chlorophyll a content (mg/g FW);
- A665v: Absorption of the extract before acidification, measured at 665 nm;
- A750v: Absorption of the extract before acidification, measured at 750 nm (for the correction of phaeopigments);
- A665n: Absorption of the extract after acidification, measured at 665 nm;
- A750n: Absorption of the extract after acidification, measured at 750 nm (for the correction of phaeopigments);
- R: Ratio of A665v/A665n for pure Chlorophyll-a; R = 1.7;
- VE: Volume of the extract in milliliters (ml);
- mP: Net weight of the duckweed biomass sample (g);
- d: Thickness of the cuvette (cm); d = 1.
2.3.4. Nutrient Solution
2.4. Statistics
3. Results
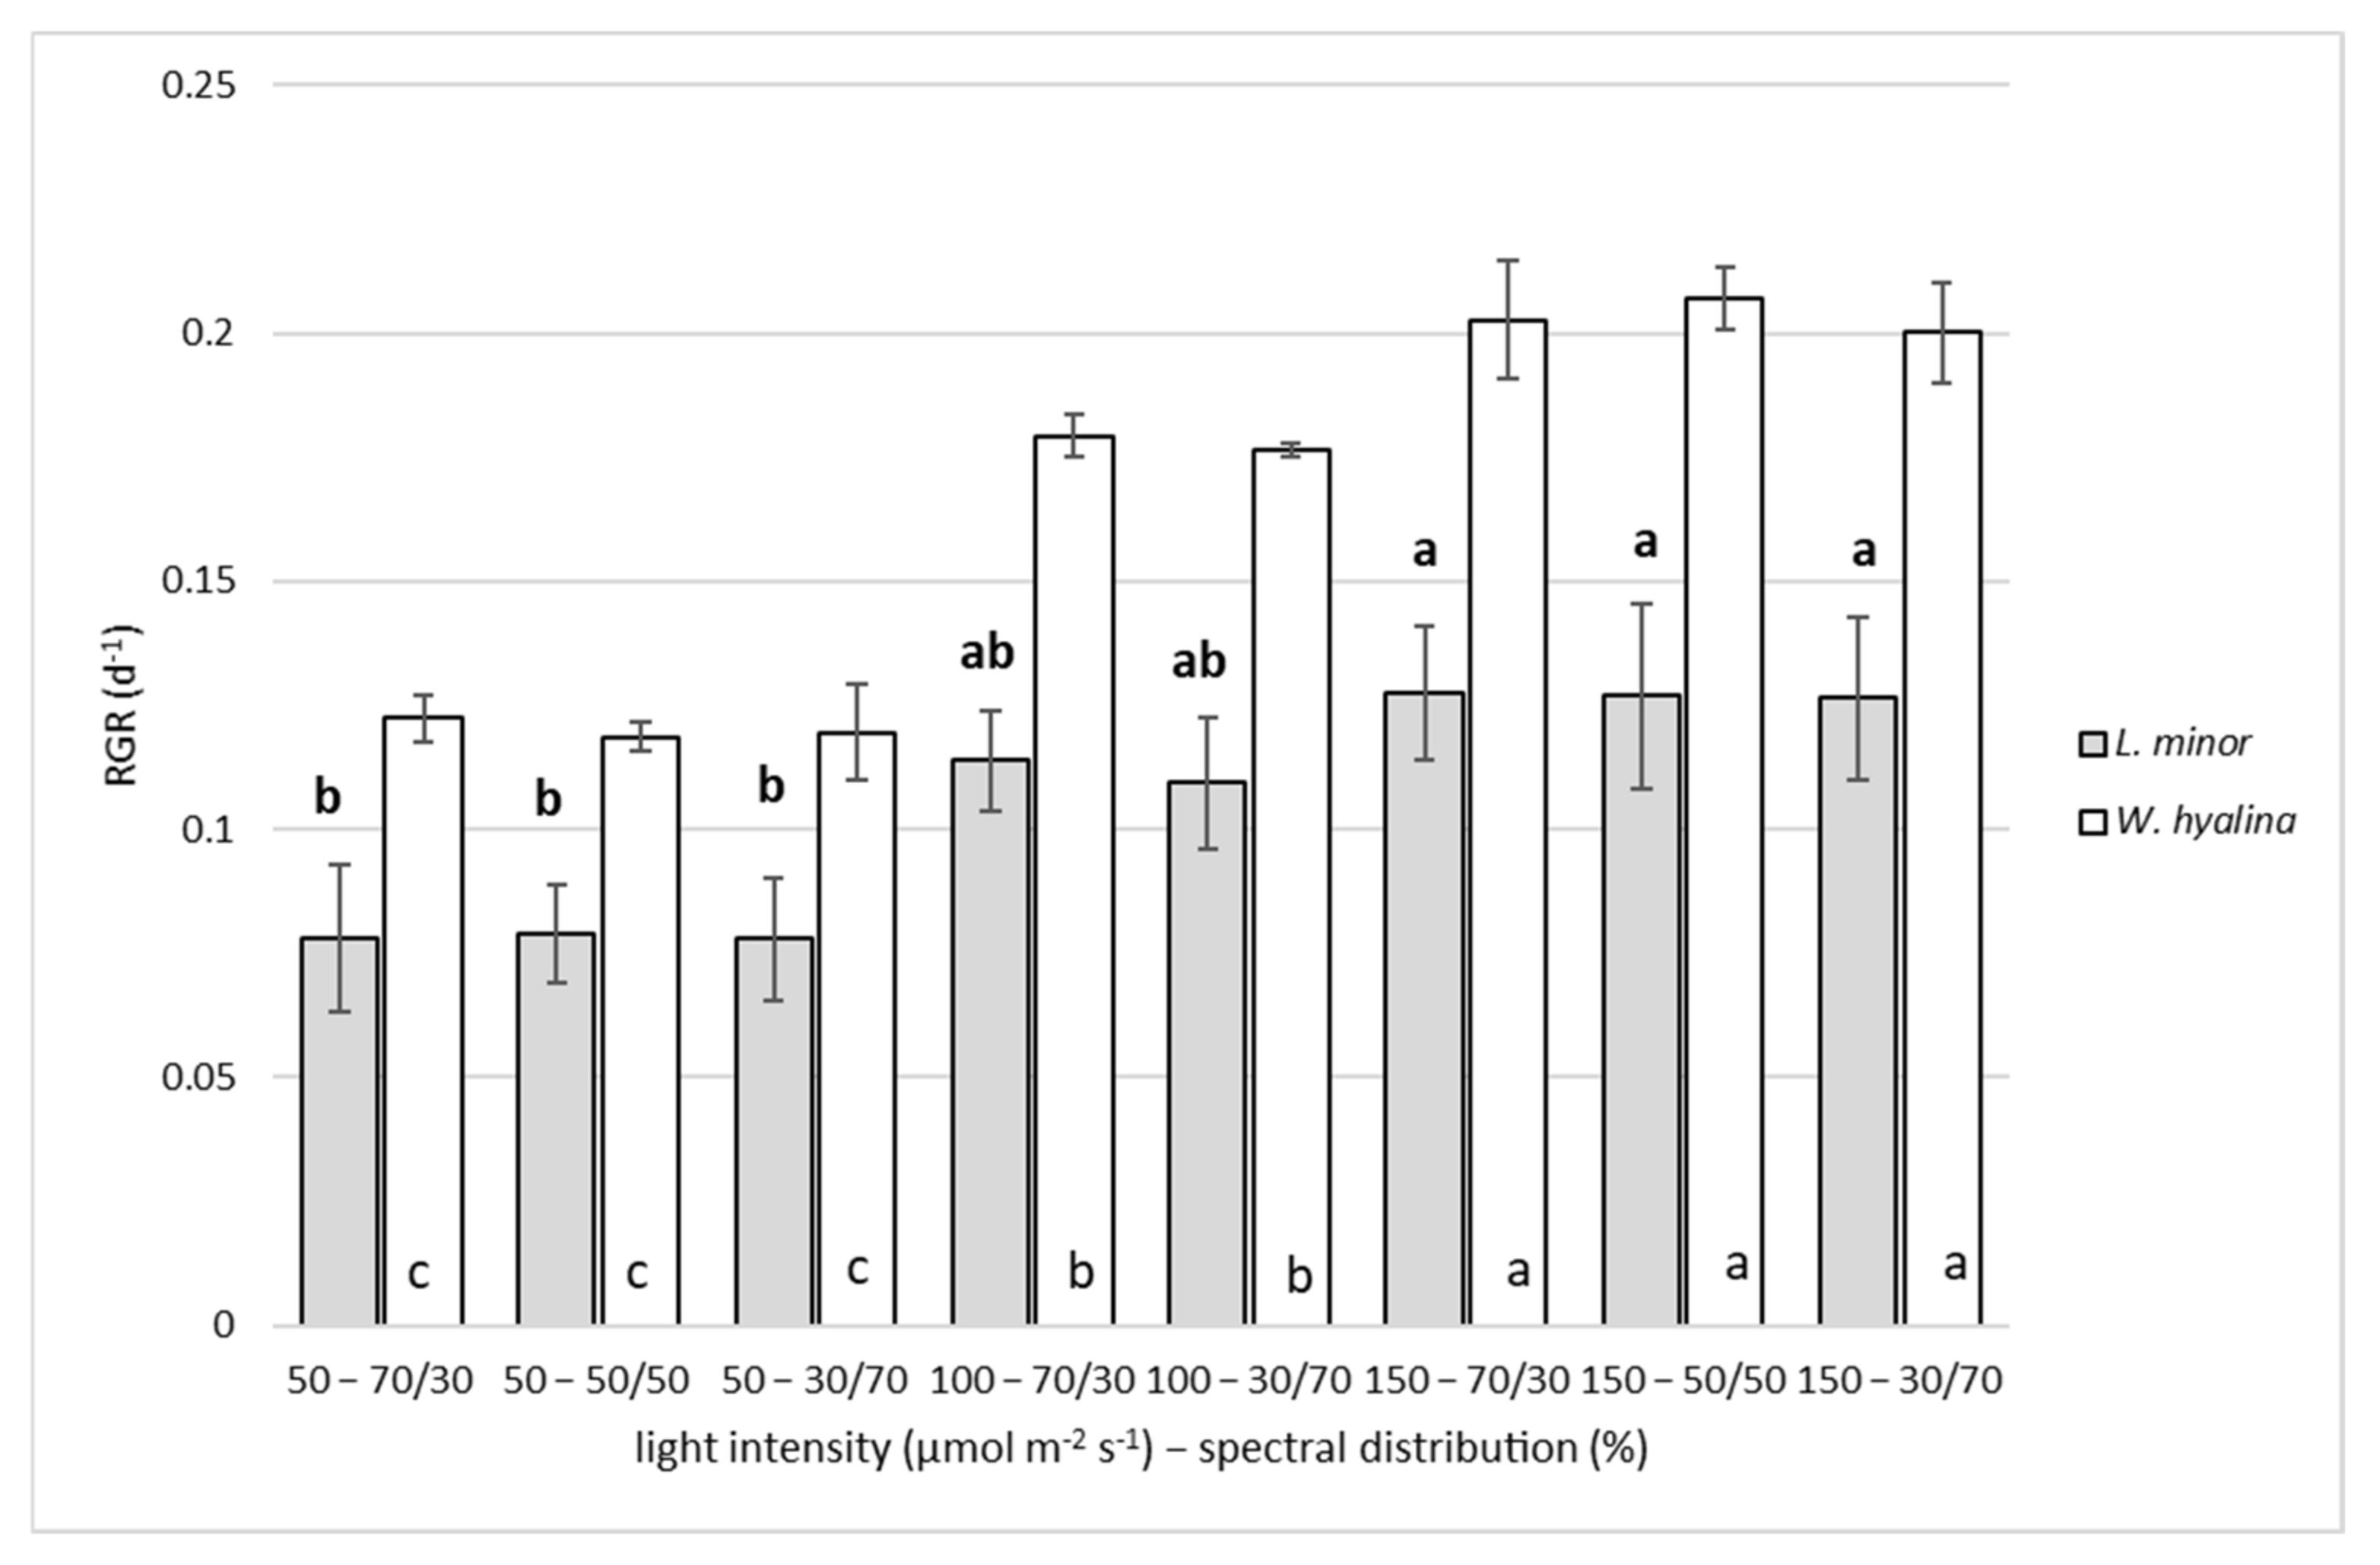
3.1. Relative Growth Rate
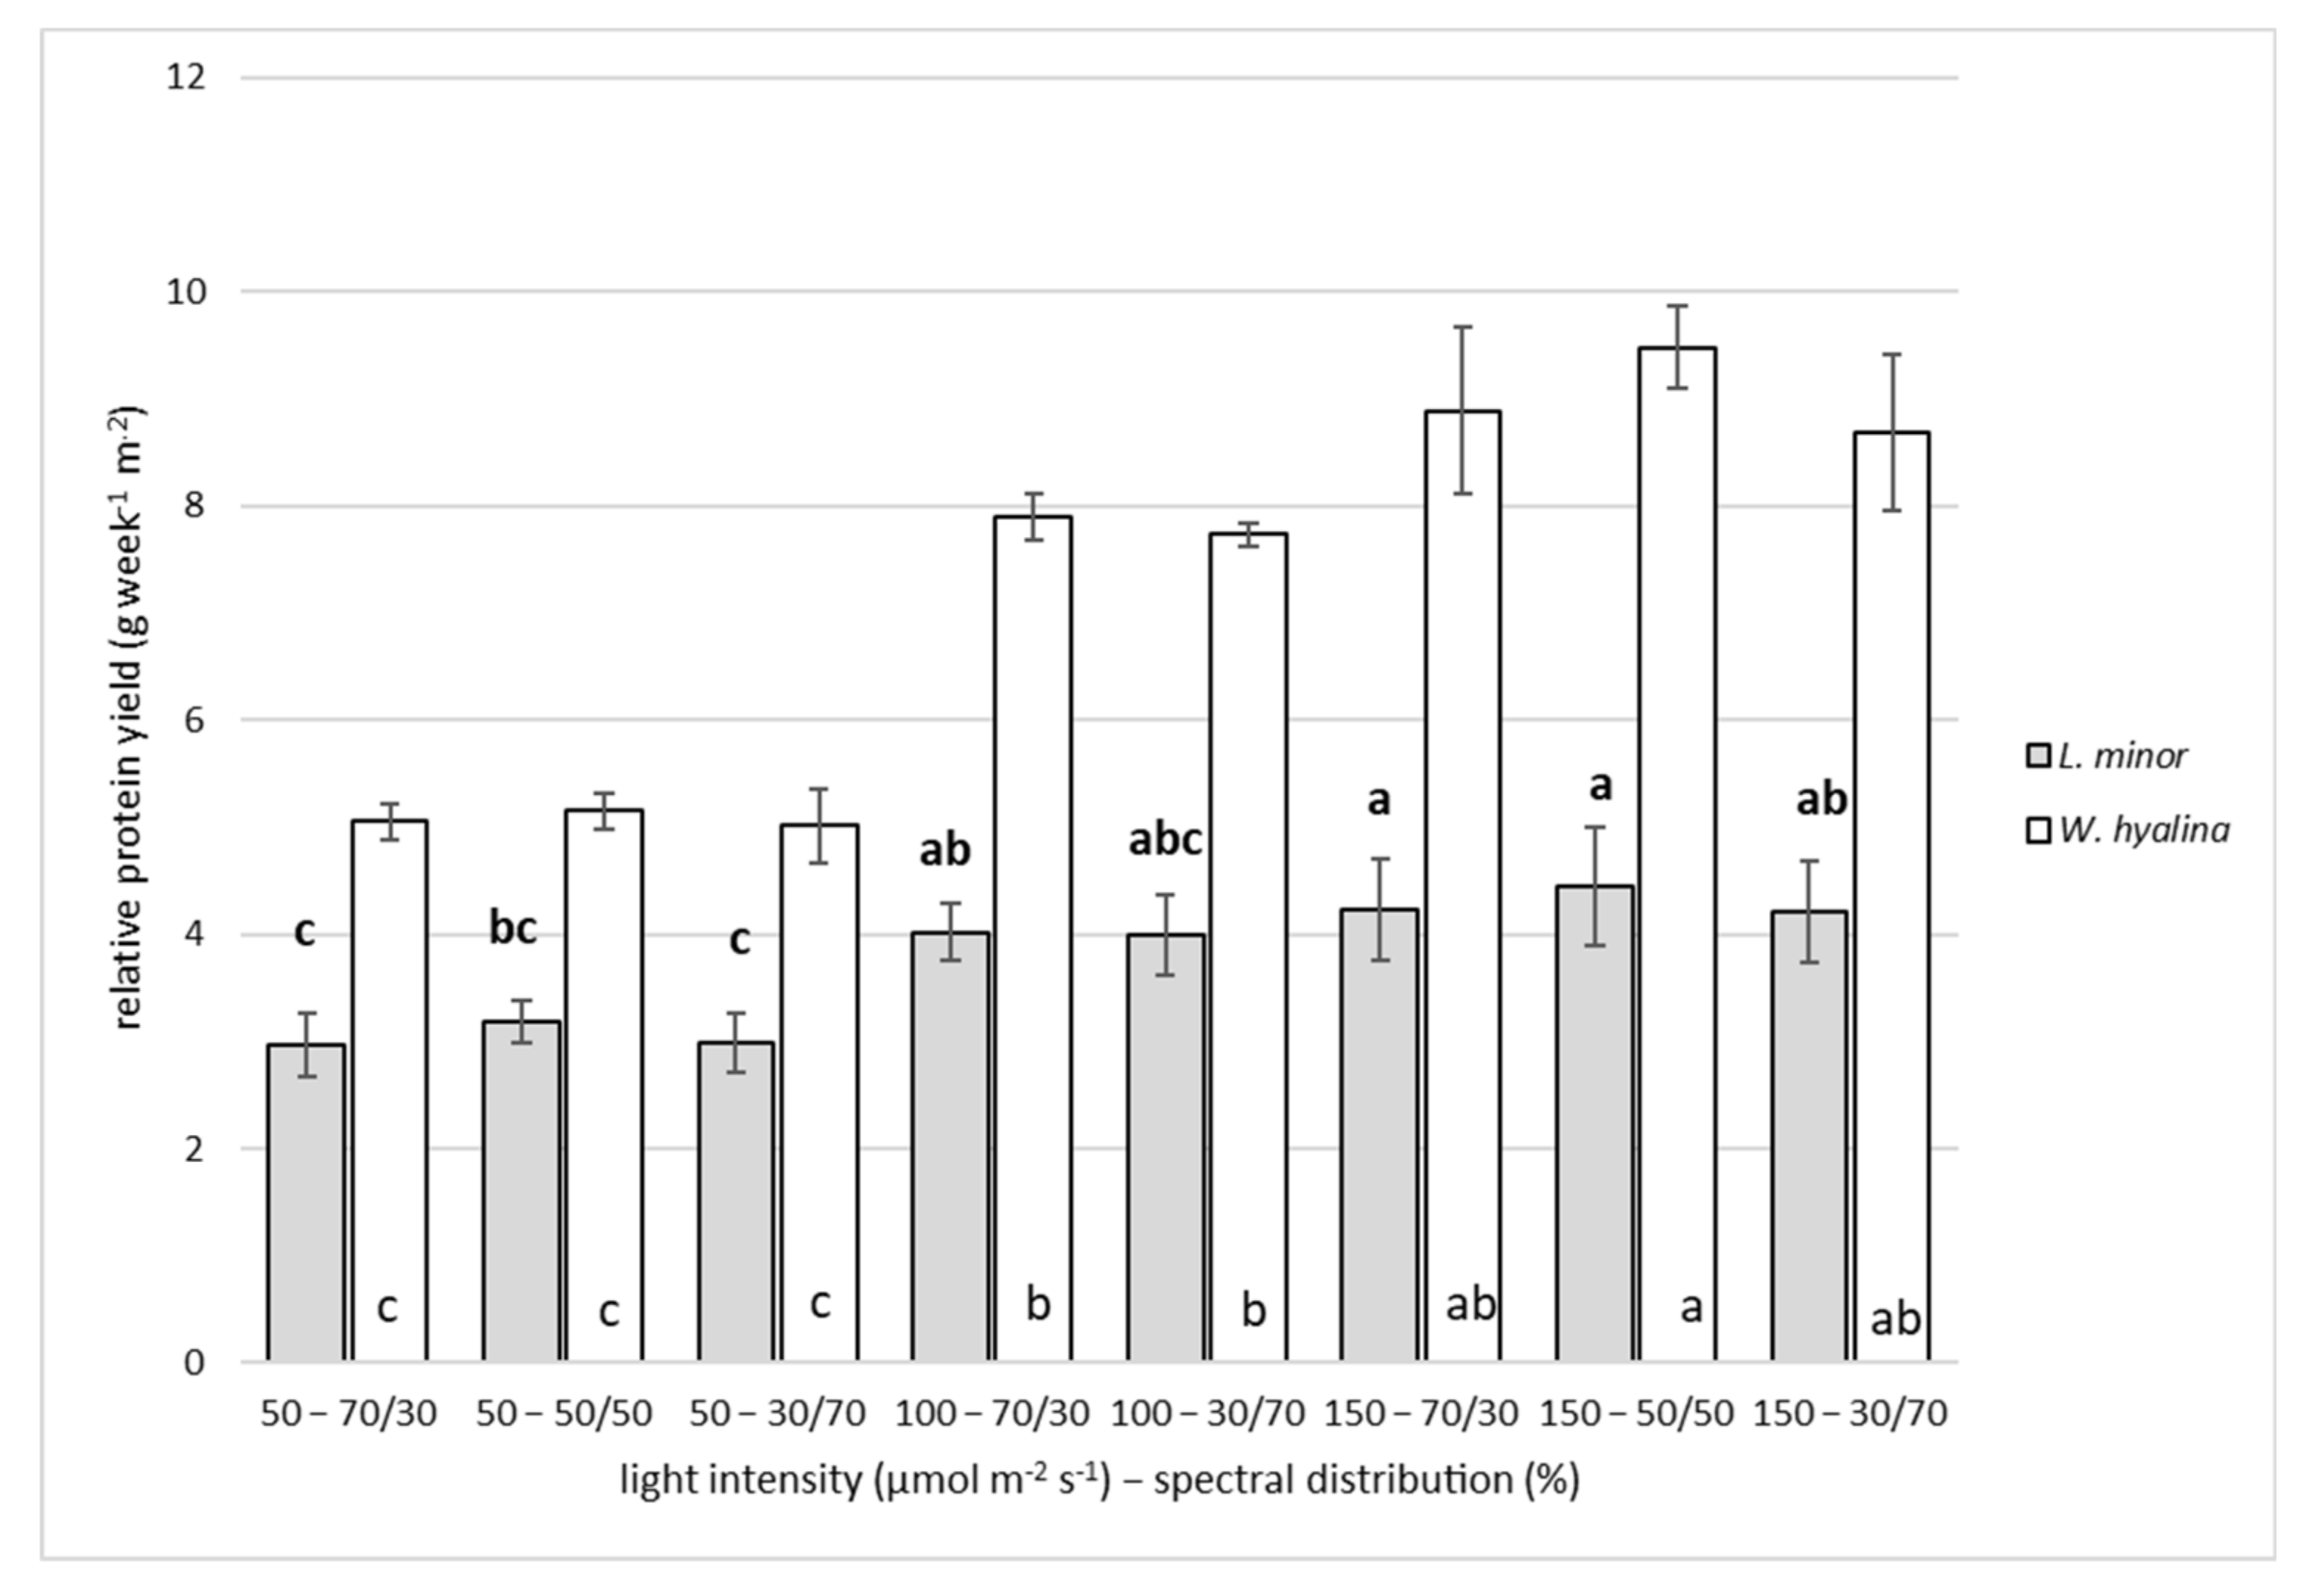
3.2. Crude Protein Content and Relative Protein Yield
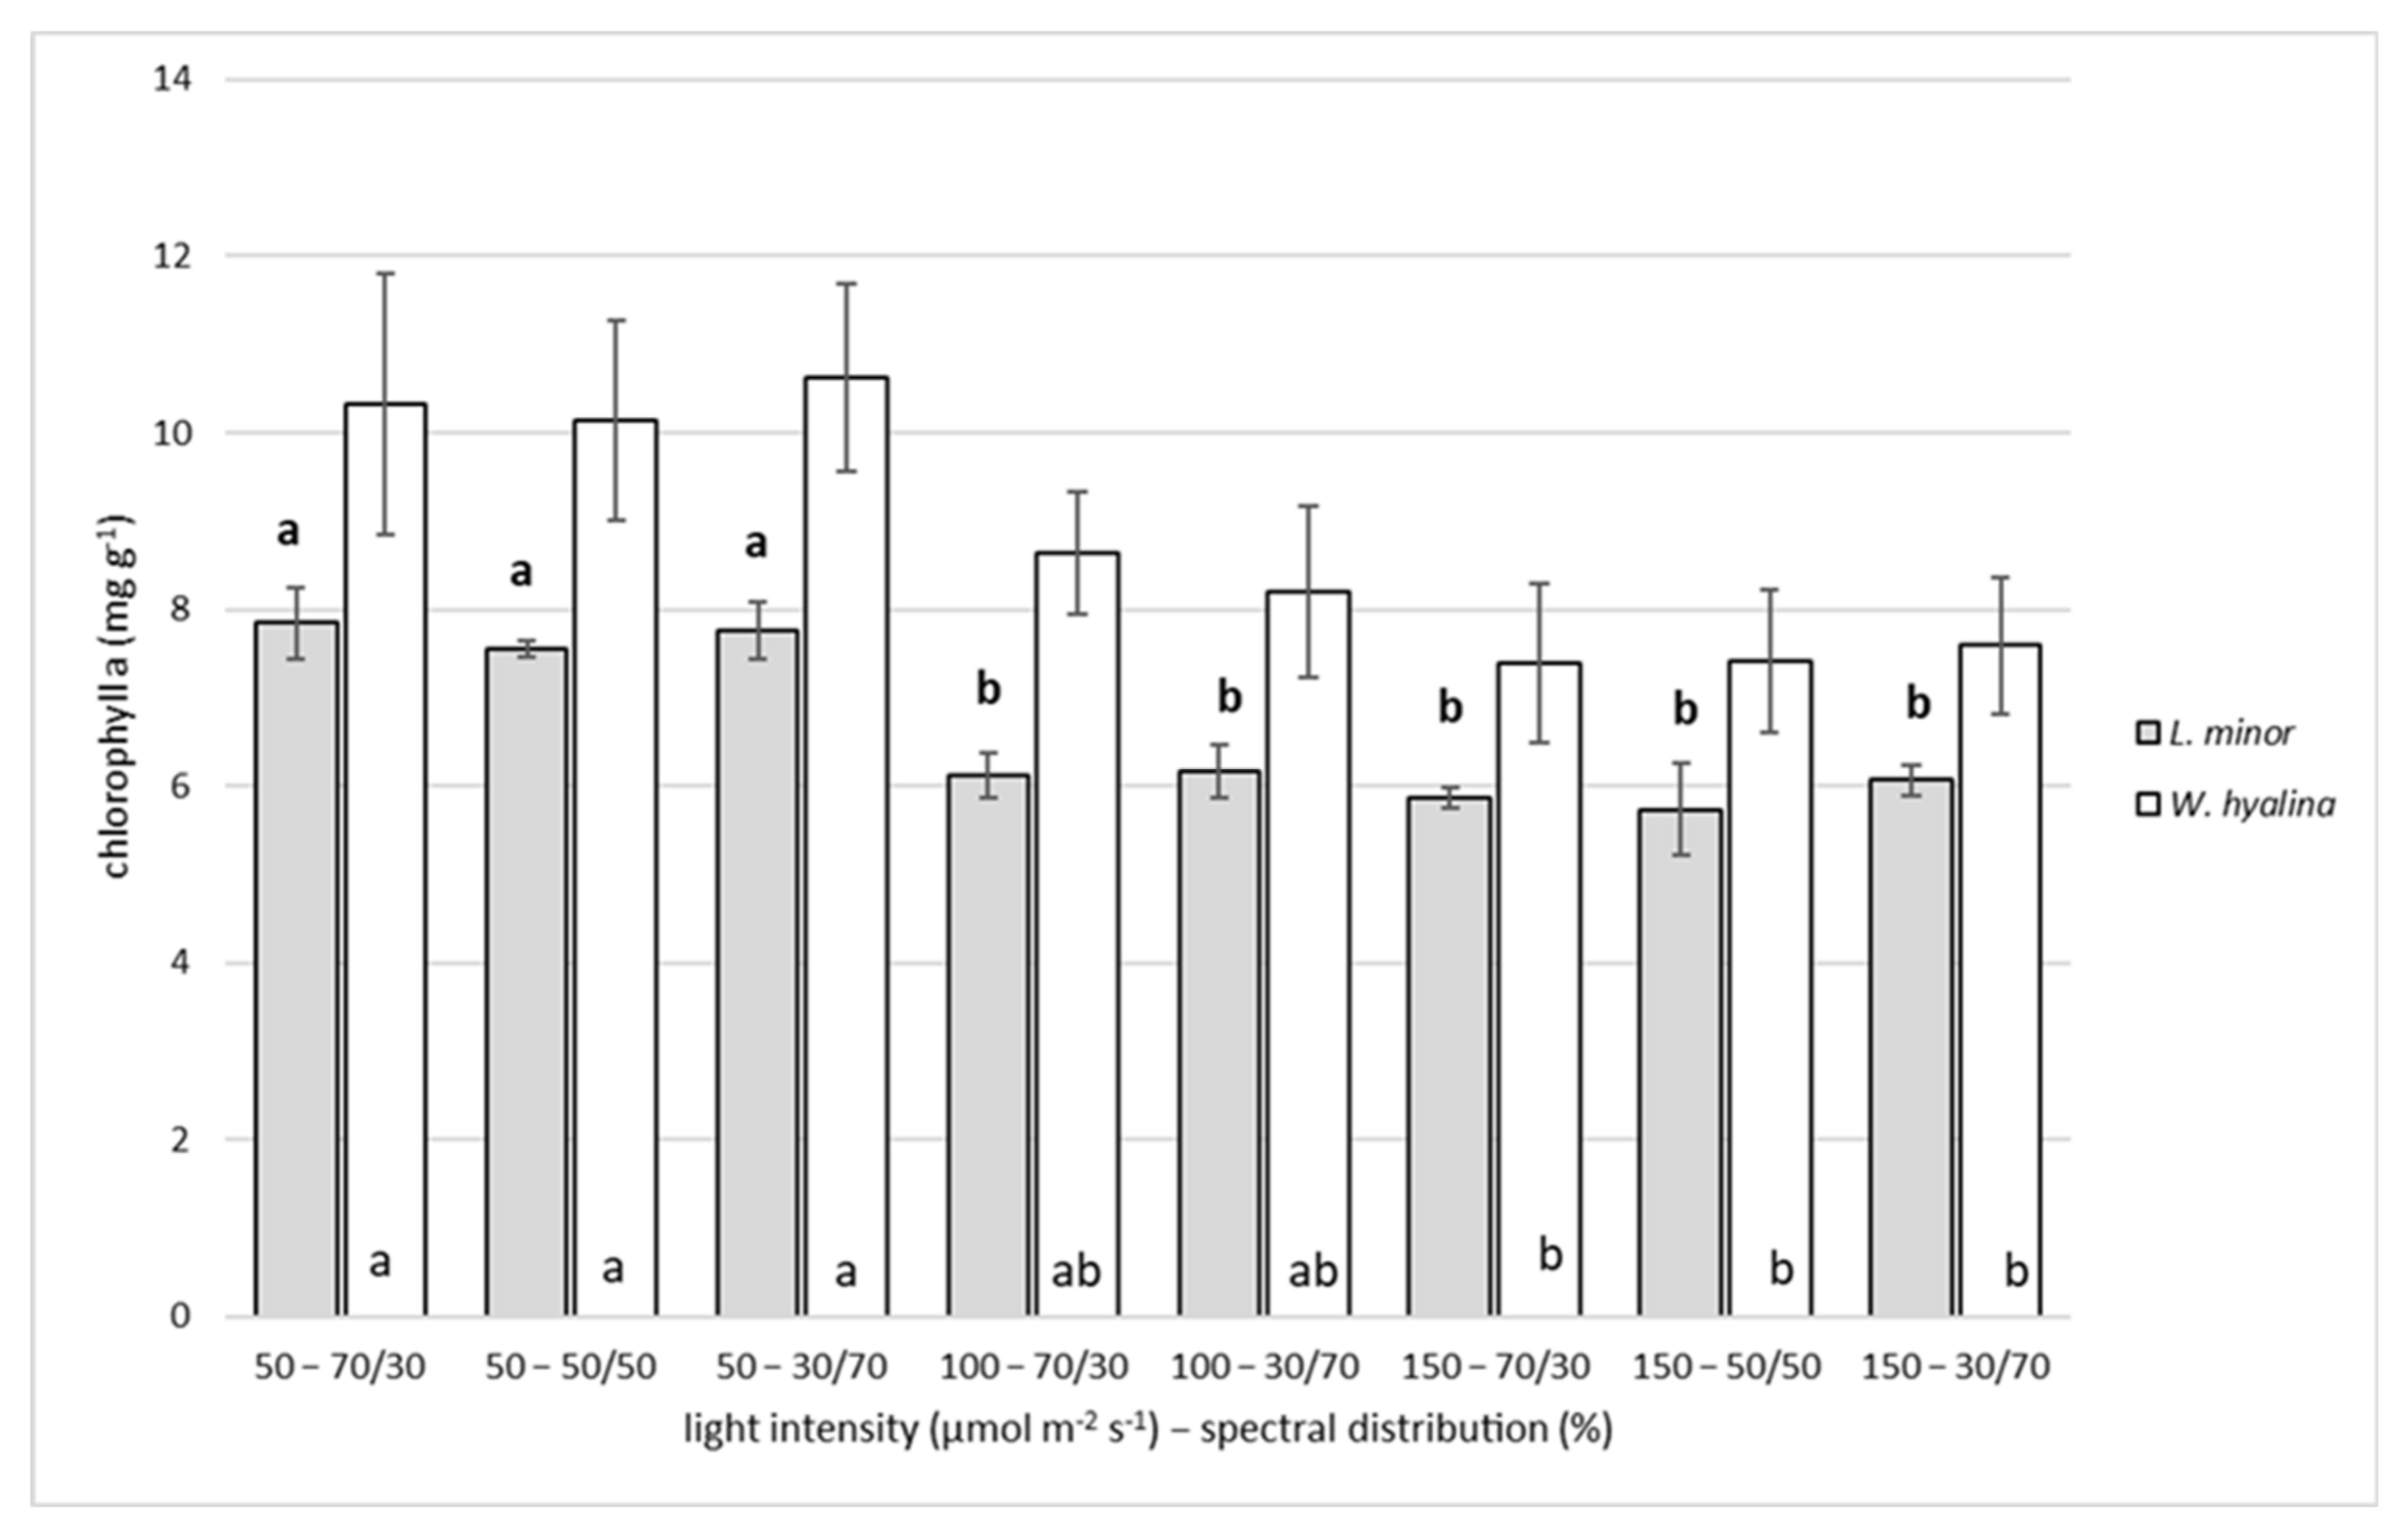
3.3. Chlorophyll a
3.4. Nutrients
4. Discussion
4.1. Relative Growth Rate
4.2. Crude Protein Content and Relative Protein Yield
4.3. Chlorophyll
5. Conclusions
Supplementary Materials
Author Contributions
Funding
Institutional Review Board Statement
Informed Consent Statement
Data Availability Statement
Conflicts of Interest
References
- Bog, M.; Sree, K.S.; Fuchs, J.; Hoang, P.T.; Schubert, I.; Kuever, J.; Rabenstein, A.; Paolacci, S.; Jansen, M.A.; Appenroth, K.-J. A taxonomic revision of Lemna sect. Uninerves (Lemnaceae). TAXON 2020, 69, 56–66. [Google Scholar] [CrossRef] [Green Version]
- Bog, M.; Appenroth, K.-J.; Sree, K.S. Duckweed (Lemnaceae): Its Molecular Taxonomy. Front. Sustain. Food Syst. 2019, 3, 117. [Google Scholar] [CrossRef]
- Tippery, N.P.; Les, D.H.; Appenroth, K.J.; Sree, K.S.; Crawford, D.J.; Bog, M. Lemnaceae and Orontiaceae Are Phylogenetically and Morphologically Distinct from Araceae. Plants 2021, 10, 2639. [Google Scholar] [CrossRef] [PubMed]
- Martinov, I. Techno-Botanical Dictionary (Технo-Бoтанический Слoварь); Pechashano v Imperatorskoĭ Tipografii: Saint Petersburg, Russia, 1820. [Google Scholar]
- Sree, K.S.; Sudakaran, S.; Appenroth, K.J. How fast can angiosperms grow? Species and clonal diversity of growth rates in the genus Wolffia (Lemnaceae). Acta Physiol. Plant. 2015, 37, 204. [Google Scholar] [CrossRef]
- Ziegler, P.; Adelmann, K.; Zimmer, S.; Schmidt, C.; Appenroth, K.J. Relative in vitro growth rates of duckweeds (Lemnaceae)—The most rapidly growing higher plants. Plant Biol. 2015, 17, 33–41. [Google Scholar] [CrossRef]
- Xu, J.; Shen, G. Growing duckweed in swine wastewater for nutrient recovery and biomass production. Bioresour. Technol. 2011, 102, 848–853. [Google Scholar] [CrossRef]
- Cedergreen, N.; Vindbæk Madsen, T. Nitrogen uptake by the floating macrophyte Lemna minor. New Phytol. 2002, 155, 285–292. [Google Scholar] [CrossRef]
- Appenroth, K.J.; Sree, K.S.; Böhm, V.; Hammann, S.; Vetter, W.; Leiterer, M.; Jahreis, G. Nutritional value of duckweeds (Lemnaceae) as human food. Food Chem. 2017, 217, 266–273. [Google Scholar] [CrossRef]
- Appenroth, K.J.; Sree, K.S.; Bog, M.; Ecker, J.; Seeliger, C.; Böhm, V.; Lorkowski, S.; Sommer, K.; Vetter, W.; Tolzin-Banasch, K. Nutritional value of the duckweed species of the genus Wolffia (Lemnaceae) as human food. Front. Chem. 2018, 6, 483. [Google Scholar] [CrossRef] [Green Version]
- Xu, J.; Cheng, J.; Stomp, A.M. Growing Spirodela polyrhiza in swine wastewater for the production of animal feed and fuel ethanol: A Pilot Study. Clean Soil Air Water 2012, 40, 760–765. [Google Scholar] [CrossRef]
- Xu, J.; Cui, W.; Cheng, J.J.; Stomp, A.M. Production of high-starch duckweed and its conversion to bioethanol. Biosyst. Eng. 2011, 110, 67–72. [Google Scholar] [CrossRef]
- Coughlan, N.E.; Walsh, É.; Bolger, P.; Burnell, G.; O’Leary, N.; O’Mahoney, M.; Paolacci, S.; Wall, D.; Jansen, M.A. Duckweed bioreactors: Challenges and opportunities for large-scale indoor cultivation of Lemnaceae. J. Clean. Prod. 2022, 336, 130285. [Google Scholar] [CrossRef]
- Keuter, V.; Deck, S.; Giesenkamp, H.; Gonglach, D.; Katayama, V.T.; Liesegang, S.; Petersen, F.; Schwindenhammer, S.; Steinmetz, H.; Ulbrich, A. Significance and Vision of Nutrient Recovery for Sustainable City Food Systems in Germany by 2050. Sustainability 2021, 13, 10772. [Google Scholar] [CrossRef]
- Ragaveena, S.; Shirly Edward, A.; Surendran, U. Smart controlled environment agriculture methods: A holistic review. Rev. Environ. Sci. Biotechnol. 2021, 20, 887–913. [Google Scholar] [CrossRef]
- Kozai, T.; Niu, G.; Takagaki, M. Plant Factory: An Indoor Vertical Farming System for Efficient Quality Food Production, 2nd ed.; Academic Press: London, UK, 2020. [Google Scholar]
- Sharma, N.; Acharya, S.; Kumar, K.; Singh, N.; Chaurasia, O.P. Hydroponics as an advanced technique for vegetable production: An overview. J. Soil Water. Conserv. 2018, 17, 364. [Google Scholar] [CrossRef]
- AlShrouf, A. Hydroponics, Aeroponic and Aquaponic as Compared with Conventional Farming. Am. Sci. Res. J. Eng. Technol. Sci. 2017, 27, 247–255. [Google Scholar]
- La Rosa-Rodríguez, R.D.; Lara-Herrera, A.; Trejo-Téllez, L.I.; Padilla-Bernal, L.E.; Solis-Sánchez, L.O.; Ortiz-Rodríguez, J.M. Water and fertilizers use efficiency in two hydroponic systems for tomato production. Hortic. Bras. 2020, 38, 47–52. [Google Scholar] [CrossRef]
- Van Os, E.A.; Beerling, E.; Blok, C.; Janse, J.; Leyh, R.; van Ruijven, J.; van der Staaij, M.; Kaarsemaker, R. Zero discharge of nutrients and pesticides to the environment in hydroponic production. Acta Hortic. 2019, 1266, 443–450. [Google Scholar] [CrossRef]
- Landolt, E. Biosystematic Investigations in the Family of Duckweeds (Lemnaceae), The Family of Lemnaceae—A Monographic Study; Geobotanisches Institut ETH: Zürich, Switzerland, 1986; Volume 2. [Google Scholar]
- Landolt, E.; Kandeler, R. Biosystematic Investigations in the Family of Duckweeds (Lemnaceae), The Family of Lemnaceae—A Monographic Study; Geobotanisches Institut ETH: Zürich, Switzerland, 1987; Volume 4. [Google Scholar]
- Stewart, J.J.; Adams, W.W.; Escobar, C.M.; López-Pozo, M.; Demmig-Adams, B. Growth and Essential Carotenoid Micronutrients in Lemna gibba as a Function of Growth Light Intensity. Front. Plant Sci. 2020, 11, 480. [Google Scholar] [CrossRef]
- Yin, Y.; Yu, C.; Yu, L.; Zhao, J.; Sun, C.; Ma, Y.; Zhou, G. The influence of light intensity and photoperiod on duckweed biomass and starch accumulation for bioethanol production. Bioresour. Technol. 2015, 187, 84–90. [Google Scholar] [CrossRef]
- Lasfar, S.; Monette, F.; Millette, L.; Azzouz, A. Intrinsic growth rate: A new approach to evaluate the effects of temperature, photoperiod and phosphorus-nitrogen concentrations on duckweed growth under controlled eutrophication. Water Res. 2007, 41, 2333–2340. [Google Scholar] [CrossRef]
- Paolacci, S.; Harrison, S.; Jansen, M.A.K. The invasive duckweed Lemna minuta Kunth displays a different light utilisation strategy than native Lemna minor Linnaeus. Aquat. Bot. 2018, 146, 8–14. [Google Scholar] [CrossRef]
- Wedge, R.M.; Burris, J.E. Effects of light and temperature on duckweed photosynthesis. Aquat. Bot. 1982, 13, 133–140. [Google Scholar] [CrossRef]
- Petersen, F.; Demann, J.; Restemeyer, D.; Ulbrich, A.; Olfs, H.-W.; Westendarp, H.; Appenroth, K.-J. Influence of the Nitrate-N to Ammonium-N Ratio on Relative Growth Rate and Crude Protein Content in the Duckweeds Lemna minor and Wolffiella hyalina. Plants 2021, 10, 1741. [Google Scholar] [CrossRef]
- Simonne, A.H.; Simonne, E.H.; Eitenmiller, R.R.; Mills, H.A.; Cresman, C.P. Could the Dumas method replace the Kjeldahl digestion for nitrogen and crude protein determinations in foods? J. Sci. Food Agric. 1997, 73, 39–45. [Google Scholar] [CrossRef]
- Casal, J.A.; Vermaat, J.E.; Wiegman, F. A test of two methods for plant protein determination using duckweed. Aquat. Bot. 2000, 67, 61–67. [Google Scholar] [CrossRef]
- DIN 38409-60:2019-12; Deutsche Einheitsverfahren zur Wasser-, Abwasser- und Schlammuntersuchung—Summarische Wirkungs- und Stoffkenngrößen (Gruppe H) - Teil 60: Photometrische Bestimmung der Chlorophyll-a-Konzentration in Wasser (H 60). Beuth Verlag GmbH: Berlin, Germany, 2019.
- VDLUFA. Methodenbuch Band 1: Die Untersuchung von Böden, Methode A 6.1.4.1 Bestimmung von Mineralischem Stickstoff (Nitrat und Ammonium) in Bodenprofilen (Nmin-Labormethode); VDLUFA-Verlag: Darmstadt, Germany, 2012. [Google Scholar]
- VDLUFA. Methodenbuch Band 1 Die Untersuchung der Böden, Methode A 6.1.1.1 Bestimmung von Nitrat-Stickstoff Durch UV-Absorption; VDLUFA-Verlag: Darmstadt, Germany, 2012. [Google Scholar]
- DIN EN ISO 11885:2009-09; Wasserbeschaffenheit—Bestimmung von Ausgewählten Elementen durch Induktiv Gekoppelte Plasma-Atom-Emissionsspektrometrie (ICP-OES) (ISO_11885:2007); Deutsche Fassung EN_ISO_11885:2009. Beuth Verlag GmbH: Berlin, Germany, 2009.
- Li, Y.; Zhang, F.; Daroch, M.; Tang, J. Positive effects of duckweed polycultures on starch and protein accumulation. Biosci. Rep. 2016, 36, e00380. [Google Scholar] [CrossRef] [Green Version]
- Brand, T.; Petersen, F.; Demann, J.; Wichura, A. First report on Pythium myriotylum as pathogen on duckweed (Lemna minor L.) in hydroponic systems in Germany. J. Cultiv. Plants 2021, 73, 316–323. [Google Scholar]
- Roijackers, R.; Szabó, S.; Scheffer, M. Experimental analysis of the competition between algae and duckweed. Arch. Hydrobiol. 2004, 160, 401–412. [Google Scholar] [CrossRef]
- Walsh, É.; Kuehnhold, H.; O’Brien, S.; Coughlan, N.E.; Jansen, M.A.K. Light intensity alters the phytoremediation potential of Lemna minor. Environ. Sci. Pollut. Res. 2021, 28, 16394–16407. [Google Scholar] [CrossRef] [PubMed]
- Stewart, J.J.; Adams, W.W.; López-Pozo, M.; Doherty Garcia, N.; McNamara, M.; Escobar, C.M.; Demmig-Adams, B. Features of the Duckweed Lemna That Support Rapid Growth under Extremes of Light Intensity. Cells 2021, 10, 1481. [Google Scholar] [CrossRef]
- Gallego, L.M.; Chien, Y.-H.; Angeles Jr, I.P. Effects of light source and photoperiod on growth of duckweed Landoltia punctata and its water quality. Aqua. Res. 2021, 53, 398–408. [Google Scholar] [CrossRef]
- Zhong, Y.; Wang, L.; Ma, Z.; Du, X. Physiological responses and transcriptome analysis of Spirodela polyrhiza under red, blue, and white light. Planta 2021, 255, 11. [Google Scholar] [CrossRef]
- Xu, Y.-L.; Tan, L.; Guo, L.; Yang, G.-L.; Li, Q.; Lai, F.; He, K.-Z.; Jin, Y.; Du, A.; Fang, Y. Increasing starch productivity of Spirodela polyrhiza by precisely control the spectral composition and nutrients status. Ind. Crops Prod. 2019, 134, 284–291. [Google Scholar] [CrossRef]
- Martindale, W.; Bowes, G. The effects of irradiance and CO2 on the activity and activation of ribulose-1,5-bisphosphate carboxylase/oxygenase in the aquatic plant Spirodela polyrhiza. J. Exp. Bot. 1996, 47, 781–784. [Google Scholar] [CrossRef] [Green Version]
- Wheeler, R.M.; Mackowiak, C.L.; Sager, J.C.; Knott, W.M.; Berry, W.L. Proximate composition of CELSS crops grown in NASA’s biomass production chamber. Adv. Space Res. 1996, 18, 43–47. [Google Scholar] [CrossRef]
- Appenroth, K.J.; Augsten, H.; Liebermann, B.; Feist, H. Effects of Light Quality on Amino Acid Composition of Proteins in Wolffia arrhiza (L.) Wimm. using a Specially Modified Bradford Method. Biochem. Physiol. Pflanz. 1982, 177, 251–258. [Google Scholar] [CrossRef]
- Mohedano, R.A.; Costa, R.H.R.; Tavares, F.A.; Belli Filho, P. High nutrient removal rate from swine wastes and protein biomass production by full-scale duckweed ponds. Bioresour. Technol. 2012, 112, 98–104. [Google Scholar] [CrossRef] [Green Version]
- Chakrabarti, R.; Clark, W.D.; Sharma, J.G.; Goswami, R.K.; Shrivastav, A.K.; Tocher, D.R. Mass production of Lemna minor and its amino acid and fatty acid profiles. Front. Chem. 2018, 6, 479. [Google Scholar] [CrossRef]
- Helms, T.C.; Orf, J.H. Protein, Oil, and Yield of Soybean Lines Selected for Increased Protein. Crop Sci. 1998, 38, 707–711. [Google Scholar] [CrossRef]
- Artetxe, U.; García-Plazaola, J.I.; Hernández, A.; Becerril, J.M. Low light grown duckweed plants are more protected against the toxicity induced by Zn and Cd. Plant Physiol. Biochem. 2002, 40, 859–863. [Google Scholar] [CrossRef]
- Hendry, G.A.F.; Price, A.H. Stress Indicators: Chlorophylls and Carotenoids. In Methods in Comparative Plant Ecology; Hendry, G.A.F., Grime, J.P., Eds.; Chapman Hall: London, UK, 1993; pp. 148–152. [Google Scholar]
- Hosseini, H.; Mozafari, V.; Roosta, H.R.; Shirani, H.; van de Vlasakker, P.C.H.; Farhangi, M. Nutrient Use in Vertical Farming: Optimal Electrical Conductivity of Nutrient Solution for Growth of Lettuce and Basil in Hydroponic Cultivation. Horticulturae 2021, 7, 283. [Google Scholar] [CrossRef]
- Walsh, É.; Paolacci, S.; Burnell, G.; Jansen, M.A.K. The importance of the calcium-to-magnesium ratio for phytoremediation of dairy industry wastewater using the aquatic plant Lemna minor L. Int. J. Phytoremediat. 2020, 22, 694–702. [Google Scholar] [CrossRef]
- Zhou, Y.; Kishchenko, O.; Stepanenko, A.; Chen, G.; Wang, W.; Zhou, J.; Pan, C.; Borisjuk, N. The Dynamics of NO3− and NH4+ Uptake in Duckweed Are Coordinated with the Expression of Major Nitrogen Assimilation Genes. Plants 2021, 11, 11. [Google Scholar] [CrossRef]
- Richa, A.; Fizir, M.; Touil, S. Advanced monitoring of hydroponic solutions using ion-selective electrodes and the internet of things: A review. Environ. Chem. Lett. 2021, 19, 3445–3463. [Google Scholar] [CrossRef]
- Bamsey, M.; Graham, T.; Thompson, C.; Berinstain, A.; Scott, A.; Dixon, M. Ion-specific nutrient management in closed systems: The necessity for ion-selective sensors in terrestrial and space-based agriculture and water management systems. Sensors 2012, 12, 13349–13392. [Google Scholar] [CrossRef]
- Fan, R.; Yang, X.; Xie, H.; Reeb, M.-A. Determination of nutrients in hydroponic solutions using mid-infrared spectroscopy. Sci. Hortic. 2012, 144, 48–54. [Google Scholar] [CrossRef]
- Jakobsen, Ø.; Schiefloe, M.; Mikkelsen, Ø.; Paille, C.; Jost, A. Real-time monitoring of chemical water quality in closed-loop hydroponics. Acta Hortic. 2020, 1296, 1005–1018. [Google Scholar] [CrossRef]


| Light Intensity | Red/Blue Ratios | Treatment Abbreviation |
|---|---|---|
| 50 | 70/30 | 50–70/30 |
| 50 | 50/50 | 50–50/50 |
| 50 | 30/70 | 50–30/70 |
| 100 | 70/30 | 100–70/30 |
| 100 | 30/70 | 100–30/70 |
| 150 | 70/30 | 150–70/30 |
| 150 | 50/50 | 150–50/50 |
| 150 | 30/70 | 150–30/70 |
| Substance | L. minor | W. hyalina |
|---|---|---|
| NH4+-N | 97.2 | 97.7 |
| NO3−-N | 12.8 | −6.6 |
| PO43− | 52.8 | 26.6 |
| K+ | 7.9 | −1.4 |
| Mg2+ | −7.9 | −22.6 |
| SO42− | −8.0 | −11.7 |
| Ca+ | −8.1 | −10.1 |
| Fe3+ | 95.6 | 94.5 |
| BO33− | 84.8 | 2.2 |
| Mn2+ | 80.3 | 98.6 |
| Zn2+ | 84.2 | 89.7 |
| Na+ | 29.1 | 23.7 |
Publisher’s Note: MDPI stays neutral with regard to jurisdictional claims in published maps and institutional affiliations. |
© 2022 by the authors. Licensee MDPI, Basel, Switzerland. This article is an open access article distributed under the terms and conditions of the Creative Commons Attribution (CC BY) license (https://creativecommons.org/licenses/by/4.0/).
Share and Cite
Petersen, F.; Demann, J.; Restemeyer, D.; Olfs, H.-W.; Westendarp, H.; Appenroth, K.-J.; Ulbrich, A. Influence of Light Intensity and Spectrum on Duckweed Growth and Proteins in a Small-Scale, Re-Circulating Indoor Vertical Farm. Plants 2022, 11, 1010. https://doi.org/10.3390/plants11081010
Petersen F, Demann J, Restemeyer D, Olfs H-W, Westendarp H, Appenroth K-J, Ulbrich A. Influence of Light Intensity and Spectrum on Duckweed Growth and Proteins in a Small-Scale, Re-Circulating Indoor Vertical Farm. Plants. 2022; 11(8):1010. https://doi.org/10.3390/plants11081010
Chicago/Turabian StylePetersen, Finn, Johannes Demann, Dina Restemeyer, Hans-Werner Olfs, Heiner Westendarp, Klaus-Juergen Appenroth, and Andreas Ulbrich. 2022. "Influence of Light Intensity and Spectrum on Duckweed Growth and Proteins in a Small-Scale, Re-Circulating Indoor Vertical Farm" Plants 11, no. 8: 1010. https://doi.org/10.3390/plants11081010