
Patterns of Plumericin Concentration in Leaves of Himatanthus tarapotensis (Apocynaceae) and Its Interactions with Herbivory in the Peruvian Amazon

 ,
,  , ,
, ,
Abstract
:1. Introduction
2. Results
2.1. Variation of Plumericin Concentration and Variation of Environmental Factors: Precipitation, Soil Types, and Insect Herbivores
2.2. Relationships of Plumericin Concentration with Environmental Factors: Precipitation, Soil Types, and Insect Herbivores
3. Discussion
4. Materials and Methods
4.1. Study Area
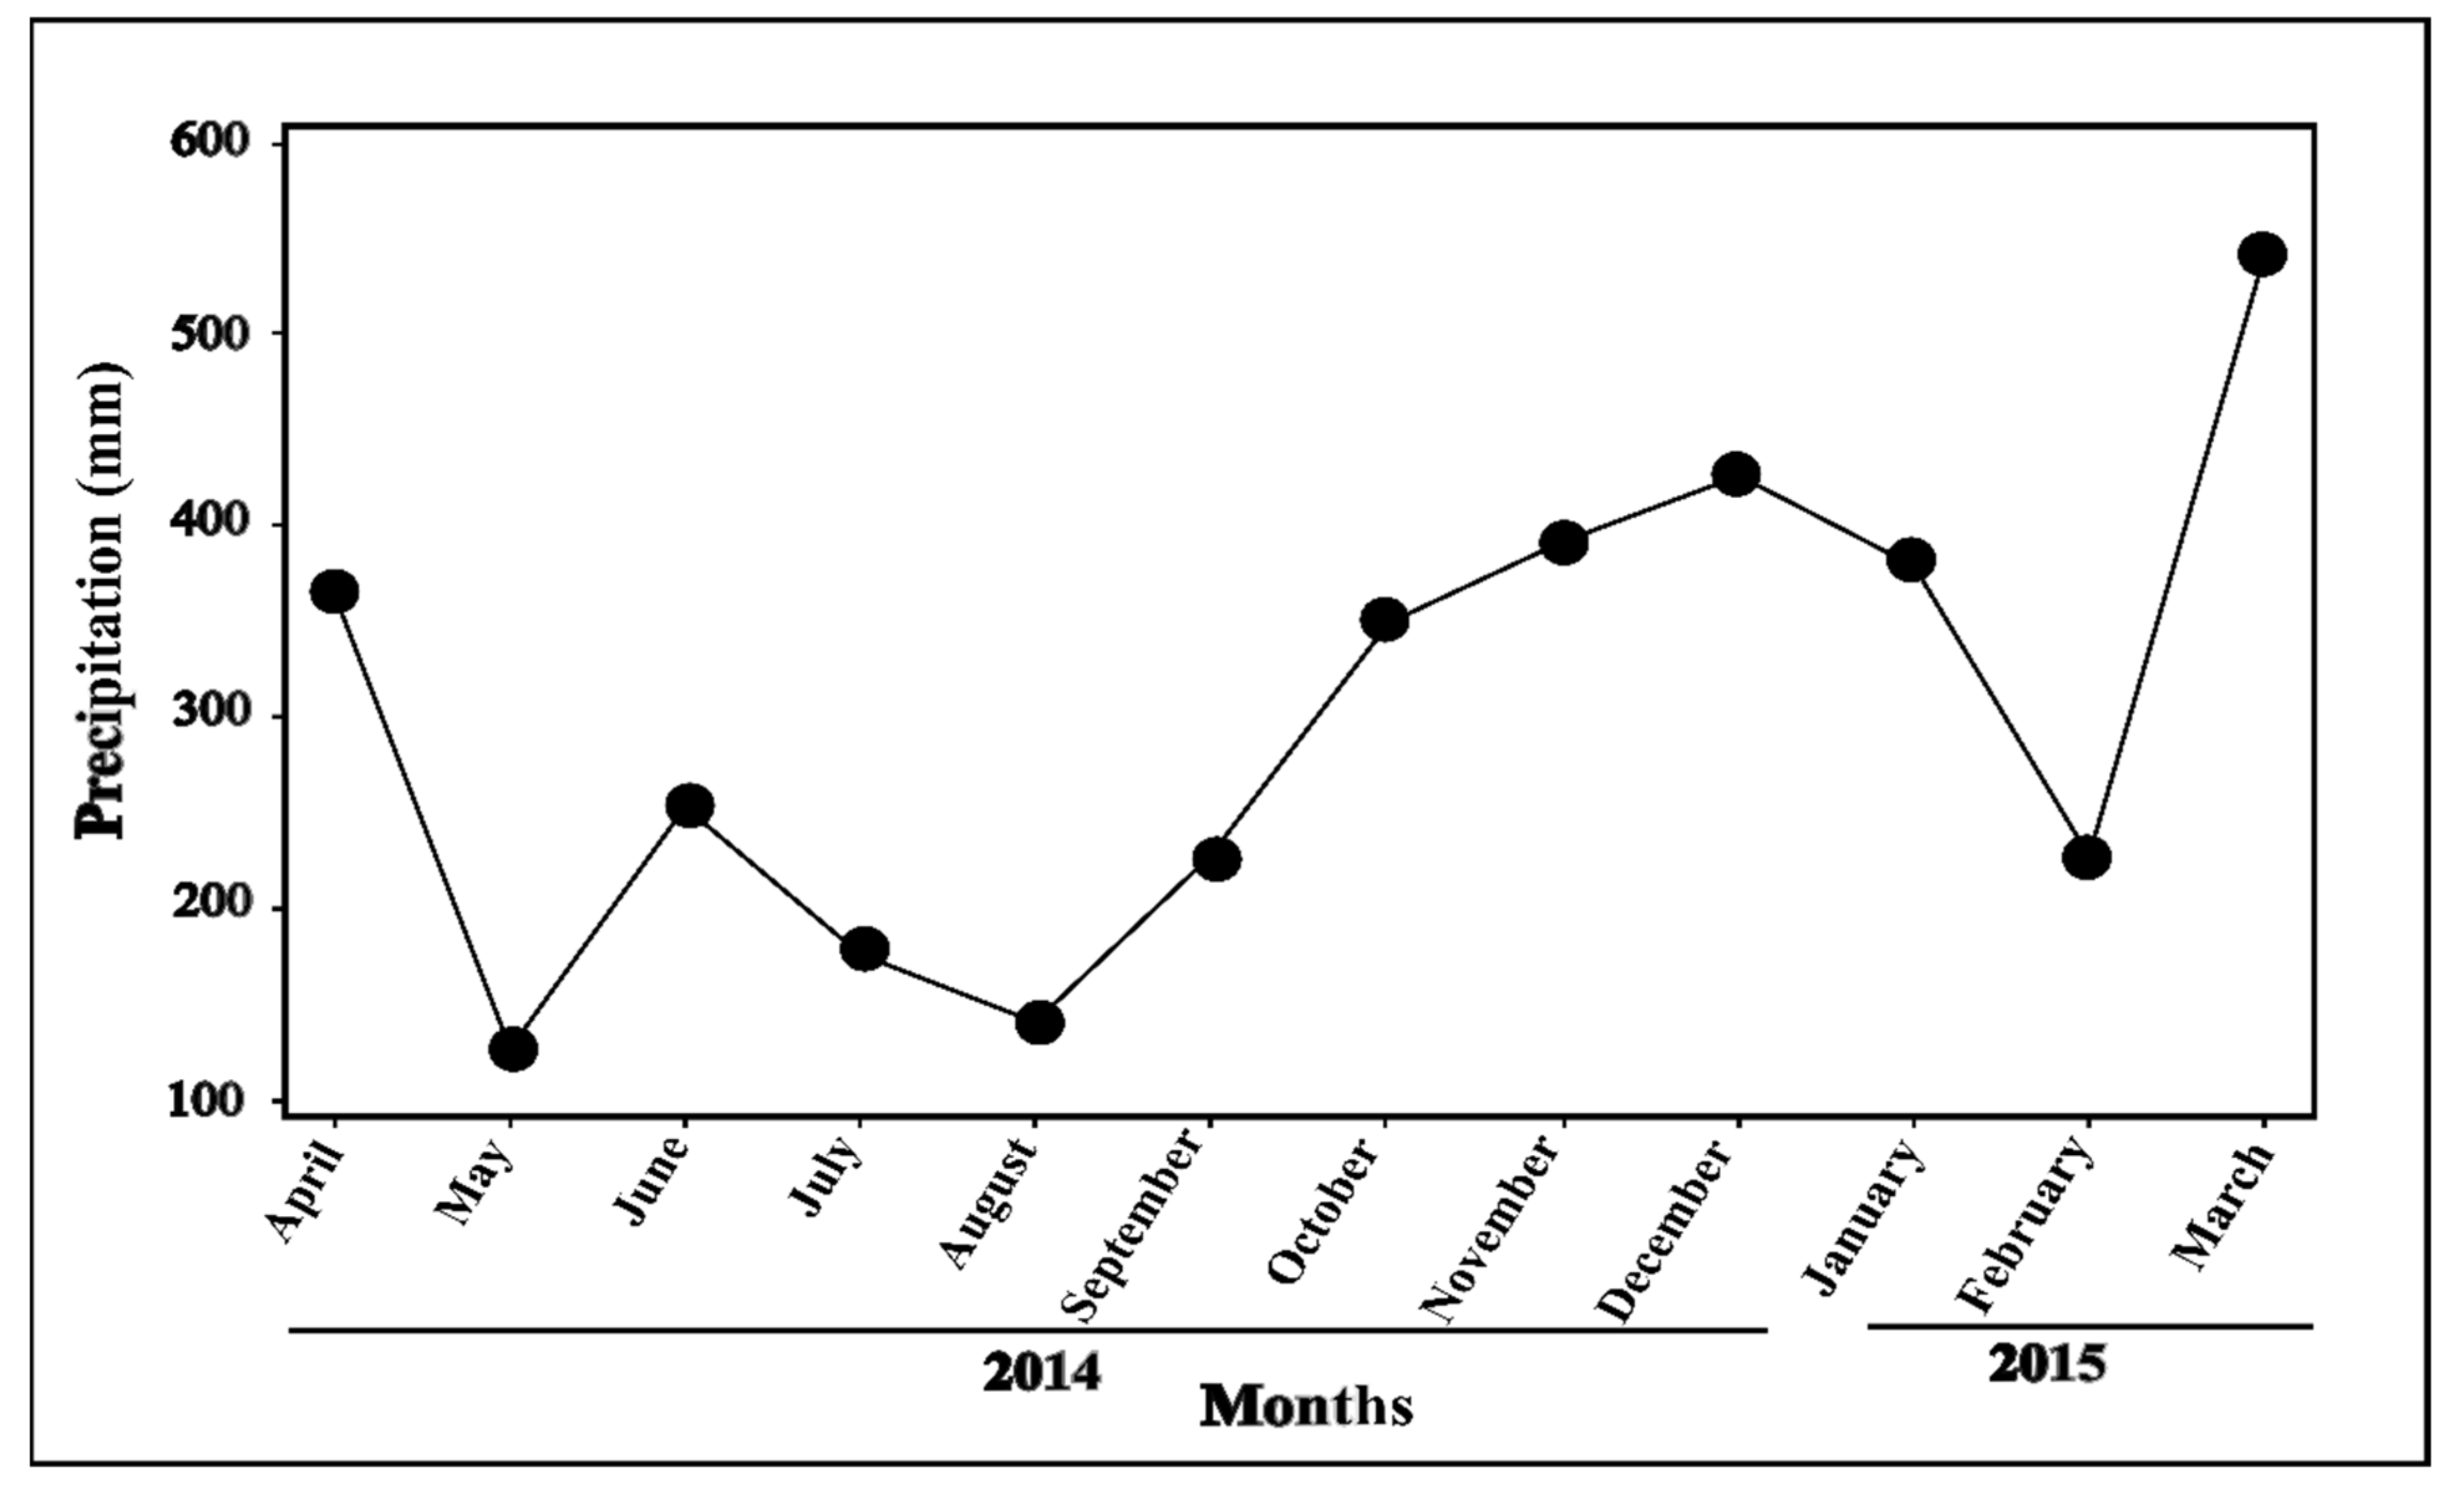
4.2. Precipitation
4.3. Soil Types
4.4. Studied Plants
4.5. Herbivory and Insect Community
4.6. Sampling of Plant Material
4.7. Samples Preparation
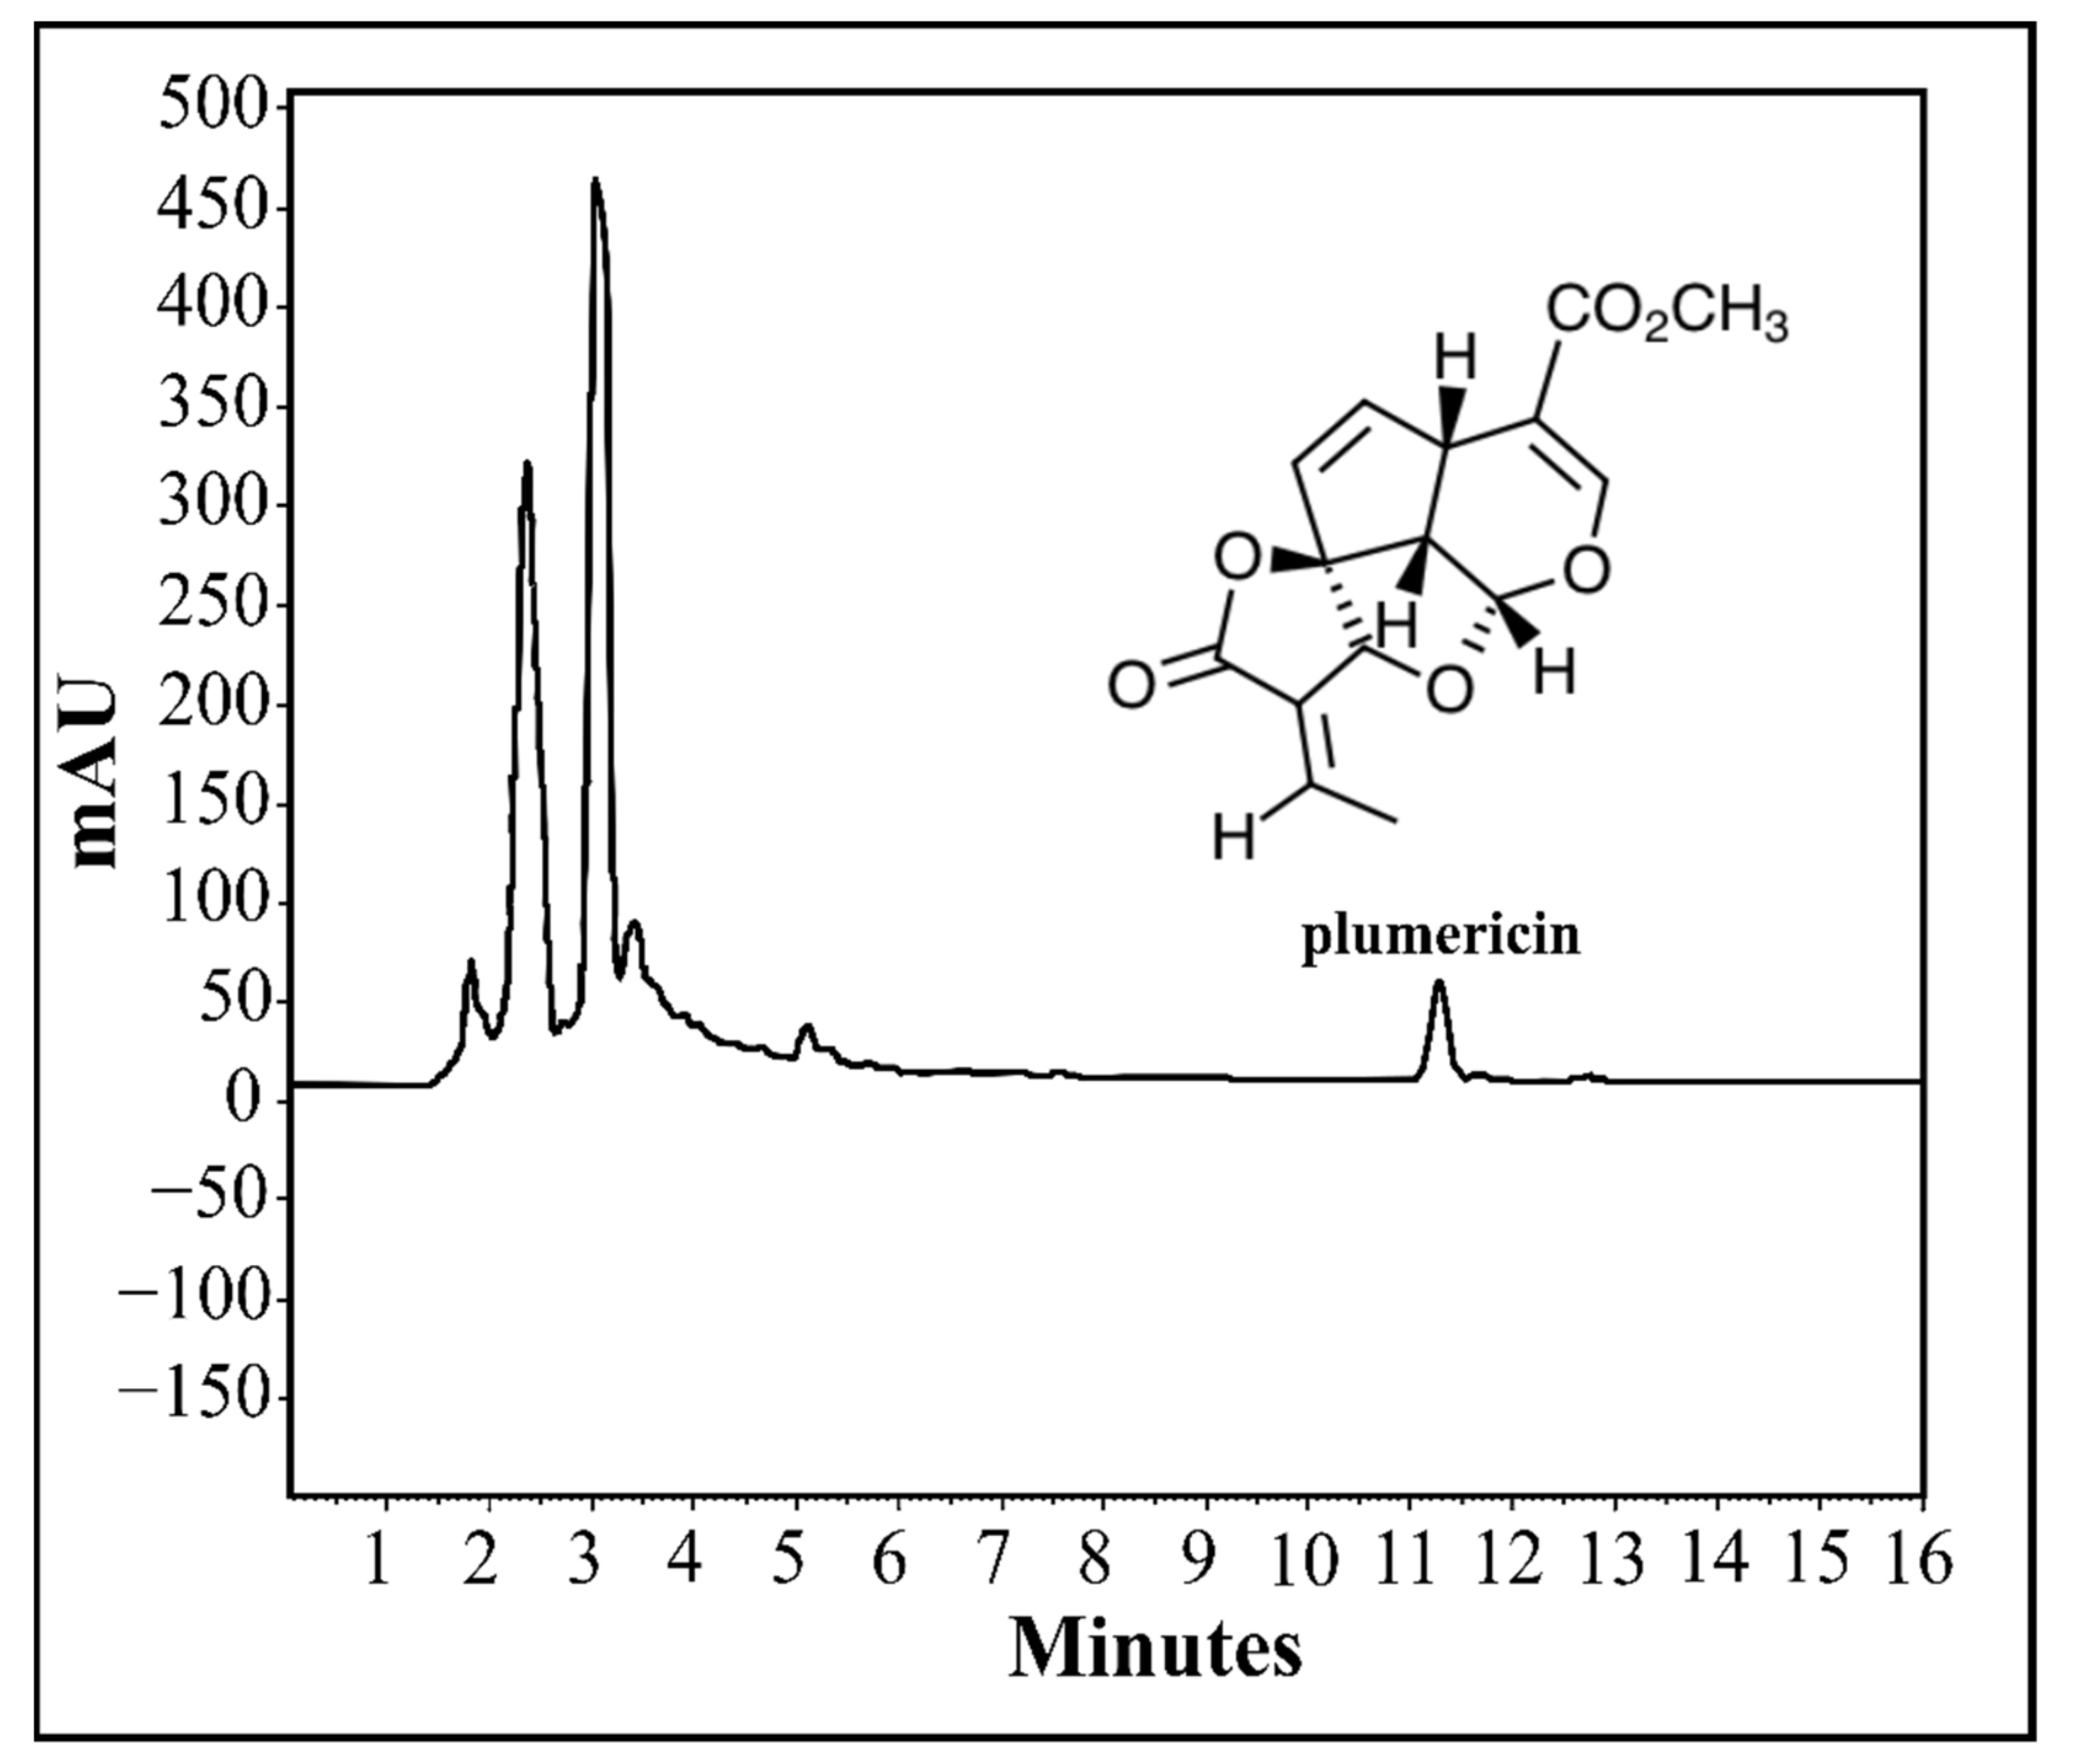
4.8. Analytical Conditions for HPLC Method
4.9. Analytical Curve (Linearity) of Standard
4.10. Detection and Quantification of Plumericin
4.11. Validation of the Analytical Method
4.12. Statistical Analyses
Supplementary Materials
Author Contributions
Funding
Data Availability Statement
Acknowledgments
Conflicts of Interest
References
- Bryant, J.P.; Chapin, F.S., III; Klein, D.R. Carbon/nutrient balance of boreal plants in relation to vertebrate herbivory. Oikos 1983, 40, 357–368. [Google Scholar] [CrossRef] [Green Version]
- Coley, P.D.; Bryant, J.P.; Chapin, F.S., III. Resource availability and plant antiherbivore defense. Science 1985, 230, 859–899. [Google Scholar] [CrossRef] [PubMed] [Green Version]
- Glassmire, A.E.; Philbin, C.; Richards, L.A.; Jeffrey, C.S.; Snook, J.S.; Dye, L.A. Proximity to canopy mediates changes in the defensive chemistry and herbivore loads of an understory tropical shrub, Piper kelleyi. Ecol. Lett. 2019, 22, 332–341. [Google Scholar] [CrossRef] [PubMed]
- Sallas, L.; Kainulainen, P.; Utriainen, J.; Holopainen, T.; Holopainen, J.K. The influence of elevated O3 and CO2 concentrations on secondary metabolites of Scots pine (Pinus sylvestris L.) seedlings. Glob. Chang. Biol. 2001, 7, 303–311. [Google Scholar] [CrossRef]
- Chapin, F.S., III; Bloom, A.J.; Field, C.B.; Waring, R.H. Plant responses to multiple environmental factors. BioScience 1987, 37, 49–57. [Google Scholar] [CrossRef]
- Borges, L.L.; Alves, S.; Sampaio, B.L.; Conceição, E.C.; Bara, M.T.F.; Paula, J.R. Environmental factors affecting the concentration of phenolic compounds in Myrcia tomentosa leaves. Rev. Bras. Farm. 2013, 23, 230–238. [Google Scholar] [CrossRef] [Green Version]
- Blank, A.F.; Costa, A.G.; Arrigoni-Blank, M.F.; Cavalcanti, S.C.H.; Alves, P.B.; Innecco, R.; Ehlert, P.A.D.; de Sousa, I.F. Influence of season, harvest time and drying on Java citronella (Cymbopogon winterianus Jowitt) volatile oil. Rev. Bras. Farm. 2007, 17, 557–564. [Google Scholar] [CrossRef]
- Gouvea, D.R.; Gobbo-Neto, L.; Sakamoto, H.T.; Lopes, N.P.; Lopes, J.L.C.; Meloni, F.; Amaral, J.G. Seasonal variation of the major secondary metabolites present in the extract of Eremanthus mattogrossensis Less (Asteraceae: Vernonieae) leaves. Quim Nova 2012, 35, 2139–2145. [Google Scholar] [CrossRef] [Green Version]
- Jackson, M.B.; Colmer, T.D. Response and adaptation by plants to flooding stress. Ann. Bot. 2005, 96, 501–505. [Google Scholar] [CrossRef]
- Huang, H.; Abel, C.; Sohrabi, R.; Petri, J.; Haupt, I.; Cosimano, J.; Gershenzon, J.; Tholl, D. Variation of herbivore-induced volatile terpenes among Arabidopsis ecotypes depends on allelic differences and subcellular targeting of two terpene synthases, TPS02 and TPS03. Plant Physiol. 2010, 153, 1293–1310. [Google Scholar] [CrossRef] [Green Version]
- Fine, P.V.A.; Metz, M.R.; Lokvam, J.; Mesones, I.; Ayarza Zuniga, J.M.; Lamarre, G.P.A.; Vásquez Pilco, M.; Baraloto, C. Insect herbivores, chemical innovation, and the evolution of habitat specialization in Amazonian trees. Ecology 2013, 94, 1764–1775. [Google Scholar] [CrossRef] [PubMed] [Green Version]
- Berini, J.L.; Brockman, S.A.; Hegeman, A.D.; Reich, P.B.; Muthukrishnan, R.; Montgomery, R.A.; Forester, J.D. Combinations of abiotic factors differentially alter production of plant secondary metabolites in five woody plant species in the boreal-temperate transition zone. Front. Plant Sci. 2018, 9, 1257. [Google Scholar] [CrossRef] [PubMed] [Green Version]
- Ehrlich, P.R.; Raven, P.H. Butterflies and plants: A study in coevolution. Evolution 1964, 18, 586–608. [Google Scholar] [CrossRef]
- Berenbaum, M.; Feeny, P. Toxicity of angular furanocoumarins to swallowtail butterflies: Escalation in a coevolutionary arms race? Science 1981, 212, 927–929. [Google Scholar] [CrossRef]
- Agrawal, A.A.; Petschenka, G.; Bingham, R.A.; Weber, M.G.; Rasmann, S. Toxic cardenolides: Chemical ecology and coevolution of specialized plant–herbivore interactions. New Phytol. 2012, 194, 28–45. [Google Scholar] [CrossRef]
- Stamp, N. Out of the quagmire of plant defense hypotheses. Q. Rev. Biol. 2003, 78, 2355. [Google Scholar] [CrossRef] [Green Version]
- Massad, T.J.; Fincher, R.M.; Smilanich, A.M.; Dyer, L.A. A quantitative evaluation of major plant defense hypotheses, nature versus nurture, and chemistry versus ants. Arthropod Plant Interact. 2011, 5, 125–139. [Google Scholar] [CrossRef]
- Smilanich, A.M.; Fincher, R.M.; Dyer, L.A. Does plant apparency matter? Thirty years of data provide limited support but reveal clear patterns of the effects of plant chemistry on herbivores. New Phytol. 2016, 210, 1044–1057. [Google Scholar] [CrossRef] [Green Version]
- Cacho, N.I.; Strauss, S.Y. Occupation of bare habitats, an evolutionary precursor to soil specialization in plants. Proc. Natl. Acad. Sci. USA 2014, 111, 15132–15137. [Google Scholar] [CrossRef] [Green Version]
- Hunter, M.D. The Phytochemical Landscape: Linking Trophic Interactions and Nutrient Dynamics; Princeton University Press: Princeton, NJ, USA, 2016; pp. 1–346. [Google Scholar] [CrossRef]
- Glassmire, A.E.; Jahner, J.P.; Badik, K.J.; Forister, M.L.; Smilanich, A.M.; Dyer, L.A.; Wilson, J.S. The soil mosaic hypothesis: A synthesis of multi-trophic diversification via soil heterogeneity. Ideas Ecol. Evol. 2017, 10, 20–26. [Google Scholar] [CrossRef] [Green Version]
- Langenheim, J.H.; Convis, L.; Macedo, C.A.; Stubblebine, W.H. Hymenaea and Copaifera leaf sesquiterpenes in relation to lepidopteran herbivory in southeastern Brazil. Biochem. Syst. Ecol. 1986, 14, 41–49. [Google Scholar] [CrossRef]
- Coley, P.D.; Barone, J.A. Herbivory and plant defenses in tropical forests. Annu. Rev. Ecol. Syst. 1996, 27, 305–335. [Google Scholar] [CrossRef]
- Mithöfer, A.; Boland, W. Plant defense against herbivores: Chemical aspects. Annu. Rev. Plant Biol. 2012, 63, 431–450. [Google Scholar] [CrossRef] [PubMed] [Green Version]
- Ali, J.G.; Agrawal, A.A. Specialist versus generalist insect herbivores and plant defense. Trends Plant Sci. 2012, 17, 293–302. [Google Scholar] [CrossRef]
- Duffey, S.S. Sequestration of plant natural products by insects. Annu. Rev. Entomol. 1980, 25, 447–477. [Google Scholar] [CrossRef]
- Opitz, S.E.W.; Müller, C. Plant chemistry and insect sequestration. Chemoecology 2009, 19, 117–154. [Google Scholar] [CrossRef]
- Bowers, M.D. Unpalatability as a defense strategy of Euphydryas phaeton (Lepidoptera: Nymphalidae). Evolution 1980, 34, 586–600. [Google Scholar] [CrossRef]
- Spina, A.P. Estudos Taxonômico, Micro-Morfológico e Filogenético Do gênero Himatanthus Willd. ex Schult. (Apocynaceae: Rauvolfioideae—Plumerieae). Ph.D. Thesis, Universidad Estatal de Campinas, Sao Paulo, Brazil, 2004. [Google Scholar]
- Amasifuen Guerra, C.A.; Delprete, P.G.; Spina, A.P. Synopsis of the species of Himatanthus (Apocynaceae, Plumerieae) in Peru. Phytotaxa 2016, 283, 65–73. [Google Scholar] [CrossRef] [Green Version]
- Odonne, G.; Valadeau, C.; Alban-Castillo, J.; Stien, D.; Sauvain, M.; Bourdy, G. Medical ethnobotany of the chayahuita of the Paranapura basin (Peruvian Amazon). J. Ethnopharmacol. 2013, 146, 127–153. [Google Scholar] [CrossRef]
- Castillo, D.; Arévalo, J.; Herrera, F.; Ruiz, C.; Rojas, R.; Rengifo, E.; Vaisberg, A.; Lock, O.; Lemesre, J.-L.; Gornitzka, H.; et al. Spirolactone iridoids might be responsible for the antileishmanial activity of a Peruvian traditional remedy made with Himatanthus sucuuba (Apocynaceae). J. Ethnopharmacol. 2007, 112, 410–414. [Google Scholar] [CrossRef] [Green Version]
- Silva, J.R.A.; Rezende, C.M.; Pinto, A.C.; Pinheiro, M.L.B.; Cordeiro, M.C.; Tamborini, E.; Young, C.M.; Bolzani, V.S. Ésteres triterpênicos de Himatanthus sucuuba (Spruce) Woodson. Quim. Nova 1998, 21, 702–704. [Google Scholar] [CrossRef]
- Morel, A.F.; Graebner, I.B.; Porto, C.; Dalcol, I.I. Study on the antimicrobial activity of Himatanthus sucuuba. Fitoterapia 2006, 77, 50–53. [Google Scholar] [CrossRef] [PubMed]
- Silva, J.R.A.; Rezende, C.M.; Pinto, A.C.; Amaral, A.C.F. Cytotoxicity and antibacterial studies of iridoids and phenolic compounds isolated from the latex of Himatanthus sucuuba. Afr. J. Biotechnol. 2010, 9, 7357–7360. [Google Scholar] [CrossRef]
- Kumar, P.; Singh, A.; Sharma, U.; Singh, D.; Dobhal, M.P.; Singh, S. Anti-mycobacterial activity of plumericin and isoplumericin against MDR Mycobacterium tuberculosis. Pulm. Pharmacol. Ther. 2013, 26, 332–335. [Google Scholar] [CrossRef] [PubMed]
- Anderson, J.E.; Chang, C.J.; McLaughlin, J.L. Bioactive components of Allamanda schottii. J. Nat. Prod. 1988, 51, 307–308. [Google Scholar] [CrossRef]
- Kardono, L.B.S.; Tsauri, S.; Padmawinata, K.; Pezzuto, J.M.; Kinghorn, D. Cytotoxic constituents of the bark of Plumeria rubra collected in Indonesia. J. Nat. Prod. 1990, 53, 1447–1455. [Google Scholar] [CrossRef]
- Abdel-Kader, M.S.; Wisse, J.; Evans, R.; van der Werff, H.; Kingston, D.G.I. Bioactive iridoids and a new lignan from Allamanda cathartica and Himatanthus fallax from the Suriname rainforest. J. Nat. Prod. 1997, 60, 1294–1297. [Google Scholar] [CrossRef]
- Page, J.E.; Madriñán, S.; Towers, G.H.N. Identification of a plant growth inhibiting iridoid lactone from Duroia hirsuta, the allelopathic tree of the “devil’s garden”. Experientia 1994, 50, 840–842. [Google Scholar] [CrossRef]
- Fine, P.V.A.; García, R.; Pitman, N.C.A.; Mesones, I.; Kembel, S.W. A floristic study of the white-sand forests of Peru. Ann. Mo. Bot. Gard. 2010, 97, 283–305. [Google Scholar] [CrossRef]
- Marengo, J. Climatología de la zona de Iquitos, Perú. In Geoecología y Desarrollo Amazónico: Estudio Integrado en la Zona de Iquitos, Perú; Kalliola, R., Paitan, S.F., Eds.; University of Turku Press: Turku, Finland, 1998; pp. 35–57. [Google Scholar]
- Izhaki, I. Emodin—A secondary metabolite with multiple ecological functions in higher plants. New Phytol. 2002, 155, 205–217. [Google Scholar] [CrossRef] [Green Version]
- Prado, V.M.J.; Moraes, V.R.S.; Nogueira, P.C.L.; Cruz, E.M.O.; Blank, A.F.; Pereira-Filho, E.L.; Martins, L.R.R. Caracterização de chás de genótipos de Lippia gracilis Schauer através de perfil cromatográfico por CLAE-DAD combinado com análises quimiométricas. Química Nova 2012, 35, 1814–1818. [Google Scholar] [CrossRef]
- Calatayud, P.-A.; Garrec, J.-P.; Nicole, M. Adaptation des plantes aux stress environnementaux. In Interactions Insects-Plantes; Sauvion, N., Calatayud, P.-A., Thiéry, D., Marion-Poll, M., Eds.; Éditions IRD—Éditions Quae: Versailles, France, 2013; pp. 229–245. [Google Scholar]
- Lefevre, T.; Raymond, M.; Thomas, F. Biologie Évolutive, 2nd ed.; De Boeck Sup: Paris, France, 2016; pp. 265–270. [Google Scholar]
- Coley, P.D. Costs and benefits of defense by tannins in a neotropical tree. Oecologia 1986, 70, 238–241. [Google Scholar] [CrossRef] [PubMed] [Green Version]
- Sakamoto, H.T.; Gobbo-Neto, L.; Cavalheiro, A.J.; Lopes, N.P.; Lopes, J.L.C. Quantitative HPLC analysis of sesquiterpene lactones and determination of chemotypes in Eremanthus seidelii MacLeish & Schumacher (Asteraceae). J. Braz. Chem. Soc. 2005, 16, 1396–1401. [Google Scholar] [CrossRef]
- Duarte Junior, J.J.; Schlindwein, C. The highly seasonal hawkmoth fauna (Lepidoptera Sphingidae:) of the caatinga of Northeast Brazil: A case study in the state of Rio Grande do Norte. J. Lepid. Soc. 2005, 59, 212–218. [Google Scholar]
- Diniz, I.R.; Morais, H.C.; Botelho, A.M.F.; Venturoli, F.; Cabral, B.C. Lepidopteran caterpillar fauna on lactiferous host plants in the Central Brazilian Cerrado. Braz. J. Biol. 1999, 59, 627–635. [Google Scholar] [CrossRef] [Green Version]
- Cock, M.J.W. Pseudosphinx tetrio (L.) (Lepidoptera: Sphingidae) in Trinidad and Tobago. Living World J. Trinidad Tobago Field Nat. Club 2008, 49–52. [Google Scholar]
- Bowers, M.D. Iridoid glycosides and host-plant specificity in larvae of the buckeye butterfly, Junonia coenia (Nymphalidae). J. Chem. Ecol. 1984, 10, 1567–1577. [Google Scholar] [CrossRef]
- Bowers, M.D.; Puttick, G.M. Fate of ingested iridoid glycosides in lepidopteran herbivores. J. Chem. Ecol. 1986, 12, 169–178. [Google Scholar] [CrossRef]
- Bowers, M.D.; Stamp, N.E. Effects of plant age, genotype and herbivory on Plantago performance and chemistry. Ecology 1993, 74, 1778–1791. [Google Scholar] [CrossRef]
- Silva, J.R.A.; Amaral, A.C.F.; Silveira, C.V. Quantitative determination by HPLC of iridoids in the bark and latex of Himatanthus sucuuba. Acta Amaz. 2007, 37, 119–122. [Google Scholar] [CrossRef] [Green Version]
- International Council for Harmonisation. Validation of Analytical Procedures: Text and Methodology. Available online: http://www.ich.org/products/guidelines/quality/quality-single/article/validation-of-analytical-procedures-text-and-methodology.html (accessed on 15 October 2015).
- McCulloch, C.E.; Searle, S.R. Generalized linear mixed models (GLMMs). In Generalized, Linear, and Mixed Models; McCulloch, C.E., Searle, S.R., Neuhaus, J.M., Eds.; Wiley: New York, NY, USA, 2001; pp. 220–246. [Google Scholar]


| Variable | Total | Sampling Periods | ||||||
|---|---|---|---|---|---|---|---|---|
| T1 | T2 | T3 | T4 | p a | ||||
| Median (IQR) | Median (IQR) | Median (IQR) | Median (IQR) | Median (IQR) | ||||
| Plumericin mg/100 g of leaves | 12.2 (6.1–26.1) | 9.8 (4.4–15.8) | 18.6 (10.9–45.5) | 7.5 (3.4–12.5) | 18.8 (9.3–31.7) | <0.001 | ||
| CS | 14.9 (8.9–27.9) | 14.7 (5.9–16.8) | 31.7 (14.8–52.5) | 10.9 (3.6–16.3) | 18.5 (9.2–23.5) | <0.001 | ||
| WS | 8.6 (4.4–16.7) | 5.7 (4.2–9.8) | 9.9 (7.3–11.2) | 2.6 (2.2–7.5) | 31.7 (16.2–32.4) | <0.001 | ||
| Precipitation (mL) | 326.9 (145.1–421.3) | 190.2 (119.8–390.1) | 145.1 (136.1–286.9) | 418.6 (370–429.5) | 464.3 (186.5–546.2) | <0.001 | ||
| Insect herbivores (number) | ||||||||
| Lepidoptera (Isognathus leachii) | 2 (1–7) | 2 (0–3) | 4 (1–10) | 4 (1–10) | 1 (1- 6) | 0.011 | ||
| CS | 0.5 (0–1) | 2 (1–3.5) | 6.5 (2.8–10) | 8.5 (2.8–14.3) | 1.5 (1–6.3) | |||
| WS | 3.5 (1–8) | 0 (0–0) | 0 (0–1) | 1 (0–1) | 1 (1–1) | |||
| Hymenoptera | 1 (0–3.3) | 2 (0–3) | 1 (1–5) | 1 (0–2) | 1 (0–3) | 0.136 | ||
| CS | 2 (1–5) | 2.5 (1.8–4.3) | 4.5 (1 -6) | 2 (1–3) | 1 (0.8–5) | |||
| WS | 0 (0–1) | 0 (0–1) | 1 (1–1) | 0 (0–1) | 0 (0–0) | |||
| Coleoptera | 1 (0–2) | 1 (0–2) | 1 (1–2) | 1 (1–2) | 1 (0–2) | 0.791 | ||
| CS | 1 (0–1) | 1 (0–2) | 1.5 (0.8–3) | 1.5 (1–2.3) | 1 (0.8–3.3) | |||
| WS | 1 (0.8–2.3) | 2 (0–3) | 1 (1–1) | 1 (0–1) | 1 (0–1) | |||
| Total | CS | WS | |||||||||
|---|---|---|---|---|---|---|---|---|---|---|---|
| rrm | 95%CI | p a | rrm | 95%CI | p a | rrm | 95%CI | p a | |||
| Insect herbivores (number) | |||||||||||
| Lepidoptera | 0.027 | −0.253–0.303 | 0.848 | −0.165 | −0.472–0.177 | 0.328 | 0.746 | 0.356–0.914 | <0.001 | ||
| Isognathus leachii | |||||||||||
| Hymenoptera | −0.109 | −0.376–0.174 | 0.440 | −0.085 | −0.407–0.255 | 0.615 | −0.254 | −0.691–0.318 | 0.341 | ||
| Formicidae | |||||||||||
| Coleoptera | 0.295 | 0.018–0.529 | 0.033 | 0.357 | 0.027–0.617 | 0.029 | −0.047 | −0.563–0.495 | 0.862 | ||
| Anobiidae | |||||||||||
| Curculionidae | |||||||||||
| Precipitation (mL) | −0.136 | −0.399–0.147 | 0.333 | ||||||||
| Soil parameters | |||||||||||
| Sand percentage | 0.146 | −0.137–0.408 | 0.301 | 0.485 | 0.182–0.704 | 0.002 | 0.080 | −0.470–0.585 | 0.767 | ||
| Clay percentage | −0.220 | −0.470–0.061 | 0.115 | −0.492 | −0.709–−0.191 | 0.001 | 0.019 | −0.516–0.544 | 0.943 | ||
| pH | −0.403 | −0.612–−0.140 | 0.003 | −0.574 | −0.761–−0.297 | 0.001 | 0.112 | −0.444–0.607 | 0.677 | ||
| Organic matter percentage | −0.005 | −0.283–0.272 | 0.966 | −0.567 | −0.757–−0.289 | 0.001 | 0.052 | −0.492–0.567 | 0.847 | ||
| Phosphorous ppm | 0.405 | 0.143–0.614 | 0.002 | 0.574 | 0.298–0.7619 | 0.001 | −0.107 | −0.603–0.449 | 0.693 | ||
| Potassium ppm | −0.314 | −0.544–−0.039 | 0.023 | −0.551 | −0.747–−0.267 | 0.001 | 0.347 | −0.224–0.741 | 0.186 | ||
| Carbon percentage | 0.435 | 0.178–0.636 | 0.001 | 0.559 | 0.277–0.752 | 0.001 | 0.088 | −0.463–0.591 | 0.743 | ||
| (A) | |||||
| Soil Parameters | Bivariate Analysis | ||||
| Mean | 95%CI | ||||
| Sand percentage | 1.02 | 0.96–1.07 | |||
| Clay percentage | 0.87 * | 0.71–0.98 | |||
| pH | 0.69 | 0.23–1.09 | |||
| Organic matter percentage | 0.85 | 0.63–1.15 | |||
| Ppm Phosphorous | 1.48 * | 1.09–1.72 | |||
| Ppm Potassium | 0.83 | 0.54–1.39 | |||
| Carbon percentage | 1.42 ** | 1.29–1.61 | |||
| (B) | |||||
| Bivariate Analysis | Multivariate Analysis | ||||
| Insect Herbivores | Mean | 95%CI | Mean | 95%CI | |
| Lepidoptera | |||||
| Isognathus leachii | 1.01 | 0.97–1.05 | 1.01 a | 0.99–1.03 | |
| 1.01 b | 0.99–1.02 | ||||
| Hymenoptera | |||||
| Formicidae | 1.09 | 0.99–1.21 | 1.07 a | 0.96–1.19 | |
| 1.09 b* | 1.01–1.20 | ||||
| Coleoptera | |||||
| Anobiidae | 0.17 *** | 0.04–0.62 | 0.17 a,*** | 0.05–0.57 | |
| 0.18 b,*** | 0.05–0.56 | ||||
| Curculionidae | 0.52 *** | 0.33–0.80 | 0.53 a,*** | 0.33–0.80 | |
| 0.51 b,** | 0.34–0.76 | ||||
Publisher’s Note: MDPI stays neutral with regard to jurisdictional claims in published maps and institutional affiliations. |
© 2022 by the authors. Licensee MDPI, Basel, Switzerland. This article is an open access article distributed under the terms and conditions of the Creative Commons Attribution (CC BY) license (https://creativecommons.org/licenses/by/4.0/).
Share and Cite
Amasifuen Guerra, C.A.; Patel, K.; Delprete, P.G.; Spina, A.P.; Grados, J.; Vásquez-Ocmín, P.; Gadea, A.; Rojas, R.; Guzmán, J.; Sauvain, M. Patterns of Plumericin Concentration in Leaves of Himatanthus tarapotensis (Apocynaceae) and Its Interactions with Herbivory in the Peruvian Amazon. Plants 2022, 11, 1011. https://doi.org/10.3390/plants11081011
Amasifuen Guerra CA, Patel K, Delprete PG, Spina AP, Grados J, Vásquez-Ocmín P, Gadea A, Rojas R, Guzmán J, Sauvain M. Patterns of Plumericin Concentration in Leaves of Himatanthus tarapotensis (Apocynaceae) and Its Interactions with Herbivory in the Peruvian Amazon. Plants. 2022; 11(8):1011. https://doi.org/10.3390/plants11081011
Chicago/Turabian StyleAmasifuen Guerra, Carlos A., Kirti Patel, Piero G. Delprete, Andréa P. Spina, Juan Grados, Pedro Vásquez-Ocmín, Alice Gadea, Rosario Rojas, Jesús Guzmán, and Michel Sauvain. 2022. "Patterns of Plumericin Concentration in Leaves of Himatanthus tarapotensis (Apocynaceae) and Its Interactions with Herbivory in the Peruvian Amazon" Plants 11, no. 8: 1011. https://doi.org/10.3390/plants11081011