Article

Multiscale Wear Simulation in Textured, Lubricated Contacts

Chair of Mechanical Engineering, Montanuniversität Leoben, 8700 Leoben, Austria
*
Author to whom correspondence should be addressed.
Coatings 2023, 13(4), 697; https://doi.org/10.3390/coatings13040697
Submission received: 14 March 2023 / Revised: 23 March 2023 / Accepted: 27 March 2023 / Published: 29 March 2023
(This article belongs to the Special Issue Friction, Wear, Lubrication and Mechanics of Surfaces and Interfaces)

Abstract

:
Specific surface textures may reduce the friction and increase the lifting forces in lubricated contacts. For the detrimental operating condition of mixed friction, wear is induced by the solid contact. In this study, a methodology for wear calculation in textured, lubricated contacts is presented that considers the wear-induced surface topography evolution. Based on the Reynolds differential equation, the mass-conserving cavitation model according to Jakobsson, Floberg, and Olsson (JFO), a wear-dependent asperity contact pressure curve and the wear equation according to Archard, wear in a wedge-shaped, textured lubrication gap was calculated. The results show the wear behavior of textured lubrication gaps. Based on the wear simulations, the tribological behavior of the textured surfaces compared to smooth surfaces is discussed. It is evident that textures, which improve the tribological performance in the hydrodynamic lubrication regime, are not necessarily associated with low wear values in a lubrication condition in the mixed friction regime. The analysis of the wear-dependent parameters initially showed a recovery of the tribological system with increasing wear until the performance decreased again after a specific reversal point. This behavior is attributed to the relative position of the surface textures in the lubrication gap.

1. Introduction

The relative movement of two contacting bodies results in friction. A lubricant in the contact zone enables a reduction in friction. The friction performance of the contact can be further increased by specific surface textures. Special surface texturing is not a new achievement; nature shows us a variety of geometries that can increase the tribological performance. For example, the special topography of fish skins allows for efficient movement [1,2], or the surfaces of plant leaves have evolved to be hydrophobic and self-cleaning, which is known as the lotus effect [3]. Around one fifth of worldwide energy consumption is caused by friction in tribological contacts [4]. Consequently, friction reduction in technical applications is of particular importance in times of global climate change. In lubricated contacts, surface texturing, in addition to reduced oil viscosities and interim stops, is a key factor in this context. Numerous studies have been conducted in the field of surface texturing in lubricated contacts over the past decades. Texturing may positively or negatively affect friction and lifting forces, depending on the operating condition [5,6,7]. For example, Filgueira Filho et al. [8] showed that chevron-shaped textures in hydrodynamic journal bearings can increase the load-carrying capacity. For a hydrodynamic journal bearing, it has also been shown that with different texturing geometries, the friction coefficient can be reduced [9,10].
Within the scope of this study, the impact of the surface topography on the wear development in the mixed friction regime was investigated for a textured geometry, which has positive effects in the hydrodynamic operating regime. Using numerical methods for wear calculations, the wear development of textured and untextured surfaces was compared. To calculate wear in the mixed friction regime, the physics has to be represented accordingly. To describe the fluid flow in the lubrication gap, the Navier–Stokes equation can be used in combination with the continuity equation. Using these equations, it is possible to calculate the flow in three dimensions considering the turbulence and inertial effects. However, high computing power is required for the numerical solution of these equations. Assuming simplifications, the Reynolds equation, which is commonly used in applications in the field of tribology [11], can be derived from the Navier–Stokes equations. Inertia and gravity forces are neglected and the lubrication gap height is small compared to the length and width dimensions of the lubrication gap. As a result, the pressure gradient in the lubrication gap height direction and the velocity gradients in the length and width direction can be neglected [11]. The advantage of the easy implementation and fast solution of the Reynolds differential equation is opposed by the limited applicability. Particularly in the area of tribological contacts with textured surfaces, the application limits must be considered, which are defined by Dobrica [12]. In this work, the limit values for the Reynolds number and a ratio value, which is determined from the texture geometry, are presented. In the mixed friction regime, asperities come into contact due to the reduced lubrication gap heights. Therefore, the external load is supported by hydrodynamic and asperity contact forces. Contact models based on the roughness topography are used to quantify these contact forces. In the past, numerous statistical and deterministic models have been published to determine the solid contact forces [13,14,15,16,17]. Operation in mixed friction is associated with wear, which changes the macroscopic geometry (component scale) and the microgeometry (roughness) [18]. In recent years, models have been presented that consider the wear-induced change in the asperity contact pressure curve [19,20,21,22]. To calculate wear, Archard developed an equation that allows for the calculation of the wear volume in relation to the normal force, the sliding distance, the hardness of the wearing material, and a wear coefficient [23], and is often used for wear simulation given its simple implementability (e.g., [24]). An alternative energy-based model was developed by Fleischer, where the friction force was used instead of the normal force [25]. Both models were linear equations in their original form, so run-in processes cannot be modeled.
It has been shown by experimental and numerical methods that surface texturing in lubricated contacts can have a positive effect on the frictional and lifting performance. Furthermore, with microstructural adaptation of the materials in terms of nanoparticles, the mechanical properties can be improved, and thus the wear behavior can be enhanced [26,27]. In the scope of this study, the influence of a texture pattern with different texture heights is determined for an operating condition in the hydrodynamic lubrication regime. How these textured surfaces influence the wear development was investigated by numerical wear simulations.

2. Materials and Methods
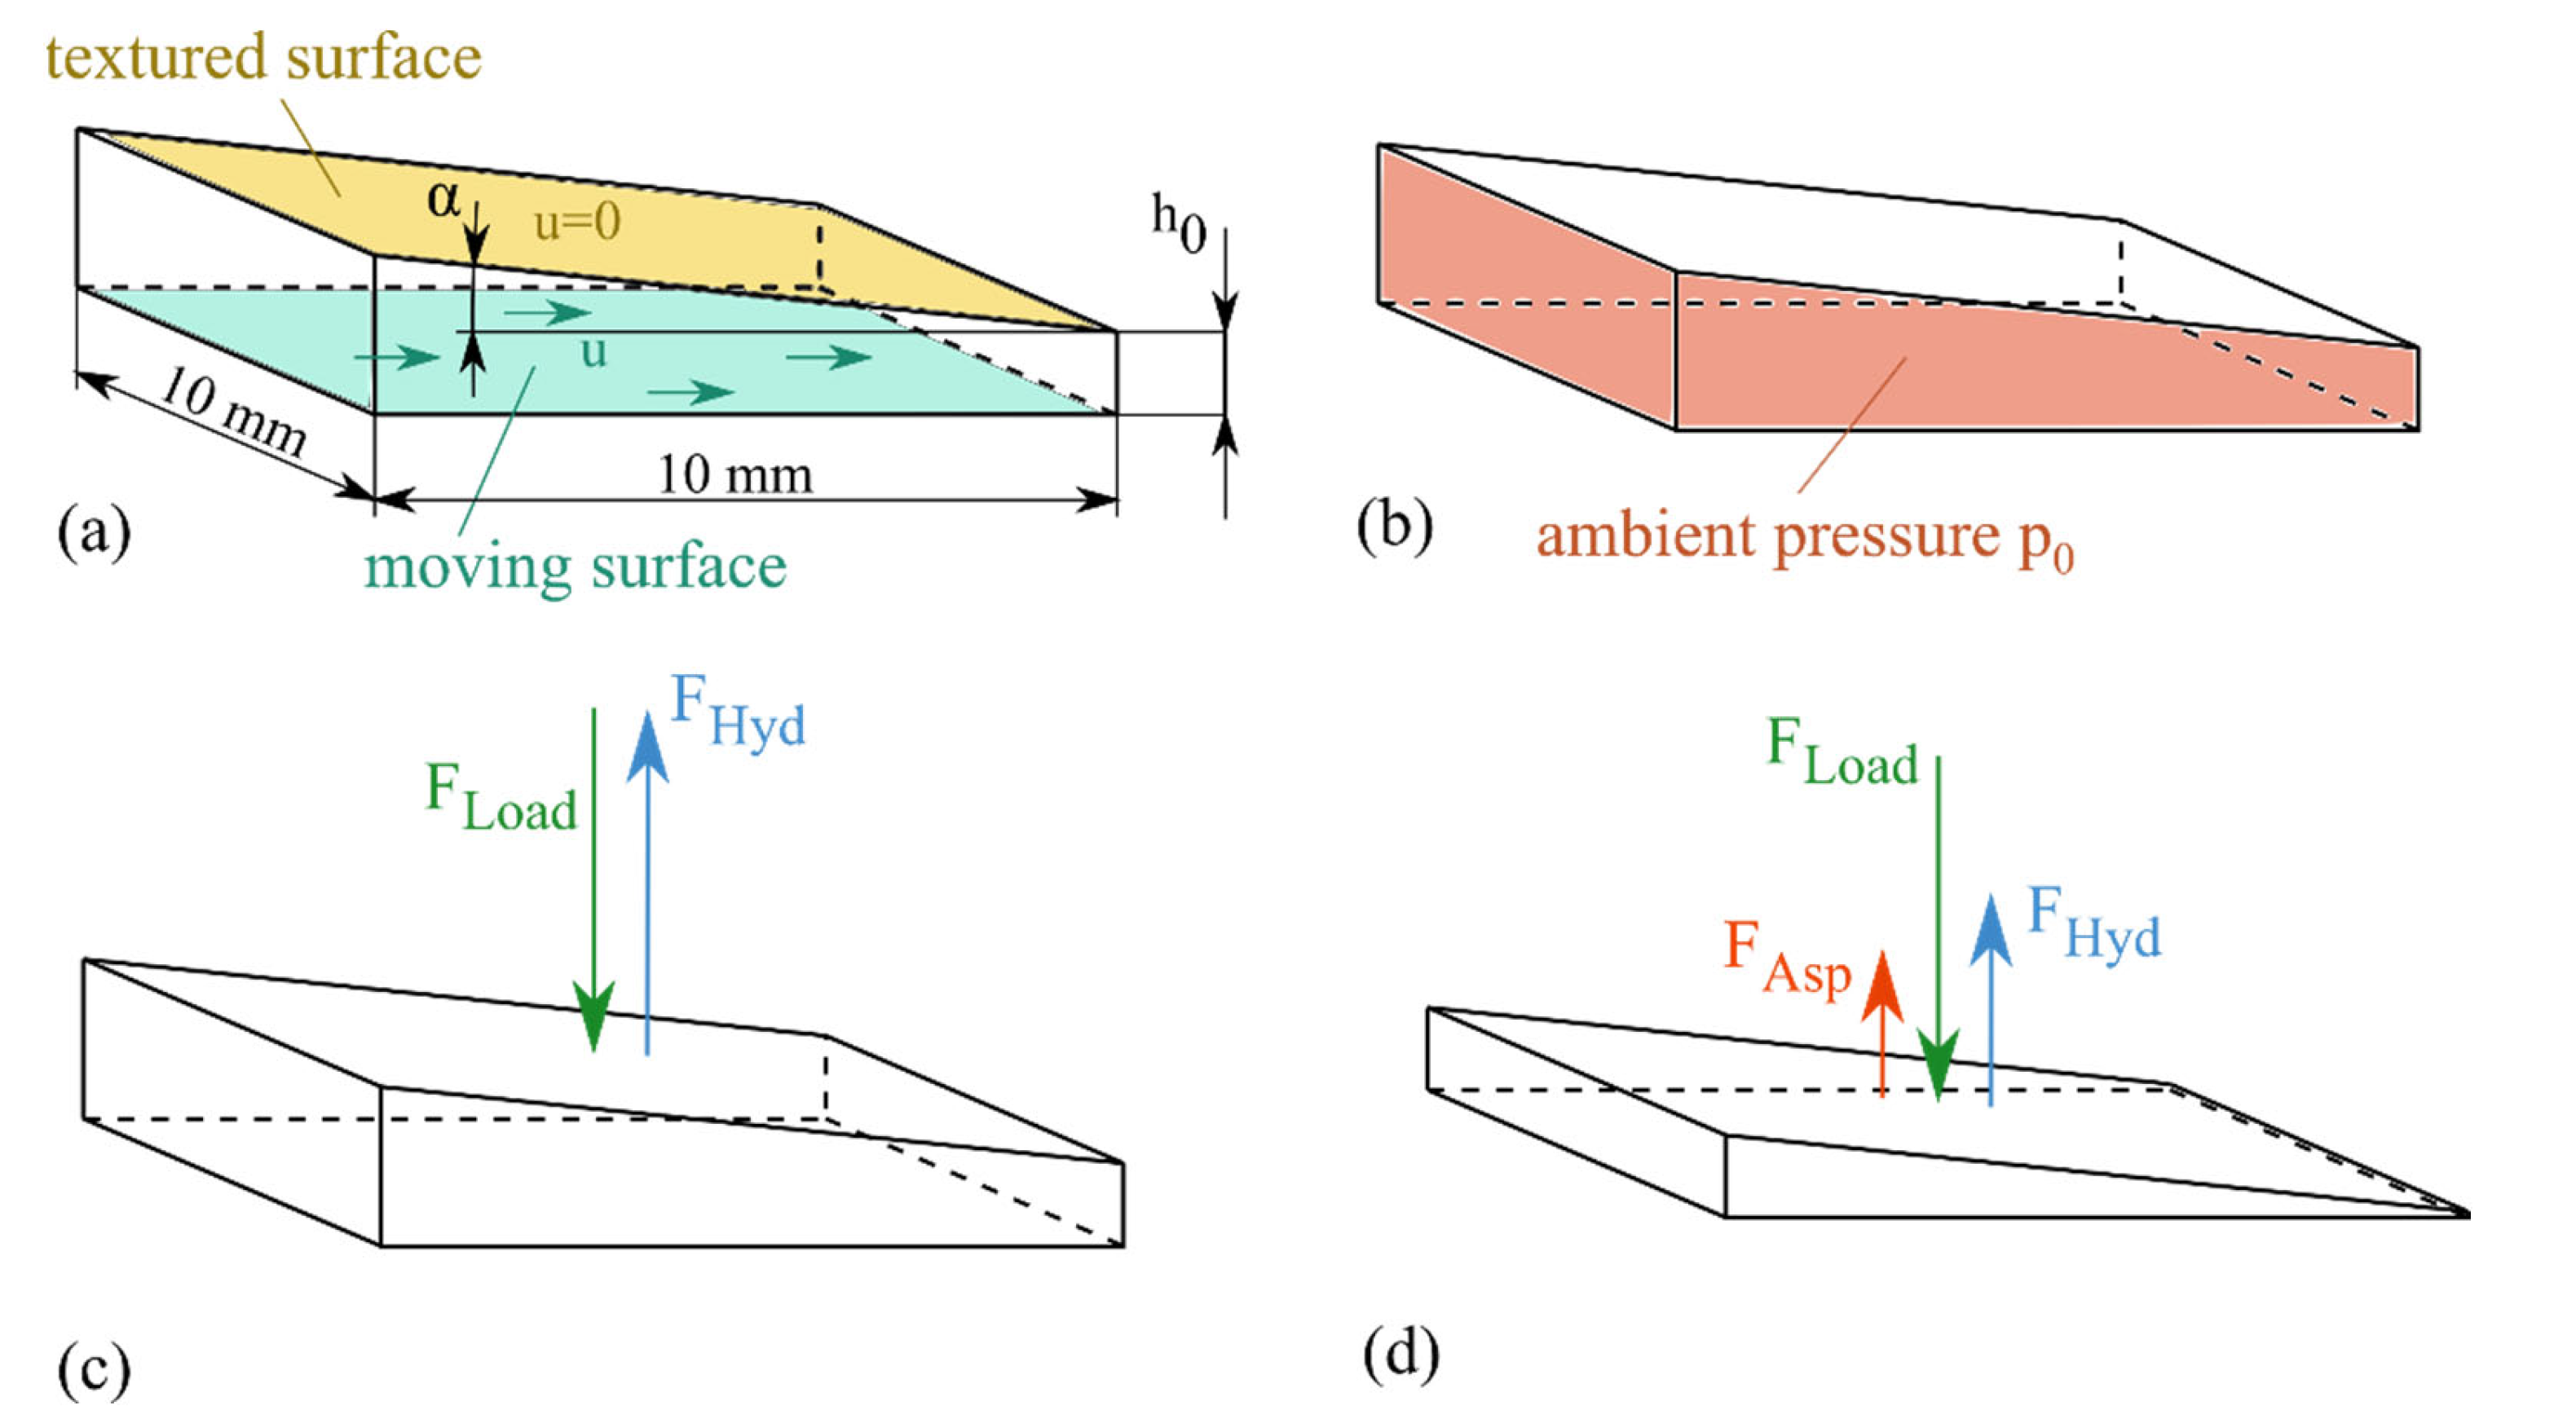
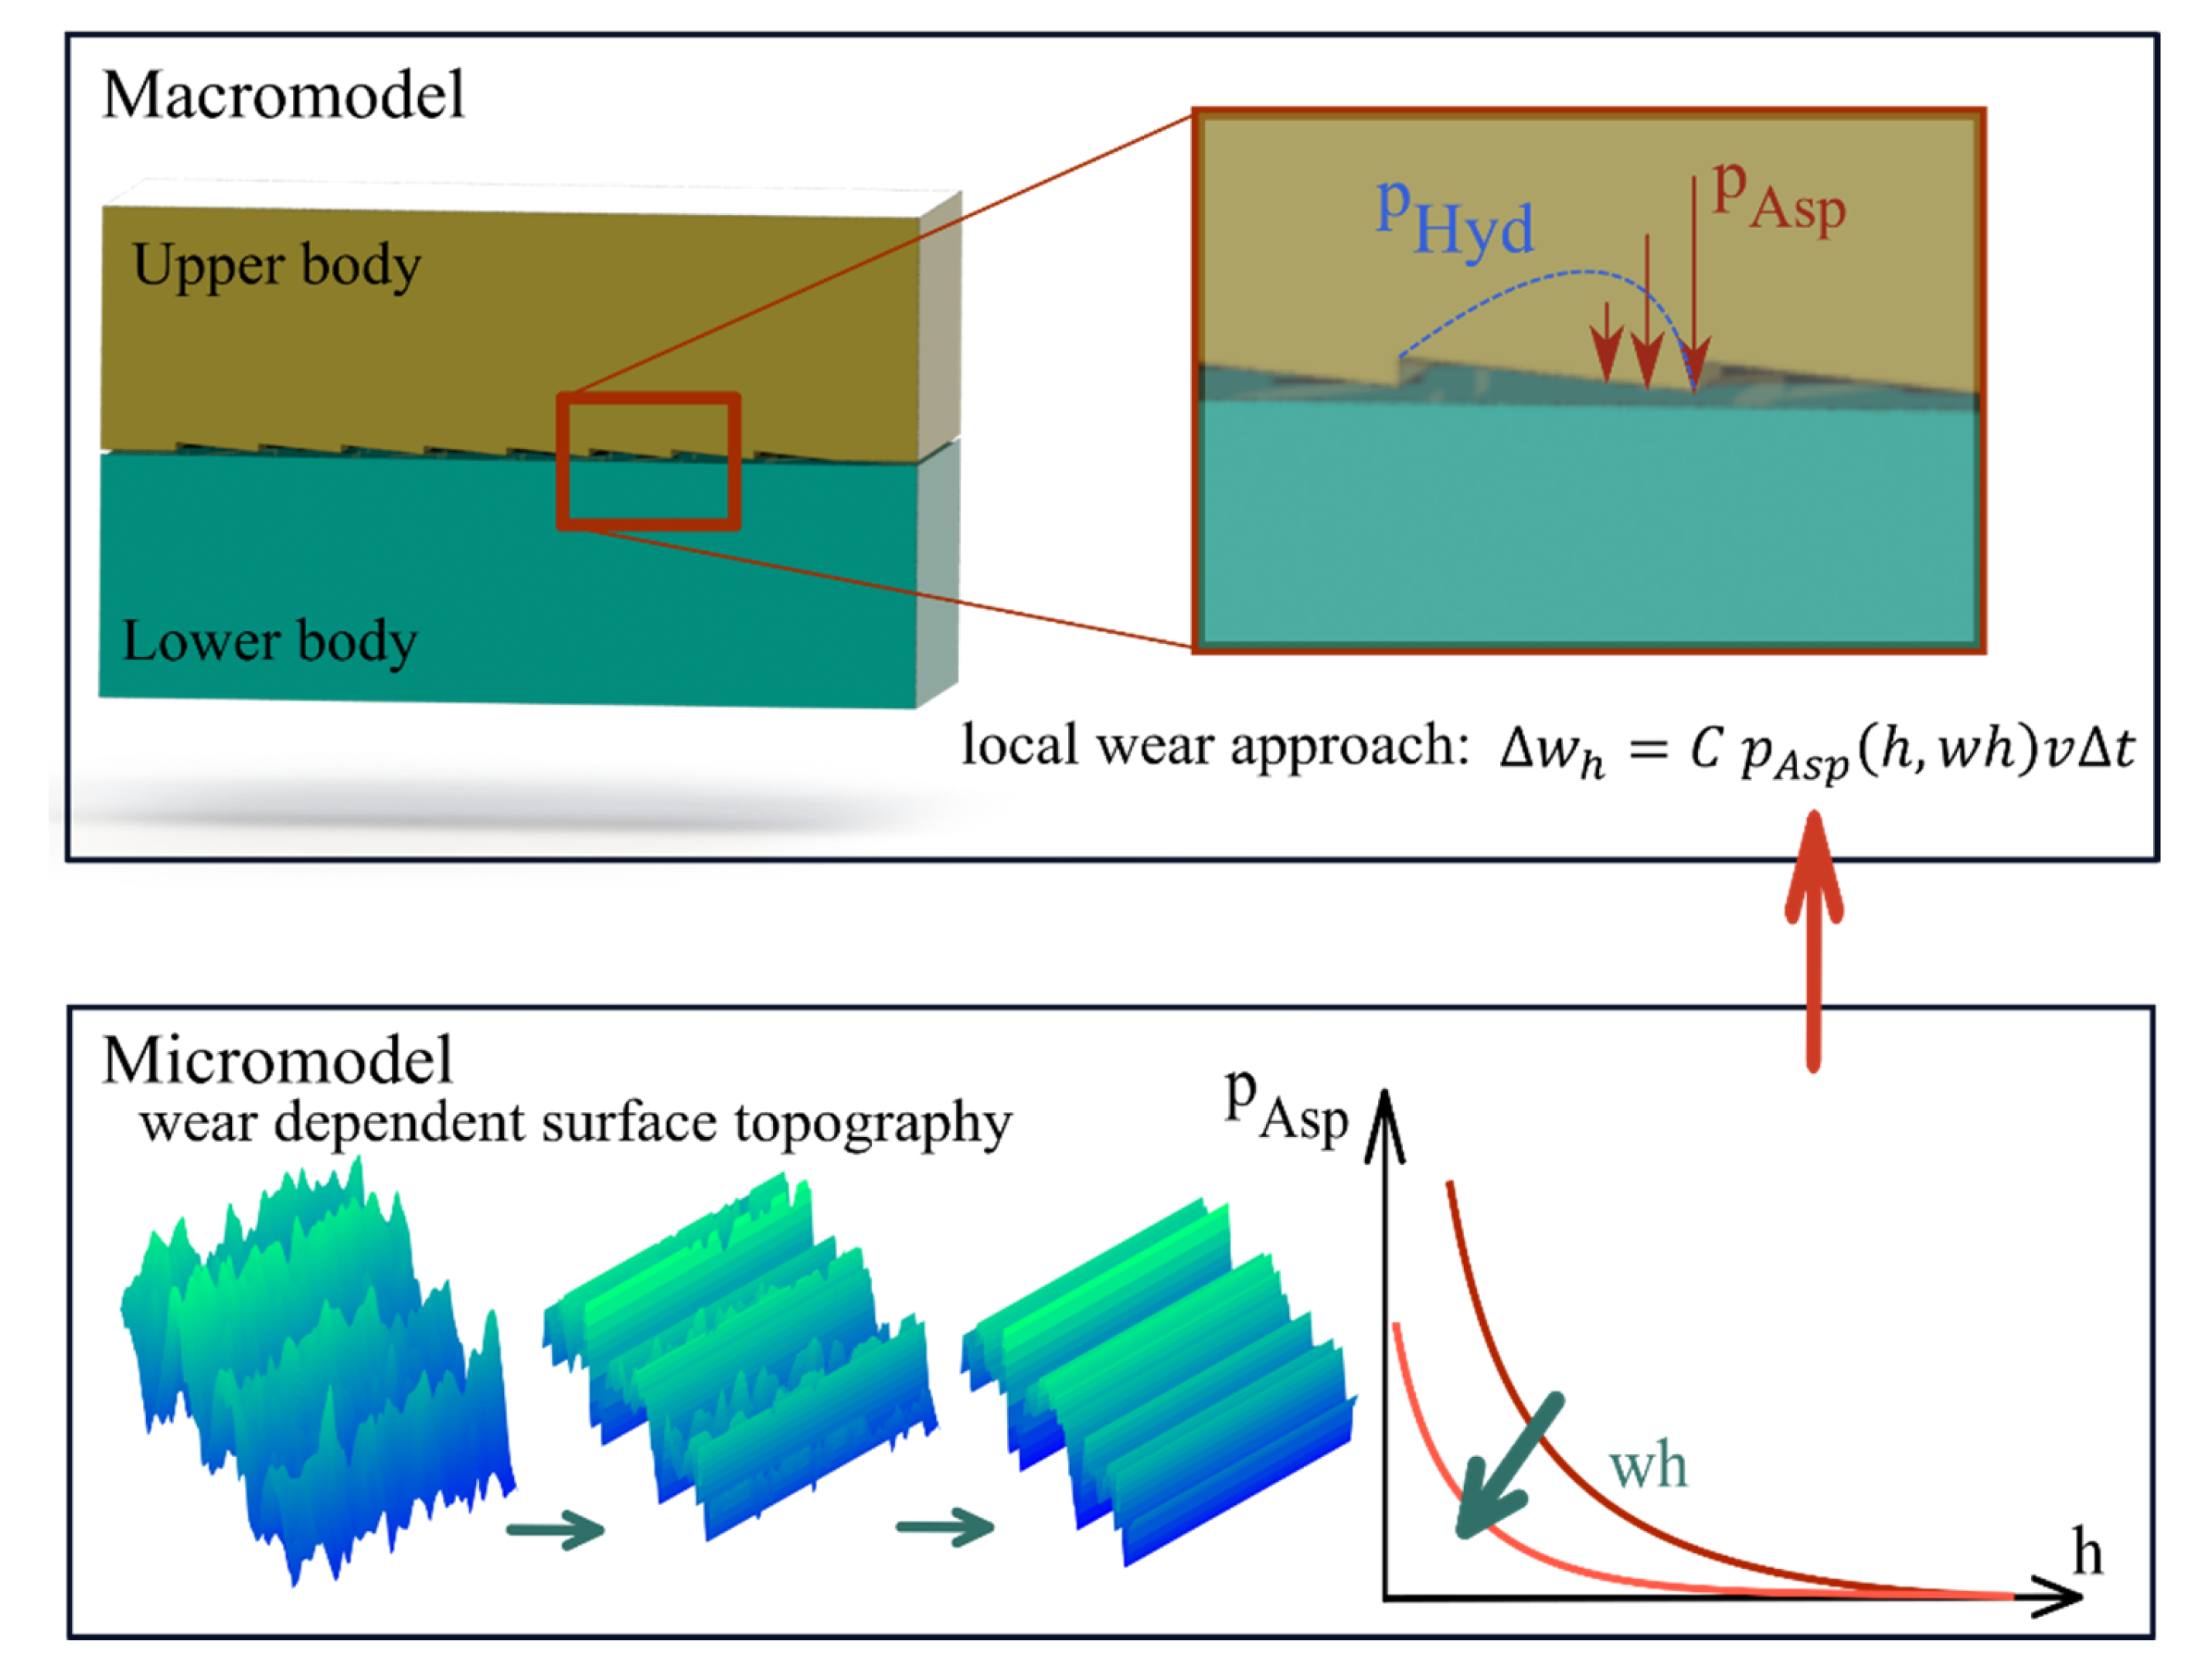
2.1. Macro Model

To determine the influence of textures on the hydrodynamics, the lifting and friction forces of a smooth and textured lubrication gap were compared. In this study, a lubrication gap of 10 × 10 mm was analyzed. The angle of the upper surface was α = 0.02°, which ensures that hydrodynamic pressure builds up, even for variants without texturing. The chosen angle corresponded approximately to the geometry conditions in a hydrodynamic journal bearing with a bearing clearance of 1.6‰ and a relative eccentricity of 0.95. For an operating point in the hydrodynamic friction regime, the force equilibrium consisting of the external load ( F L o a d ) and the hydrodynamic force ( F H y d ) (Equation (1)) must be fulfilled.
F H y d + F L o a d = 0
Due to the relative velocity between the upper and lower surface, the present geometry, and the lubricant, a hydrodynamic pressure is induced in the lubrication gap. In this work, the hydrodynamic pressure was determined numerically using the Reynolds differential equation. For the numerical calculations, the multiphysics package Netgen/NGSolve [28] was used whereby the pressure build-up was determined by solving the Reynolds equation using the finite element method (FEM). For this purpose, the height field hdef(x,y) is necessary. Therefore, the lubrication gap geometry was drawn in a 3D CAD software and exported as a .stl file. The raycasting method can be used to determine the height field of the lubrication gap, which was implemented in python using the trimesh library [29]. On the bottom surface of the lubrication gap, the velocity u is assigned, while the top surface is stationary. This corresponds to a relative velocity of u. Furthermore, the ambient pressure p0 is set at the vertical outer surfaces of the lubrication gap. The overall setup of the computational model is depicted in Figure 1.
At low lubrication gap heights, the roughness has an influence on the flow conditions in the lubrication gap. Depending on the orientation of the roughness topography, the lubricant supply can be either enhanced, or reduced. Patir and Cheng [30,31] considered this influence with factors in the Reynolds equation. For the observed case of the lubrication gap, pressure flow factors in the x- and y-direction as well as a shear flow factor in x-direction were implemented in the Reynolds Equation (2). The flow factors were determined according to the analytical equations of Patir and Cheng and implemented into the Reynolds equation.
  Φ x p 0 0 Φ y p ρ h 3 12 η p · v   d x =   Φ x s u 1 u 2 2 ρ h x v   d x
To consider cavitation, the mass conserving JFO [32] model was used. In the pressure region (p > pcav), the gap filling factor was set to ϴ = 1 in the cavitation region 0 < ϴ < 1. Thus, according to the implementation of Elrod, a two-phase flow can be modeled with the gap filling factor ϴ.
For an operating condition in the hydrodynamic friction regime, the external load must correspond to the hydrodynamic force (Figure 1c). In the simulation model, the clearance height h0 was adjusted in an iterative process until F H y d = A   p H y d   d A corresponded to F L o a d . The frictional shear stress in the fluid can be calculated by Equation (3) [11].
τ x = u θ η h Φ f + Φ x f s + h 2 p x Φ x f p
The resulting fluid friction force is the integral over the calculation area F D r a g _ H y d = A   τ x   d A . If an operating condition in the hydrodynamics is assumed, for a given load, speed, and viscosity, the resulting clearance height of the lubricating gap and the associated frictional force can be determined. The parameters for the hydrodynamic simulation of the flat and textured lubrication wedge are summarized in Table 1.
With an increasing load, reduced speed, or viscosity, the clearance h0 decreases and the operating point shifts more and more into the mixed friction regime. Consequently, asperities come into contact and the force equilibrium is extended by the asperity contact force (Figure 1d). In the mixed friction regime, in addition to the hydrodynamic frictional force, the friction due to solid body contact F D r a g _ A s p = µ 0   F A s p has to be considered. The total coefficient of friction in the mixed friction can be determined with Equation (4).
µ = µ H y d + µ A s p = F D r a g _ H y d F L o a d + F A s p F L o a d µ 0

2.2. Micro Model

The value of the local asperity contact pressure is determined via an asperity contact pressure curve, which represents the contact pressure as a function of the local lubrication gap height. For an elastic half-space, the asperity contact pressure curve can be determined based on the potential Equation (5) according to Boussinesq [33], which describes the relationship between elastic deformation and pressure on a surface.
w e l = 1 ν 2 π E p x , y ' x x 2 + y y 2 d x d y
The flow factors and the contact model depend on the roughness topography. Due to the size dimensions, this is known as the micromodel. In the context of this work, AlSn20 was specified for the upper stationary (eventually textured) surface of the lubrication gap, and 34CrNiMo6 for the lower moving surface, which corresponded to the bearing and shaft material in previous works [17,34].
To determine the parameters in the micromodel, the initial state of a surface section of 400 × 400 µm of the lower and upper surface was scanned with an Alicona© Infinite Focus 3D (Munich, Germany) confocal microscope. A magnification of 100 and a resolution of 0.33 µm in the lateral and 10 nm in the vertical direction was used [35]. The determination of the flow factors and the asperity contact curve relies on the optically determined point cloud; for more information on the parameter definitions in the micro model, please refer to [34].

2.3. Wear

The reduced lubrication gap height in the mixed friction area results in contacting asperities of the two contact surfaces, which leads to increased friction. Furthermore, wear occurs mainly in this suboptimal operating condition [36]. Wear leads to a modified contact geometry, which results in a change in the tribological behavior. The wear causes a change in the macroscopic geometry (component scale), which leads to adapted flow conditions. Furthermore, the surface topography (microscale) is subject to change, which can be represented by corresponding flow factors and asperity contact pressure curves [18,20].
In the framework of this paper, the multiscale wear simulation model according to [34] was used to evaluate wear in textured contacts. Wear is calculated in the macro model according to Archard’s wear equation [23]. Using the local form of the equation, the local wear height Δwh can be determined in dependence of the wear coefficient C, the local asperity contact pressure pAsp, the sliding velocity vu and the sliding time Δt (Equation (6)). The change in the macroscopic geometry due to the wear height wh was considered in the calculation of the height field in Equation (7).
Δ w h = C   p A s p v u   Δ t
h = h d e f + w h
To account for the roughness topography evolution, a geometric approach was used. Mokhtar describes that in a sliding contact, the softer contact surface with increasing wear takes on the roughness of a harder counterpart [37]. The material of the upper and lower boundary surfaces of the lubricating wedge were similar to the materials in [38], therefore, it can be assumed that the wear in this study mainly occurred on the softer upper surface. The following methodology was used to model the roughness evolution: The inverted envelope of the roughness geometry of the lower surface is successively overlapped with the roughness of the softer upper surface until the latter has assumed the envelope shape of the harder, lower geometry. The overlay is divided into several increments and the current surface topography is evaluated for the corresponding overlay distances, which comes up with the local wear heights in the macro model. For these surface topographies, the asperity contact pressure curves can be determined, resulting in a wear-dependent formulation of the asperity contact pressure pAsp(h,wh). Thus, in addition to the local lubrication gap height h, the local wear height wh was used as a coupling variable between the micro and macro models. For further information regarding the wear-dependent micro model, respectively, the multiscale wear simulation, please refer to [21,34]. The load and sliding velocity were defined in order to obtain the same nominal surface pressure and relative velocity as in [34]. In Table 2, the parameters for the calculations in mixed friction and the accompanying wear simulations are summarized.
For an overview and better understanding of the simulation methodology, the schematic procedure is shown in Figure 2.
For this investigation, in addition to the smooth lubrication wedge geometry, variants with wedge-shaped texture geometries on the upper lubrication gap surface were analyzed. The lubrication gap geometry is shown in Figure 3. A parameter study was performed by varying the texture depth ht. Texture heights of 5, 10, 20, and 50 µm were used.

3. Results

3.1. Micro Model

Wear of the upper boundary surface of the lubrication gap was associated with a change in its surface topography. This resulted in a shift of the characteristic curves of the micro model. Using the presented surface modification approach of the micro model, the roughness topography of the upper wearing surface gradually assumed the inverted envelope of the topography of the lower surface with increasing wear height. Since the roughness orientation in the initial state aligns with the direction of the relative velocity, a change in the roughness orientation can be neglected [20]. With increasing wear, a tendential smoothing of the roughness topography was detectable, which resulted in a shift in the asperity contact pressure curves and the flow factor curves toward lower lubrication gap heights (Figure 4). In accordance with the literature [17,20,36,39], with increasing wear, asperities come into contact at lower lubricating gap heights, which corresponds to the running-in of a contact. With increasing wear, the surface is increasingly flattened, and therefore the lubrication flow is less affected due to the micro topography. The shift in the flow factor curves to lower lubrication gap heights was in good correlation with the literature [36,40].

3.2. Hydrodynamic Simulation

In a first step, the hydrodynamic performance of the smooth lubricating wedge was compared with those of the textured wedges. With the presented calculation method, for one operating condition (Table 1), the clearance height h0 and the hydrodynamic friction force FFric were evaluated.
Since the external load was specified, a corresponding lubrication gap height was obtained for the different geometries (Figure 5a). The clearance height can be interpreted as a parameter for the bearing capacity. A higher value for the clearance height corresponds to a higher bearing capacity of the texture. Figure 5a shows the relative clearance heights of the lubrication gaps in comparison to the smooth wedge. It can be seen that for texture heights of 5 µm and 10 µm, the corresponding lubrication gap heights and thus the load bearing capacities of the textured surfaces were approximately the same as for the smooth surfaces. For ht = 20 µm and 50 µm, the load-bearing capacity decreased significantly. In Figure 5b, it can be seen that for all texturing heights, the hydrodynamic friction force was lower than for the smooth wedge. For texture heights of 5 and 10 µm, the friction was reduced while the lubrication gap clearance remained the same, which corresponded to an improvement in the tribological performance for the considered operating condition in the hydrodynamic lubrication regime.
An analytical solution of the hydrodynamic pressure distribution for the smooth lubricating wedge was used to validate the implemented simulation model. For the operating condition in the hydrodynamic lubrication regime (Table 1), a clearance height of h 0 = 4.12   µ m was obtained. For this lubrication gap geometry, the pressure distribution was calculated, on one hand, using the simulation model, and on the other hand, using the analytical solution according to Schiebel [41]. In Figure 6, the hydrodynamic pressure in the middle of the smooth lubrication wedge (section at y = 5 mm) is depicted. It can be seen that the difference had the highest value in the center and decreased continuously toward the edges. The average deviation between the simulation model and analytical solution was ~1.9%. However, due to the small difference, the correct implementation was ensured.

3.3. Wear Simulation

In Figure 7, the simulation results for the wear calculations in the mixed friction regime are shown. The characteristics of the hydrodynamic lifting force FL_Hydro, solid contact force FL_Solid, friction coefficient µ, wear volume VW, minimum lubrication gap height hmin, and the maximum wear height whmax, depending on the time in mixed friction of the smooth lubrication wedge, were compared with those of the textured variants with different texture heights. Selected textures exhibited beneficial tribological performance in the hydrodynamic friction regime (Figure 5). It was evident for all textured variants that in the initial condition, for the operating point in mixed friction (Table 2), lower hydrodynamic lifting forces and higher solid contact forces were determined, resulting in a higher coefficient of friction. Even the textured surfaces exhibited lower friction coefficients for the considered operating point in the hydrodynamic lubrication regime. In the case of the smooth wedge, the hydrodynamic lifting force decreased successively with increasing time in mixed friction, which was related to the wear in the lubrication gap and the associated change in the lubrication gap geometry toward a parallel gap. For the textured surfaces, an intermediate increase in the hydrodynamic lifting force was evident before it rapidly decreased with increasing wear. Furthermore, it was observed that the textured surfaces showed higher wear values, even if they showed better performance in the hydrodynamic lubrication regime. Neither the maximum wear height nor the wear volume showed an advantageous trend compared to the smooth lubrication gap.
In Figure 8, the wear−dependent parameters of the lubrication gap are shown as surface plots. The superposition of the smooth lubrication wedge (α = 0.02°) with the texturing was evident by the lubrication gap height hfilm in the initial state (t = 0). In the initial state, the smallest lubrication gap height hmin was very localized at the outlet end of the lubrication gap. With an increasing time in mixed friction, the wedge became increasingly flattened, whereby the minimum lubrication gap height occurred in larger areas and reached a higher value (compared with Figure 7). This was also evident with the development of the asperity contact pressure. In the initial condition, high asperity contact pressures could be observed at the edge along the clear height h0. This area was rapidly worn due to the high asperity contact pressures (according to Equation (6)). The wear led to areas with the same lubricating gap heights. As the wedge effect decreased, it can be seen that the hydrodynamic pressure buildup was reduced. The pressure buildup due to the separate texturing can be seen in Figure 8. With increasing wear, the proportion of the pressure buildup of the texturing increased in relation to the pressure buildup of the main lubrication wedge. The plot of the wear height showed that the lubricating wedge mainly was subject to wear and the texture, due to its depth, remained almost unaffected.
In Figure 9, the parameters for the smooth lubrication gap are depicted in relation to the time in mixed friction. The results showed that with increasing wear, the wedge geometry was reduced. As a result, the hydrodynamic pressure peak shifted, and the magnitude of the hydrodynamic force decreased (compared with Figure 7).

4. Discussion

If the Reynolds equation is used for the calculation of the fluid flow in textured contacts, its limitation, that inertial forces are neglected, has to be verified. Dobrica et al. [12] bound the applicability with limits for the Reynolds number R e = ρ u h η and the texture aspect ratio λ = l t h t , which characterizes the geometry. If the Reynolds Re number is below a defined limit, and the texture aspect ratio λ is above a threshold, the Reynolds equation is applicable. In the context of this study, for the considered operating conditions, a maximum Reynolds number of R e m a x = 0.076 and a minimum texture aspect ratio of λ m i n = 20 were obtained, hence the applicability of the Reynolds equation is given.
In Figure 7, it is evident that the wear-dependent characteristics tended to follow the characteristics of the smooth lubrication gap as the texture height ht decreased. In the initial condition, it can be seen that for larger texture heights, the hydrodynamic force for the operating condition in the mixed friction regime was more reduced. With increasing wear, an intermediate increase in the hydrodynamic lifting force was evident for the textured surfaces before the hydrodynamic force decreased rapidly. The reversal point depends on the texture depth (Figure 10) and ranged between 24 s and 35 s. Up to the reversal point, the hydrodynamic lifting force for the textured surfaces increased, which can be interpreted as a recovery of the hydrodynamic performance.
Furthermore, it can be seen in Figure 10 that the reversal points occurred at maximum wear heights between 1.55 µm and 1.78 µm. The maximum wear height was at the outflow side of the lubrication gap. Hence, based on l w = w h m a x tan α , it can be deduced that the lubrication gap was worn over a length of lw = 4.4–5.1 mm for all texture heights. This means that up to the time of a half worn lubrication wedge, the hydrodynamic pressure buildup is increased compared to the initial condition. For better clarification, the surface plots at the times of the reversal points for the textured surfaces are shown in Figure 11.
Rosenkranz et al. [42] discussed the influence of the texture position in the lubrication wedge for different convergence ratios K ( K = h i n l e t h o u t l e t 1 ) on the hydrodynamic friction coefficient (where hinlet corresponds to the lubrication gap height at the inlet and houtlet to the lubrication gap height at the outlet). In scope of the present study, it was evident that in the first stadium of the wear, up to the reversal point, the performance improved (FL_Hydro was increased, µ was reduced). With increasing wear, the relative position of the texture was more at the outlet side and the convergence ratio also decreased. At the reversal point of the characteristic curves, a convergence ratio of approx. K ~1.5 was observed for all texture heights ht. Up to this point, an intermediate improvement was evident before the tribological performance dropped again. This corresponds to the trend of the friction coefficient in [42].
The comparison of the surface plots of the textured lubrication gap (Figure 8) with the smooth lubrication gap (Figure 9) conclusively showed that locally higher asperity contact pressures arose for the textured lubrication gaps. According to Archard’s wear equation, this lead to higher wear heights. On one hand, surface texturing can act as a lubricant reservoir and thus preserve the lubricant film in the mixed friction regime, resulting in lower friction and wear [43,44,45]. On the other hand, surface textures can trap wear particles, protecting the surface from abrasive wear [45,46]. These effects were not considered in the current version of the presented simulation model, and thus corresponding potential positive effects were not considered.

5. Conclusions

In the framework of this study, a simulation methodology for wear calculation in lubricated contacts considering the wear-related surface topography changes was presented. The main findings of this research are summarized below:
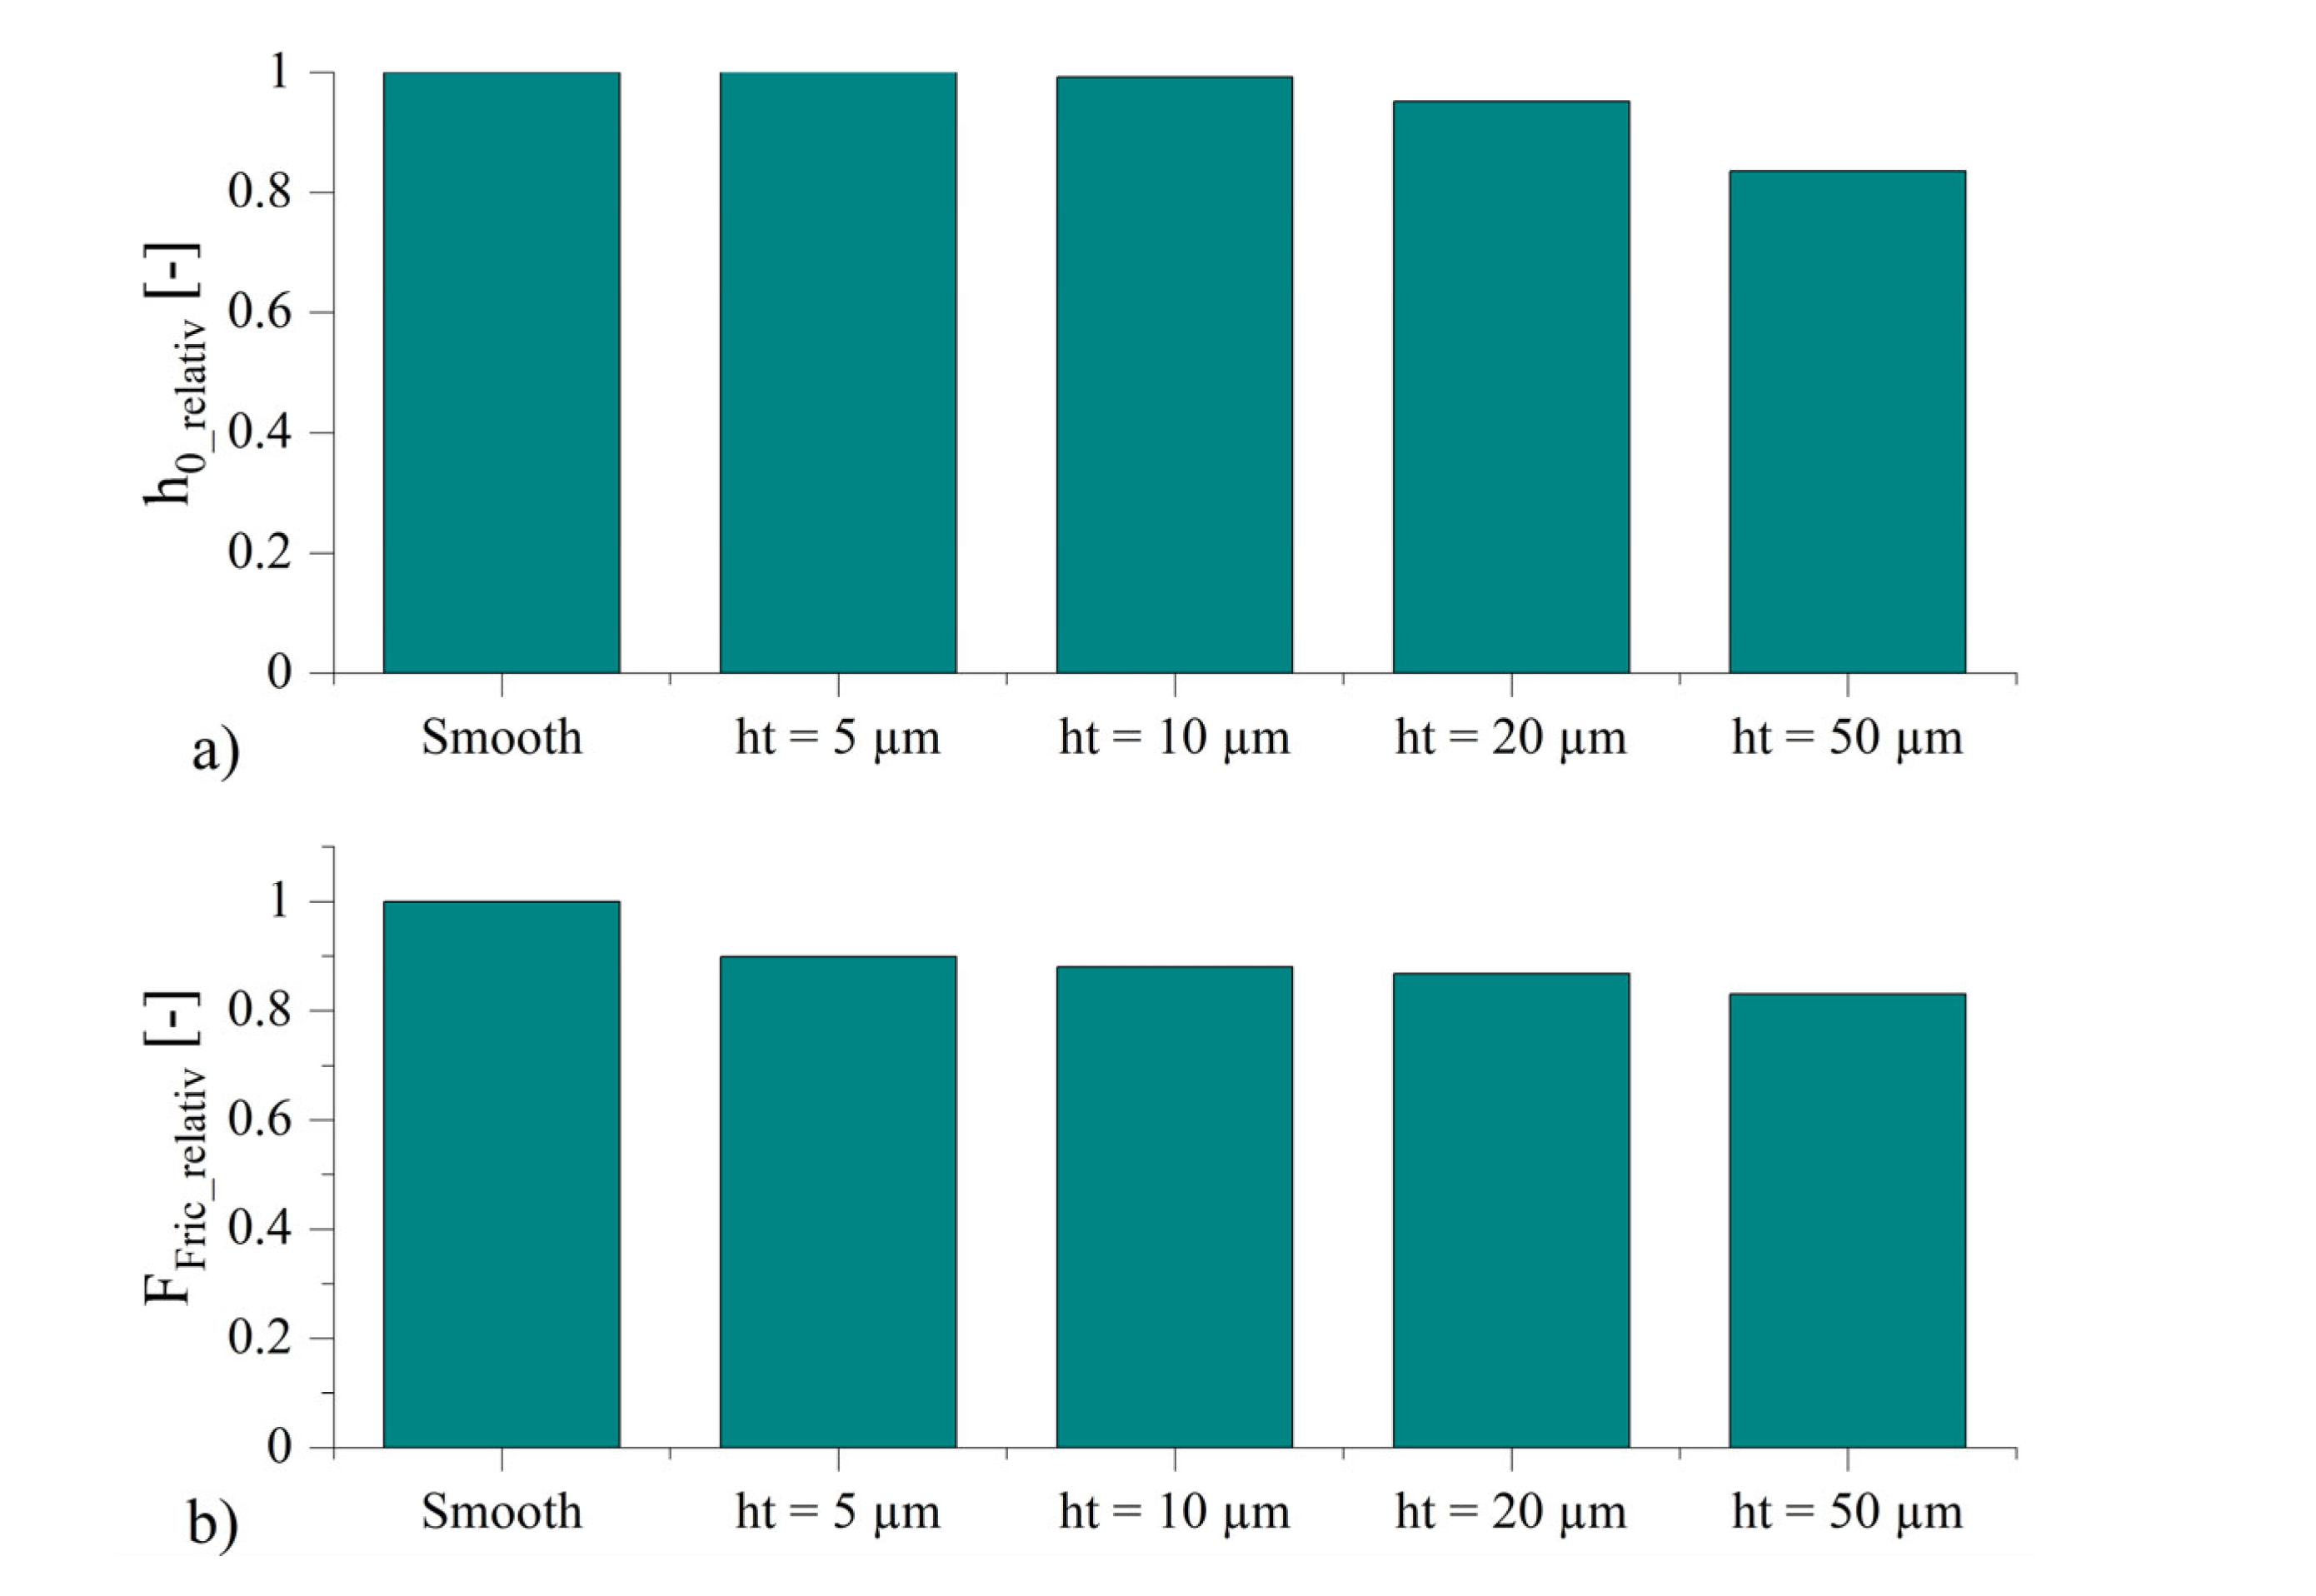
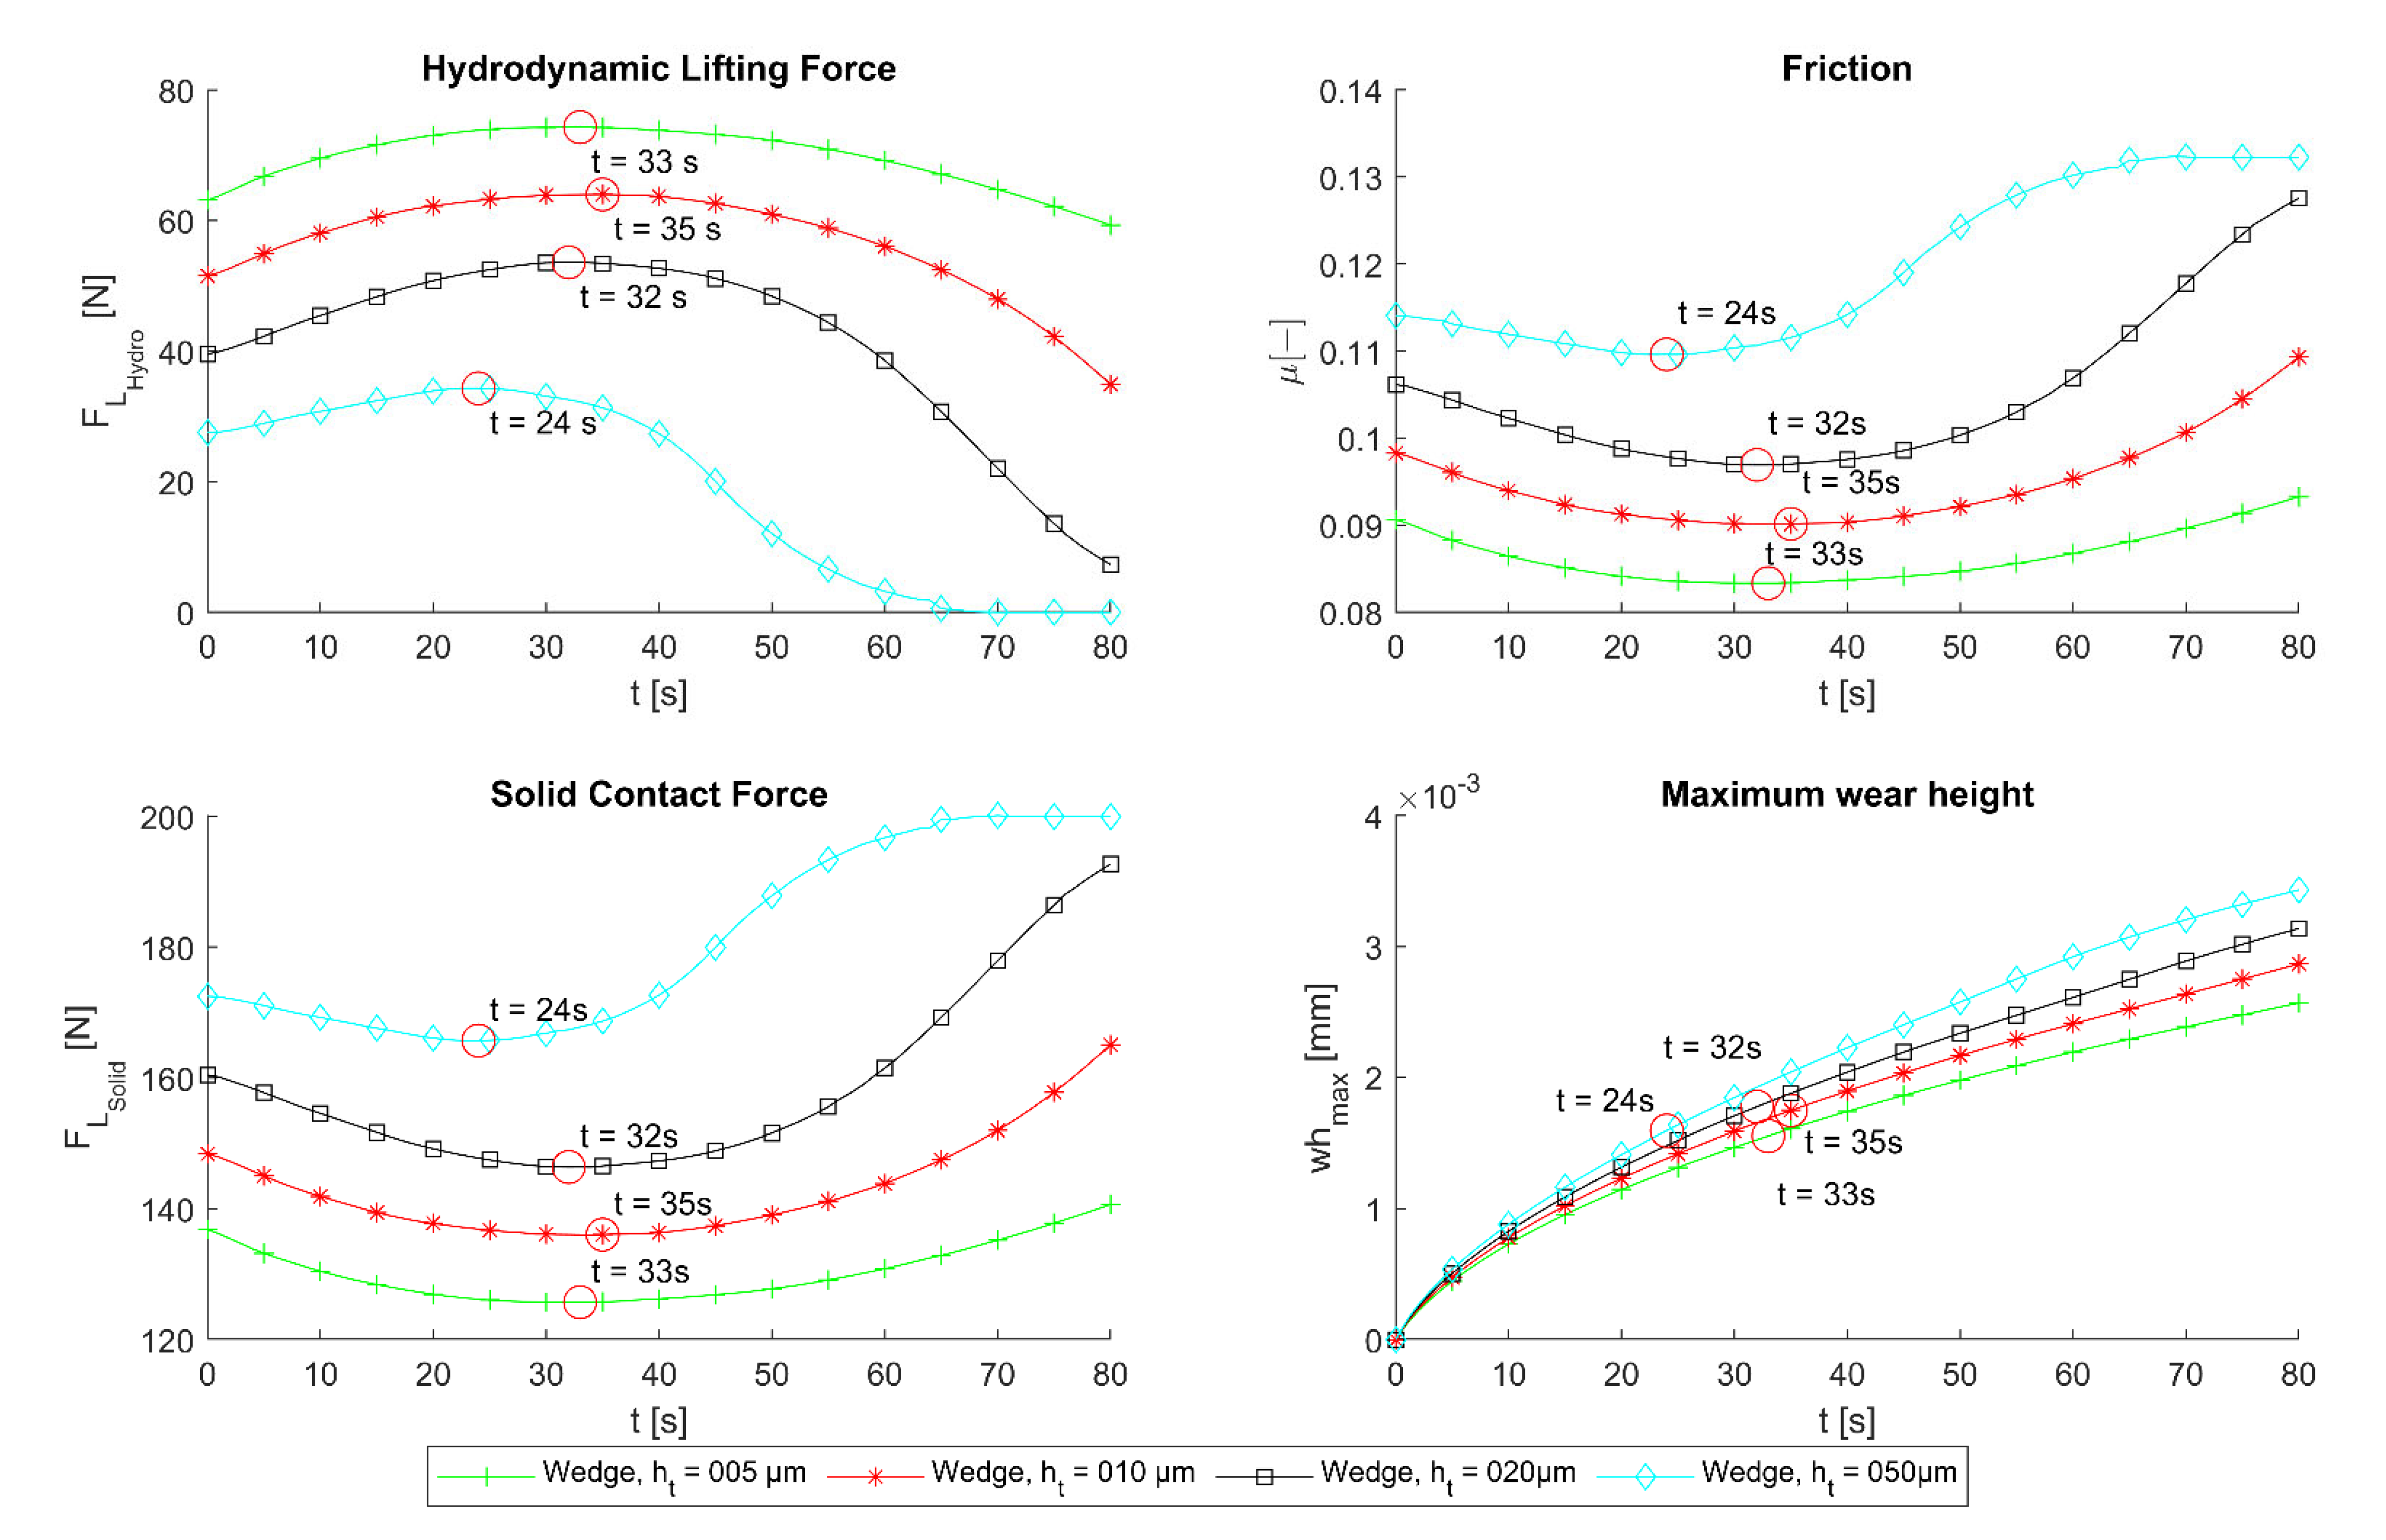
  • Surface textures show the potential to positively affect the performance of lubricated contacts in the hydrodynamic lubrication regime in terms of reduced friction and increased lifting force.
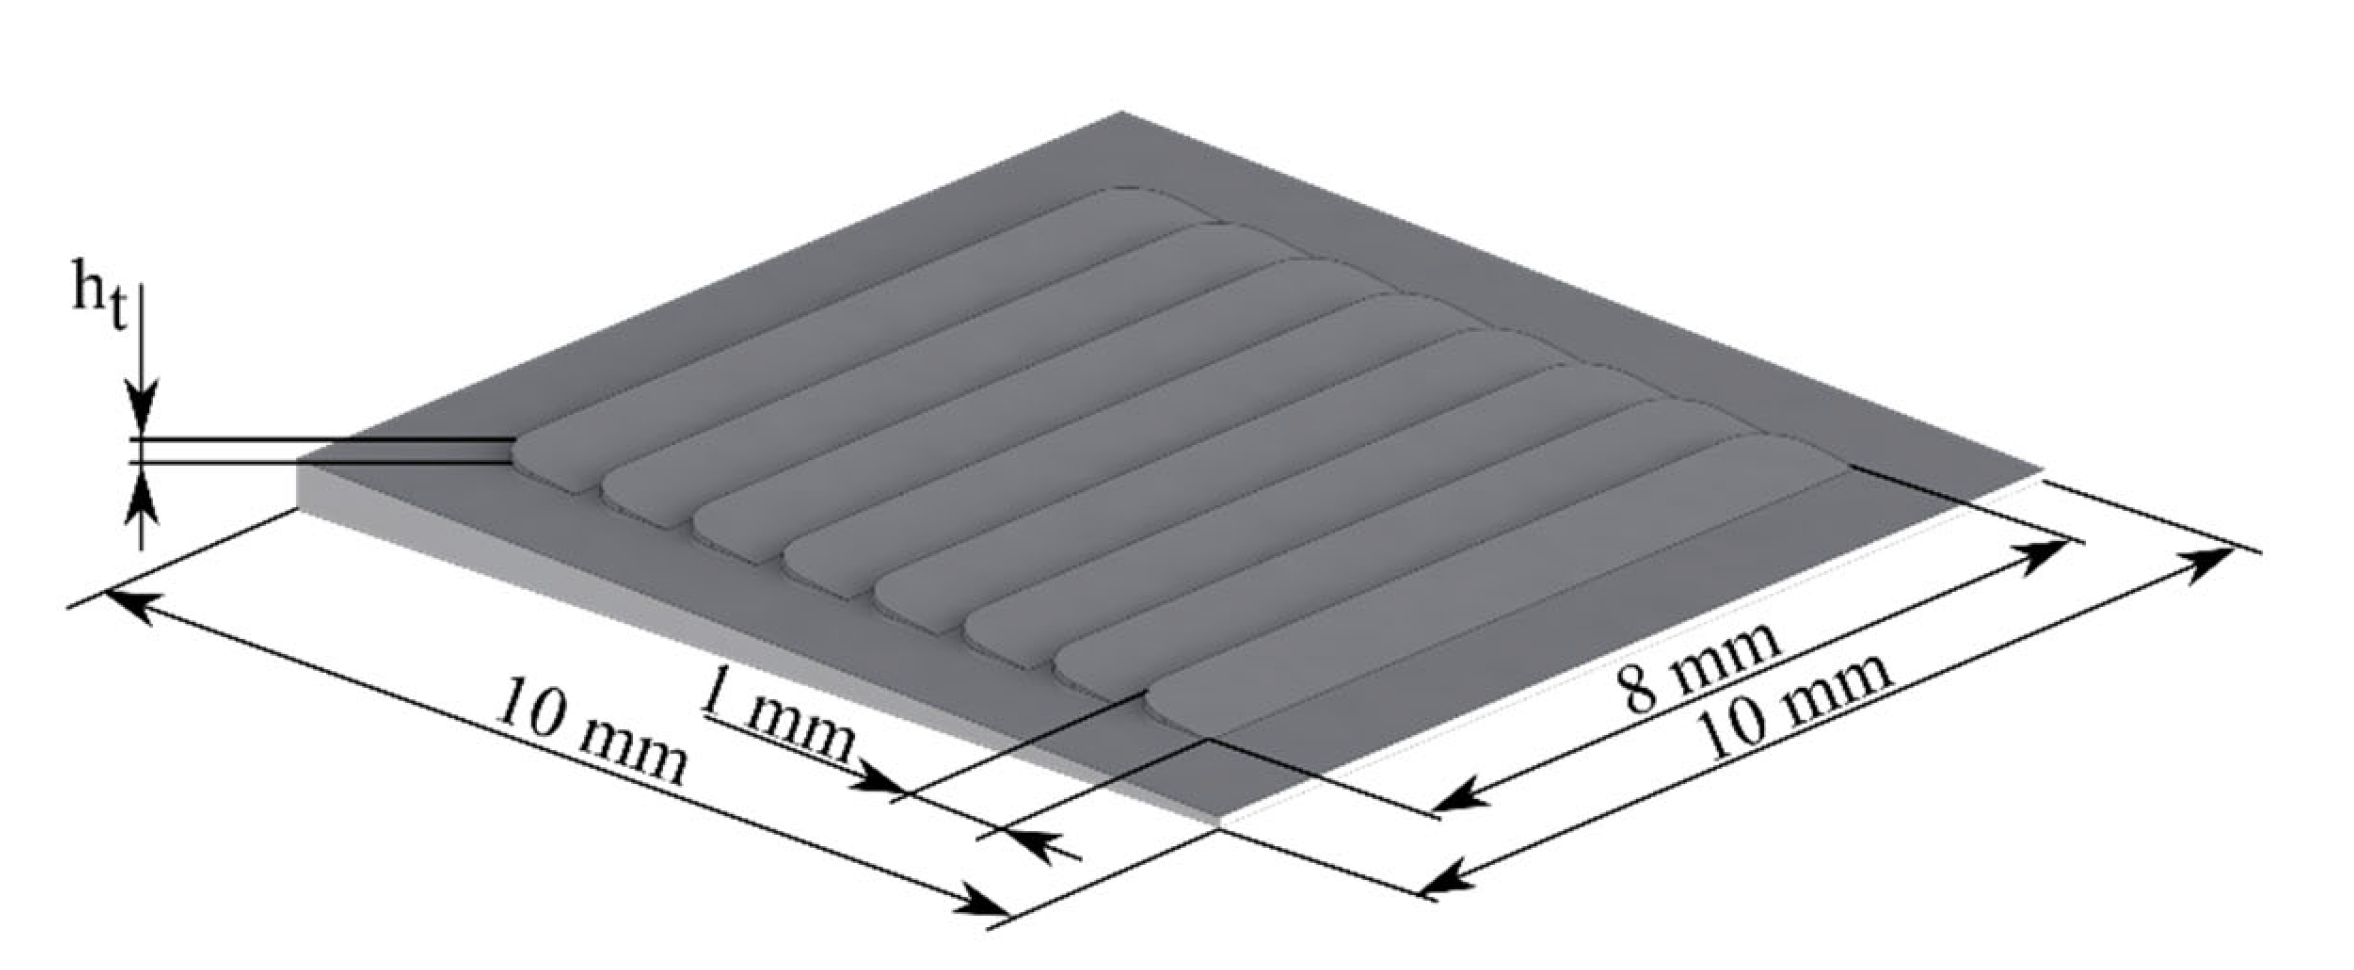
  • For a given texture shape, the texture height ht has a significant influence on the operating performance.
  • A specific texture geometry, which has a positive effect on tribological performance in a specific operating point in the hydrodynamic lubrication regime, is not inevitably associated with lower wear values. Hence, it can be inferred that a certain texture geometry only improved the tribological performance within the range of a certain operating point.
  • With increasing wear, an intermediate improvement in the tribological performance for the textured surfaces could be observed. From a reversal point, which occurred for all considered textured heights at a maximum wear height of ~1.6 µm, respectively, a convergence ratio of K ~1.5, the tribological performance deteriorated again, which corresponded to the observations regarding the coefficient of friction for different convergence ratios of another author [42].
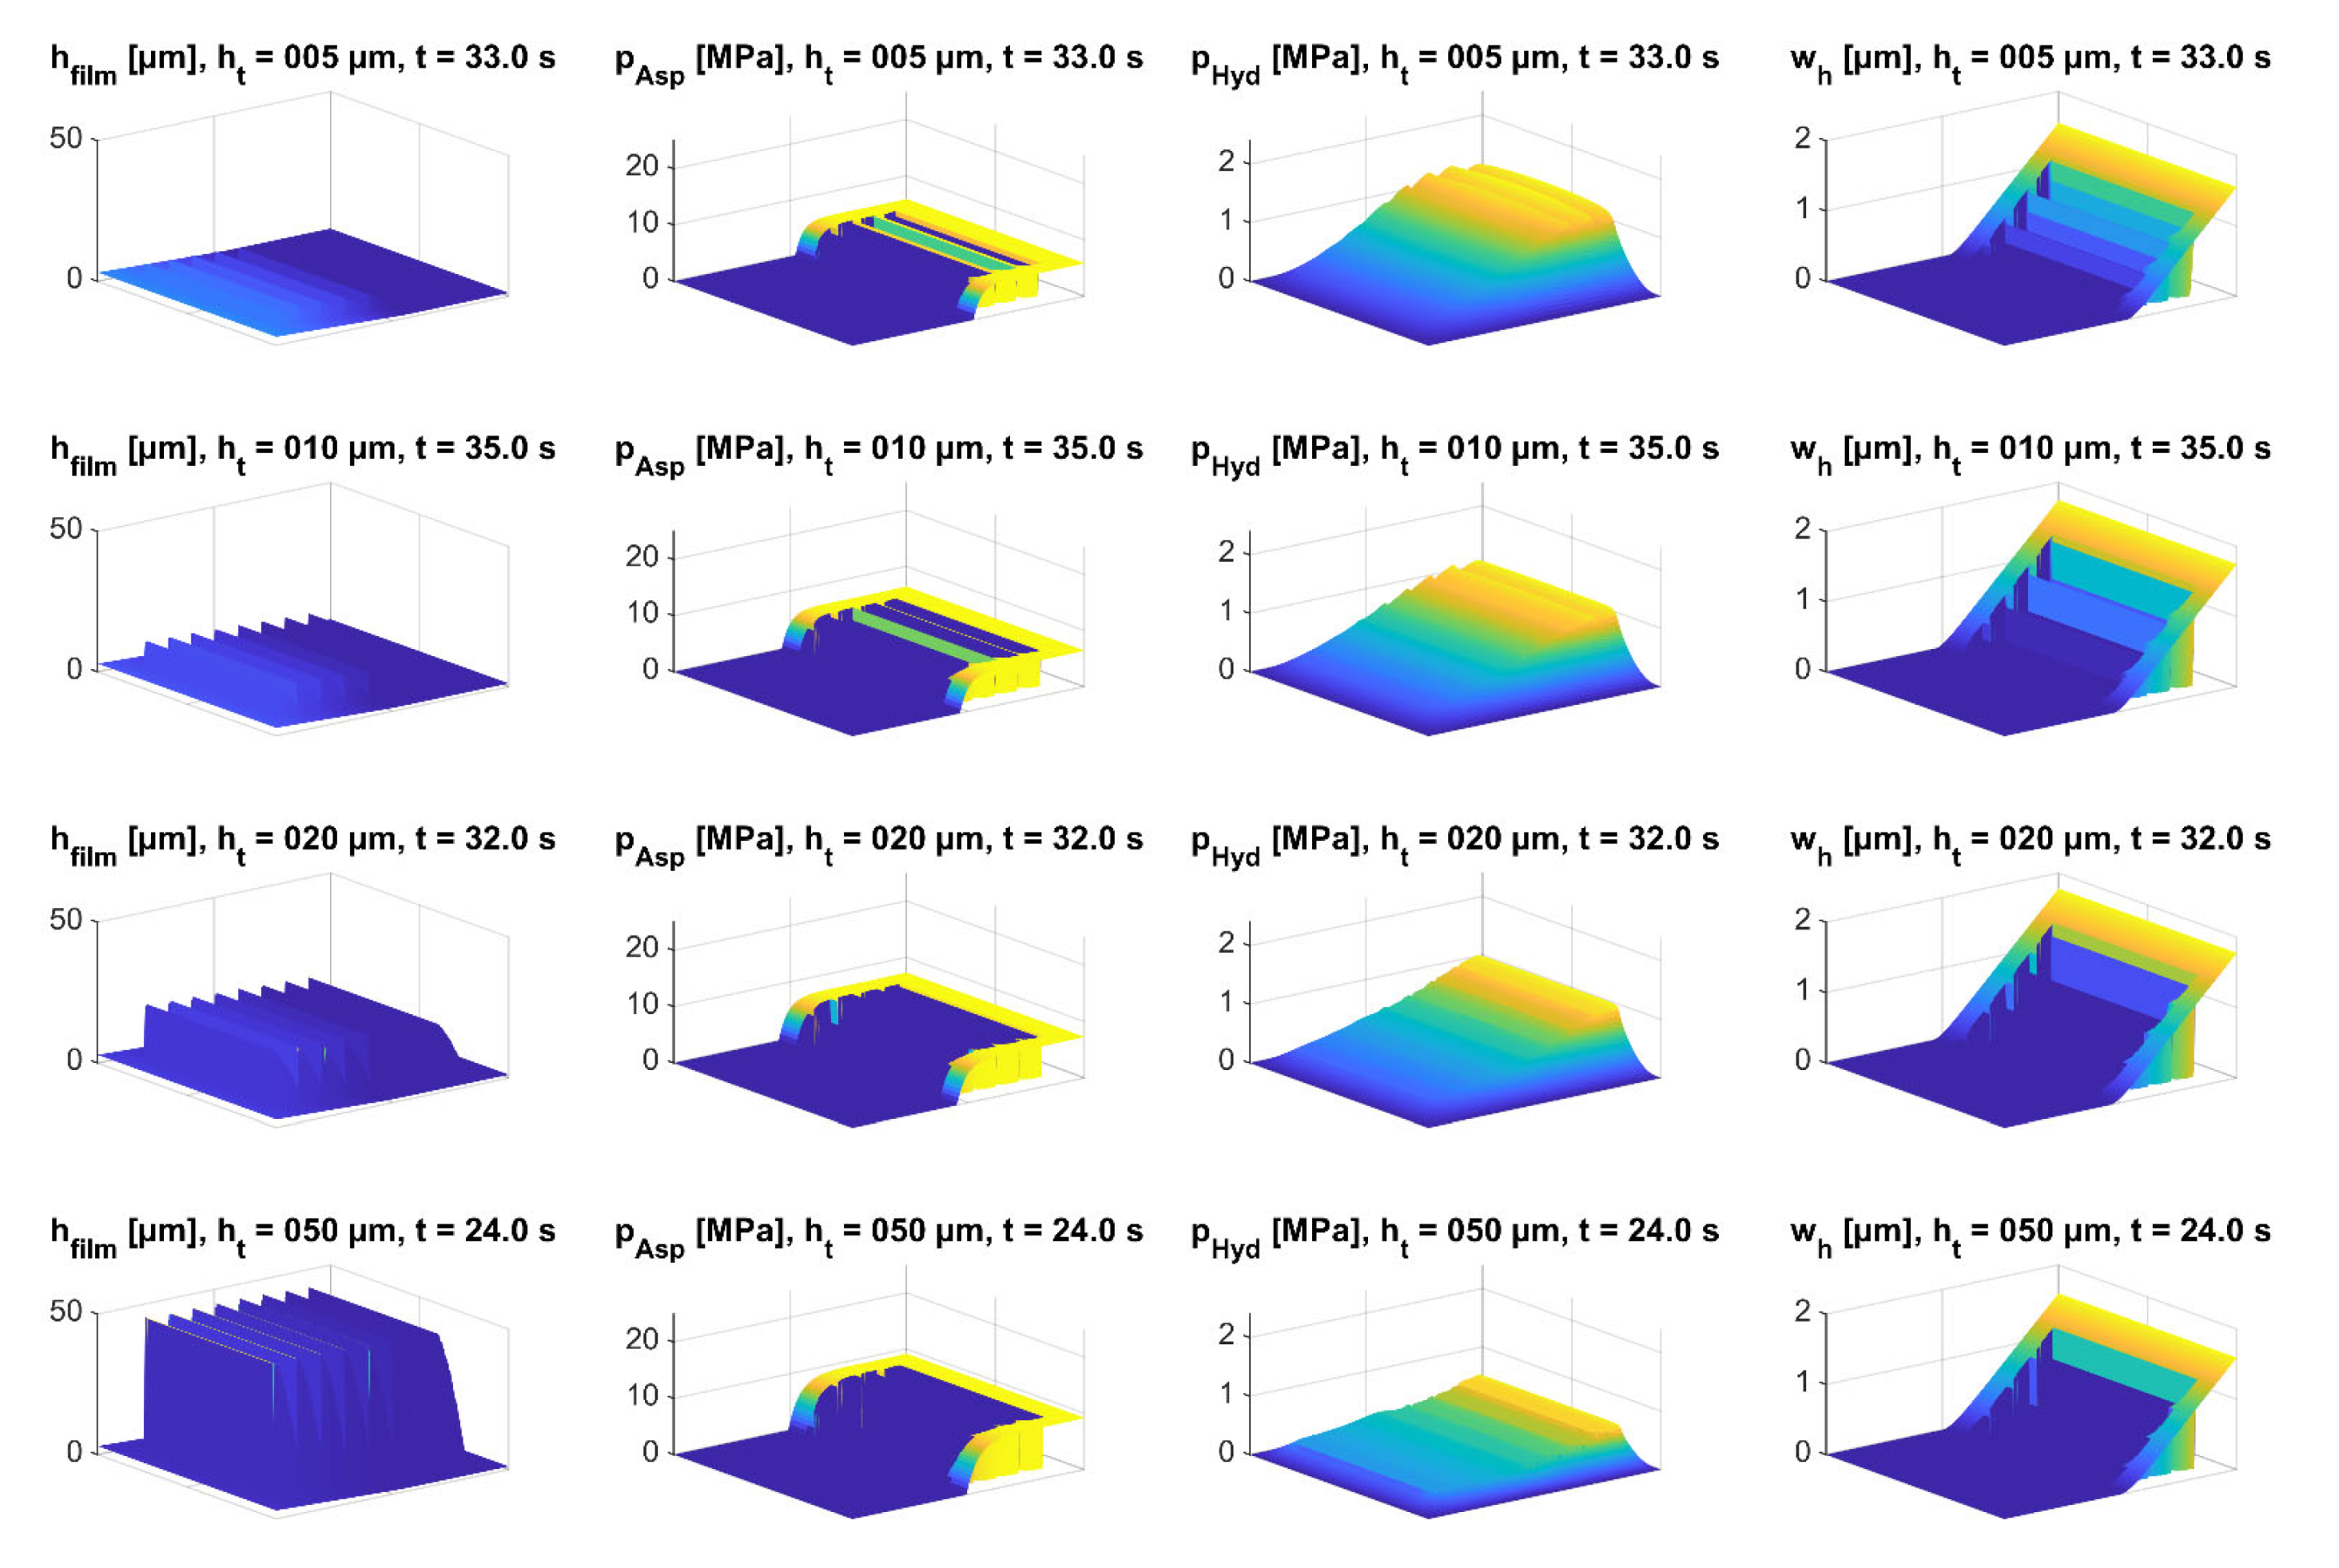
  • In the present study, the ability to trap wear particles in the texturing dimples was not modeled. This mechanism can improve the wear behavior, therefore, the obtained simulation results should be interpreted as relative values. The presented simulation model is intended to provide a better understanding of the contact conditions, particularly the asperity contact pressure, in the lubricated and textured contacts and considering the wear dependent surfaces.

Author Contributions

Conceptualization, M.M. and M.P.; Methodology, M.M.; Software, M.M.; Investigation, M.M.; Data curation, M.M.; Writing—original draft preparation, M.M.; Writing—review and editing, M.P. and F.G.; Supervision, M.P. and F.G. All authors have read and agreed to the published version of the manuscript.

Funding

This research received no external funding.

Institutional Review Board Statement

Not applicable.

Informed Consent Statement

Not applicable.

Data Availability Statement

Not applicable.

Conflicts of Interest

The authors declare no conflict of interest.

References

  1. Luo, Y.; Yuan, L.; Li, J.; Wang, J. Boundary layer drag reduction research hypotheses derived from bio-inspired surface and recent advanced applications. Micron 2015, 79, 59–73. [Google Scholar] [CrossRef] [PubMed]
  2. Wu, L.; Wang, J.; Luo, G.; Wang, S.; Qu, J.; Fan, X.; Liu, C. Study on the Drag Reduction Characteristics of the Surface Morphology of Paramisgurnus dabryanus Loach. Coatings 2021, 11, 1357. [Google Scholar] [CrossRef]
  3. Zhang, M.; Feng, S.; Wang, L.; Zheng, Y. Lotus effect in wetting and self-cleaning. Biotribology 2016, 5, 31–43. [Google Scholar] [CrossRef]
  4. Holmberg, K.; Erdemir, A. Influence of tribology on global energy consumption, costs and emissions. Friction 2017, 5, 263–284. [Google Scholar] [CrossRef] [Green Version]
  5. Dobrica, M.B.; Fillon, M.; Pascovici, M.D.; Cicone, T. Optimizing surface texture for hydrodynamic lubricated contacts using a mass-conserving numerical approach. Proc. Inst. Mech. Eng. Part J J. Eng. Tribol. 2010, 224, 737–750. [Google Scholar] [CrossRef]
  6. Mishra, P.; Ramkumar, P. Effect of Micro Texture on Tribological Performance of Piston Ring-Cylinder Liner System under Different Lubrication Regimes. In Proceedings of the International Conference on Advances in Design, Materials, Manufacturing and Surface Engineering for Mobility, SAE International, Chennai, India, 20–21 July 2018. [Google Scholar]
  7. Morris, N.; Leighton, M.; de La Cruz, M.; Rahmani, R.; Rahnejat, H.; Howell-Smith, S. Combined numerical and experimental investigation of the micro-hydrodynamics of chevron-based textured patterns influencing conjunctional friction of sliding contacts. Proc. Inst. Mech. Eng. Part J J. Eng. Tribol. 2015, 229, 316–335. [Google Scholar] [CrossRef]
  8. Filho, I.C.M.F.; Bottene, A.C.; Silva, E.J.; Nicoletti, R. Static behavior of plain journal bearings with textured journal-Experimental analysis. Tribol. Int. 2021, 159, 106970. [Google Scholar] [CrossRef]
  9. Vlădescu, S.-C.; Fowell, M.; Mattsson, L.; Reddyhoff, T. The effects of laser surface texture applied to internal combustion engine journal bearing shells–An experimental study. Tribol. Int. 2019, 134, 317–327. [Google Scholar] [CrossRef]
  10. Grützmacher, P.G.; Rosenkranz, A.; Szurdak, A.; König, F.; Jacobs, G.; Hirt, G.; Mücklich, F. From lab to application-Improved frictional performance of journal bearings induced by single- and multi-scale surface patterns. Tribol. Int. 2018, 127, 500–508. [Google Scholar] [CrossRef]
  11. Bartel, D. Simulation von Tribosystemen: Grundlagen und Anwendungen; Vieweg + Teubner; GWV Fachverlage GmbH: Wiesbaden, Germany, 2010. [Google Scholar]
  12. Dobrica, M.B.; Fillon, M. About the validity of Reynolds equation and inertia effects in textured sliders of infinite width. Proc. Inst. Mech. Eng. Part J J. Eng. Tribol. 2009, 223, 69–78. [Google Scholar] [CrossRef]
  13. Jackson, R.L.; Green, I. A statistical model of elasto-plastic asperity contact between rough surfaces. Tribol. Int. 2006, 39, 906–914. [Google Scholar] [CrossRef]
  14. Greenwood, J.A.; Williamson, J.B.P. Contact of nominally flat surfaces. Proc. R. Soc. Lond. Ser. A Math. Phys. Sci. 1966, 295, 300–319. [Google Scholar] [CrossRef]
  15. Greenwood, J.A.; Tripp, J.H. The contact of two nominally flat rough surfaces. Proc. Inst. Mech. Eng. 1970, 185, 625–633. [Google Scholar] [CrossRef]
  16. Kogut, L.; Etsion, I. A Finite Element Based Elastic-Plastic Model for the Contact of Rough Surfaces. Tribol. Trans. 2003, 46, 383–390. [Google Scholar] [CrossRef]
  17. Maier, M.; Pusterhofer, M.; Summer, F.; Grün, F. Validation of statistic and deterministic asperity contact models using experimental Stribeck data. Tribol. Int. 2021, 165, 107329. [Google Scholar] [CrossRef]
  18. Waddad, Y.; Magnier, V.; Dufrénoy, P.; de Saxcé, G. Multiscale thermomechanical modeling of frictional contact problems considering wear–Application to a pin-on-disc system. Wear 2019, 426–427, 1399–1409. [Google Scholar] [CrossRef]
  19. Sugimura, J.; Kimura, Y.; Amino, K. Analysis of the Topographical Changes due to Wear-Geometry of the Running-In Process. Toraibarojisuto J. Jpn. Soc. Tribol. 1986, 31, 813–820. [Google Scholar]
  20. König, F.; Chaib, A.O.; Jacobs, G.; Sous, C. A multiscale-approach for wear prediction in journal bearing systems–from wearing-in towards steady-state wear. Wear 2019, 426–427, 1203–1211. [Google Scholar] [CrossRef]
  21. Maier, M.; Pusterhofer, M.; Grün, F. Modelling Approaches of Wear-Based Surface Development and Their Experimental Validation. Lubricants 2022, 10, 335. [Google Scholar] [CrossRef]
  22. Albers, A.; Reichert, S. On the influence of surface roughness on the wear behavior in the running-in phase in mixed-lubricated contacts with the finite element method. Wear 2017, 376–377, 1185–1193. [Google Scholar] [CrossRef]
  23. Jarchard, F.; Hirst, W. The wear of metals under unlubricated conditions. Proc. R. Soc. Lond. Ser. A Math. Phys. Sci. 1956, 236, 397–410. [Google Scholar] [CrossRef]
  24. Põdra, P.; Andersson, S. Simulating sliding wear with finite element method. Tribol. Int. 1999, 32, 71–81. [Google Scholar] [CrossRef]
  25. Fleischer, G. Zum energetischen Niveau von Reibpaarungen. Schmierungstechnik 1985, 12, 358–363. [Google Scholar]
  26. Ostovan, F.; Hasanzadeh, E.; Toozandehjani, M.; Shafiei, E.; Jamaludin, K.R.; Amrin, A.B. A combined friction stir processing and ball milling route for fabrication Al5083-Al2O3 nanocomposite. Mater. Res. Express 2019, 6, 65012. [Google Scholar] [CrossRef]
  27. Ostovan, F.; Azimifar, I.; Toozandehjani, M.; Shafiei, E.; Shamshirsaz, M. Synthesis of ex-situ Al5083 reinforced with mechanically-alloyed CNTs and Fe2O3 nanoparticles using friction stir processing. J. Mater. Res. Technol. 2021, 14, 1670–1681. [Google Scholar] [CrossRef]
  28. Netgen/NGSolve Finite Element Tool. 2023. Available online: https://docu.ngsolve.org/latest/index.html (accessed on 10 January 2023).
  29. Michael Dawson-Haggerty. Trimesh. 2023. Available online: https://trimsh.org/trimesh.html (accessed on 10 January 2023).
  30. Patir, N.; Cheng, H.S. An Average Flow Model for Determining Effects of Three-Dimensional Roughness on Partial Hydrodynamic Lubrication. J. Lubr. Technol. 1978, 100, 12–17. [Google Scholar] [CrossRef]
  31. Patir, N.; Cheng, H.S. Application of Average Flow Model to Lubrication Between Rough Sliding Surfaces. J. Lubr. Technol. 1979, 101, 220–229. [Google Scholar] [CrossRef]
  32. Jakobsson, B.; Floberg, L. The Finite Journal Bearing, Considering Vaporization: (Das Gleitlager von Endlicher Breite mit Verdampfung); Gumperts: Göteborg, Germany, 1957. [Google Scholar]
  33. Boussinesq, J. Application des Potentiels à L'étude de L'équilibre et du Mouvement des Solides Élastiques, Principalement au Calcul des Déformations et des Pressions Que Produisent, Dans Ces Solides, des Efforts Quelconques Exercés sur Une Petite Partie de Leur Surface ou de Leur Intérieur: Mémoire Suivi de Notes Étendues sur Divers Points de Physique Mathématique et d'Analyse; Gauthier-Villars: Paris, France, 1885. [Google Scholar]
  34. Maier, M.; Pusterhofer, M.; Grün, F. Wear simulation in lubricated contacts considering wear-dependent surface topography changes. Mater. Today Proc. 2023, 96, 173. [Google Scholar] [CrossRef]
  35. Bergmann, P.; Grün, F.; Gódor, I.; Stadler, G.; Maier-Kiener, V. On the modelling of mixed lubrication of conformal contacts. Tribol. Int. 2018, 125, 220–236. [Google Scholar] [CrossRef]
  36. Sander, D.E.; Allmaier, H.; Priebsch, H.H.; Witt, M.; Skiadas, A. Simulation of journal bearing friction in severe mixed lubrication–Validation and effect of surface smoothing due to running-in. Tribol. Int. 2016, 96, 173–183. [Google Scholar] [CrossRef] [Green Version]
  37. Mokhtar, M.O.A.; Howarth, R.B.; Davies, P.B. Wear Characteristics of Plain Hydrodynamic Journal Bearings During Repeated Starting and Stopping. ASLE Trans. 1977, 20, 191–194. [Google Scholar] [CrossRef]
  38. Pusterhofer, M.; Summer, F.; Gódor, I.; Grün, F. Cumulative damage assessment of tribological durability limits. Wear 2020, 456–457, 203318. [Google Scholar] [CrossRef]
  39. König, F.; Sous, C.; Jacobs, G. Numerical prediction of the frictional losses in sliding bearings during start-stop operation. Friction 2020, 71, 22. [Google Scholar] [CrossRef]
  40. Awasthi, R.K.; Jain, S.C.; Sharma, S.C. A Simulation Study of Running-in Wear Effect and Its Influence on Average Flow Factors. Tribol. Trans. 2006, 49, 427–438. [Google Scholar] [CrossRef]
  41. Schiebel, A.; Körner, K. Die Gleitlager (Längs- und Querlager): Berechnung und Konstruktion; Springer: Berlin/Heidelberg, Germany, 1933. [Google Scholar]
  42. Rosenkranz, A.; Costa, H.L.; Profito, F.; Gachot, C.; Medina, S.; Dini, D. Influence of surface texturing on hydrodynamic friction in plane converging bearings-An experimental and numerical approach. Tribol. Int. 2019, 134, 190–204. [Google Scholar] [CrossRef]
  43. Azami, B.; Torabi, A.; Akbarzadeh, S.; Esfahanian, M. Experimental Investigation of Textured Surfaces in Line and Point Mixed Lubrication Contact. J. Stress Anal. 2022, 6, 59–65. [Google Scholar] [CrossRef]
  44. Vlădescu, S.-C.; Olver, A.V.; Pegg, I.G.; Reddyhoff, T. Combined friction and wear reduction in a reciprocating contact through laser surface texturing. Wear 2016, 358–359, 51–61. [Google Scholar] [CrossRef] [Green Version]
  45. Liu, S.; Sai, Q.; Wang, S.; Williams, J. Effects of Laser Surface Texturing and Lubrication on the Vibrational and Tribological Performance of Sliding Contact. Lubricants 2022, 10, 10. [Google Scholar] [CrossRef]
  46. Schnell, G.; Müller, T.; Seitz, H. Tribological effects of different scaled chevron-shaped microstructures on the Stribeck curve of parallel contacts under unidirectional friction. Tribol. Int. 2023, 178, 108099. [Google Scholar] [CrossRef]
Figure 1. (a) Dimensions and velocity boundary conditions of the lubrication gap, (b) pressure boundary condition, (c) force equilibrium for hydrodynamic lubrication, (d) force equilibrium for mixed lubrication.
Coatings 13 00697 g001
Figure 2. Methodical approach—interaction of the macro and micro models.
Coatings 13 00697 g002
Figure 3. Dimensions of the textured lubrication gap.
Coatings 13 00697 g003
Figure 4. Results of the wear dependent micro model (a) asperity contact pressure, (b) flow factors, (c) shear factors.
Coatings 13 00697 g004
Figure 5. Results of the hydrodynamic simulation: (a) relative lubrication gap clearance, (b) relative hydrodynamic friction force.
Coatings 13 00697 g005
Figure 6. Centered hydrodynamic pressure distribution of the smooth lubrication wedge.
Coatings 13 00697 g006
Figure 7. Development of the selected tribosystem parameters as a function of time in mixed friction and the associated wear.
Coatings 13 00697 g007
Figure 8. Plot of the time dependent lubrication gap height, asperity contact pressure, hydrodynamic pressure, and wear height for a texture height of ht = 10 µm.
Coatings 13 00697 g008
Figure 9. Plot of the time dependent lubrication gap height, asperity contact pressure, hydrodynamic pressure, and wear height for the smooth lubrication wedge.
Coatings 13 00697 g009
Figure 10. Reversal points in the wear dependent characteristic curves.
Coatings 13 00697 g010
Figure 11. Surface plots for the wear dependent lubrication gap height, asperity contact pressure, hydrodynamic pressure, and wear height at the reversal point.
Coatings 13 00697 g011
Table 1. Parameters of the simulations in the hydrodynamic lubrication regime.
ParameterValue
LoadFLoad = 200 N
Velocityu = 5 m/s
Densityρ = 819.63 kg/m3
Dynamic viscosityη = 0.01021 Pas
Table 2. Simulation parameters for the micro and macro models.
ParameterValue
LoadFload = 200 N
Velocityu = 0.124 m/s
Densityρ = 819.63 kg/m3
Dynamic viscosityη = 0.01021 Pas
Wear coefficientC = 3.72 × 10⁻¹⁴ m3/Nm
Static friction coefficientµ0 = 0.132
E-Modulus upper bodyEupper = 77,590 N/mm2
E-Modulus lower bodyElower = 210,000 N/mm2
Poisson’s ratio upper bodyνupper = 0.3
Poisson’s ratio lower bodyνlower = 0.3
Disclaimer/Publisher’s Note: The statements, opinions and data contained in all publications are solely those of the individual author(s) and contributor(s) and not of MDPI and/or the editor(s). MDPI and/or the editor(s) disclaim responsibility for any injury to people or property resulting from any ideas, methods, instructions or products referred to in the content.

