Author Contributions
M.S. management of annotation, design of the experiments, validation. I.O. idea author; application of statistical, mathematical, computational, formal techniques to analyze and synthesize study data; preparation, creation, and presentation of the published work—specifically, writing the initial draft. B.T. performed the experiments. M.B. and M.N., visualization/data presentation. All authors have read and agreed to the published version of the manuscript.
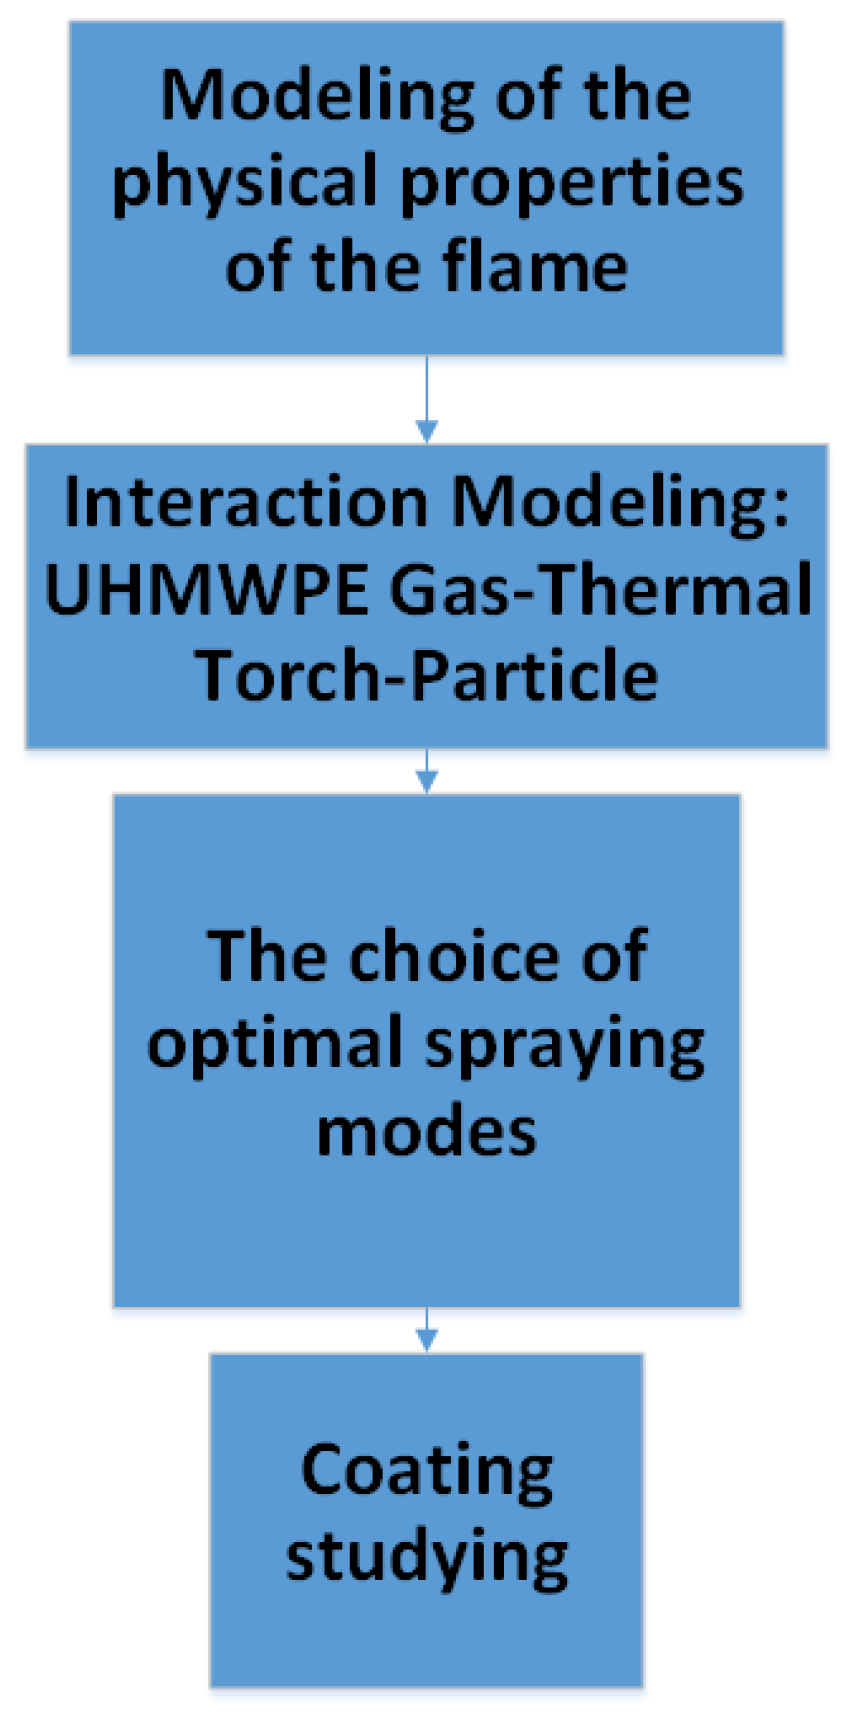
Figure 1.
General scheme of the study.
Figure 1.
General scheme of the study.
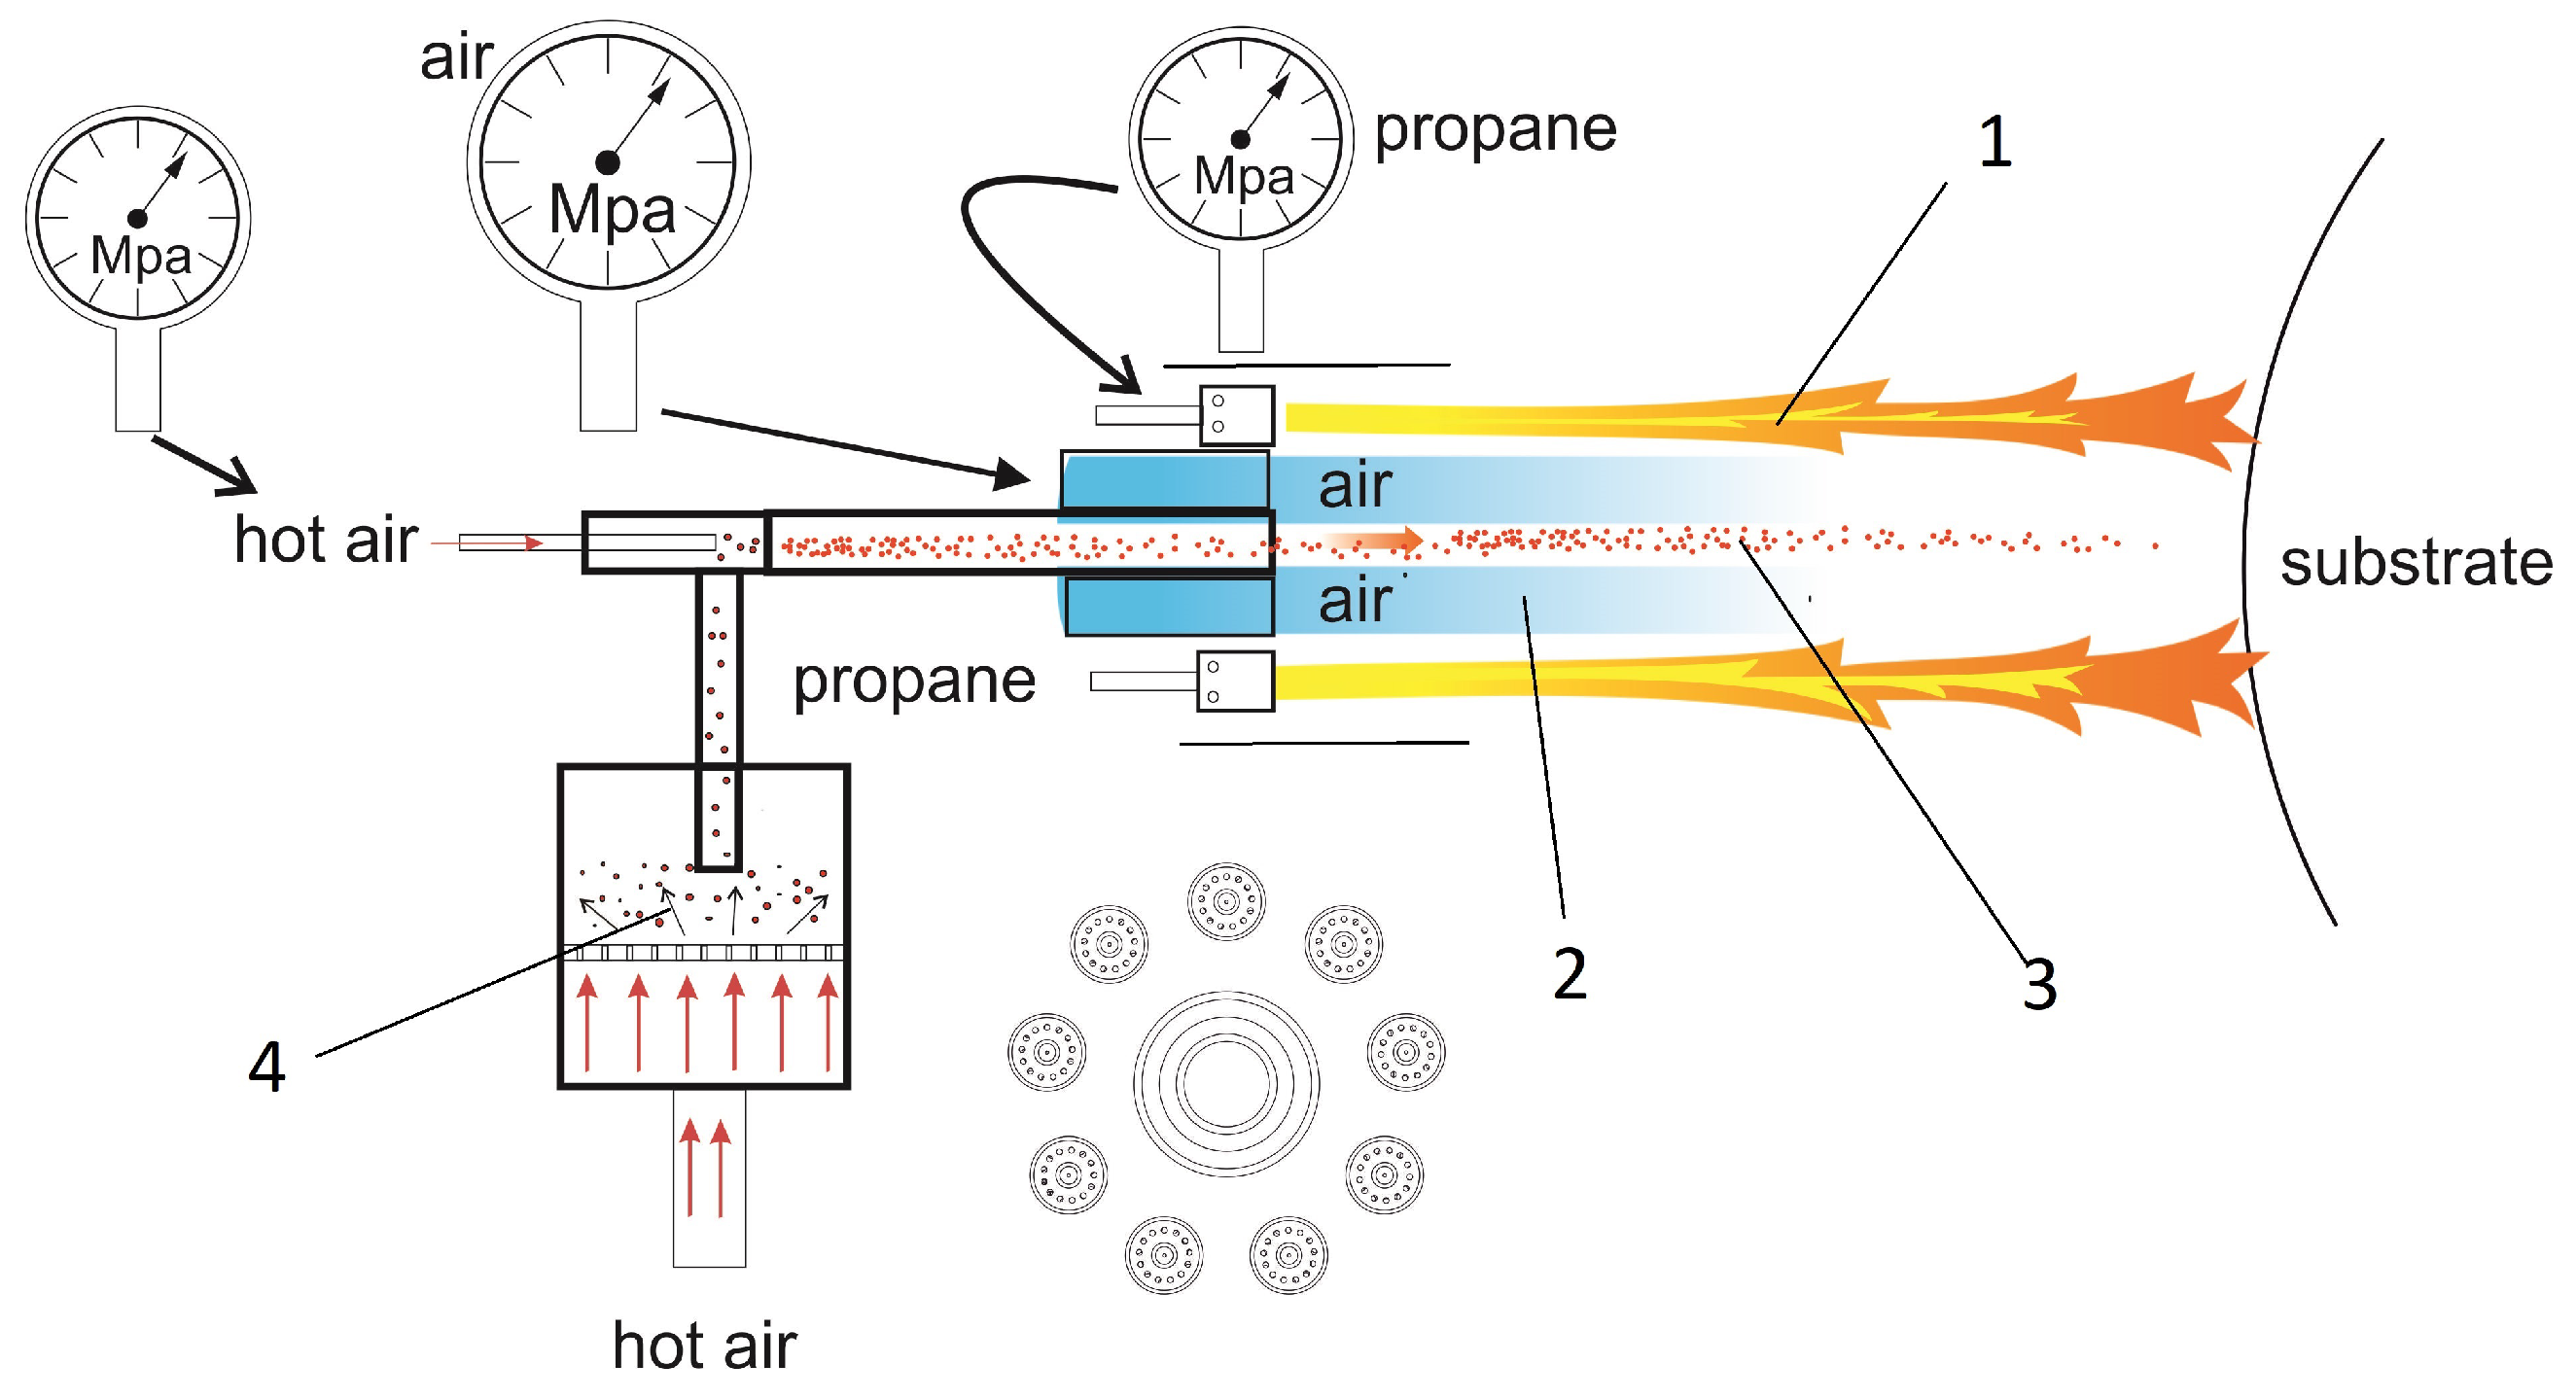
Figure 2.
Scheme of the experimental setup for spraying polymeric thermoplastic materials.
Figure 2.
Scheme of the experimental setup for spraying polymeric thermoplastic materials.
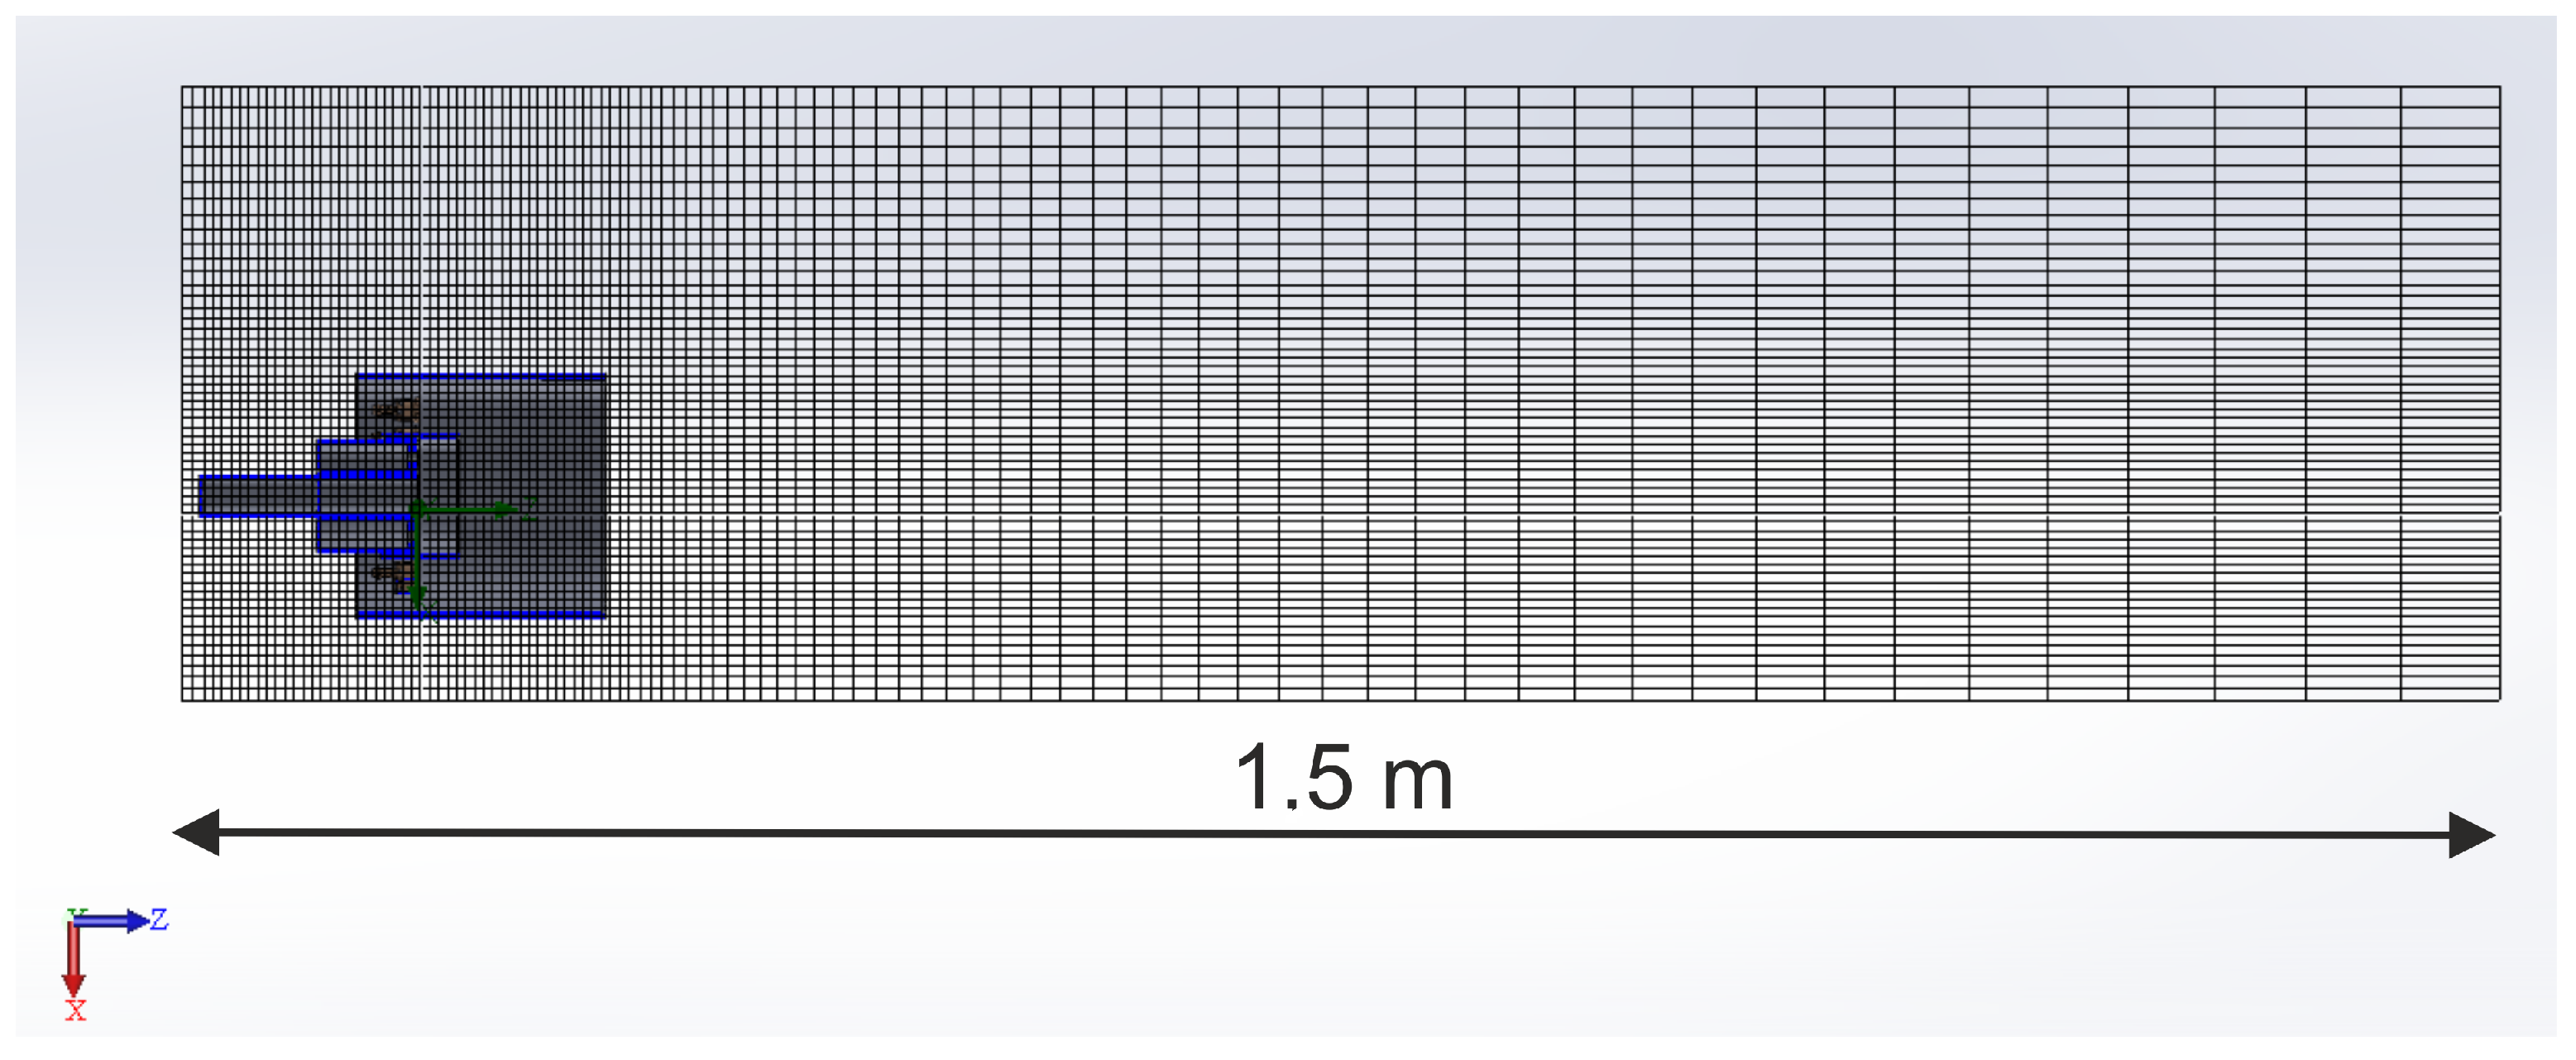
Figure 3.
Three-dimensional model of a gas-thermal burner in a domain divided into cells.
Figure 3.
Three-dimensional model of a gas-thermal burner in a domain divided into cells.
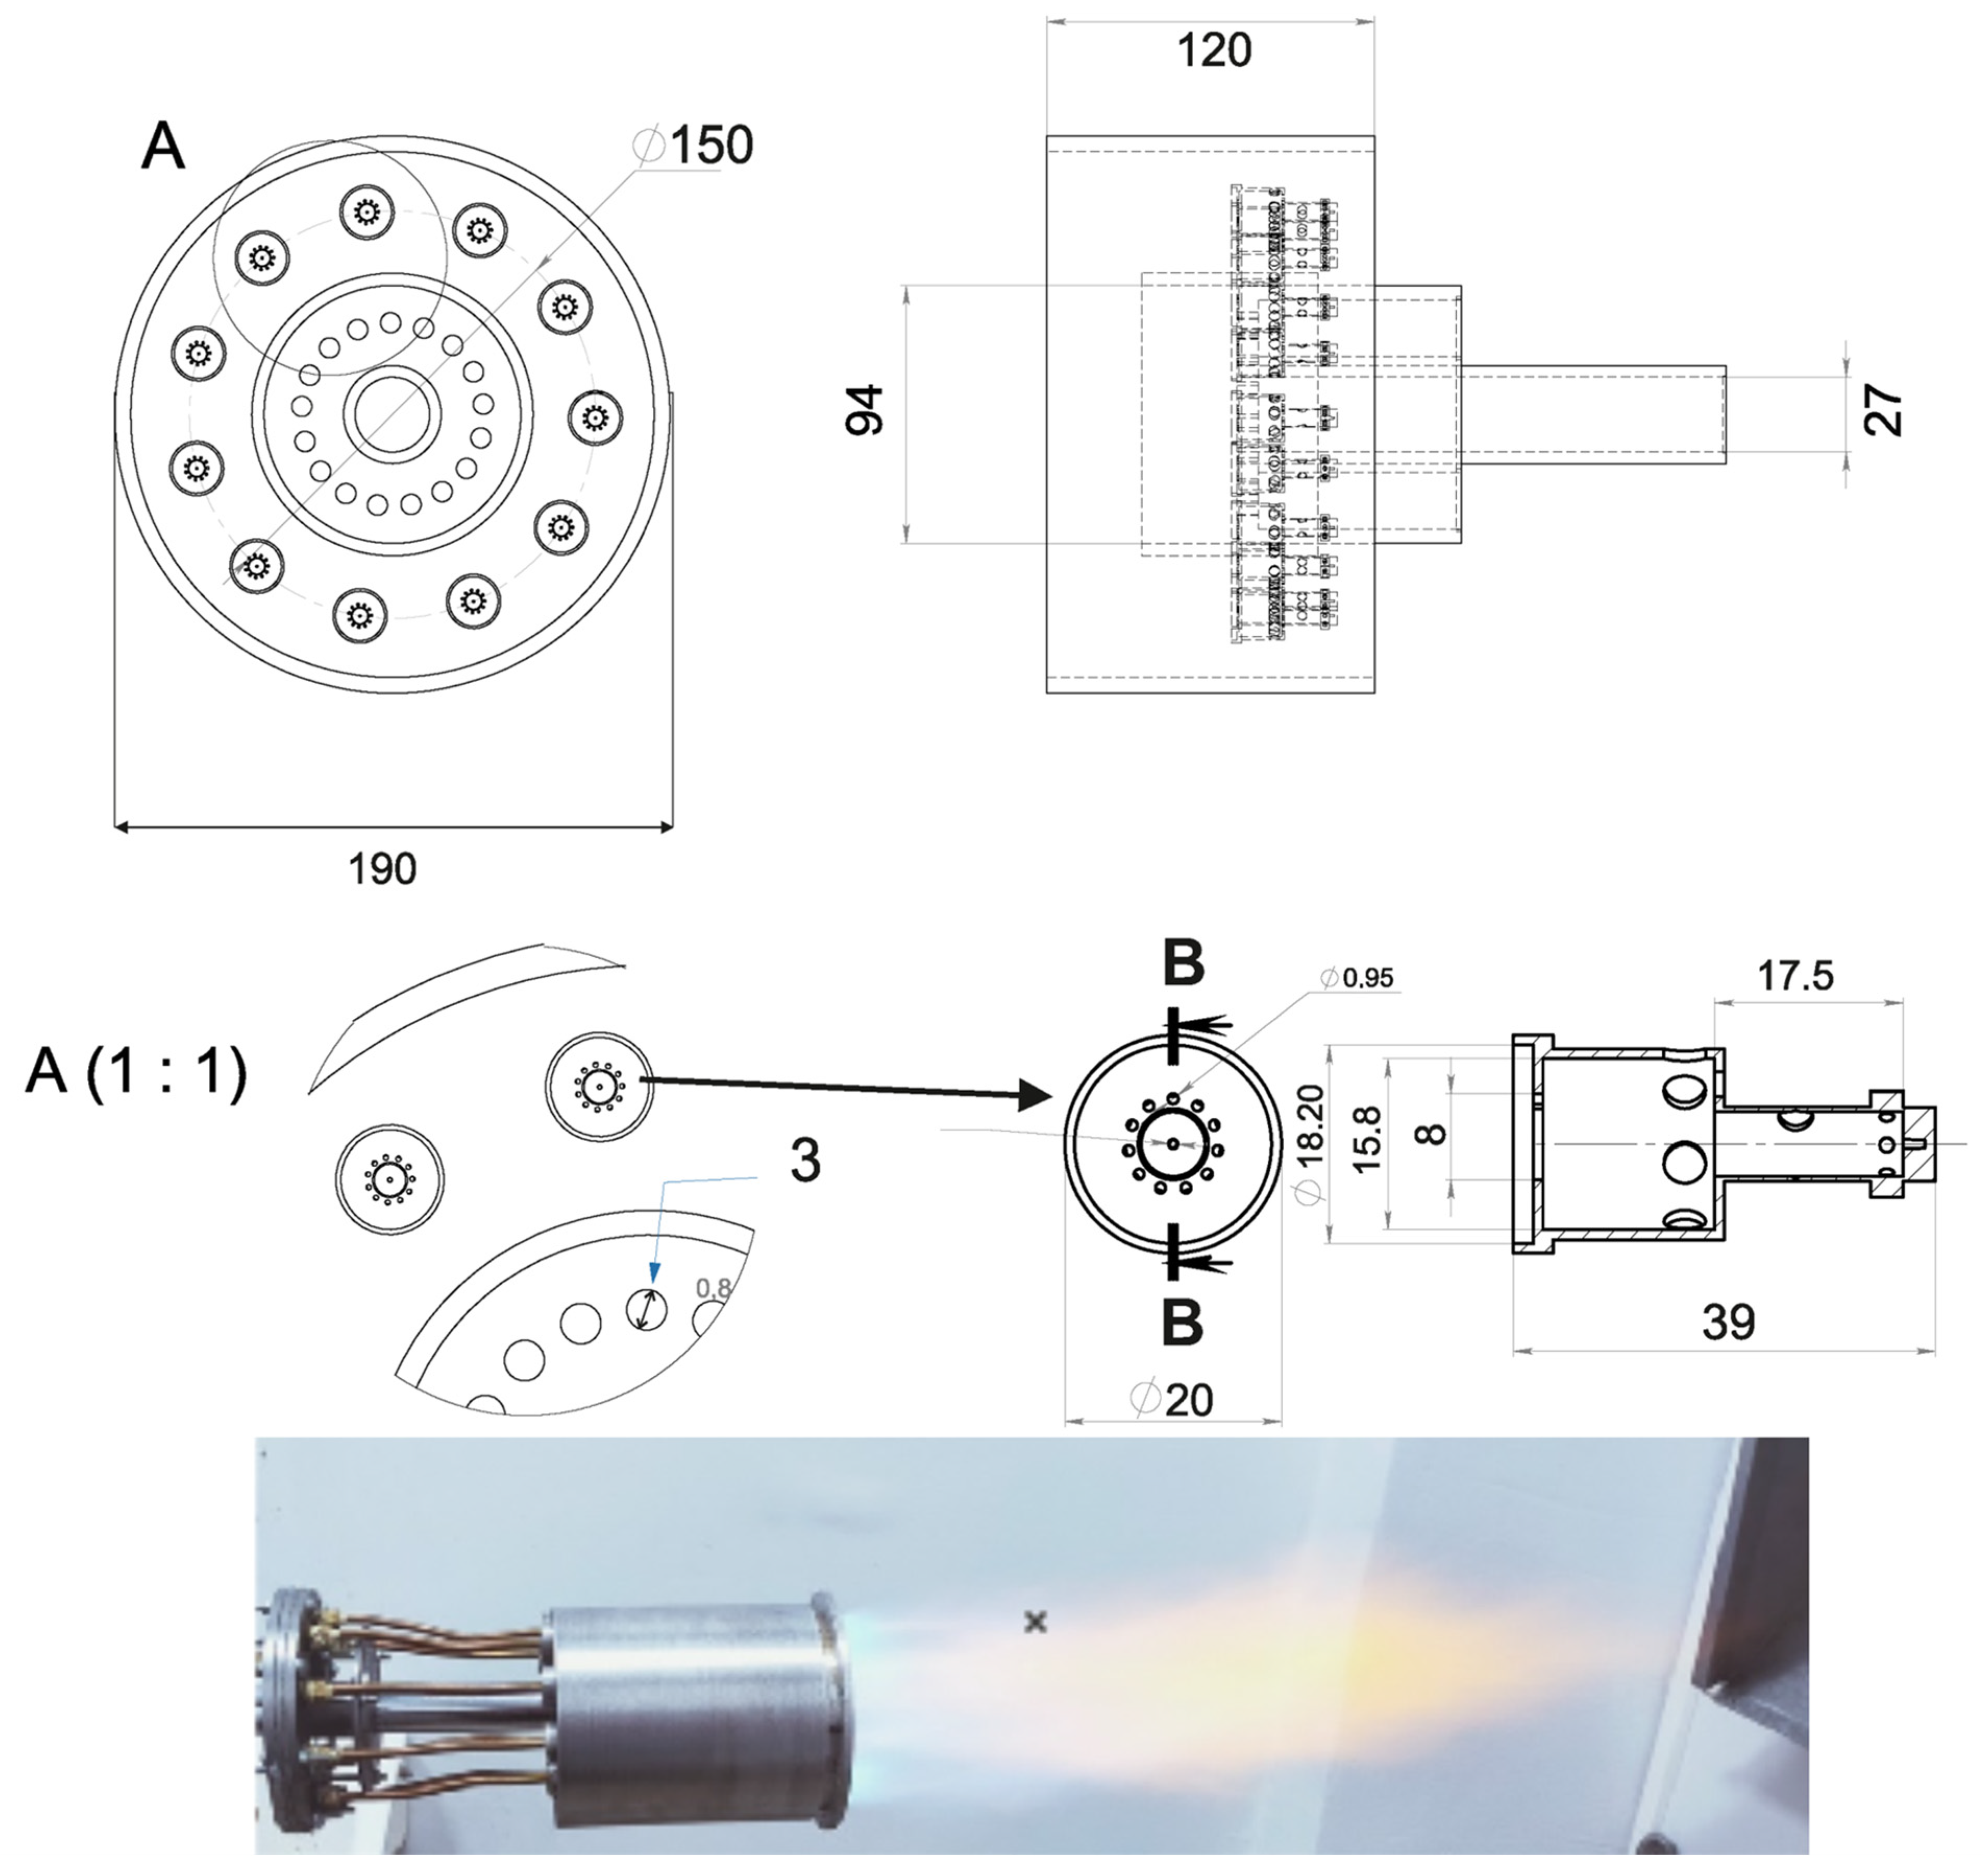
Figure 4.
Operation of the gas-thermal installation.
Figure 4.
Operation of the gas-thermal installation.
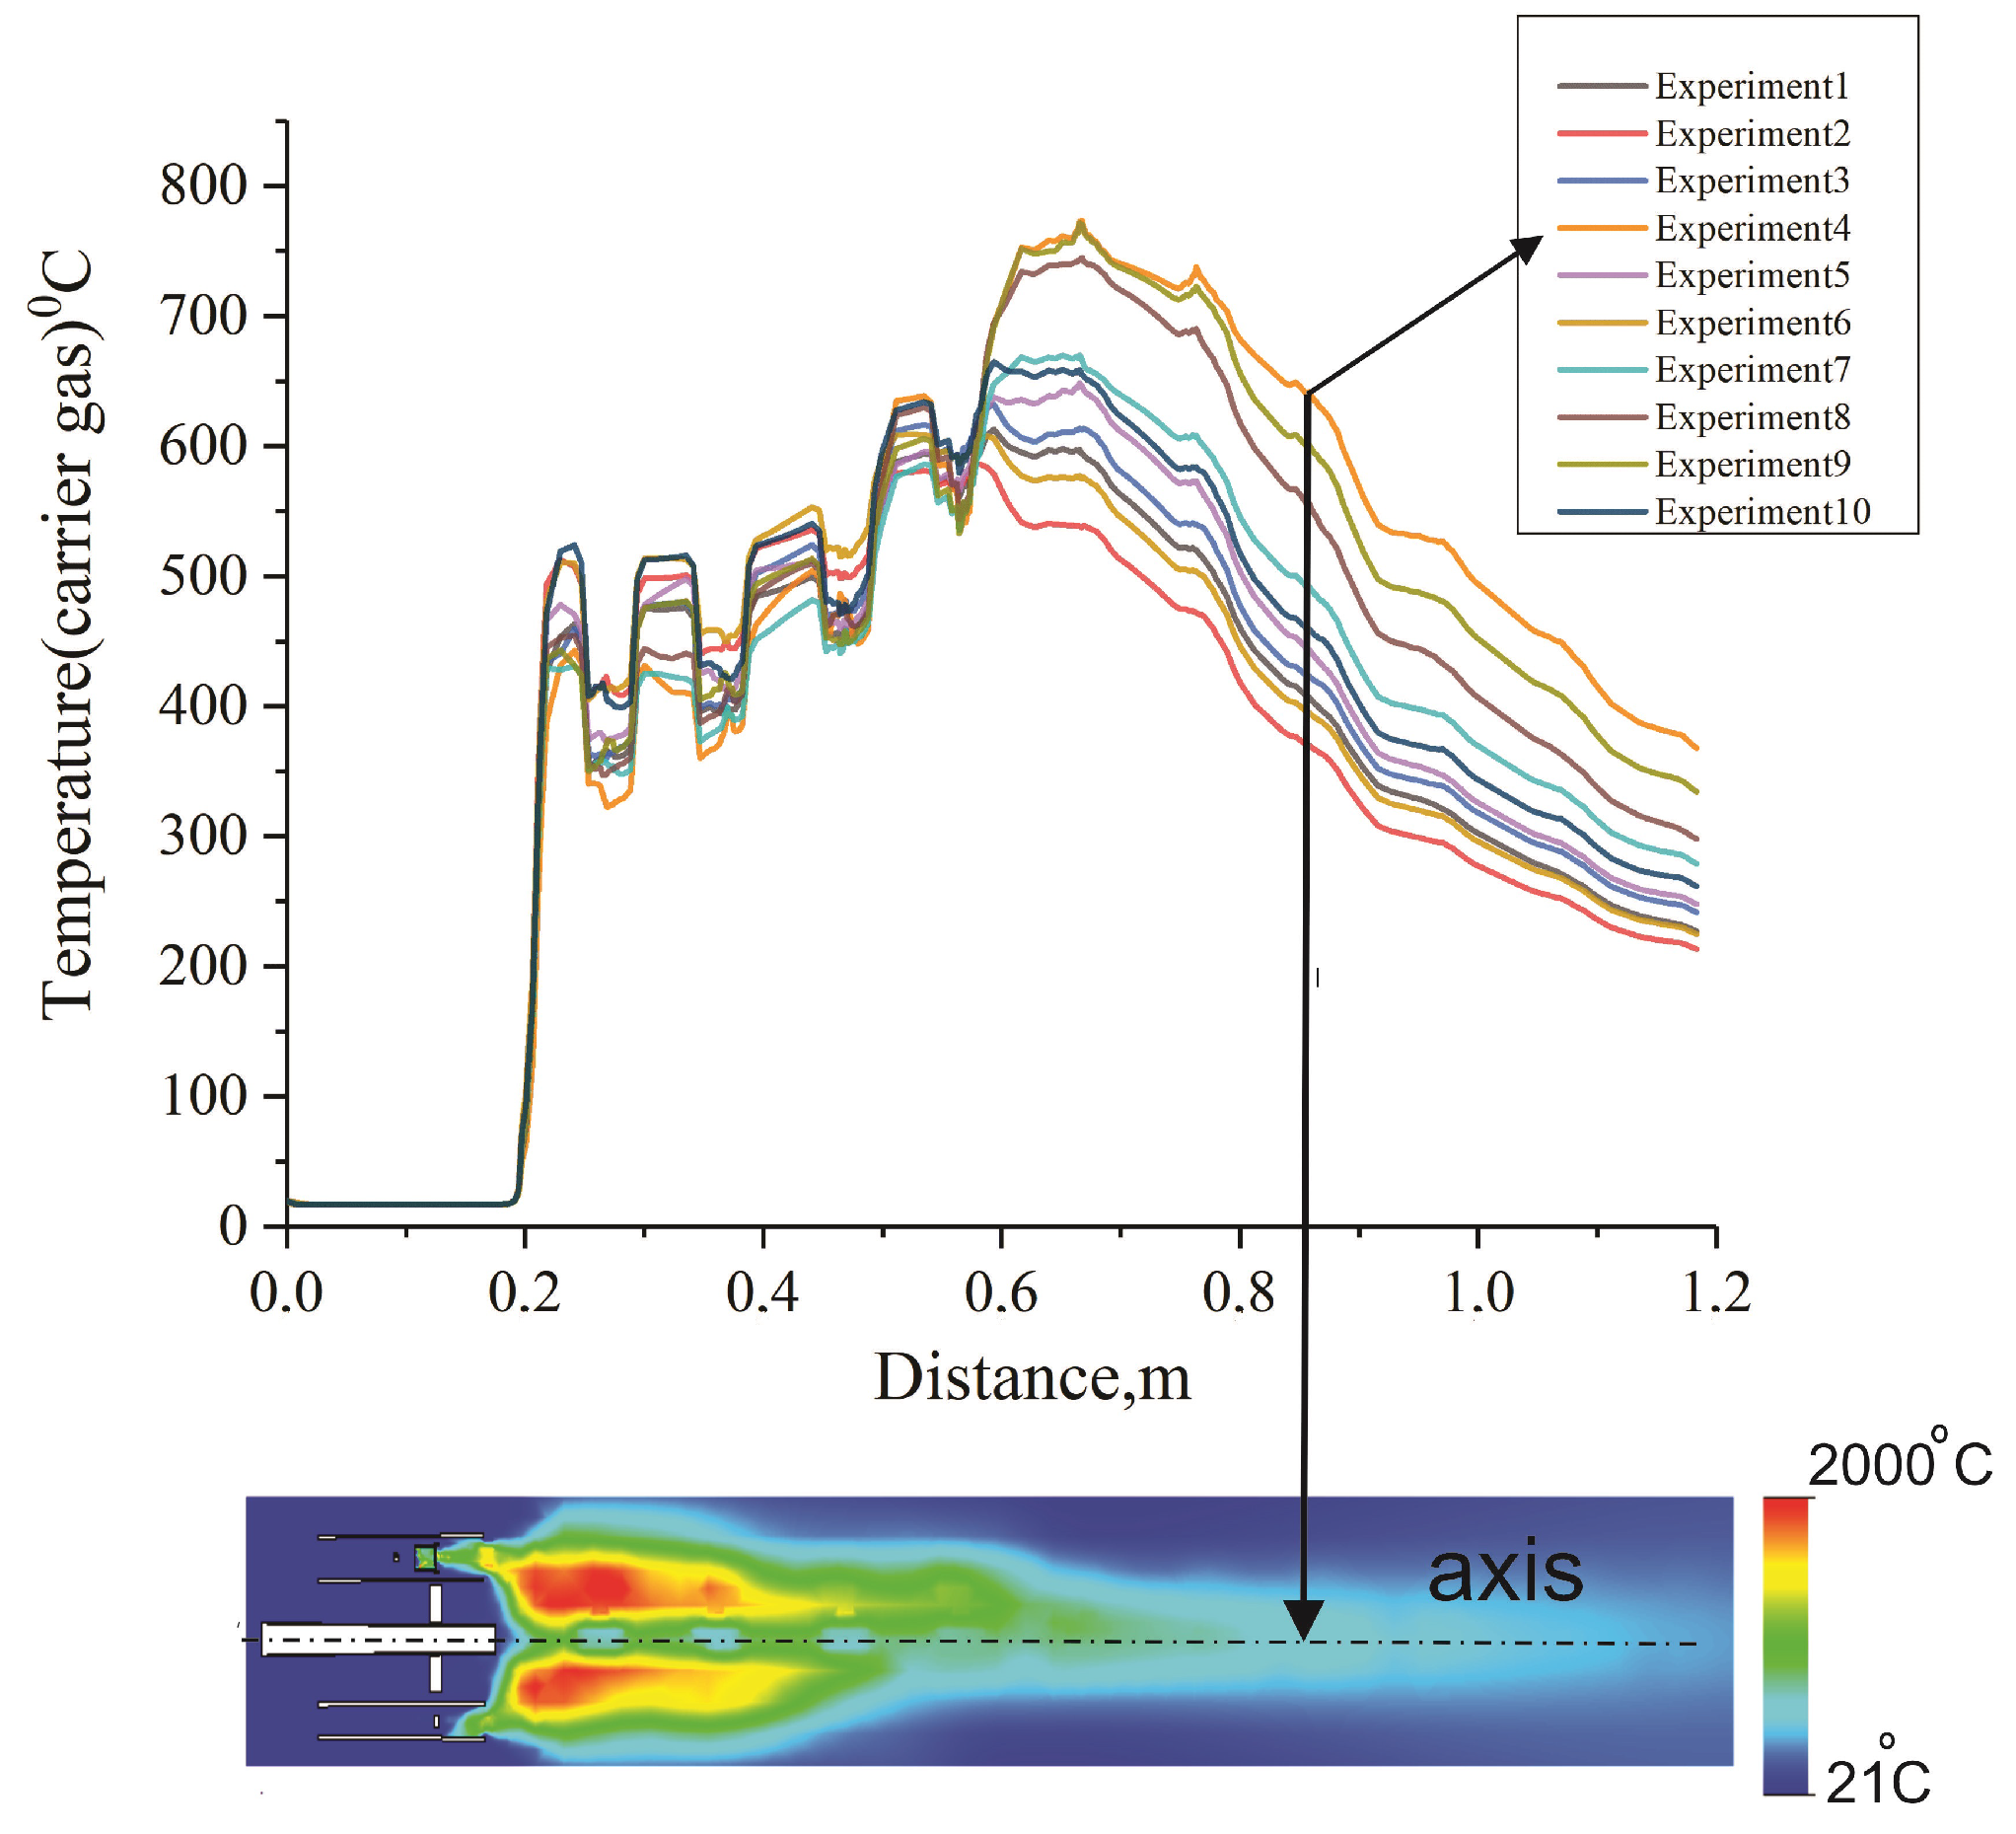
Figure 5.
Influences of variable technological parameters on the flame’s temperature along the central axis of the flame.
Figure 5.
Influences of variable technological parameters on the flame’s temperature along the central axis of the flame.
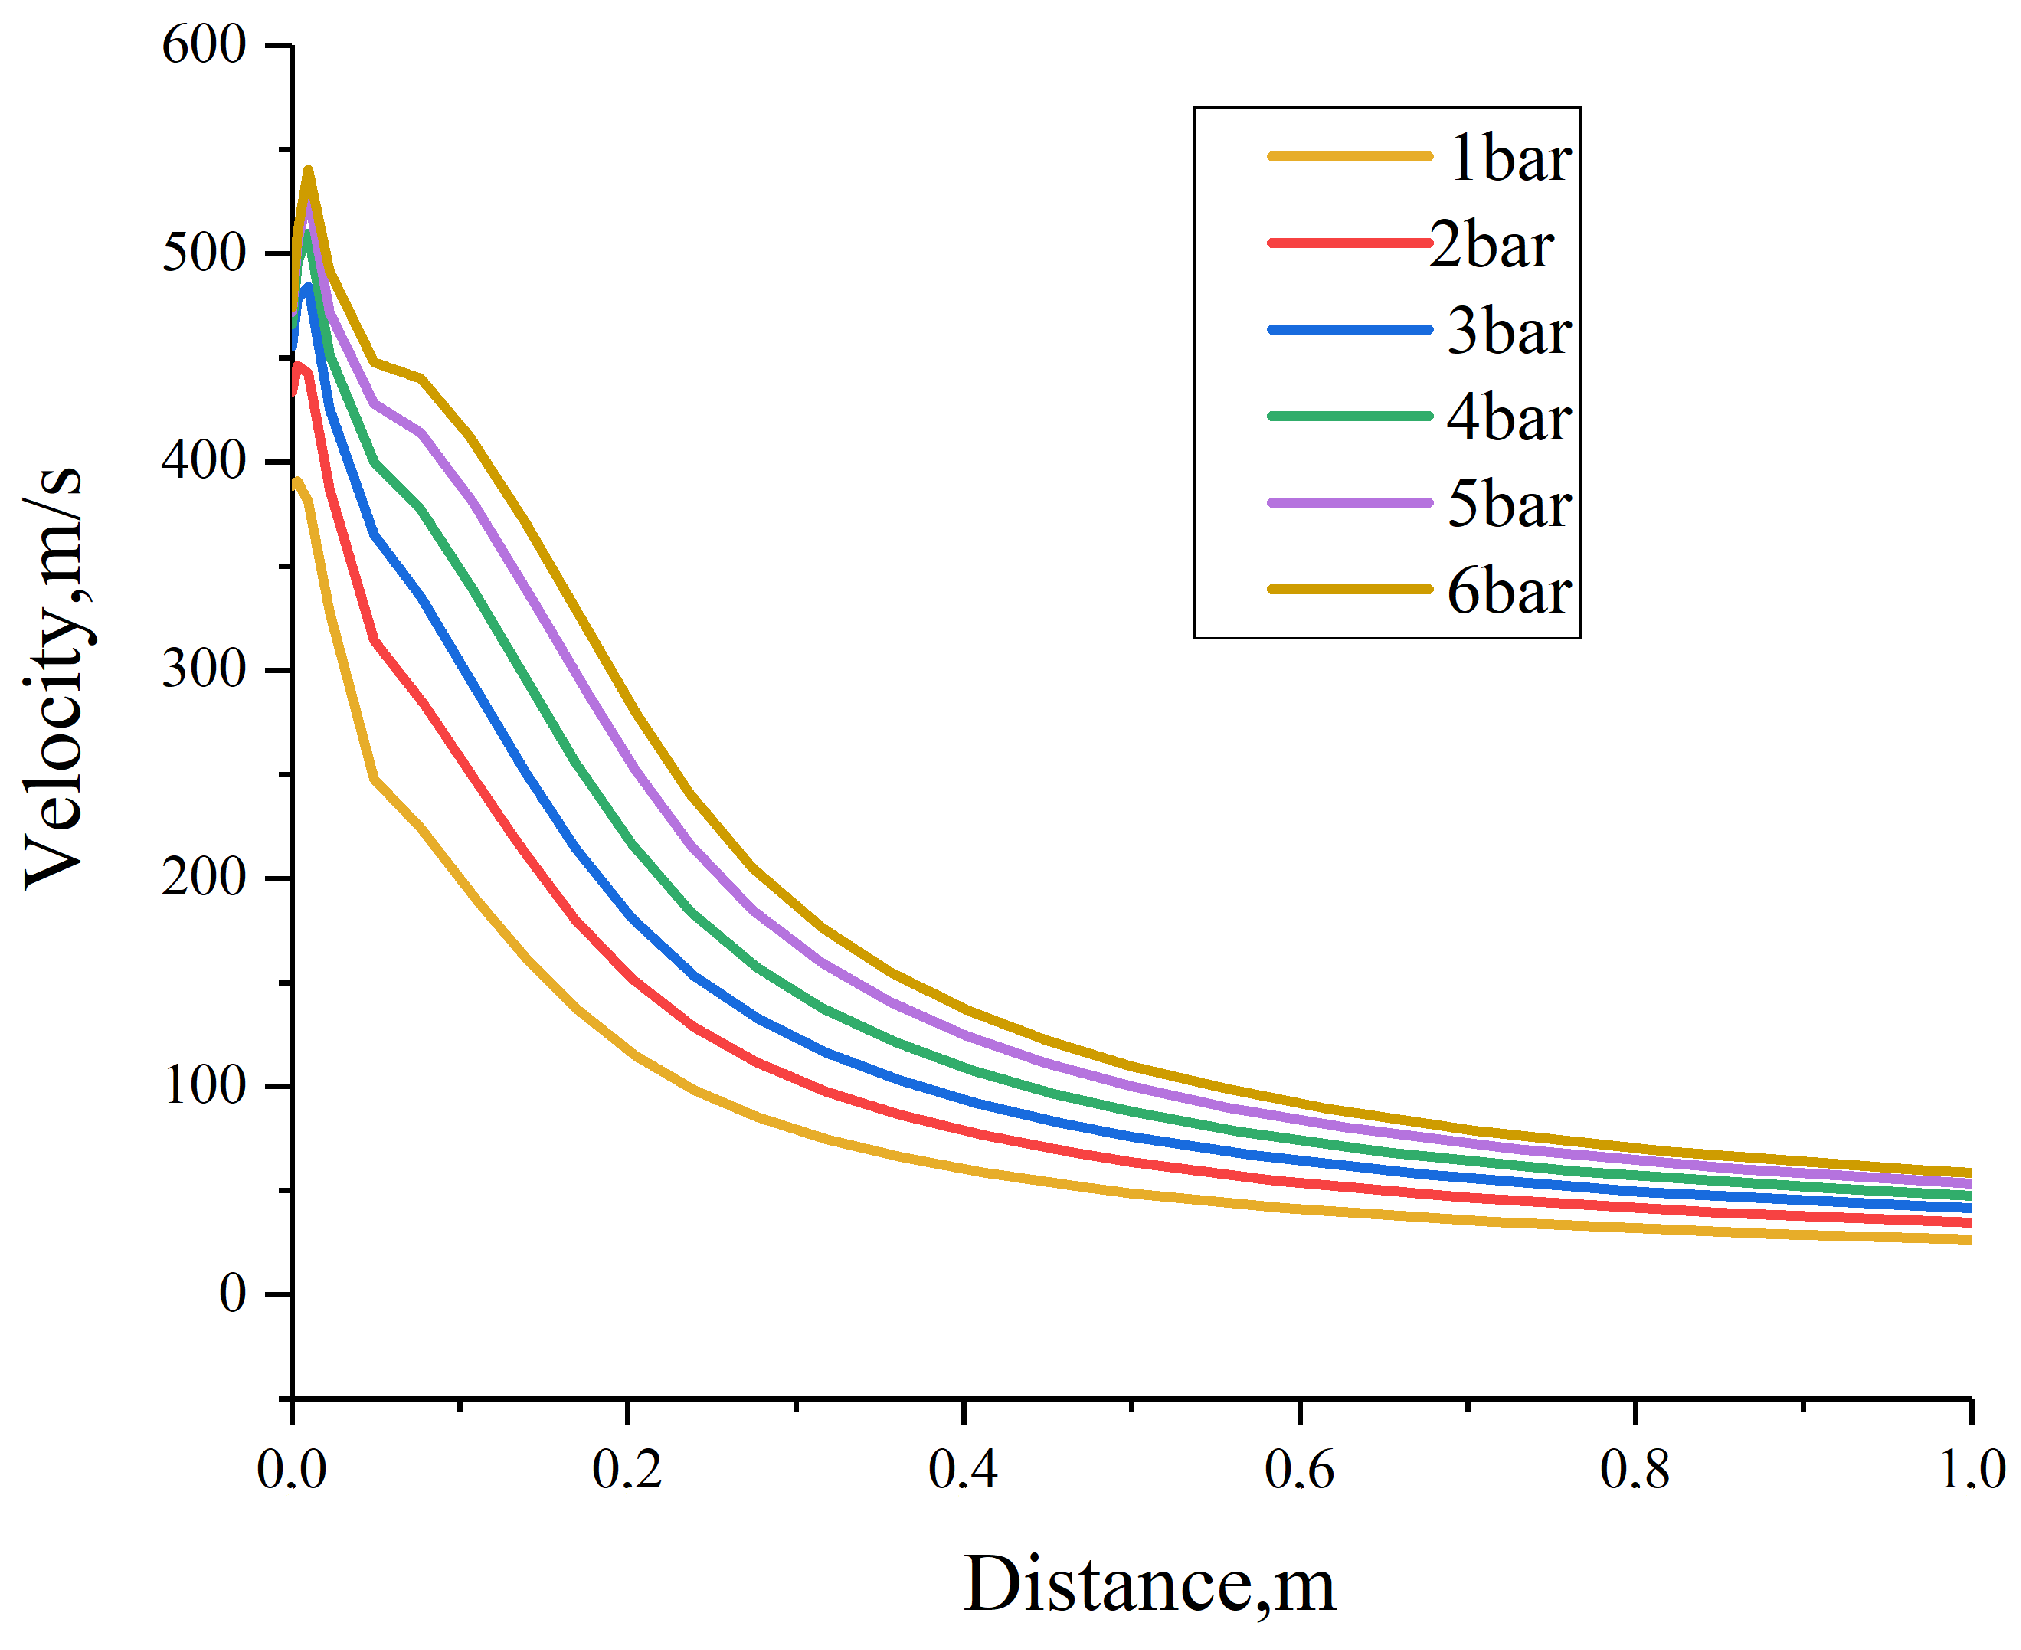
Figure 6.
Change in the flow rate of the carrier gas along the central axis of the flame at pressures of 1–6 bar.
Figure 6.
Change in the flow rate of the carrier gas along the central axis of the flame at pressures of 1–6 bar.
Figure 7.
Change in the velocity of UHMWPE particles along the flame’s central axis at a pressure of 1 bar.
Figure 7.
Change in the velocity of UHMWPE particles along the flame’s central axis at a pressure of 1 bar.
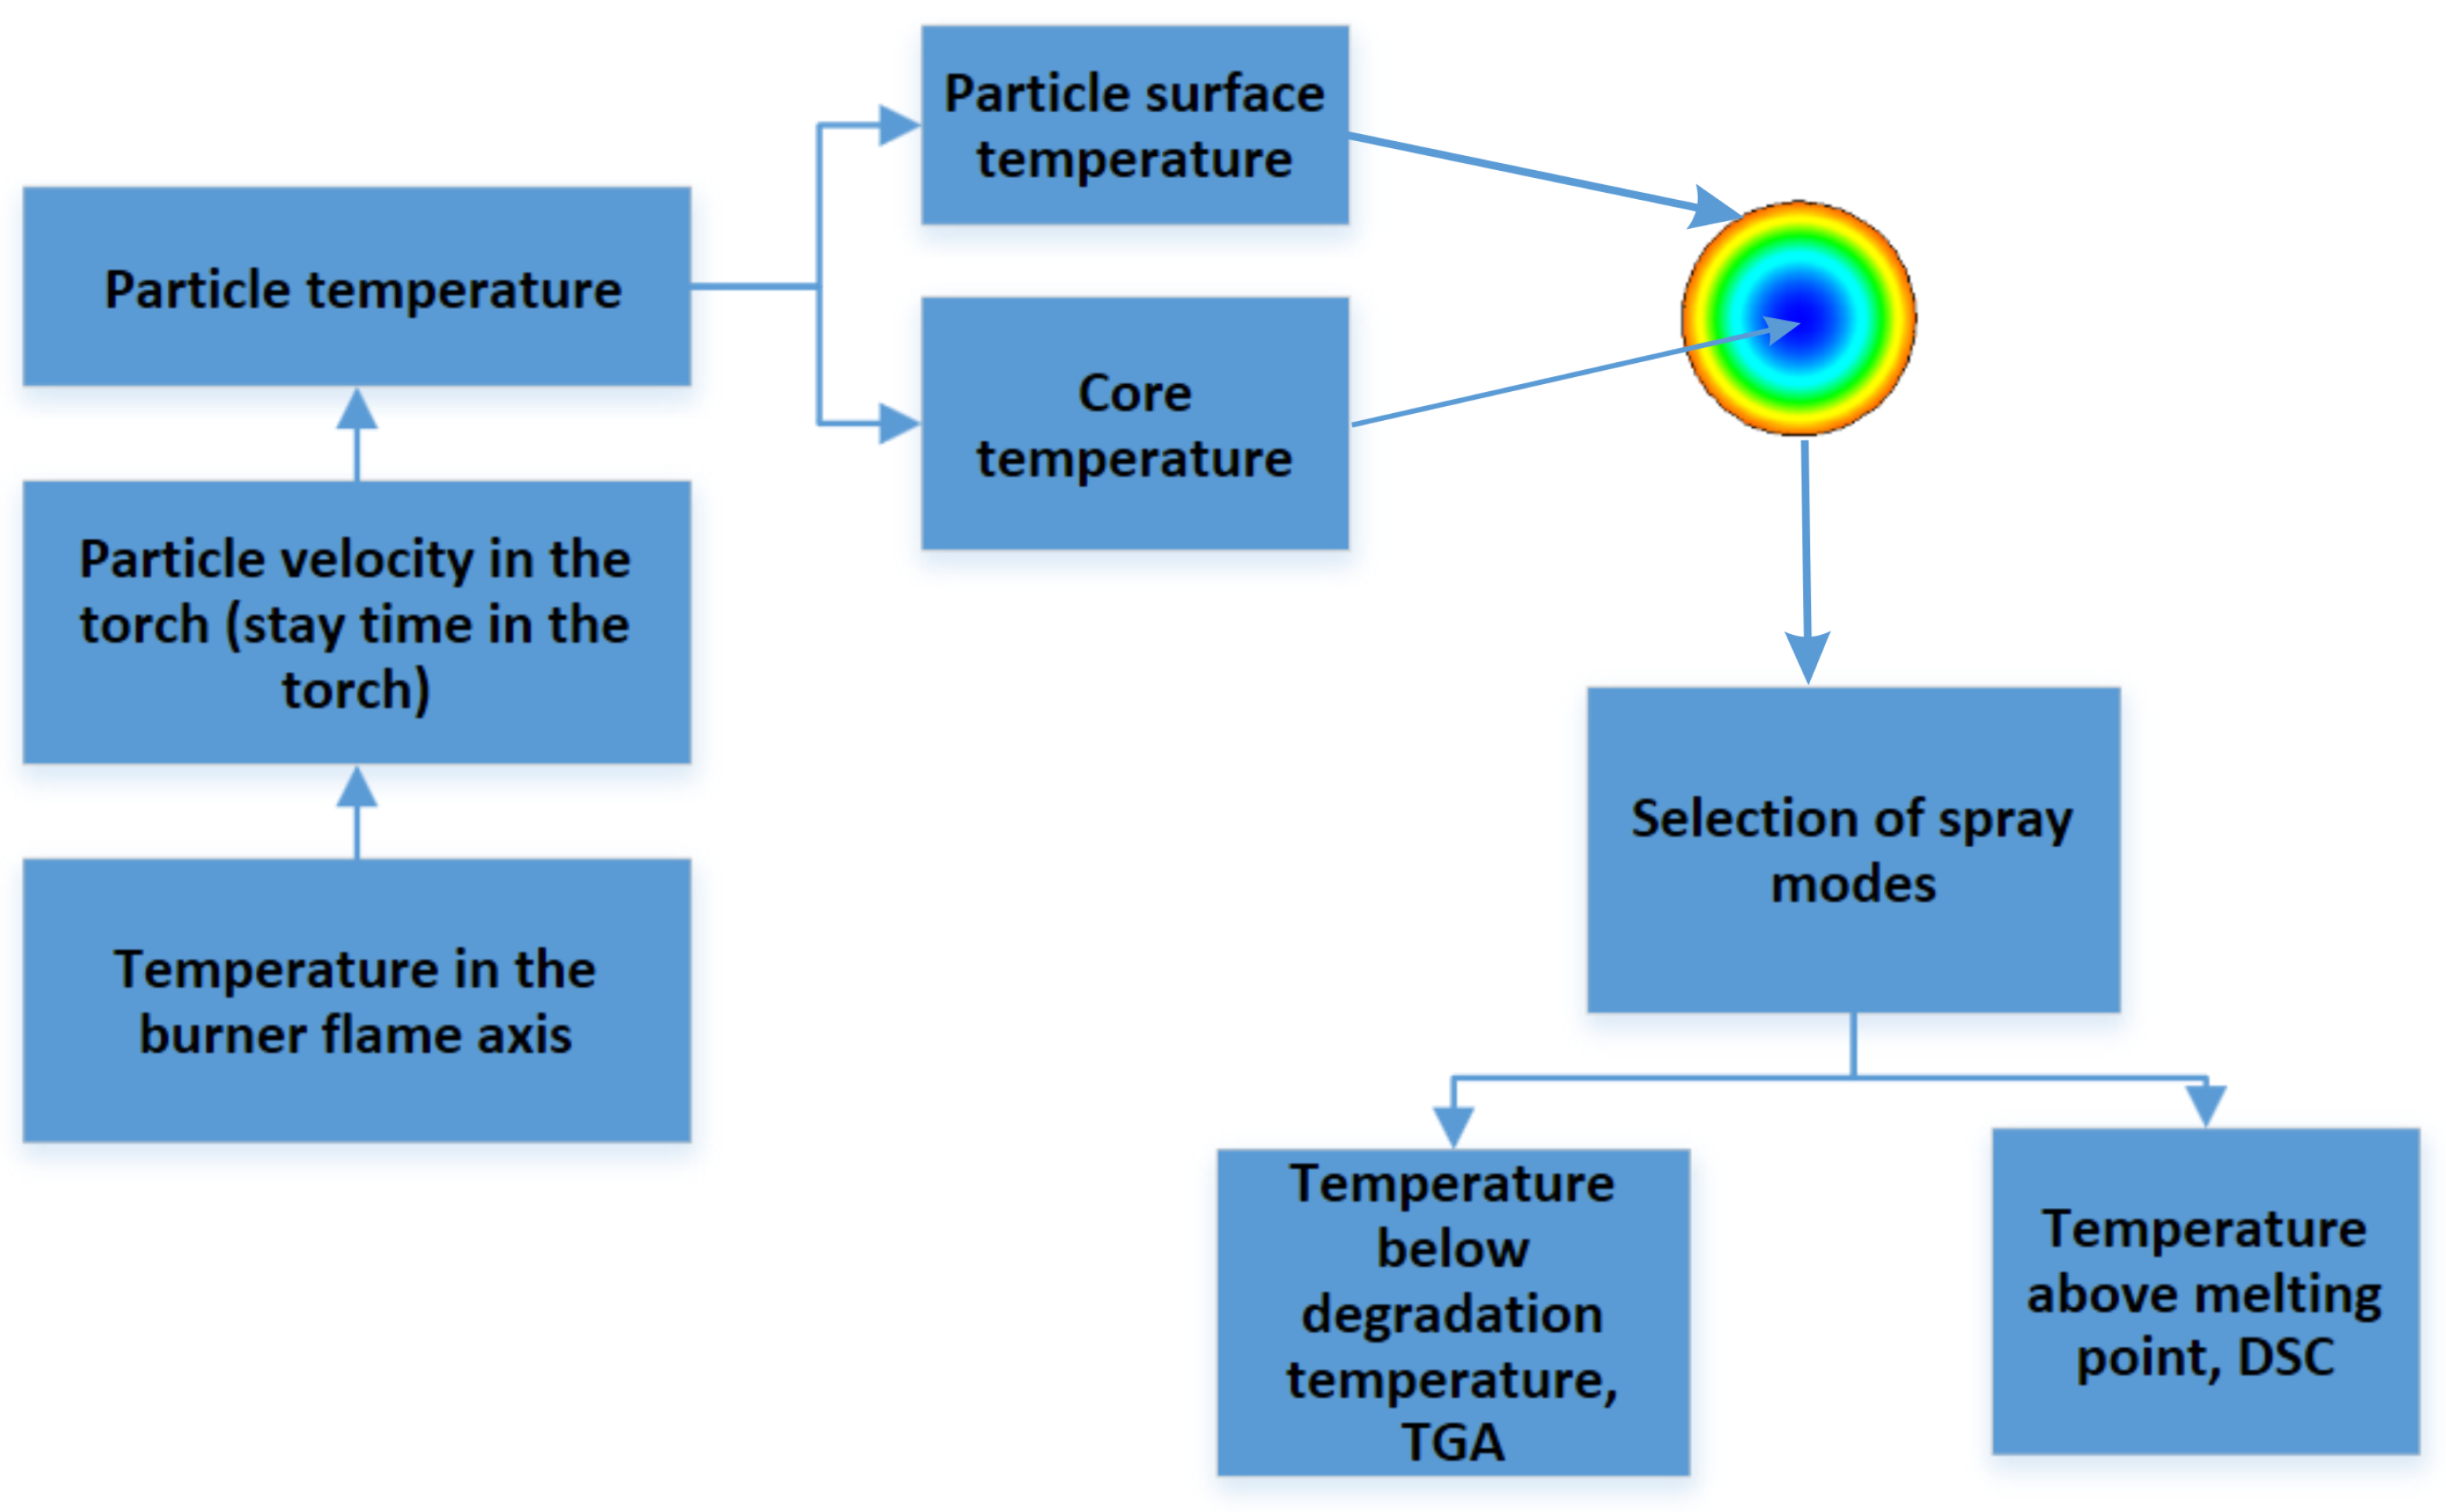
Figure 8.
Spray mode selection scheme.
Figure 8.
Spray mode selection scheme.
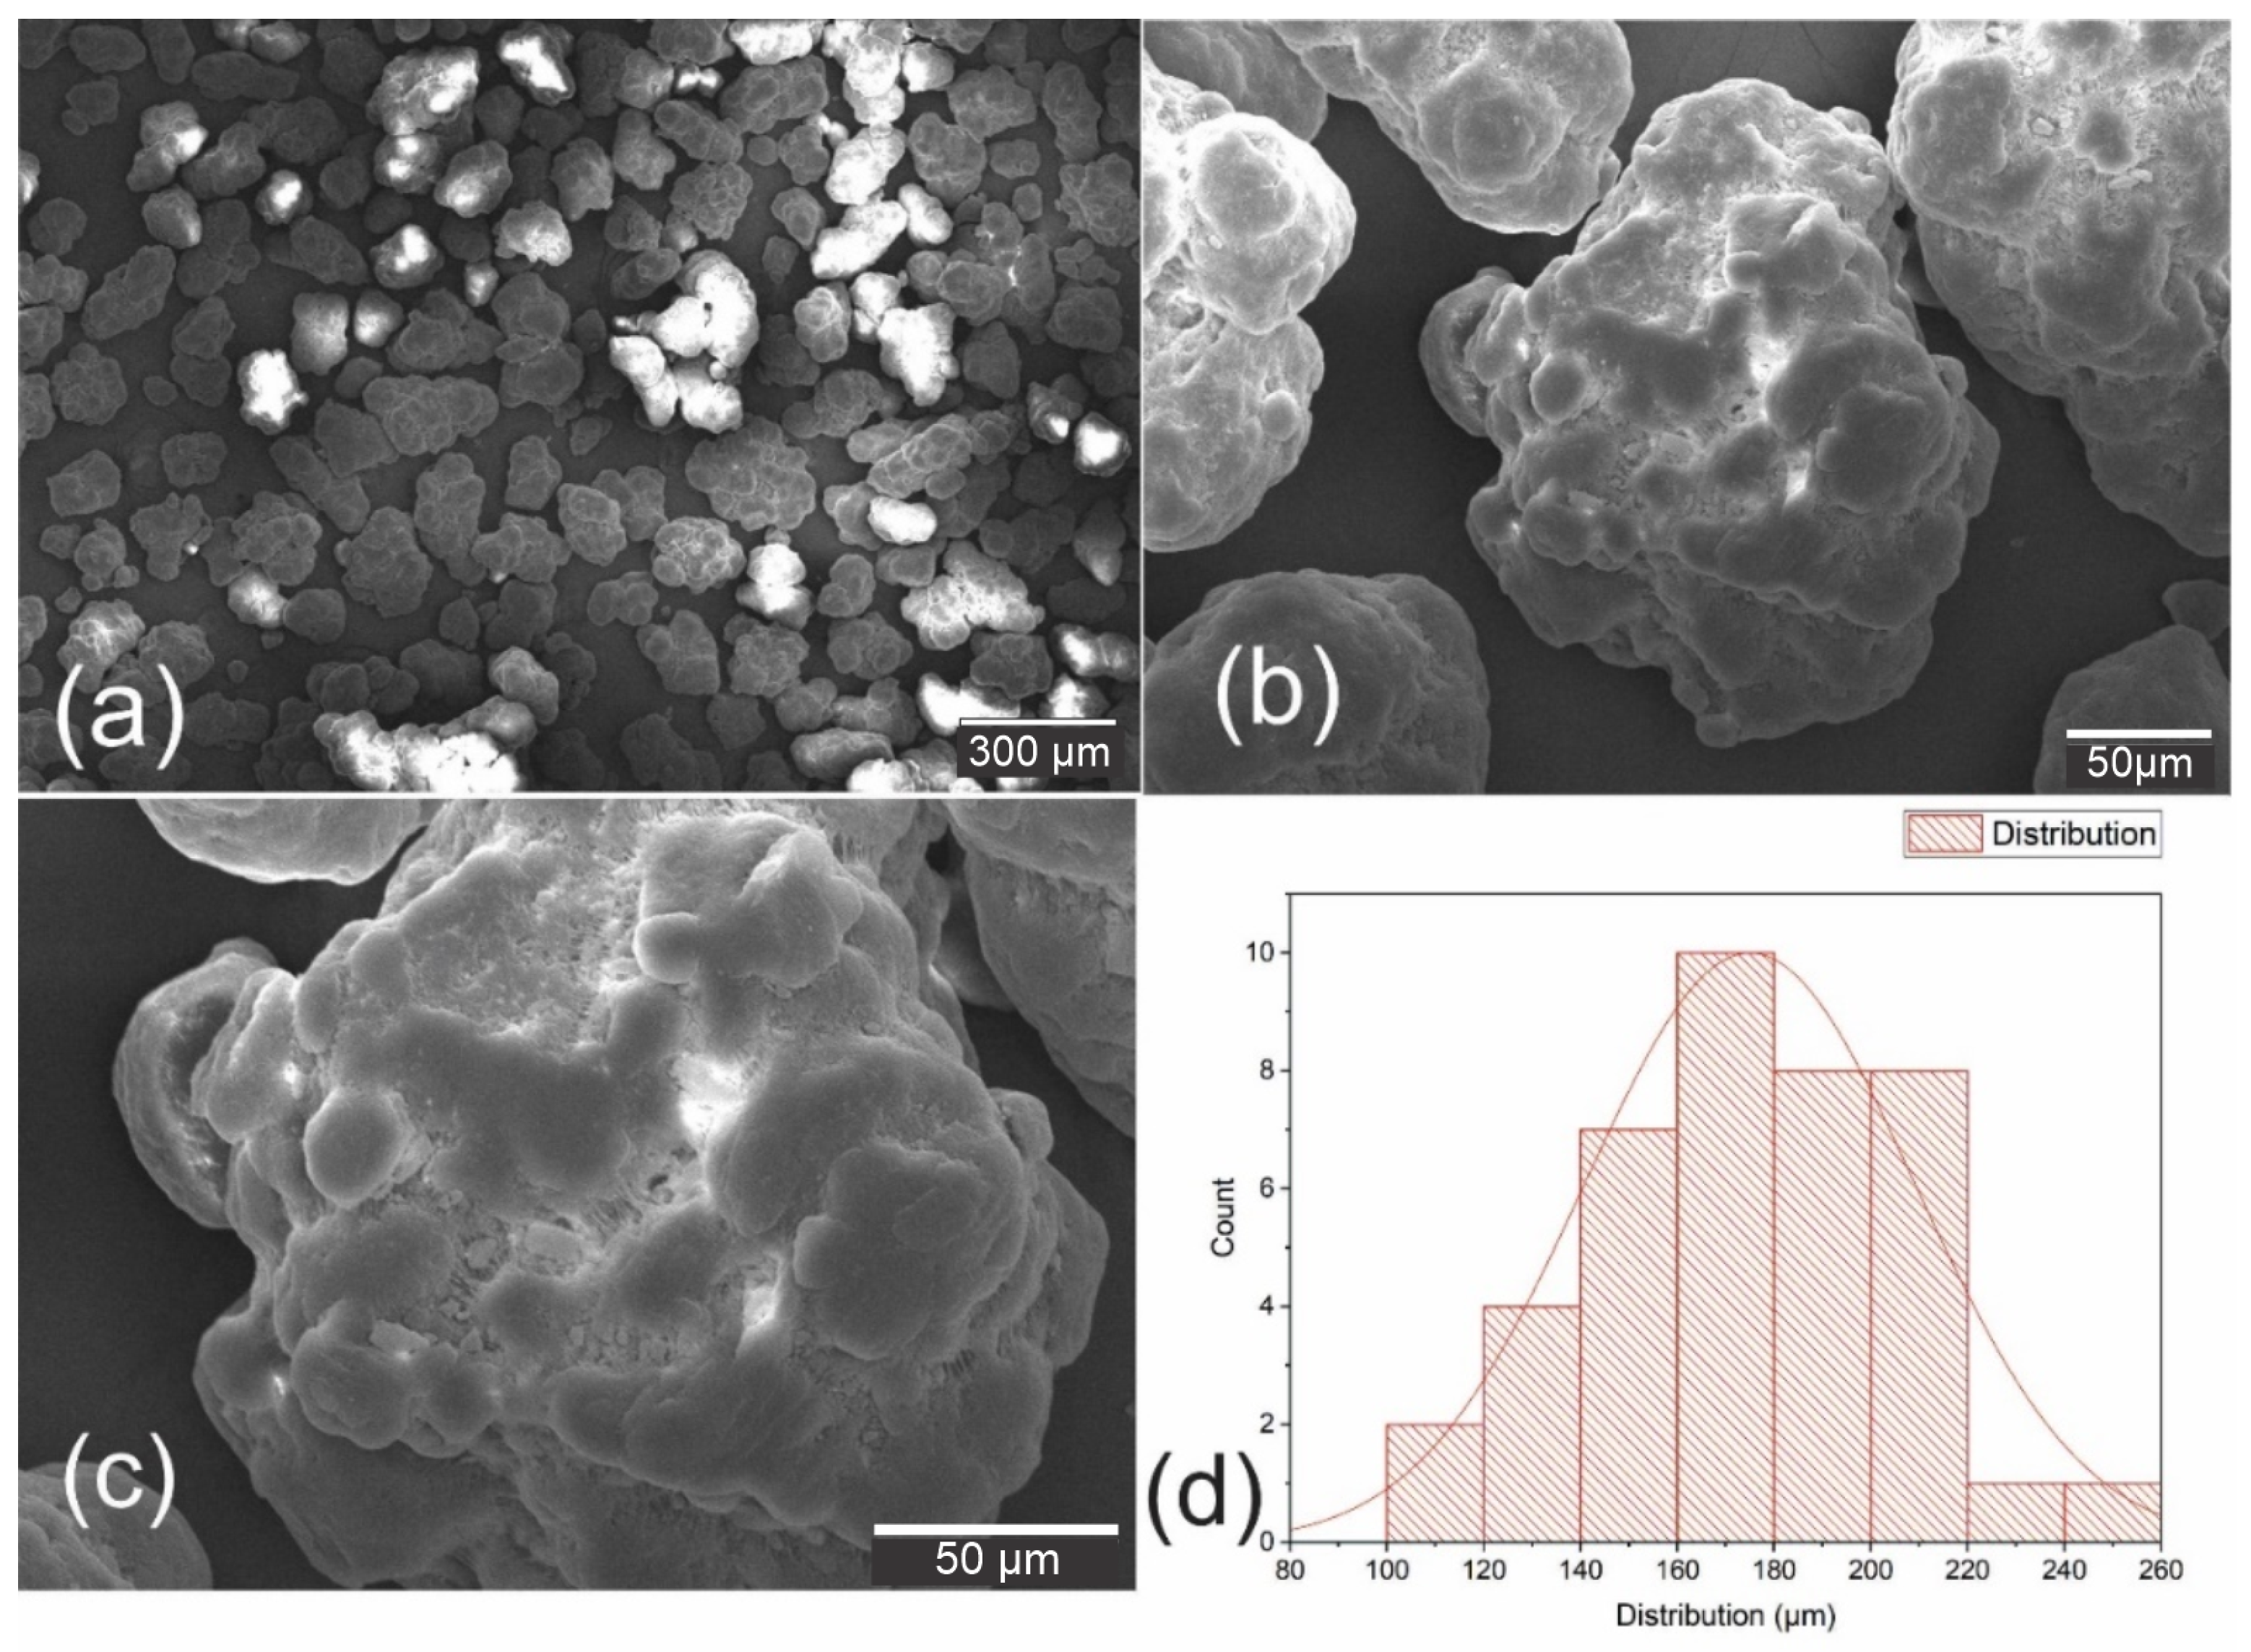
Figure 9.
(a) UHMWPE powder—50× magnification. (b) UHMWPE powder—300× magnification. (c) UHMWPE powder—600× magnification. (d) Normal distribution of UHMWPE particles.
Figure 9.
(a) UHMWPE powder—50× magnification. (b) UHMWPE powder—300× magnification. (c) UHMWPE powder—600× magnification. (d) Normal distribution of UHMWPE particles.
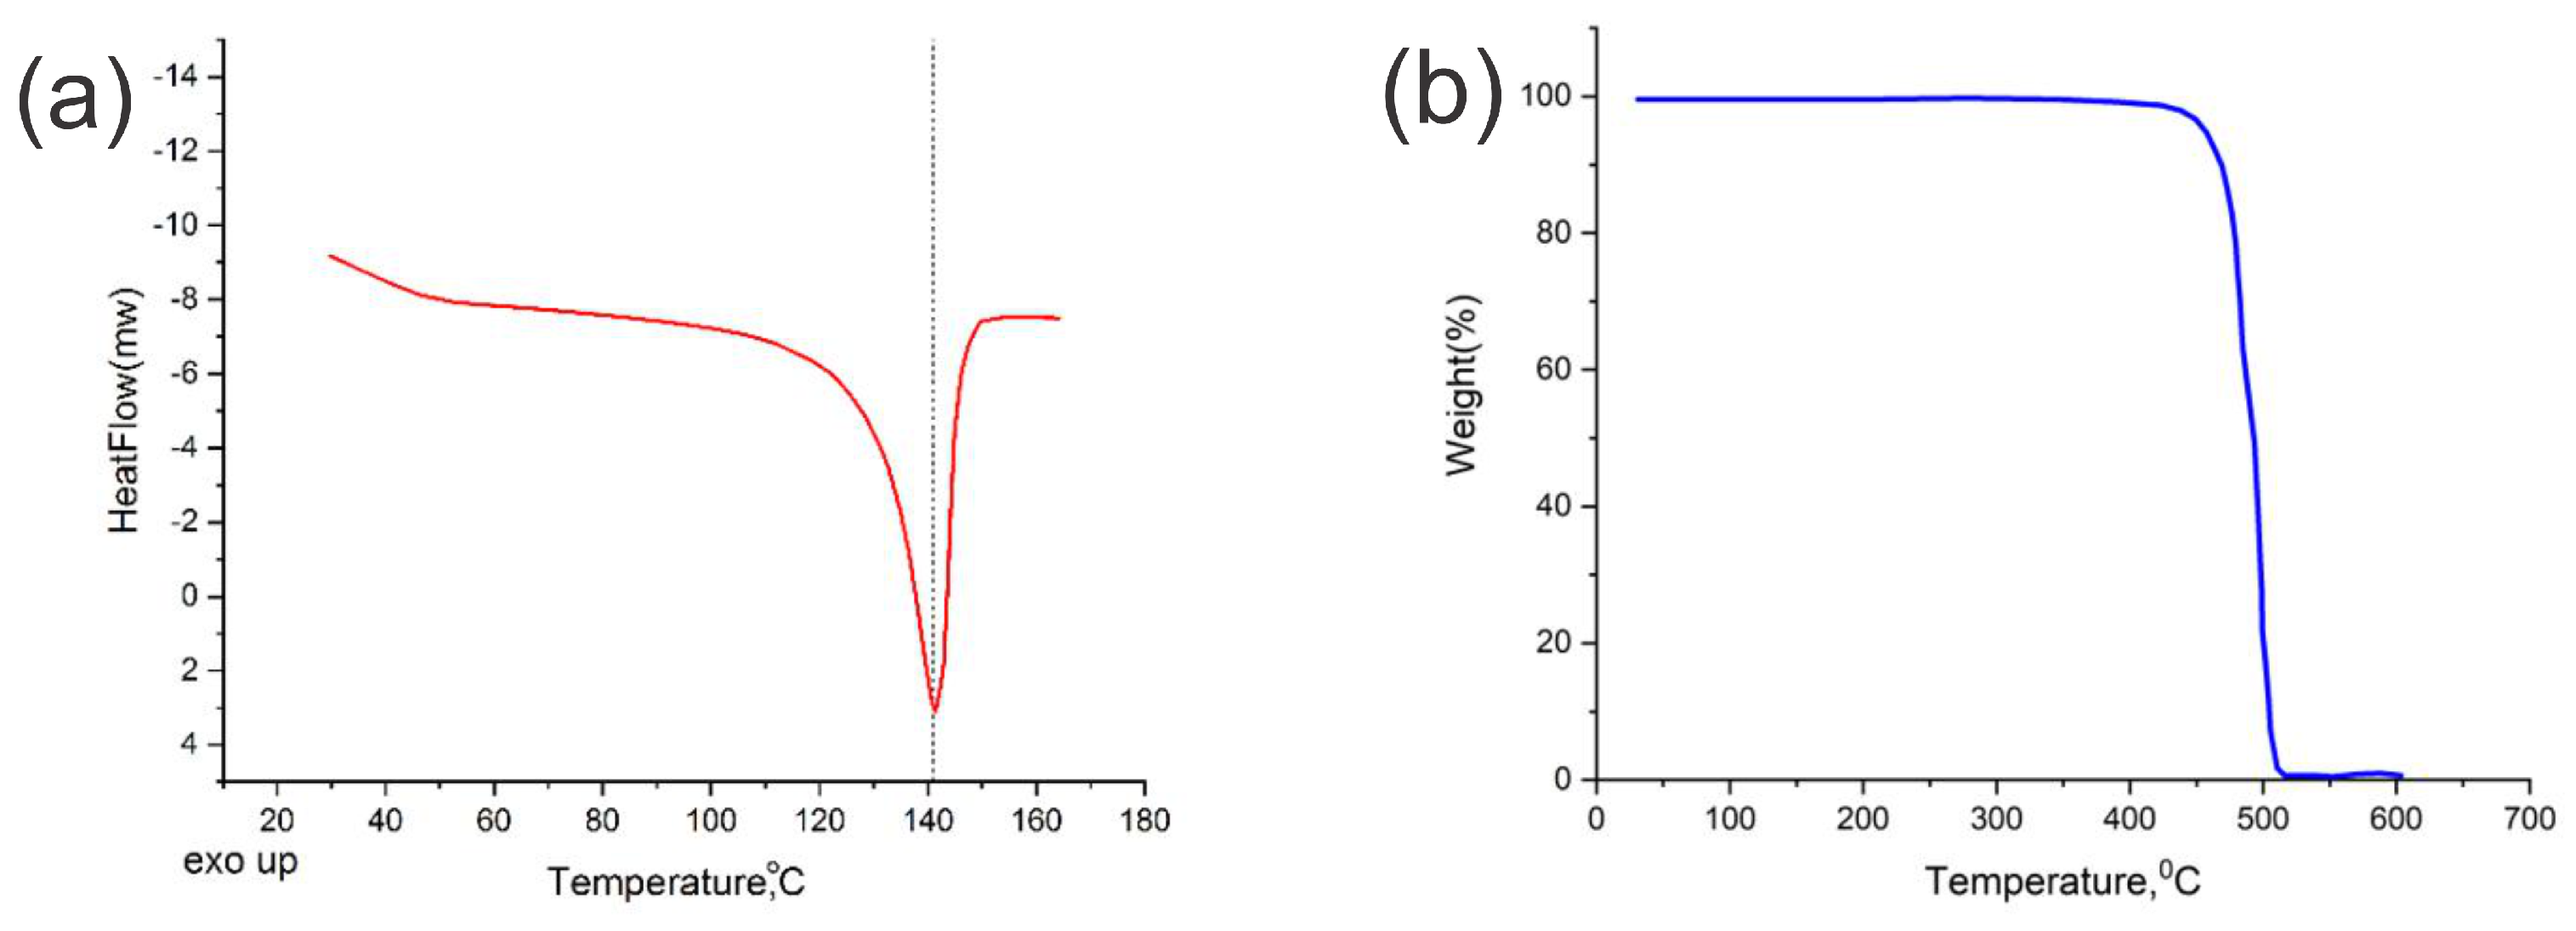
Figure 10.
(a) Differential scanning calorimetry of UHMWPE powder. (b) Thermogravimetric analysis of UHMWPE.
Figure 10.
(a) Differential scanning calorimetry of UHMWPE powder. (b) Thermogravimetric analysis of UHMWPE.
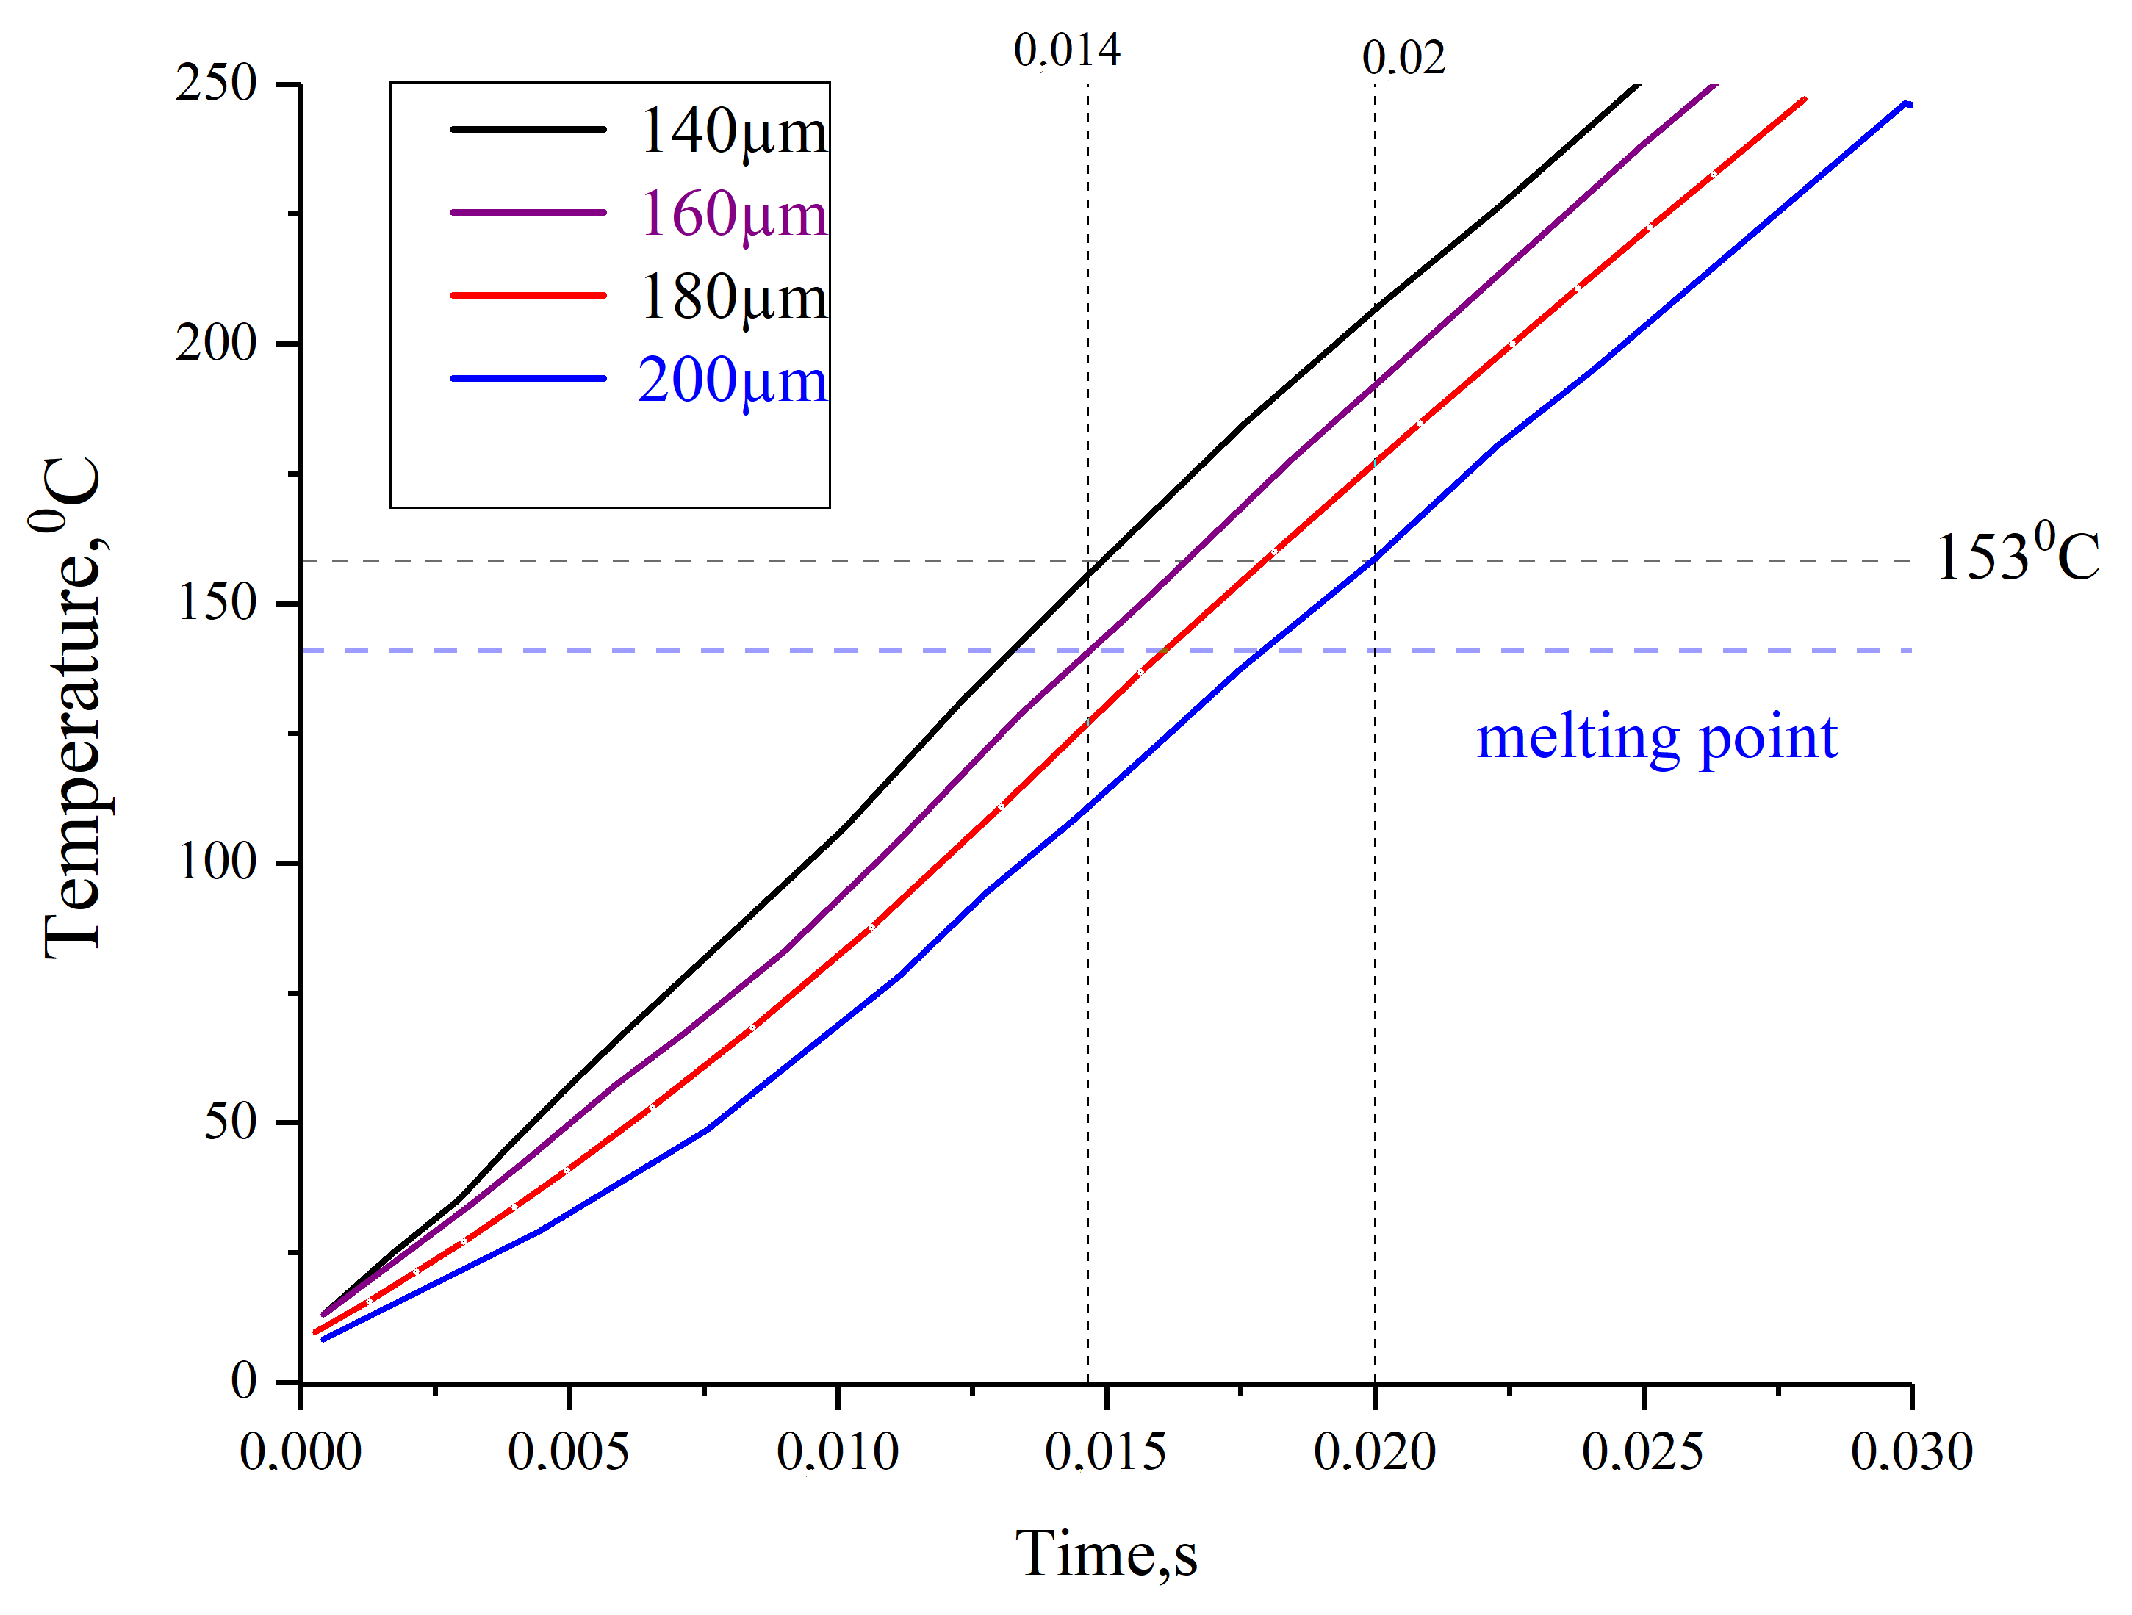
Figure 11.
(a) Influence of the time factor on the heating of a UHMWPE particle at a constant temperature. (b) Influence of the temperature factor on particle heating at a constant heating time of 0.006 s.
Figure 11.
(a) Influence of the time factor on the heating of a UHMWPE particle at a constant temperature. (b) Influence of the temperature factor on particle heating at a constant heating time of 0.006 s.
Figure 12.
The transported gas’s temperature, the particle’s velocity in the gas flow, and the particle’s surface temperature. Summary chart.
Figure 12.
The transported gas’s temperature, the particle’s velocity in the gas flow, and the particle’s surface temperature. Summary chart.
Figure 13.
Dependence of the temperature of the core of the UHMWPE particle during the time of exposure to the heat flux. Experiment 4.
Figure 13.
Dependence of the temperature of the core of the UHMWPE particle during the time of exposure to the heat flux. Experiment 4.
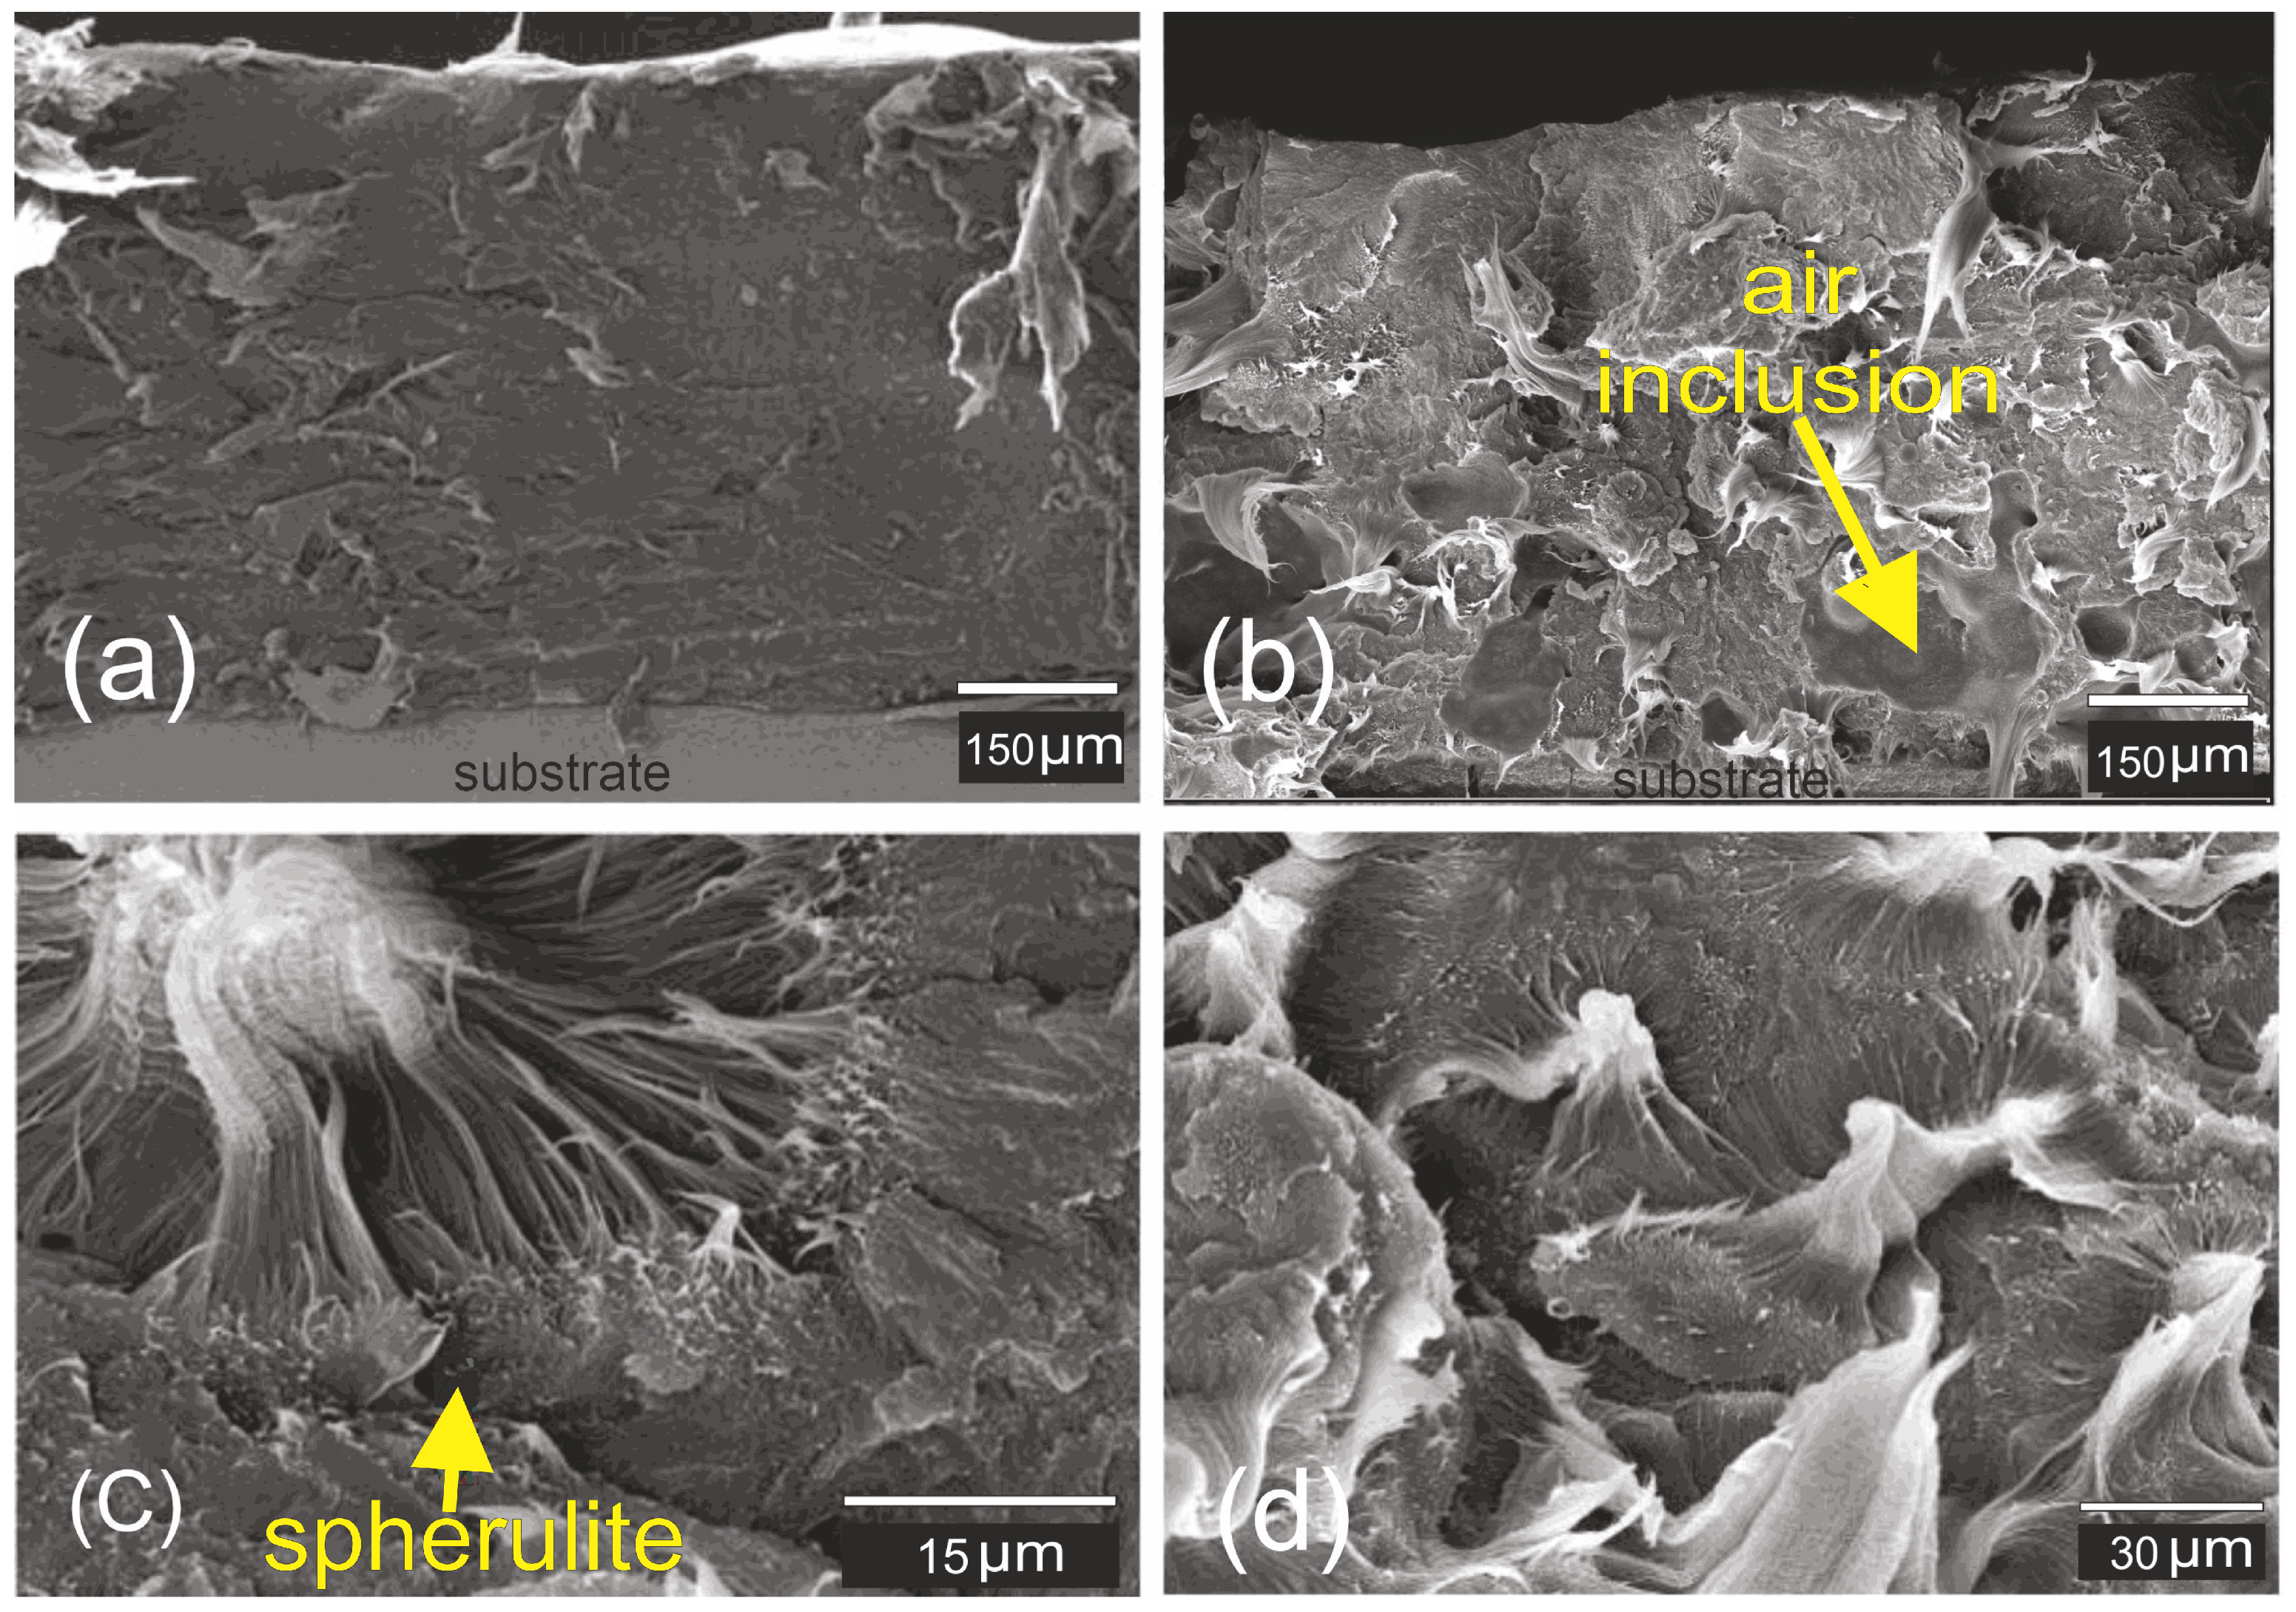
Figure 14.
Macrostructures of coatings. (a,c) Characteristic structure formed according to mode-2. (b,d) Characteristic structure formed according to mode-1.
Figure 14.
Macrostructures of coatings. (a,c) Characteristic structure formed according to mode-2. (b,d) Characteristic structure formed according to mode-1.
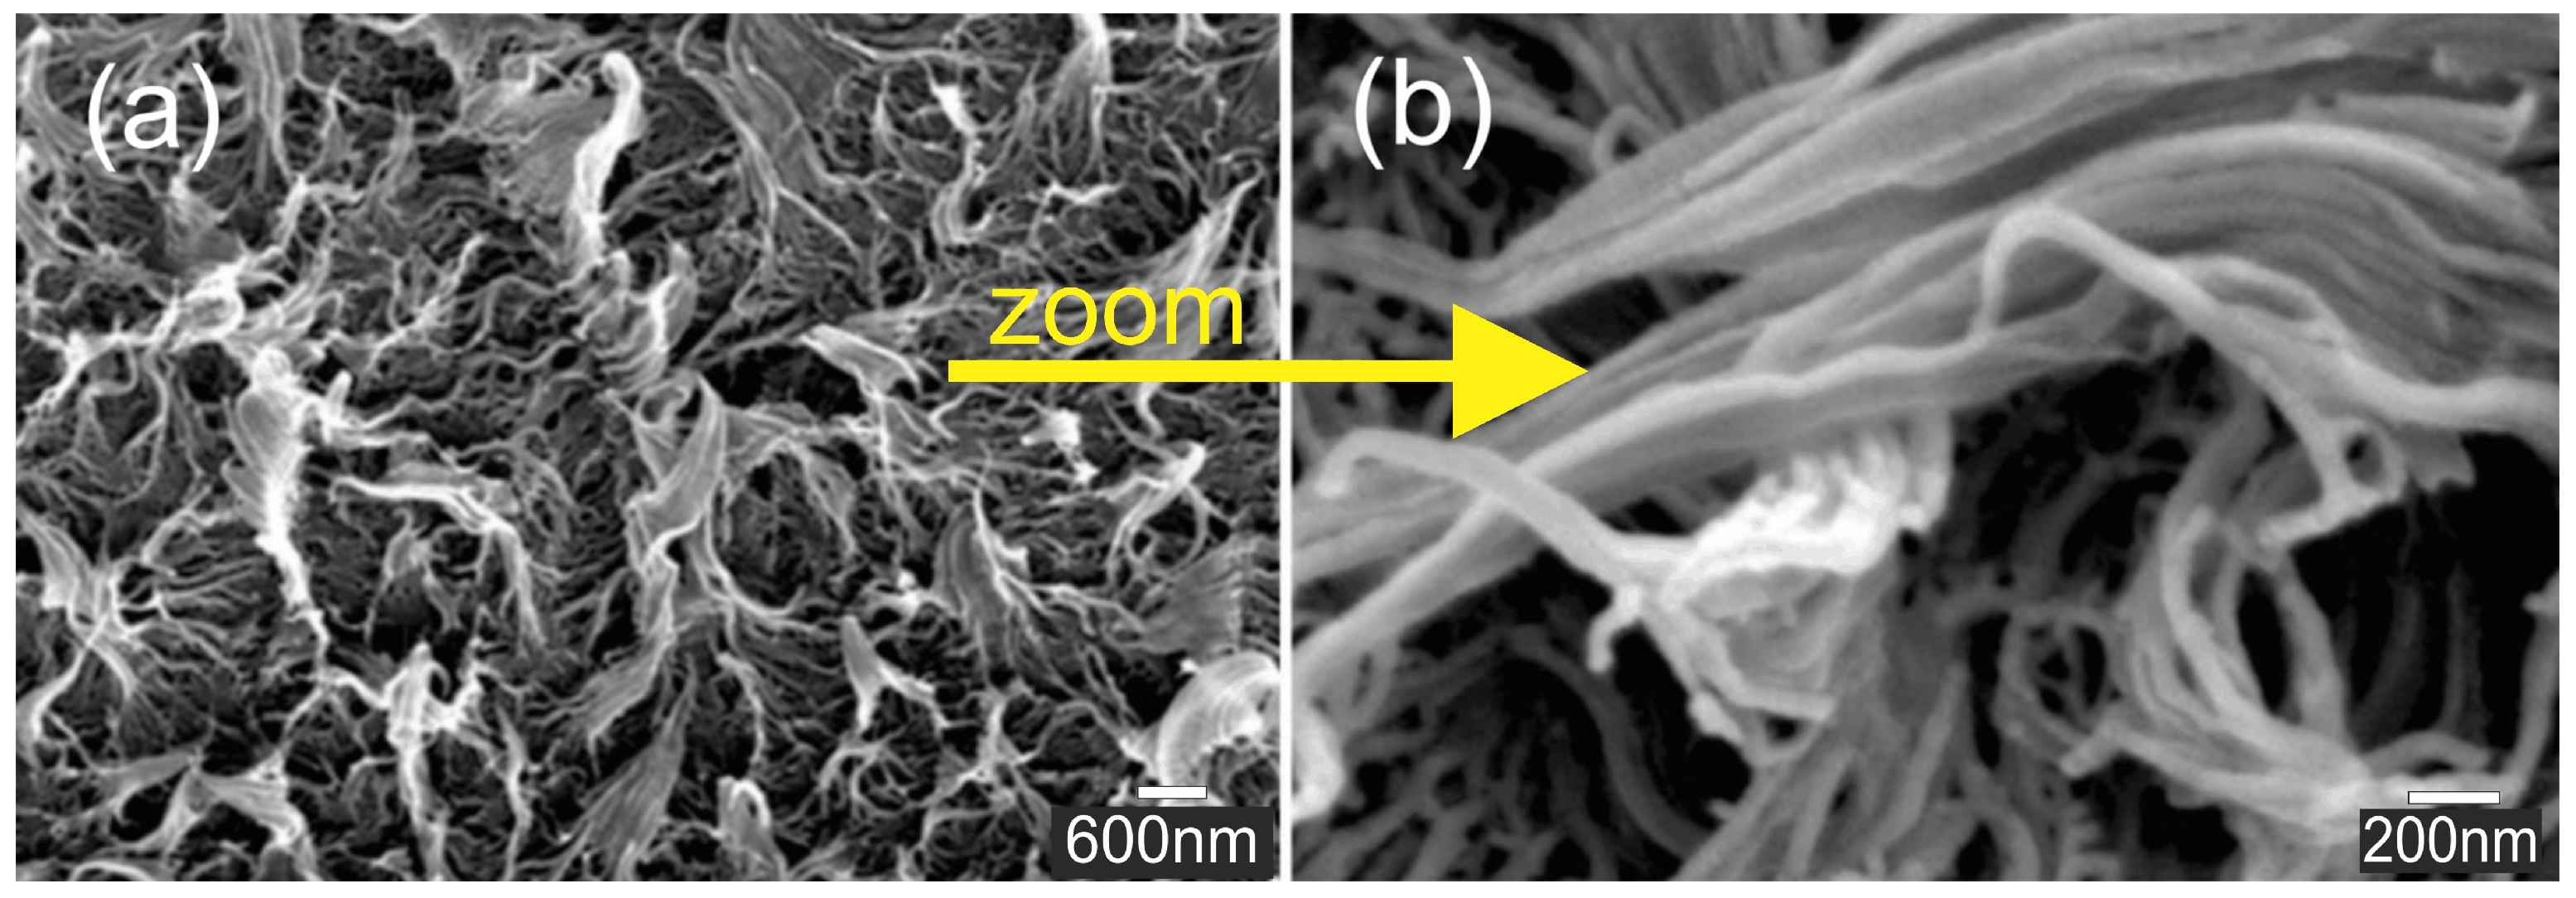
Figure 15.
(a,b) Coating spherulite structure at different magnifications.
Figure 15.
(a,b) Coating spherulite structure at different magnifications.
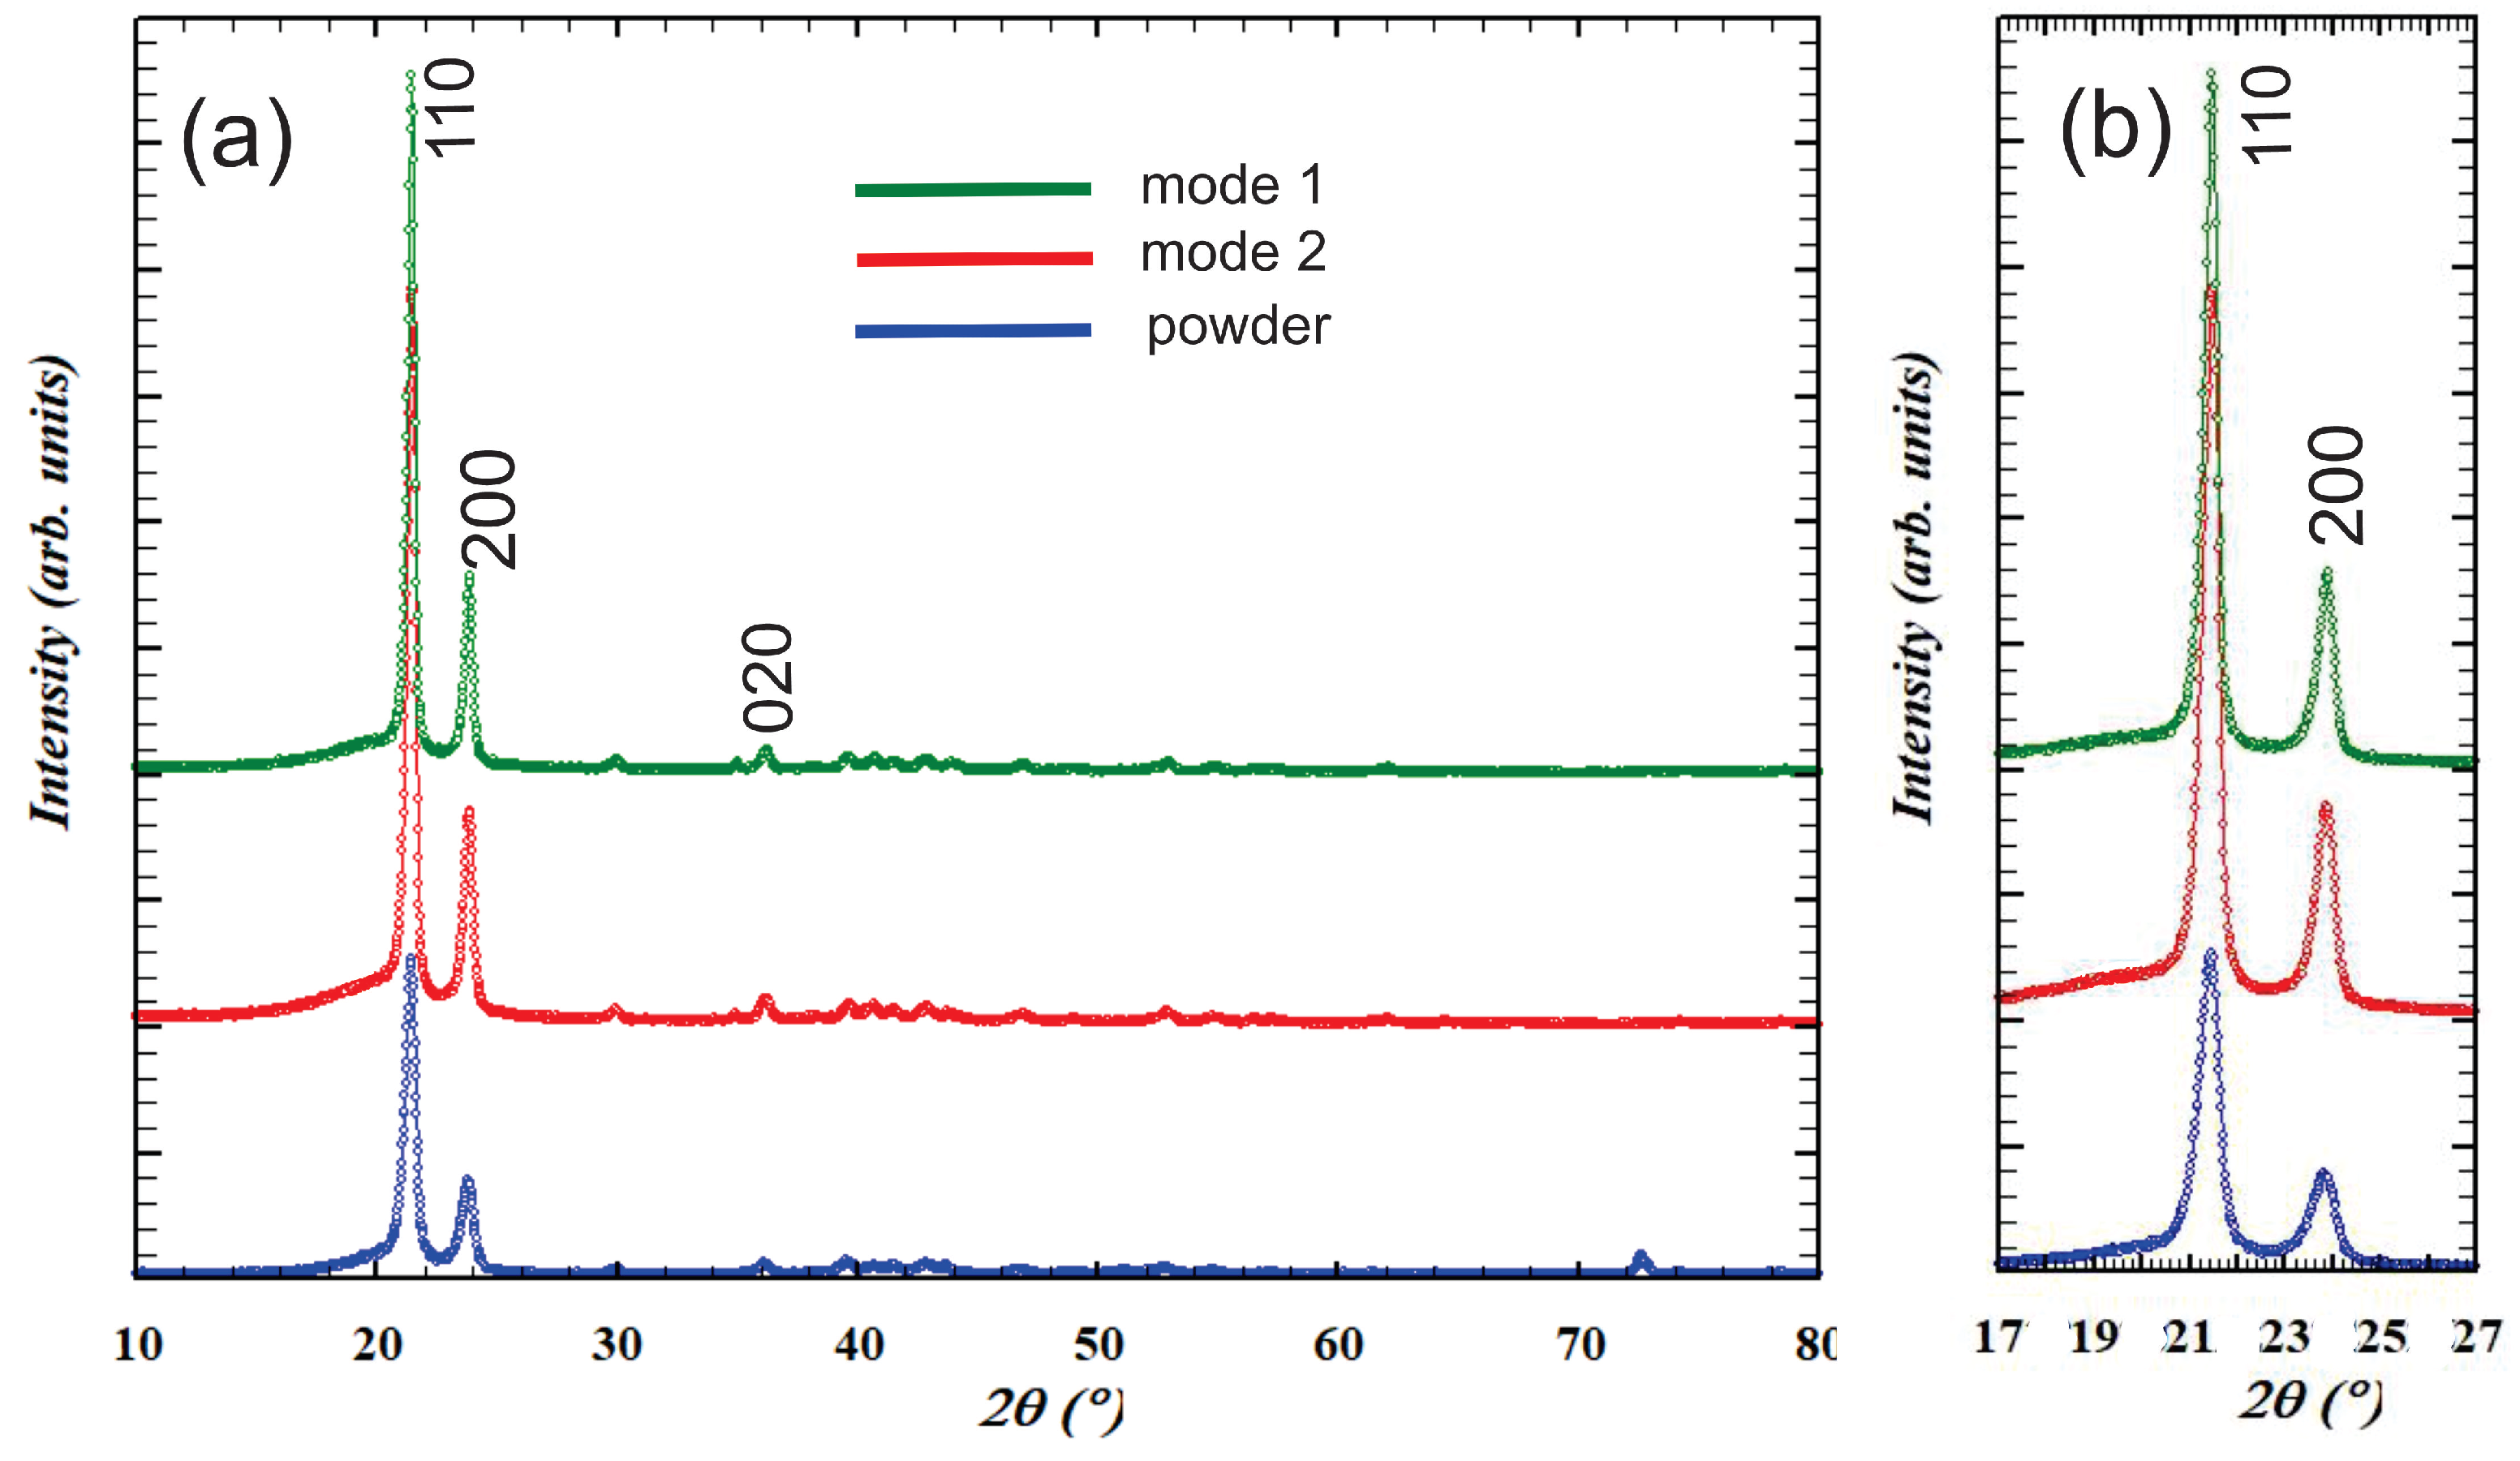
Figure 16.
(a) X-ray diffraction patterns of UHMWPE coatings. (b) Complete range of determination of the degree of crystallinity.
Figure 16.
(a) X-ray diffraction patterns of UHMWPE coatings. (b) Complete range of determination of the degree of crystallinity.
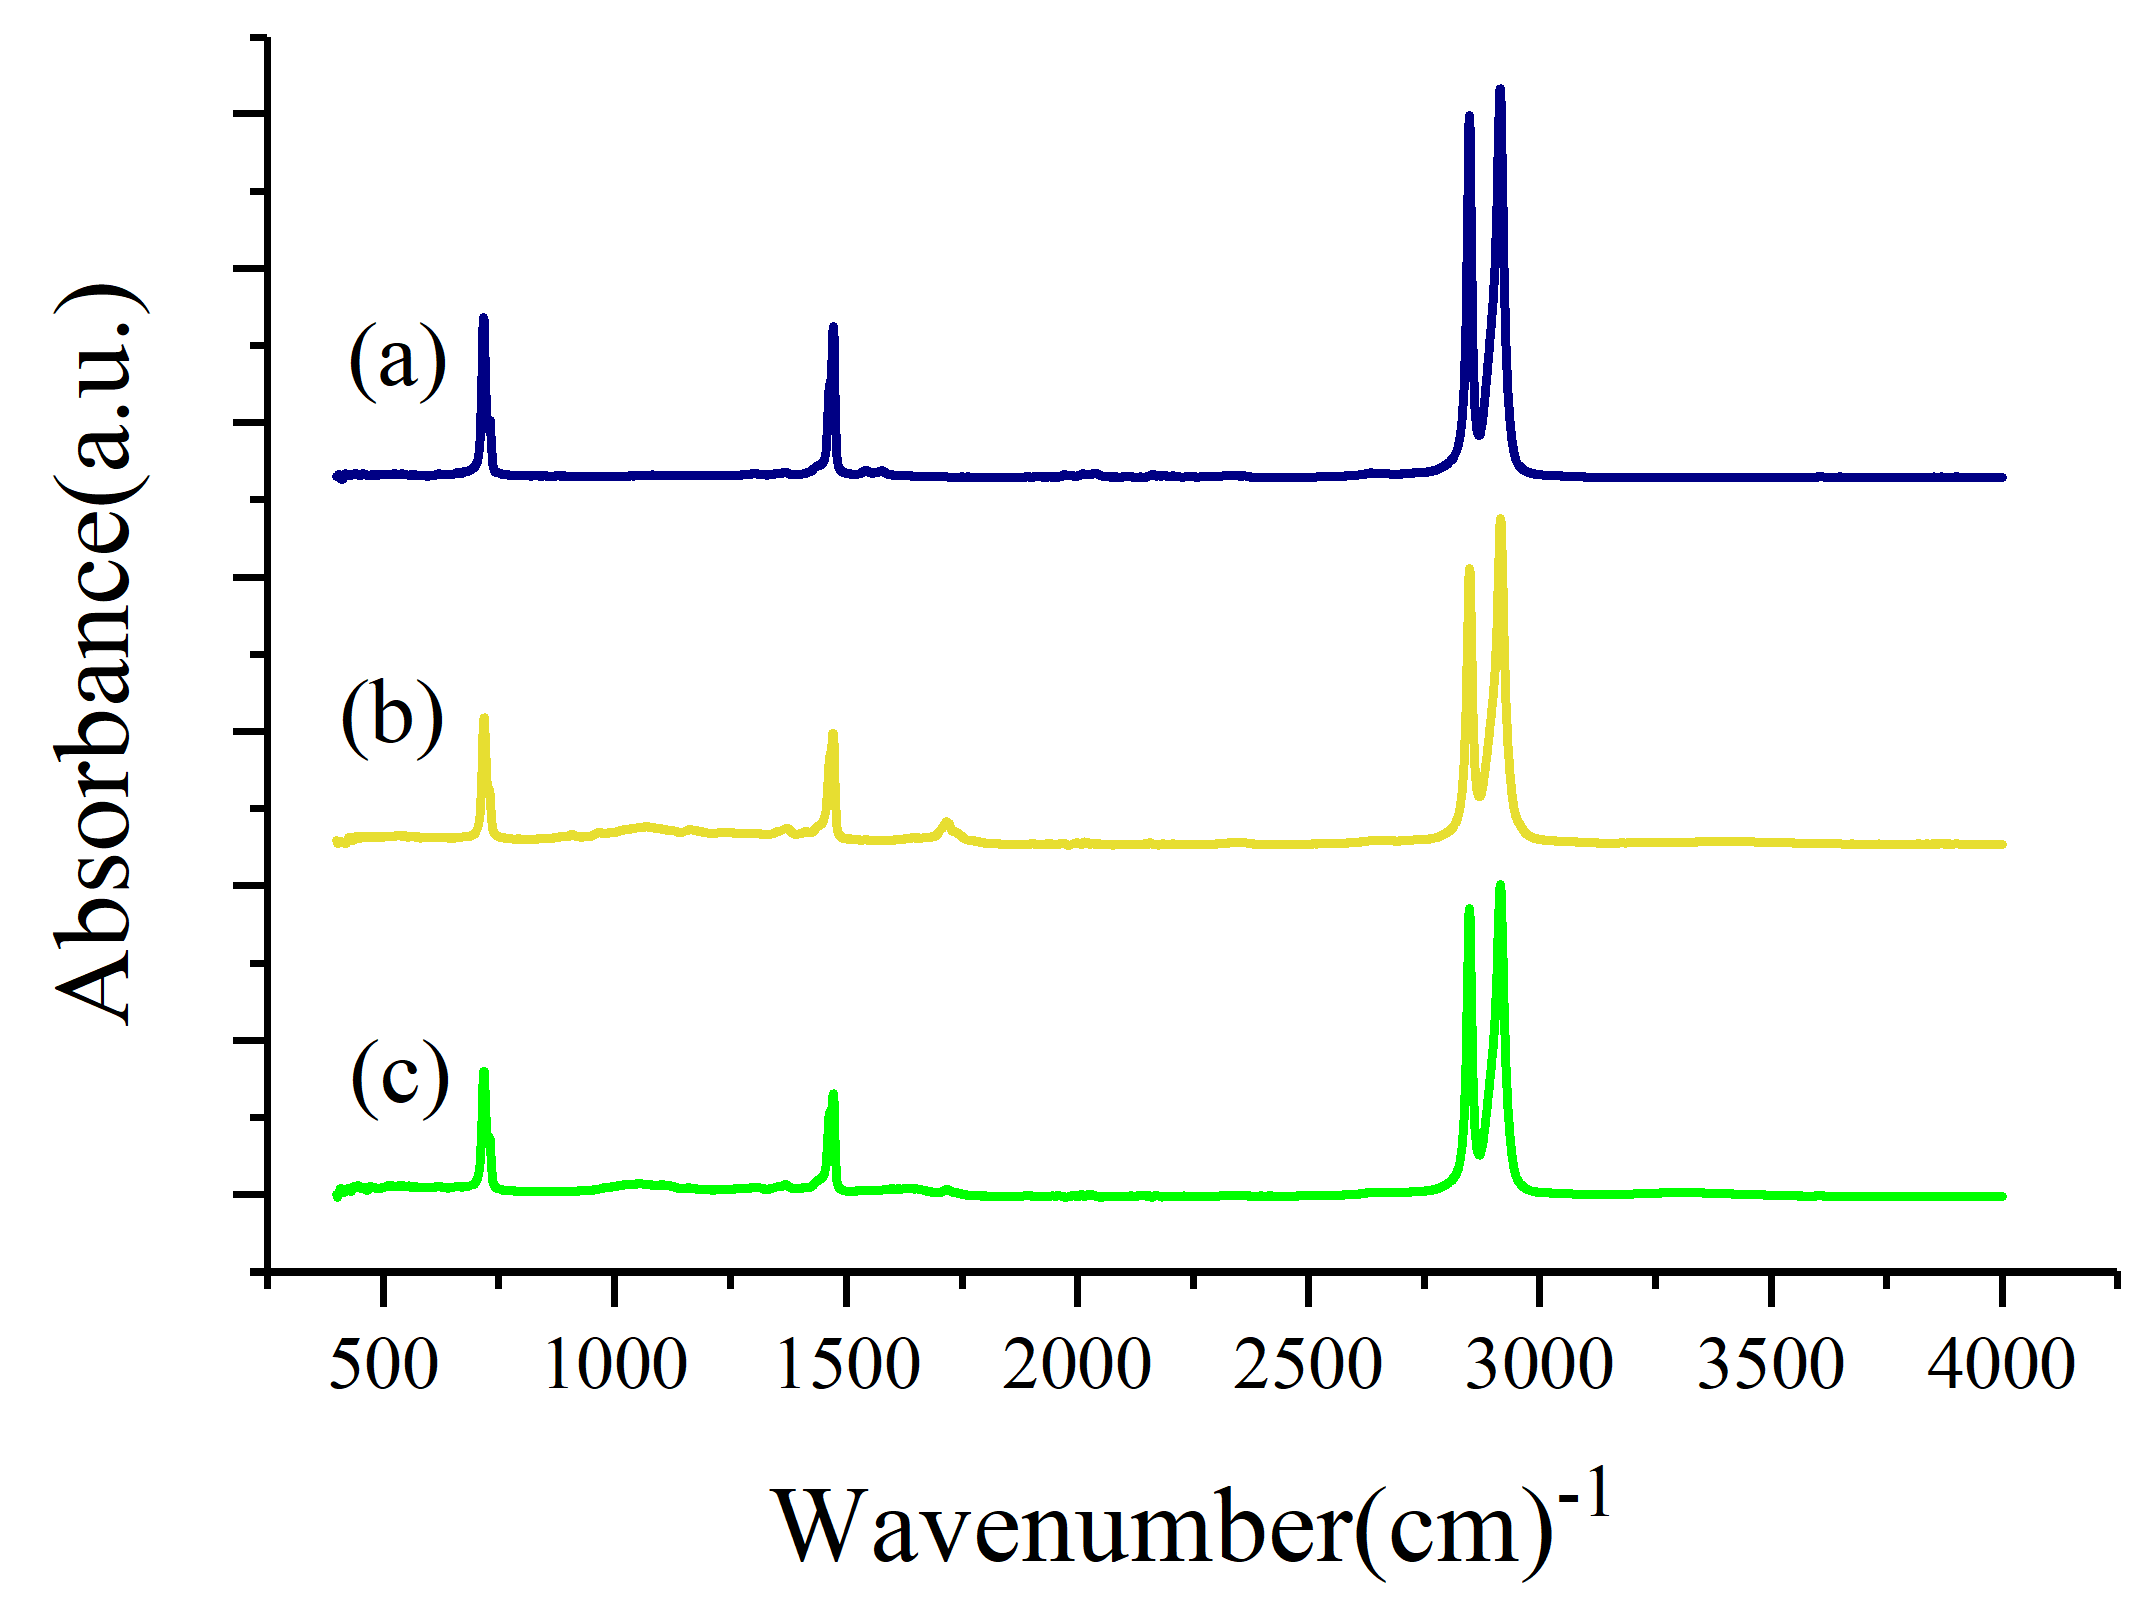
Figure 17.
(a) UHMWPE powder. (b) Coating according to mode-1. (c) Coating according to mode-2.
Figure 17.
(a) UHMWPE powder. (b) Coating according to mode-1. (c) Coating according to mode-2.
Table 1.
Properties of UHMWPE powder.
Table 1.
Properties of UHMWPE powder.
| Molecular
weight, mol | 4 × 10 |
| Density, kg/m | 930 |
| Melting point, °C | 138–143 |
| Specific heat, J/kg·K | 1780 |
| Thermal conductivity, W/m·K | 0.18 |
Table 2.
Dependence of the pressure of the transporting gas and the residence time of the particle in the body of the torch.
Table 2.
Dependence of the pressure of the transporting gas and the residence time of the particle in the body of the torch.
| Technological Mode | Experiment 1 | Experiment 2 | Experiment 3 | Experiment 4 | Experiment 5 | Experiment 6 | Experiment 7 | Experiment 8 | Experiment 9 | Experiment 10 |
|---|
| Propane pressure, bar | 1.0 | 1.8 | 2.7 | 3 | 1.3 | 0.4 | 3.6 | 2.2 | 1.9 | 1.0 |
| Carrier gas pressure, bar | 1.1 | 5.0 | 3.7 | 1.0 | 3.2 | 4.6 | 2.3 | 1.9 | 1.4 | 2.8 |
| Air damper pressure, bar | 1 | 1 | 1 | 1 | 1 | 1 | 1 | 1 | 1 | 1 |
| Average temperature (fluid), °C | 333 | 320 | 349 | 479 | 356 | 331 | 387 | 403 | 443 | 371 |
Table 3.
Relationship of the pressure of the transporting gas and the residence time of the particle in the body of the torch.
Table 3.
Relationship of the pressure of the transporting gas and the residence time of the particle in the body of the torch.
| Pressure in the Powder Supply Channel, bar | Fraction, mm | The Residence Time of the Particle in the Flame, s |
|---|
| 1 | 0.17–0.19 | 0.006 |
| 2 | 0.17–0.19 | 0.0053 |
| 3 | 0.17–0.19 | 0.0048 |
| 4 | 0.17–0.19 | 0.0043 |
| 5 | 0.17–0.19 | 0.0038 |
| 6 | 0.17–0.19 | 0.0032 |
Table 4.
UHMWPE Coating Modes.
Table 4.
UHMWPE Coating Modes.
| Mode | Time of Thermal Influence on a Particle, s | The Average Velocity of a Particle in Contact with a Substrate, m/s | Substrate Temperature, °C | Distance, m | Powder Consumption, g/s |
|---|
| Mode 1 | 0.006 s heating only by the thermal effect of the torch | 75 | 130 | 1–1.2 | 5 |
| Mode 2 | heating in a fluidized bed for 1 s + heating by the thermal effect of the torch—0.006 s | 75 | 95–100 | 1–1.2 | 5 |
Table 5.
The degrees of crystallinity of the initial powder and UHMWPE coatings.
Table 5.
The degrees of crystallinity of the initial powder and UHMWPE coatings.
| Sample | Degree of Crystallinity, ±10% |
|---|
| UHMWPE Powder | 66.11 |
| Spraying without heating UHMWPE | 64.4 |
| Heated spray UHMWPE | 68.2 |
Table 6.
Peak position and vibration type of the CH group.
Table 6.
Peak position and vibration type of the CH group.
| No | Range | Vibration |
|---|
| 1 | [710.. 750] | CH rocking |
| 2 | [1435.. 1475] | CH scissoring |
| 3 | [2845.. 2880] | CH sym stretching |
| 4 | [2915.. 2955] | CH asym stretching |


 ,
, 


