Article

Modelling of Chloride Concentration Profiles in Concrete by the Consideration of Concrete Material Factors under Marine Tidal Environment

National Engineering Research Center for Inland Waterway Regulation, School of River and Ocean Engineering, Chongqing Jiaotong University, 66 Xuefu Road, Nan’an District, Chongqing 400074, China
*
Author to whom correspondence should be addressed.
J. Mar. Sci. Eng. 2022, 10(7), 917; https://doi.org/10.3390/jmse10070917
Submission received: 30 May 2022 / Revised: 26 June 2022 / Accepted: 30 June 2022 / Published: 2 July 2022
(This article belongs to the Special Issue Coastal Engineering: Sustainability and New Technologies)

Abstract

:
The corrosion of reinforcement induced by chloride ions is one of the most significant causes of durability deterioration for reinforced concrete (RC) buildings. The concrete material factors, including the water-to-cement ratio (w/c) of concrete, as well as the content, shape, particle grading, and random distribution of coarse aggregate embedded in mortar, have a marked effect on chloride transport performance within concrete. However, comprehensive consideration for the effects of both w/c and coarse aggregate performances on chloride diffusion characteristics in concrete is scarce, especially regarding the chloride diffusion model of concrete. In this paper, an indoor exposure experiment exploring chloride ions intruding into mortar and concrete specimens with w/c = 0.4, 0.5 and 0.6 was carried out, in order to acquire the chloride diffusion parameters for concrete three-phases composites. Based on the numerical algorithm of random generation and placement of two-dimensional random convex polygon coarse aggregate, mesoscopic numerical models for concrete, considering various coarse aggregate contents as well as grading, were established. Using the numerical simulation method of finite element analysis for chloride transport in cement-based materials, which can replace some of the exposure tests, the influences of w/c, coarse aggregate content and grading on chloride diffusion performance in concrete mesoscopic models were systematically probed. According to the Fick’s second law, a chloride diffusion model by the consideration of w/c, volume fraction of coarse aggregate (VFCA), and maximum size of coarse aggregate (MSCA) was developed to assess the chloride concentration profiles in concrete under arbitrary w/c, coarse aggregate content, and coarse aggregate grading conditions. Certainly, the precision accuracy for this proposed chloride diffusion model was validated. The research results can provide theoretical support for chloride erosion behavior and structural durability assessment of concrete with different mix proportions.

1. Introduction

Reinforced concrete is extensively applied in water conservancy infrastructure buildings because of its low cost and excellent mechanical properties [1,2,3]. The durability of RC is closely related to various impact factors, such as chloride-induced steel corrosion, sulfate corrosion, carbonation, freezing-thawing cycles for concrete deterioration, and the influences of damage cracks, cover thickness, mix proportion, environmental temperature, and humidity [4,5,6,7,8]. In particular, chloride intruding into concrete, which induces steel corrosion, is considered to be an important factor to the declining durability of marine RC buildings [8,9,10,11,12]. At the mesoscopic level, concrete is a three-phase composite composed of mortar, coarse aggregate, and an interfacial transition zone (ITZ) [13,14]. In particular, the material properties of each phase in concrete include hardness, compactness, porosity, permeability, etc. [2,15]. The mortar and ITZ phases can be regarded as diffusion media for chloride ion transport, while the coarse aggregate phase can be regarded as a non-diffusion medium for chloride ion transport [16,17]. For concrete composites, the concrete penetrability principally relies on its composition materials and corresponding geometric arrangement, which include the water-to-cement ratio (w/c), coarse aggregate content (named VFCA, Vca), shape, grading (characterized by MSCA, Smax), and random distributions of aggregates in mortar [18]. These typical material factors will change the meso- and microstructure of concrete to varying degrees and affect the resistance of concrete to chloride ion erosion. The water-to-cement ratio w/c is a crucial parameter in concrete structure service life. A larger w/c leads to more capillary pores and microcrack channels in mortar [19], which is more conducive to chloride transport in concrete. As the representative medium for chloride transport in concrete, the coarse aggregate content, particle grading, shape and random distribution in mortar will change the microstructures and capillary porosity of concrete to varying degrees and exert an impact on chloride transport behavior in heterogeneous materials [20]. In summary, the contents and proportions of water and cement in mortar and the characteristics of aggregate embedded in cement paste will influence the transport behaviors of chloride ions in concrete. Consequently, the characteristics of the w/c as well as the coarse aggregate are regarded as vital material factors affecting chloride transport behaviors in concrete. Previous studies lack relevant results that comprehensively consider the influences of the above material factors on chloride transport behavior; therefore, further investigation needs to be conducted.
There have been some attempts to study the transport behaviors of chloride ions by considering various concrete material factors. Golewski and Szostak [21,22,23] indicated that the nano-admixtures in the form of the active C-S-H seeds is an innovative form for accelerating the curing of concrete with fly ash (FA) at a very early stage, which can lead to the formation of a more homogeneous and compact cement matrix structure. By this token, the chloride penetration resistance for the aforementioned concrete materials can be greatly increased. Considering the effect of w/c on chloride transport behaviors within concrete materials, the physical experiments carried out by Mangat et al. [24] and Costa et al. [25] showed that the smaller the water-binder ratio (w/b) of ordinary Portland cement concrete is, the smaller the apparent chloride diffusion coefficient obtained by regression. Chen et al. [26] measured the resistivity of cement-based materials through the slice-resistivity method and evaluated the chloride permeation of concrete with diverse w/c at exposure times without regard to polarization. The results indicated that the chloride diffusivity decreased as the w/c decreased. Chen et al. [27] conducted a rapid chloride migration (RCM) test to measure the chloride diffusivity of cement materials. Moreover, a chloride diffusion coefficient model accounting for the effects of w/c and curing age was proposed. Gao et al. [28] employed an indoor exposure experiment to reveal that a lower w/c can observably decrease the chloride concentration peak value of concrete and its chloride diffusion coefficient. Khanzadeh et al. [29] conducted a field exposure experiment under the marine tidal zone to explore the influence of the w/b on the maximum phenomenon of chloride concentrations in concrete. The results showed that the maximum depth of chloride diffusion increased as the w/c increased. Higashiyama et al. [30] reported that a lower w/c is more effective in resisting chloride ingress (having a lower chloride diffusion coefficient). Similarly, Ribeiro et al. [31] described that a low w/b can effectively decrease the porosity and chloride diffusion coefficient in cement-based composites. In addition, to reach an extremely high resistance to chloride penetration, the w/b must be less than 0.40. Du et al. [32] demonstrated that the w/c can be considered a microscale calculating parameter because it determines the pore structure and porosity of mortar at the microscale. Furthermore, increasing the w/c can cause the chloride diffusivity of concrete to increase sharply; thus, reducing the w/c is the most effective way to decrease chloride ion intrusion into concrete.
In most actual engineering projects, the properties of concrete materials are subject to deterioration and variation, particularly in marine environments. To satisfy economic, mechanical, and reliability requirements, VFCAs are usually approximately 40% within concrete composites [33]. The properties of aggregates are considered an important factor that affects the corrosion resistance and durability of concrete structures. Wang et al. [33] probed the influence of VFCA on chloride ion distribution and diffusion behavior in concrete by means of an indoor drying-wetting cycle experiment. The chloride concentration and chloride diffusivity decreased with increasing VFCA, while the surface chloride concentration was not disturbed by the coarse aggregate. Yang et al. [34] used the accelerated chloride migration test (ACMT) to reveal that the chloride diffusivity of cement-based materials decreased with increasing aggregate content. Li et al. [35] explored the influence of aggregate content on chloride diffusion in concrete by simulating concrete with different VFCAs. The results showed that the larger the VFCA was, the smaller the chloride diffusivity was in concrete. Wu et al. [36] carried out an indoor real-time tidal cycle experiment, quantified the effect of VFCA on chloride diffusion parameters, and established a two-dimensional chloride diffusion model taking into account the effect of VFCA. Wu et al. [37] obtained the chloride diffusivity in concrete with different VFCAs by RCM and further revealed that the chloride diffusivity for concrete decreases with increasing coarse aggregate volume fraction. Du et al. [32] employed the finite element method to quantify the influence of VFCA on chloride diffusivity for concrete models, and the results indicated that an increasing VFCA can cause an obvious decrease in the chloride diffusivity of concrete. Comprehensively, the chloride diffusivity of concrete determined by the experimental and numerical methods declined with increasing VFCA.
The sizes of concrete aggregates also affect concrete properties [38,39]. Previous studies have also considered the effects of aggregate particle size or grading on chloride diffusion characteristics in concrete. Basheer et al. [40] conducted air penetrability experiments, accelerated carbonation tests, and freeze–thaw/salt scaling resistance experiments to explore the effects of aggregate size and gradation on the microstructural characteristics and durability of concrete. The results demonstrated that as the proportion of larger aggregates increased in the mixture, the local porosity at the ITZ increased, and the overall durability of concrete decreased. Wang et al. [33] elaborated the influence of the MSCA on the chloride diffusion behavior of concrete via an indoor drying-wetting cycle experiment. It was concluded that the chloride diffusion concentration increased with decreasing MSCA, and the surface chloride concentration had nothing to do with the coarse aggregate factor. Wu et al. [37] indicated that a larger MSCA led to a larger chloride diffusion coefficient in the interface transition zone (ITZ), which represents the chloride diffusion capacity of the ITZ. In addition, an empirical model of the ITZ chloride diffusion coefficient accounting for the MSCA was proposed. Altogether, the coarse aggregate size/grading can be regarded as one of the vital impact factors on chloride transport performance for concrete composites.
In summary, previous studies determined that the w/c, VFCA, and MSCA significantly affect the chloride diffusion behavior in cement matrix composites by changing the microstructure and capillary porosity of concrete [41]. However, most of the previous achievements have used a single concrete material factor alone in considering the effects of the w/c or VFCA and MSCA on chloride diffusion characteristics. Few studies have considered the influences of two or more of the above factors on chloride diffusion behavior and concrete structure durability. Moreover, the chloride concentration distribution, diffusion characteristics and corresponding prediction models in concrete have not been reported when comprehensively considering the combined effects of the w/c and coarse aggregate characteristics (content, shape, particle grading, and random distribution).
Therefore, the research significance of this paper is to further investigate and quantify the influence of comprehensive concrete material factors on chloride transport characteristics. Specifically, an exposure experiment for chloride intruding into mortar and concrete materials with various w/c is carried out to determine the important diffusion parameters of chloride ions for the mortar, coarse aggregate, and ITZ phases in concrete composites. The chloride diffusion characteristics are deeply investigated by the numerical simulation method for chloride ion diffusion in mesoscopic models of concrete, including the w/c, coarse aggregate content and particle grading. Finally, the chloride diffusion prediction model for concrete considering the concrete material factors of the w/c, VFCA, and MSCA is established. The above research results can provide necessary theoretical support for the evaluation of chloride erosion behavior and structural durability assessment of concrete with different mix proportions.

2. Experimental Procedure

2.1. Materials and Mix Proportions

During the experimentation described in this paper, the ordinary Portland cement (OPC) (P.O. 42.5) with a density of 3100 kg/m3 was used as the cementitious material. Crushed limestone (apparent density of 2690 kg/m3) with continuous grading and a size range of 5–40 mm was considered as the coarse aggregate. River sand without chloride (fineness modulus of 2.4 and apparent density of 2610 kg/m3) was adopted as the fine aggregate. To avert the influences of external chloride ions on measurements, distilled water was used for preparation and testing during this paper’s whole experimental progress. In this paper, two types of mortar and concrete mixture proportions were prepared on the basis of w/c = 0.4, 0.5, and 0.6; and the mix proportion details are exhibited in Table 1 and Table 2. For the concrete, the VFCA is approximately 0.4–0.45.

2.2. Specimen Preparation and Exposure Conditions

The specimen preparation of concrete was done according to SL/T352-2020 (Chinese standard). Cubic mortar and concrete specimens were cast in 100 × 100 × 100 mm3 PVC molds and subsequently moved to a vibration table for compaction. After 24 h initial curing and 28 days final curing for all the specimens, the epoxy polyurethane coating was used to seal five surfaces of all the experimental specimens except for one side to ensure that the chloride ions can only intrude into the mortar and concrete materials via one-dimensional diffusion. For an arbitrary exposure time, three mortar and concrete specimens were prepared to acquire the tested results as accurately as possible by averaging the aforementioned three samples.
After the preparation, curing, covering and other steps for the experimental specimens, they were moved and exposed to a man-made 3.5% NaCl solution under the condition of a drying-wetting cycle. During the drying-wetting alternation of chlorine salt solutions, each drying-wetting period and its corresponding dry-wet ratio were set as 24 h and 1:1, i.e., the experimental specimens were exposed in a drying environment along sustaining 12 h, in which the environmental temperature and relative humidity are 25 °C and 70%, respectively; and during the rest of 12 h, the specimens were immersed in 3.5% NaCl solution. The 3.5% NaCl solution in this simulated marine tidal environment was replaced once every 10 drying-wetting cycles, and the exposure times during this experiment were 60, 120, 240, 360, 480, and 600 consecutive days.

2.3. Powder Sampling and Chloride Ion Testing

Sampling was conducted at different exposure periods. For each exposure time, six types of experimental specimens, including three mortars and three concrete specimens, were used to test the chloride concentrations. Many powders were acquired by grinding the experimental mortar and concrete specimens with a precision of 2 mm along the depth direction. Subsequently, the free chloride concentrations within the powder samples were tested by using the method of rapid chloride ion content determination based on the standard [42].

2.4. Results and Discussion

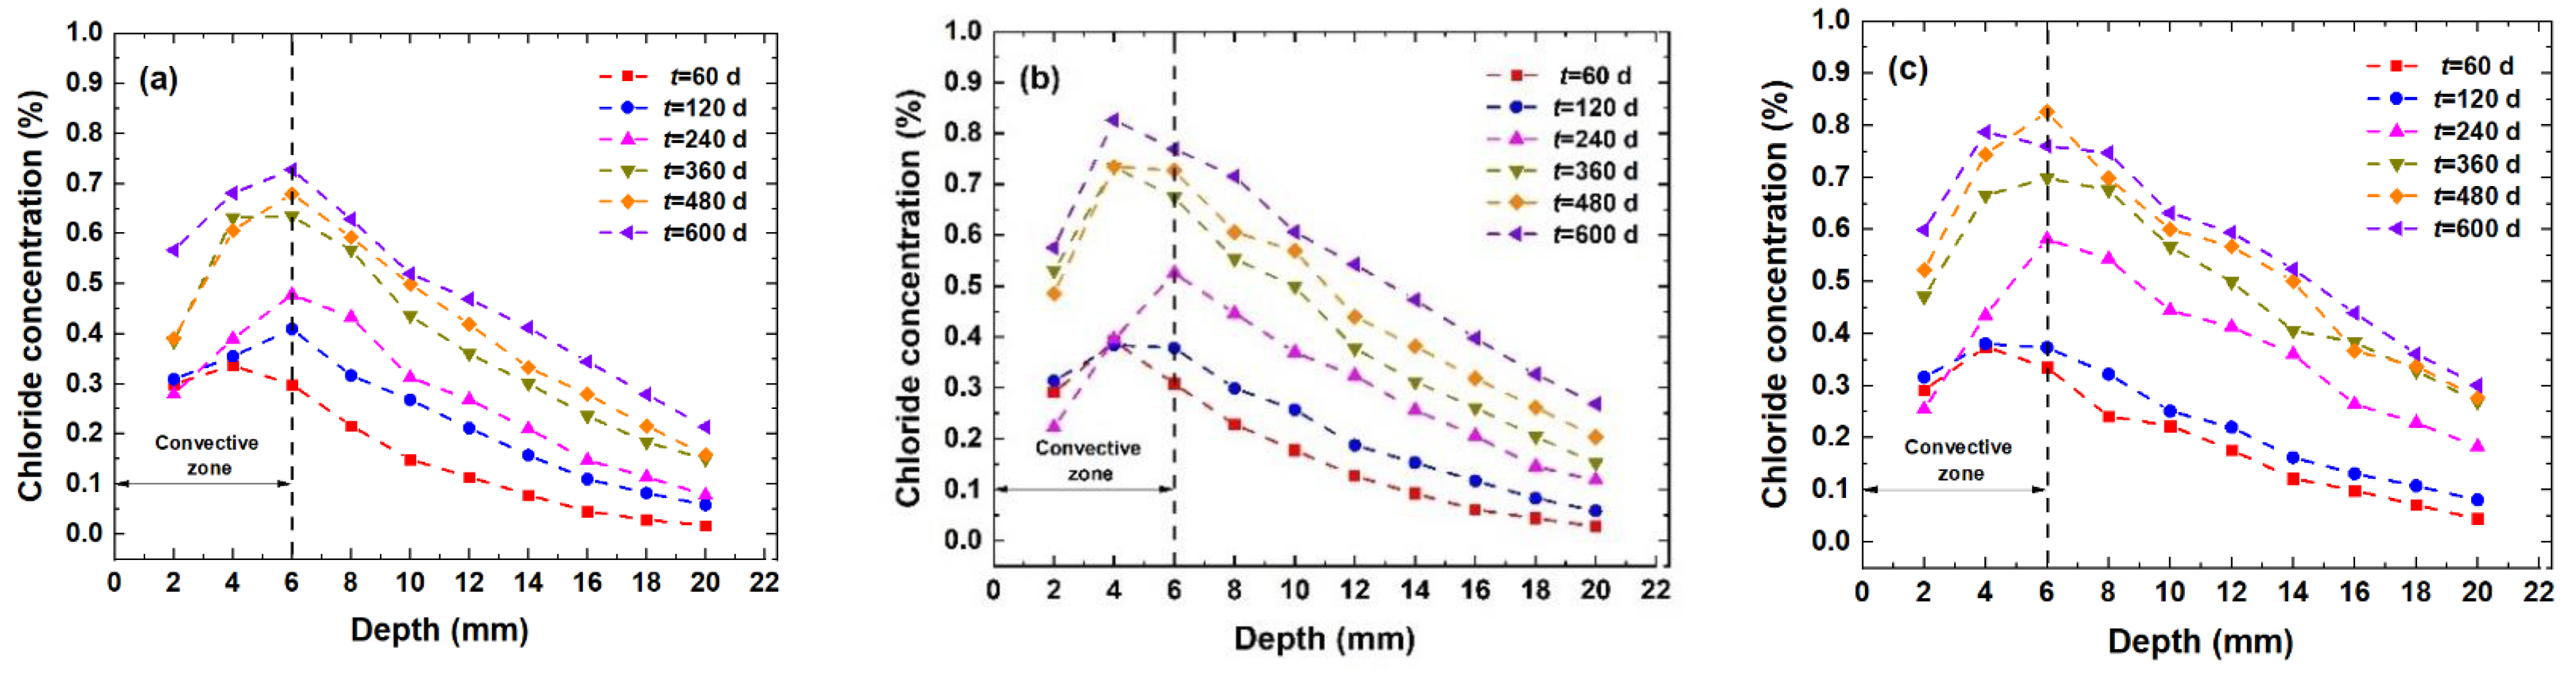
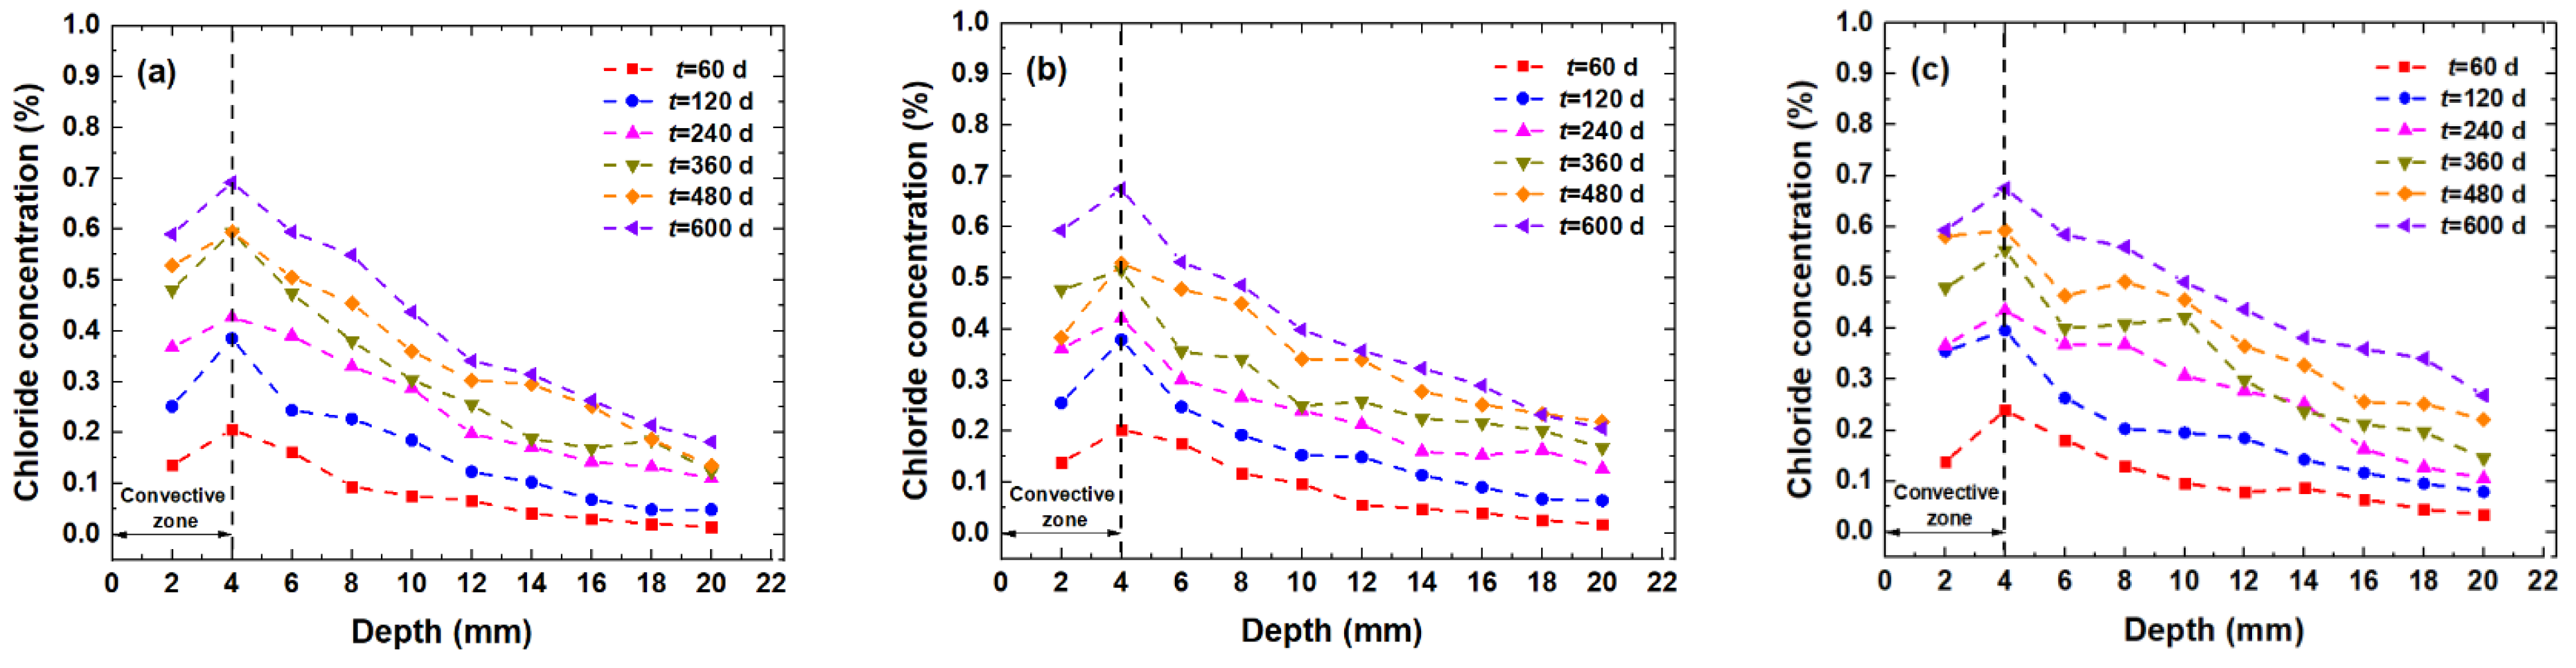
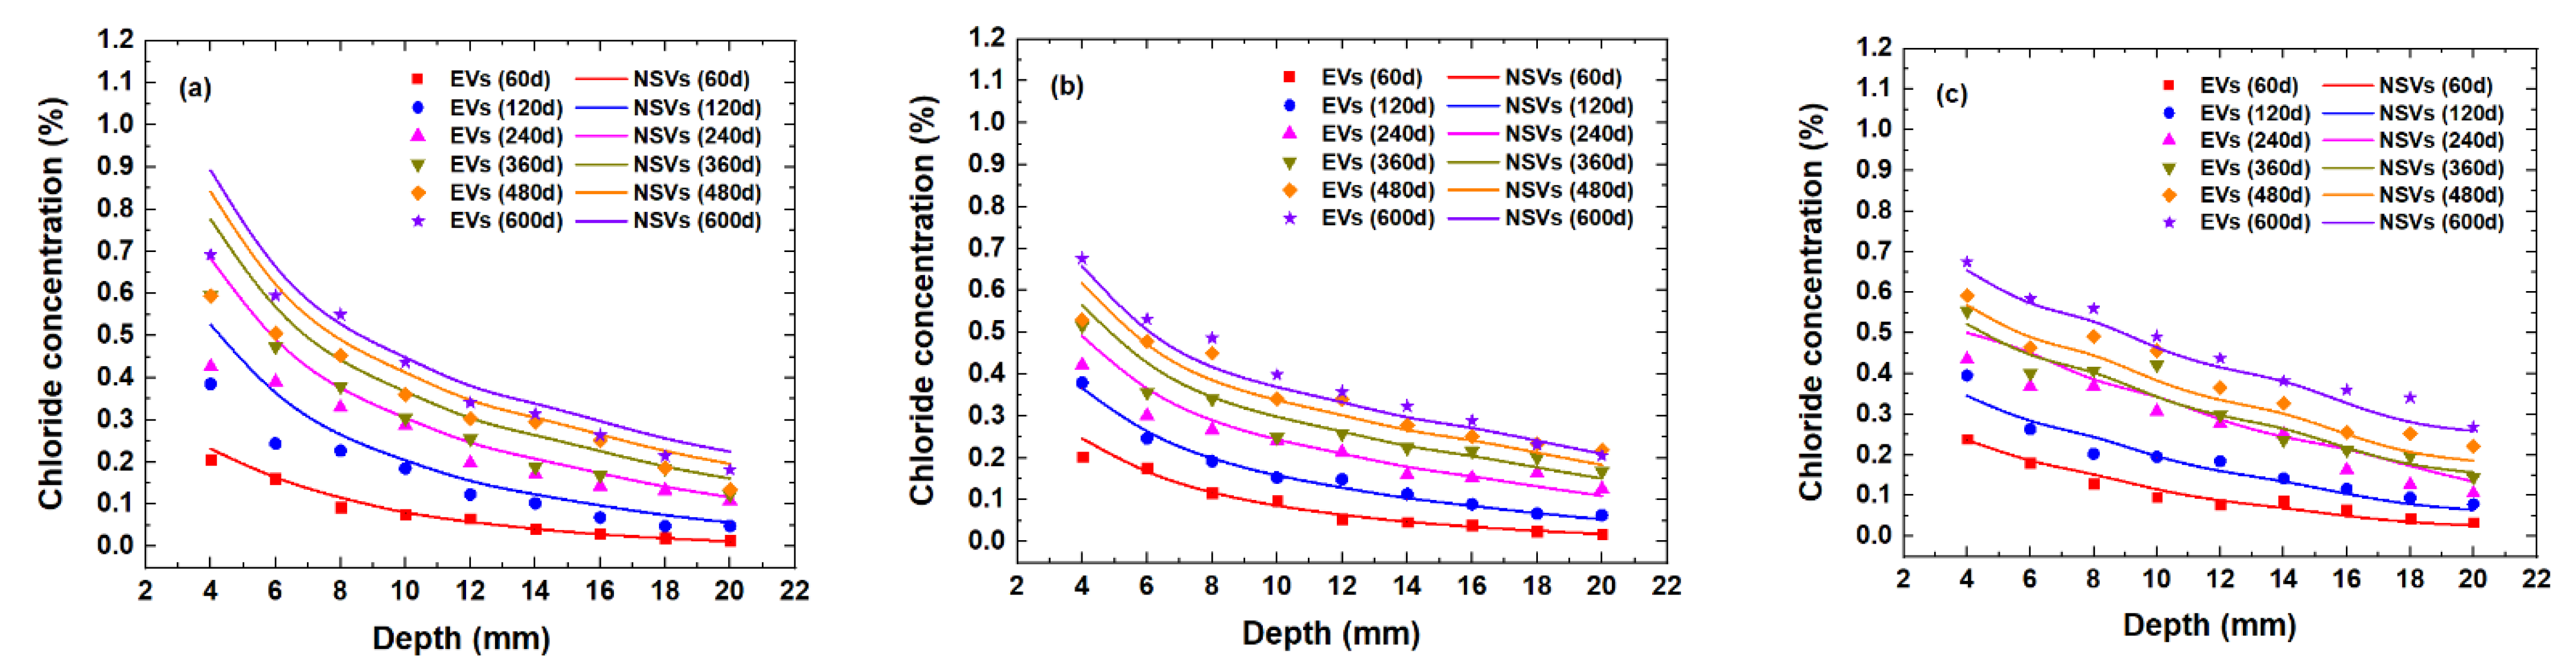
2.4.1. Chloride Concentration Profiles

For different exposure times, the chloride concentration profiles of mortar and concrete specimens with different w/c are exhibited in Figure 1 and Figure 2. The tested chloride concentrations are all expressed as a percentage of the concrete mass (%) during this paper’s descriptions.
As shown in Figure 1 and Figure 2, the tested chloride concentrations increase with increasing exposure time and w/c. The chloride concentrations first increase and then decrease with increasing depth in the experimental specimens. The aforementioned variation laws of chloride diffusion concentrations are consistent with the conclusions reported by literatures [28,33]. In addition, the convection zone affected by drying-wetting cycles can be clearly observed in Figure 1 and Figure 2. The convection zone widths for the experimental mortar and concrete specimens are 6 mm and 4 mm, respectively. This is because the coarse aggregate hardness and compactness exceed those of the mortar [37]. If the coarse aggregate proportion in the convection zone is larger, then the available chloride transport medium in the concrete and the overall porosity within the region will also be reduced accordingly [33,40], and convection will be inhibited. Therefore, the convection zone of the concrete specimen is shorter than that of the mortar.

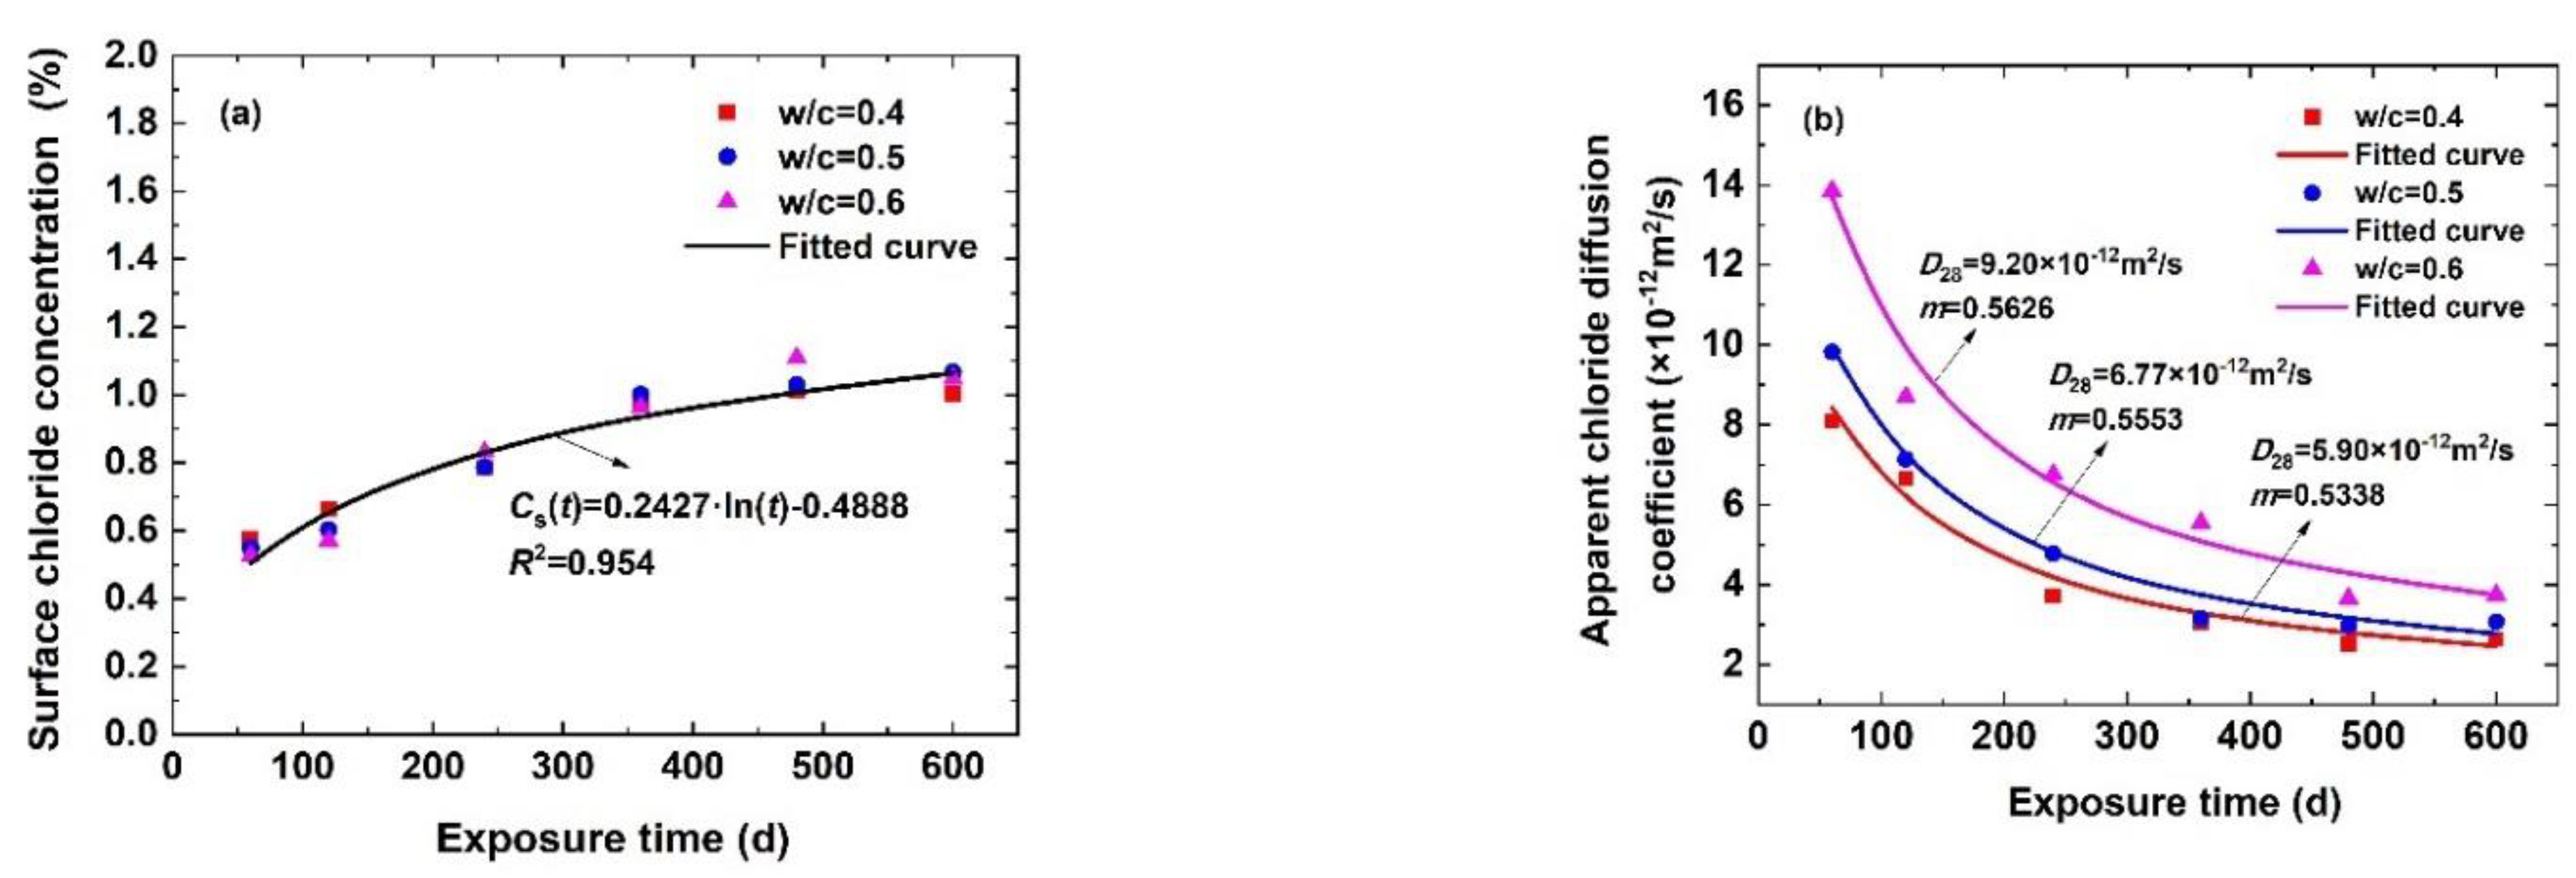
2.4.2. Chloride Diffusion Parameters

During chloride transport in mortar or concrete materials, only the diffusion mechanism is considered to elaborate the chloride movement behaviors. Therefore, the convection mechanism of chloride ion transport into concrete can be temporarily neglected. Utilizing the closed-form solution of Fick’s second law, the chloride profiles within the stable diffusion zone of cement-based materials, including the mortar and concrete, can be quantified as follows:
C ( x , t ) = C s ( t ) · [ 1 erf ( x 2 D a ( t ) · t ) ] ,
where C(x, t) is the chloride concentration (%) of the cement-based materials (mortar and concrete) at arbitrary depth x and exposure time t. Cs(t) is the time-dependent surface chloride concentration (%). Da(t) is the time-dependent apparent chloride diffusion coefficient (m2/s). erf(·) is the error function.
Cs(t) and Da(t), which are both influenced by multiple factors, such as exposure times, service environments, and properties of the concrete composites, are regarded as the two most significant parameters affecting the chloride diffusion behavior in concrete. The existing research results consider that Cs(t) is usually quantified in the form of a logarithmic function [43], and the time-dependent Da(t) is quantified via a power function proposed by Thomas et al. and is shown in the literature [33]. The two expressions are represented as follows:
C s ( t ) = A · ln ( t ) + B ,
D a ( t ) = D 28 1 m · ( t 28 t ) m ,
where A and B are the regression parameters; D28 is the apparent chloride diffusion coefficient at t = 28 days, i.e., named as the reference chloride diffusion coefficient (m2/s); and m denotes the aging factor; t28 means the reference diffusion time, i.e., t28 = 28 days.
Combined with the chloride profiles for the mortar specimens exhibited in Figure 1, the values of Cs, D28 and m for mortars at different exposure times with different w/c can be confirmed according to fitting Equations (1) and (3) by means of the nonlinear least squares method, as elaborated in Figure 3.
The values of Cs are almost constant with increasing w/c, so it can be considered that the Cs values in the mortar have nothing to do with the w/c. Therefore, in this paper, the average values of Cs with different w/c are considered representative values. The empirical expression of Cs with respect to t can be determined as follows: Cs(t) = 0.2427·ln(t) − 0.4888 (for mortar specimens). The time-dependent chloride diffusion coefficients for the mortar, i.e., chloride diffusivities for the homogeneous mortar phase within concrete composites, are set as Dm(t) = D28m·(t28/t)m, and the detailed parameters are shown in Table 3.

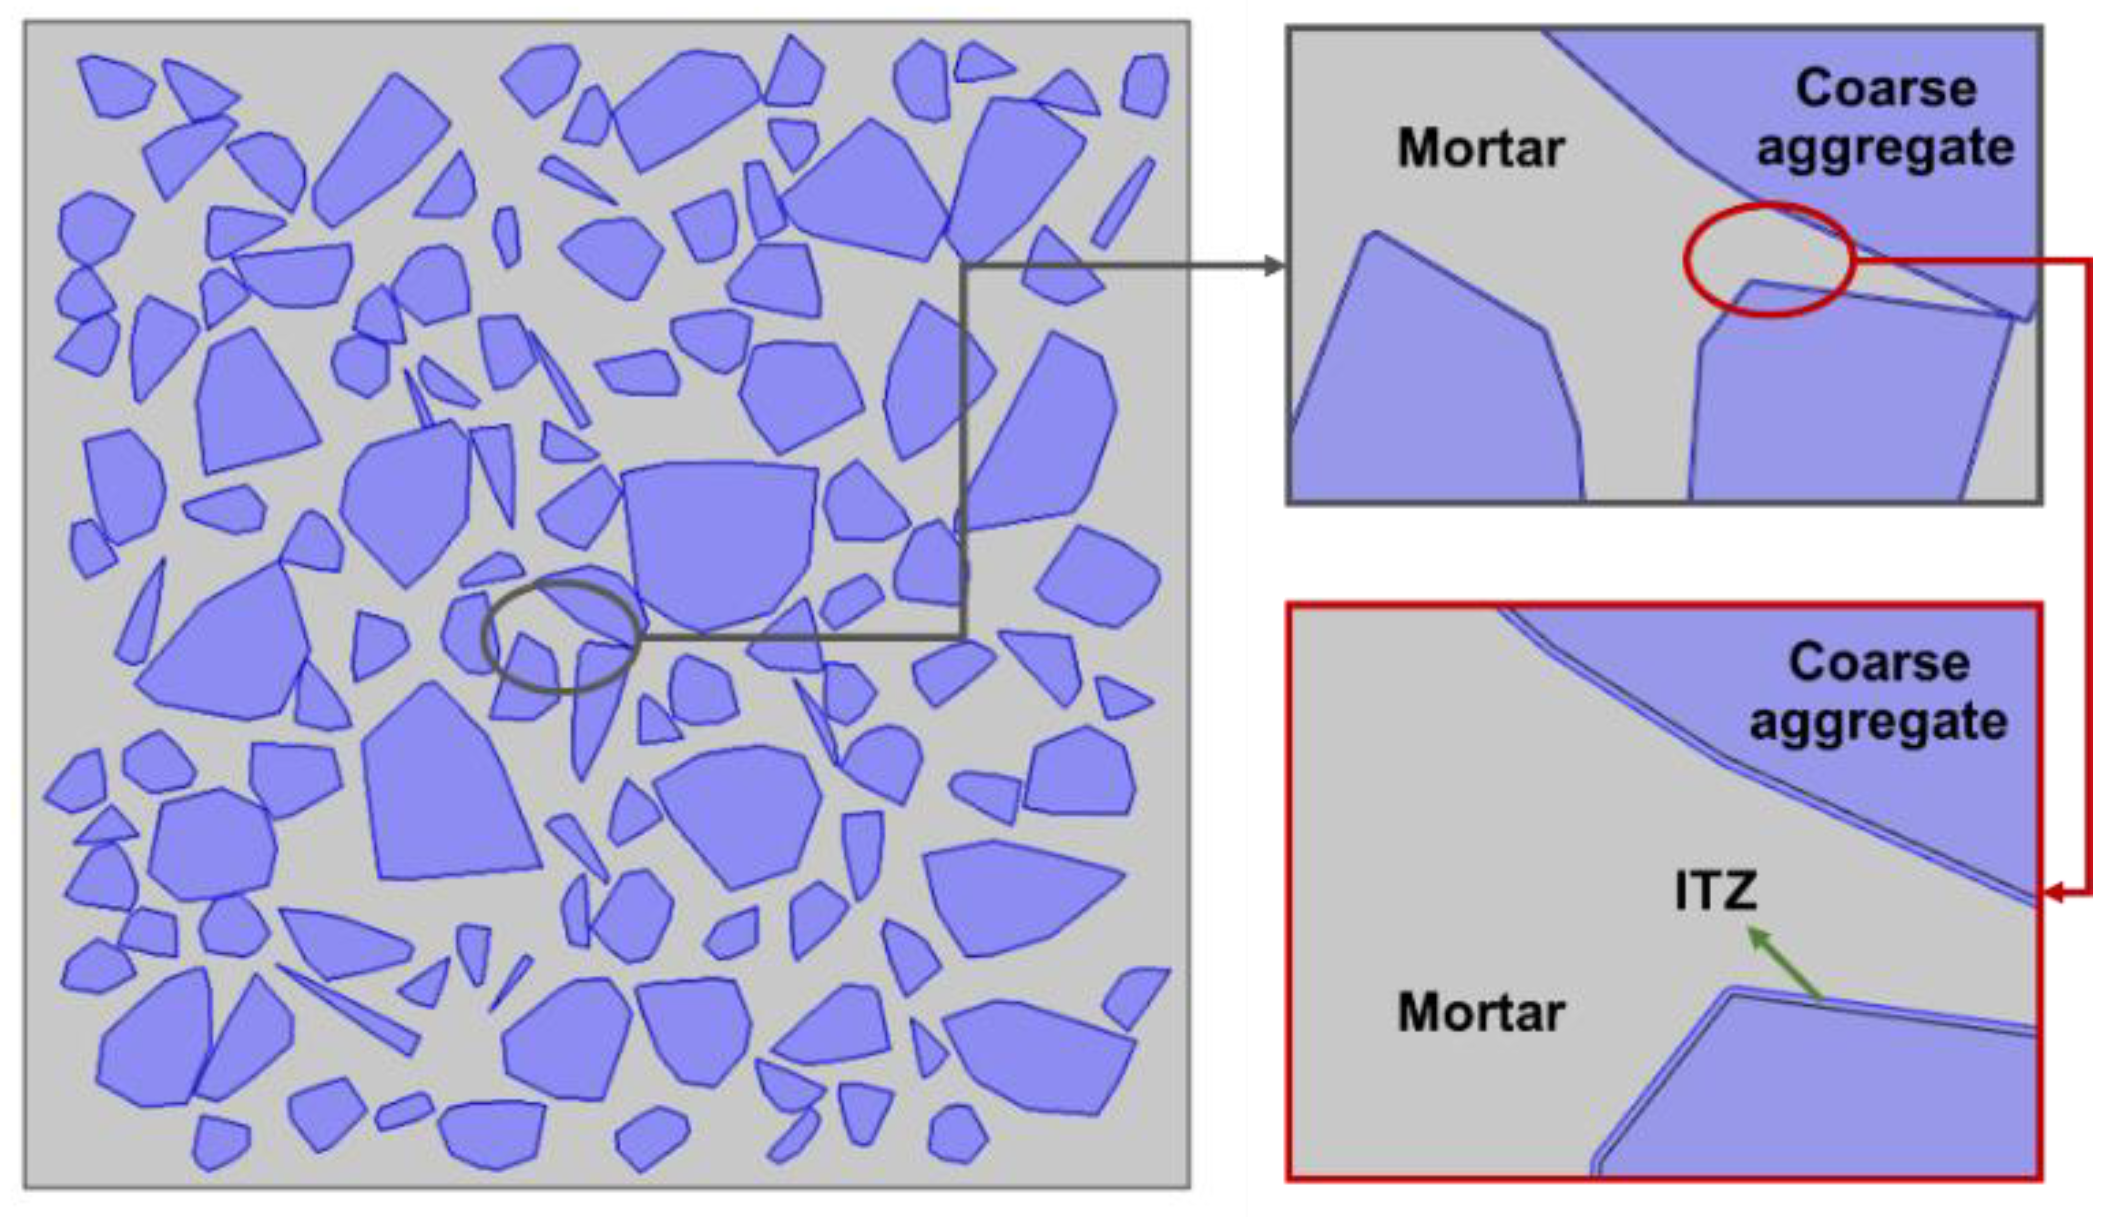
3. Numerical Simulation Method for Chloride Diffusion in a Mesoscopic Model of Concrete

In practical engineering, it can be considered that chloride intrusion into concrete is a natural and relatively long-term behavior. Physical experimental studies on long-term chloride diffusion will not only require substantial time but also consume more manpower, material, and financial resources [33,44]. Consequently, a mesoscopic simulation method for numerical models of concrete is suggested to replace some physical experiments to investigate the long-term diffusion progress of chloride ions in concrete [44]. Most of the existing concrete numerical models based on the finite element method simplify heterogeneous concrete composite materials into isotropous uniform diffusion media. This assumption is quite different from the actual situation.
Coarse aggregate is generally one of the main components for concrete composites, and its shape, volume fraction, particle grading, and random distribution within mortar should be comprehensively considered in the mesoscopic numerical model for concrete. In addition, the ITZ is regarded as the loosest zone in concrete, which easily cracks under a series of external loads compared with the mortar phase [37,45].
For this paper’s studies, considering the mesoscopic structure of multiphase composites, mesoscopic models of concrete with convex polygonal coarse aggregates are established based on the Monte Carlo stochastic simulation algorithm. In particular, the ITZs are thought to have a uniform distribution on the surface of the coarse aggregate, the ITZ thicknesses remain consistent, and the two phases of the coarse aggregate and ITZ are completely wrapped inside the mortar phase in the model, as shown in Figure 4.

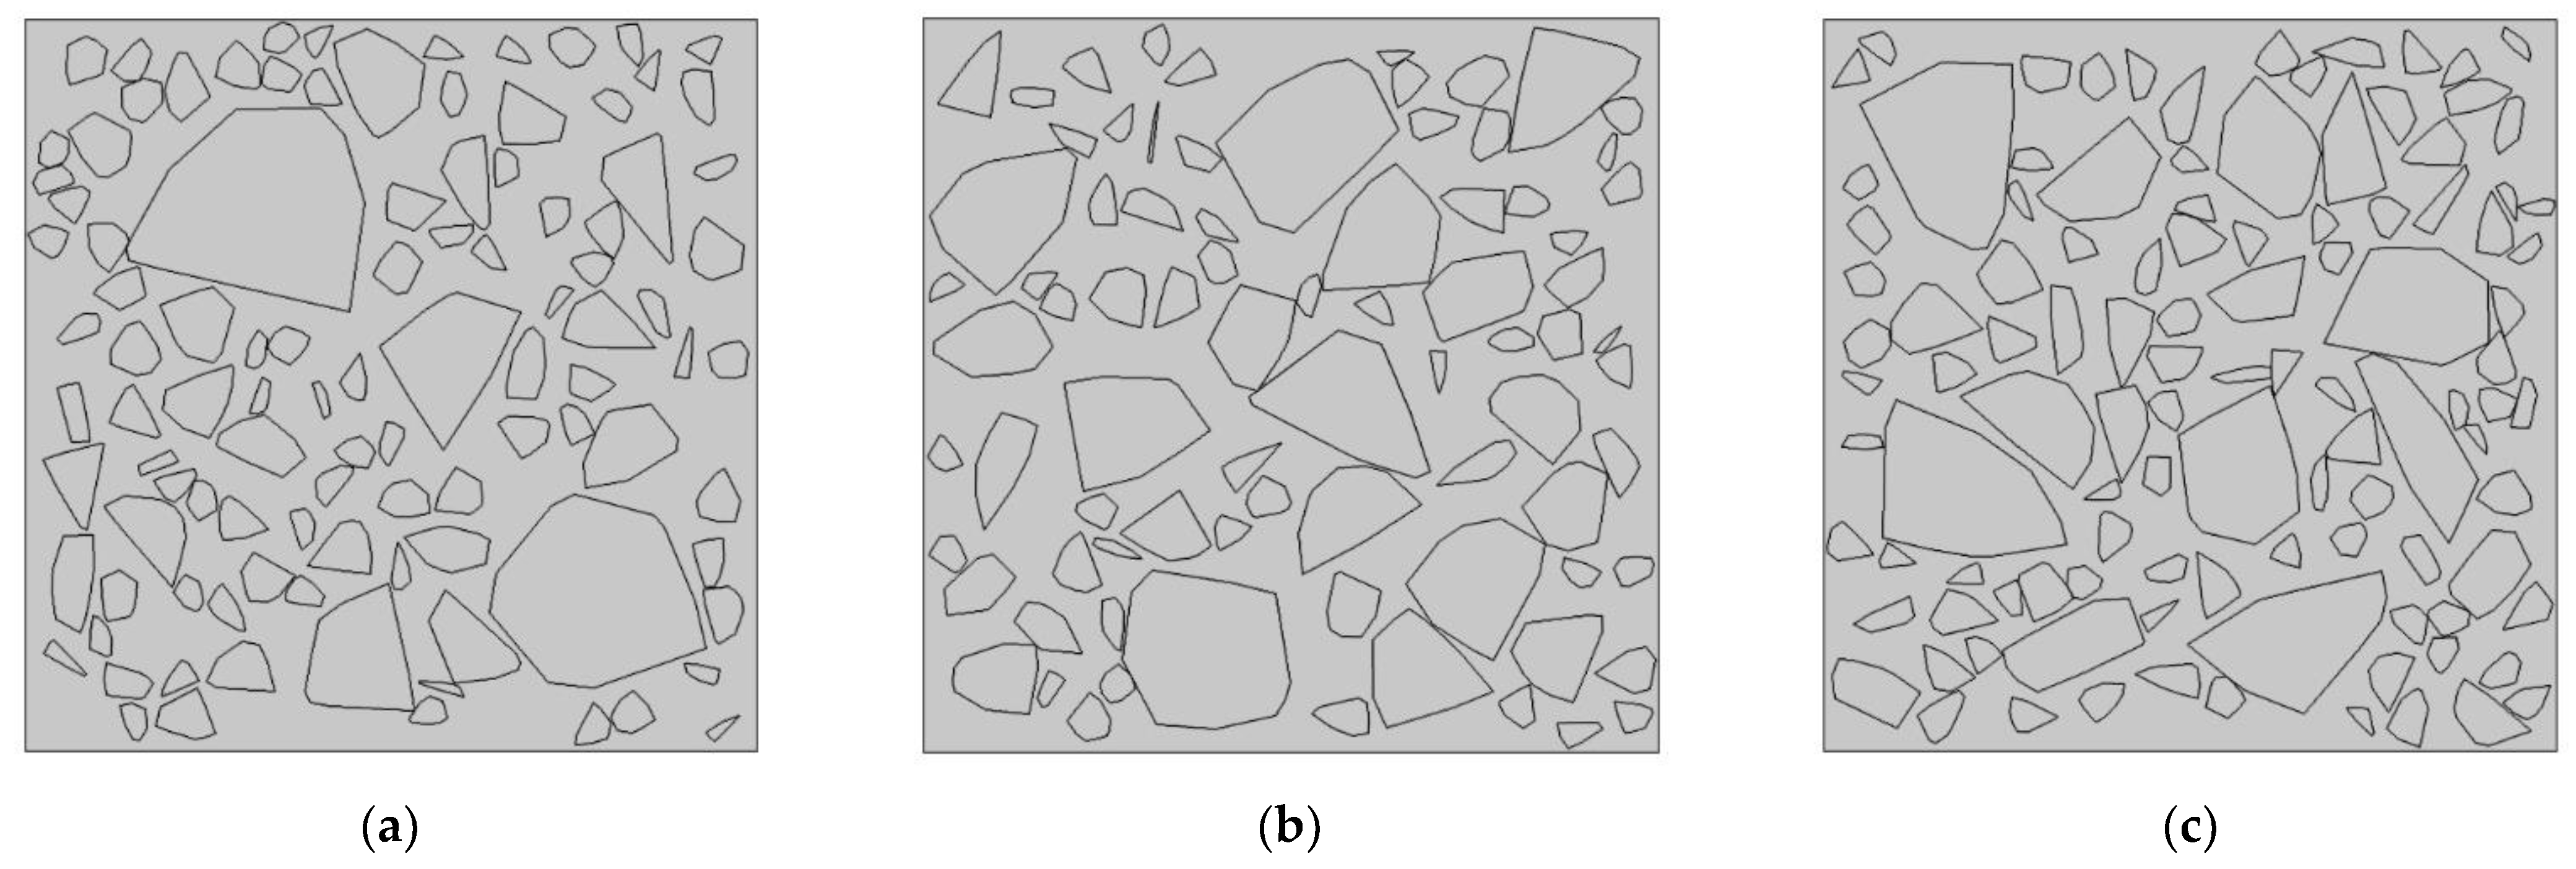
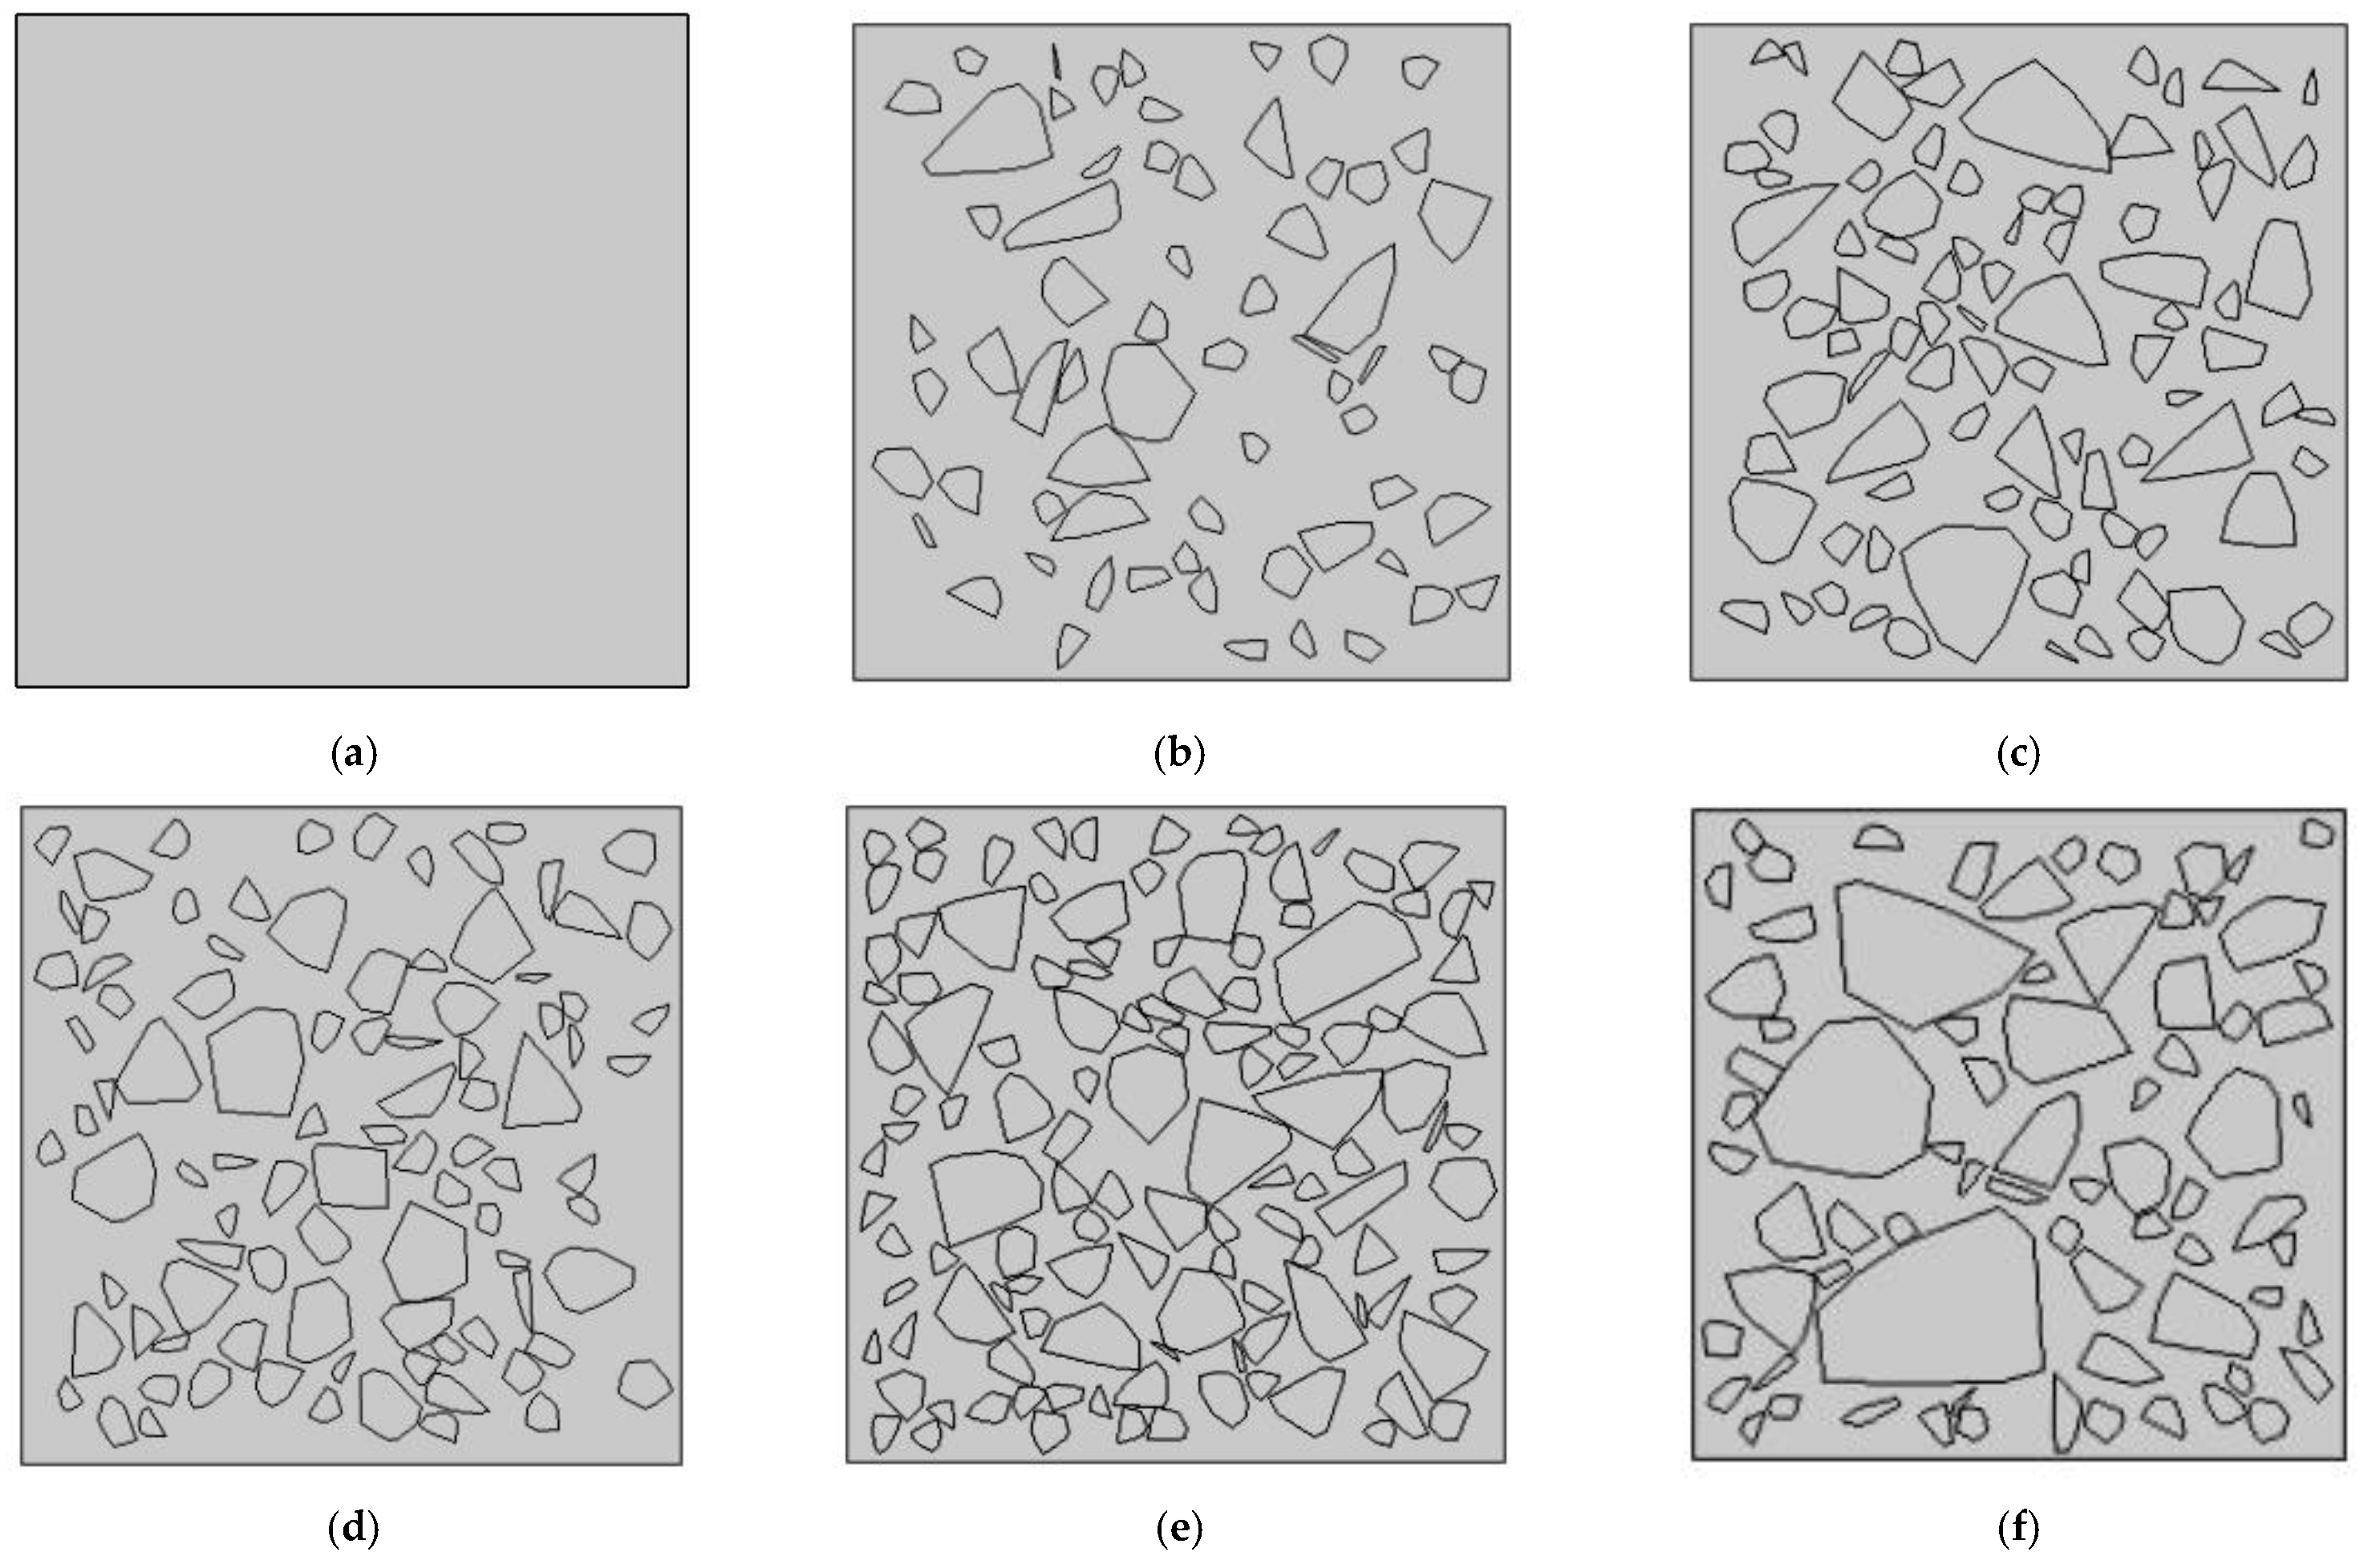
3.1. Mesoscopic Numerical Model for Concrete

The mesoscopic numerical model for concrete with different w/c is built in the form of a square of 100 × 100 mm2, as shown in Figure 5. The w/c values and VFCAs within the mesoscopic numerical models of concrete in Section 3 are all consistent with the concrete specimens of the indoor exposure experiment elaborated in Table 2 of Section 2. Noticeably, 10 parallel samples are taken for any mesoscopic numerical model of concrete; namely, each of the simulation analysis values of chloride concentration represent an average chloride concentration of 10 parallel samples.

3.2. Initial Conditions, Boundary Conditions, and Chloride Diffusion Coefficients in Various Phases for the Mesoscopic Numerical Model of Concrete

3.2.1. Initial and Boundary Conditions for the Numerical Concrete Model

During the numerical simulation process, it is assumed that there is no initial chloride content in the mesoscopic numerical model of concrete. Therefore, the initial chloride concentration at any concrete model is set as C(x > 0, t = 0) = C0 = 0. In addition, the left border position of the numerical model is set as the chloride diffusion surface with Cs, and the other three borders are set according to the flux-free property to ensure one-dimensional chloride diffusion behavior in the mesoscopic numerical model for concrete. Based on the physical experiment in Section 2, the time-dependency of Cs is Cs(t) = 0.2427·ln(t) − 0.4888, as shown in Table 3.

3.2.2. Chloride Diffusion Coefficients in Various Phases for the Numerical Model of Concrete

The coarse aggregate phase in concrete composites is generally regarded as impermeable; thus, its apparent chloride diffusion coefficient is set as Dca = 0 m2/s. For the ITZ phase, the ITZ thickness, i.e., titz = 0.05 mm, is selected as representative during the numerical simulation process [37]. The ITZ chloride diffusion coefficient is defined as Ditz(t) = Nitz·Dm(t), where Ditz(t) is the time-dependent chloride diffusion coefficient of the ITZ and Nitz denotes the normalized chloride diffusion coefficient of the ITZ. According to the normalized ITZ chloride diffusion coefficient model proposed by the literature [37], when the ITZ thickness titz = 0.05 mm and the MSCA Smax = 40 mm, the normalized ITZ chloride diffusivities with different w/c values are Nitz(w/c = 0.4, Vca = 0.415) = 45.483; Nitz(w/c = 0.5, Vca = 0.439) = 44.567; and Nitz(w/c = 0.6, Vca = 0.454) = 43.913. Ultimately, the chloride diffusion coefficient for the mortar phase in concrete is Dm(t) = [D28m/(1 − m)]·(t28/t)m, where the D28m and m values are shown in Table 3.

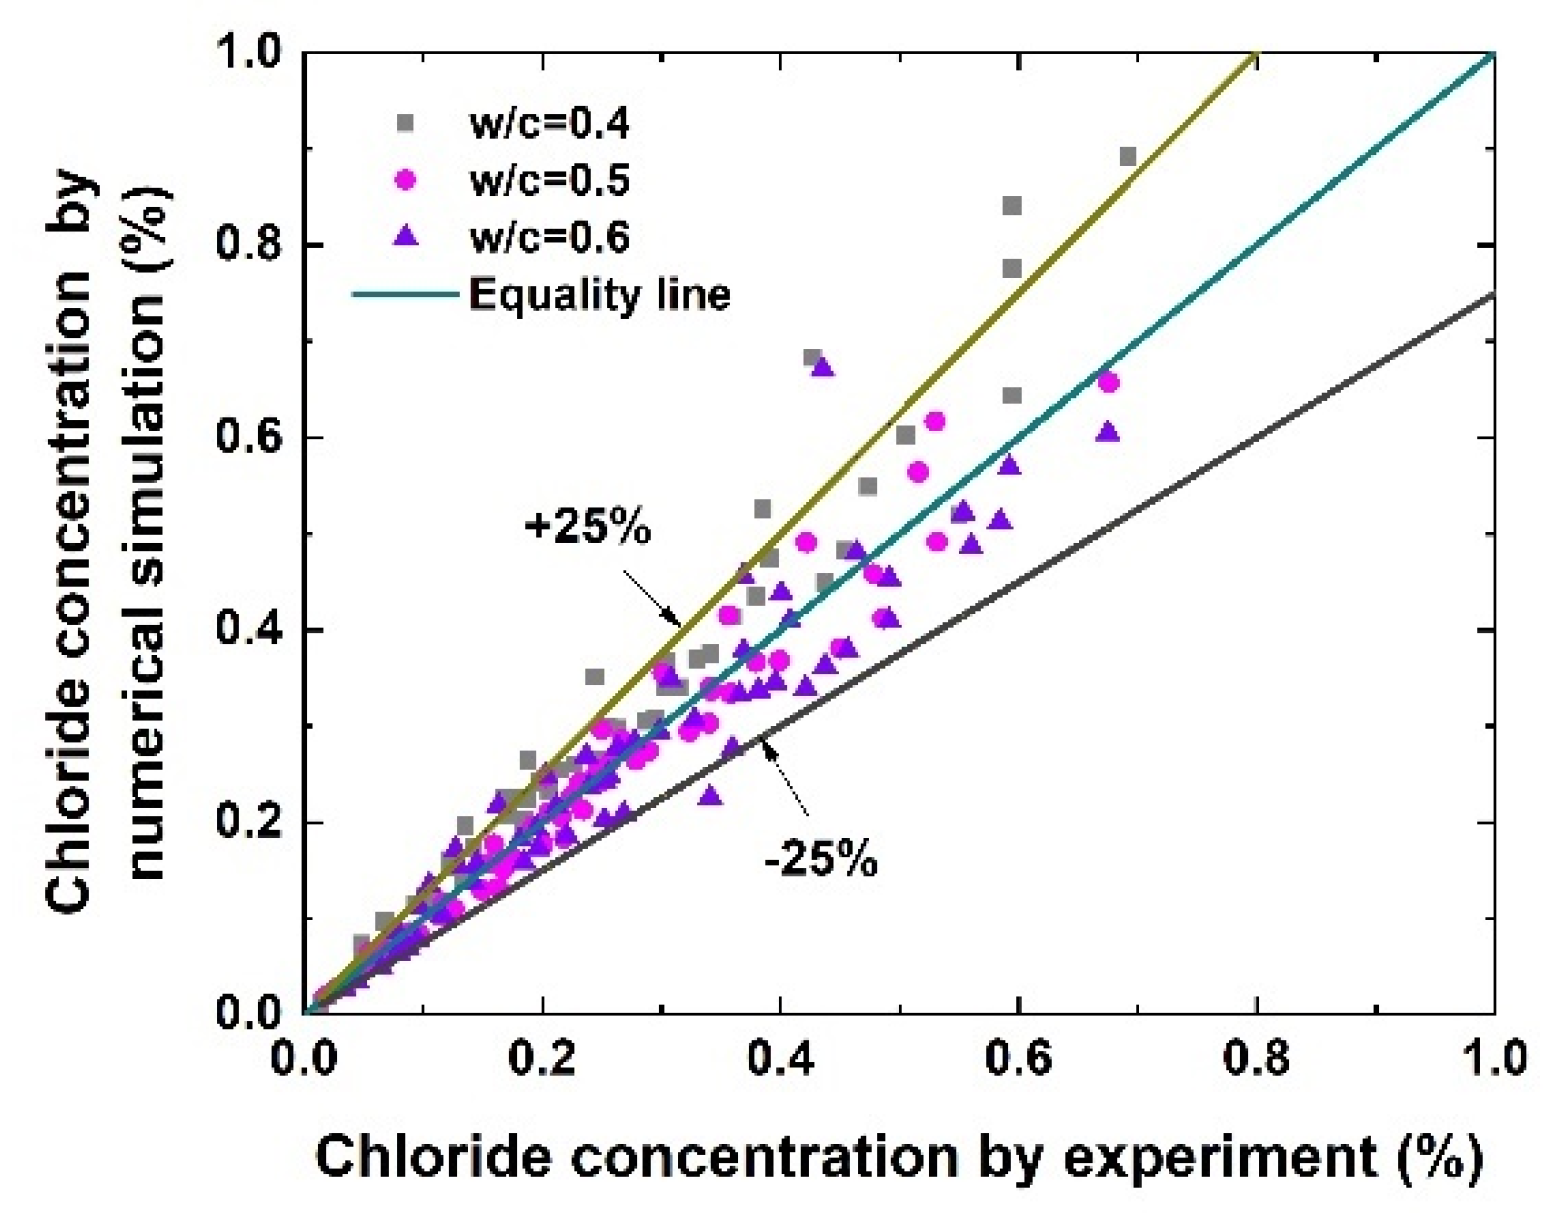
3.3. Validation of the Mesoscopic Numerical Simulation Method for Chloride Diffusion in Concrete Models

The simulated calculating time is set from ti = 0 day to te = 700 days, and the time step is 1 d. After the computation process is finished, the simulated chloride concentrations at various depths in the numerical models of concrete are determined. The diffusion depths are the same as those in the indoor exposure experiment in Section 2.3. Moreover, the chloride profiles determined by numerical simulation (NSVs) and the experiment (EVs) are shown in Figure 6. In addition, the chloride concentration results confirmed by the mesoscopic models of concrete versus the tested values via indoor experiments are plotted in Figure 7.
From Figure 6 and Figure 7, we can see that the numerical simulation values of chloride concentration exhibit good agreement with the experimental measurements, and the relative errors between the two methods are all within a ±25% range, which validates the accuracy of the mesoscopic numerical simulation method.
Therefore, in practical engineering, the mesoscopic numerical simulation method can be reasonably adopted to assess the chloride distribution in RC structures. In addition, if the significant chloride diffusion parameters of the uniform mortar phase in concrete multiphase composites are obtained, the chloride diffusion behavior in concrete may be accurately estimated. Furthermore, the mesoscopic numerical simulation method is suggested to replace some physical experiments for exploring the chloride distribution within concrete while considering the influences of material factors (including w/c, coarse aggregate shape, coarse aggregate volume fraction, coarse aggregate particle grading, and random distribution) to improve the efficiency of scientific research.

4. Numerical Simulation Experiment of Chloride Transport in a Mesoscopic Concrete Model Considering Material Factors

On the basis of the mesoscopic numerical simulation method for concrete, this paper intends to carry out mesoscale numerical simulation experiments for concrete considering concrete material factors and to further explore the influences of a series of concrete multiphase composite material factors on the chloride transport behavior and diffusion characteristics.

4.1. Impact Factors for the Numerical Simulation Experiment

Considering the concrete material factors, mesoscopic numerical models of concrete with different water-to-cement ratios w/c = 0.4, 0.5, and 0.6, different VFCAs Vca = 0, 0.1, 0.2, 0.3, and 0.4, and MSCAs Smax = 10, 16, 20, 25, 31.5, and 40 mm were established, and mesoscopic numerical simulation experiments of chloride diffusion in concrete models were carried out. The specific simulation conditions are as follows in Table 4.
Figure 8 exhibits the mesoscopic numerical model examples of concrete for Vca = 0, 0.3, 0.4 and Smax = 20, 25 mm. To ensure the accuracy of the numerical simulation results, when Vca ≠ 0, the average chloride concentrations for 10 model parallel samples are considered as the final simulation results.

4.2. Chloride Diffusion Coefficients for the Mesoscopic Numerical Models of Concrete

In the numerical simulation experiment for chloride diffusion in mesoscopic models of concrete, the initial conditions, boundary conditions, and the chloride diffusion coefficients of the mortar phase are still consistent with Section 3.2; in particular, the normalized ITZ chloride diffusivities are as shown in Table 5, which were determined by Equation (8) in the literature [37].

5. Results and Analysis

5.1. Influences of Concrete Material Factors on Chloride Profiles

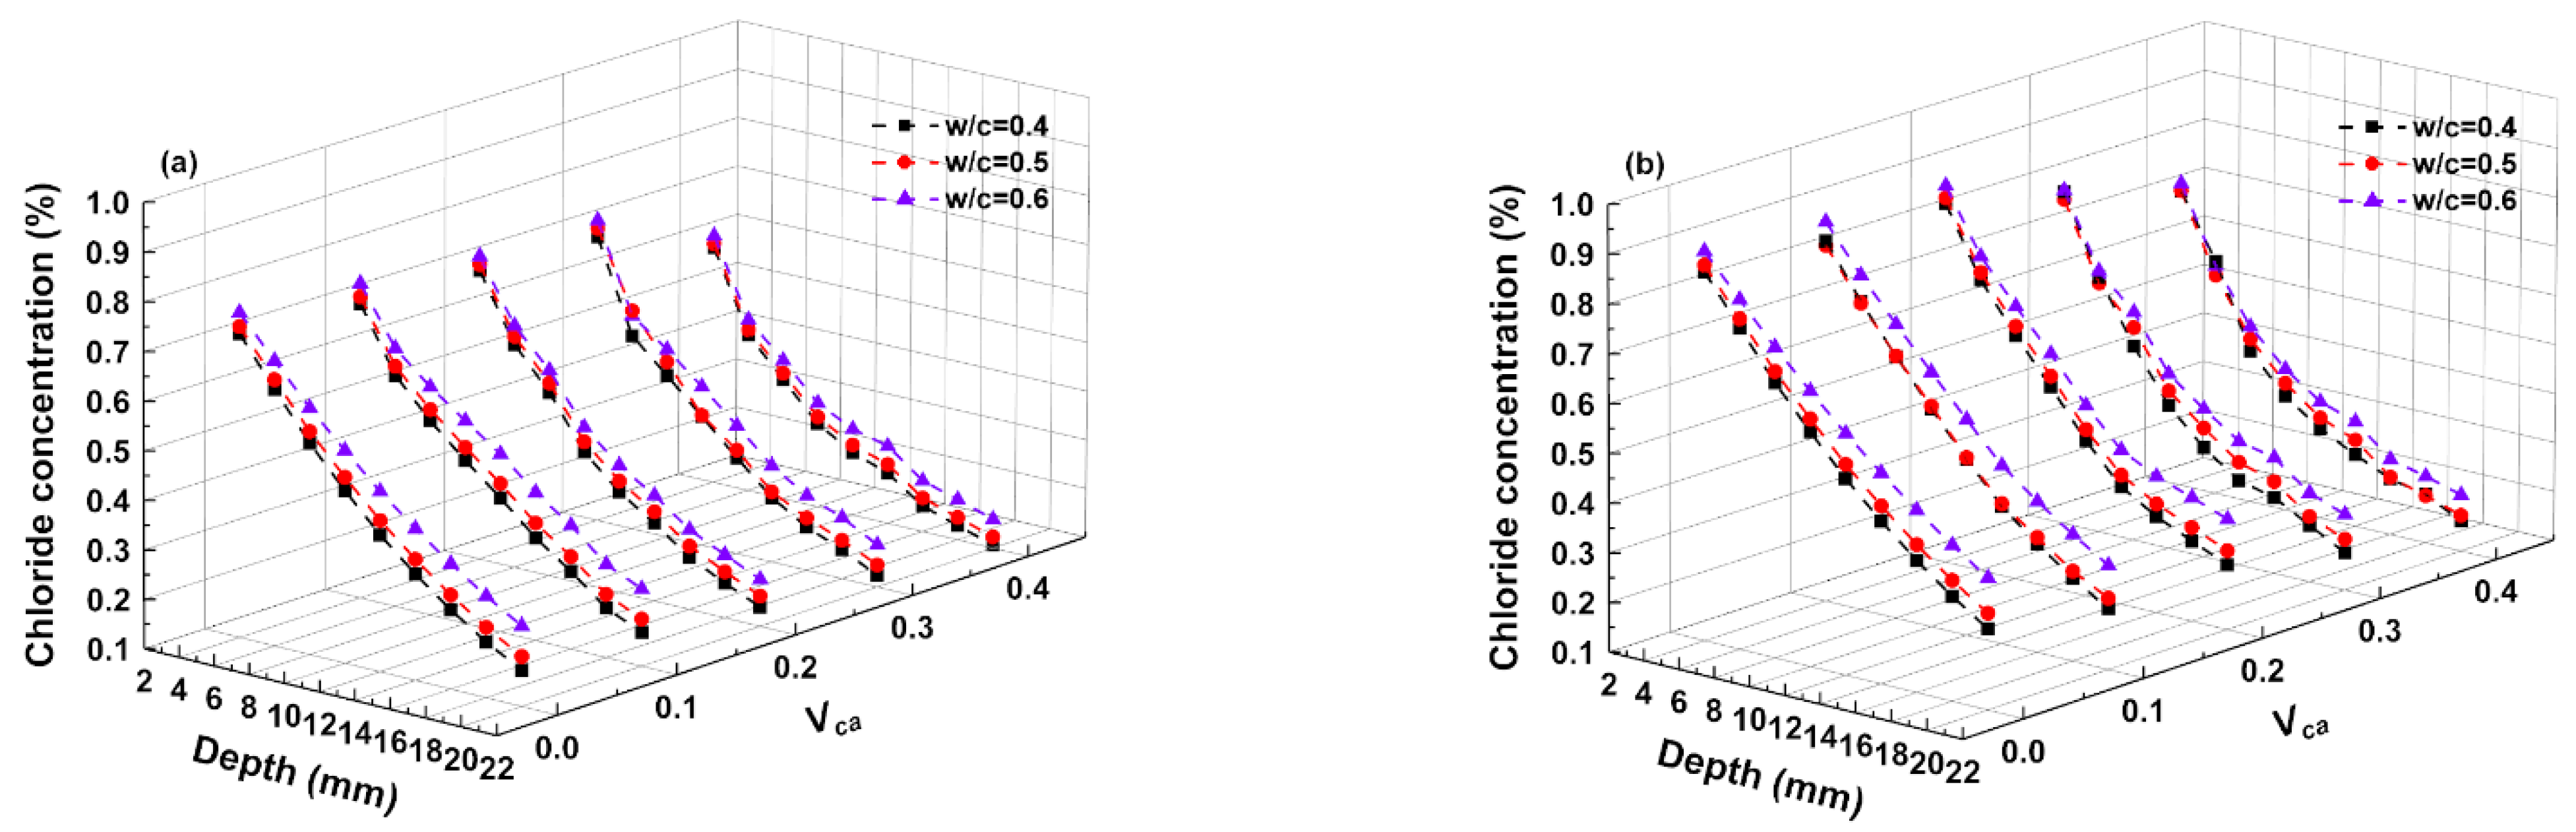
5.1.1. Influence of Water-to-Cement Ratio, w/c

Figure 9 illustrates the chloride profiles in mesoscopic numerical models of concrete with different w/c values for exposure times t = 360 and 600 days, MSCAs Smax = 20 and 25 mm, and VFCAs Vca = 0, 0.1, 0.2, 0.3, 0.4.
It can be determined from the figures that under the same exposure time t, the chloride concentration in the mesoscopic numerical model for concrete increases gradually with increasing w/c, which fully demonstrates that the w/c factor will significantly affect the chloride concentration distribution. Quantitatively, when Vca = 0.4, Smax = 20 mm, the chloride concentration C(x = 4 mm, t = 600 days) increases almost 2.3% with the increasing of w/c from 0.4 to 0.6. When the w/c is larger, the capillary pore structure and microfracture channels in mortar are greater, which is more conducive to the transmission and chloride diffusion in concrete.

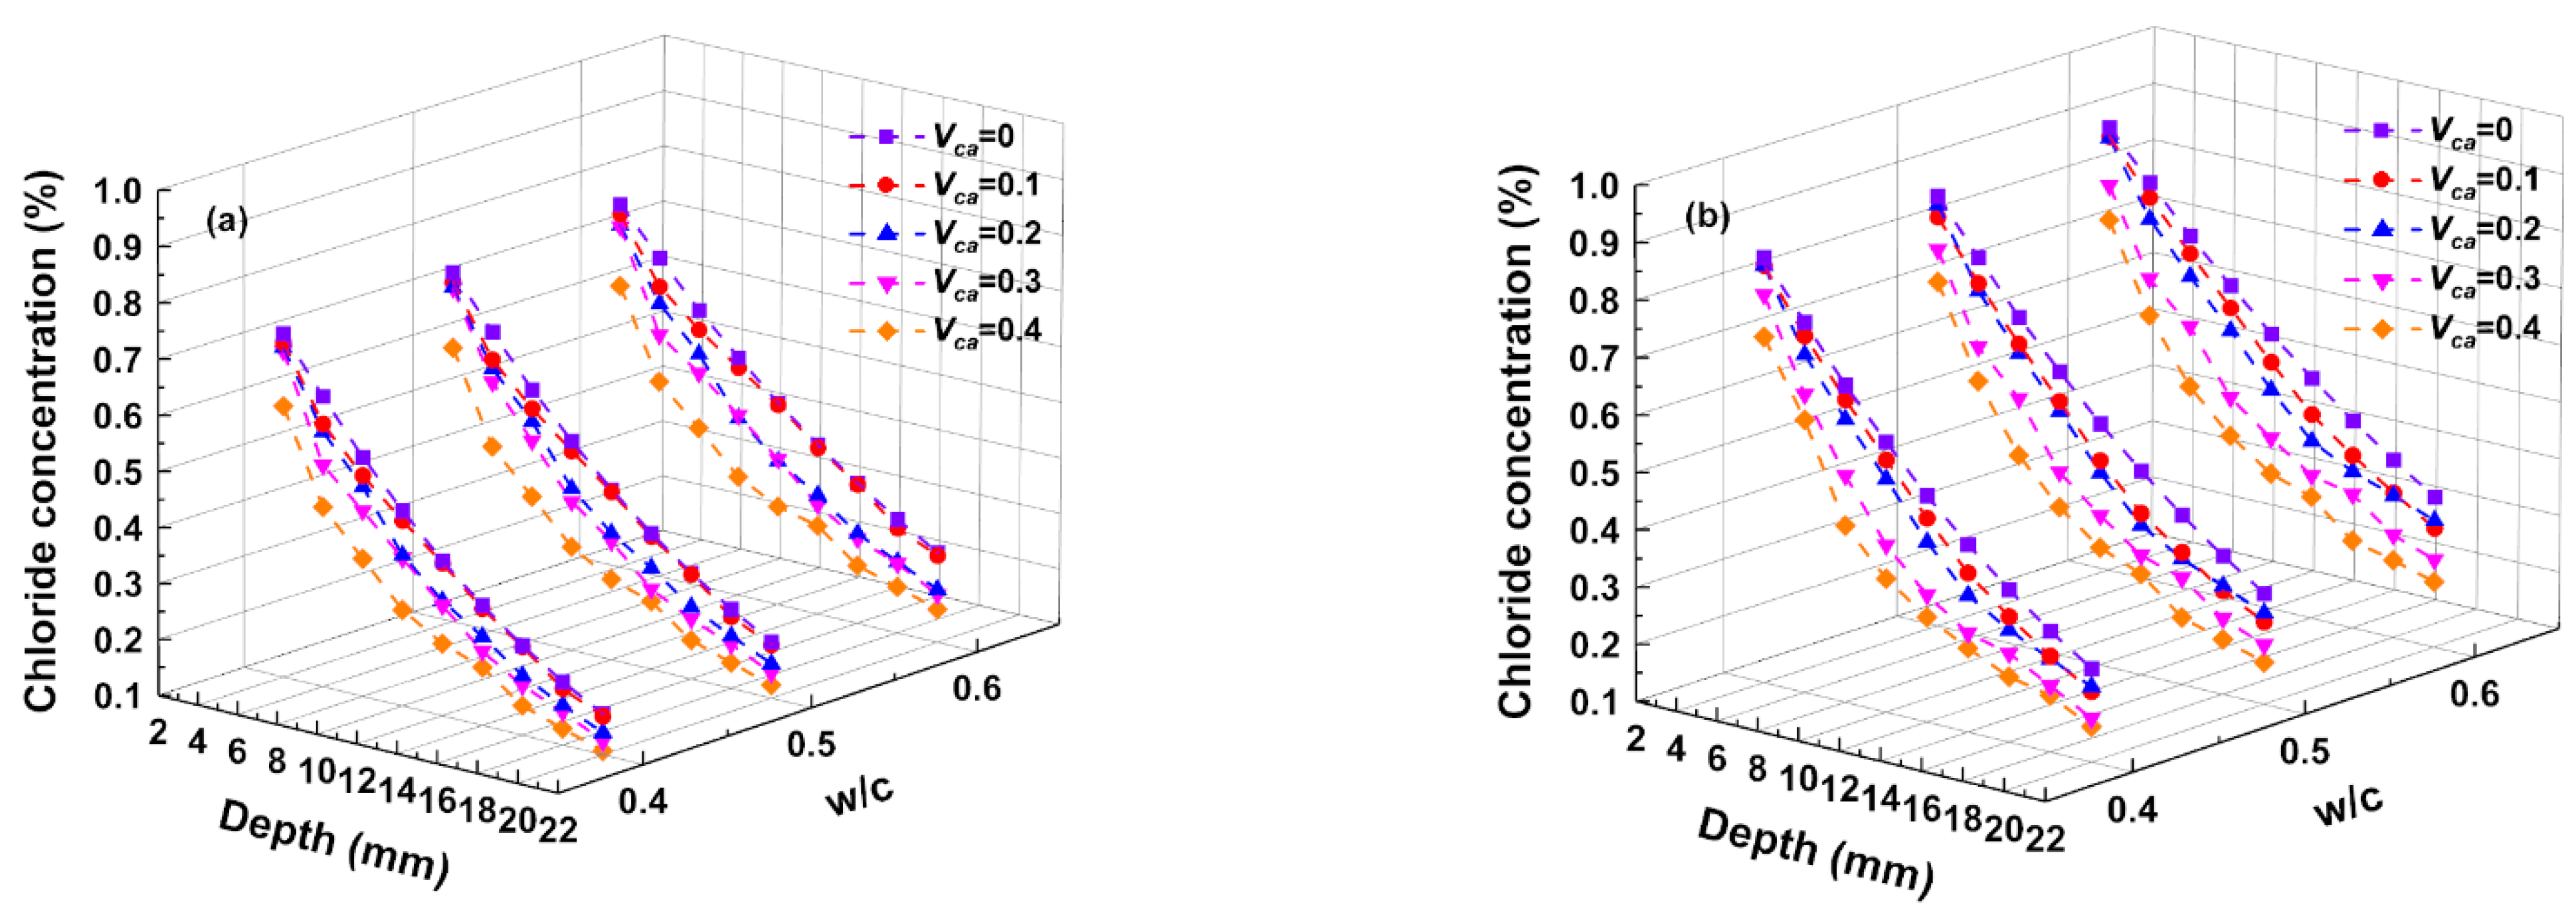
5.1.2. Influence of VFCA, Vca

Figure 10 shows that the chloride concentrations gradually decrease with increasing Vca, and the greater Vca is, the greater the reduction in the chloride concentration in concrete. Especially, when w/c = 0.5, Smax = 20 mm, the chloride concentration C(x = 4 mm, t = 600 days) decreases almost 16.4% with the increasing of Vca from 0 to 0.4.

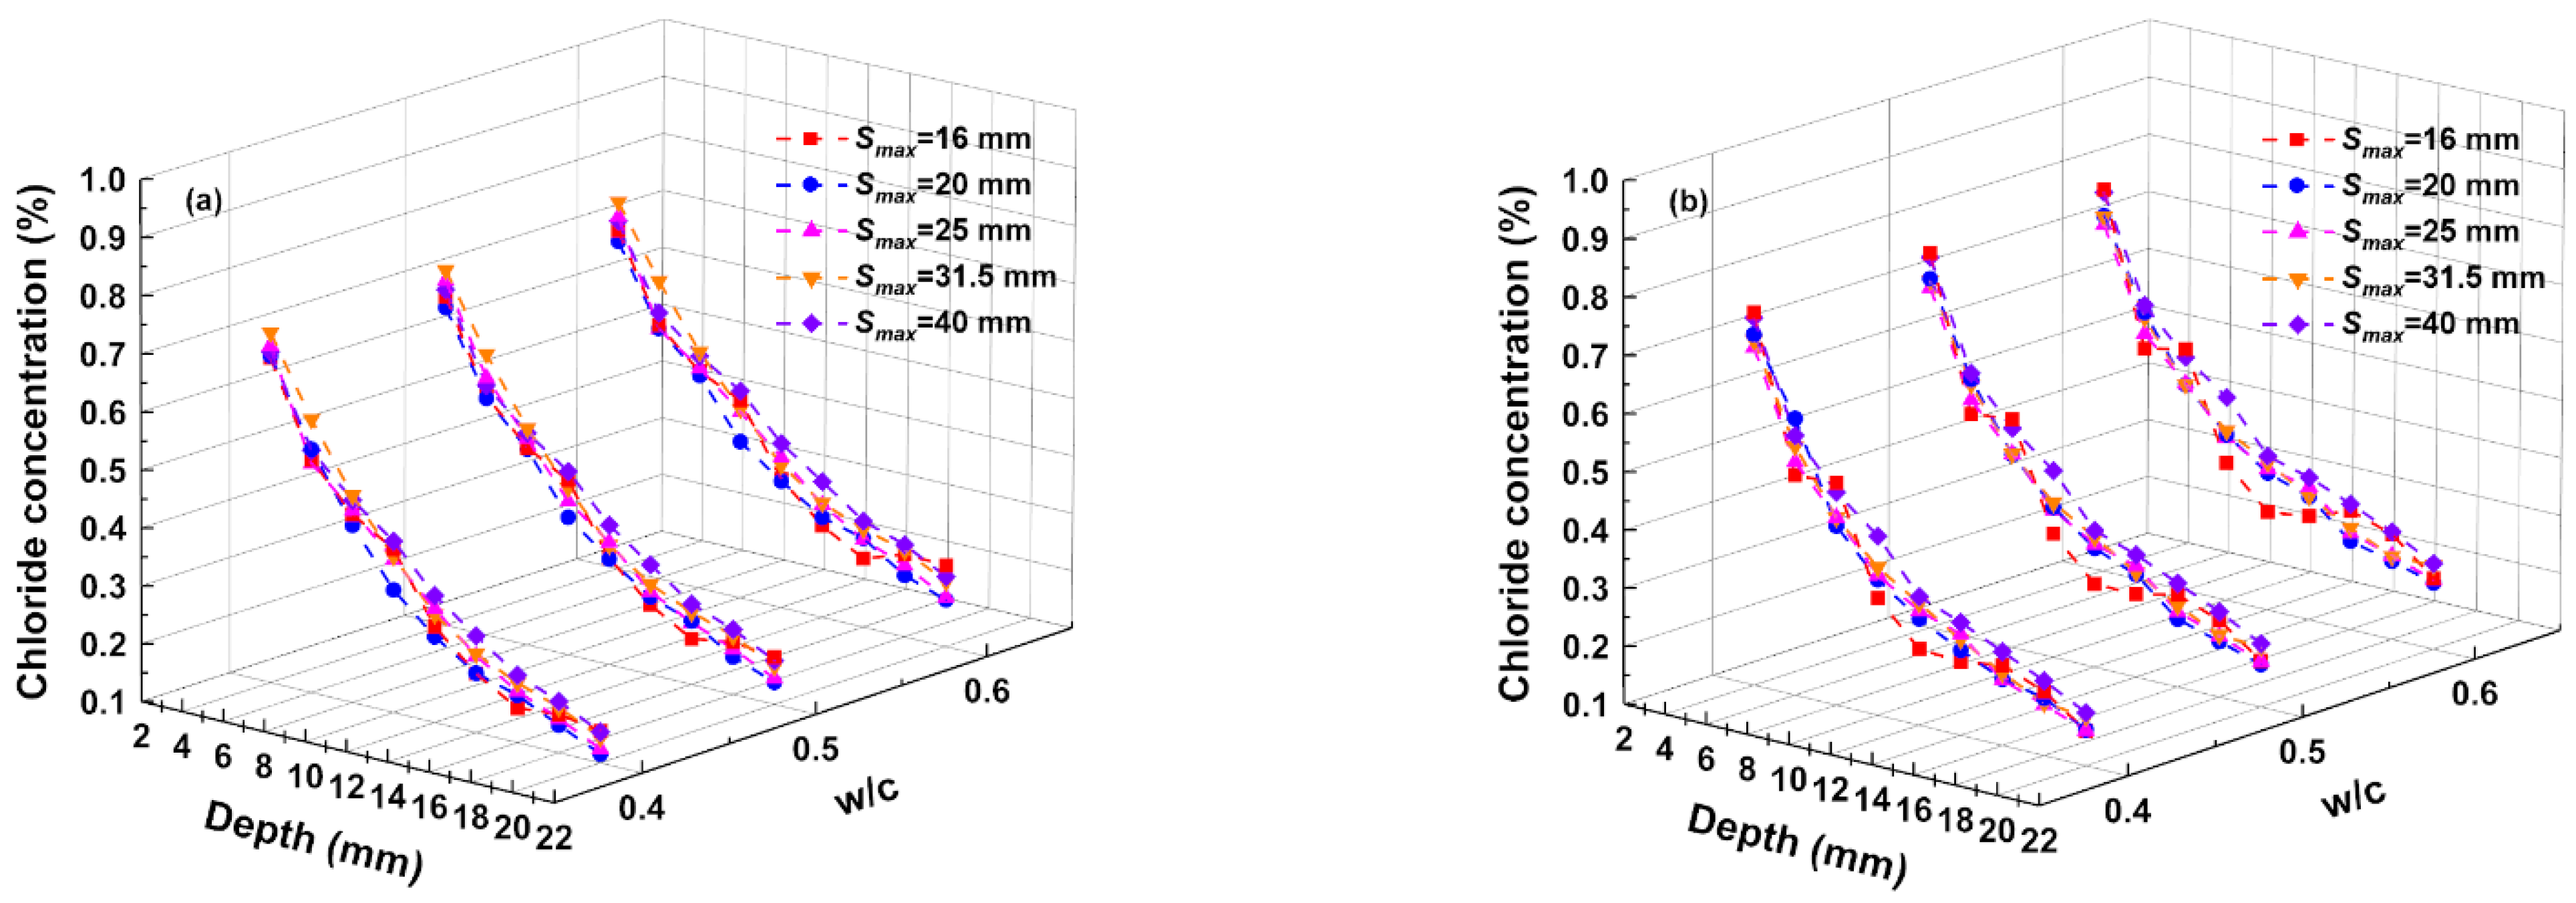
5.1.3. Influence of MSCA, Smax

Figure 11 shows the variation trend of the chloride concentrations in the mesoscopic numerical models for concrete with different Smax and w/c values, taking the calculated exposure times of t = 360 and 600 days, with Vca = 0.3 and 0.4. Obviously, under conditions of the same Vca, the chloride concentrations with different Smax values in concrete are not significantly different.

5.2. Influences of Concrete Material Factors on Surface Chloride Concentrations

The surface chloride concentration Cs values of the mesoscopic numerical model for concrete with different exposure times t, Vca, and Smax are all determined in accordance with fitting the closed-form solution of Fick’s second law, as expressed by Equation (1), to the tested chloride profiles shown in Figure 11 by using nonlinear regression analysis.

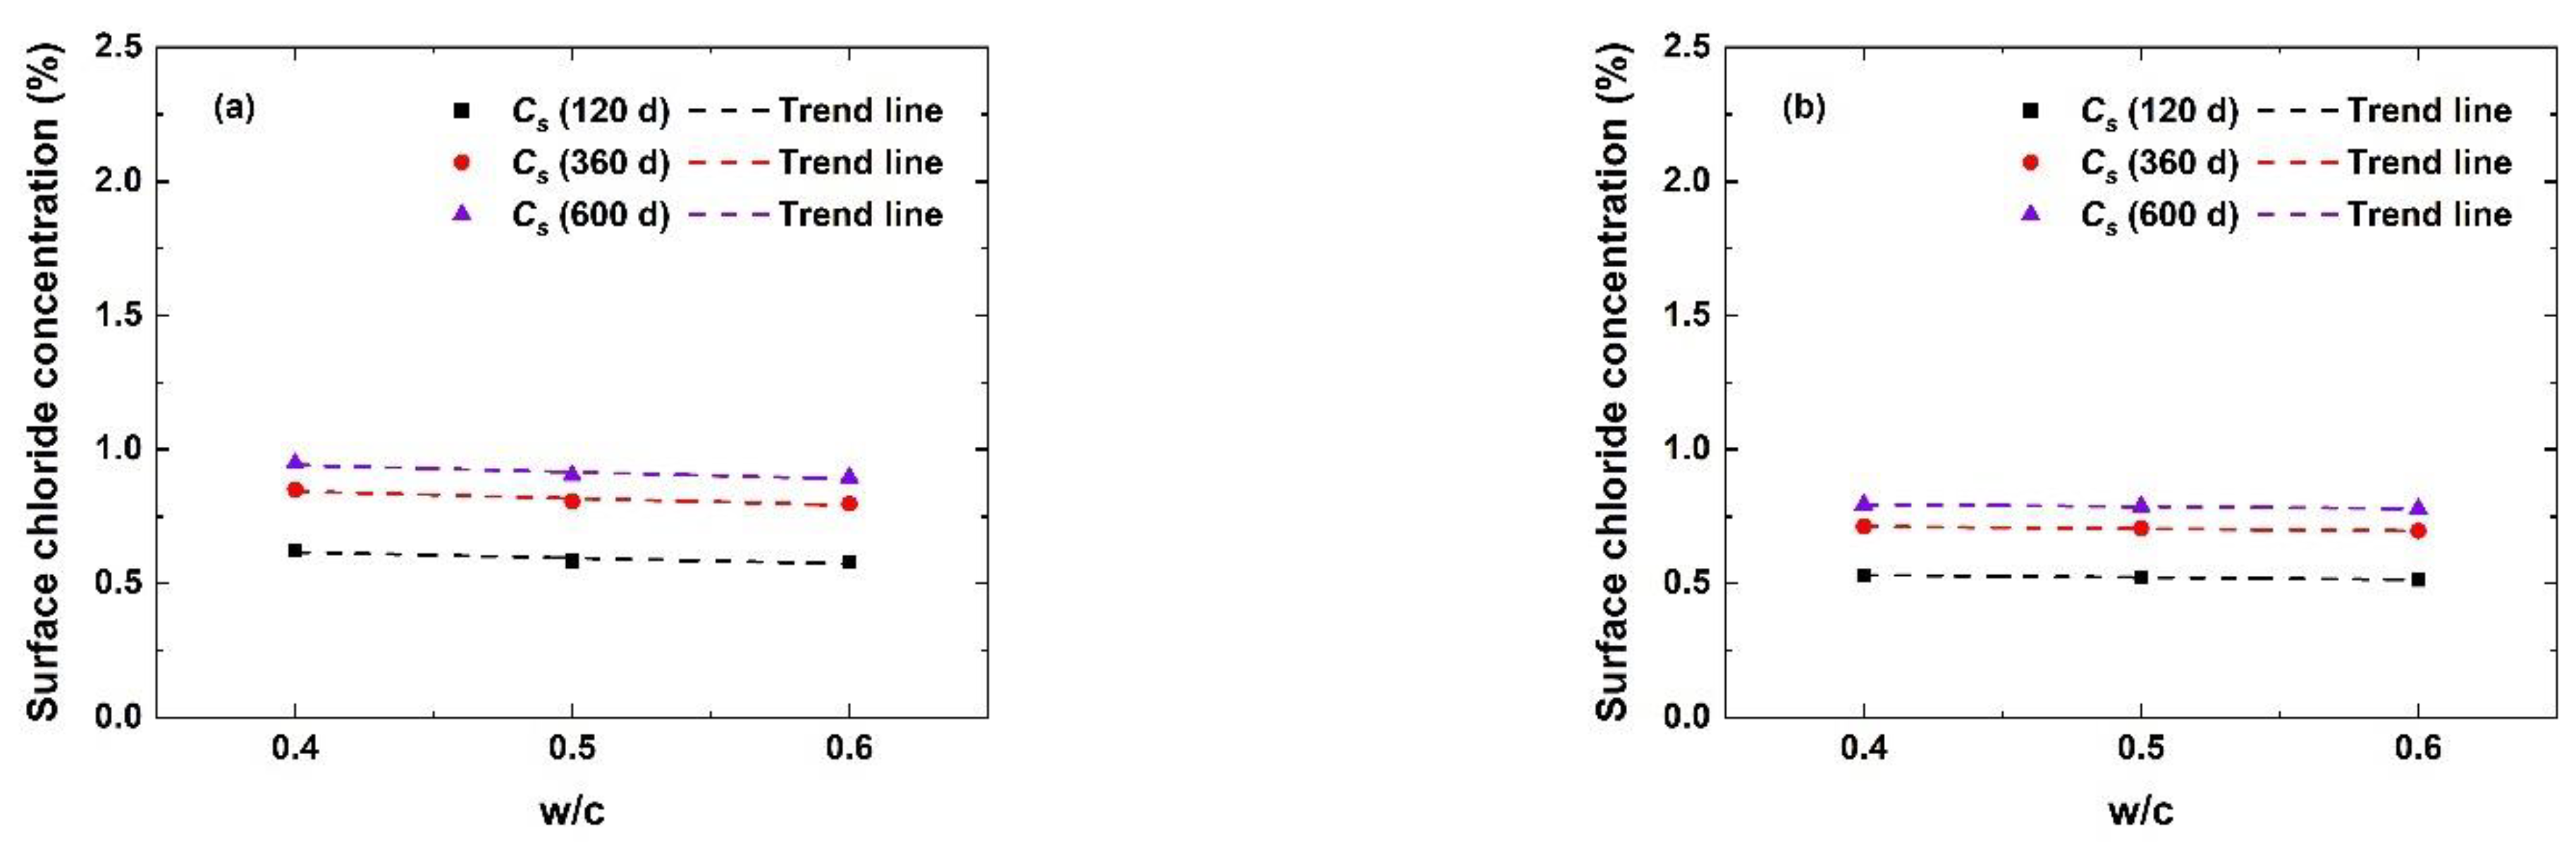
5.2.1. Influence of Water-to-Cement Ratio, w/c

The variations in Cs with increasing w/c are plotted in Figure 12. The figures include the computational exposure times t = 120, 360, and 600 days, Vca = 0.3, 0.4, and Smax= 20, 25 mm. Obviously, Cs is almost unchanged with the increase in w/c, which is consistent with the conclusion in Section 2.4 of this paper. Therefore, it is considered that the surface chloride concentration has no specific relation with w/c.

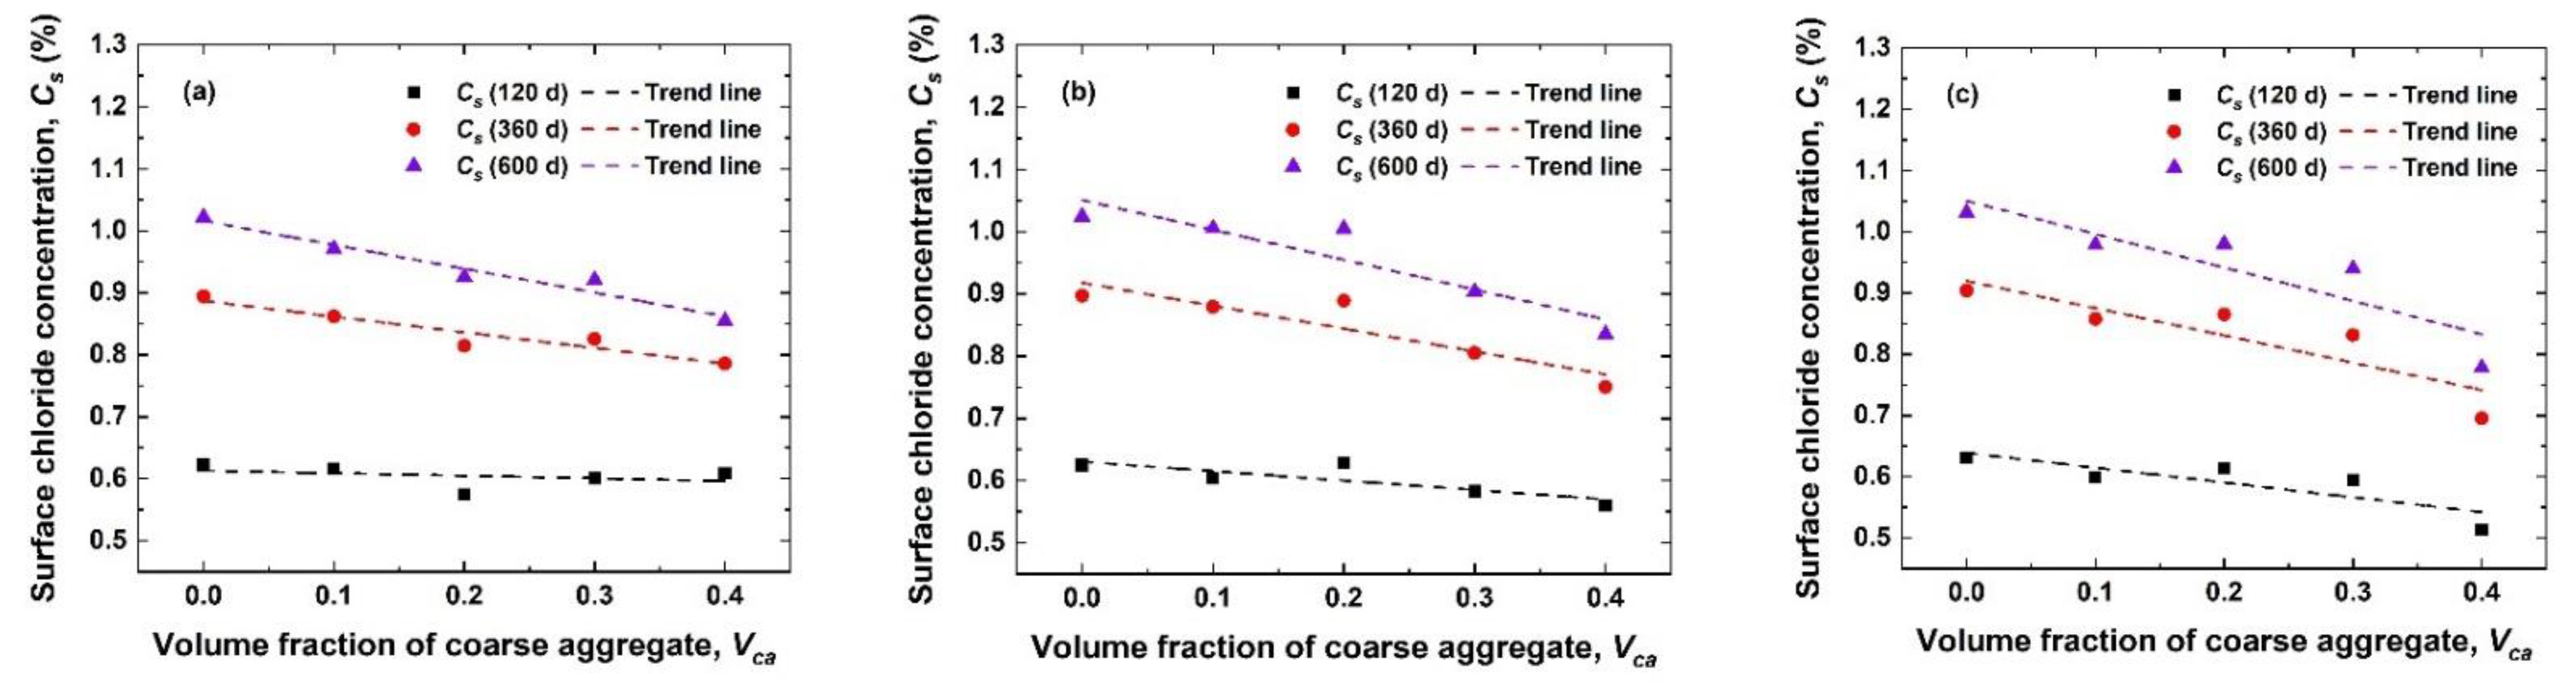
5.2.2. Influence of VFCA, Vca

Figure 13 illustrates the variation in Cs with Vca. In the figure, the computational exposure times are t = 120, 360, and 600 days, w/c = 0.4, 0.5, and 0.6, and Smax = 16 mm, 20 mm, and 25 mm. Figure 13 shows that the Cs of the mesoscopic numerical model for concrete decreases linearly with increasing Vca. This trend shows that the Vca factor will affect the Cs values. Especially, when w/c = 0.5, Smax = 20 mm, the Cs(t = 600 days) decreases almost 18.5% with the increasing of Vca from 0 to 0.4.

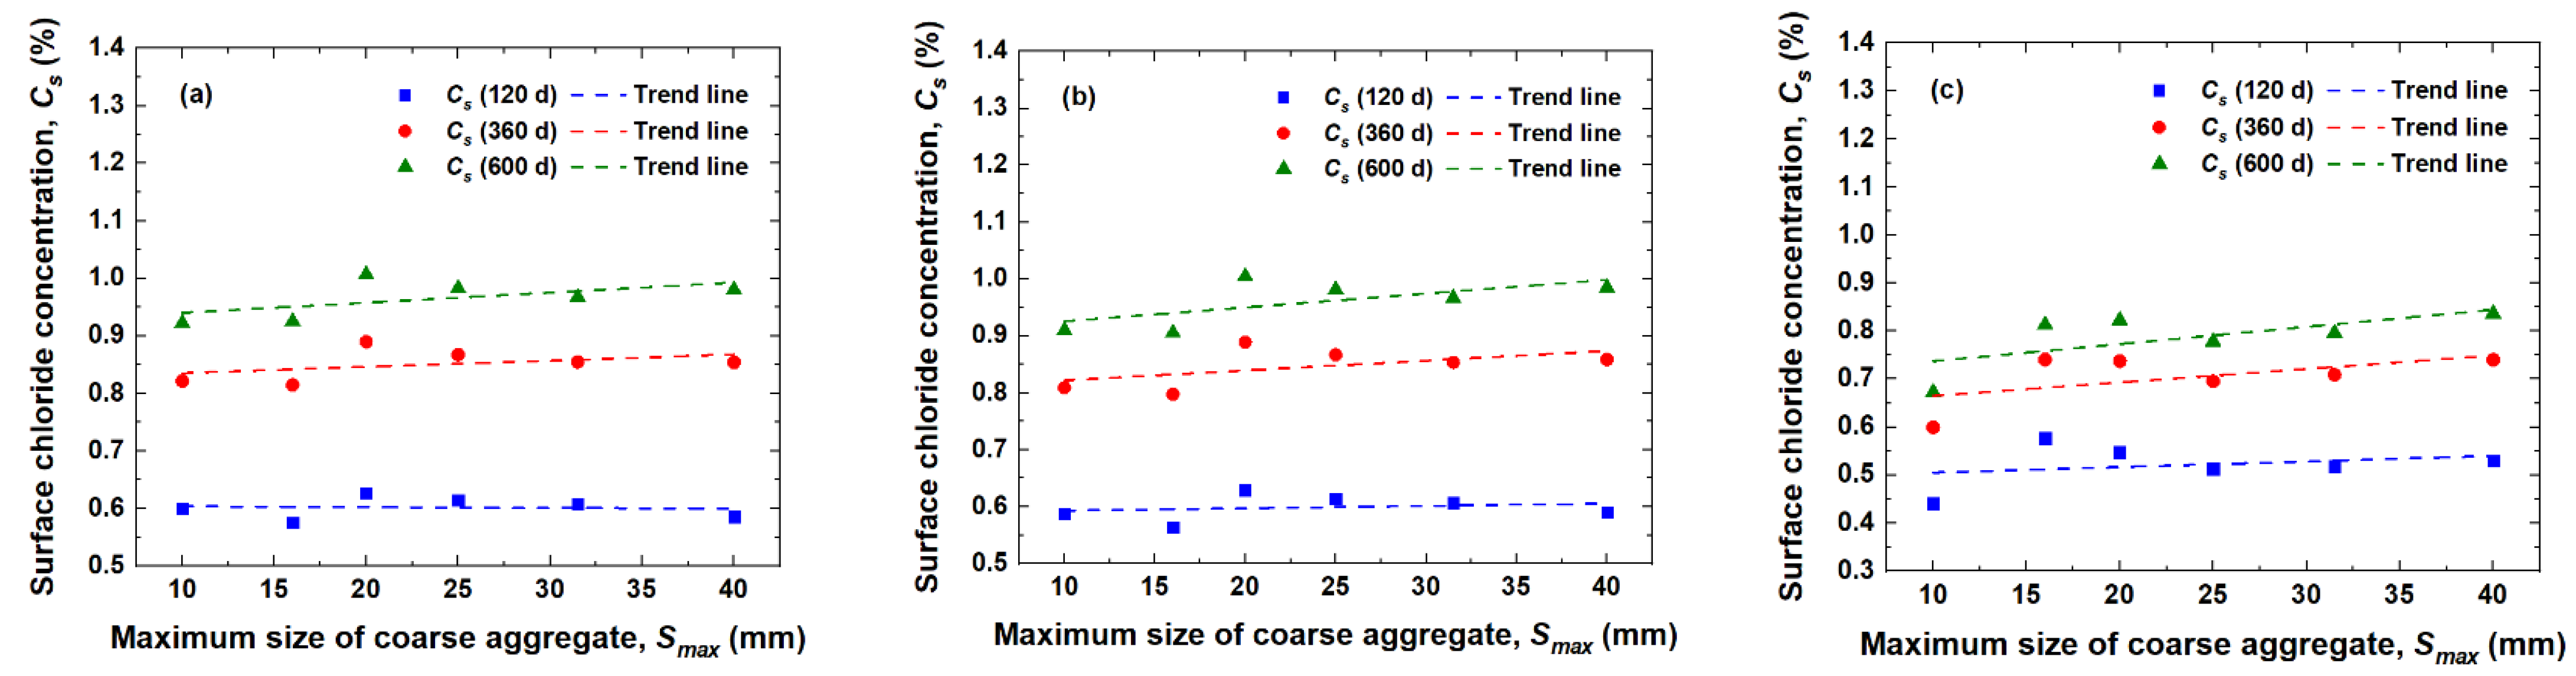
5.2.3. Influence of MSCA, Smax

Similarly, the variation in Cs with Smax in the mesoscopic numerical model for concrete is plotted in Figure 14. The computational exposure times are t = 120, 360, and 600 days, w/c = 0.4, 0.5, and 0.6, and Vca = 0.2, 0.3, and 0.4. Clearly, Cs increases nearly linearly with increasing Smax. This shows that Smax can affect the Cs values. Quantitatively, when w/c = 0.5, Vca = 0.4, the Cs(t = 600 days) increases almost 23.4% with the increasing of Smax from 10 mm to 40 mm. In addition, Cs increases with increasing exposure time t at different mesoscopic numerical models for concrete.

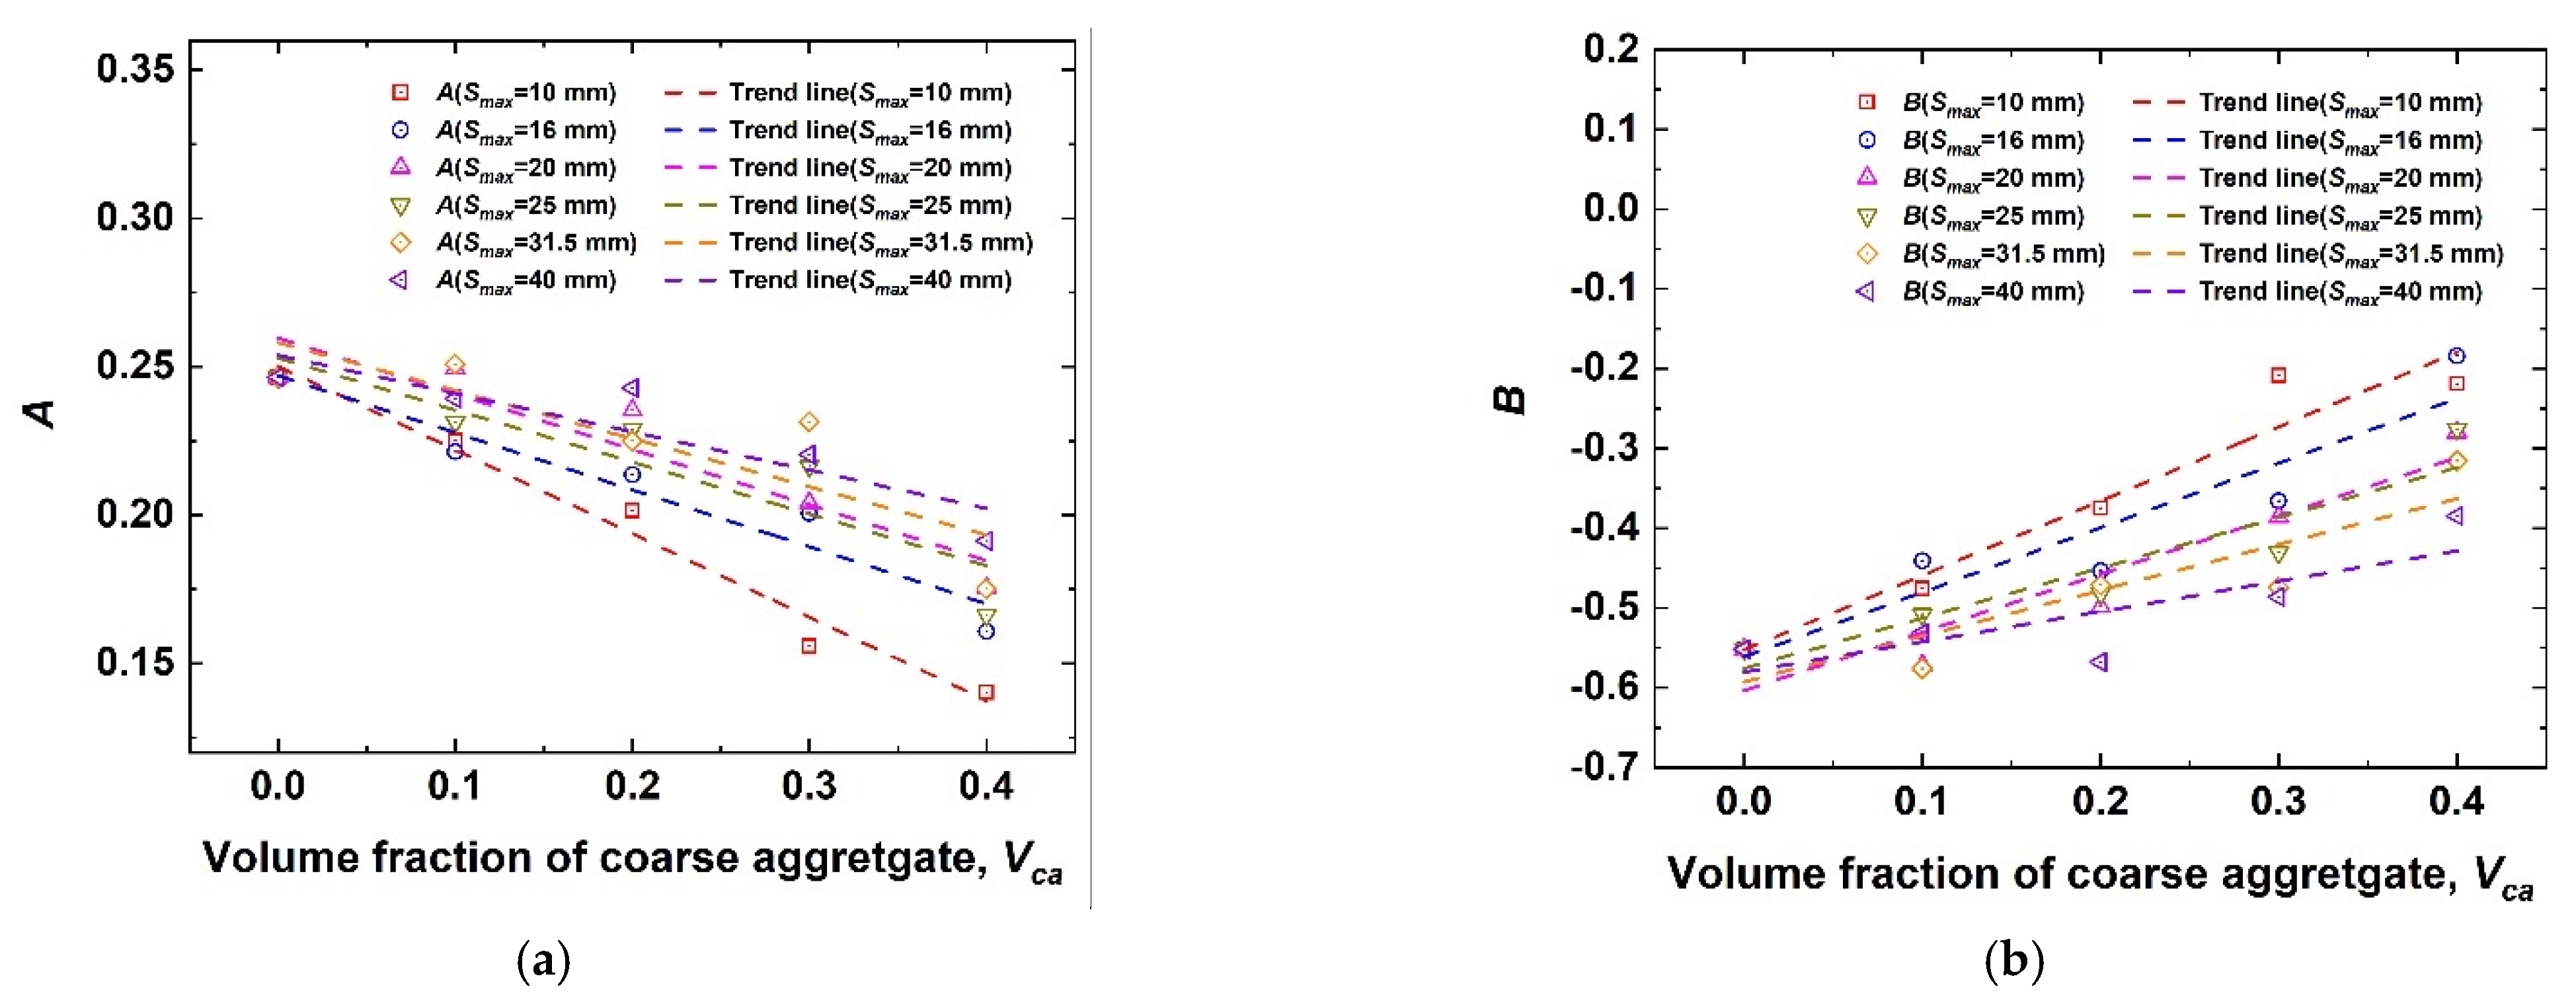
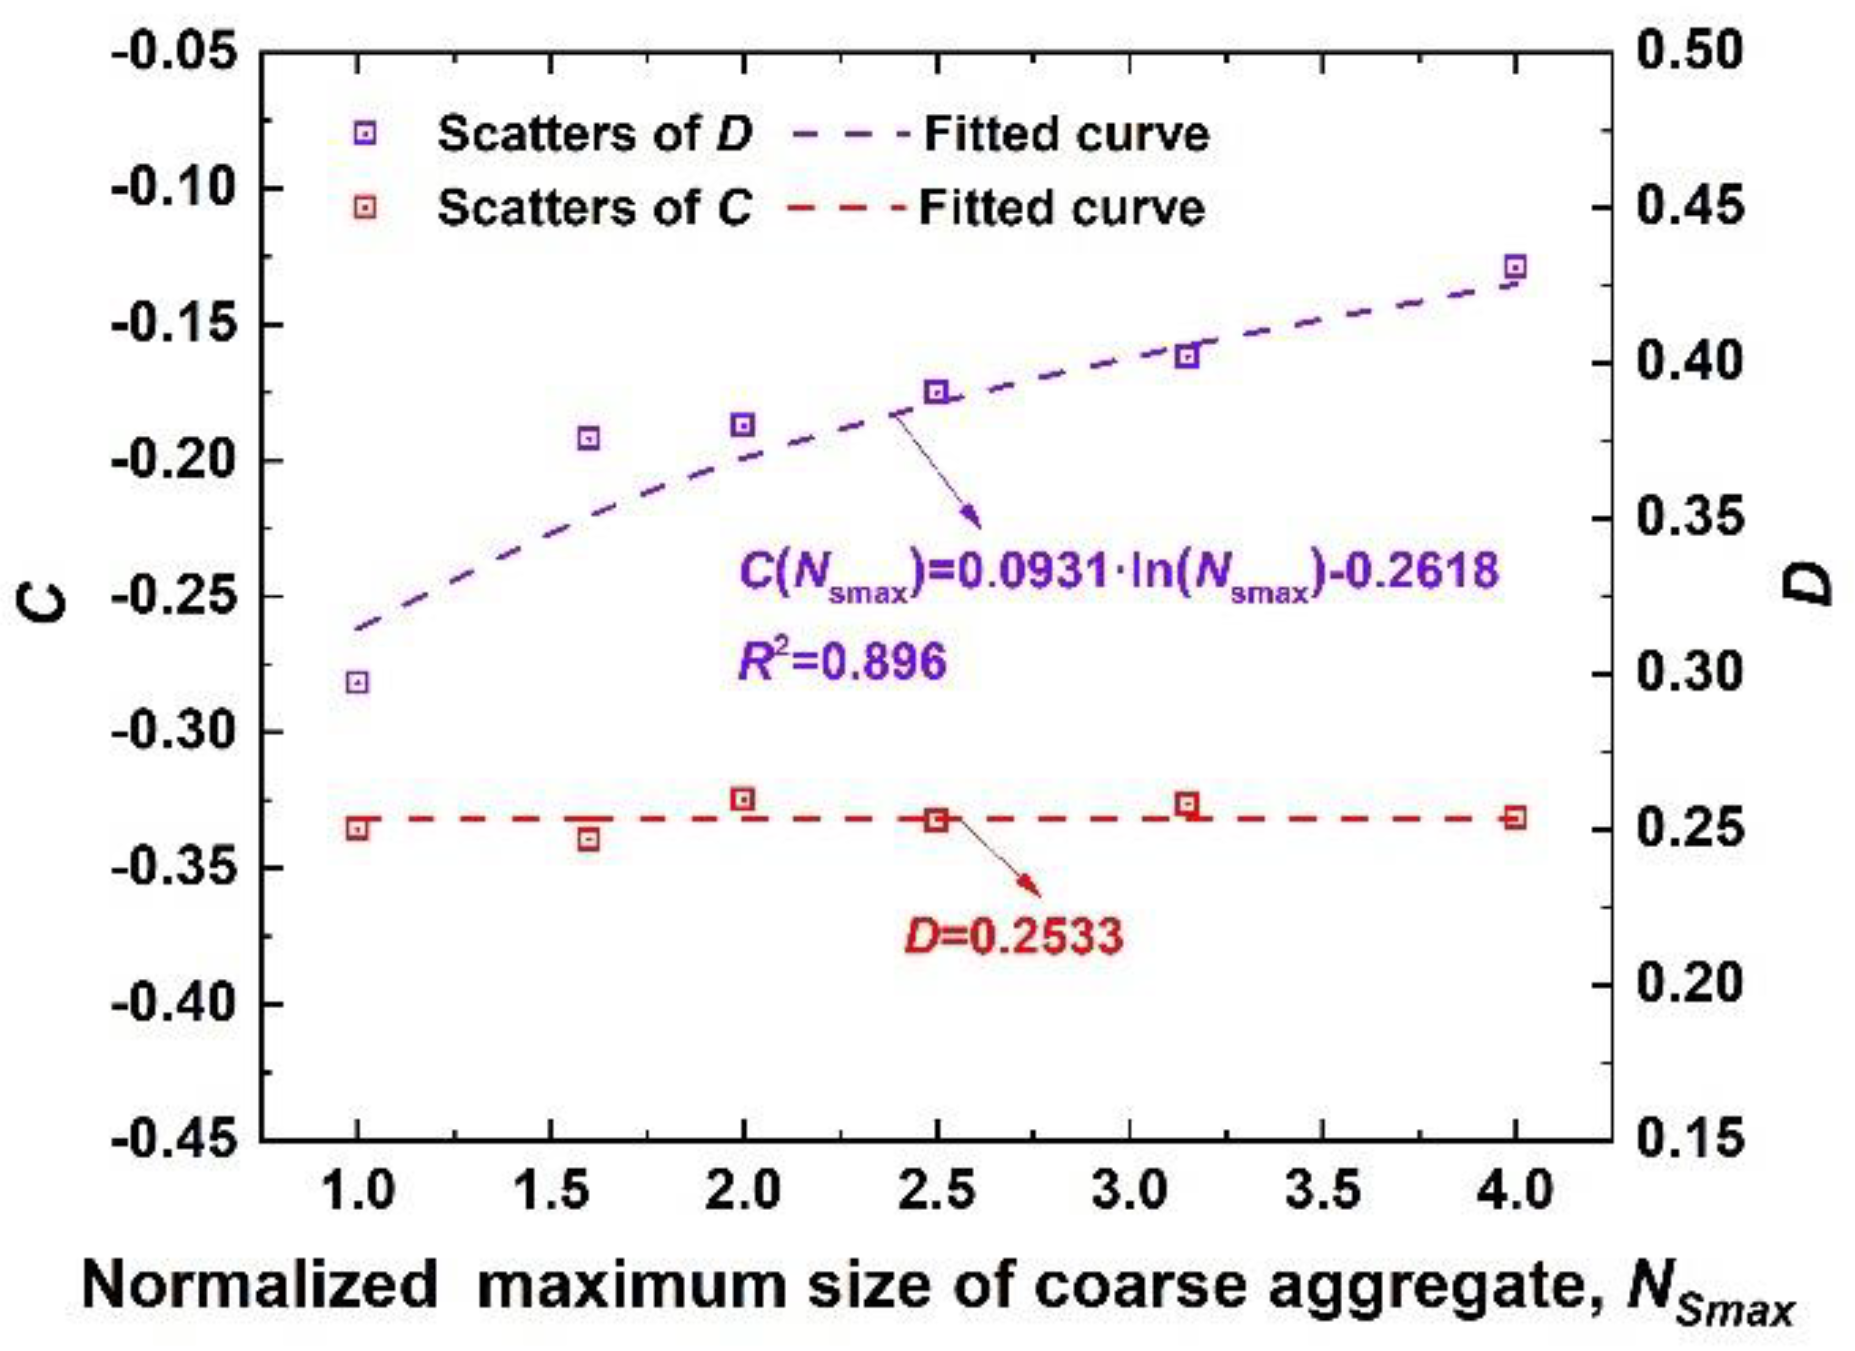
5.2.4. Prediction Empirical Model of Cs Considering Concrete Material Factors

According to the variation law of the Cs values with the concrete material factors mentioned above, the Cs values are independent of w/c but have a certain quantitative relation with Vca and Smax. Therefore, to further quantify the influences of Vca and Smax on Cs, the average value of Cs with different w/c is considered to be the representative Cs value for the concrete mesoscopic numerical model, and the trend of Cs with exposure time t at different Vca and Smax is fitted by using the logarithmic function form (Equation (2)).
The variation in the correction parameters A and B in Equation (2) at different values of Vca and Smax can be obtained, as shown in Figure 15. A and B show linear trends with increasing Vca, which are fitted by the linear functions shown in Equations (4) and (5).
A ( V c a ) = C · V c a + D ,
B ( V c a ) = E · V c a + F ,
where C(x, t) is the chloride concentration (%) of the cement-based materials (mortar and to simplify the calculation, the normalized maximum size of coarse aggregate is defined as NSmax = Smax/(Smax = 10 mm), and the variations in parameters C, D, E, and F within Equations (4) and (5) versus the NSmax values are plotted in Figure 16 and Figure 17.
As observed in Figure 16, C increases logarithmically with increasing NSmax. The variation in C with NSmax is fitted by a logarithmic function, as shown in Equation (6). Obviously, D exhibits no difference with the increase of the NSmax, and the D scatters present slightly random fluctuation with varying NSmax; in addition, the relative errors between the scatters of D and its corresponding average values are all in a ±5% margin. As a consequence, it is reasonable to take the average value of D scatters as the representative value, namely, D = 0.2533.
C ( N S m a x ) = 0.0931 · ln ( N S m a x ) 0.2618 .
Figure 17 shows that the correction parameter E decreases linearly with increasing NSmax. Thus, the linear function form of the correction parameter E with NSmax can be obtained through Equation (7). Parameter F shows no obvious difference with increasing NSmax. The relative errors between the scatters of F and their corresponding mean are included in ±5%, so the average value of F = −0.5776 is reasonable as the representative value under different w/c and NSmax.
E ( N S m a x ) = 0.1771 · N S m a x + 1.0963 .
In summary, by substituting Equations (4)–(7) into Equation (2), the empirical model of Cs for concrete by considering the material factors (Vca and Smax) can be established, as shown in Equation (8). The time dependency of Cs is also considered in this model, as follows:
{ C s ( t , V c a , S m a x ) = A ( V c a , N S m a x ) · ln ( t ) + B ( V c a , N S m a x ) A ( V c a , N S m a x ) = C ( N S m a x ) · V c a + 0.2533 B ( V c a , N S m a x ) = E ( N S m a x ) · V c a 0.5776 C ( N S m a x ) = 0.0931 · ln ( N S m a x ) 0.2618 E ( N S m a x ) = 0.1771 · N S m a x + 1.0693 .

5.3. Influences of Concrete Material Factors on the Chloride Diffusion Coefficients

In this paper, the apparent chloride diffusion coefficients Da can also be determined by fitting Equation (1) using regression analysis. Da, which reflects the chloride ion diffusion ability in concrete, can be obtained. Combined with the power function of Equation (3), the reference chloride diffusion coefficient D28 for the concrete mesoscopic numerical model with different values of Vca, w/c and Smax can be regressed.

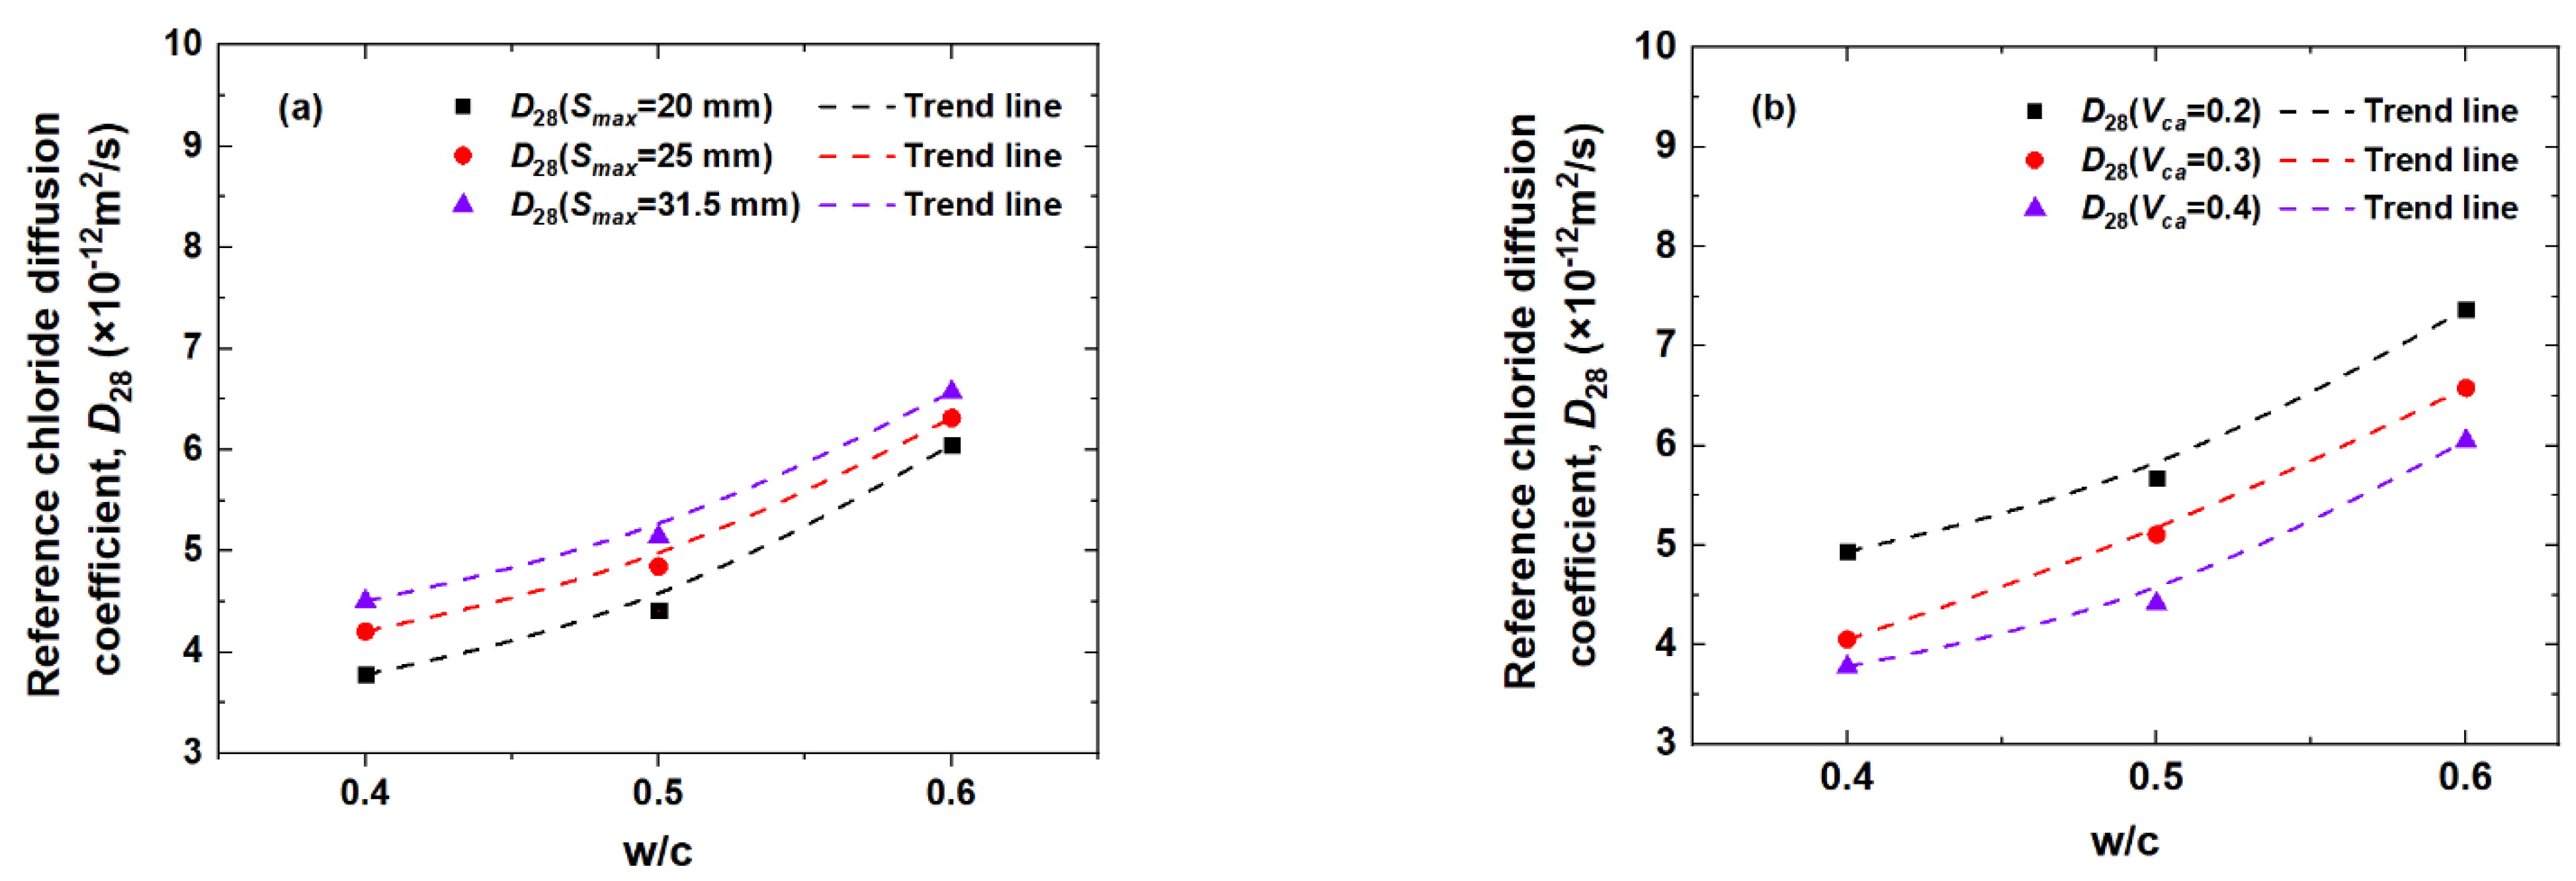
5.3.1. Influence of Water-to-Cement Ratio, w/c

The variation in the reference chloride diffusion coefficient D28 with w/c in the mesoscale numerical model for concrete is shown in Figure 18. When Vca and Smax are constants, the D28 values both increase with increasing w/c. Quantitatively, when Vca = 0.4, Smax = 20 mm, the D28 increases almost 60.1% with the increasing of w/c from 0.4 to 0.6.

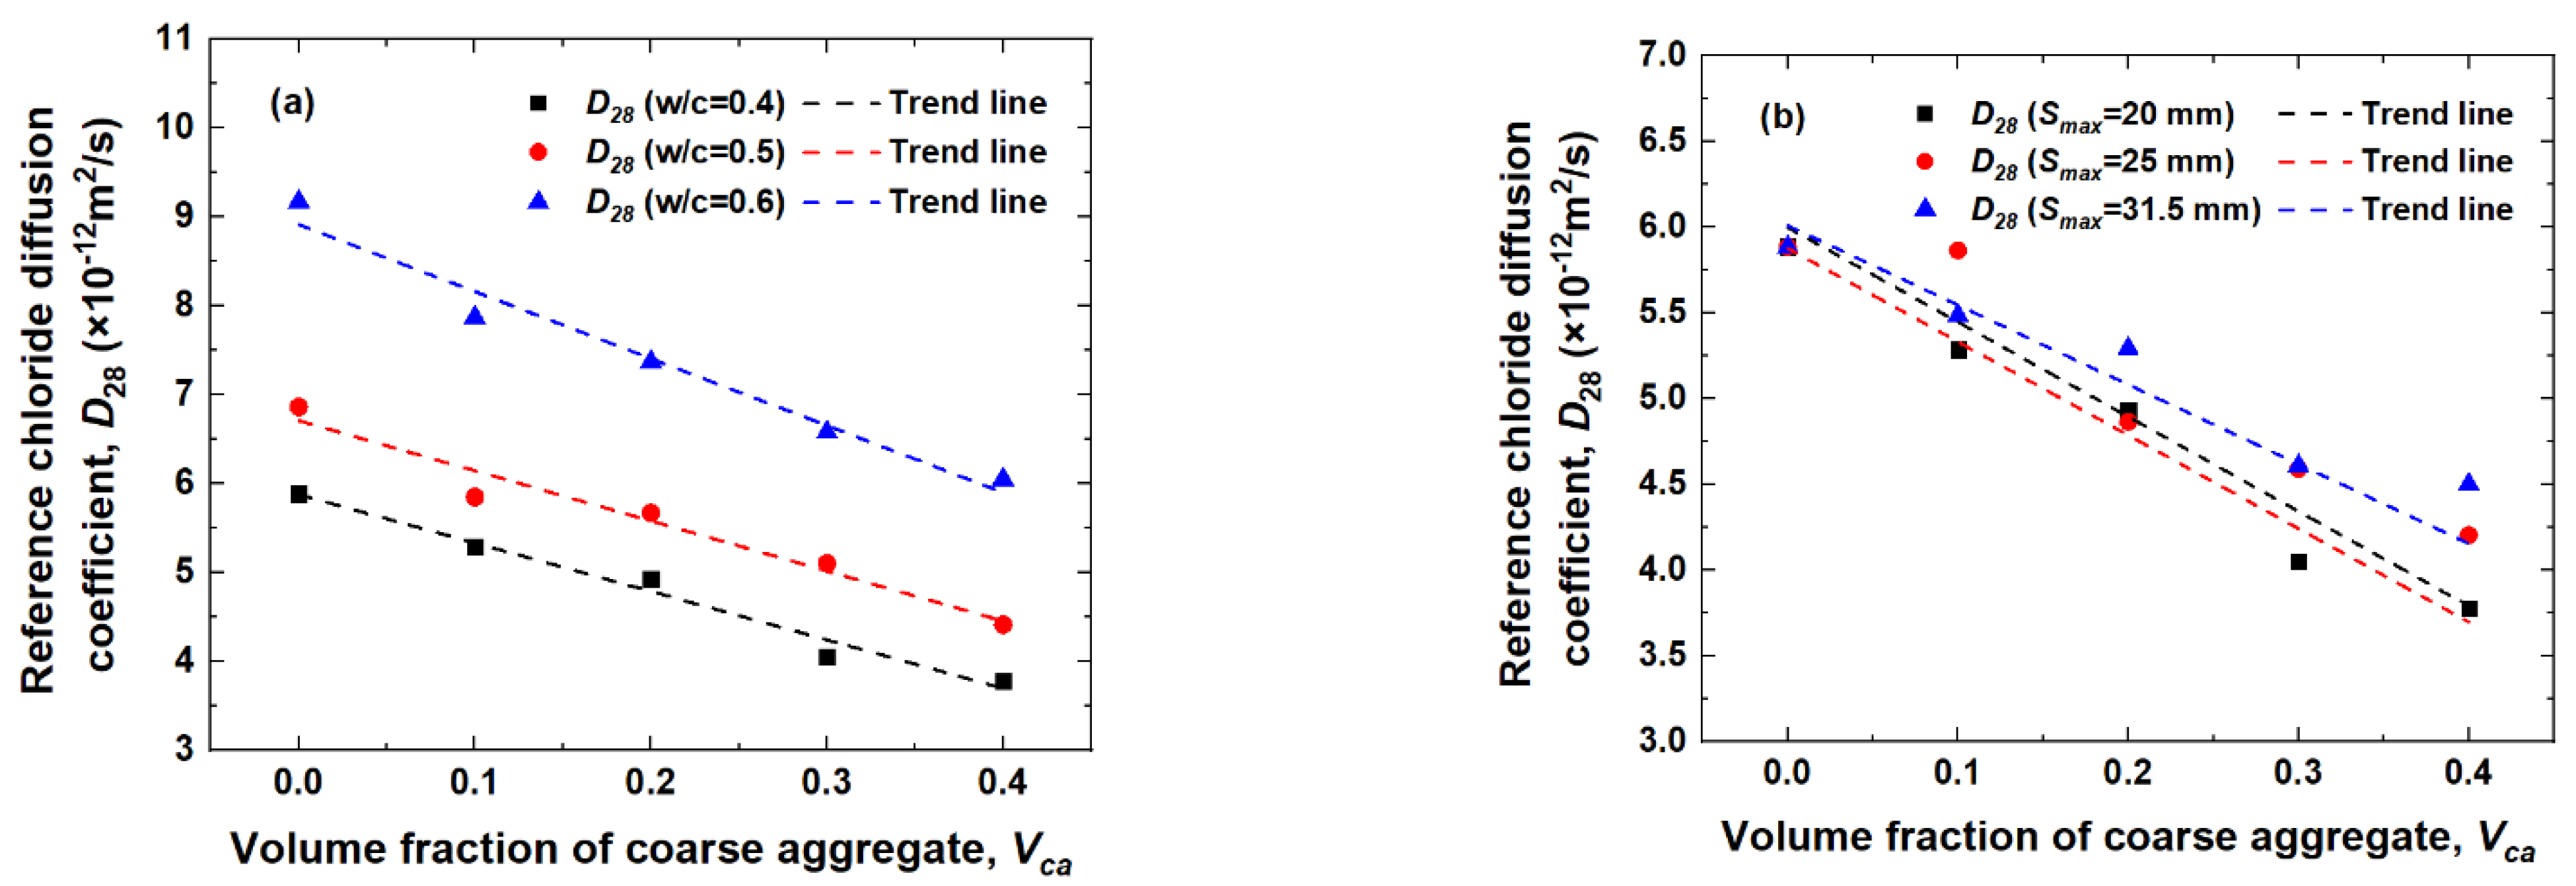
5.3.2. Influence of VFCA, Vca

Figure 19 shows the variation in D28 in the mesoscopic numerical model for concrete with respect to Vca. At arbitrary Smax and w/c, the D28 values decrease with increasing Vca. This phenomenon illustrates that the concrete material factor Vca will reduce the chloride diffusion coefficient Da, and the greater Vca is, the more obvious the reduction of Da. Especially, when w/c = 0.5, Smax = 20 mm, the D28 decreases almost 35.8% with the increasing of Vca from 0 to 0.4.

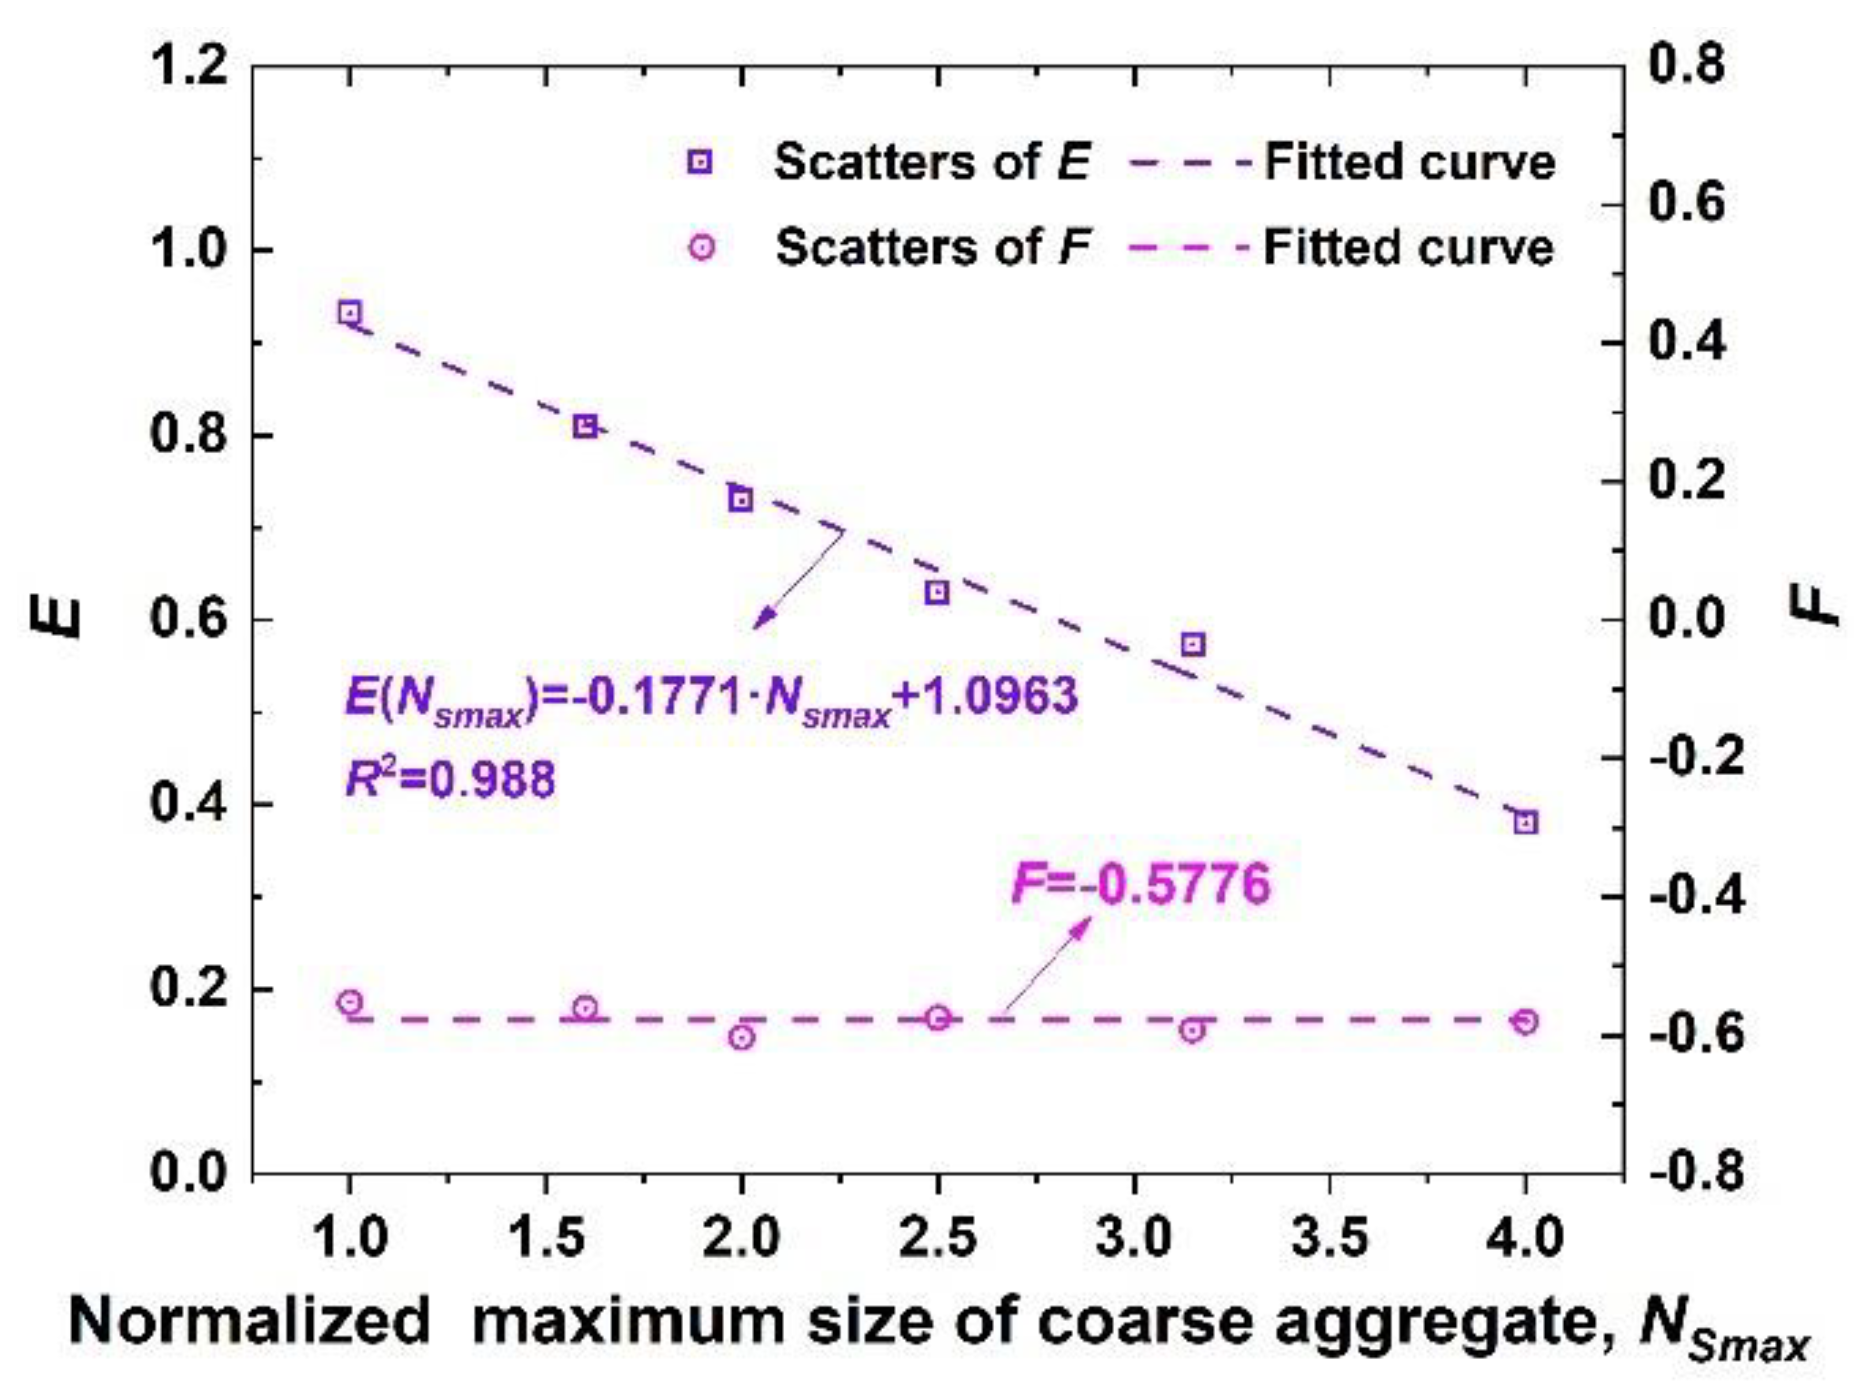
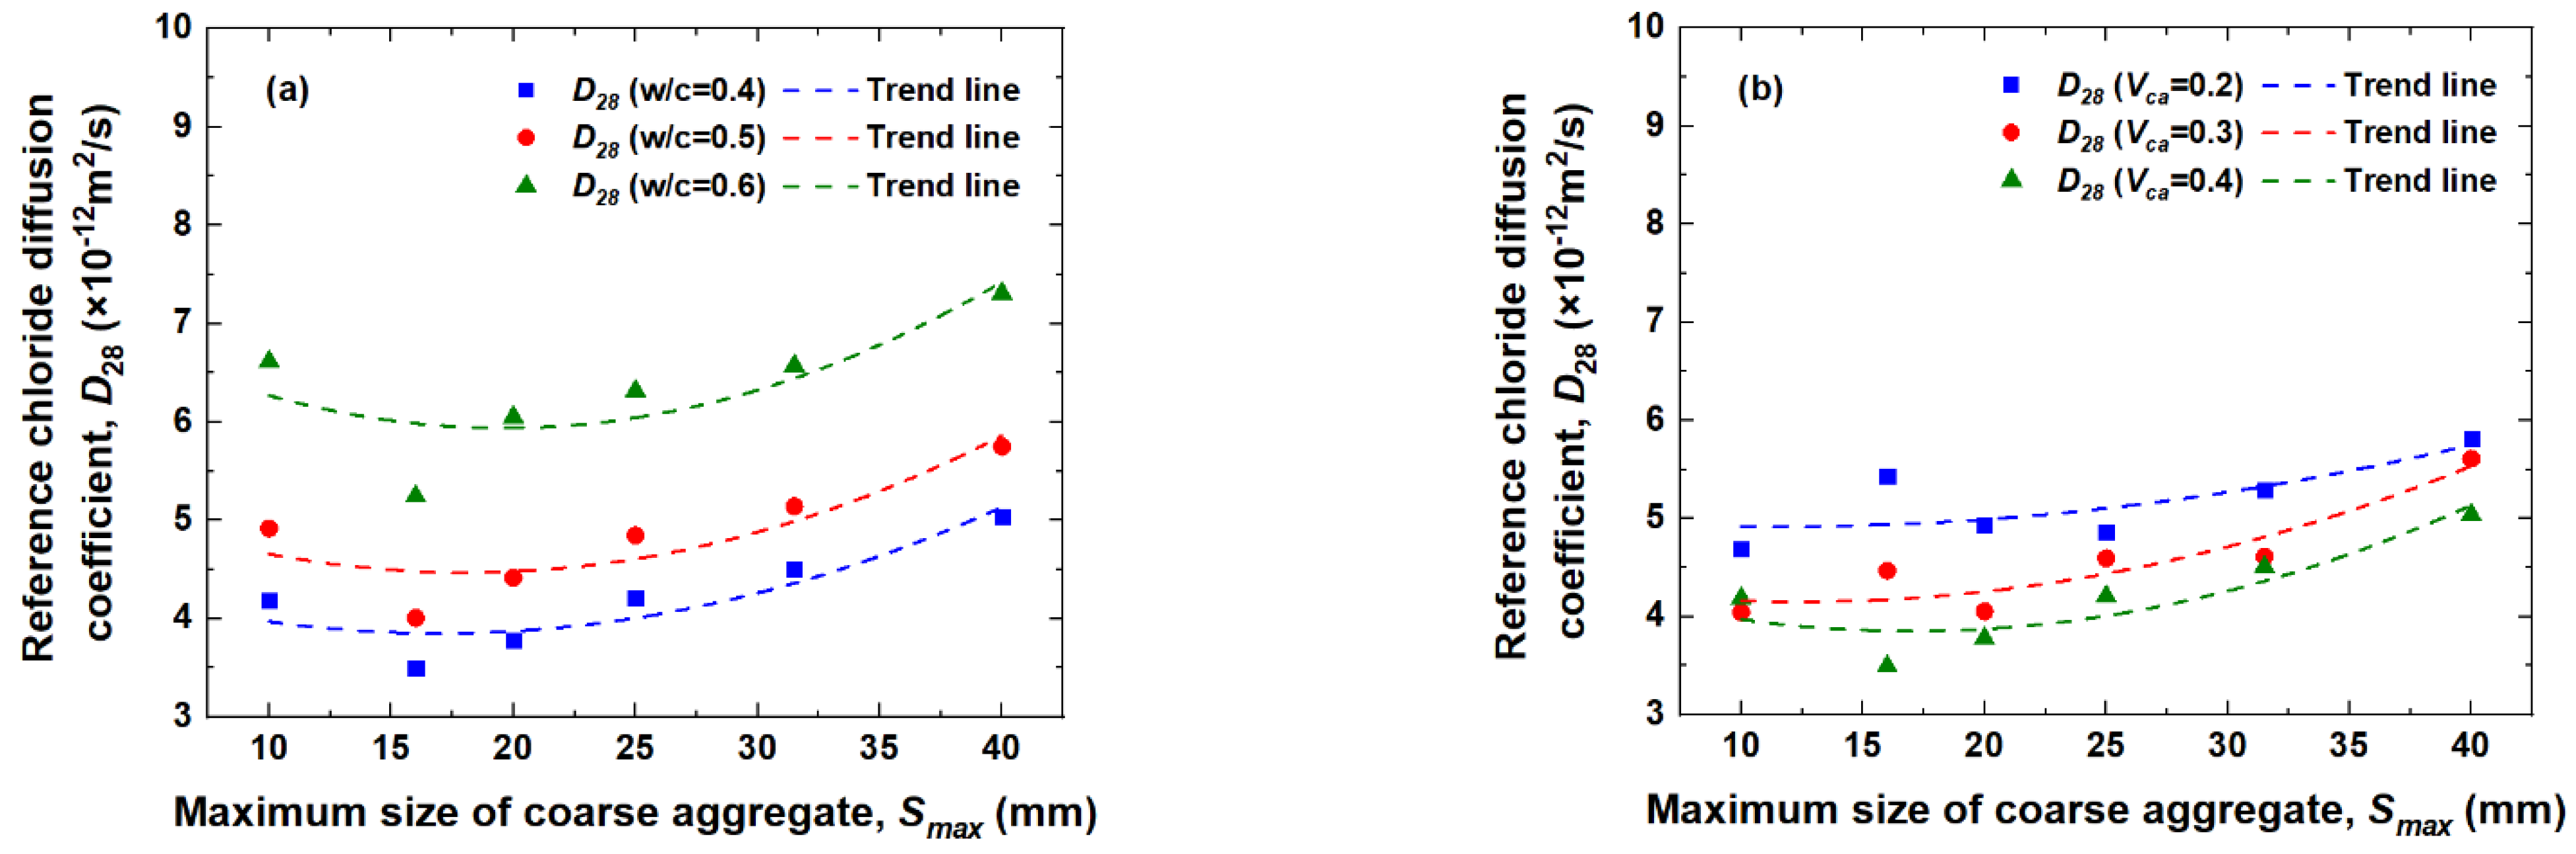
5.3.3. Influence of MSVA, Smax

Figure 20 depicts the D28 values in the mesoscopic numerical model for concrete with Smax. Obviously, at an arbitrary Vca (Figure 20a) and w/c (Figure 20b), D28 shows a quadratic function trend of first decreasing and then increasing with Smax. The minimum D28 value appears in the range of Smax = 16−20 mm. Respectively, when w/c = 0.5, Vca = 0.4, D28(Smax = 40 mm) increases approximately 43.4% and 30.2% than those of Smax = 16 mm and 20 mm. It is noteworthy that D28 has the largest discreteness compared with the overall trend line when Smax = 16 mm.

5.3.4. Prediction Empirical Model of D28 Considering Concrete Material Factors

To quantitatively evaluate the influences of concrete material factors on the chloride diffusion coefficient, the w/c-corrected parameter a and the Vca-corrected parameter b are defined. These two expressions are both exhibited as follows:
a = D 28 ( w / c , V c a = 0 ) D 28 ( w / c = 0.4 , V c a = 0 ) ,
b = D 28 ( w / c , V c a , S m a x ) D 28 ( w / c , V c a = 0 ) ,
where D28(w/c, Vca = 0) represents the reference chloride diffusion coefficient (m2/s) of the mesoscopic numerical model for concrete when Vca = 0; D28(Vca = 0, w/c = 0.4) represents the reference chloride diffusion coefficient (m2/s) when Vca = 0, w/c = 0.4; and D28(Vca = 0, w/c = 0.4) = 5.90 × 10⁻¹² (m2/s), as shown in Table 3.
Based on Equation (9), the w/c-corrected parameter a can be quantitatively calculated, and the results are shown in Figure 21.
According to Figure 21, the linear formula is used to regress and determine the scatters of the w/c-corrected parameter a, and the linear function expression of a is obtained by regression analysis, as shown in Figure 21 and expressed in Equation (11):
a ( w / c ) = 2 . 7906 · ( w / c ) 0 . 1539 .
The Vca-corrected parameter b (Equation (10)) of the chloride diffusion coefficient in the mesoscopic numerical model for concrete with increasing Vca is shown in Figure 22. It can be observed that b decreases linearly as Vca increases at an arbitrary w/c. The corrected parameters c and d in Equation (12) fitted by a linear function form with the values of NSmax are depicted in Figure 23.
b ( V c a ) = c · V c a + d .
From Figure 23, parameter c shows a quadratic function trend with increasing NSmax. The function form shown in Equation (13) is used to fit the curve of c with NSmax, where e, f and g are the coefficients related to w/c. Evidently, parameter d exhibits no significant trend with increasing NSmax. The quantitative calculation shows that the relative error between the d scatters and the average value is within the range of ±5%, so it is reasonable to take the average value of d with different values of NSmax as the representative value, namely, d = 1.002.
c ( N S m a x ) = e · N S m a x 2 + f · N S m a x + g .
Figure 24 depicts the variation of correction parameters e, f, and g versus w/c, and the three exhibit linear function relationships with respect to w/c. The linear function is used to fit e, f, and g, and the expressions are determined, as shown in Figure 24 and Equation (14):
{ e ( w / c ) = 0.095 · ( w / c ) + 0.0825 f ( w / c ) = 0.785 · ( w / c ) 0.1058 g ( w / c ) = 0.9215 · ( w / c ) 0.8947 .
In summary, by substituting Equations (11)–(14) into Equation (3), the model of Da in the mesoscopic numerical model for concrete considering the concrete material factors (Vca, Smax, w/c) is established, as shown in Equation (15).
{ D a ( V c a , S m a x , w / c ) = D 28 ( V c a , S m a x , w / c ) 1 m · ( t 28 t ) m D 28 ( V c a , S m a x , w / c ) = a ( V c a , N S m a x , w / c ) · D 28 ( V c a = 0 , w / c ) D 28 ( V c a = 0 , w / c ) = b ( w / c ) · D 28 ( V c a = 0 , w / c = 0.4 ) D 28 ( V c a = 0 , w / c = 0.4 ) = 5.90 × 10 12 m 2 / s a ( w / c ) = 2.7906 · ( w / c ) 0.1539 b ( V c a , N S m a x , w / c ) = c ( N S m a x , w / c ) · V c a + 1.002 c ( N S m a x , w / c ) = e ( w / c ) · N S m a x 2 + f ( w / c ) · N S m a x + g ( w / c ) e ( w / c ) = 0.095 · ( w / c ) + 0.0825 f ( w / c ) = 0.785 · ( w / c ) 0.1058 g ( w / c ) = 0.9215 · ( w / c ) 0.8947 .

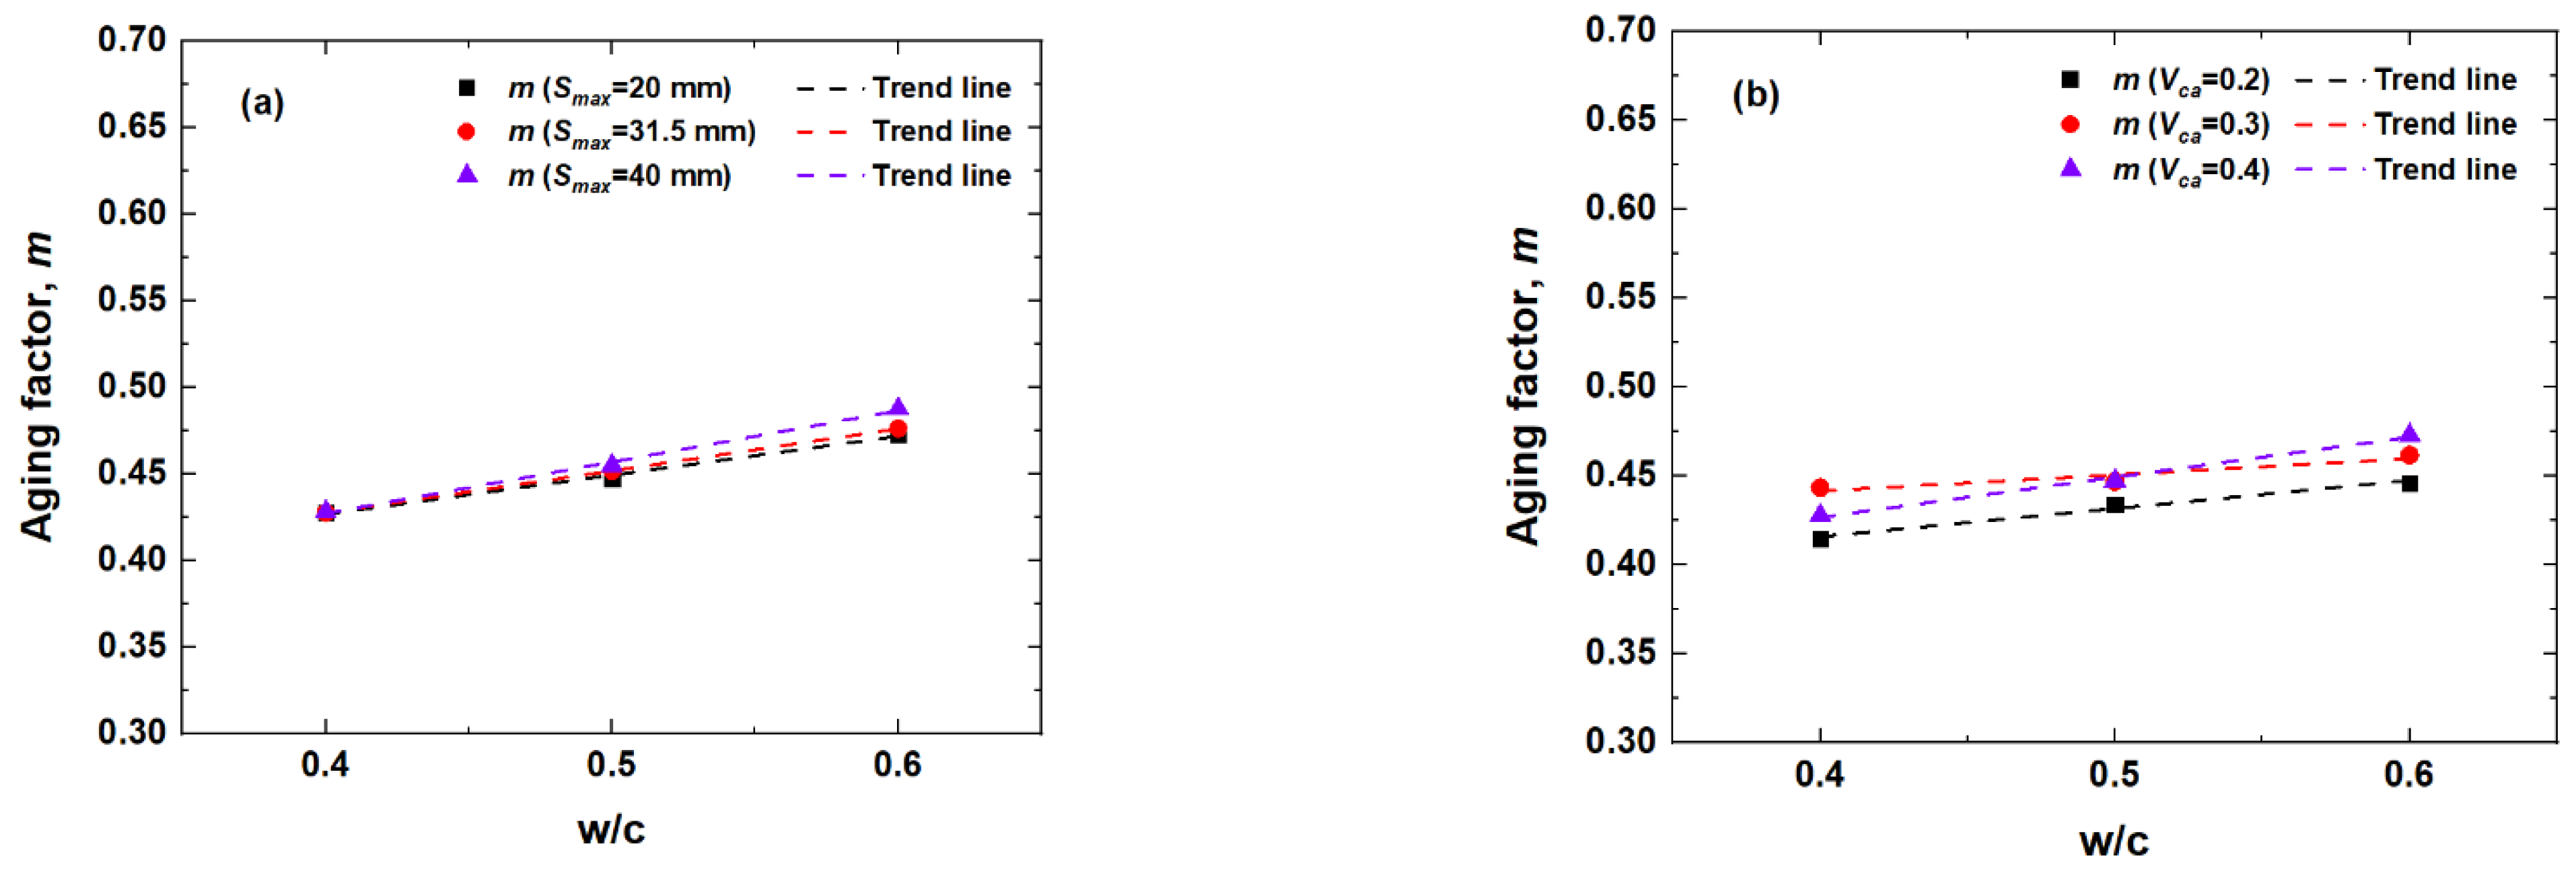
5.4. Influences of Concrete Material Factors on Aging Factor

In Equation (3), the aging factor m is an important parameter for quantifying chloride transportation in concrete composites [33]. The aging factor was found not to be constant with time in concrete specimens with mineral admixtures. It was also found that the exposure conditions and concrete material factors also affect the aging factor.

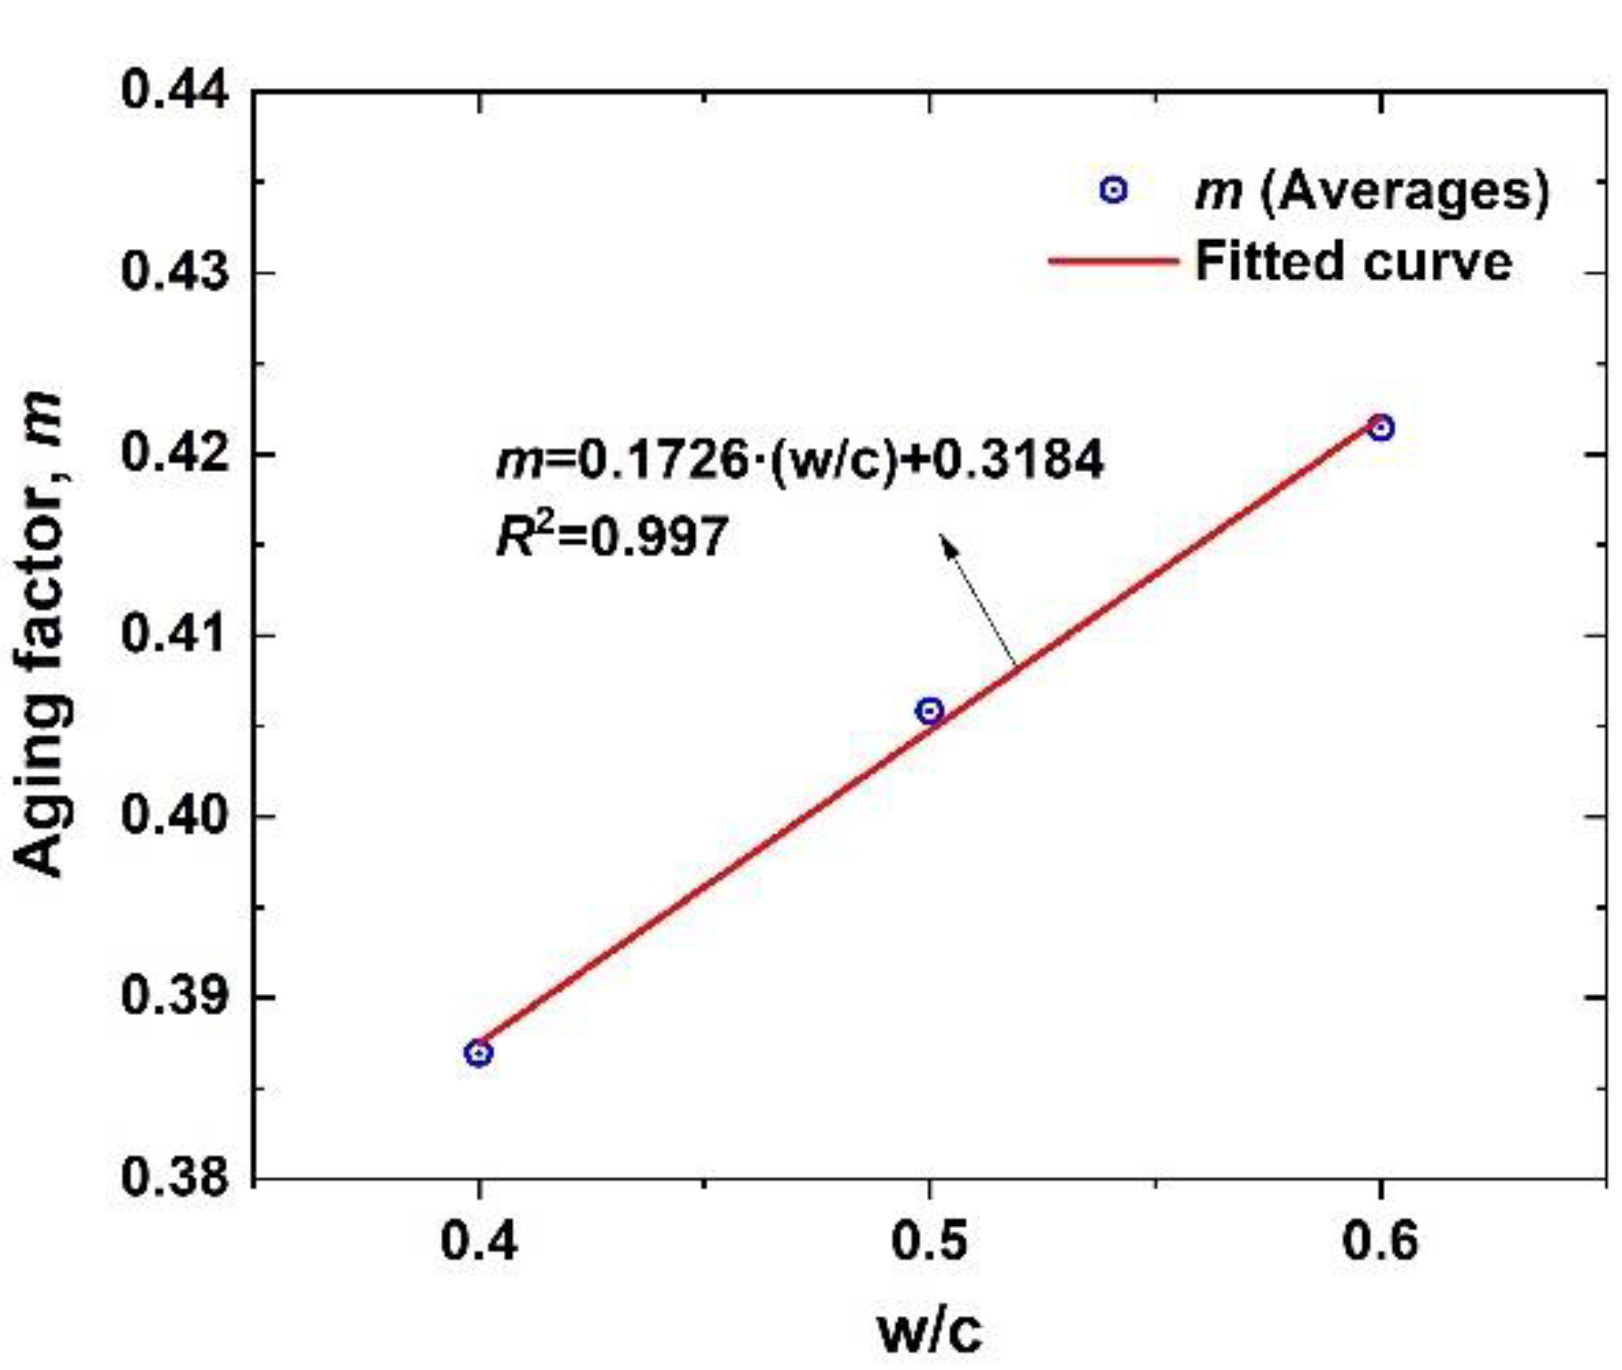
5.4.1. Influence of Water-to-Cement Ratio, w/c

The variation trend of Da versus t is fitted by using a power function of Equation (3), and the aging factor m with different values of Vca, w/c, and Smax can be obtained by regression analysis. The variation is shown in Figure 25, and the m values increase linearly with increasing w/c. Particularly, when Vca = 0.4, Smax = 20 mm, the m increases almost 10.5% with the increasing of w/c from 0.4 to 0.6.

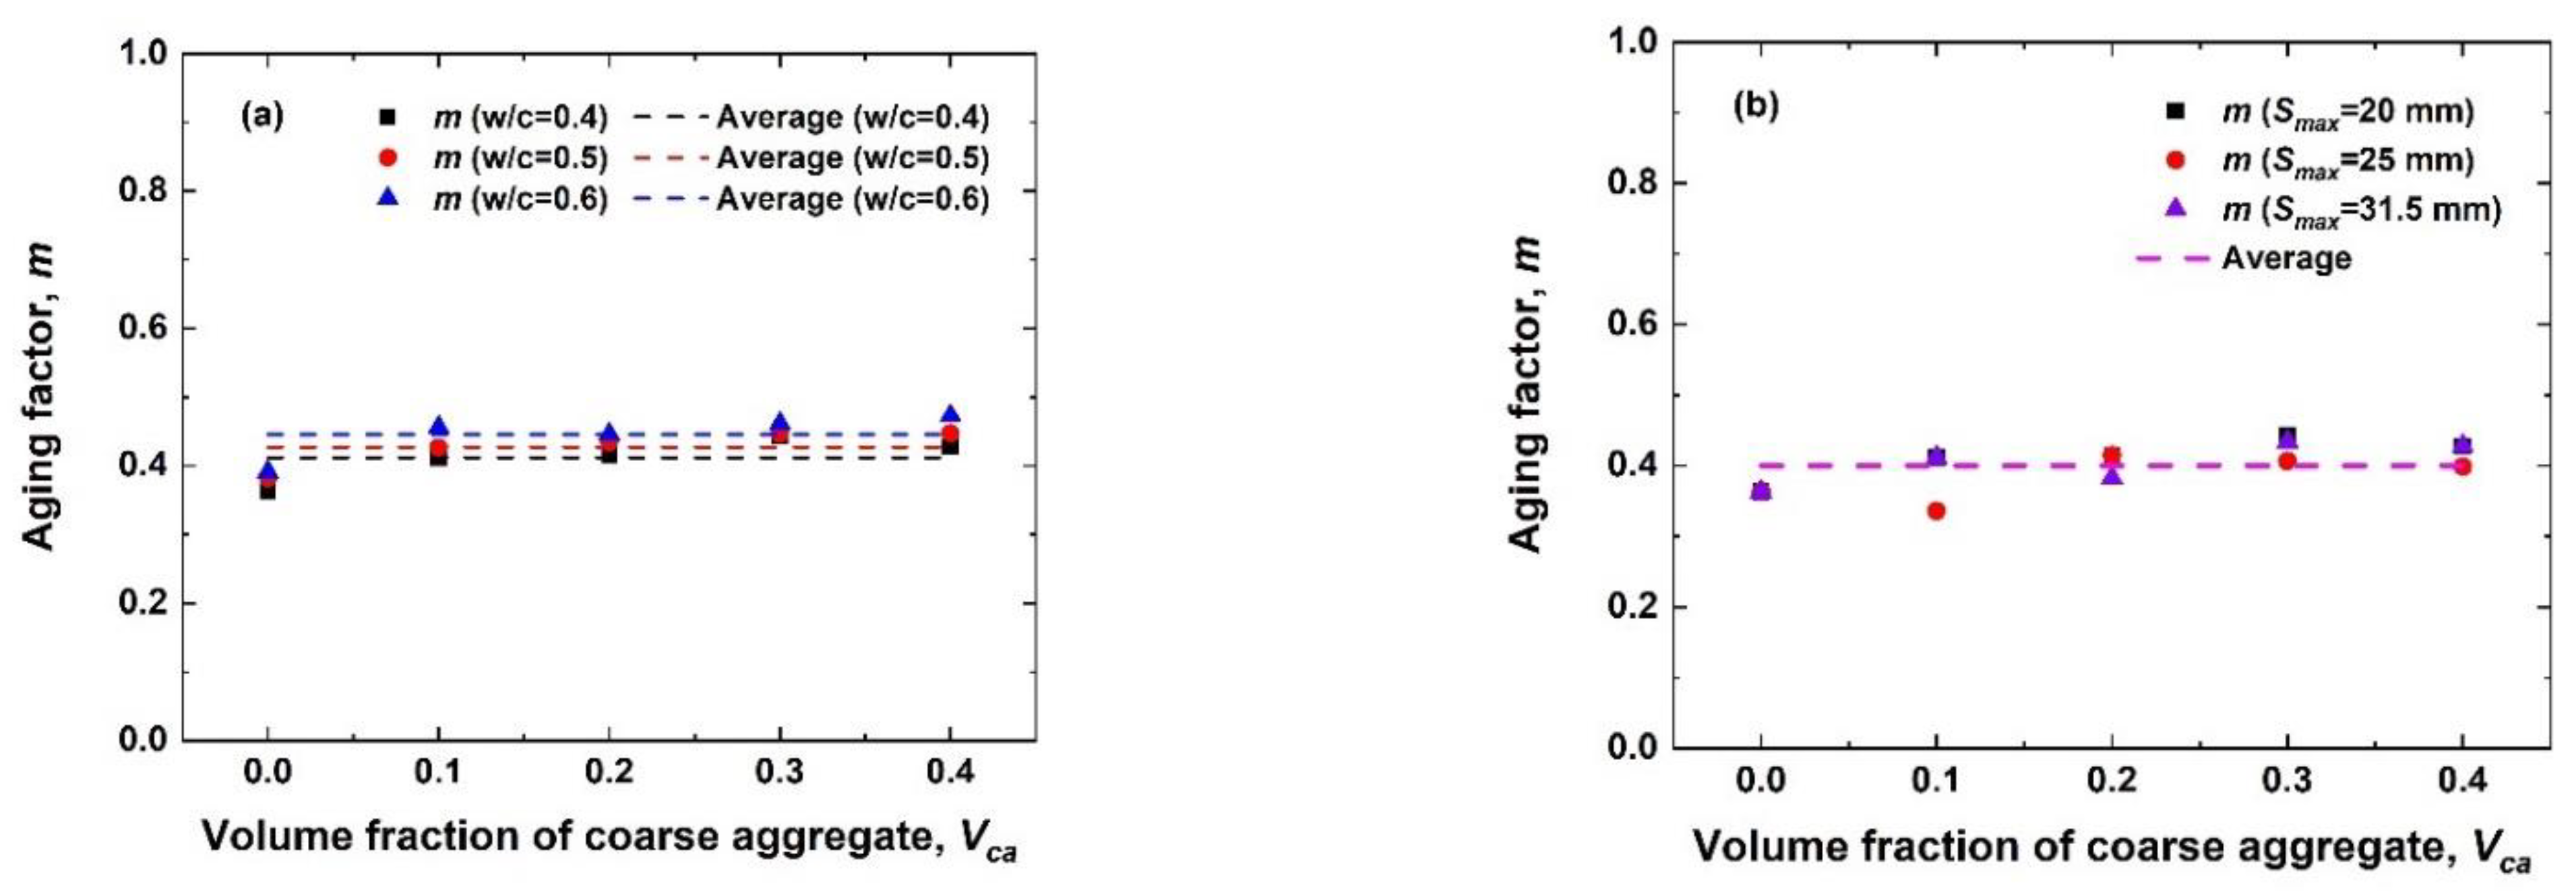
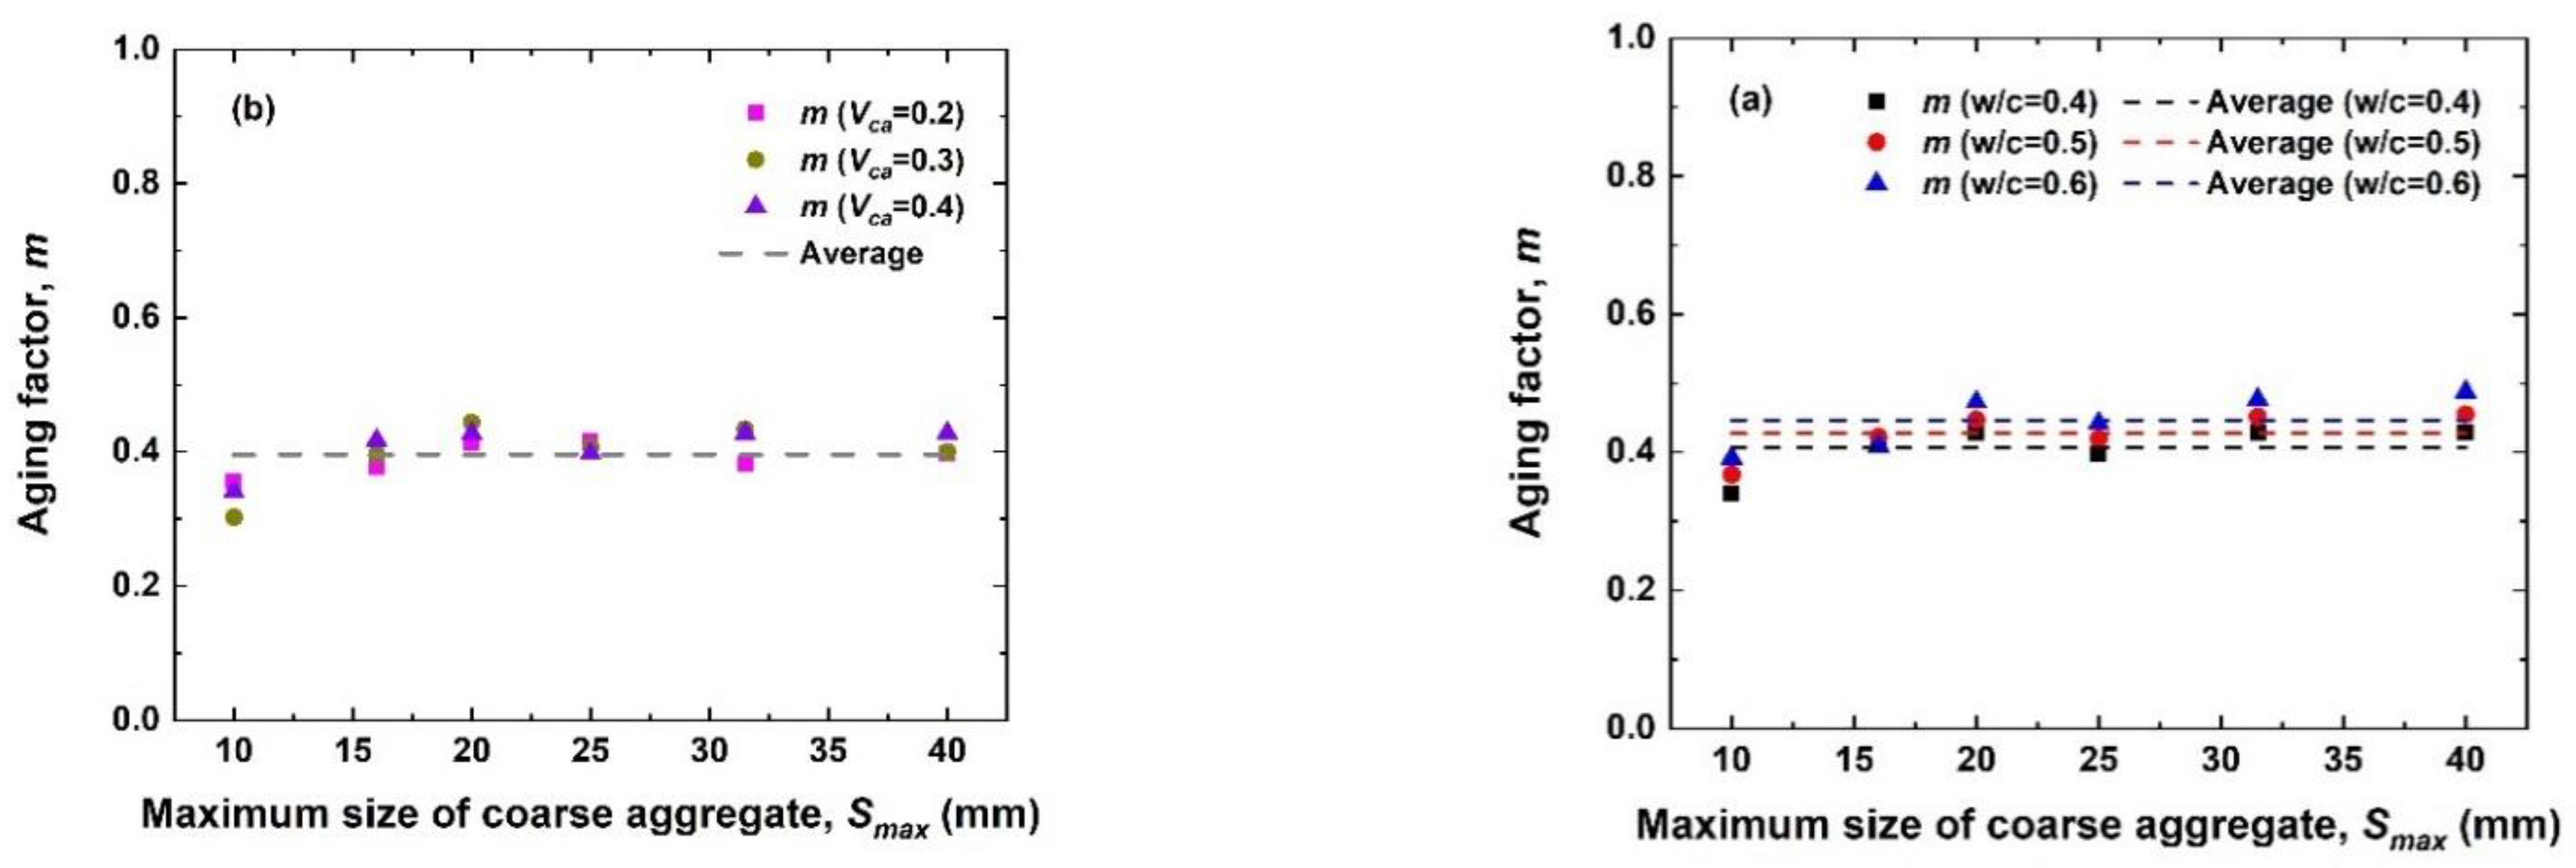
5.4.2. Influence of VFCA, Vca and MSCA, Smax

Figure 26 and Figure 27 depict the variation in the aging factor m with Vca and Smax in the mesoscopic numerical model for concrete, respectively. It can be observed from the figures that m has no obvious change in trend with increasing Vca and Smax. It can be considered that m is unrelated to Vca and Smax.
Therefore, the average value of m corresponding to the different Vca and Smax can be used as the representative value of the aging factor for the concrete mesoscopic numerical model with different w/c. The quantitative calculation testifies that the relative error between the m scatters and their mean is in a range of ±5% for any w/c. Thus, it is thought that the aging factor is independent of Vca and Smax, and it is reasonable to take the average value as the representative value of the aging factor corresponding to different w/c.
Based on the aforementioned analysis in this paper, the variation in aging factor m with w/c is fitted by using a linear function, and the empirical expression of the aging factor m of the mesoscopic numerical model for concrete is shown in Figure 28 and Equation (16).
m ( w / c ) = 0.1726 · ( w / c ) + 0.3184 .

6. Modelling of Chloride Concentration Considering Concrete Material Factors

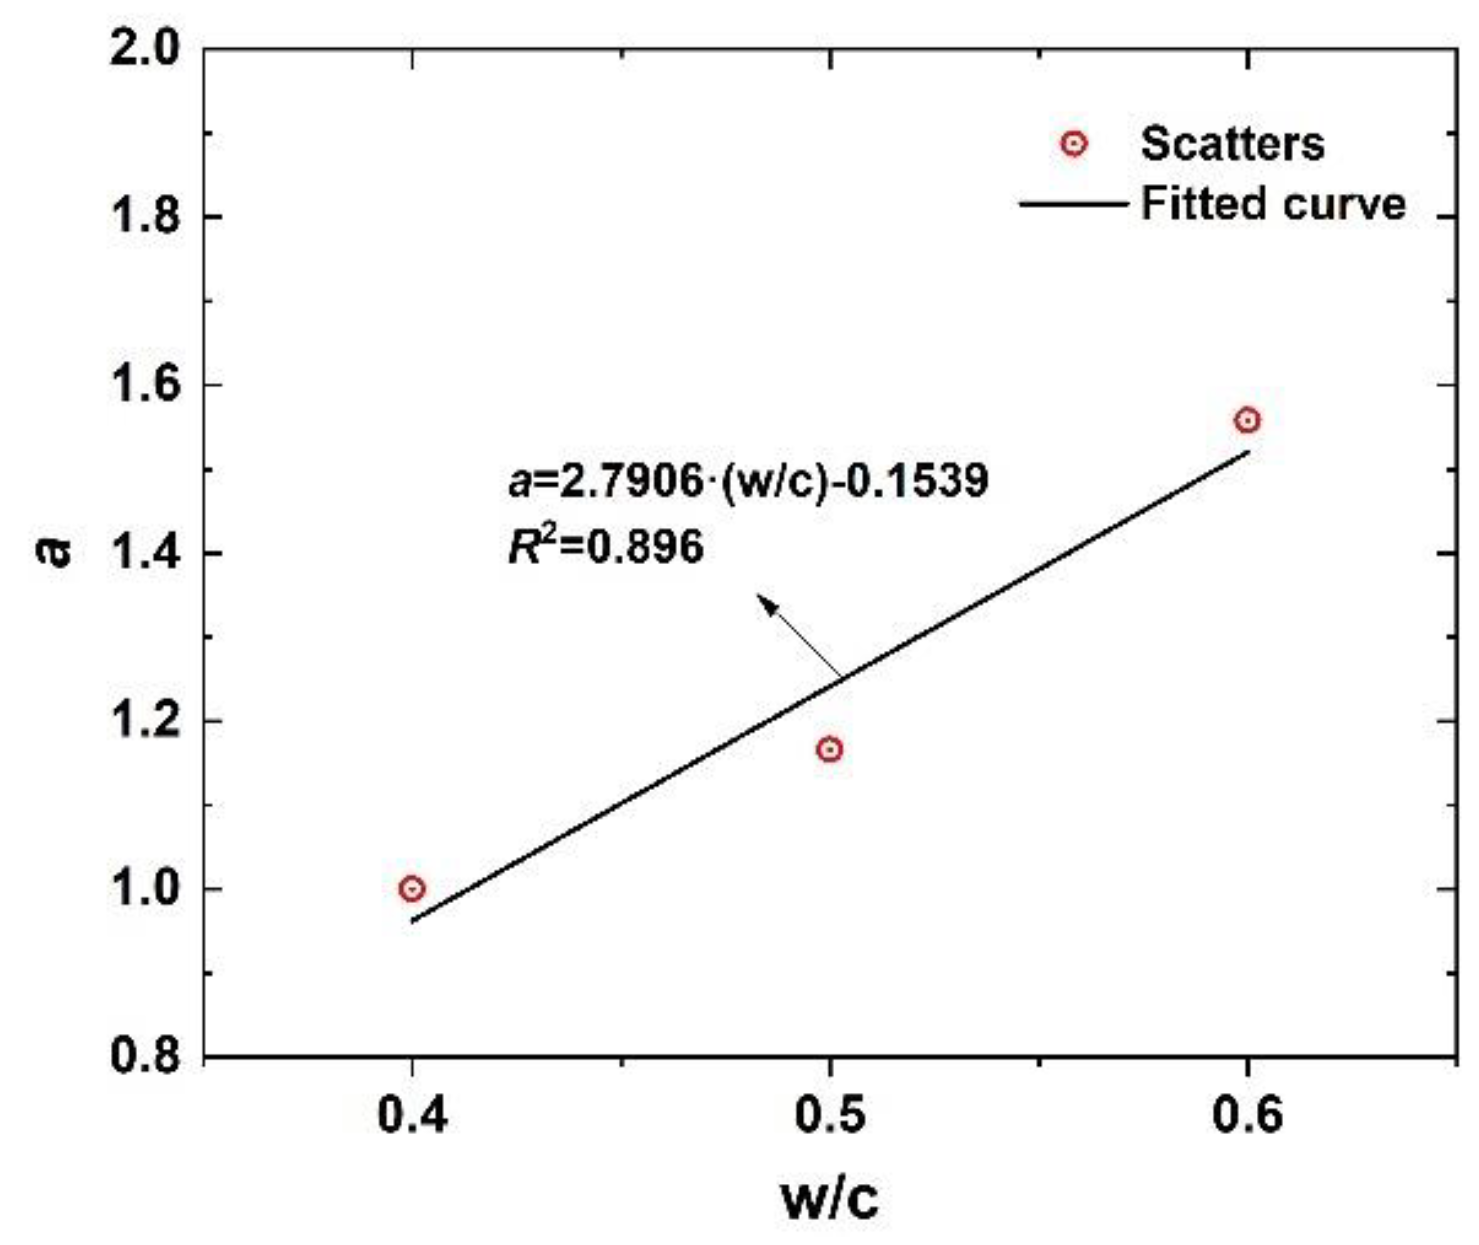
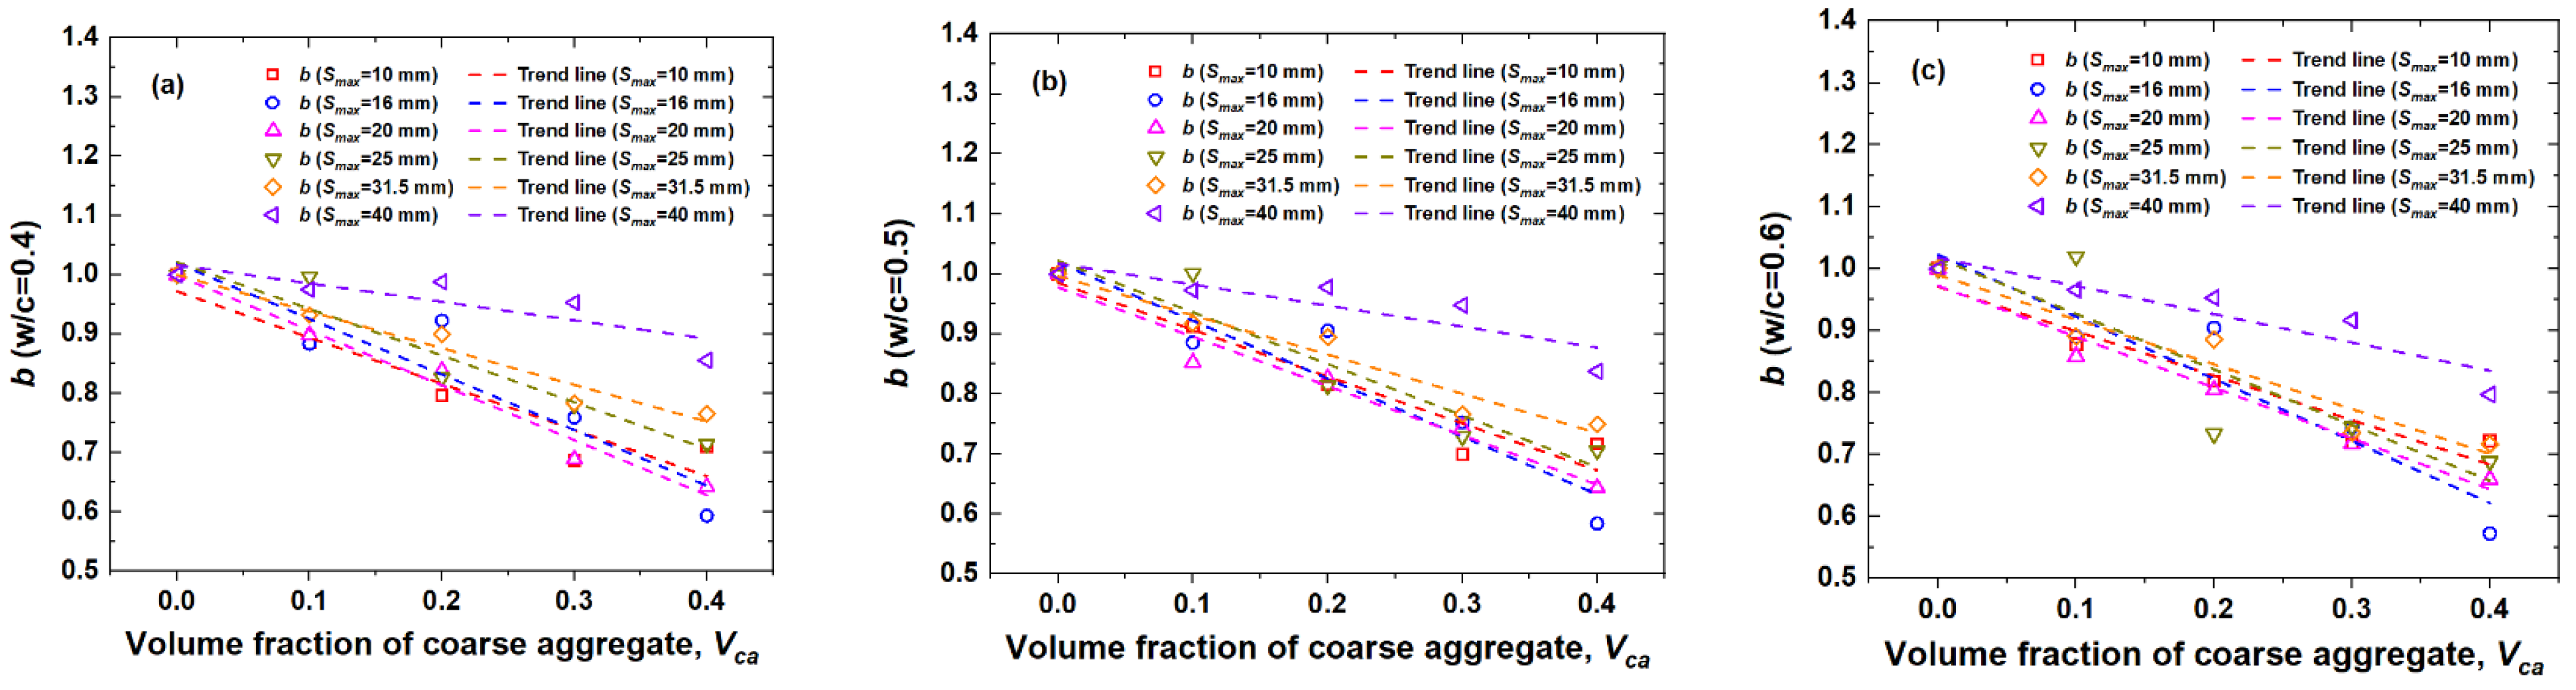
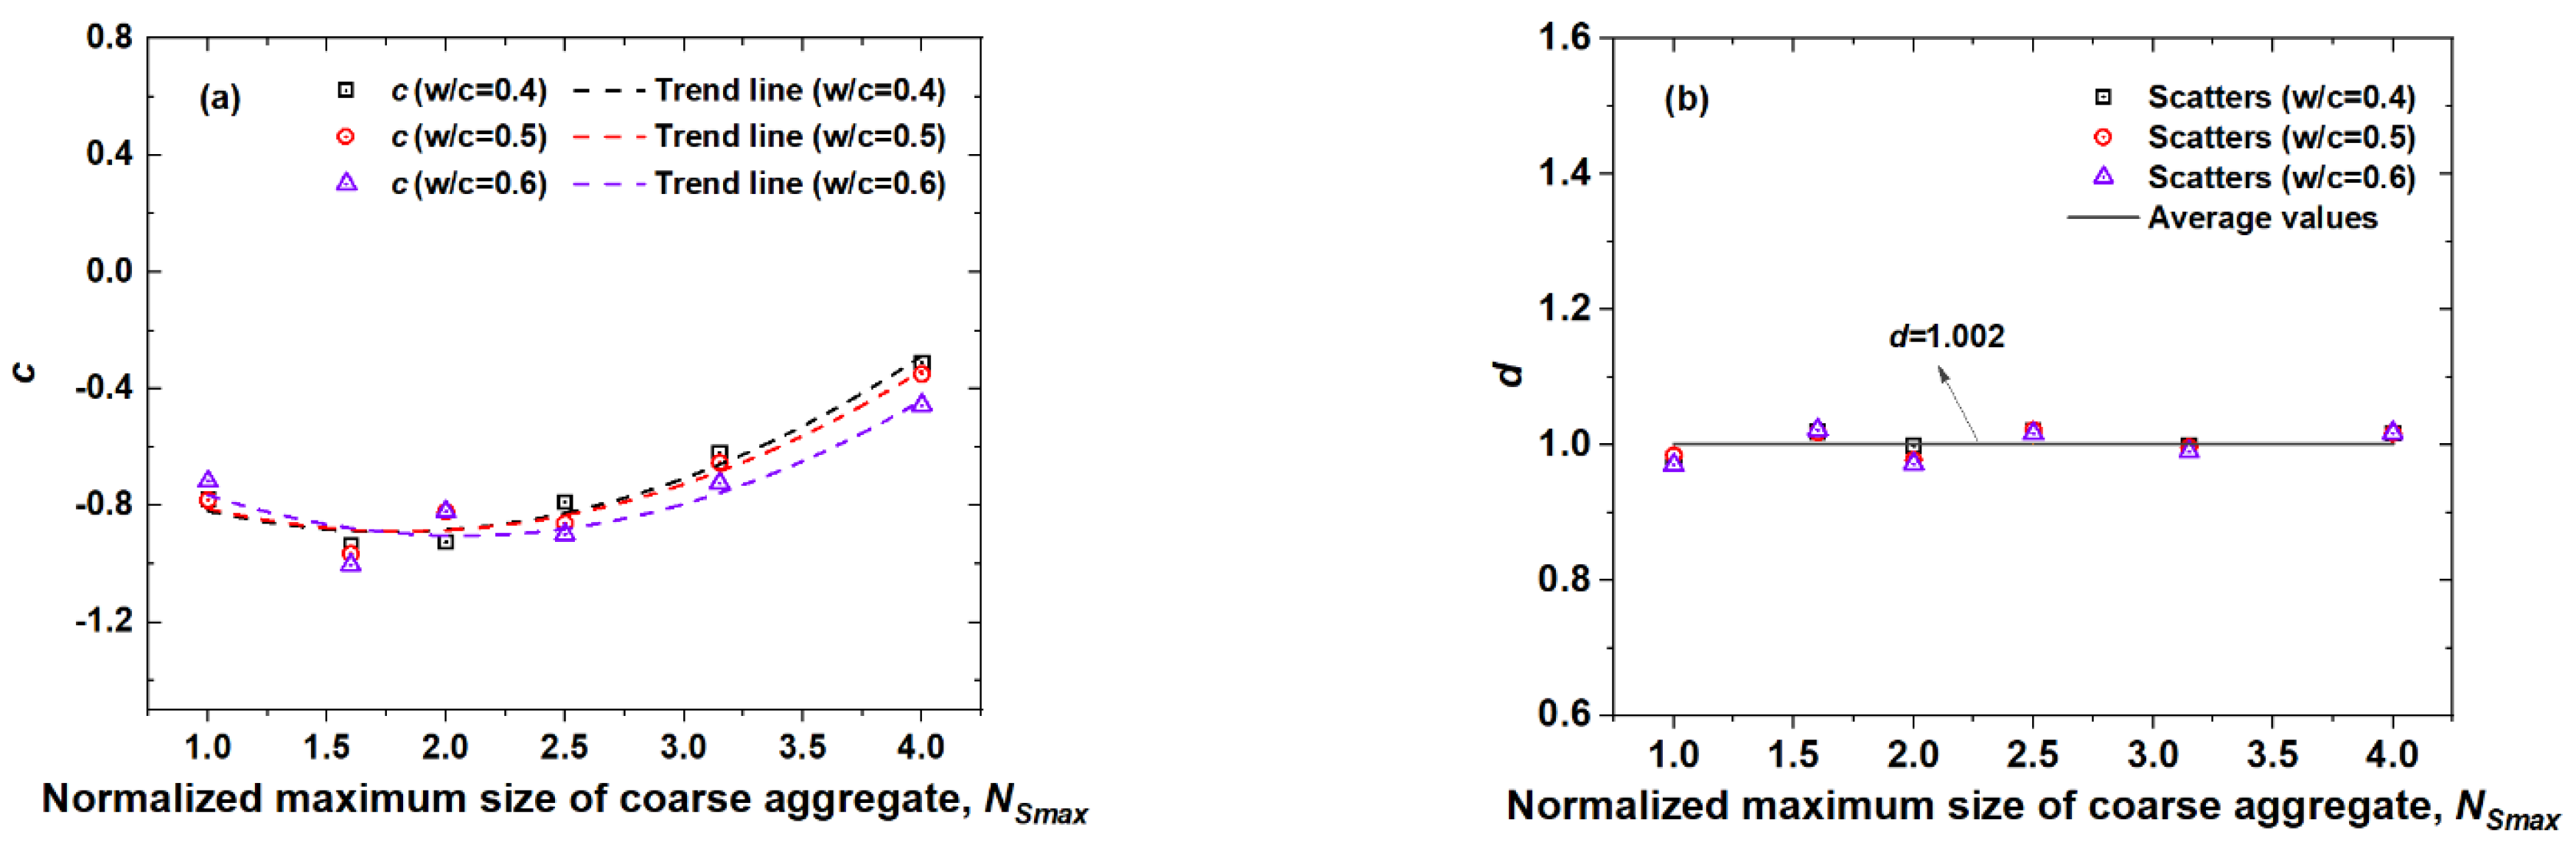
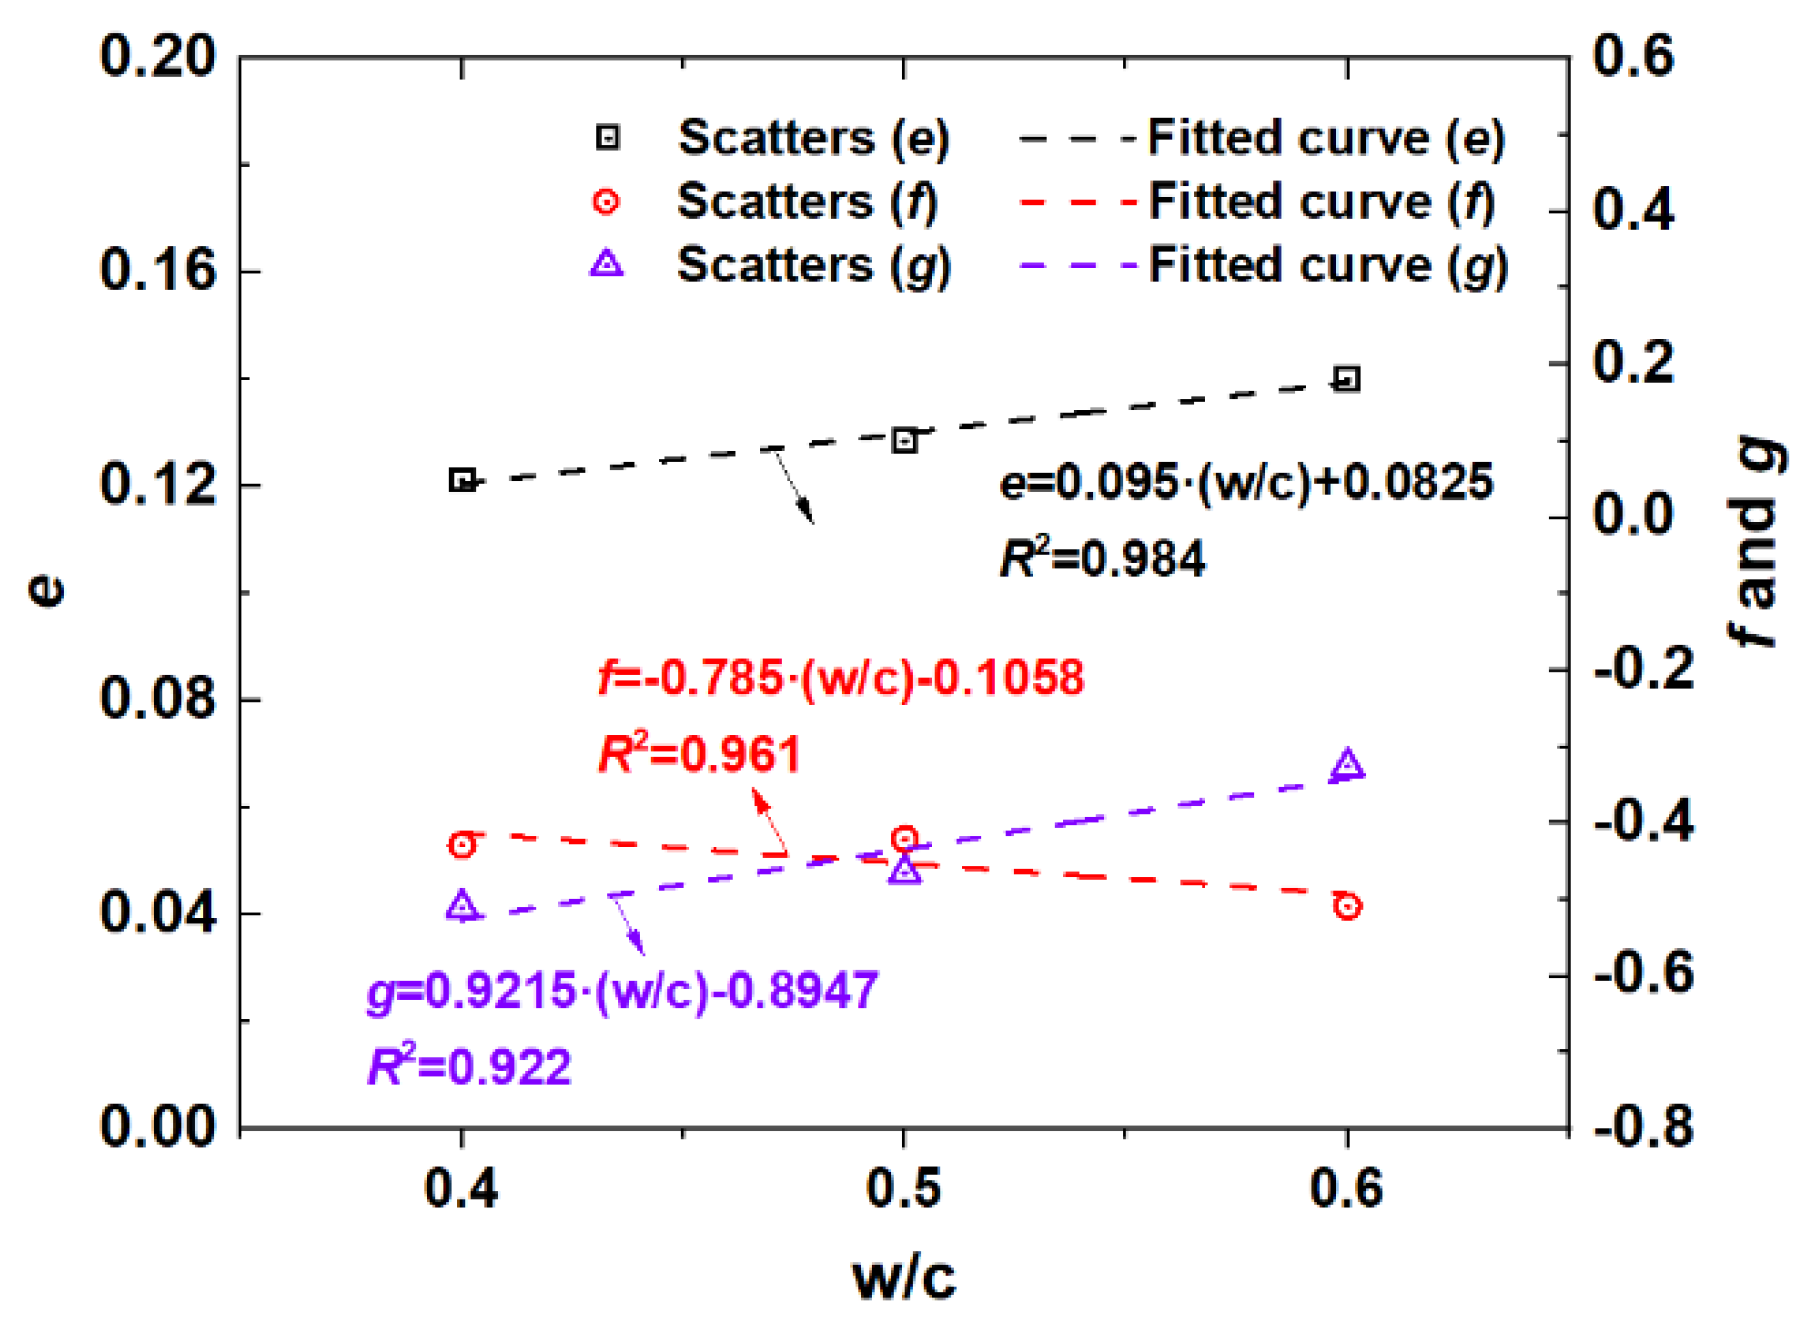
6.1. Model Establishment

According to the aforementioned Cs(t, Vca, Smax), Da(t, Vca, Smax, w/c), and m(w/c), a chloride diffusion model of concrete that accounts for the concrete material factors can be established based on Fick’s second law of diffusion. For this model, the time-dependency of Cs and Da are both considered as well. The expression is shown in Equation (17):
{ C ( x , t , V c a , S m a x , w / c ) = C s ( t , V c a , S m a x ) · [ 1 erf ( x 2 D a ( t , V c a , S m a x , w / c ) · t ) ] D a ( t , V c a , S m a x , w / c ) = D 28 ( V c a , S m a x , w / c ) 1 m · ( t 28 t ) m ( w / c ) C s ( t , V c a , S m a x ) = A ( V c a , N S m a x ) · ln ( t ) + B ( V c a , N S m a x ) A ( V c a , N S m a x ) = C ( N S m a x ) · V c a + 0.2536 B ( V c a , N S m a x ) = E ( N S m a x ) · V c a 0.5776 C ( N S m a x ) = 0.0931 · ln ( N S m a x ) 0.2613 E ( N S m a x ) = 0.1717 · N S m a x + 1.0693 D 28 ( V c a , S m a x , w / c ) = a ( V c a , N S m a x ) · D 28 ( V c a = 0 ) D 28 ( V c a = 0 ) = b ( w / c ) · D 28 ( V c a = 0 , w / c = 0.4 ) D 28 ( V c a = 0 , w / c = 0.4 ) = 5.90 × 10 12 m 2 / s a ( w / c ) = 2.7906 · ( w / c ) 0.1539 b ( V c a , N S m a x ) = c ( N S m a x ) · V c a + 1.002 c ( N S m a x , w / c ) = e ( w / c ) · N S m a x 2 + f ( w / c ) · N S m a x + g ( w / c ) e ( w / c ) = 0.095 · ( w / c ) + 0.0825 f ( w / c ) = 0.785 · ( w / c ) 0.1058 g ( w / c ) = 0.9215 · ( w / c ) 0.8947 m ( w / c ) = 0.1726 · ( w / c ) + 0.3184 .
The model (Equation (17)) can be used to efficiently estimate and predict the spatial and temporal distribution of chloride ion diffusion concentration in concrete under the conditions of arbitrary w/c, Vca and Smax.

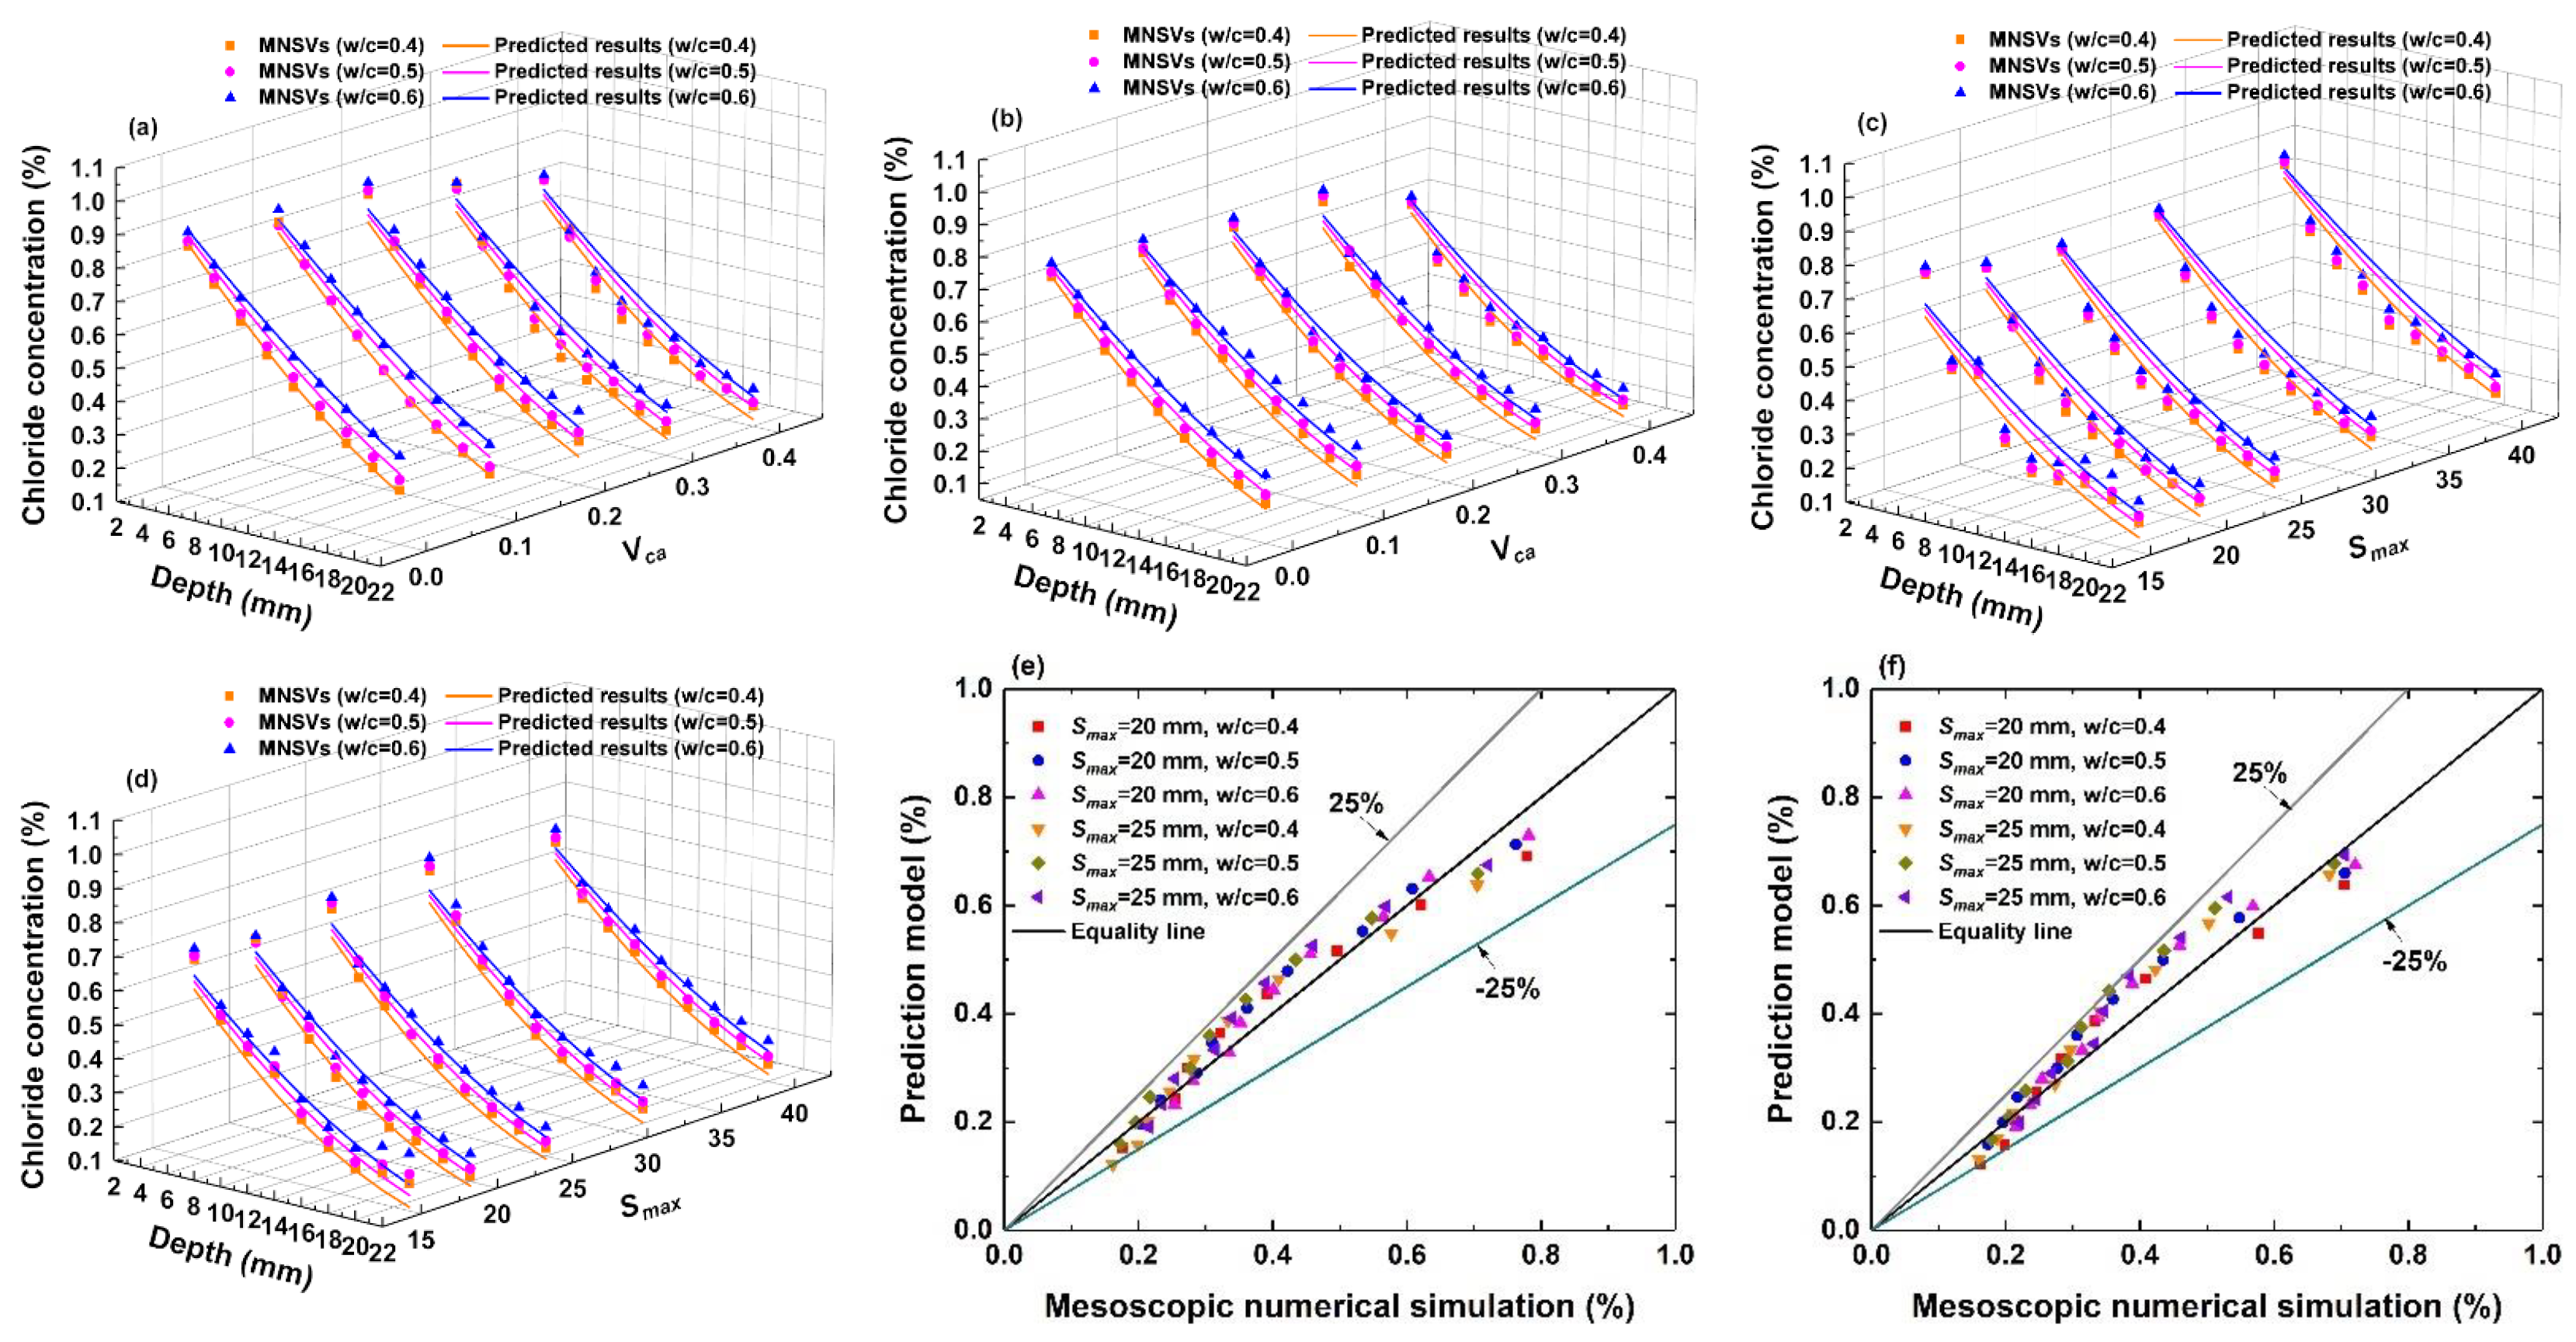
6.2. Model Validation

To verify the reasonability of the estimated model in line with Equation (17), the mesoscopic numerical simulation values (MNSVs) of the chloride concentrations determined by the numerical simulation experiment (Figure 9, Figure 10 and Figure 11) are compared with the predicted chloride results by the prediction model of Equation (17), and the error analysis was carried out. The results are shown in Figure 29.
As shown in Figure 29, the estimated results of the chloride diffusion model in Equation (17) are consistent with the chloride concentrations via mesoscopic numerical simulation, and the relative errors between the two results are within the range of ±25%, thereby verifying the accuracy of the model (Equation (17)) considering the concrete material factor in Equation (17), as presented in this paper’s research work.

7. Conclusions

In this paper, mesoscopic numerical models for concrete with different values of Vca and Smax are constructed, and a large number of chloride ion diffusion simulation experiments are conducted based on these models. The influences of concrete material factors (including w/c, Vca, and Smax) on chloride diffusion characteristics within concrete are quantified. On this basis, a chloride diffusion model considering the concrete material factors is established. The specific conclusions are as follows:
(1)
It is emphasized and proven that the mesoscopic numerical simulation method for concrete can be used to partially replace physical experimentation to investigate the influences of concrete material factors on chloride diffusion behaviors;
(2)
For the impact factor of the w/c, the chloride concentration, D28 and m of concrete increase with increasing w/c, but Cs is unrelated to the w/c. Quantitatively, when Vca = 0.4, Smax = 20 mm, the chloride concentration C(x = 4 mm, t = 600 days), D28, m increase almost 2.3%, 60.1%, and 10.5% with the increasing of w/c from 0.4 to 0.6;
(3)
For the impact factor of Vca, the chloride concentration, Cs and D28 of concrete show decreasing trends with increasing Vca. Especially, when w/c = 0.5, Smax = 20 mm, the chloride concentration C(x = 4 mm, t = 600 days), Cs(t = 600 days), D28, decrease almost 16.4%, 18.5%, and 35.8% with the increasing of Vca from 0 to 0.4. m is unrelated to the change in Vca but is a linear function of the w/c;
(4)
For the impact factor of Smax, there is no significant effect of Smax on chloride concentration and m. Cs is positively correlated with Smax, when w/c = 0.5, Vca = 0.4, the Cs(t = 600 days) increases almost 23.4% with the increasing of Smax from 10 mm to 40 mm. D28 shows a quadratic curve trend of first decreasing and then increasing when Smax is in the range of 16–20 mm. Respectively, when w/c = 0.5, Vca = 0.4, D28(Smax = 40 mm) increases approximately 43.4% and 30.2% than those of Smax = 16 mm and 20 mm;
(5)
According to the quantitative relationship between the chloride diffusion parameters and w/c, Vca, and Smax, a chloride diffusion model that considers the influences of important concrete material factors is established. The accuracy of the model proposed in this paper is verified by comparing the predicted results with mesoscopic numerical simulation values. This model is used to predict the spatial and temporal distribution of the chloride diffusion concentration in concrete for any w/c, Vca and Smax.

Author Contributions

Investigation, data curation, formal analysis, writing—original draft preparation, X.J.; conceptualization, methodology, L.W.; supervision, resources, M.L.; validation, H.J.; data curation, visualization, W.Z. All authors have read and agreed to the published version of the manuscript.

Funding

This research was funded by supported by the Open-end Fund of Key Laboratory of Hydraulic and Waterway Engineering of the Ministry of Education in Chongqing Jiaotong University (SLK2021B13), the Science and Technology Innovation Project of Chongqing Education Commission (KJCX2020030), and the Talents Plan Project in Chongqing (cstc2021ycjh-bgzxm0053).

Institutional Review Board Statement

Not applicable.

Informed Consent Statement

Not applicable.

Data Availability Statement

Not applicable.

Conflicts of Interest

The authors declare no conflict of interest.

References

  1. Nguyen, Q.D.; Afroz, S.; Castel, A. Influence of Calcined Clay Reactivity on the Mechanical Properties and Chloride Diffusion Resistance of Limestone Calcined Clay Cement (LC3) Concrete. J. Mar. Sci. Eng. 2020, 8, 301. [Google Scholar] [CrossRef]
  2. Zhang, J.Z.; Guo, J.; Li, D.H.; Zhang, Y.R.; Bian, F.; Fang, Z.F. The influence of admixture on chloride time-varying diffusivity and microstructure of concrete by low-field NMR. Ocean Eng. 2017, 142, 94–101. [Google Scholar] [CrossRef]
  3. Chen, X.; Shen, J. Experimental Investigation on Deterioration Mechanisms of Concrete under Tensile Stress-Chloride Ion-Carbon Dioxide Multiple Corrosion Environment. J. Mar. Sci. Eng. 2022, 10, 80. [Google Scholar] [CrossRef]
  4. Oktavianus, Y.; Sofi, M.; Lumantarna, E.; Kusuma, G.; Duffield, C. Long-Term Performance of Trestle Bridges: Case Study of an Indonesian Marine Port Structure. J. Mar. Sci. Eng. 2020, 8, 358. [Google Scholar] [CrossRef]
  5. Balestra, C.E.T.; Reichert, T.A.; Pansera, W.A.; Savaris, G. Evaluation of chloride ion penetration through concrete surface electrical resistivity of field naturally degraded structures present in marine environment. Constr. Build. Mater. 2020, 230, 116979. [Google Scholar] [CrossRef]
  6. Balestra, C.E.T.; Reichert, T.A.; Savaris, G. Contribution for durability studies based on chloride profiles analysis of real marine structures in different marine aggressive zones. Constr. Build. Mater. 2019, 206, 140–150. [Google Scholar] [CrossRef]
  7. Valipour, M.; Shekarchi, M.; Arezoumandi, M. Chlorine diffusion resistivity of sustainable green concrete in harsh marine environments. J. Clean. Prod. 2017, 142, 4092–4100. [Google Scholar] [CrossRef]
  8. Balestra, C.E.T.; Reichert, T.A.; Pansera, W.A.; Savaris, G. Chloride profile modeling contemplating the convection zone based on concrete structures present for more than 40 years in different marine aggressive zones. Constr. Build. Mater. 2019, 198, 345–358. [Google Scholar] [CrossRef]
  9. Zhang, Z.M.; Chen, R.; Hu, J.; Wang, Y.Y.; Huang, H.L.; Ma, Y.W.; Zhang, Z.H.; Wang, H.; Yin, S.H.; Wei, J.X.; et al. Corrosion behavior of the reinforcement in chloride-contaminated alkali-activated fly ash pore solution. Compos. Part B Eng. 2021, 224, 109215. [Google Scholar] [CrossRef]
  10. Shao, W.; Nie, Y.H.; Shi, D.D.; Xu, Y.Z. Probabilistic analysis of the behaviour of laterally loaded piles in chloride environments. Ocean Eng. 2020, 217, 107872. [Google Scholar] [CrossRef]
  11. Vázquez, K.; Rodríguez, R.R.; Esteban, M.D. Corrosion Prediction Models in the Reinforcement of Concrete Structures of Offshore Wind Farms. J. Mar. Sci. Eng. 2022, 10, 185. [Google Scholar] [CrossRef]
  12. Zhang, Z.M.; Hu, J.; Ma, Y.W.; Wang, Y.Y.; Huang, H.L.; Zhang, Z.H.; Wei, J.X.; Yin, S.H.; Yu, Q.J. A state-of-the-art review on Ag/AgCl ion-selective electrode used for non-destructive chloride detection in concrete. Compos. Part B Eng. 2020, 200, 108289. [Google Scholar] [CrossRef]
  13. Shen, X.H.; Liu, Q.F.; Hu, Z.; Jiang, W.Q.; Lin, X.S.; Hou, D.S.; Hao, P. Combine ingress of chloride and carbonation in marine-exposed concrete under unsaturated environment: A numerical study. Ocean Eng. 2019, 189, 106350. [Google Scholar] [CrossRef]
  14. De Medeiros-Junior, R.A.; de Lima, M.G.; de Brito, P.C.; de Medeiros MH, F. Chloride penetration into concrete in an offshore platform-analysis of exposure conditions. Ocean Eng. 2015, 103, 78–87. [Google Scholar] [CrossRef]
  15. Afroughsabet, V.; Biolzi, L.; Monteiro, P.J.M. The effect of steel and polypropylene fibers on the chloride diffusivity and drying shrinkage of high-strength concrete. Compos. Part B Eng. 2018, 139, 84–96. [Google Scholar] [CrossRef]
  16. Li, K.; Stroeven, P.; Stroeven, M.; Sluys, L.J. A numerical investigation into the influence of the interfacial transition zone on the permeability of partially saturated cement paste between aggregate surfaces. Cem. Concr. Res. 2017, 102, 99–108. [Google Scholar] [CrossRef]
  17. Jiang, W.Q.; Shen, X.H.; Hong, S.X.; Wu, Z.Y.; Liu, Q.F. Binding capacity and diffusivity of concrete subjected to freeze-thaw and chloride attack: A numerical study. Ocean Eng. 2019, 186, 106093. [Google Scholar] [CrossRef]
  18. Wang, Y.Z.; Liu, C.X.; Li, Q.M.; Wu, L.J. Chloride ion concentration distribution characteristics within concrete covering-layer considering the reinforcement bar presence. Ocean Eng. 2019, 173, 608–616. [Google Scholar] [CrossRef]
  19. Valipour, M.; Pargar, F.; Shekarchi, M.; Khani, S.; Moradian, M. In situ study of chloride ingress in concretes containing natural zeolite, metakaolin and silica fume exposed to various exposure conditions in a harsh marine environment. Constr. Build. Mater. 2013, 46, 63–70. [Google Scholar] [CrossRef]
  20. Jamkar, S.S.; Rao, C.B.K. Index of Aggregate Particle Shape and Texture of coarse aggregate as a parameter for concrete mix proportioning. Cem. Concr. Res. 2004, 34, 2021–2027. [Google Scholar] [CrossRef]
  21. Golewski, G.L.; Szostak, B. Application of the C-S-H Phase Nucleating Agents to Improve the Performance of Sustainable Concrete Composites Containing Fly Ash for Use in the Precast Concrete Industry. Materials 2021, 14, 6514. [Google Scholar] [CrossRef] [PubMed]
  22. Golewski, G.L.; Szostak, B. Strengthening the very early-age structure of cementitious composites with coal fly ash via incorporating a novel nanoadmixture based on C-S-H phase activators. Constr. Build. Mater. 2021, 312, 125426. [Google Scholar] [CrossRef]
  23. Golewski, G.L. Evaluation of morphology and size of cracks of the Interfacial Transition Zone (ITZ) in concrete containing fly ash (FA). J. Hazard. Mater. 2018, 357, 298–304. [Google Scholar] [CrossRef]
  24. Mangat, P.S.; Molloy, B.T. Prediction of long term chloride concentration in concrete. Mater. Struct. 1994, 27, 338–346. [Google Scholar] [CrossRef]
  25. Costa, A.; Appleton, J. Chloride penetration into concrete in marine environment-Part I: Main parameters affecting chloride penetration. Mater. Struct. 1999, 32, 252–259. [Google Scholar] [CrossRef]
  26. Tian, C.; Chen, J.W.; Wei, X.S. The Slice-Resistivity method to measure the chloride ion diffusion coefficient of cementitious materials. Constr. Build. Mater. 2020, 243, 118155. [Google Scholar] [CrossRef]
  27. Chen, J.W.; Tian, C.; Wei, X.S. Experimental and simulation study on chloride permeability in cement paste. Constr. Build. Mater. 2020, 262, 120600. [Google Scholar] [CrossRef]
  28. Gao, Y.H.; Zhang, J.Z.; Zhang, S.; Zhang, Y.R. Probability distribution of convection zone depth of chloride in concrete in a marine tidal environment. Constr. Build. Mater. 2017, 140, 485–495. [Google Scholar] [CrossRef]
  29. Mehdi, K.M.; Seyedhamed, S.; Mohammad, S. Quantifying maximum phenomenon in chloride ion profiles and its influence on service-life prediction of concrete structures exposed to seawater tidal zone—A field oriented study. Constr. Build. Mater. 2018, 180, 109–116. [Google Scholar]
  30. Higashiyama, H.; Yamauchi, K.; Sappakittipakorn, M.; Sano, M.; Takahashi, O. A visual investigation on chloride ingress into ceramic waste aggregate mortars having different water to cement ratios. Constr. Build. Mater. 2013, 40, 1021–1028. [Google Scholar] [CrossRef]
  31. Ribeiro, D.V.; Pinto, S.A.; Amorim Júnior, N.S.; Andrade Neto, J.S.; Santos, I.H.L.; Marques, S.L.; França, M.J. Effects of binders characteristics and concrete dosing parameters on the chloride diffusion coefficient. Cem. Concr. Compos. 2021, 122, 104114. [Google Scholar] [CrossRef]
  32. Du, X.L.; Jin, L.; Ma, G.W. A meso-scale numerical method for the simulation of chloride diffusivity in concrete. Finite Elem. Anal. Des. 2014, 85, 87–100. [Google Scholar] [CrossRef]
  33. Wang, Y.Z.; Wu, L.J.; Wang, Y.C.; Liu, C.X.; Li, Q.M. Effects of coarse aggregates on chloride diffusion coefficients of concrete and interfacial transition zone under experimental drying-wetting cycles. Constr. Build. Mater. 2018, 185, 230–245. [Google Scholar] [CrossRef]
  34. Yang, C.C. Effect of the percolated interfacial transition zone on the chloride migration coefficient of cement-based materials. Mater. Chem. Phys. 2005, 91, 538–544. [Google Scholar] [CrossRef]
  35. Li, L.Y.; Xia, J.; Lin, S.-S. A multi-phase model for predicting the effective diffusion coefficient of chlorides in concrete. Constr. Build. Mater. 2012, 26, 295–301. [Google Scholar] [CrossRef]
  36. Wu, L.J.; Wang, Y.Z.; Wang, Y.C.; Ju, X.L.; Li, Q.M. Modelling of two-dimensional chloride diffusion concentrations considering the heterogeneity of concrete materials. Constr. Build. Mater. 2020, 243, 118213. [Google Scholar] [CrossRef]
  37. Wu, L.J.; Ju, X.L.; Liu, M.W.; Guan, L.; Ma, Y.F.; Li, M.L. Influences of multiple factors on the chloride diffusivity of the interfacial transition zone in concrete composites. Compos. Part B Eng. 2020, 199, 108236. [Google Scholar] [CrossRef]
  38. Grabiec, A.M.; Zawal, D.; Szulc, J. Influence of type and maximum aggregate size on some properties of high-strength concrete made of pozzolana cement in respect of binder and carbon dioxide intensity indexes. Constr. Build. Mater. 2015, 98, 17–24. [Google Scholar] [CrossRef]
  39. Gao, P.; Chen, Y.; Huang, H.; Qian, Z.; Schlangen, E.; Wei, J.; Yu, Q. Effect of coarse aggregate size on non-uniform stress/strain and drying-induced microcracking in concrete. Compos. Part B Eng. 2021, 216, 108880. [Google Scholar] [CrossRef]
  40. Basheer, L.; Basheer, P.A.M.; Long, A.E. Influence of coarse aggregate on the permeation, durability and the microstructure characteristics of ordinary Portland cement concrete. Constr. Build. Mater. 2005, 19, 682–690. [Google Scholar] [CrossRef]
  41. Pang, L.; Li, Q. Service life prediction of RC structures in marine environment using long term chloride ingress data: Comparison between exposure trials and real structure surveys. Constr. Build. Mater. 2016, 113, 979–987. [Google Scholar] [CrossRef]
  42. ASTM C1218; Standard Test Method for Water-Soluble Chloride in Mortar and Concrete. ASTM International (ASTM): West Conshohocken, PA, USA, 2020.
  43. Pack, S.W.; Jung, M.S.; Song, H.W.; Kim, S.H.; Ann, K.Y. Prediction of time dependent chloride transport in concrete structures exposed to a marine environment. Cem. Concr. Res. 2010, 40, 302–312. [Google Scholar] [CrossRef]
  44. Wang, Y.Z.; Wu, L.J.; Wang, Y.C.; Li, Q.M.; Xiao, Z. Prediction model of long-term chloride diffusion into plain concrete considering the effect of the heterogeneity of materials exposed to marine tidal zone. Constr. Build. Mater. 2018, 159, 297–315. [Google Scholar] [CrossRef]
  45. Gao, Y.; de Schutter, G.; Ye, G.; Tan, Z.; Wu, K. The ITZ microstructure, thickness and porosity in blended cementitious composite: Effects of curing age, water to binder ratio and aggregate content. Compos. Part B Eng. 2014, 60, 1–13. [Google Scholar] [CrossRef]
Figure 1. Chloride concentration profiles in mortar specimen at different exposure times: (a) w/c = 0.4; (b) w/c = 0.5; (c) w/c = 0.6.
Jmse 10 00917 g001
Figure 2. Chloride concentration profiles in concrete specimen versus depths at different exposure times: (a) w/c = 0.4; (b) w/c = 0.5; (c) w/c = 0.6.
Jmse 10 00917 g002
Figure 3. Regression parameters for mortar specimen: (a) Cs(t); (b) Da.
Jmse 10 00917 g003
Figure 4. Three-phase concrete composites composed by mortar, coarse aggregate, and ITZ.
Jmse 10 00917 g004
Figure 5. Mesoscopic numerical model of concrete: (a) w/c = 0.4, Vca = 0.42; (b) w/c = 0.5, Vca = 0.44; (c) w/c = 0.6, Vca = 0.45.
Jmse 10 00917 g005
Figure 6. Comparison of the chloride concentration profiles in concrete based on the physical experiment and the mesoscopic numerical simulation method: (a) w/c = 0.4; (b) w/c = 0.5; (c) w/c = 0.6.
Jmse 10 00917 g006
Figure 7. Comparison of the chloride concentrations determined by mesoscopic numerical simulation method versus those of the experiment.
Jmse 10 00917 g007
Figure 8. Mesoscopic numerical models of concrete: (a) Vca = 0; (b) Vca = 0.2, Smax = 25 mm; (c) Vca = 0.3, Smax = 20 mm; (d) Vca = 0.3, Smax = 31.5 mm; (e) Vca = 0.4, Smax = 25 mm; (f) Vca = 0.4, Smax = 40 mm.
Jmse 10 00917 g008
Figure 9. Chloride profiles in mesoscopic numerical models of concrete: (a) Smax = 25 mm, t = 360 d; (b) Smax = 20 mm, t = 600 d.
Jmse 10 00917 g009
Figure 10. Chloride profiles in mesoscopic numerical models of concrete: (a) Smax = 25 mm, t = 360 d; (b) Smax = 20 mm, t = 600 d.
Jmse 10 00917 g010
Figure 11. Chloride profiles in mesoscopic numerical model of concrete: (a) Vca = 0.3, t = 360 d; (b) Vca = 0.4, t = 600 d.
Jmse 10 00917 g011
Figure 12. Surface chloride concentrations of mesoscopic numerical model for concrete: (a) Vca = 0.3, Smax = 20 mm; (b) Vca = 0.4, Smax = 25 mm.
Jmse 10 00917 g012
Figure 13. Surface chloride concentration of mesoscopic numerical model of concrete: (a) w/c = 0.4, Smax = 16 mm; (b) w/c = 0.5, Smax = 20 mm; (c) w/c = 0.6, Smax = 25 mm.
Jmse 10 00917 g013
Figure 14. Surface chloride concentration of mesoscopic numerical model of concrete: (a) w/c = 0.4, Vca = 0.2; (b) w/c = 0.5, Vca = 0.3; (c) w/c = 0.6, Vca = 0.4.
Jmse 10 00917 g014
Figure 15. Regression parameters of A and B with different Smax values versus Vca: (a) Variation trend of parameter A; (b) Variation trend of parameter B.
Jmse 10 00917 g015
Figure 16. Regression parameters C and D versus NSmax.
Jmse 10 00917 g016
Figure 17. Regression parameters E and F versus NSmax.
Jmse 10 00917 g017
Figure 18. Reference chloride diffusion coefficient D28 versus w/c: (a) Vca = 0.4; (b) Smax = 20 mm.
Jmse 10 00917 g018
Figure 19. Reference chloride diffusion coefficient D28 versus Vca: (a) Smax = 20 mm; (b) w/c = 0.4.
Jmse 10 00917 g019
Figure 20. Reference chloride diffusion coefficient D28 versus Smax: (a) Vca = 0.4; (b) w/c = 0.4.
Jmse 10 00917 g020
Figure 21. w/c impact parameter a in mesoscopic numerical model for concrete.
Jmse 10 00917 g021
Figure 22. Corrected parameter b versus Vca: (a) w/c = 0.4; (b) w/c = 0.5; (c) w/c = 0.6.
Jmse 10 00917 g022
Figure 23. Corrected parameters c, d versus NSmax: (a) parameter c; (b) parameter d.
Jmse 10 00917 g023
Figure 24. Corrected parameters e, f, g versus w/c.
Jmse 10 00917 g024
Figure 25. Aging factor m versus w/c: (a) Vca = 0.4; (b) Smax = 20 mm.
Jmse 10 00917 g025
Figure 26. Aging factor m versus Vca: (a) Smax = 20 mm; (b) w/c = 0.4.
Jmse 10 00917 g026
Figure 27. Aging factor m versus Smax: (a) Vca = 0.4; (b) w/c = 0.4.
Jmse 10 00917 g027
Figure 28. Average aging factor m versus w/c.
Jmse 10 00917 g028
Figure 29. Comparison of the chloride concentration results by mesoscopic numerical simulation and those via prediction model Equation (17): (a) Smax = 20 mm, t = 600 d; (b) Smax = 25 mm, t = 360 d; (c) Vca = 0.4, t = 600 d; (d) Vca = 0.3, t = 360 d; (e) predicted results vs. MNSVs: Smax = 20 mm, t = 600 d; (f) predicted results vs. MNSVs: Vca = 0.4, t = 600.
Jmse 10 00917 g029
Table 1. Mortar mixture details.
w/cWater (kg/m3)Cement (kg/m3)Sand (kg/m3)
0.43258131002
0.53426841114
0.63545901195
Table 2. Concrete mixture details.
w/cWater (kg/m3)Cement (kg/m3)Sand (kg/m3)Coarse Aggregate (kg/m3)Vca
0.419548860111160.415
0.519539063511800.439
0.619532565812220.454
Table 3. Chloride diffusion parameters for mortars with different w/c.
w/cCs(t)D28m (×10−12 m2/s)t28 (Day)m
0.4 5.90 0.5338
0.50.2427·ln(t) − 0.48886.77280.5553
0.6 9.20 0.5626
Table 4. Conditions of the mesoscopic numerical simulation experiment.
w/cVcaSmax (mm)
0.40------
0.15–105–165–205–255–31.55–40
0.25–105–165–205–255–31.55–40
0.35–105–165–205–255–31.55–40
0.45–105–165–205–255–31.55–40
0.50------
0.15–105–165–205–255–31.55–40
0.25–105–165–205–255–31.55–40
0.35–105–165–205–255–31.55–40
0.45–105–165–205–255–31.55–40
0.60------
0.15–105–165–205–255–31.55–40
0.25–105–165–205–255–31.55–40
0.35–105–165–205–255–31.55–40
0.45–105–165–205–255–31.55–40
Table 5. Normalized ITZ chloride diffusivities, Dnitz.
VcaSmax (mm)
1016202531.540
0.19.0512.7716.0621.3931.0650.56
0.28.1811.7514.9620.2529.9950.13
0.37.2310.5913.6618.7728.3748.70
0.46.239.2912.1316.9226.1046.01
Publisher’s Note: MDPI stays neutral with regard to jurisdictional claims in published maps and institutional affiliations.

