Article

Parametric Design and Numerical Investigation of Hydrodynamic Characteristics of a New Type of Armour Block TB-CUBE Based on SPH Method

National Engineering Research Center of Port Hydraulic Construction Technology, Tianjin Research Institute for Water Transport Engineering, Tianjin 300456, China
*
Author to whom correspondence should be addressed.
J. Mar. Sci. Eng. 2022, 10(8), 1116; https://doi.org/10.3390/jmse10081116
Submission received: 6 June 2022 / Revised: 5 August 2022 / Accepted: 5 August 2022 / Published: 13 August 2022
(This article belongs to the Special Issue Coastal Engineering: Sustainability and New Technologies)

Abstract

:
Based on the open-source code DualSPHysics, a numerical model was conducted to simulate the regular wave transformation on the slope breakwater with artificial block, and the simulation results were verified according to the measured data from the physical experiment. The deviation between the numerical model and the measured data was less than 6% and 9% in wave run-up and overtopping, respectively, which demonstrated the model can reliably capture the wave evolution on the breakwater with an artificial block. Based on this verified model, the size of the artificial block was adjusted to obtain optimal wave-damping effects. Once obtained, the hydrodynamic characteristics of the optimized new artificial block TB-CUBE were further studied, and the effects of the breakwater slope, water depth in front of the breakwater, incident wave period, and the height on wave run-up were all analyzed. Finally, an empirical formula for wave run-up on this type of article block was suggested through data-fitting, for which the correlation coefficient is 0.981.

1. Introduction

The implementation of an armor unit or artificial block [1] on rubble mound breakwaters is a typical approach for wave mitigation and ocean disaster prevention. It is of great scientific significance and practical engineering value to comprehend the hydrodynamic characteristics of the armor unit under wave force and harness its wave damping effect. Numerical simulation methods, not limited by time and space, to unravel this armor unit’s performance have been widely applied in coastal engineering around the world, and a large number of numerical methods for the interaction between waves and coastal structures have been developed, including the Boundary Element Method [2,3], the Finite Volume Method [4,5], the Arbitrary Lagrangian Eulerian Method [6,7], the Finite Element Method [8,9], and also particle-based methods, such as, Moving Particle Semi-implicit method (MPS) [10] and Smoothed-Particle-Hydrodynamics (SPH) [11]. Open source code including OpenFOAM [12], SWASH [13] and SPHysics [14], have been extensively investigated and adopted during the last several decades.
Among them, the pure particle method that is based on SPH [11], not constrained by the fixed grid, is feasible for solving large deformation free surface flow problems [15] such as wave breaking [16], liquid splashing [17], the interaction between waves and porous media [18], and other fields that the traditional grid simulation methods cannot accurately describe. When SPH was created, the simulation of the real sea state and wave conditions was restricted by limited computer resources. Then, due to algorithm improvements, such as the use of graphics processors, the calculation efficiency has been substantially improved [19]. It began to be widely used in coastal engineering practices [20,21,22,23], making it feasible to simulate a wave overtopping scenario with a duration of 1000 irregular wave cycles under real sea conditions [24].
Since these improvements, the SPH has been applied to a variety of uses. Dominguez et al. [25] used DualSPHysics and MoorDyn [26], a coupled model, to simulate the dynamic response of the anchored floating structure under the regular wave forcing, which would been further applied in security assessments of offshore structures such as floating offshore wind turbines, offshore oil platforms, and wave energy converters under real sea conditions. Additionally, SPH has been coupled with the Finite Element Method to investigate the wave-debris-structure interaction for the risk assessment of coastal structures during extreme tsunami events [27]. Crespo et al. [28] used SPH to explore the interaction between waves and floating oscillating water column wave energy converters, but due to the lack of an effective wave-making and wave-absorbing systems, it was limited in practical operation [29]. Meringolo et al. [30] simulated the interaction between waves and permeable caisson breakwaters based on a two-dimensional SPH model with artificial viscous terms. The simulation results showed the reduction of wave pressure at the sea wall holes, and revealed that the empirical formula [31] inaccurately estimated the wave pressure previously due to neglect the existence of sea wall holes. Monaghan et al. [32] and Dalrymple et al. [21] studied the propagation of solitary waves on the beach, and the climbing and overtopping of waves on breakwaters with different roughness, but they did not consider the effect of an armor block. Altomare et al. [33] used the DualSPHysics [19,34] open-source code for the first time to gain insights for the interaction between waves and a 3D breakwater with armor units, and their numerical model results are in good agreement with the measurement data and empirical formula.
The use of armor blocks, including Accropode®, Xbloc®, and Core-Loc™ has been a classical solution for coastal structure construction [1]. There has been a sustaining effect for new type of armor block development [35,36,37] to achieve better wave damping and low consumption of concrete. Suffice it to say, there is considerable uncertainty in how to effectively protect the coastal structure when facing of longer and larger waves in further deeper coastal waters where more construction has taken place, and this coastal structure is more vulnerable in confronting ocean disasters that are associated with more concern for global warming [38].
High porosity block is promising in coping with this long period wave. The interactions between the armor blocks and the waves on breakwater could be categorized as the interaction of a wave and solid objects, which has been extensively studied numerically [39,40]. The wave run-up and wave overtopping of various blocks under different breakwater structures are quite different, and the empirical formulas that are given by standards could hardly cover all of the structures and blocks, which limits its application. Therefore, it is still necessary to develop new types of amour units and evaluate their function.
Massive physical experiment scenarios would be required for the size parametric selection before the generation of a new type of armor unit, which is largely inefficient. Meanwhile, through the establishment of a numerical model that describes the wave-breakwater-armor-unit interaction could be a solid, low-cost, and efficient tool for abundant parametric selection scenarios under various wave input conditions.
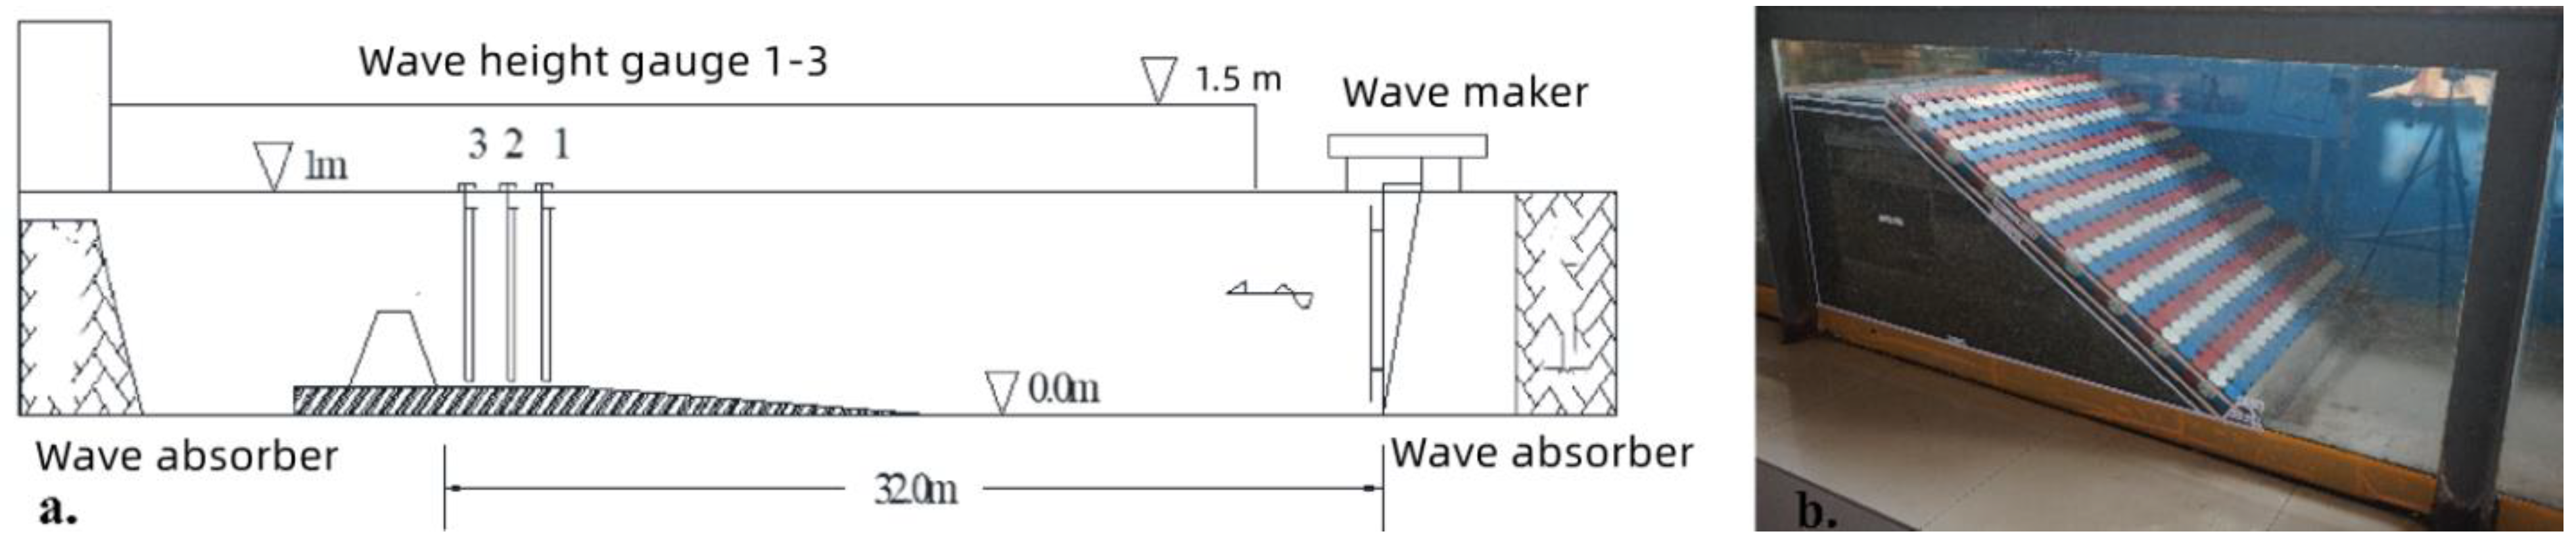
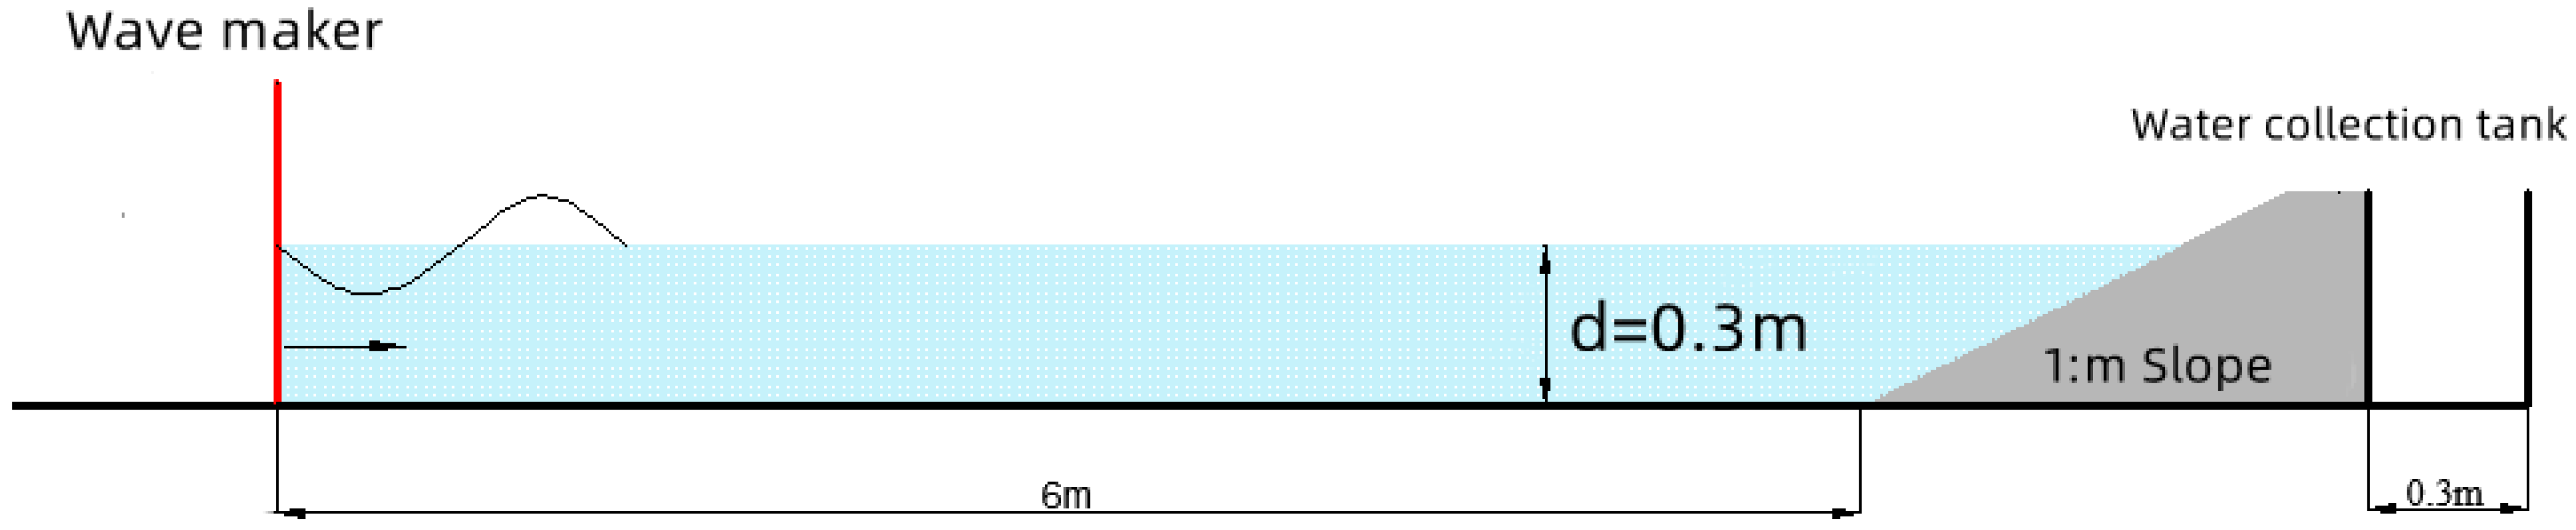
The chief objective of this paper is to optimize the size of a new type of armor block and to gain insight into its wave damping effects. To achieve that, a wave-breakwater-block numerical model that was based on the open-source code DualSPHysics was established to simulate the climbing and overtopping of regular waves on a rubble mound breakwater. First, the numerical results are verified with the results of the physical model test. After that, with this verified model, sensitivity studies are conducted to evaluate the effect of blocks on wave damping with a diversity of design sizes to provide the optimal size. After optimization, the hydrodynamic characteristics of the new artificial block are further explored and a wave run-up empirical formula for this block is provided. Finally, the conclusion and research limitations are given.

2. Materials and Methods

2.1. Block Description

The block TB-CUBE [37], the research object of this paper, was independently developed by the Tianjin Research Institute for Water Transport Engineering (TIWTE). The block is based on a cube, including four 1/4 spherical cavities, eight 1/4 cylindrical cavities, and four 1/2 cylindrical cavities. The shape of the block and the definition of the dimensions are shown in Figure 1. When a wave enters the chamber that is formed in the block during the climbing process on the slope, a vortex is initiated. During the wave’s interaction with the concreate surface in the chamber of the hole, energy is dissipated, thus achieving its purpose of wave attenuation. The TB-CUBE block features the advantages of high porosity, flexible replacement adaptability, high stability, and solid structural strength.

2.2. Physical Model Experiment

2D physical model tests for wave run-up of this new artificial block (TB-CUBE) on slope breakwater have been carried out in the wave tank at TIWTE, which is 70 m long, 1 m wide, and 1.5 m height. The geometric scale of the model was 1:40, the test section was a slope structure, and the weight of the TB-CUBE block was 152 g. There was a block stone cushion with a thickness of 25 mm that weighed around 1/10 to 1/20 of the weight of the TB-CUBE block. The layout of the physical model is shown in Figure 2. A total of 20 blocks were installed across the flume width during the experiments. In the test, the climbing and reflection of the TB-CUBE under different combinations of water levels, periods, wave heights, and slopes were experimentally studied. The physical experiment wave parameters are shown in Table 1, which is also the input conditions for the numerical experiment.
Kr = Hr/Hi
where Kr is the reflection, and Hr and Hi are the reflect wave and the incident wave, respectively.
Armor unit #4 in Table 2 was employed for the physical experiment, while other armor units would be used for the numerical model test in Section 2.3.3.

2.3. Numerical Model

2.3.1. SPH Equations

The main features of the DualSPHysics code are described in other references [19,29,34]. Here, the main features of the solution would be presented. The governing equations for discrete SPH Lagrangian system that simulates weakly compressible fluid, following Monaghan [41], are:
d ρ i d t = j m j   ( V i V j )   i W i j  
d V i d t = j   m j   ( P i + P j ρ i ρ j + E i j ) i   W i j + g
where t is the time, V is the velocity, P is the pressure, ρ is the density, m is the mass, and g is the gravitational acceleration. Wij is the kernel function that depends on the distance between particles i and j, as presented in (4). The quintic kernel [42], where the weighting function vanishes for inter-particle distances that are longer than 2 hSL (hSL is the smoothing length), was employed in this study. Eij is the artificial viscosity term provided in DualSPHysics from Monaghan [41].
W ( r , h S L ) = α D ( 1 0.5 q ) 4 ( 2 q + 1 ) ,   0 q 1
where q = r/hSL, r is the distance between any given two particles i and j, αD is equal to (hSL)3/π. In DualSPHysics, it is based on weakly compressible fluid assumption, allowing the use of state equation to determine the fluid pressure [11].
P = B [ ( ρ ρ r ) 7 1 ]
where B = c02 ρ0/7, ρ0 is the reference density and c0 the numerical speed of sound.

2.3.2. Boundary Conditions

The default dynamic boundary condition from Crespo et al. [43] was used except two sidewalls in the following numerical wave flume. The boundary particles meet the same equations as other fluid particles. However, they would not move according to the forces that were imposed on them. Instead, they remain either fixed in position or move according to the assigned function. Once a particle moves close to a boundary and the distance between the boundary particles and the fluid particles is shorter than 2 hSL, the density of the affected boundary particles rises, leading to the pressure enhancement. Consequently, there would be a repulsive force that was imposed on the fluid particle due from the pressure term in the momentum equation.

2.3.3. Numerical Wave Flume Description

The side length of the TB-CUBE block was set at 2 m, and the TB-CUBE block structure was established by 3D AutoCAD, which was imported into DualSPHysics in the form of an STL file to generate discrete particles. To reproduce the elaborated shape of the block and the inter-particle size, dp was set at 0.001 m after tuning. The method of establishing the numerical model of the breakwater was same as the modeling method of the aforementioned block, as displayed in Figure 3.
In the DualSPHysics model, the active absorbing wave-making program was introduced through C++ programming to provide dynamic boundary conditions and periodic boundary conditions. In the 3D wave tank model, since the two sidewalls of the tank were in the same direction as the wave propagation, the sidewall particles exerted a particularly large repulsive force on the adjacent fluid particles, resulting in incorrect numerical dissipation. This problem was avoided by using periodic boundary conditions, while the rest of the walls were still set as default dynamic boundary conditions.
The three-dimensional numerical wave tank has a total length of 8 m, a width of 0.1 m, and a height of 1 m. The wave-making plate is 0.1 m wide, 0.6 m high, and is located 0.5 m from the left end of the tank.
The constructed numerical wave model was used to verify the TB-CUBE block climbing and wave overtopping to ensure the reliability of the numerical model. The geometric scale of 1:40 was selected for numerical simulation, consistent with the physical experiment. The slope breakwater was located at a distance of 6 m from the wave-making plate, and two rows of TB-CUBE blocks were laid on the simplified impervious slope. The block model had a side length of 0.05 m. A water collecting tank with a length of 0.3 m, a width of 0.1 m, and a height of 0.4 m, was arranged behind the breakwater to collect the overtopped water. In order to take the requirements of accurate simulation of block shape and calculation accuracy into account, the particle spacing in this experiment was set to 0.003 m, and the model layout is shown in Figure 4.
The TB-CUBE block is a specially shaped block with involved porosity that was obtained by digging out spheres and cylinders of a certain size from the cube-based block. Therefore, the porosity can be adjusted by changing the size of the spheres and cylinders. The use of the numerical wave model was to evaluate its run-up and overtopping, to explore its hydrodynamic properties, and to optimize its structural size. To determine the block shape with the optimal wave elimination effect, six representative blocks with different detailed sizes were selected, as shown in Table 2.

3. Results

3.1. Model Validation

Table 3 and Table 4 presented the comparison of wave climb-up and wave overtopping from the numerical model and wave flume physical experiment. The deviations of the numerical results of wave run-up and overtopping and results from the physical model have not exceeded 6% and 9%, respectively, and the numerical model also reproduced the trend of the reflection coefficient variation. It can be demonstrated that the numerical model can accurately simulate the wave run-up and overtopping of waves along slope breakwater that was covered with the TB-CUBE.

3.2. Block Structure Optimization Study

Numerical calculations of each type of block to evaluate its run-up and overtopping have been carried out and the case for d = 0.3 m, H = 0.12 m, T = 1.8 s was selected for results discussion.
Figure 5 is a snapshot of the climbing waves (at t = 10.8 s) and the overtopping of the waves (at t = 26.05 s) on the slopes of the six types of armor units, respectively. During the climb and fall of the wave, water particles penetrate into the pores of the block, dissipating partial wave energy. Adjusting the relative radius of the cylinder (R2) while keeping the relative radius of the sphere (R1) constant allows for a higher or lower amount of water to fall into the pores of the block. For example, in Figure 5, block #2 has a greater R2 than block #1 (Table 2), which led to more water entering the block and a more rapid dissipation of energy. Due to this difference, the climbing height of block #2 was shorter than that of block #1, with its values at 0.138 m (#2) and 0.178 m (#1), respectively. However, the smaller circular pore size of block #1 reduces the ability for fluid particles to jump out of the block pores, leading to the threshold effect. Consequently, more water is held in the block cavity without overtopping the breakwater, which eventually led to less overtopping from block #1 when compared to block #2. Their values were 0.659 (#1), and 0.758 (#2) L/(m·s), respectively.
Alternatively, adjusting R1 while keeping R2 invariant would change the porosity of the block. Looking at blocks #1, #3, and #5 as examples, their R1 values were set at 0.45 h, 0.40 h, and 0.475 h (Table 2), respectively, with diversity in porosity (46%, 40%, and 50%). As the porosity increases, the energy dissipation of the wave during the climbing process was greater, and the final performance was such that the climb of block #5 were the smallest values among the three, with block #1 as the second and block #3 the largest. The climb values were 0.178, 0.188, and 0.168 m for #1, #3, and #5, respectively.
The results of the climbing heights, reflection coefficients, and overtopping of different blocks from numerical solutions are plotted in Figure 6. It can be seen from the figure that when the radius of the sphere (R1) was constant, the climbing height and reflection coefficient decreased with the increase of the cylinder size (R2), while the amount of overtopping wave increased. When the cylinder radius (R2) was constant, the climbing height and wave volume decreased with the increase of the sphere size (R1). Given the above factors such as block climb, reflection coefficient, overtopping waves, block porosity, and material consumption, block #6 had the best overall performance and block #6 would be used for TB-CUBE block design parameter and for further hydrodynamic characteristics investigation.

3.3. Regular Wave Run-Up

Using the numerical wave tank that was constructed, a TB-CUBE hydrodynamic characteristics simulation study was carried out for block #6 with the best performance by the above-mentioned optimization comparison. The distribution of the flow velocity of the wave on the smooth slope versus the TB-CUBE and the climbing and falling on the block slope are shown from Figure 7, Figure 8, Figure 9, Figure 10 and Figure 11 for t = 5.25 s, 5.45 s, 5.75 s, 6.15 s, and 6.45 s, respectively (a and b for without TB-CUBE; c and d for with TB-CUBE). These figures depict the complete process of wave propagation to the front of the breakwater, the wave climbing on the slope, the exhaustion of the wave energy when climbing to the highest point, and the wave falling back.
Figure 7 showed that when the wave reached the front of the breakwater, the wave was in a regular shape, with some reflection from the breakwater. The cases with TB-CUBE (Figure 7c,d) showed more reflection than the case without one (Figure 7a,b). The case with TB-CUBE revealed less climbing up energy due to the resistance from the armor unit. Figure 8 shows the moment that the wave touched the slope and began to climb along the breakwater. At this time, the velocity of the water particle on the slope was relatively large. For the smooth slope, the wave is more energetic to achieve high placement (Figure 8b). Figure 9 showed that as the wave gradually climbed on the breakwater, the flow velocity gradually decreased to zero, and reached the maximum height for both the cases with TB-CUBE (Figure 9c,d)and without one (Figure 9a,b). When the wave reached the location of the TB-CUBE block, part of the water also entered the block hole, leading to wave energy and a pronouncedly shorter climb distance on the TB-CUBE breakwater surface (Figure 9c,d) than the smooth slope (Figure 9a,b). The discrepancy in the climbing distance has been clearly displayed in Figure 9b,d. The reflective wave was still stronger in the cases with TB-CUBE block (Figure 9c,d). Figure 10 shows that when the fluid began to fall back along the breakwater due to its own gravity, the flow velocity gradually fortified. At this time, the TB-CUBE had a certain hindering effect on the backflow, so the backflow velocity was lower than that on the smooth slope (Figure 10a,b). Substantial water was trapped in the hole of the block. Figure 11 shows that the falling water met the following wave front, breaking before the breakwater. The flow velocity in the breaking area was large and disorderly, and then the next cycle of climbing began.

3.4. Regular Wave Overtopping

The wave overtopping process on slope breakwater laid with TB-CUBE under regular waves roughly contained five stages: wave propagation to the front of the breakwater, wave breaking, wave climbing along the breakwater, wave overtopping over the breakwater, and fluid falling back. Figure 12 displays the flow velocity at t = 7.70 s, t = 7.80 s, t = 7.90 s, t = 8.05 s, t = 8.30 s, and t = 9.00 s, respectively. Figure 12a describes the wave breaking on the breakwater. Figure 12b shows the wave climbing up the slope and the fluid with higher flow velocity climbing higher. Figure 12c shows that when the waves climbed to the top of the breakwater, the fluid with a high velocity jumped up to the top surface of the breakwater, while the water particles with low velocity in the lower layer flowed into the pores of the block on the top of the breakwater. Figure 12d presents that the waves passed over the top of the breakwater to form overtopping, but it is worth noting that partial water was trapped in the block cavity on the top of the breakwater due to the threshold effect that was generated by the structural properties of the TB-CUBE. Figure 12e,f shows that the water fell back along the slope, and a vortex was formed in front of the breakwater where the flow velocity was disordered and turbulent, and then the next cycle of the wave overtopping process began.

4. Discussion

4.1. Roughness of Block

For further insights on the wave dissipation characteristics of the TB-CUBE block, the roughness coefficient K from the numerical experiment results was obtained from the ratio of wave run-up level on slope breakwater with TB-CUBE block and smooth slope breakwater. The mean K for the TB-CUBE block is 0.462 (Table 5). Comparing the roughness coefficients of various blocks [1], the roughness coefficient of the TB-CUBE is less than 0.5 as well, indicating its preferable performance in wave damping.
K = Rblock/Rsmooth,
where K is the roughness coefficient, and Rblock and Rsmooth are the wave run-up values on slope breakwater with this TB-CUBE and that on a smooth breakwater, respectively.

4.2. Effect of Slope

Figure 13 shows the relationship between the relative wave run-up (R/H) and the breakwater slope with different incident wave heights from the numerical results. The relationship between R/H and the breakwater slope displays a single-peak curve trend, meaning that the run-up value increases first and then decreases as the slope increases. When the slope is steeper, most of the wave energy has been consumed by the reflection, so the climb is small. As the slope varies from 1.5 to 2, moving toward mildness, the reflection decreases. During that, some amount of the wave energy is converted into potential energy, so the climbing increases substantially. Taking H = 4.8 m and T = 6 s (Figure 13a) as an example, the relative climbing height of the wave increases from 1.23 to 1.67. When the slope changes from 2 to 2.5, the slope becomes milder and the waves break in front of the breakwater, with the dissipation of abundant wave energy. In addition, the climbing net distance of the wave increases on the mild slope, along with the enhanced wave energy dissipation due to increased friction and turbulent energy dissipation. Therefore, the run-up value becomes smaller. For the case of H = 4.8 m and T = 6 s, the relative wave run-up drops from 1.67 to 0.99 (Figure 13a).

4.3. Effect of Inverse Wave Steepness

Figure 14a illustrates the relationship between the reflection coefficient and inverse wave steepness under different slopes from the numerical solutions. The reflection coefficient decreases as the slope becomes gentler. When the slope is constant, and the wave steepness is small, a large amount of wave break occurs. As the wave steepness increases, the wave breaking decreases and is replaced by the reflection wave that increases gradually. When the wave steepness reaches a certain value, the reflection coefficient tends to be stable. Figure 14b,c display the relationship between the height and inverse wave steepness at various periods. The relative wave run-up (R/H) and inverse wave steepness (L/H) are generally positively correlated, meaning that the relative wave run-up elevates with the increase of inverse wave steepness. When inverse wave steepness is small, abundant waves are broken in front of the breakwater, and the wave energy is dissipated. Nevertheless, if it increases further, the amount of breaking wave would also further reduce and meanwhile the wave reflection is enhanced, contributing to a slow rise in the climbing.

4.4. Wave Breaking Parameter

The well-accepted wave breaking parameter Iribarren number ζ0 [44,45] is employed to describe the wave breaking, including three types: spilling breaker (ζ0 < 0.5), surging breaker (0.5 < ζ0 < 3.3), or plunging breaker (ζ0 > 3.3). Figure 15 shows the relationship between the relative wave run-up and the breaking wave parameters from the numerical simulations. When the slope m = 1.5, the minimum breaking wave parameter is 2.33, and the waves are mostly plunging wave. When m = 2, and the wave height is greater than 3.2 m, the waves appear as a surging wave. When the wave height is less than 3.2 m, it is mainly in the form of plunging wave. When m = 2.5 and the breaking wave parameter is in the range of 1.40 to 3.31, the breaking wave becomes a surging breaker.
In general, the relative climbing height increases with the increase of the breaking wave parameter. When the breaking wave parameter is less than 2.5, the relative climbing height increases rapidly with the increase of the breaking wave parameter and the wave mainly appears as a surging breaking wave. The wave is completely broken, the reflected wave decreases, and the climbing height and the breaking wave parameter show a good linear relationship.
When the breaking wave parameter is greater than 2.5, the relative climbing height increase displays a blunt trend. When the wave parameters become larger, the waves break in the form of plunging breakers in front of the breakwater, and together with the accumulation of the reflected waves, the wave run-up and breaking wave parameters increase nonlinearly.

4.5. Empirical Formula for Wave Run-Up

Using the dimensionless parameter relative to the wave-runup R/H and the inverse wave steepness L/H as parameters, the relationship between R/H and L/H at different slopes is nonlinearly fitted, so as to determine the corresponding slope of the breakwater at different slopes. The fitting results are shown in Figure 16, and the values of A(m), B(m), and C(m) are shown in Table 6.
Then, the coefficients A(m), B(m), and C(m) under different slopes in Table 6 were fitted with the slope m value, and the relationship between the slope function and the slope was obtained through analysis. After fitting each formula, the empirical formula of wave climbing on the new armor block TB-CUBE was finally obtained, as shown in the following Formulas (6) to (9):
R = H e x p [ A ( m ) + B ( m ) L H + C ( m ) ( L H ) 2 ]
A ( m ) = 0.677 0.048 e x p ( m 0.92 )
B ( m ) = 0.007 + 7.14 × 10 8 e x p ( m 0.201 )
C ( m ) = 2.84 × 10 4 7.15 × 10 10 1.39 e x p ( m 0.195 )
in which R is the wave run-up value, L is the wavelength (m), H is the average wave height in front of the slope breakwater (m), and m is the slope of the breakwater. Numerical experimental data was compared with the calculated value from the formula. The correlation coefficient is 0.981. The formula produced a strong relationship with the data from the numerical experiment, indicating its high accuracy in reflecting the wave run-up phenomenon as displayed in Figure 17.

5. Conclusions

Based on the open-source code DualSPHysics, a numerical investigation has been conducted for the parameter design and the understanding of the wave damping effects and hydrodynamic characteristics of one new type of armor block, TB-CUBE. The main conclusions are summarized as follows:
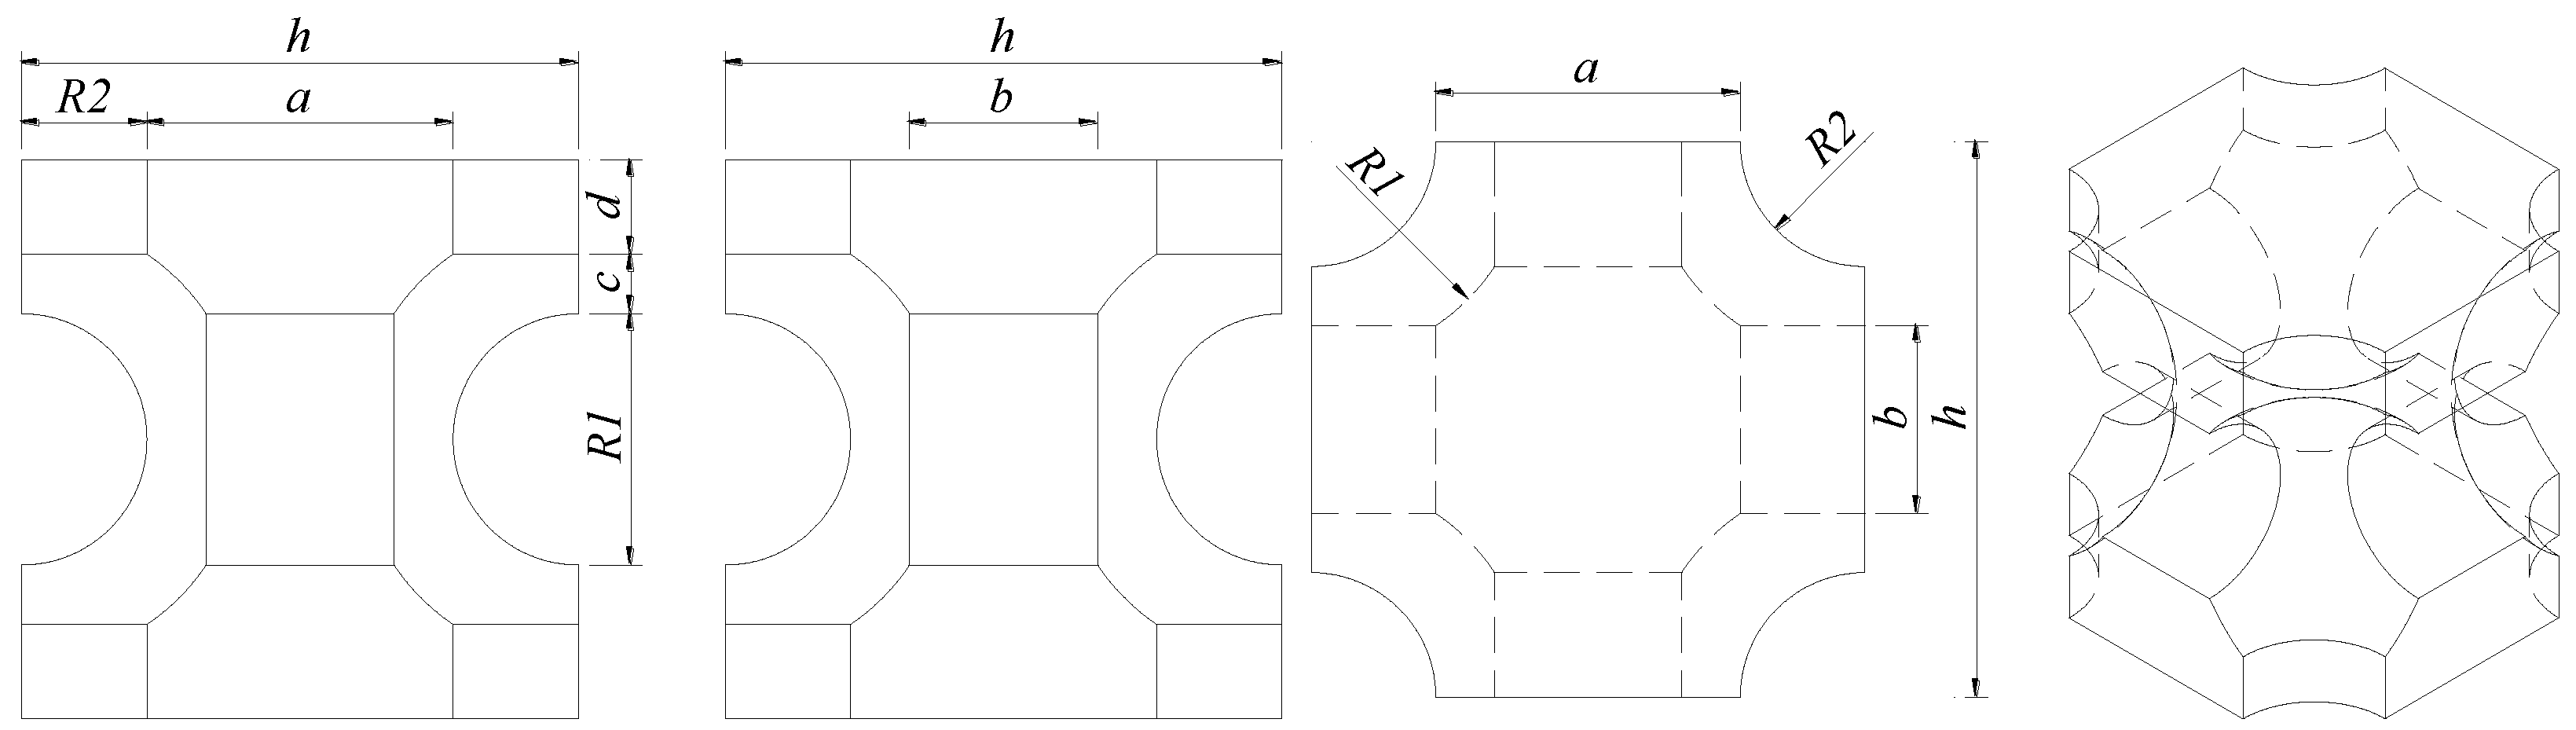
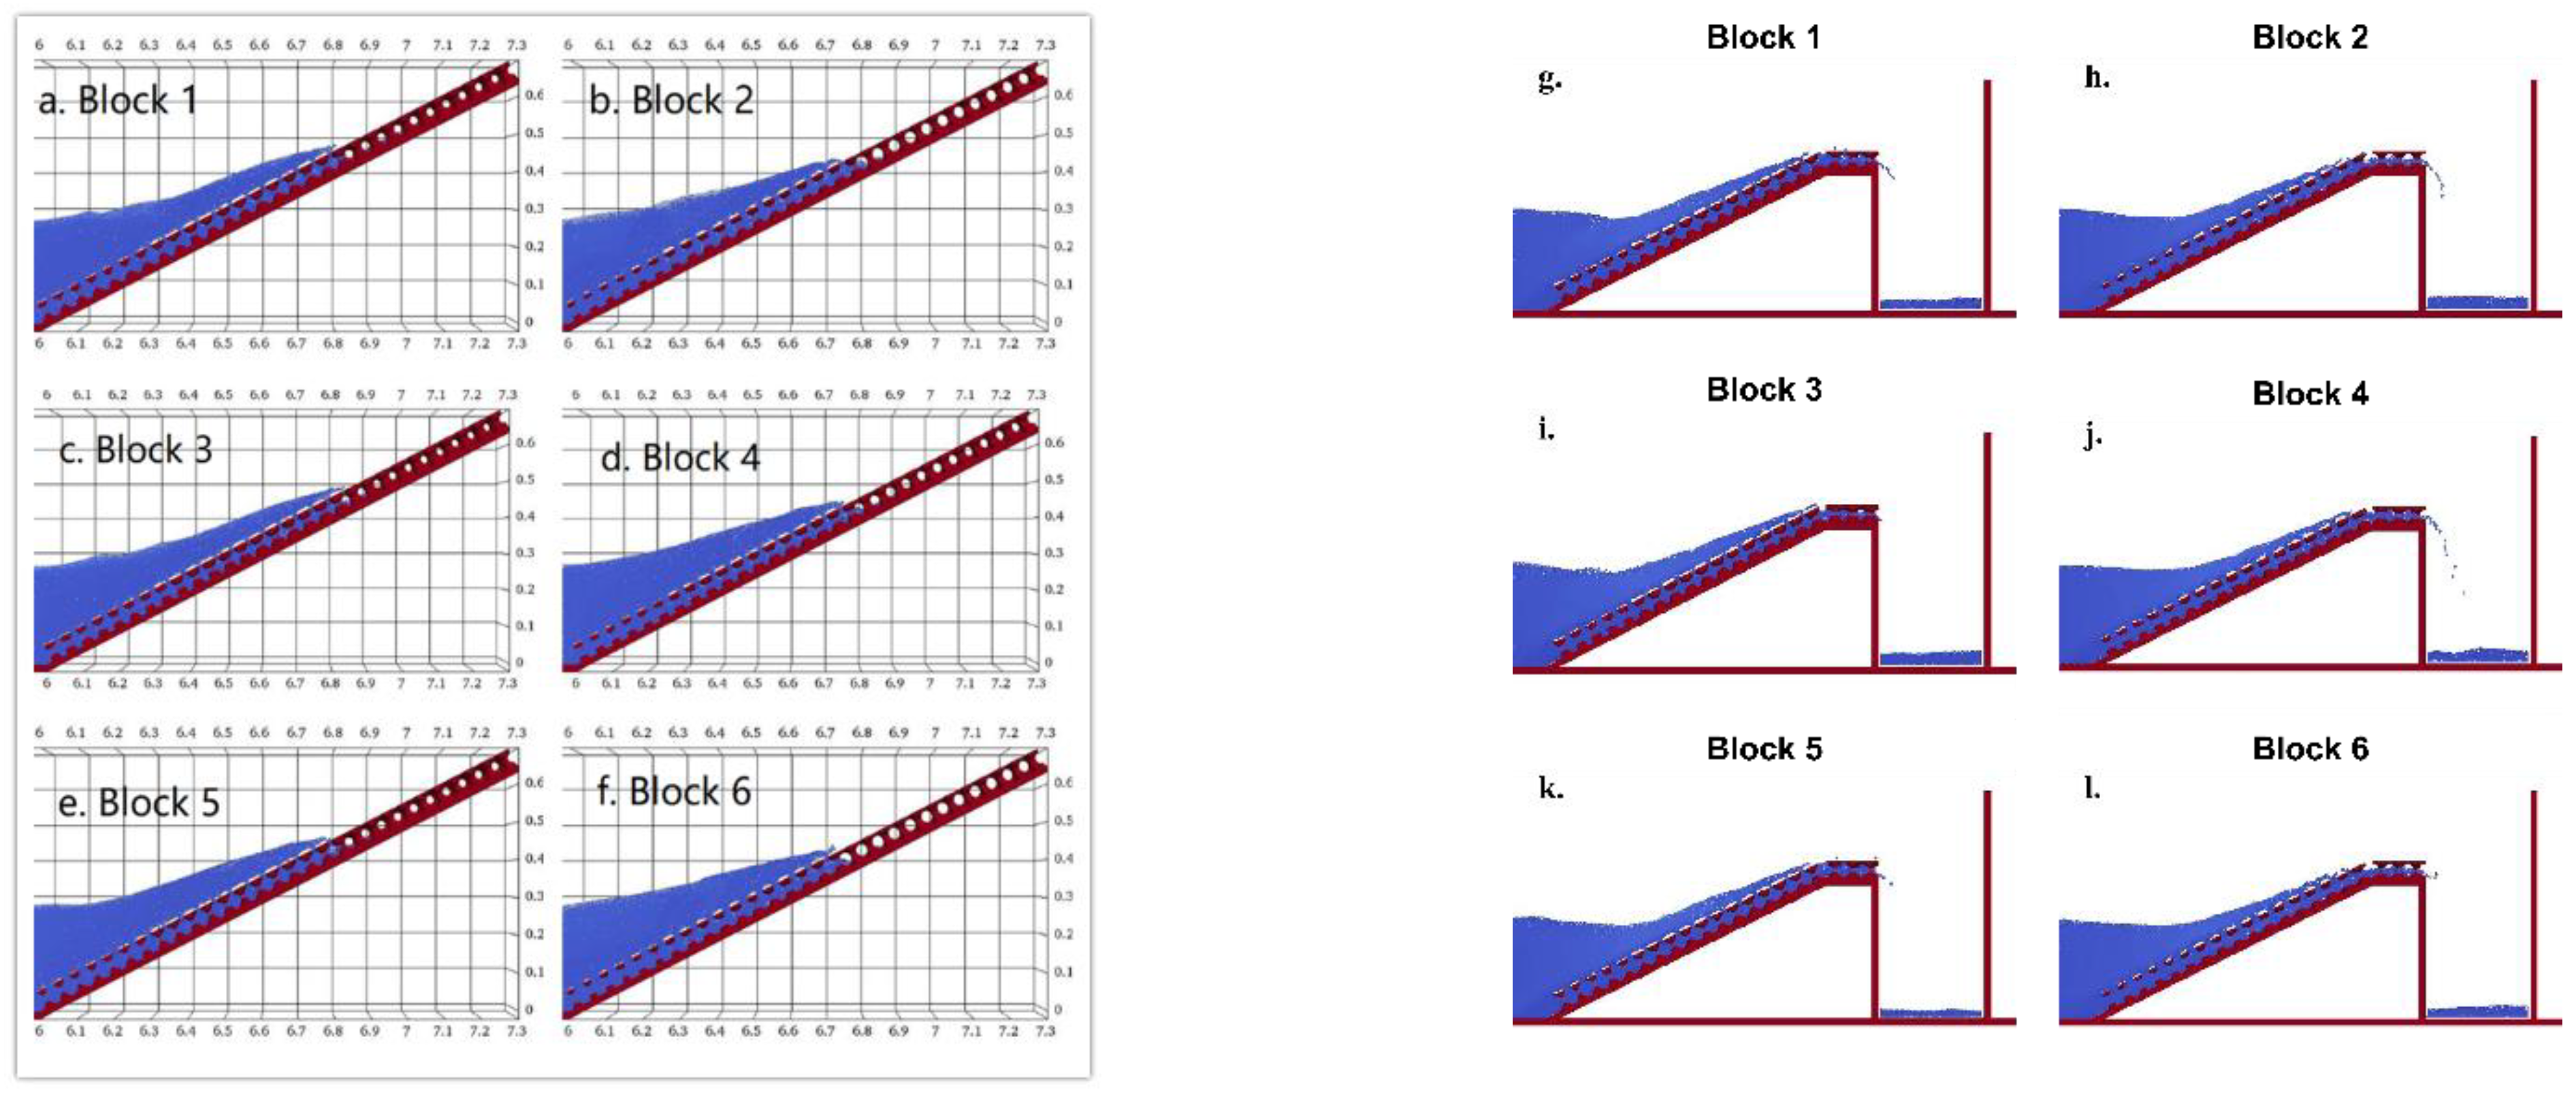
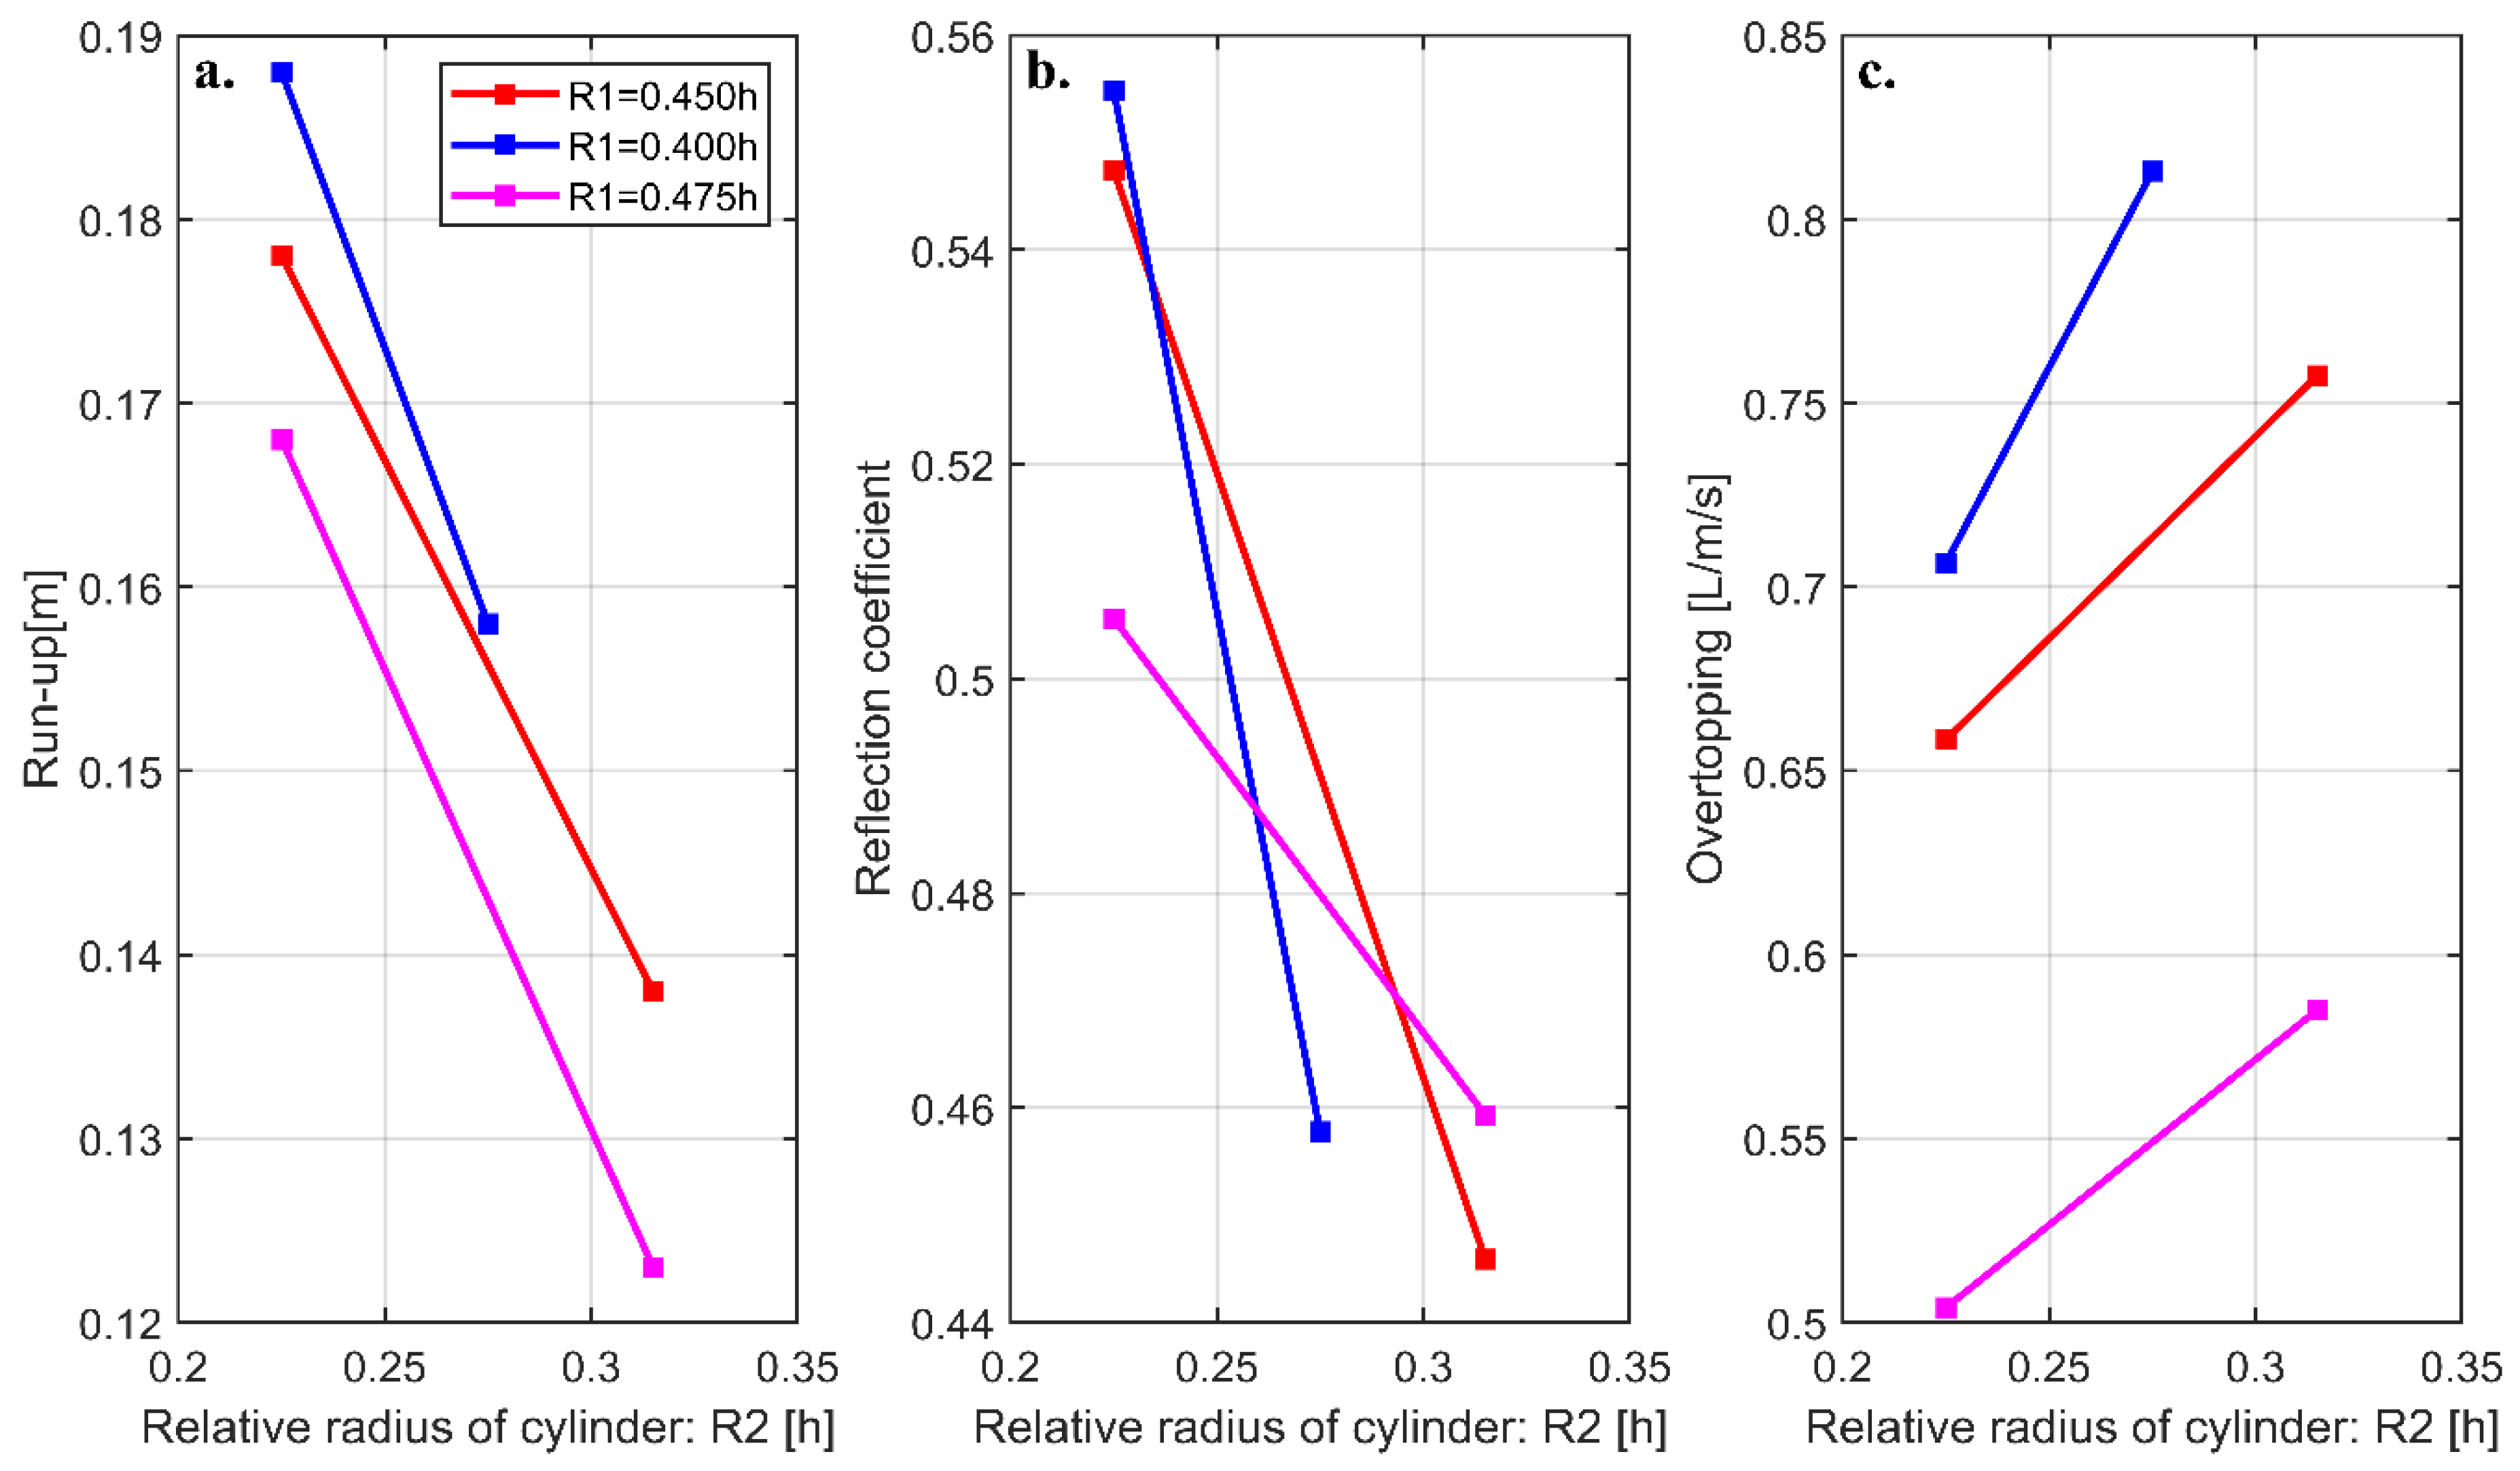
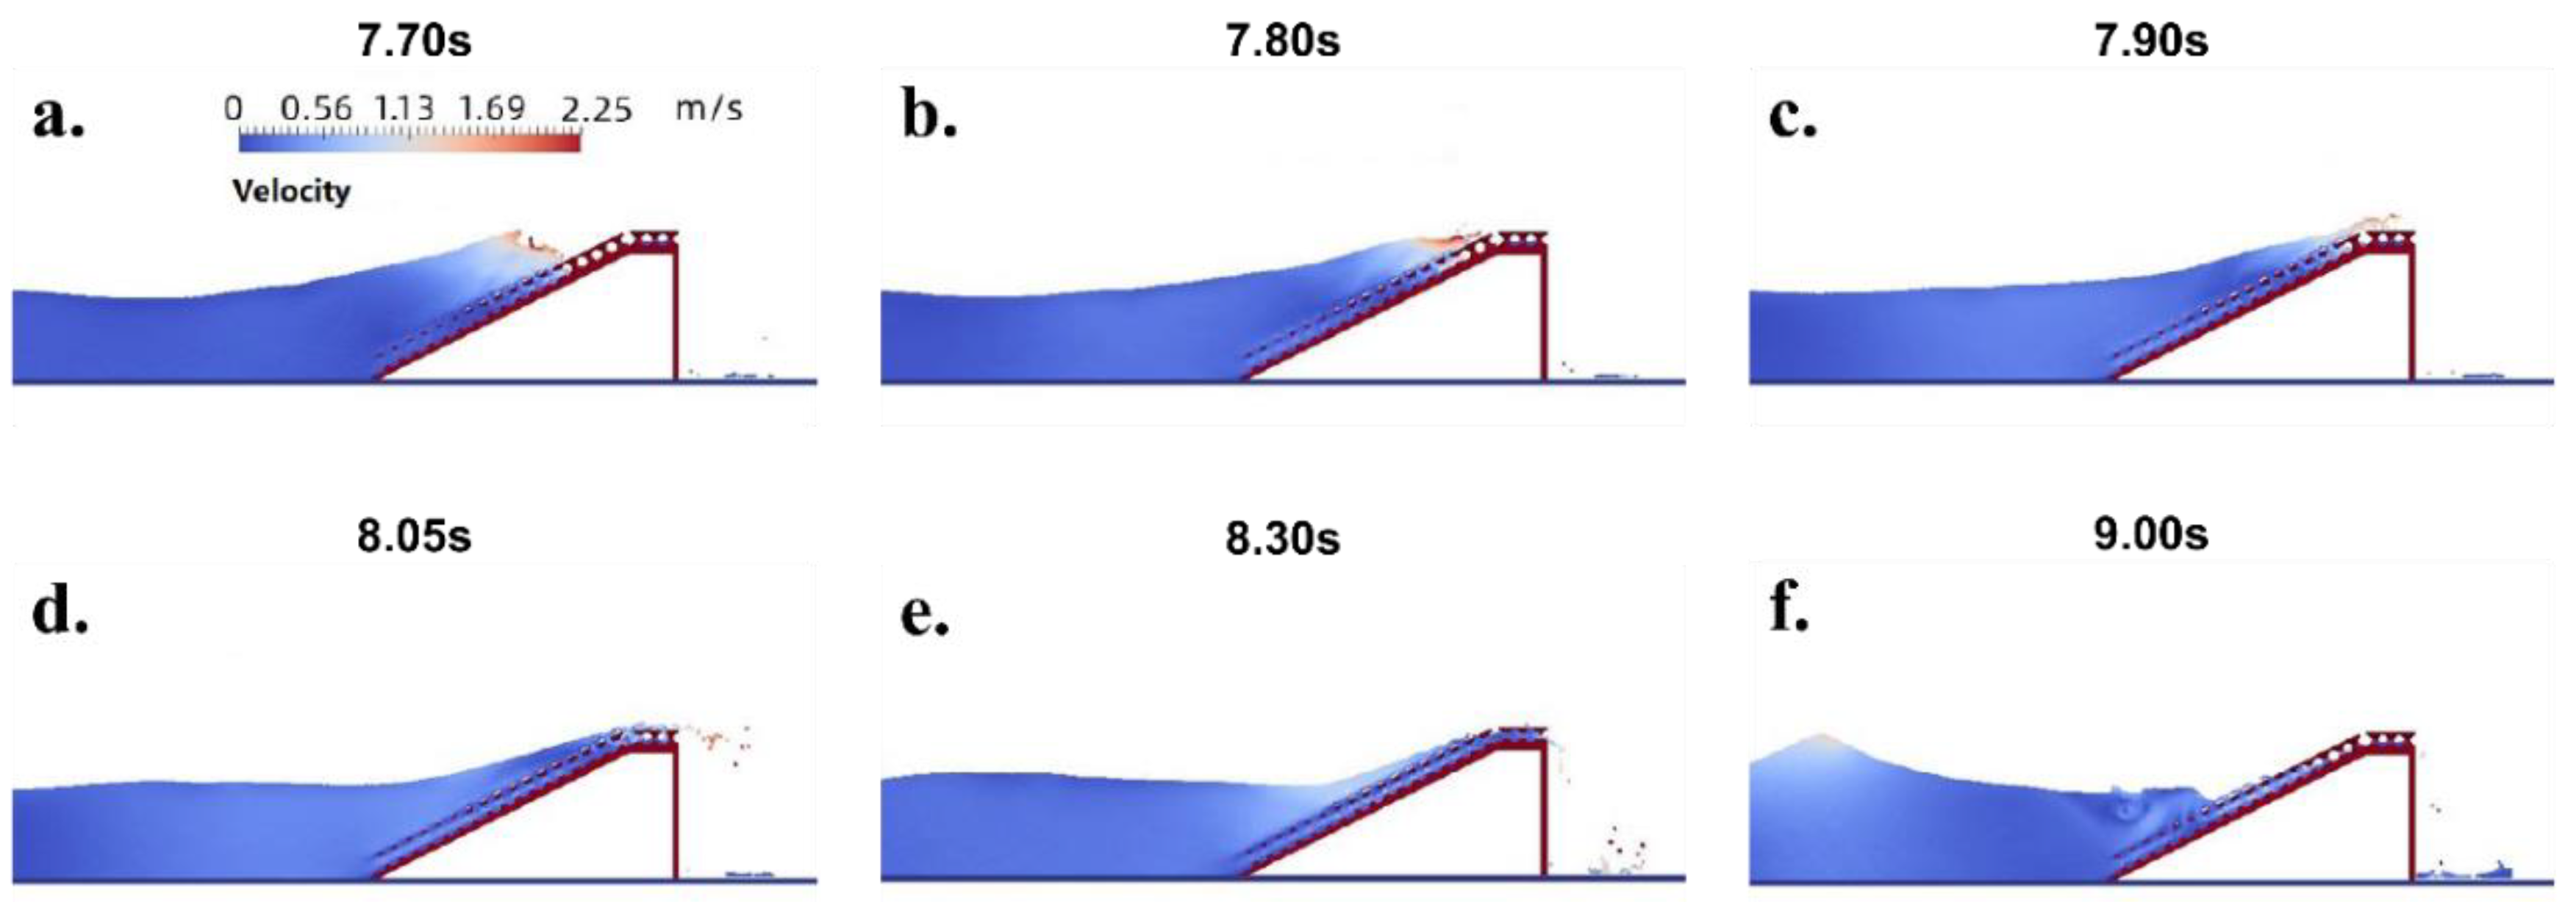
(1) The three-dimensional, SPH-based active absorption wave-making flume has been constructed to reproduce wave evolution on rubble mound breakwaters and to obtain the optimal wave damping effects under various design combinations. The results have proven that when the radius of the sphere is constant, both the wave run-up and reflection coefficient shrink with the increase of the cylinder size, and the overtopping rises. The amount of wave run-up and overtopping decreases with the increase of the size of the sphere under invariant radius of the sphere.
Given the factors of wave run-up, overtopping, wave reflection, porosity, and concrete consumption, the TB-CUBE block with R1 and R2 values of 0.475 h and 0.315 h, respectively, outperforms others, and thus has been selected for further study.
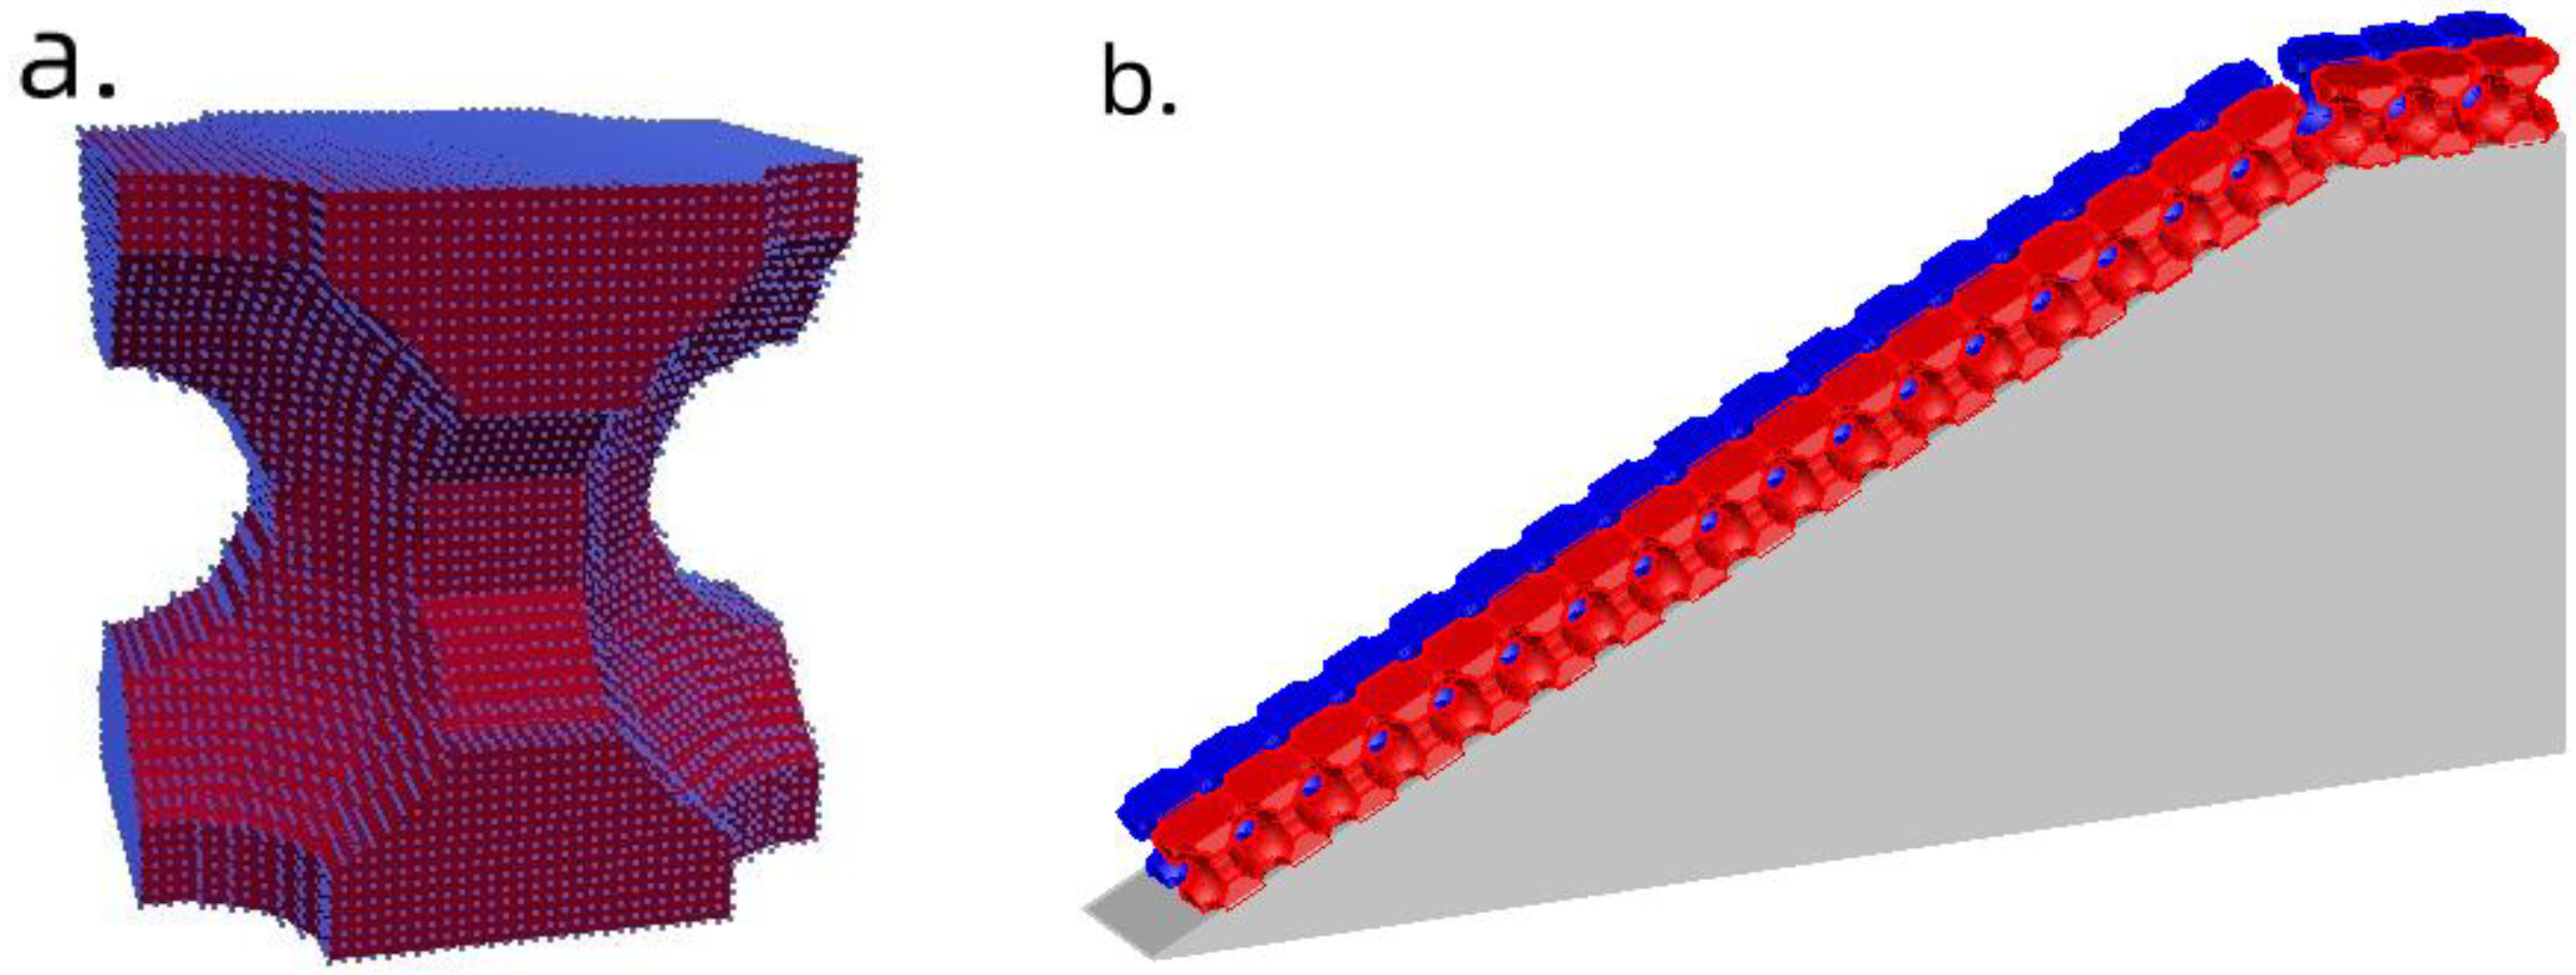
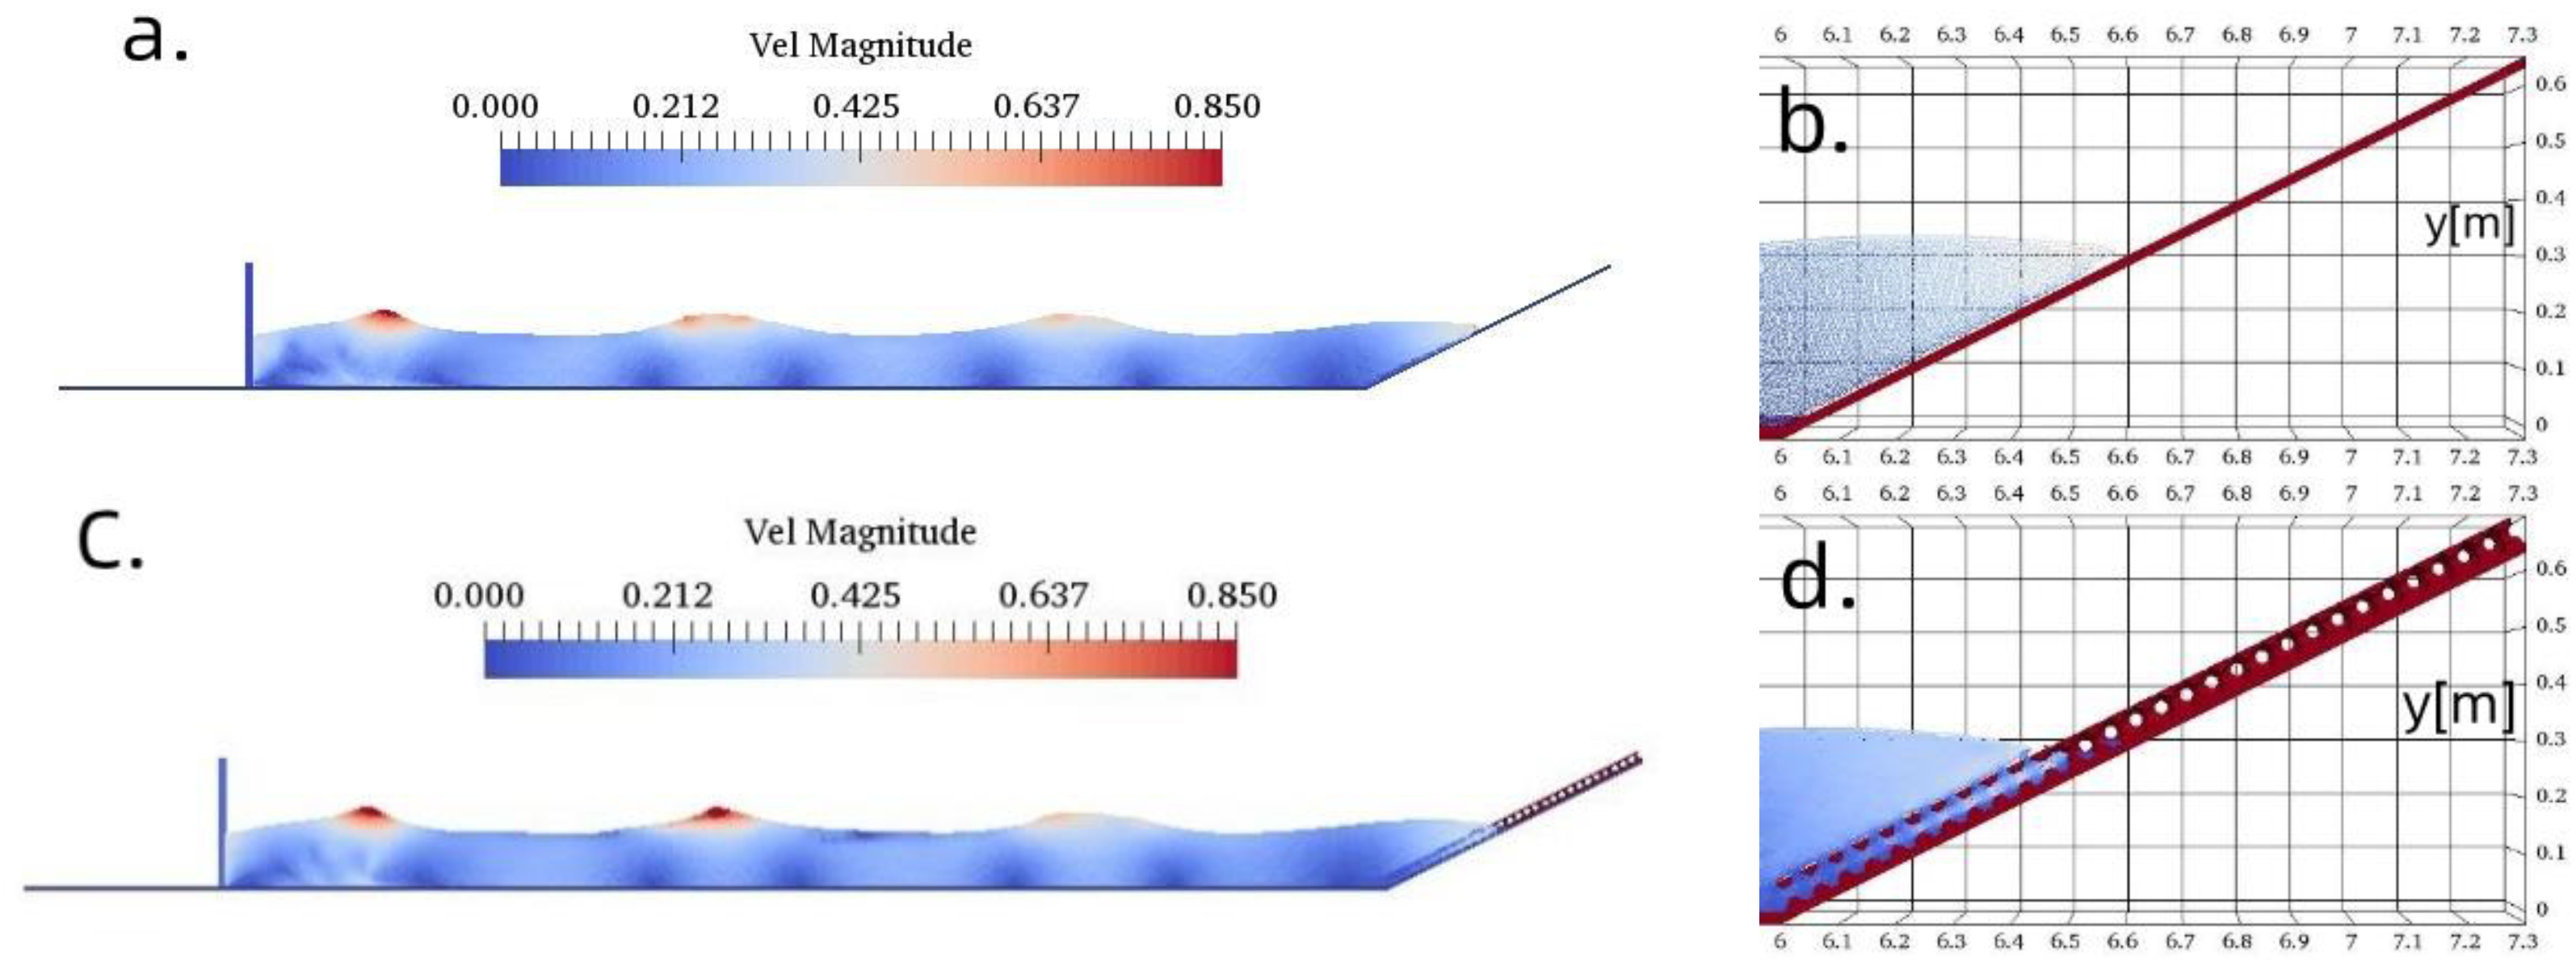
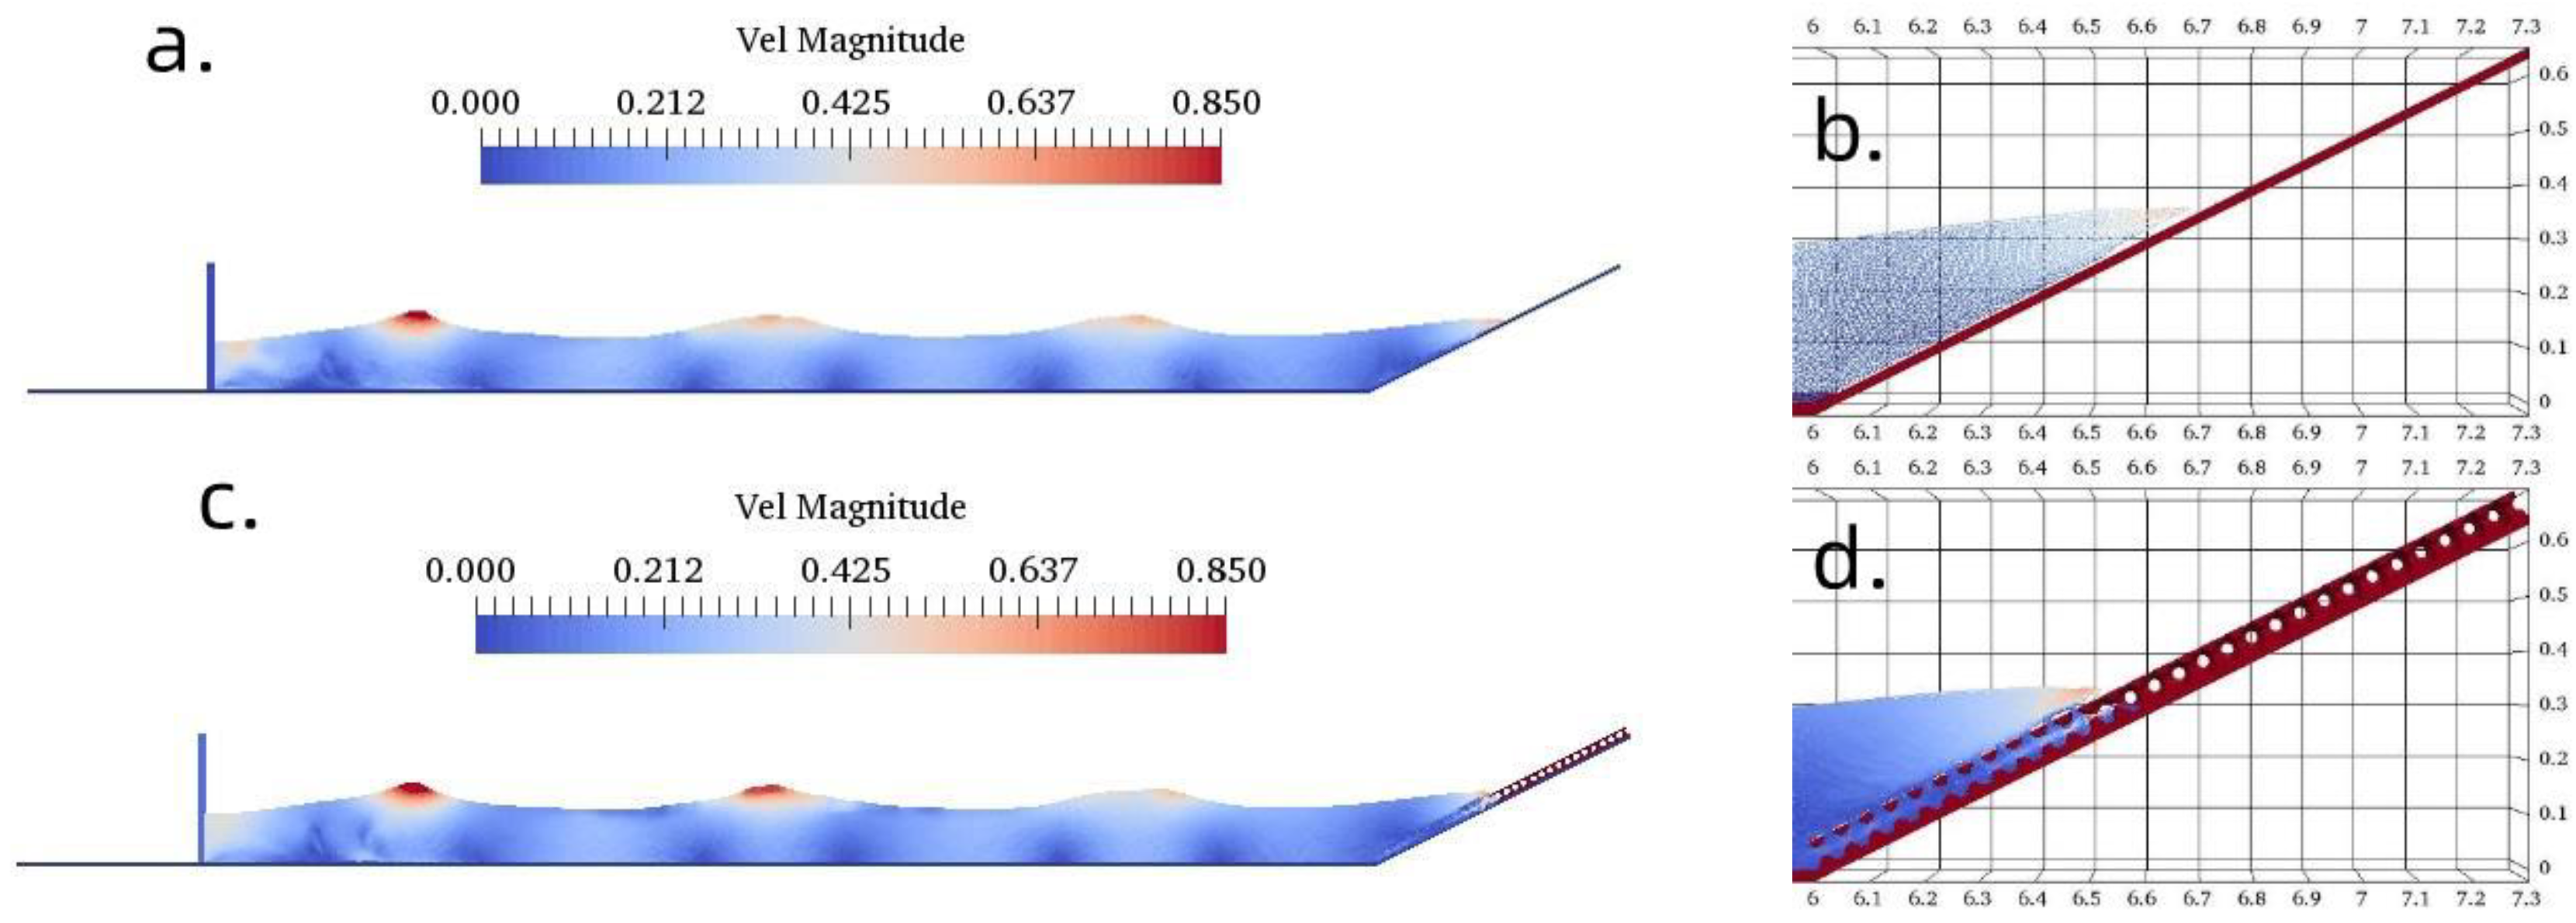
(2) The mean roughness coefficient that was given by numerical simulations for this optimized TB-CUBE block is 0.462, indicating a promising capability of wave damping. It could also be viewed from the three-dimensional visualization that the structural characteristics of the TB-CUBE block itself have exerted large impacts on the interaction between the wave and the breakwater. It can accommodate the water body and form a turbulent flow effect. The threshold effect makes the quantity of overtopping decrease.
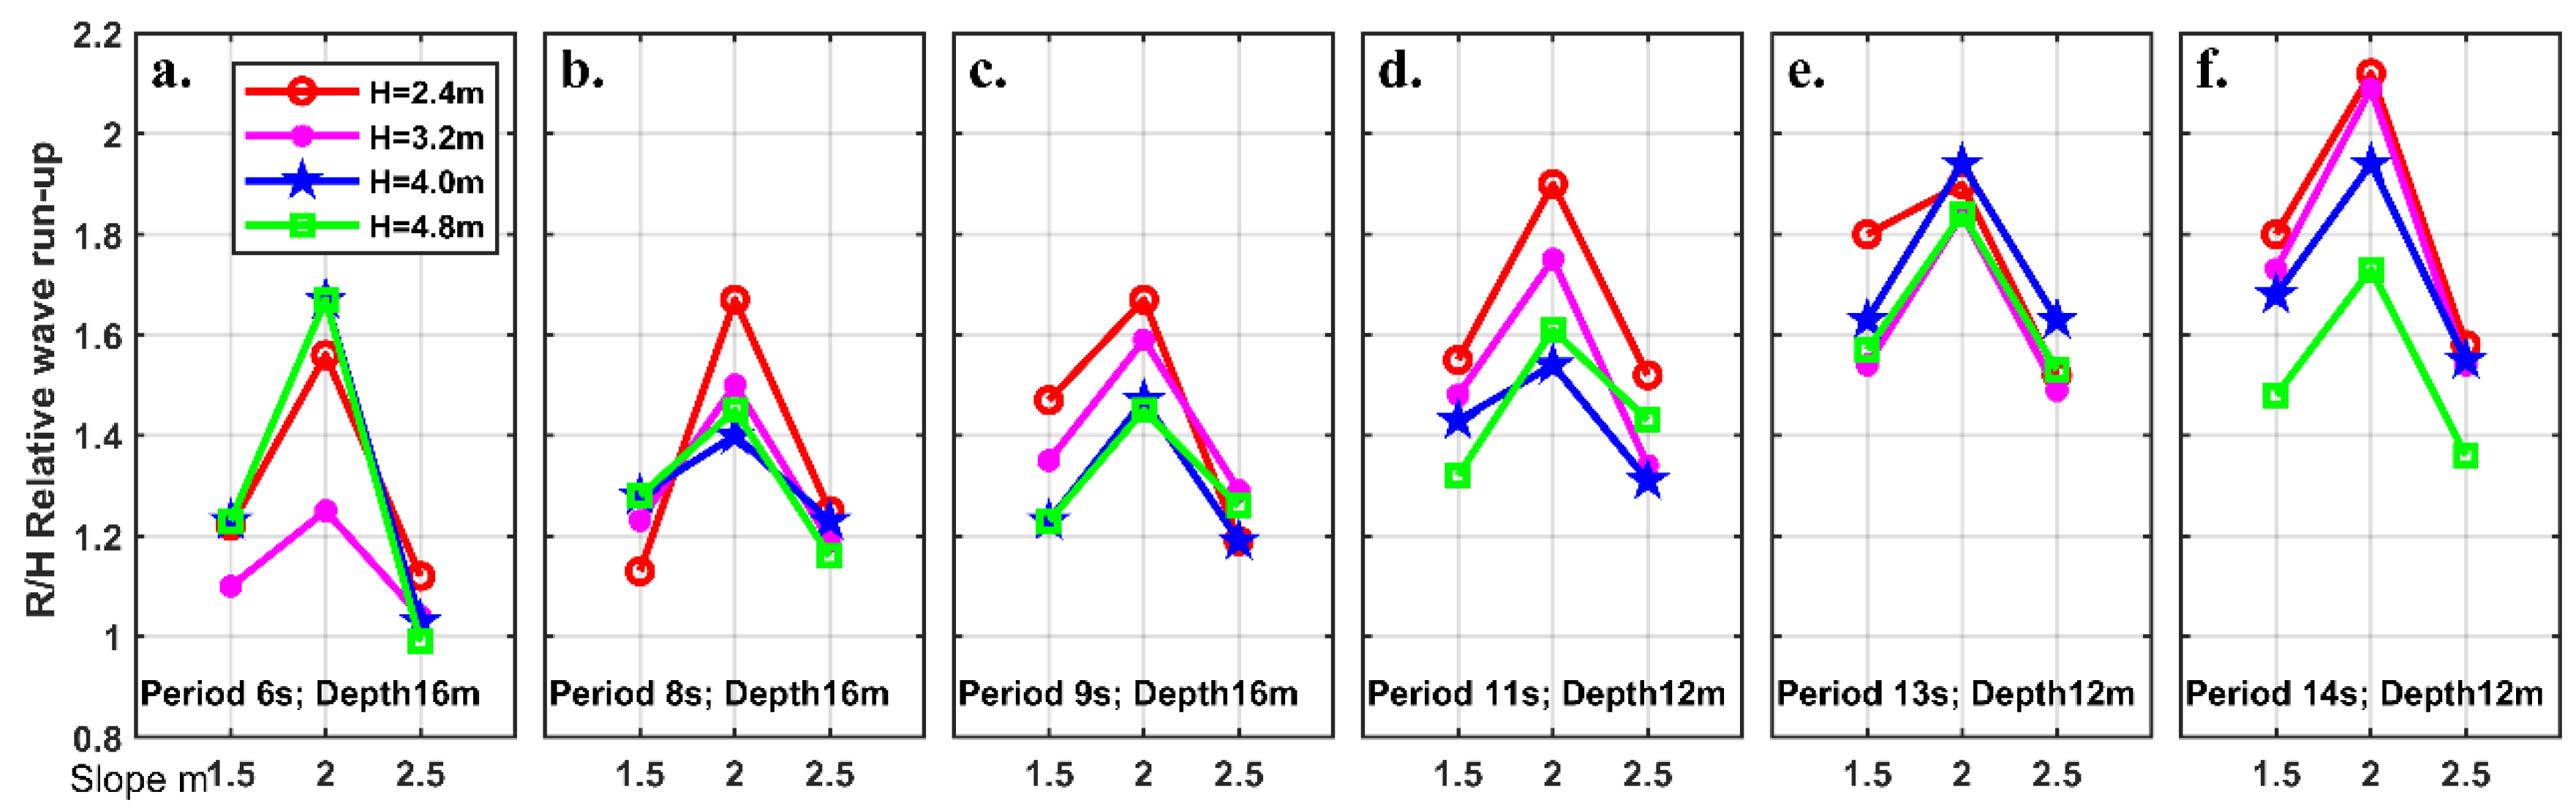
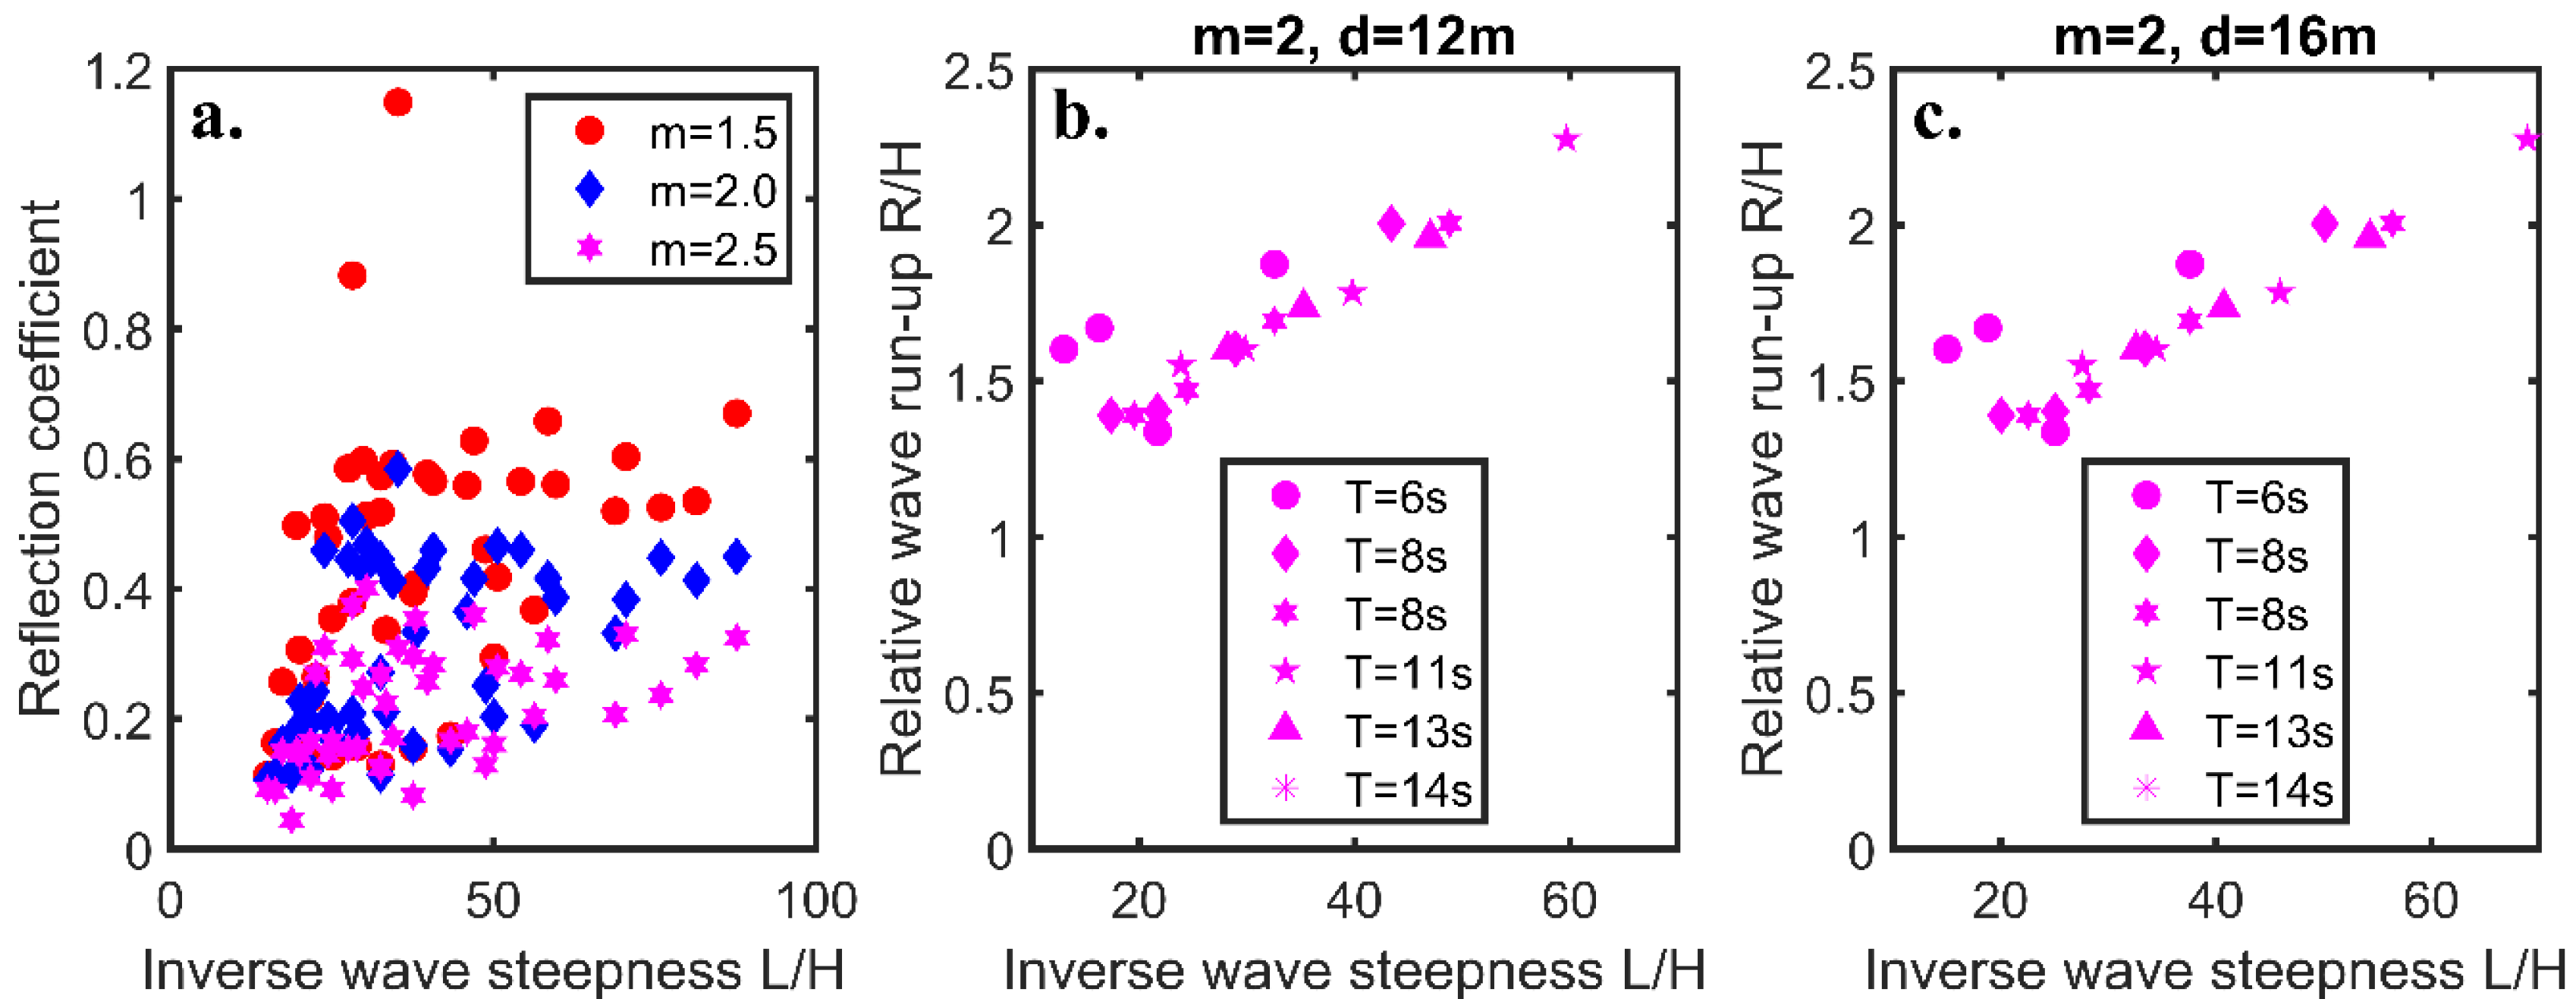
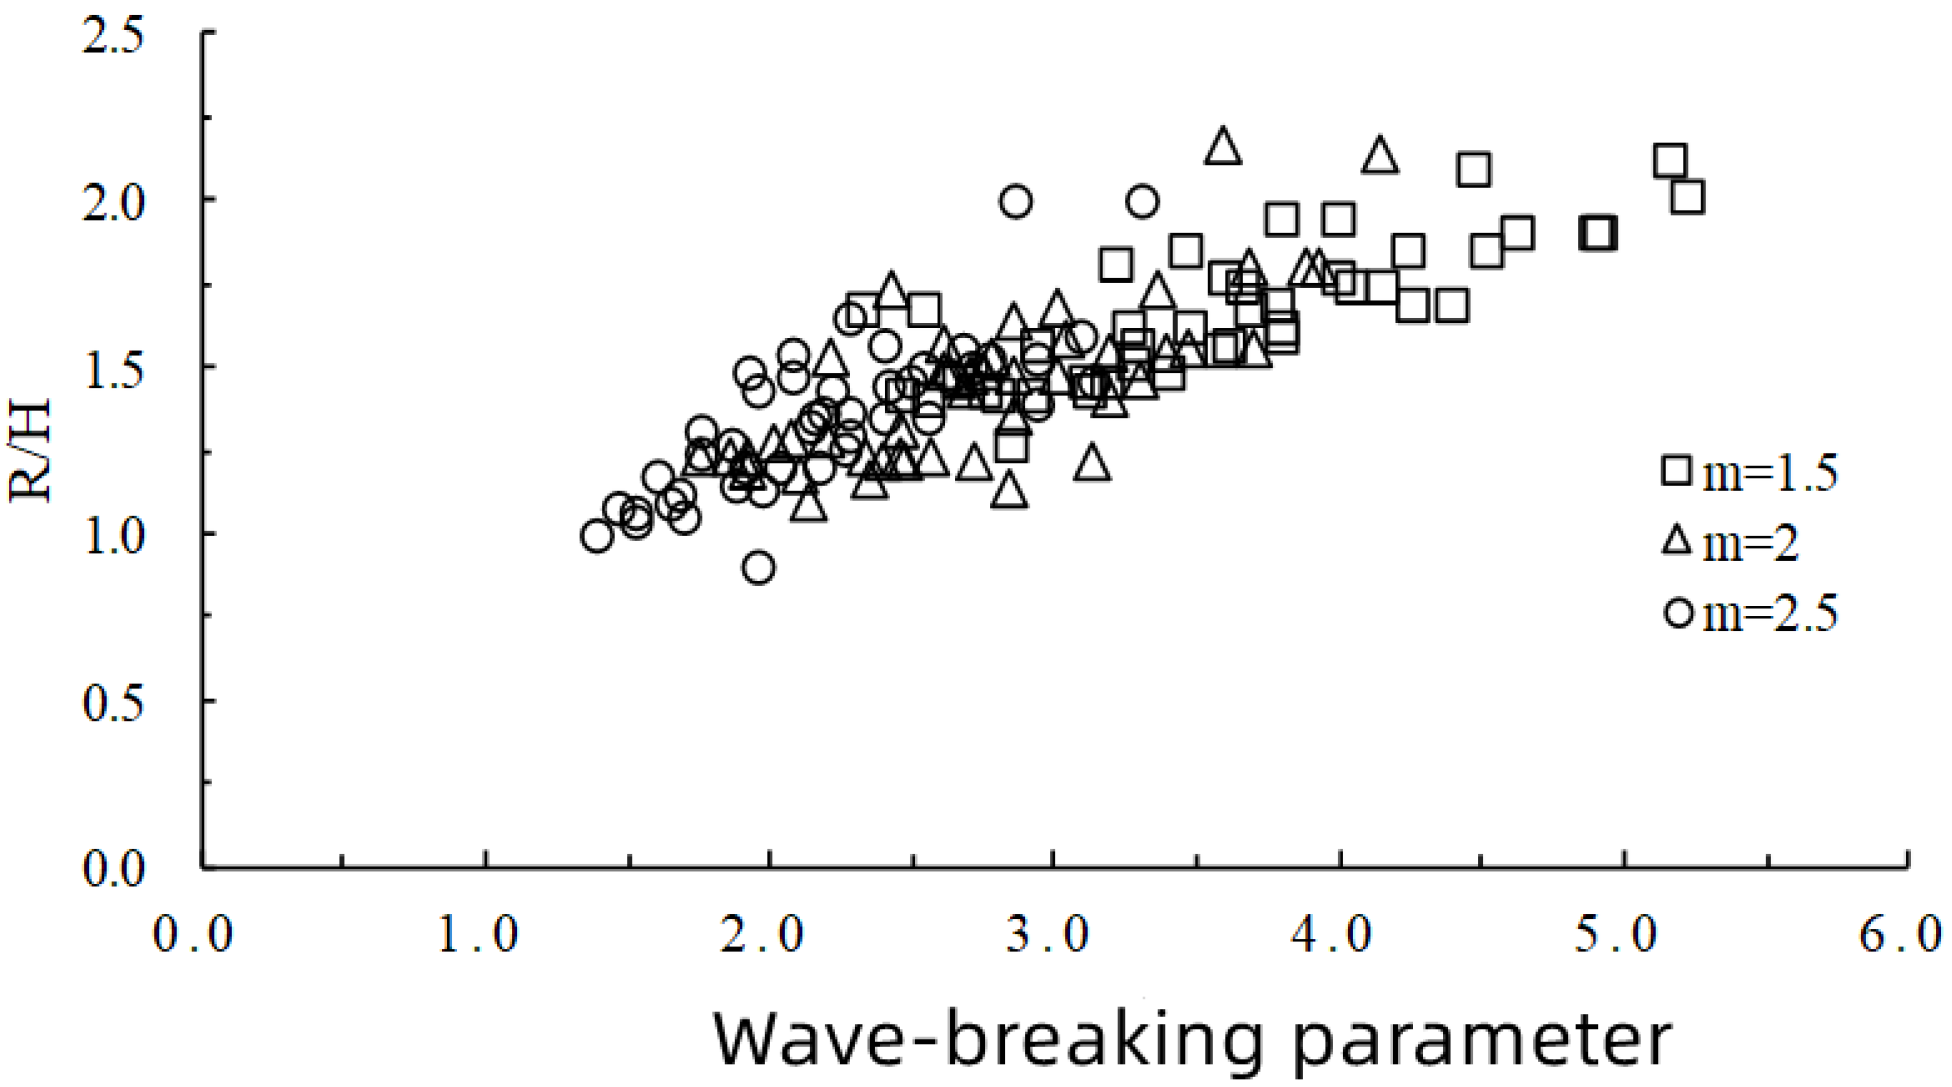
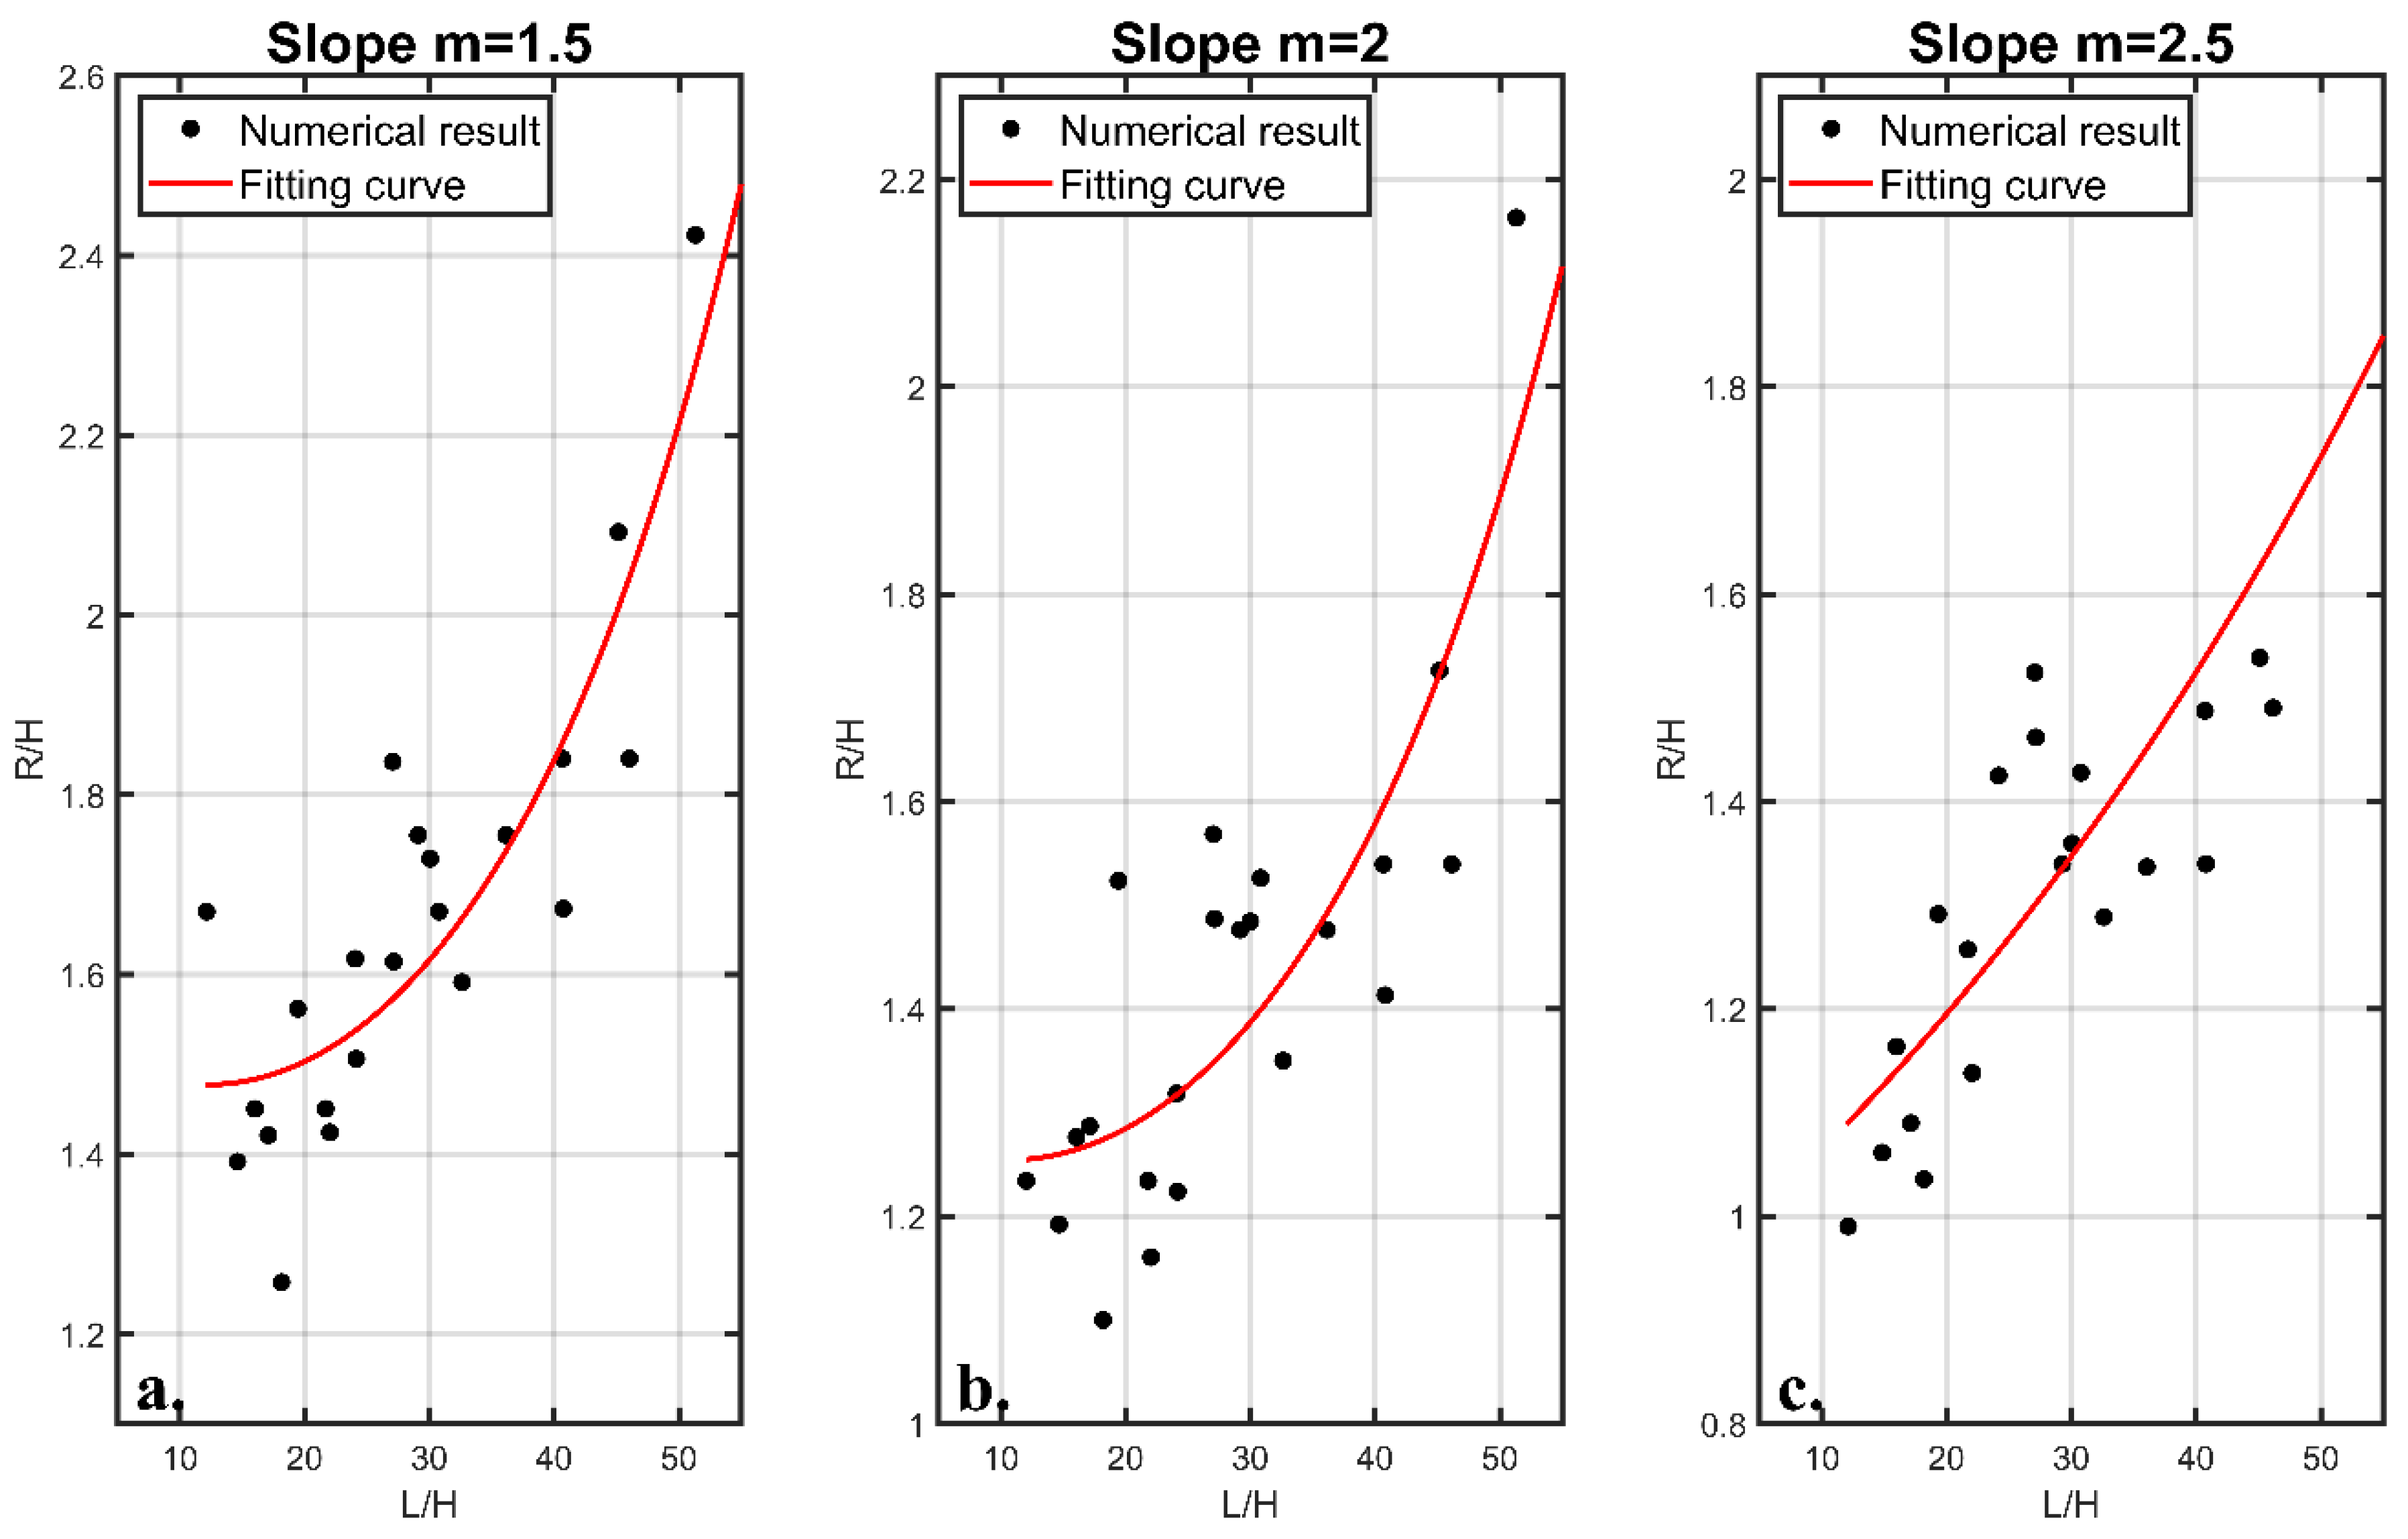
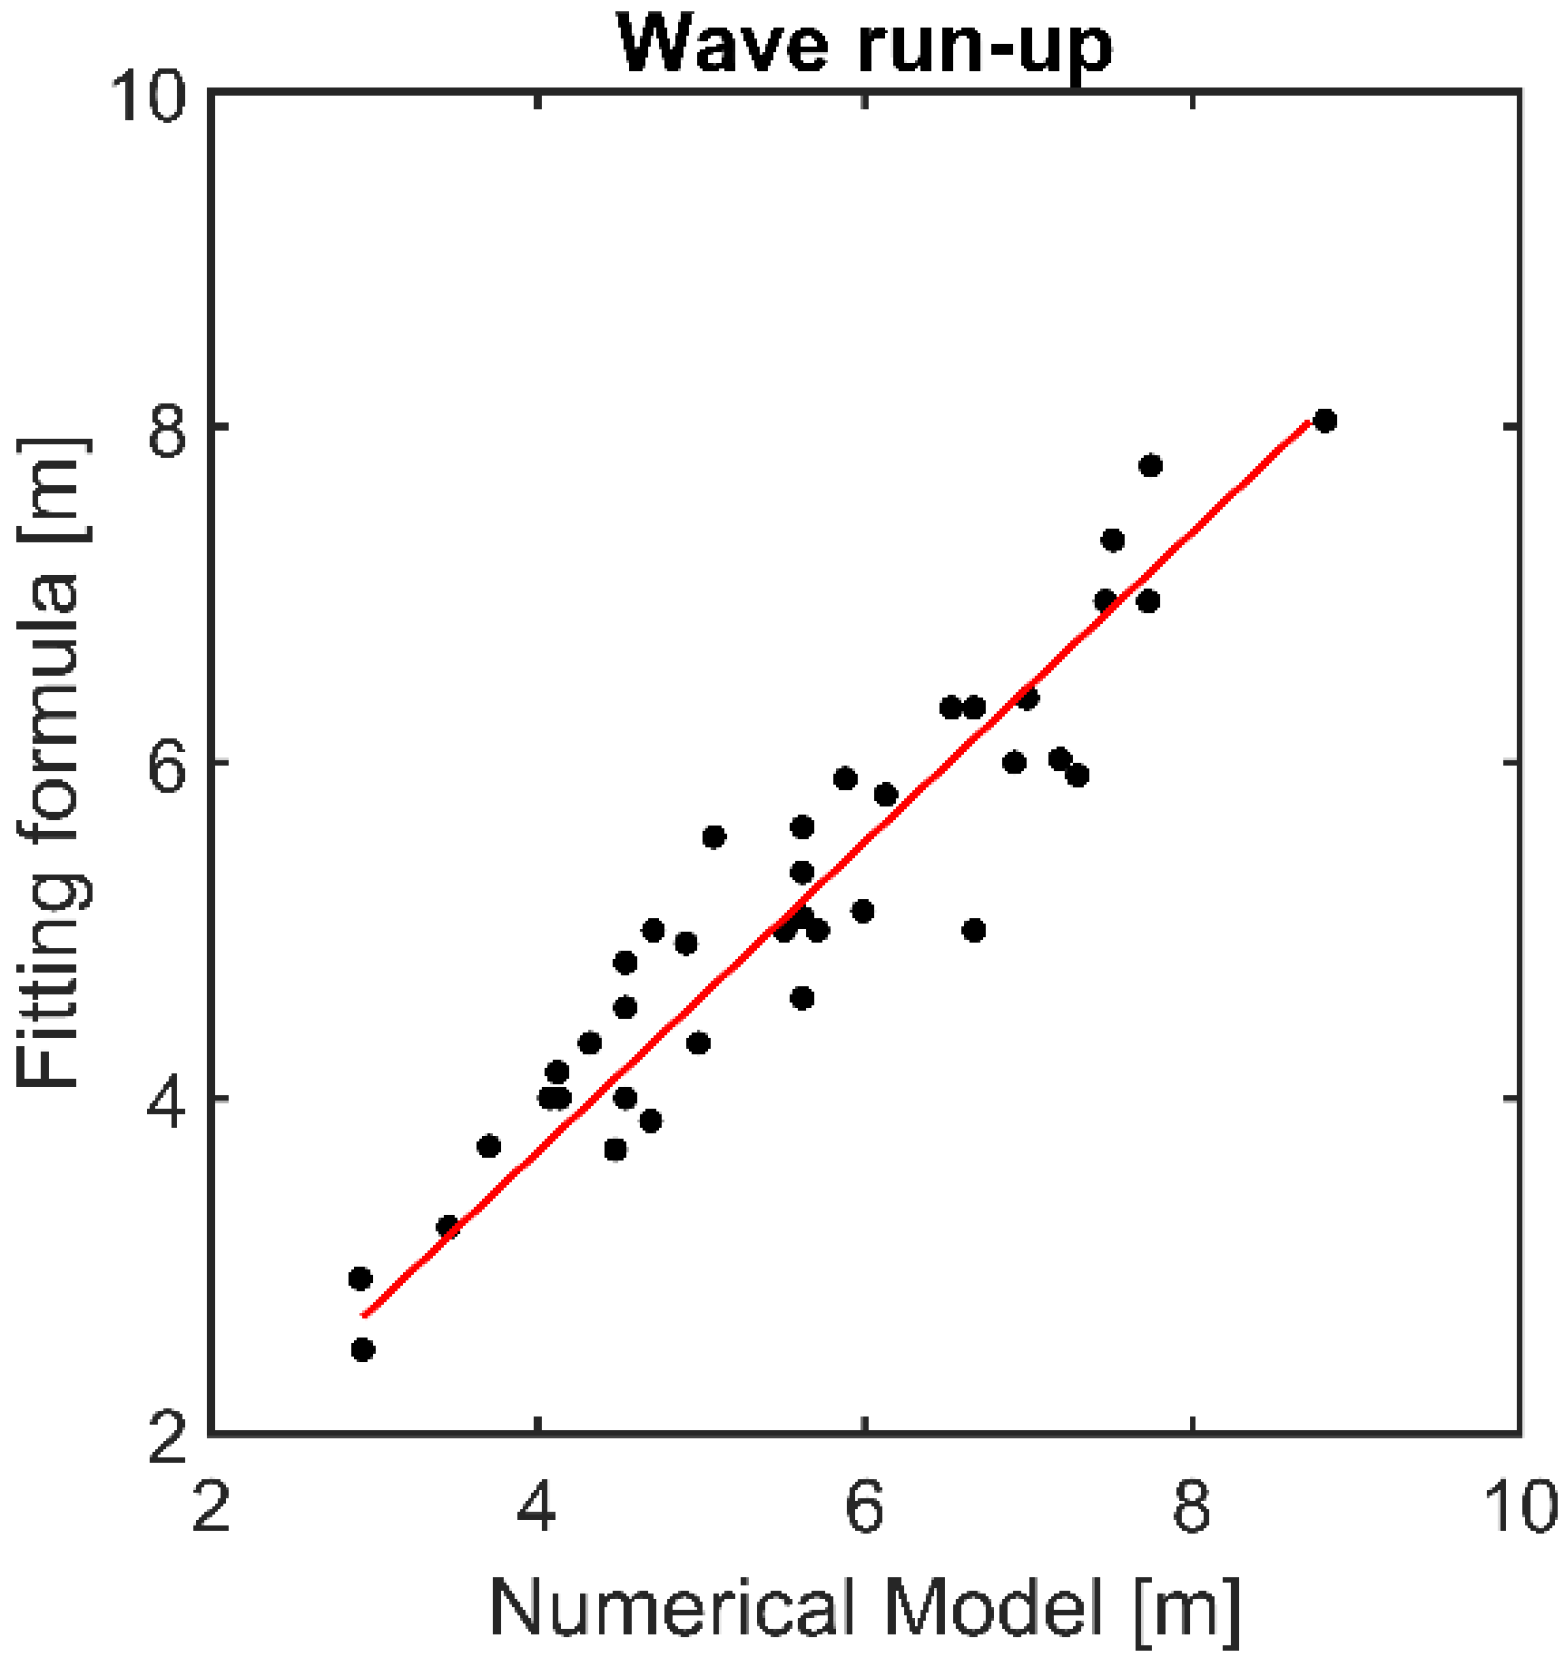
(3) The results from the wave-block-breakwater model demonstrate that the wave run-up value increases along with the increase of wave height, displaying a unimodal distribution trend with the growth of slope, and rises with the increase of inverse wave steepness. The empirical formula for wave run-up on this TB-CUBE has been provided, which would be further employed in engineering practice.
(4) This study has paid attention to the interaction of non-breaking waves on slope breakwater with new type of armor unit, the TB-CUBE, in a 2D wave flume experiment and numerical investigation. Previous studies on unbroken and broken solitary waves highlighted that the interaction of these two types of waves with a coastal deck and the associated hydrodynamic effects were totally different, with the broken waves being more turbulent and introducing more impulsive effects [46]. It is reported that the “aleatory uncertainty” that is involved in the wave breaking and the wave loads on coastal structures, since a minor change in the wave height offshore (e.g., 1%) can lead to a variability of 35% in the pressures and forces that are applied to coastal structures [47]. In fact, this uncertainty is one of the main parameters that is related to the impact of broken waves on structures that is hard to capture via numerical simulations [47]. Further study should consider the effects of wave breaking effects on the stability of the armor unit on slope breakwater. In addition, kinetic energy and velocity or momentum flux of the flow that overtops the breakwater variations are valuable information for this process.
This study used normal incidence of waves. However, the dynamic process of the interaction between breakwater and incoming oblique waves is inherently a three-dimensional problem. Previous research also reported the reduction in overtopping when wave is oblique [48,49]. However, it is still necessary to evaluate the inundation process of the structure and the applied hydrodynamic loads, which includes also yaw and roll moments that further increases the risk for structural damage [9].
Our research is from a small scale (1:40) wave flume experiment which is a common experimental scale as other studies [50,51,52], and scale effects exist. It is well-accepted that solitary waves normally decay faster in the model than in the prototype due to boundary layer effects and fluid viscosity [53]. Full scale research that is not limited in wave-breakwater-armor-unit interaction has been reported in literature [54,55,56], and more numerical studies that are based on that would be feasible to be performed in the future.

Author Contributions

Conceptualization, C.P., H.W., H.Z. and H.C.; methodology, C.P., H.W., H.Z. and H.C.; experiment and validation, C.P. and H.W.; formal analysis, C.P. and H.W.; original draft preparation, C.P. and H.W.; review and editing, H.Z. and H.C. funding acquisition, H.Z. and H.C. All authors have read and agreed to the published version of the manuscript.

Funding

This research was funded the National Natural Science Foundation of China (28119002); Fundamental Research Funds for the Central Institutes (TKS20200204; TKS20220602).

Institutional Review Board Statement

Not applicable.

Informed Consent Statement

Not applicable.

Data Availability Statement

Not applicable.

Acknowledgments

We thank three anonymous reviewers for peer reviewing an earlier version of this manuscript, and the editor and reviewer for their constructive feedback that helped us improve the presentation of the manuscript.

Conflicts of Interest

The authors declare no conflict of interest.

References

  1. Bruce, T.; van der Meer, J.W.; Franco, L.; Pearson, J.M. Overtopping performance of different armour units for rubble mound breakwaters. Coast. Eng. 2009, 56, 166–179. [Google Scholar] [CrossRef]
  2. Demirel, V.; Wang, S. An efficient boundary element method for two-dimensional transient wave propagation problems. Appl. Math. Model. 1987, 11, 411–416. [Google Scholar] [CrossRef]
  3. Belibassakis, K.A. A boundary element method for the hydrodynamic analysis of floating bodies in variable bathymetry regions. Eng. Anal. Bound. Elem. 2008, 32, 796–810. [Google Scholar] [CrossRef]
  4. Troch, P.; Li, T.Q.; De Rouck, J.; Ingram, D. Wave interaction with a sea dike using a vof finite-volume method. In Proceedings of the 13th International Offshore and Polar Engineering Conference, Honolulu, HI, USA, 25–30 May 2003; pp. 325–332. [Google Scholar]
  5. Jose, J.; Choi, S.J.; Giljarhus, K.E.T.; Gudmestad, O.T. A comparison of numerical simulations of breaking wave forces on a monopile structure using two different numerical models based on finite difference and finite volume methods. Ocean Eng. 2017, 137, 78–88. [Google Scholar] [CrossRef]
  6. Xiang, T.; Istrati, D. Assessment of extreme wave impact on coastal decks with different geometries via the arbitrary lagrangian-eulerian method. J. Mar. Sci. Eng. 2021, 9, 1342. [Google Scholar] [CrossRef]
  7. Xiang, T.; Istrati, D.; Yim, S.C.; Buckle, I.G.; Lomonaco, P. Tsunami loads on a representative coastal bridge deck: Experimental study and validation of design equations. J. Waterw. Port Coast. Ocean Eng. 2020, 146, 04020022. [Google Scholar] [CrossRef]
  8. Istrati, D.; Hasanpour, A.; Buckle, I. Numerical investigation of tsunami-borne debris damming loads on a coastal bridge. In Proceedings of the 17th World Conference on Earthquake Engineering, Sendai, Japan, 13–18 September 2020. [Google Scholar]
  9. Istrati, D.; Buckle, I.G. Tsunami Loads on Straight and Skewed Bridges—Part 2: Numerical Investigation and Design Recommendations; FHWA-OR-RD-21-13; Federal Highway Administration Research and Technology: Washington, DC, USA, 2021. [Google Scholar]
  10. Arikawa, T.; Ishikawa, N.; Beppu, M.; Tatesawa, H. Collapse mechanisms of seawall due to the march 2011 japan tsunami using the mps method. Int. J. Prot. Struct. 2012, 3, 457–476. [Google Scholar] [CrossRef]
  11. Monaghan, J.J. Simulating free surface flows with sph. J. Comput. Phys. 1994, 110, 399–406. [Google Scholar] [CrossRef]
  12. Higuera, P.; Lara, J.L.; Losada, I.J. Simulating coastal engineering processes with openfoam (r). Coast. Eng. 2013, 71, 119–134. [Google Scholar] [CrossRef]
  13. Zijlema, M.; Stelling, G.; Smit, P. Swash: An operational public domain code for simulating wave fields and rapidly varied flows in coastal waters. Coast. Eng. 2011, 58, 992–1012. [Google Scholar] [CrossRef]
  14. Gomez-Gesteira, M.; Rogers, B.D.; Crespo, A.J.C.; Dalrymple, R.A.; Narayanaswamy, M.; Dominguez, J.M. Sphysics—Development of a free-surface fluid solver—Part 1: Theory and formulations. Comput. Geosci. 2012, 48, 289–299. [Google Scholar] [CrossRef]
  15. Luo, M.; Khayyer, A.; Lin, P. Particle methods in ocean and coastal engineering. Appl. Ocean Res. 2021, 114, 102734. [Google Scholar] [CrossRef]
  16. Lowe, R.J.; Buckley, M.L.; Altomare, C.; Rijnsdorp, D.P.; Yao, Y.; Suzuki, T.; Bricker, J.D. Numerical simulations of surf zone wave dynamics using smoothed particle hydrodynamics. Ocean Model. 2019, 144, 101481. [Google Scholar] [CrossRef]
  17. Wei, Z.P.; Dalrymple, R.A.; Rustico, E.; Herault, A.; Bilotta, G. Simulation of nearshore tsunami breaking by smoothed particle hydrodynamics method. J. Waterw. Port Coast. Ocean Eng. 2016, 142, 05016001. [Google Scholar] [CrossRef]
  18. Ren, B.; Wen, H.; Dong, P.; Wang, Y. Improved sph simulation of wave motions and turbulent flows through porous media. Coast. Eng. 2016, 107, 14–27. [Google Scholar] [CrossRef]
  19. Dominguez, J.M.; Fourtakas, G.; Altomare, C.; Canelas, R.B.; Tafuni, A.; Garcia-Feal, O.; Martinez-Estevez, I.; Mokos, A.; Vacondio, R.; Crespo, A.J.C.; et al. Dualsphysics: From fluid dynamics to multiphysics problems. Comput. Part. Mech. 2021. [Google Scholar] [CrossRef]
  20. Gomez-Gesteira, M.; Cerqueiroa, D.; Crespoa, C.; Dalrymple, R.A. Green water overtopping analyzed with a sph model. Ocean Eng. 2005, 32, 223–238. [Google Scholar] [CrossRef]
  21. Dalrymple, R.A.; Rogers, B.D. Numerical modeling of water waves with the sph method. Coast. Eng. 2006, 53, 141–147. [Google Scholar] [CrossRef]
  22. Crespo, A.J.C.; Gomez-Gesteira, M.; Dalrymple, R.A. Modeling dam break behavior over a wet bed by a sph technique. J. Waterw. Port Coast. Ocean Eng. 2008, 134, 313–320. [Google Scholar] [CrossRef]
  23. Barreiro, A.; Crespo, A.J.C.; Dominguez, J.M.; Gomez-Gesteira, M. Smoothed particle hydrodynamics for coastal engineering problems. Comput. Struct. 2013, 120, 96–106. [Google Scholar] [CrossRef]
  24. Altomare, C.; Gironella, X.; Crespo, A.J.C. Simulation of random wave overtopping by a wcsph model. Appl. Ocean Res. 2021, 116, 102888. [Google Scholar] [CrossRef]
  25. Dominguez, J.M.; Crespo, A.J.C.; Hall, M.; Altomare, C.; Wu, M.H.; Stratigaki, V.; Troch, P.; Cappietti, L.; Gomez-Gesteira, M. Sph simulation of floating structures with moorings. Coast. Eng. 2019, 153, 103560. [Google Scholar] [CrossRef]
  26. Hall, M.; Goupee, A. Validation of a lumped-mass mooring line model with deepcwind semisubmersible model test data. Ocean Eng. 2015, 104, 590–603. [Google Scholar] [CrossRef]
  27. Hasanpour, A.; Istrati, D.; Buckle, I. Coupled sph–fem modeling of tsunami-borne large debris flow and impact on coastal structures. J. Mar. Sci. Eng. 2021, 9, 1068. [Google Scholar] [CrossRef]
  28. Crespo, A.J.C.; Altomare, C.; Dominguez, J.M.; Gonzalez-Cao, J.; Gomez-Gesteira, M. Towards simulating floating offshore oscillating water column converters with smoothed particle hydrodynamics. Coast. Eng. 2017, 126, 11–26. [Google Scholar] [CrossRef]
  29. Altomare, C.; Dominguez, J.M.; Crespo, A.J.C.; Gonzalez-Cao, J.; Suzuki, T.; Gomez-Gesteira, M.; Troch, P. Long-crested wave generation and absorption for sph-based dualsphysics model. Coast. Eng. 2017, 127, 37–54. [Google Scholar] [CrossRef]
  30. Meringolo, D.D.; Aristodemo, F.; Veltri, P. Sph numerical modeling of wave-perforated breakwater interaction. Coast. Eng. 2015, 101, 48–68. [Google Scholar] [CrossRef]
  31. Tabet-Aoul, E.H.; Lambert, E. Tentative new formula for maximum horizontal wave forces acting on perforated caisson. J. Waterw. Port Coast. Ocean Eng. 2003, 129, 34–40. [Google Scholar] [CrossRef]
  32. Monaghan, J.J.; Kos, A. Solitary waves on a cretan beach. J. Waterw. Port Coast. Ocean Eng. 1999, 125, 145–154. [Google Scholar] [CrossRef]
  33. Altomare, C.; Crespo, A.J.C.; Rogers, B.D.; Dominguez, J.M.; Gironella, X.; Gomez-Gesteira, M. Numerical modelling of armour block sea breakwater with smoothed particle hydrodynamics. Comput. Struct. 2014, 130, 34–45. [Google Scholar] [CrossRef]
  34. Crespo, A.J.C.; Dominguez, J.M.; Rogers, B.D.; Gomez-Gesteira, M.; Longshaw, S.; Canelas, R.; Vacondio, R.; Barreiro, A.; Garcia-Feal, O. Dualsphysics: Open-source parallel cfd solver based on smoothed particle hydrodynamics (sph). Comput. Phys. Commun. 2015, 187, 204–216. [Google Scholar] [CrossRef]
  35. Safari, I.; Mouazé, D.; Ropert, F.; Haquin, S.; Ezersky, A. Hydraulic stability and wave overtopping of starbloc® armored mound breakwaters. Ocean Eng. 2018, 151, 268–275. [Google Scholar] [CrossRef]
  36. Park, Y.H.; Oh, Y.M.; Ahn, S.M.; Han, T.H.; Kim, Y.T.; Suh, K.D.; Won, D. Development of a new concrete armor unit for high waves. J. Coast. Res. 2019, 35, 719–728. [Google Scholar] [CrossRef]
  37. Tianjin Research Institute for Water Transport Engineering. A Comprehensive Type of Wave Damping Artificial Block and Embankment. CN 108385609 B, 27 October 2020. (In Chinese). [Google Scholar]
  38. Isobe, M. Impact of global warming on coastal structures in shallow water. Ocean Eng. 2013, 71, 51–57. [Google Scholar] [CrossRef]
  39. Colling, J.K.; Jafari Kang, S.; Dehdashti, E.; Husain, S.; Masoud, H.; Parker, G.G. Free-decay heave motion of a spherical buoy. Fluids 2022, 7, 188. [Google Scholar] [CrossRef]
  40. Windt, C.; Davidson, J.; Ringwood, J.V. High-fidelity numerical modelling of ocean wave energy systems: A review of computational fluid dynamics-based numerical wave tanks. Renew. Sustain. Energy Rev. 2018, 93, 610–630. [Google Scholar] [CrossRef]
  41. Monaghan, J.J. Smoothed particle hydrodynamics. Annu. Rev. Astron. Astrophys. 1992, 30, 543–574. [Google Scholar] [CrossRef]
  42. Wendland, H. Piecewise polynomial, positive definite and compactly supported radial functions of minimal degree. Adv. Comput. Math. 1995, 4, 389–396. [Google Scholar] [CrossRef]
  43. Crespo, A.-J.-C.; Gómez-Gesteira, M.; Dalrymple, R.-A. Boundary conditions generated by dynamic particles in sph methods. Comput. Mater. Contin. 2007, 5, 173–184. [Google Scholar]
  44. Baldock, T.E.; Cox, D.; Maddux, T.; Killian, J.; Fayler, L. Kinematics of breaking tsunami wavefronts: A data set from large scale laboratory experiments. Coast. Eng. 2009, 56, 506–516. [Google Scholar] [CrossRef]
  45. Hsu, T.W. Geometric characteristics of storm-beach profiles caused by inclined waves. Ocean Eng. 1998, 25, 69–84. [Google Scholar] [CrossRef]
  46. Istrati, D.; Buckle, I.; Lomonaco, P.; Yim, S. Deciphering the tsunami wave impact and associated connection forces in open-girder coastal bridges. J. Mar. Sci. Eng. 2018, 6, 148. [Google Scholar] [CrossRef]
  47. Istrati, D. Large-Scale Experiments of Tsunami Inundation of Bridges Including Fluid-Structure-Interaction. Ph.D. Thesis, University of Nevada, Reno, NV, USA, 2017. [Google Scholar]
  48. Van Gent, M.R.A. Influence of oblique wave attack on wave overtopping at caisson breakwaters with sea and swell conditions. Coast. Eng. 2021, 164, 103834. [Google Scholar] [CrossRef]
  49. Van Gent, M.R.A.; van der Werf, I.M. Influence of oblique wave attack on wave overtopping and forces on rubble mound breakwater crest walls. Coast. Eng. 2019, 151, 78–96. [Google Scholar] [CrossRef]
  50. Koosheh, A.; Etemad-Shahidi, A.; Cartwright, N.; Tomlinson, R.; van Gent, M.R.A. Experimental study of wave overtopping at rubble mound seawalls. Coast. Eng. 2022, 172, 104062. [Google Scholar] [CrossRef]
  51. Zheng, J.; Yao, Y.; Chen, S.; Chen, S.; Zhang, Q. Laboratory study on wave-induced setup and wave-driven current in a 2dh reef-lagoon-channel system. Coast. Eng. 2020, 162, 103772. [Google Scholar] [CrossRef]
  52. Vieira, F.; Taveira-Pinto, F.; Rosa-Santos, P. New developments in assessment of wave overtopping on single-layer cube armoured breakwaters based on laboratory experiments. Coast. Eng. 2021, 166, 103883. [Google Scholar] [CrossRef]
  53. Heller, V. Scale effects in physical hydraulic engineering models. J. Hydraul. Res. 2011, 49, 293–306. [Google Scholar] [CrossRef]
  54. Chen, S.-g.; Gong, E.-y.; Zhao, X.; Arikawa, T.; Chen, X. Large-scale experimental study on scour around offshore wind monopiles under irregular waves. Water Sci. Eng. 2022, 15, 40–46. [Google Scholar] [CrossRef]
  55. Chen, B.; Li, S. Experimental study of local scour around a vertical cylinder under wave-only and combined wave-current conditions in a large-scale flume. J. Hydraul. Eng. 2018, 144, 04018058. [Google Scholar] [CrossRef]
  56. Schoonees, T.; Kerpen, N.B.; Schlurmann, T. Full-scale experimental study on wave overtopping at stepped revetments. Coast. Eng. 2021, 167, 103887. [Google Scholar] [CrossRef]
Figure 1. Sketch of the new artificial block TB-CUBE.
Jmse 10 01116 g001
Figure 2. (a) Sketch of model layout; (b) Model photo with breakwater slope, m = 2.
Jmse 10 01116 g002
Figure 3. (a) Structure of the artificial block, TB-CUBE; (b) Artificial block on the breakwater in the numerical model (two blocks in the flume width direction).
Jmse 10 01116 g003
Figure 4. Layout of the numerical wave flume for wave run-up and overtopping, with slope m = 1.5, 2 and 2.5. TB-CUBE armor units were installed on the slope (not shown).
Jmse 10 01116 g004
Figure 5. Wave run-up (af) and overtopping (gl) snapshots for different type of blocks.
Jmse 10 01116 g005
Figure 6. Numerical results of wave performance in the relative wave run-up (a), reflection coefficient (b), and overtopping (c) under various R1 (relative radius of the sphere) and R2 (relative radius of the cylinder), as stated in Figure 1 and Table 2.
Jmse 10 01116 g006
Figure 7. Wave patterns and velocity distribution at t = 5.25 s when thewave propagates to the breakwater: (a) Without article block; (b) Zoom in; (c) With article block; (d) Zoom in.
Jmse 10 01116 g007
Figure 8. The same as Figure 7, but for wave climbing along the breakwater at t = 5.45 s.
Jmse 10 01116 g008
Figure 9. The same as Figure 7, but for wave climbing to the top along the breakwater at t = 5.75 s.
Jmse 10 01116 g009
Figure 10. The same as Figure 7, but for wave retreating at t = 6.15 s.
Jmse 10 01116 g010
Figure 11. The same as Figure 7, but for wave breaking at t = 6.45 s.
Jmse 10 01116 g011
Figure 12. Wave overtopping and velocity distribution at time snapshots 7.70 s (a), 7.80 s (b), 7.90 s (c), 8.05 s (d), 8.30 s (e), and 9.00 s (f).
Jmse 10 01116 g012
Figure 13. Numerical results for slope versus the wave run-up under various wave heights (a) T = 6 s, D = 16 m; (b) T = 8 s, D = 16 m; (c) T = 9 s, D = 16 m; (d) T = 11 s, D = 12 m; (e) T = 13 s, D = 12 m; (f) T = 14 s, D = 12 m.
Jmse 10 01116 g013
Figure 14. L/H versus reflection coefficient (a); L/H versus relative wave run-up (b,c) from numerical model results.
Jmse 10 01116 g014
Figure 15. Wave-breaking parameter versus wave run-up from the numerical model results.
Jmse 10 01116 g015
Figure 16. Fitting line for m = 1.5 (a); m = 2.0 (b); m = 2.5 (c) from the numerical model results.
Jmse 10 01116 g016
Figure 17. Wave run-up from the numerical model results versus from the fitting formula.
Jmse 10 01116 g017
Table 1. Physical experiment wave parameters, where m is slope, D is water depth, H is wave height, and T is period.
D (m)m T (s)
1.21.51.82.22.5
0.3/0.41.5/2.0/2.5H (m)0.060.060.060.060.06
0.080.080.080.080.08
0.100.100.100.100.10
0.120.120.120.120.12
Table 2. Size of the TB-CUBE blocks.
BlockSizePorosity ρp (%)
R1R2abcd
1#0.450 h0.225 h0.550 h0.221 h0.165 h0.110 h46
2#0.450 h0.315 h0.370 h0.357 h0.006 h0.179 h59
3#0.400 h0.225 h0.550 h0.339 h0.106 h0.169 h40
4#0.400 h0.275 h0.450 h0.419 h0.015 h0.210 h48
5#0.475 h0.225 h0.550 h0.163 h0.193 h0.082 h50
6#0.475 h0.315 h0.370 h0.289 h0.041 h0.144 h60
Table 3. Comparison of wave run-up and reflection coefficient between the numerical model and physical model. Deviation = (numerical model value-physical model value)/physical model value × 100%.
No.Period (s)H (m)Run-Up (m)Kr
Physical ModelNumerical ModelDeviation (%)Physical ModelNumerical Model
1 1.20.060.089 0.088 1.2 0.270.24
2 0.120.210 0.198 5.7 0.250.23
3 1.50.060.102 0.098 3.90.280.33
4 0.120.228 0.233 2.3 0.210.23
5 1.80.060.102 0.098 4.4 0.440.51
6 0.120.210 0.199 5.2 0.440.55
Table 4. Comparison of wave overtopping between the numerical model and physical model.
No.H (m)Period (s)Overtopping L/(m·s)
Physical ModelNumerical ModelDeviation (%)
10.121.20.1750.1608.6
21.50.2250.2192.7
31.80.2860.2618.7
42.20.8100.8130.4
Table 5. TB-CUBE roughness-permeation parameter from the numerical model results.
NoWave InputRun-Up [m]Roughness Coefficient K
T (s)H (m)Smooth Interfacewith TB-CUBE BlockSmooth InterfaceTB-CUBE
ExperimentMean
1 1.20.060.158 0.073 10.462 0.462
2 0.120.323 0.143 10.443
3 1.80.060.170 0.093 10.547
4 0.120.353 0.158 10.448
Table 6. Fitting coefficients.
FunctionSlope m
1.522.5
A(m)0.43190.25500.04805
B(m)−0.0069−0.0055−0.01068
C(m)0.0002820.0002630.000021
Publisher’s Note: MDPI stays neutral with regard to jurisdictional claims in published maps and institutional affiliations.

