Article

Recognition and Positioning of Fresh Tea Buds Using YOLOv4-lighted + ICBAM Model and RGB-D Sensing

1
Beijing Key Laboratory of Optimization Design for Modern Agricultural Equipment, College of Engineering, China Agricultural University, Beijing 100083, China
2
Quality & Safety Assessment Research Unit, U. S. National Poultry Research Center, USDA-ARS, 950 College Station Rd., Athens, GA 30605, USA
3
Zhanglou Town Government of Chengwu County, Heze 274205, China
*
Author to whom correspondence should be addressed.
Agriculture 2023, 13(3), 518; https://doi.org/10.3390/agriculture13030518
Submission received: 10 January 2023 / Revised: 15 February 2023 / Accepted: 17 February 2023 / Published: 21 February 2023
(This article belongs to the Special Issue Sensors Applied to Agricultural Products)

Abstract

:
To overcome the low recognition accuracy, slow speed, and difficulty in locating the picking points of tea buds, this paper is concerned with the development of a deep learning method, based on the You Only Look Once Version 4 (YOLOv4) object detection algorithm, for the detection of tea buds and their picking points with tea-picking machines. The segmentation method, based on color and depth data from a stereo vision camera, is proposed to detect the shapes of tea buds in 2D and 3D spaces more accurately than using 2D images. The YOLOv4 deep learning model for object detection was modified to obtain a lightweight model with a shorter inference time, called YOLOv4-lighted. Then, Squeeze-and-Excitation Networks (SENet), Efficient Channel Attention (ECA), Convolutional Block Attention Module (CBAM), and improved CBAM (ICBAM) were added to the output layer of the feature extraction network, for improving the detection accuracy of tea features. Finally, the Path Aggregation Network (PANet) in the neck network was simplified to the Feature Pyramid Network (FPN). The light-weighted YOLOv4 with ICBAM, called YOLOv4-lighted + ICBAM, was determined as the optimal recognition model for the detection of tea buds in terms of accuracy (94.19%), recall (93.50%), F1 score (0.94), and average precision (97.29%). Compared with the baseline YOLOv4 model, the size of the YOLOv4-lighted + ICBAM model decreased by 75.18%, and the frame rate increased by 7.21%. In addition, the method for predicting the picking point of each detected tea bud was developed by segmentation of the tea buds in each detected bounding box, with filtering of each segment based on its depth from the camera. The test results showed that the average positioning success rate and the average positioning time were 87.10% and 0.12 s, respectively. In conclusion, the recognition and positioning method proposed in this paper provides a theoretical basis and method for the automatic picking of tea buds.

1. Introduction

Tea is one of the three major non-alcoholic beverages in the world [1,2]. According to the data from the Food and Agriculture Organization of the United Nations, tea production in the world was 5.73 million tons in 2016, of which China accounted for 42.6%, the largest tea producer. The types of tea harvesting machines can be mainly categorized into reciprocating cutting, spiral hob, horizontal circular knives, and spiral folding [3,4,5]. These conventional mechanized tea-harvesting methods often result in a mixture of new and old tea leaves. Although effective for most tea leaves, these machines are not appropriate for picking premium quality tea leaves, because mixed old leaves will lower the quality of the product and decrease the yield [6]. At present, the picking of premium-quality tea leaves is done manually. The decrease in the agricultural population (labor shortages even in China), and rising labor costs, necessitate the development of methods and machines for intelligent and automated detection and picking of tea leaves [7,8,9]. However, there is a research gap in detecting and differentiating tea buds from other leaves and stems, and predicting the locations for picking the tea buds individually.
Many researchers have reported the detection and classification of crops [10], including apple [11], citrus [12], melon [13], strawberry [14], kiwi [15], tomato [16], cucumber [17], and pepper [18]. In the area of detection of tea leaves, it is important to differentiate tea buds from other tea leaves, because these tea buds of premium tea plants are sold separately from other leaves, at high prices. However, tea buds are similar to other tea leaves in color and shape. Thus, it is difficult to accurately detect only tea buds in their natural growing condition. Traditional image processing techniques, based on K-means clustering and Bayesian discrimination of color features, have been proposed to detect tea buds [19,20]. However, due to the complex environment of tea plantations, and changing lighting conditions, these traditional image processing methods cannot solve the problem of the identification of tea buds and picking positions.
Compared with traditional image processing techniques, deep learning has significantly improved recognition accuracy in many other agriculture applications and tea bud detection tasks [21,22,23,24]. Qian et al. proposed an improved deep convolutional decoding network (TS-SegNet) for the segmentation of tea sprouts. Xu et al. proposed a convolutional neural network combining the You Only Look Once v3 (YOLOv3) and DenseNet201 algorithms, to achieve a detection accuracy of 95.71% for tea buds. Sun et al. combined the improved YOLO network, using largescale and mesoscale detection instead of the original multi-scale detection, with the super green feature and the OSTU algorithm, to solve the tea bud detection problem [25]. Chen et al. found that more input information can lead to a better detection result. They proposed a method using image enhancement and a Fusion Single-Shot Detector [26]. Li et al. proposed a real-time tea shoot detection method, using the channel and layer pruned YOLOv3-SPP deep learning algorithm. The number of parameters, model size, and inference time of the tea shoot detection model after compression were reduced by 96.82%, 96.81%, and 59.62%, respectively, and the mean average precision of the model was only 0.40% lower than that of the original model [27]. Researchers also proposed using deep learning to detect tea buds, based on the improved YOLOv3 and the Mask-RCNN (region-based convolutional neural network), where a thinning algorithm [28], and a method for finding the centroid of a stem [29], were proposed, to locate the picking points. Yan et al. proposed the method of tea segmentation and picking point location based on a lightweight convolutional neural network named MC-DM (Multi Class DeepLabV3+ MobileNetV2 (Mobile Networks Vision 2)), to solve the problem of identifying the tea shoot picking point in a natural environment. The accuracy of picking point identification reached 82.52%, 90.07%, and 84.78% for single bud, one bud with one leaf, and one bud with two leaves, respectively [30]. Chen et al. used a Faster R-CNN model and a fully convolutional network (FCN) in cascade, to detect tea buds, and achieved an average accuracy of 84.91%. This literature review shows that the previous studies using deep learning to identify tea buds and locate picking points achieved good accuracy (ranging from 85% to 96% in detecting tea buds and from 70% to 95% in localizing the picking points), and the processing time, in terms of processed frames per second, was between 0.12 and 7.70 [31]. There was still a need to improve the detection and localization performance, while reducing the processing time, for deploying an automated tea-harvest machine in practice.
Hence, the main objective of this paper is to introduce a new deep learning-based object detection algorithm for the accurate detection and localization of tea buds, and their picking, in real-time. Since the first version of YOLO [32] was introduced in 2016, the object detection performance in accuracy and speed has been greatly improved. Due to the size of the network meaning it cannot achieve a real-time detection effect, some researchers have reported light networks of YOLO series, to identify and count targets [33,34,35,36,37,38,39]. In this paper, YOLO v4 [40] was used as our baseline object detection model, and it was made more lightweight and improved.
The sub-objectives of the paper are: (1) to study a solution to detect tea buds growing in outdoor natural light using a stereo vision (RGB-D) camera, (2) to characterize the performance of the stereo camera, (3) to develop a lightweight YOLOv4, with improved detection accuracy, (4) to apply 3D depth information to improve the detection accuracy of tea buds, (5) finally to solve the problem of locating picking points.

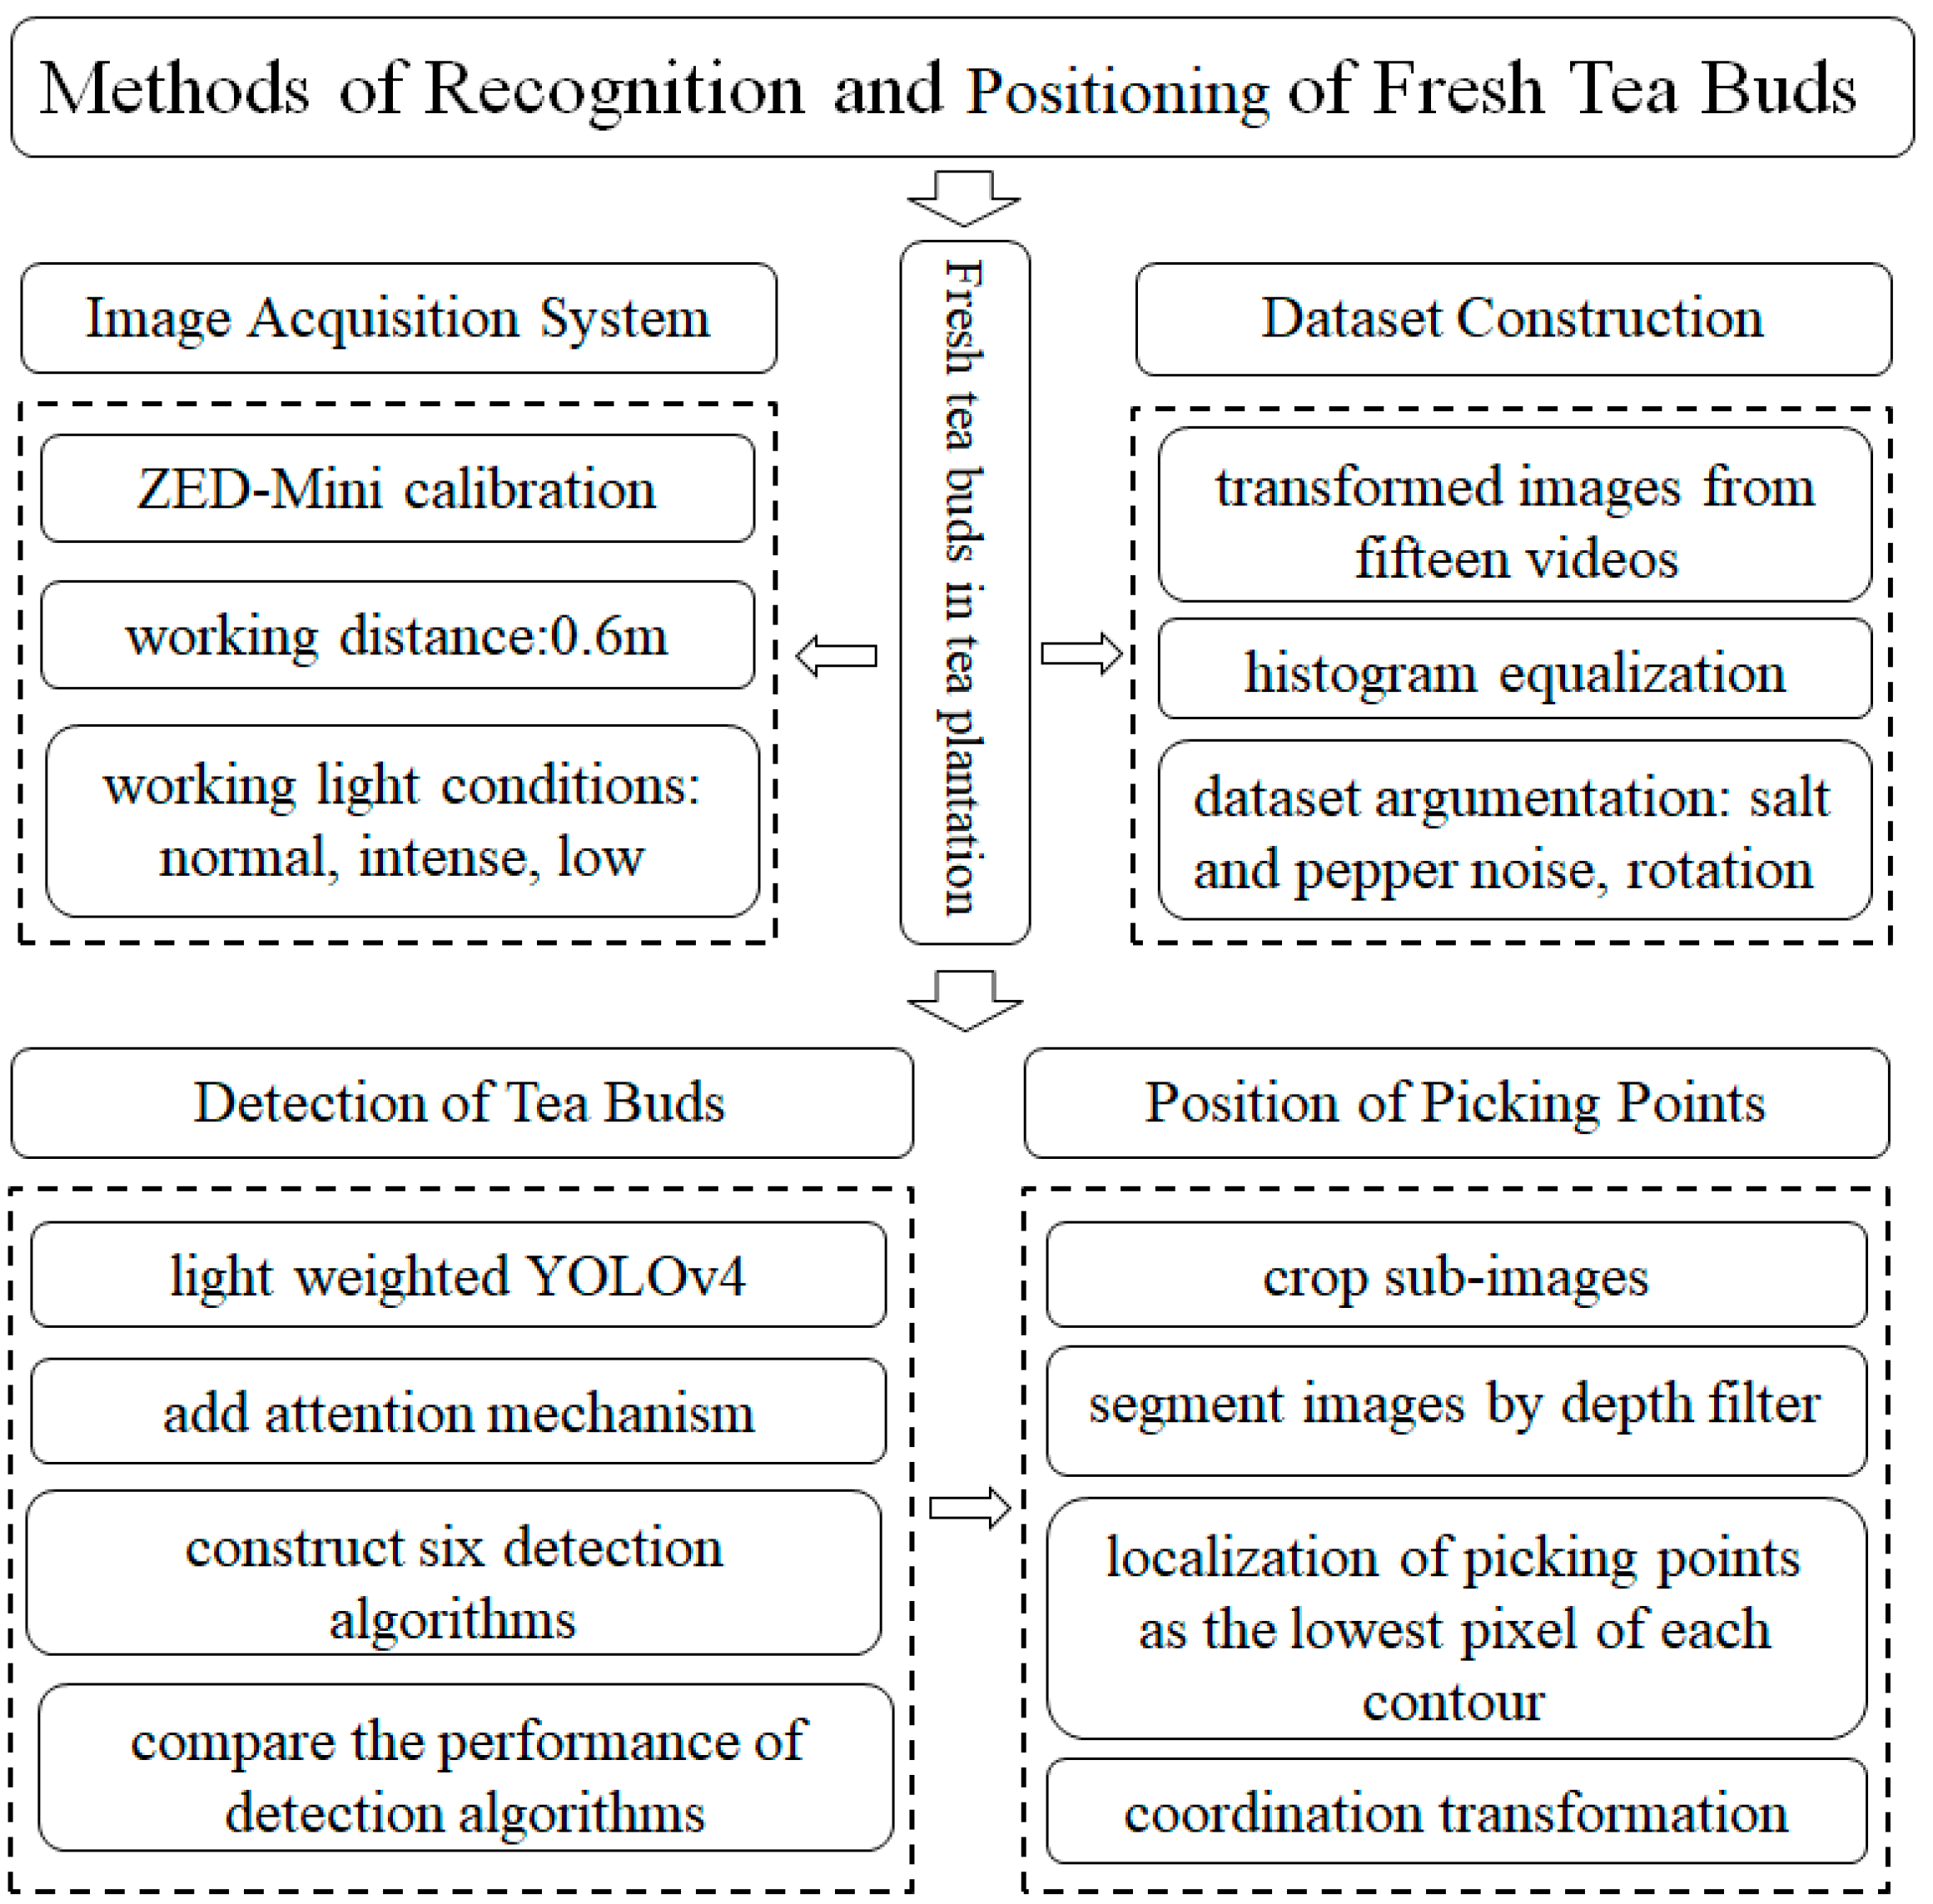
2. Materials and Methods

2.1. Image Acquisition and Dataset Construction
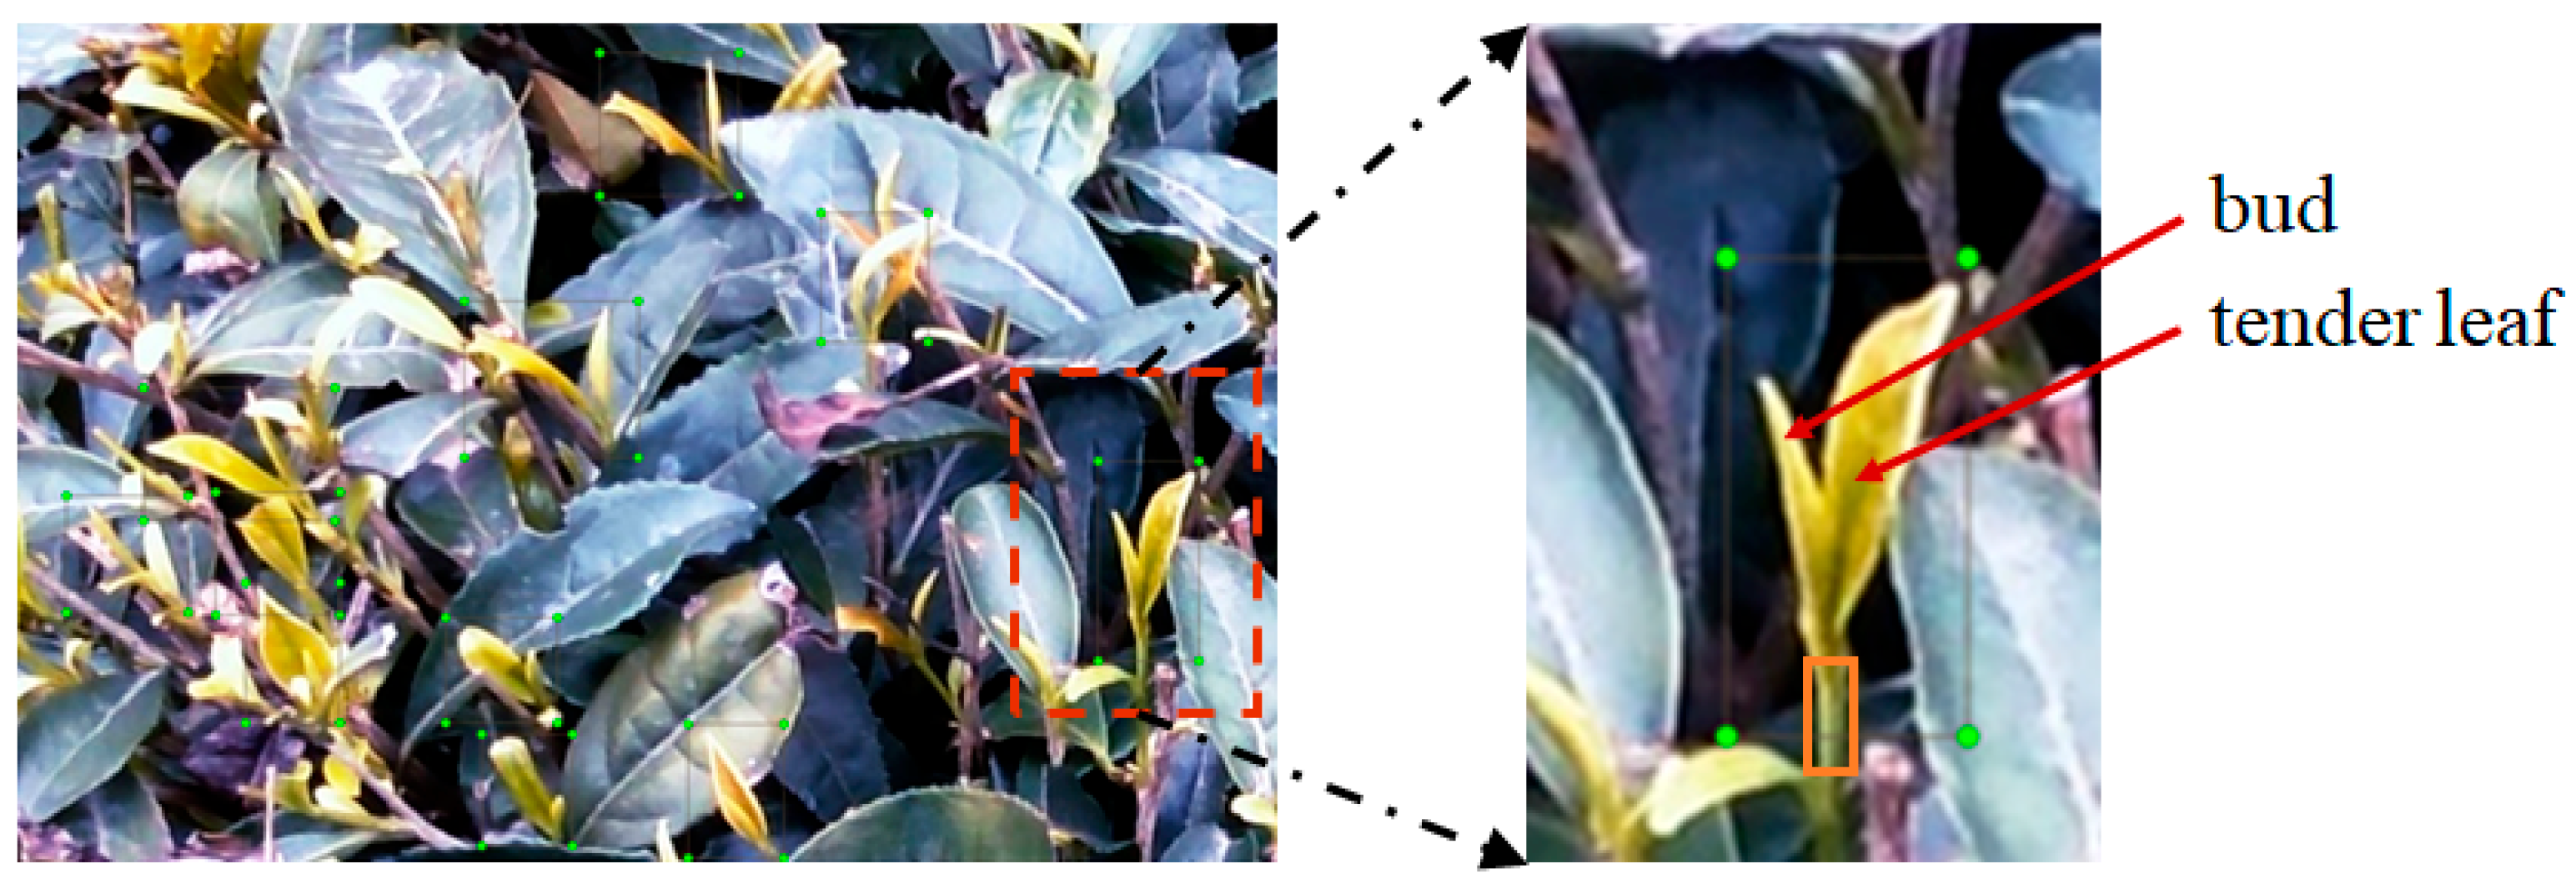
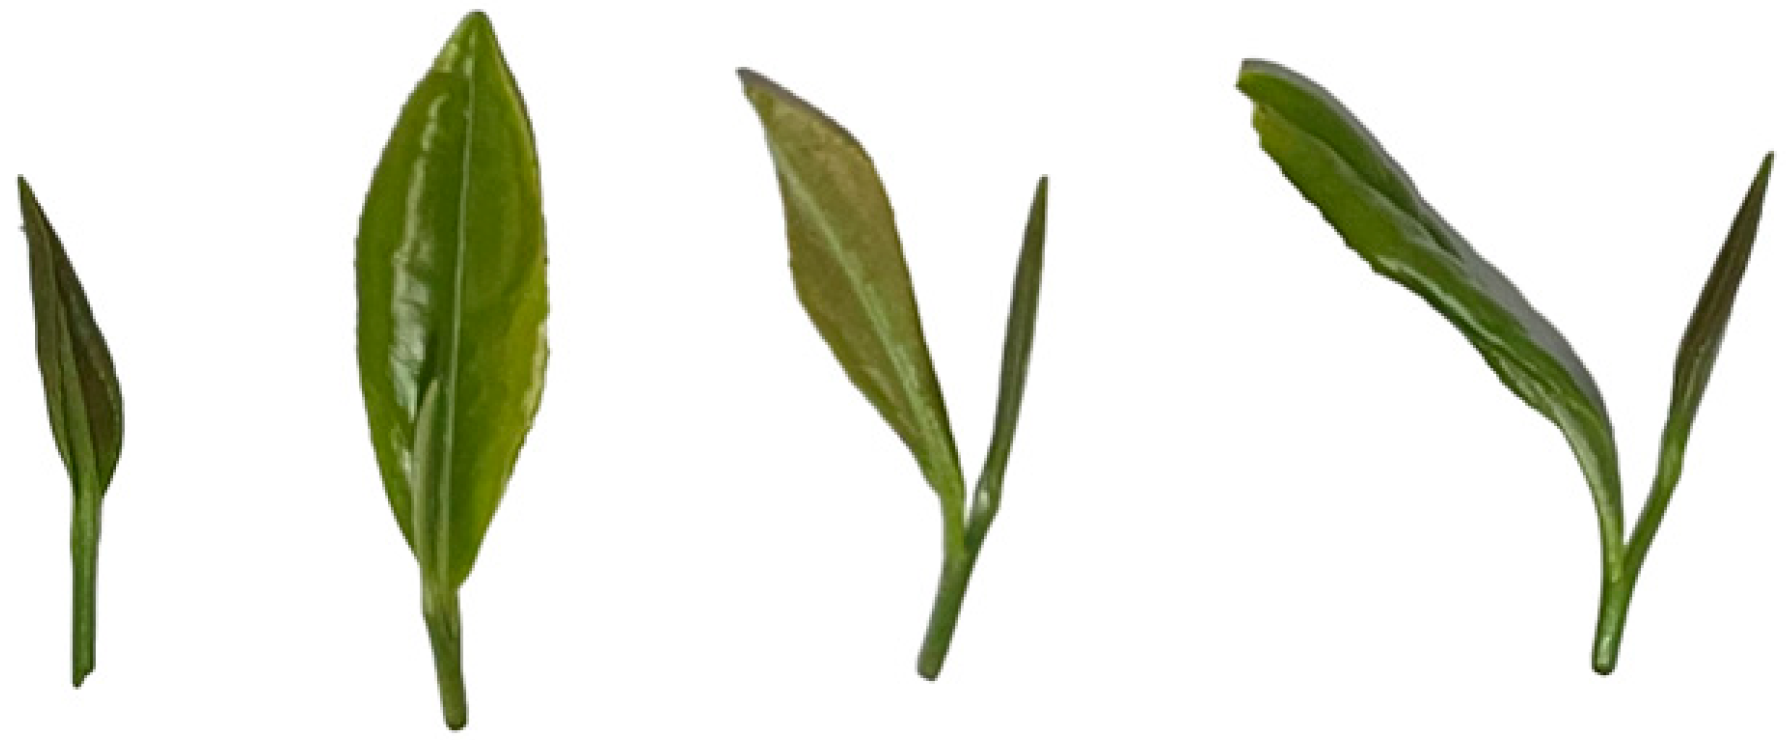
2.1.1. Tea Plants

Biluochun tea (Tetraena mongolica Maxim) that grew naturally in a tea plantation (Qingcheng Road Tea Tourist Plantation, Dujiangyan, Sichuan Province, China) was selected for this study. The planting parameters in the tea plantation were as follows: (1) the width and the height of a tea ridge were about 900 mm and 750 mm, respectively, (2) the distance between tea ridges was about 600 mm, and (3) the top surface of the tea ridge was close to the plane. To make the detection model suitable for the different lighting conditions of the tea plantation, images using a stereo vision camera were collected in video mode at three time periods: 9:00–10:00, 12:00–13:00, and 17:00–18:00, on 8 April 2020. Four sets of videos were collected during each period, and the images included tea buds, tender leaves, old leaves, and the real scene of the tea plantation environment.

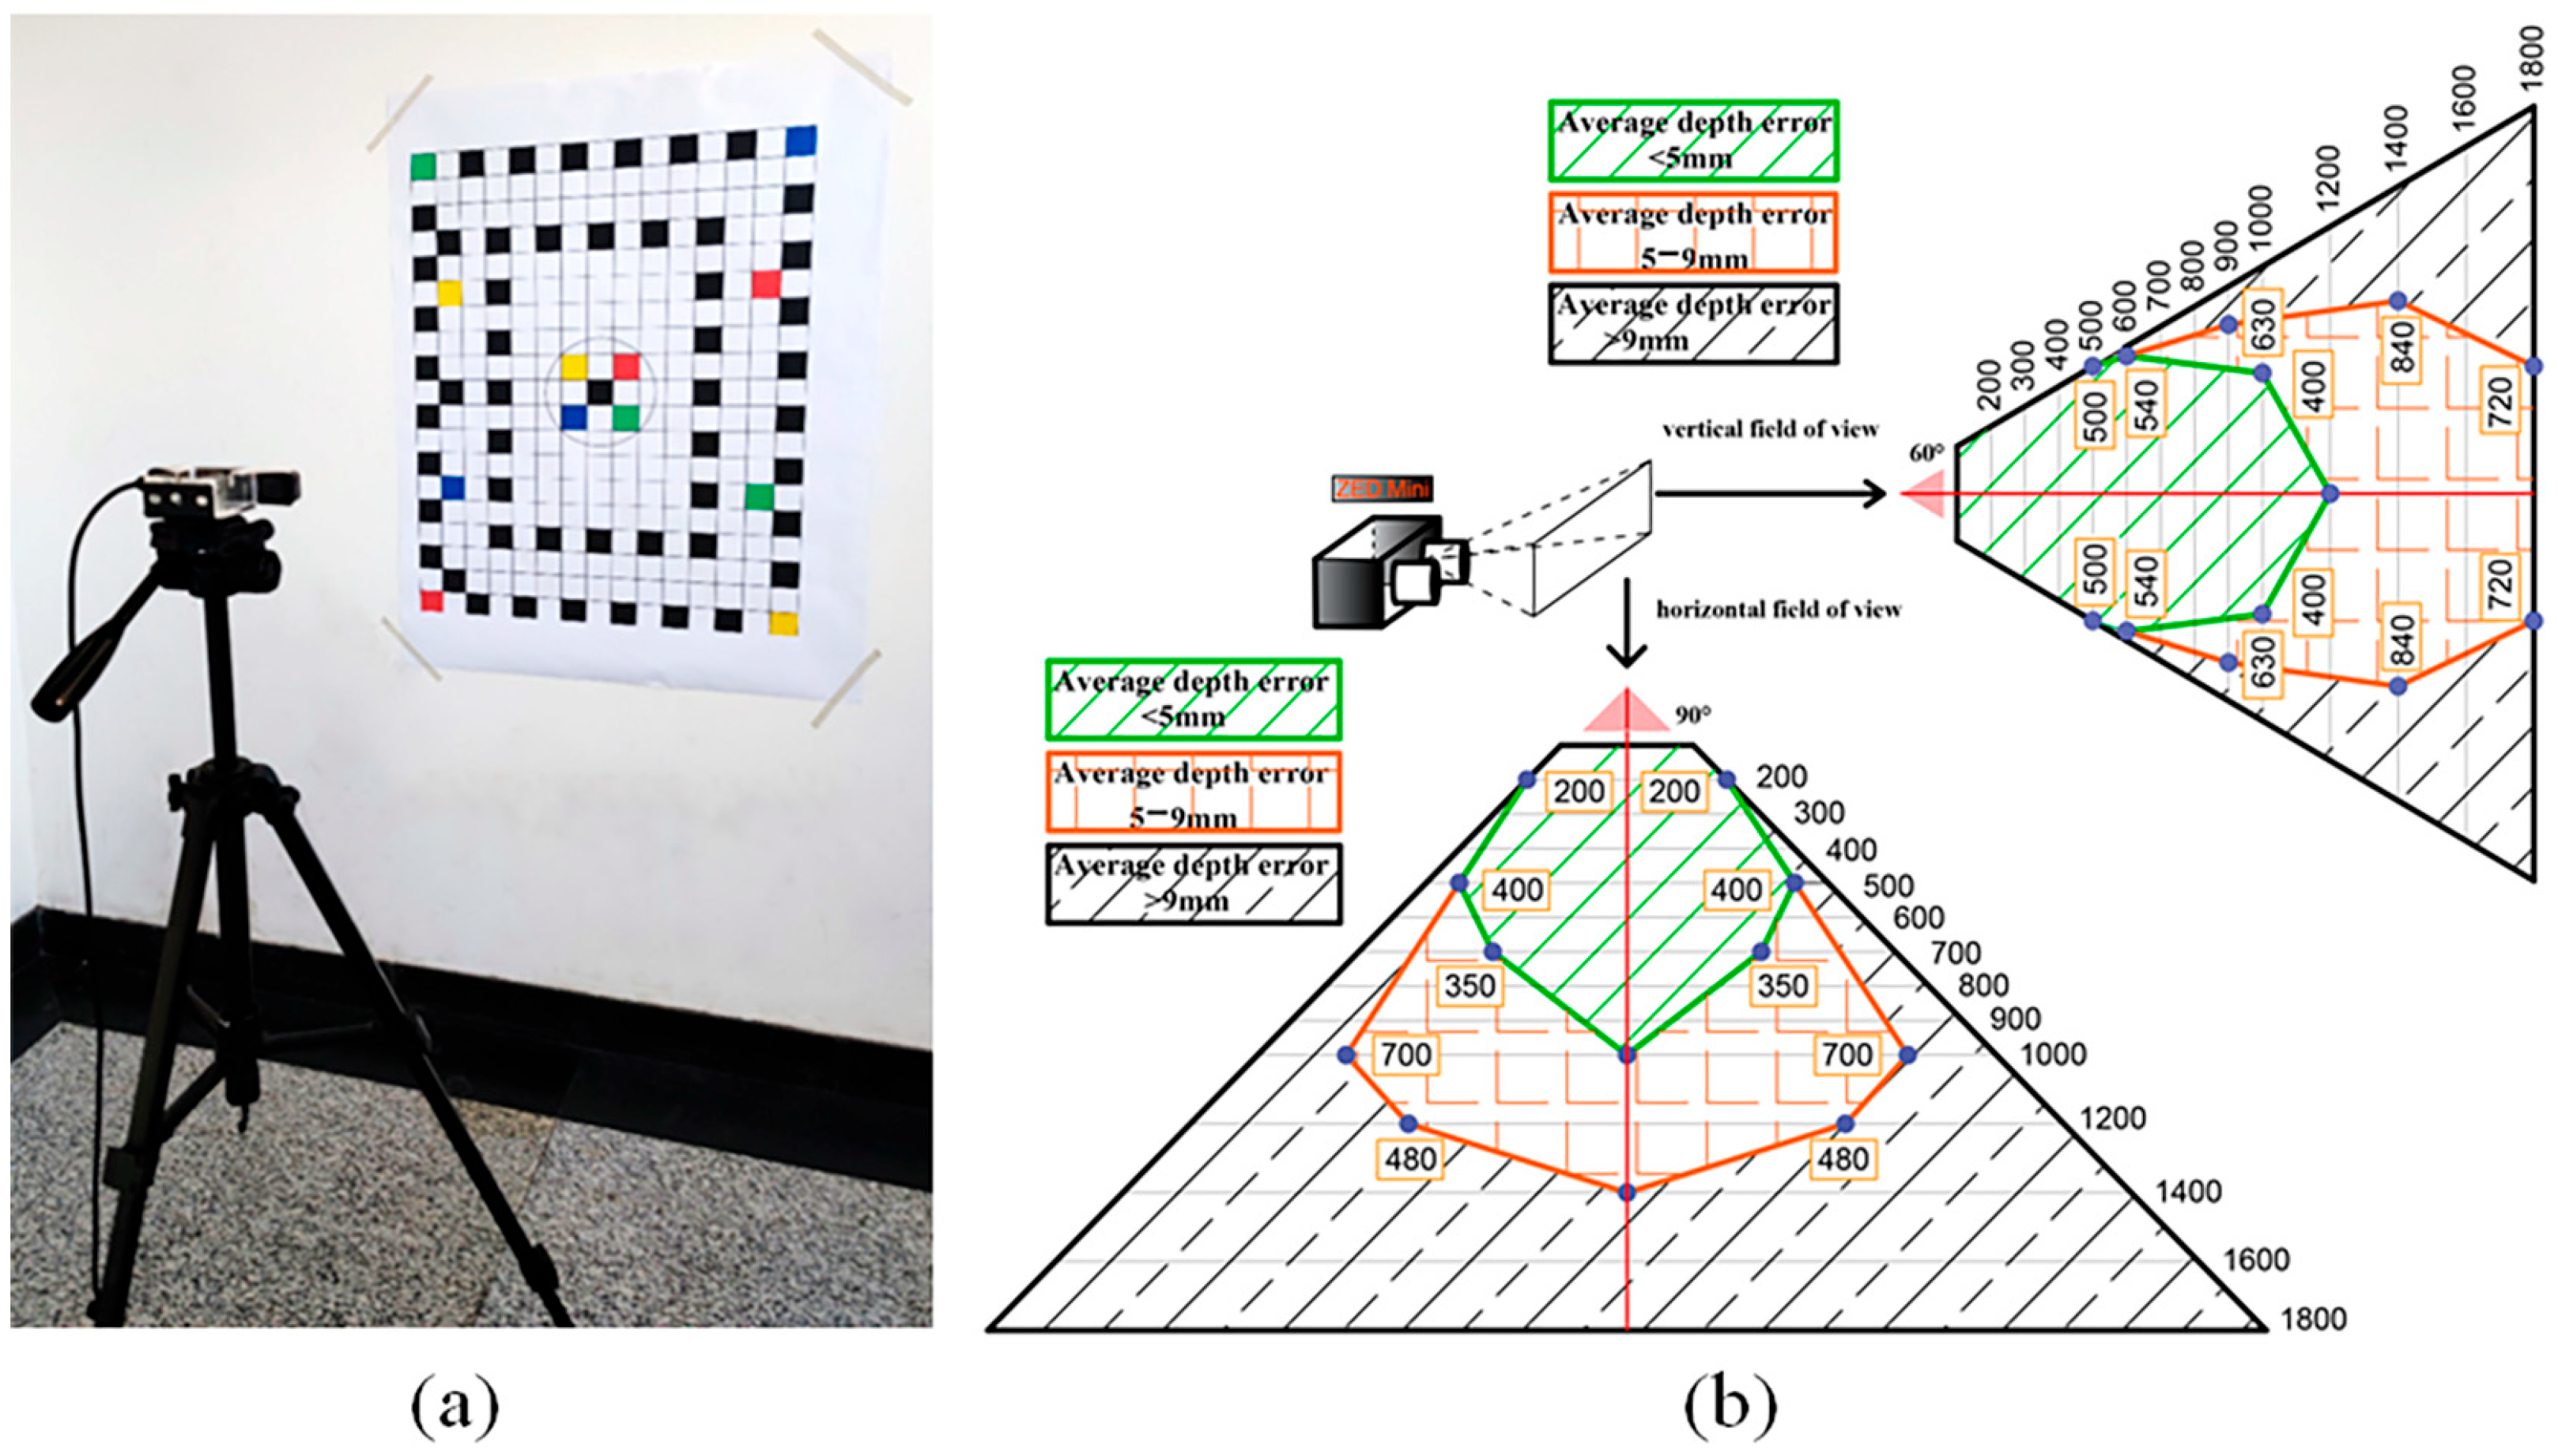
2.1.2. Image Acquisition System

In this paper, an RGB-D camera, based on two RGB stereo sensors (ZED-Mini, Stereolabs, San Francisco, CA, USA), was used for acquiring color images and their spatially corresponding depth images. The stereo camera was set to operate in a video mode, to acquire color and depth images with a frame rate of 30 Hz, a pixel resolution of 1920 × 1080, a depth range of 0.1–15 m, and a field of view of 90° (horizontal) × 60° (vertical). The depth mode for the highest depth range (ULTRA) was selected, and a mode (FILL) to fill in holes occurring due to occlusion and filtering was also selected. The stereo camera, calibrated by the manufacturer, was recalibrated manually with the manufacturer-provided calibration tool (ZED Calibration).
An experiment for obtaining the best working distance of the stereo camera was conducted, through an analysis of depth errors. For the depth error analysis, a planar target with a grid pattern was first attached to the wall, and the view of the stereo camera, installed on a tripod, was adjusted such that the optical center of the left camera coincided with that of the grid target (Figure 1a). The live view was also checked to ensure the relative angle between the camera and the X, Y, and Z axes of the grid were 0°. Under this setup, the distance of the camera was measured between the optical center of the left camera and the center of the grid target. The initial camera distance was set to 0.2 m. Then, the camera distance to the grid target was increased by a step size of 0.1 m, between 0.2 and 1 m, and then by a step size of 0.2 m, from 1 m to 1.8 m. At each change in the distance, the distance between the eight equal points on the horizontal and vertical center lines of the grid target and the optical center of the left camera were calculated. A distance meter was used to measure the real distance, and the depth errors of the calculated distances and real distances were analyzed. The depth error analysis results are shown in Figure 1b. When the camera distance was greater than 0.2 m but less than 0.5 m, the depth measurement error was less than 5 mm. In the range from 0.5 m to 1 m, the pixels along the optical axis had a depth measurement error of less than 5 mm, but the error size increased toward the edges of the field of view, to 5 to 9 mm. While the depth accuracy along the vertical field of view was better than the horizontal view when the camera distance was longer than 1.0 m, the errors at the image edges in the far distance of over 1.4 m were greater than 9 mm. In general, the error increased with the increase in the center distance, no matter whether in the horizontal field of view or the vertical field of view.
The stereo camera for tea plant imaging was attached to a gimbal, and the camera’s shoot angle was set to about 45°. Considering the camera performance, the operation of an intelligent tea-picking machine, and the accuracy of detection and positioning models, the optimal parameters for image data collection were determined as follows: a camera working distance of 0.6 m, and a horizontal field of view of about 0.936 m. The expected error of the measured depths under this setup was about 5–9 mm, from the depth error analysis study (Figure 1b).

2.1.3. Dataset Construction

To simulate the view of the picking machine, crossing the ridge straight forward, to capture SVO video. The videos were taken during three time periods, under normal light, intense light, and low light conditions. Five videos were taken under every light condition. The video captured by the stereo camera were saved in the manufacturer’s proprietary video format (SVO). Using a Python custom code, based on the ZED SDK, every third frame in a video was extracted and exported into a PNG format image (1920 × 1080 pixels). The initial tea dataset was composed of one image selected from every 10 transformed images, so as to reflect the image changes caused by environmental factors to a certain extent. A total of 3900 stereo images were extracted from the acquired videos, with 1300 stereo pairs per light condition. The images included old tea leaves, tea buds, and the complex tea plantation environment.
To improve the contrast between the leaves and tea buds in the images, histogram equalization processing was performed and evaluated, before adding the contrast-enhanced images to the final dataset, for which global histogram equalization (GHE) and adaptive histogram equalization (AHE) were tested. Moreover, data augmentation was performed to improve the generalization ability of the model via sharpening, adding salt and pepper noise, and rotating (clockwise 45° and 135°). The total number of images, including the original and processed images, was 15,600 (Table 1).
It has been reported that the optimal picking position of green tea leaves has a strong correlation with metabolism [41]. A comprehensive analysis of 18 metabolites in green tea showed that tea buds had a higher concentration of beneficial metabolites, such as gallic acid, compared to the concentration of harmful metabolites such as theanine [42]. In this study, one bud and one leaf were included in one target object, to detect such that a ground-truth-bounding box for training and evaluation of the models included one bud and one tender leaf, as shown in Figure 2. The determination of the real label sample on the ground truth is very important for the accuracy of the detection, while the results obtained by the artificial naked eye sensory method will inevitably have errors. Despite all this, the research object of this work, the tea, is a perennial plant, and the differences between new buds and old leaves are obvious, especially in color and shape (Figure 2). Moreover, in this paper, a unique combination of one bud and one leaf is selected as the identification standard, which makes the label data more targeted. Besides, the automatic picking of tea is still developing, thus there is no very mature standard. This work is also a preliminary one, further work will be conducted in the near future. The optimal picking areas were also covered as the area of the yellow rectangular box. LabelImg was the labeling tool used to make the ground-truth-bounding boxes in the images.

2.2. Detection of Tea Buds

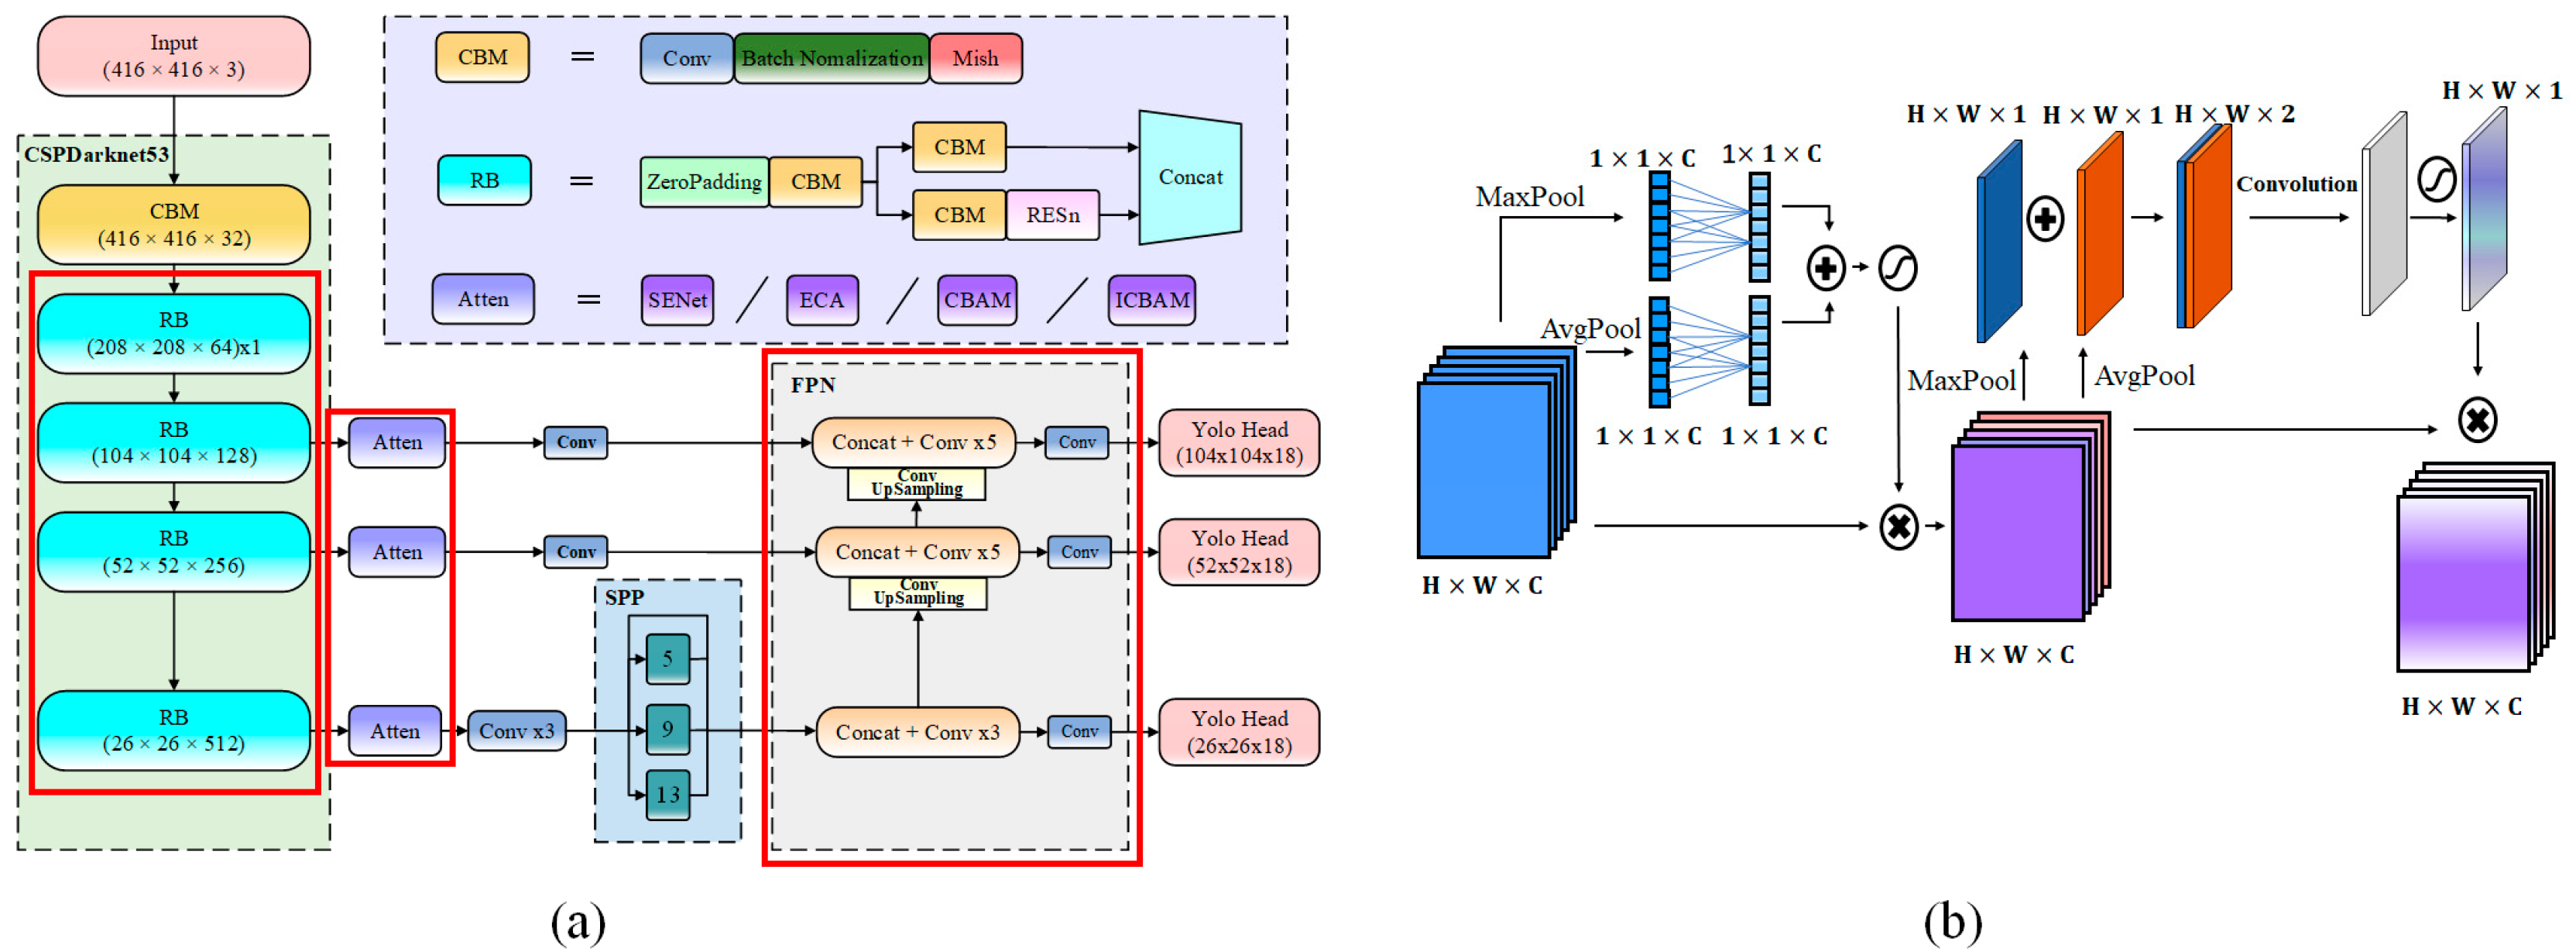
2.2.1. Baseline YOLOv4 Network

The YOLOv4 network was used as a baseline model to evaluate the performance of the new models introduced in this paper. The YOLOv4 architecture was based on three sub-networks, including the backbone network, for feature extraction; the neck network, for fusion of extracted features; and the head network, for bounding box localization and object classification.
The backbone network of YOLOv4 was CSPDarkNet53, which combined Darknet53 and CSPDenseNet. CSPDarkNet53 consisted of one convolution, batch normalization, and Mish (CBM) module, and five stacked Resblock_body (RB) modules. The Mish activation function in the CBM module had a generalization ability [43]. The RB module used the cross-stage partial network (CSPNet) approach [44] for partitioning the feature map of the base layer into two parts, and then merging them through a cross-stage hierarchy. The spatial pyramid pooling (SPP) block, and a path aggregation network (PANet) block, were used as the neck network, with bottom-up and top-down pyramid path structures. The SPP block utilized pooling kernels of different scales for max-pooling, to separate salient contextual features. The PANet structure realized the repeated extraction and fusion of features.
The head of Yolov3 was used for the head network, where bounding boxes were located and classification was performed. The coordinates of the bounding boxes, as well as their scores, were predicted.

2.2.2. Lightweight YOLOv4 Network

The speed of the YOLOv4 model, for the detection of tea buds, can be improved with a lightweight model. In this paper, the last RB was removed from the backbone network, and three feature layers were reserved for the input of the neck network, where the unnecessary feature layer of 13 × 13 × 1024 was removed, and a feature layer of 104 × 104 × 128 was introduced, to focus on the small-scale features of tea buds. In the neck network, the PANet structure was replaced by the feature pyramid network (FPN), to simplify the model. In this work, the lightweight network model was named YOLOv4-lighted.
Figure 3a shows the basic structure of the improved tea buds detection algorithm model proposed in this paper. We chose an image of 416 × 416 pixels as the model input. Through the CBM module, the shallow feature information was aggregated. Then, through the four-layer RB structure, further features were extracted, and three effective feature layers were obtained, where the first two focused on the detection of small- and medium-sized tea buds, and the last one focused on large-scale features. Then, the different attention mechanism modules were introduced. The specific processes are shown in Figure 3b. The last layer used the SPP structure to enlarge the receptive field, and FPN to realize the features’ fusion. Finally, we obtained the features with dimensions of 104 × 104 × 18 , 52 × 52 × 18 , and 26 × 26 × 18 (where 18 is 3   ×   ( 1 + 1 + 4 ) : 3 is the number of anchors, 1 is the number of categories, 1 is the confidence level, and 4 is the coordinate information of the object).

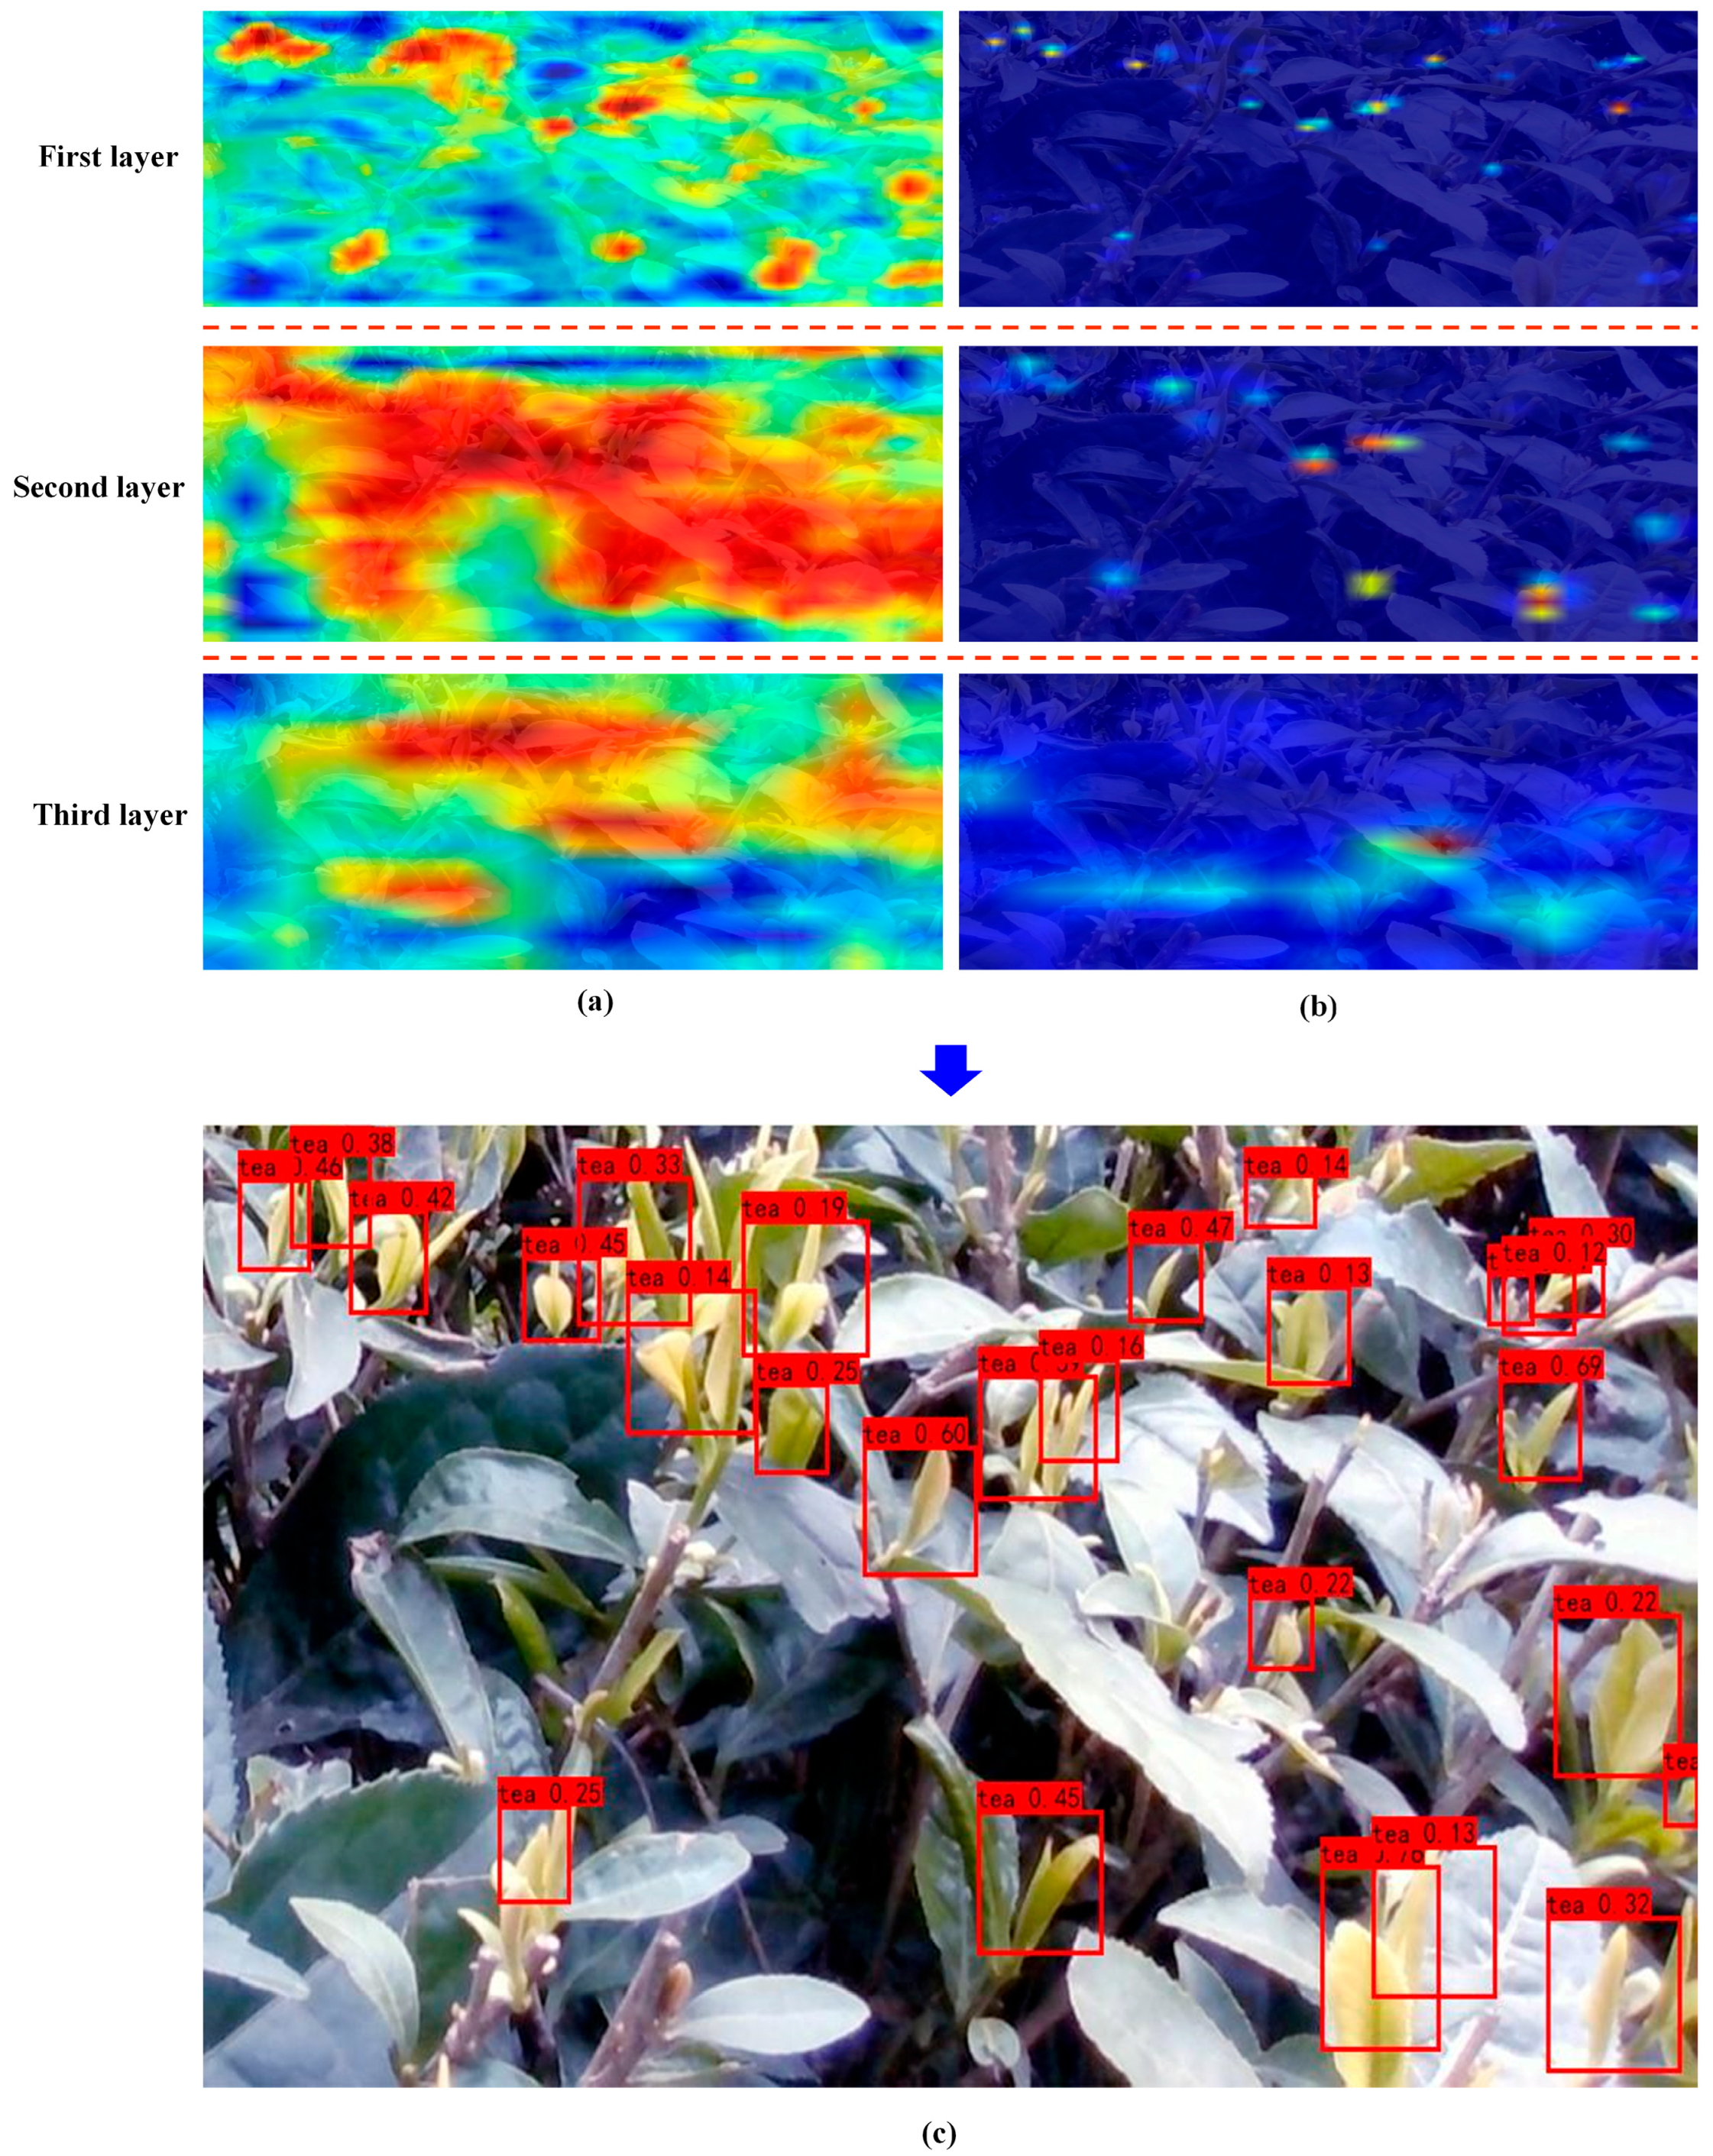
2.2.3. Multi-Scale Fusion Pyramid with Attention Mechanism

Although the introduction of a low-dimensional feature layer was beneficial for extracting small-sized objects [45], it also introduced a large amount of background noise, which could affect the accuracy of identification. To solve this problem, we used an attention mechanism at the beginning of the neck network. The channel attention mechanism SENet [46], efficient channel attention (ECA) [47], convolutional block attention module (CBAM) [48], and the self-improved attention mechanism (ICBAM) were evaluated and compared, to find the optimal attention mechanism. The ICBAM structure is shown in Figure 3b, which was divided into two parts, the left was the channel attention mechanism, and the right was the spatial attention mechanism. Under the channel attention mechanism, the original feature map, H × W × C, was compressed into two 1 × 1 × C feature maps spatially, through maximum pooling and average pooling. Then the Conv1D construction replaced fully connected layers, to improve the detection speed and obtain feature information across channels. Finally, the two-channel feature maps were fused, using a sigmoid function, to form the new channel. The weight coefficient enhanced the classification information. A new enhanced feature map was obtained through multiplying by the weight coefficients of the original feature map. Similarly, the maximum pooling and average pooling in the channel dimension were used to pool the original feature map (H × W × C), to obtain two H × W × 1 feature maps, and after stacking the two feature maps, the spatial attention of H × W × 1 was finally obtained through the 7 × 7 convolutional layer and the sigmoid function. The force weight was multiplied by the original feature map to obtain a new feature map. The feature layer of the changed attention mechanism was used as the input of the neck network to extract further features.

2.2.4. Construction Strategy of Tea Buds Detection Algorithm

The lightweight network YOLOv4-lighted, was combined with the attention mechanism SENet, ECA, CBAM, and ICBAM modules, to make five improved YOLOv4 networks, as shown in Table 2 Compared with the baseline YOLOv4, the total number of parameters of the YOLOv4-lighted network was reduced by 79.40%. In addition, compared with the YOLOv4-lighted network, the networks with different attention mechanisms had an increase of less than 1.31% in the total number of parameters. Although the total amount of the five improved network parameters was basically the same, the model detection effect needed to be further compared.

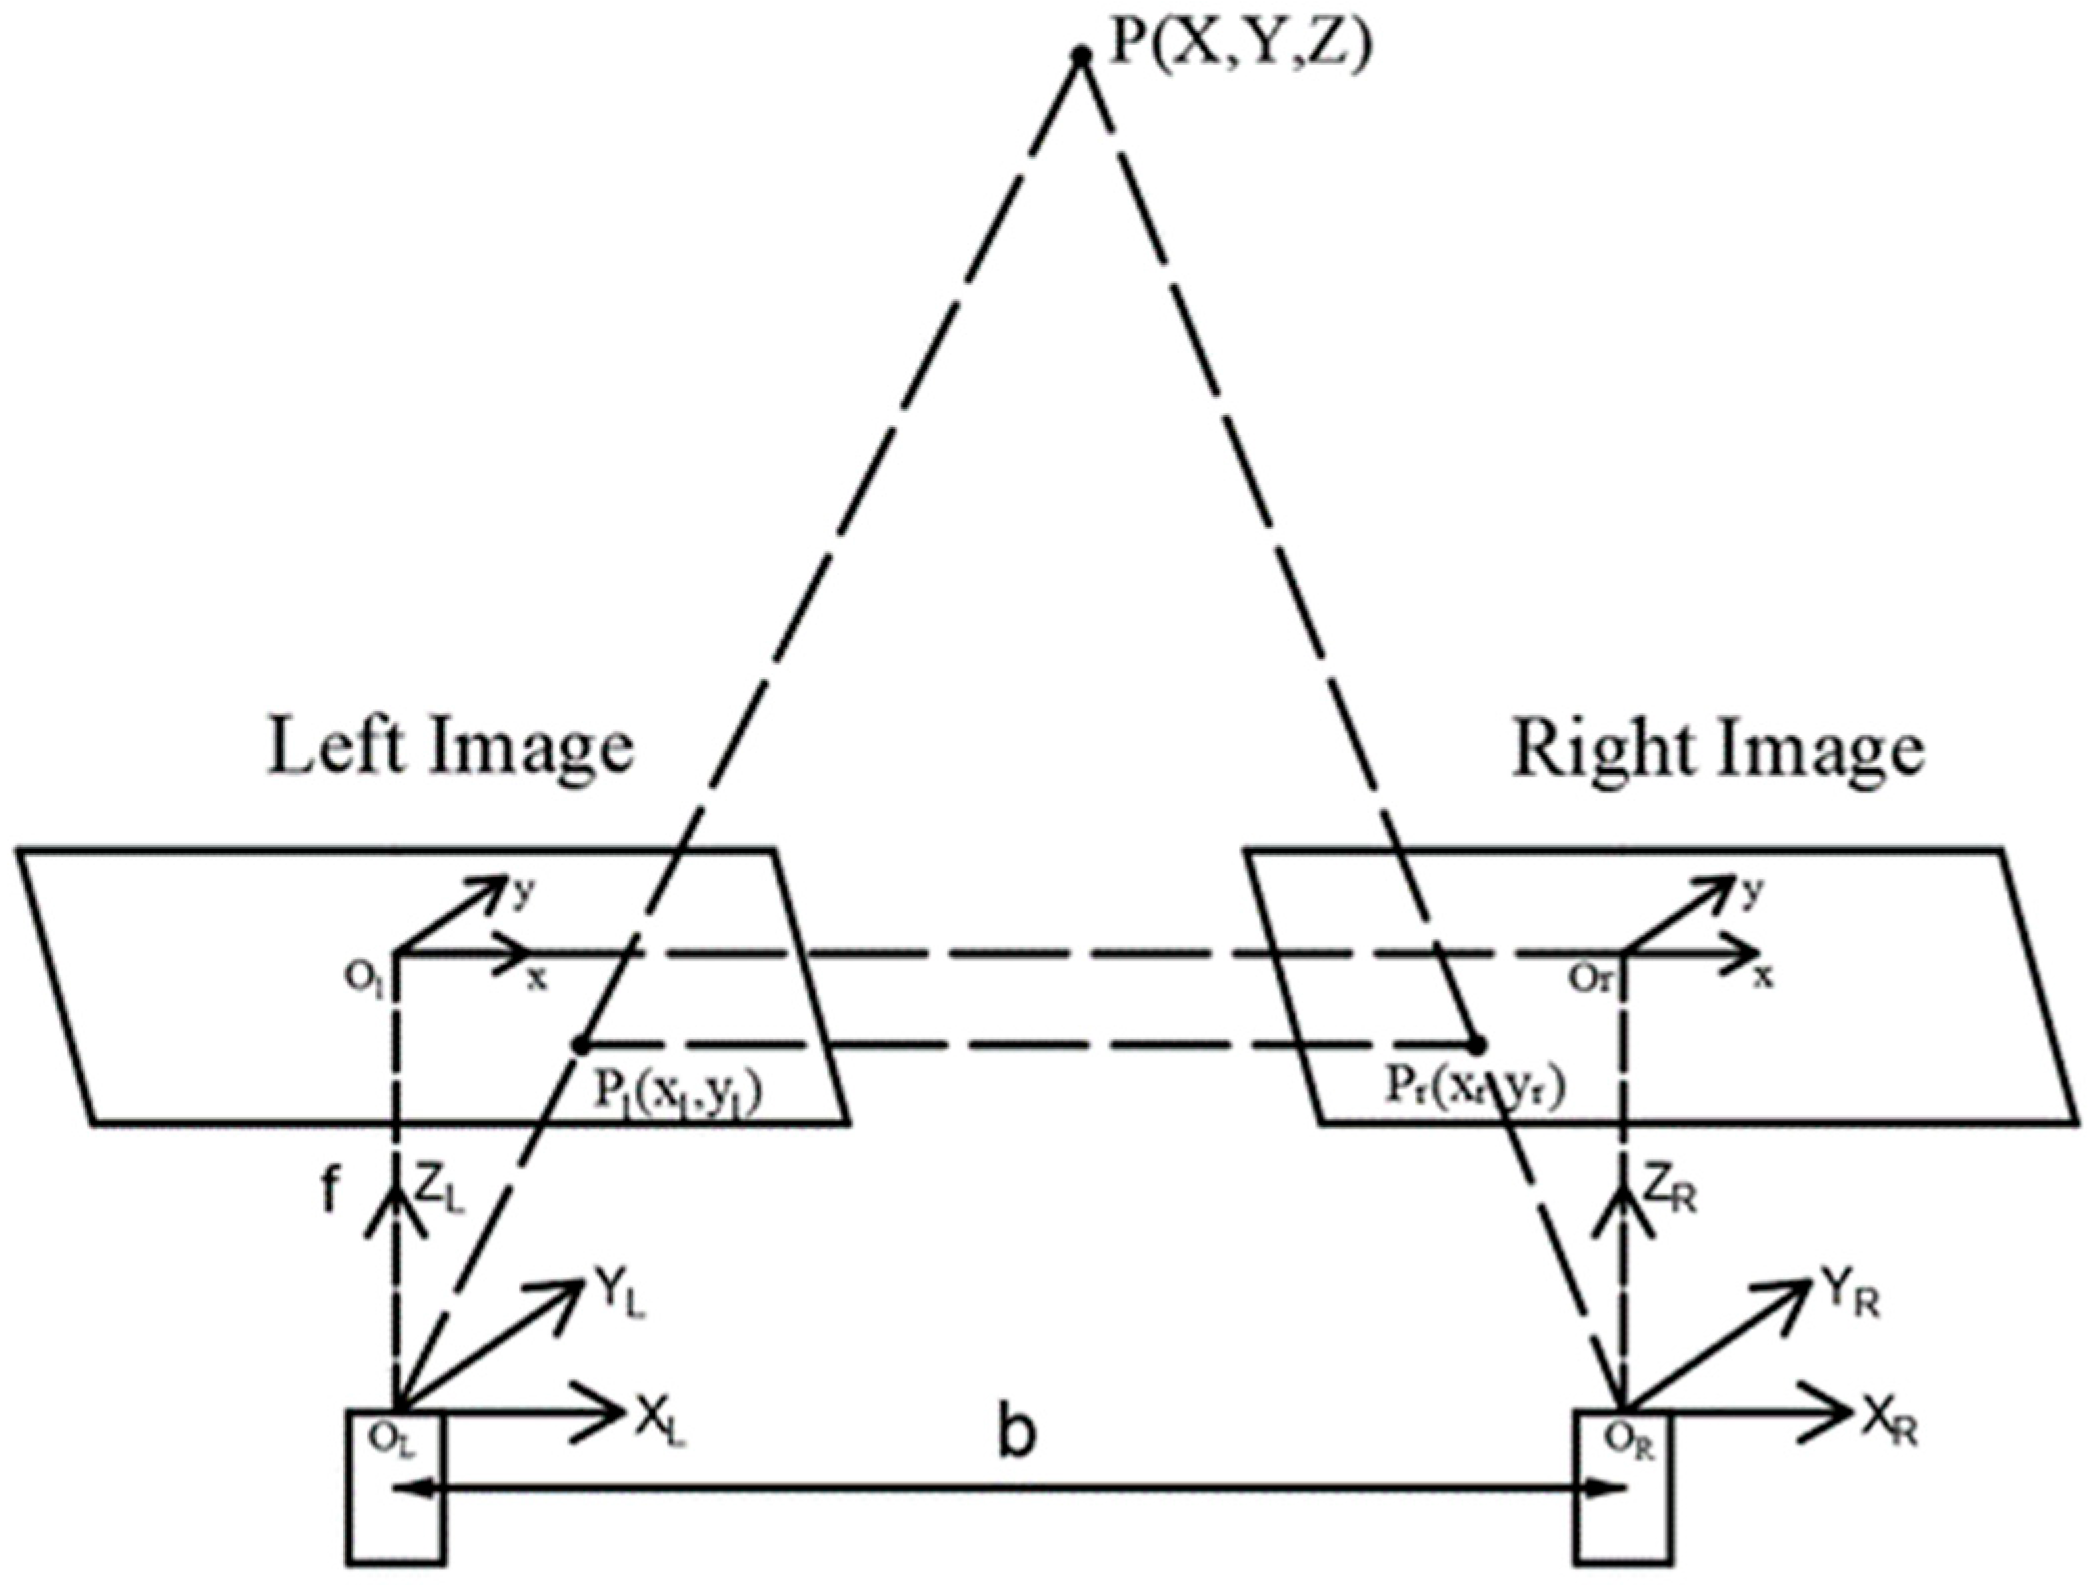
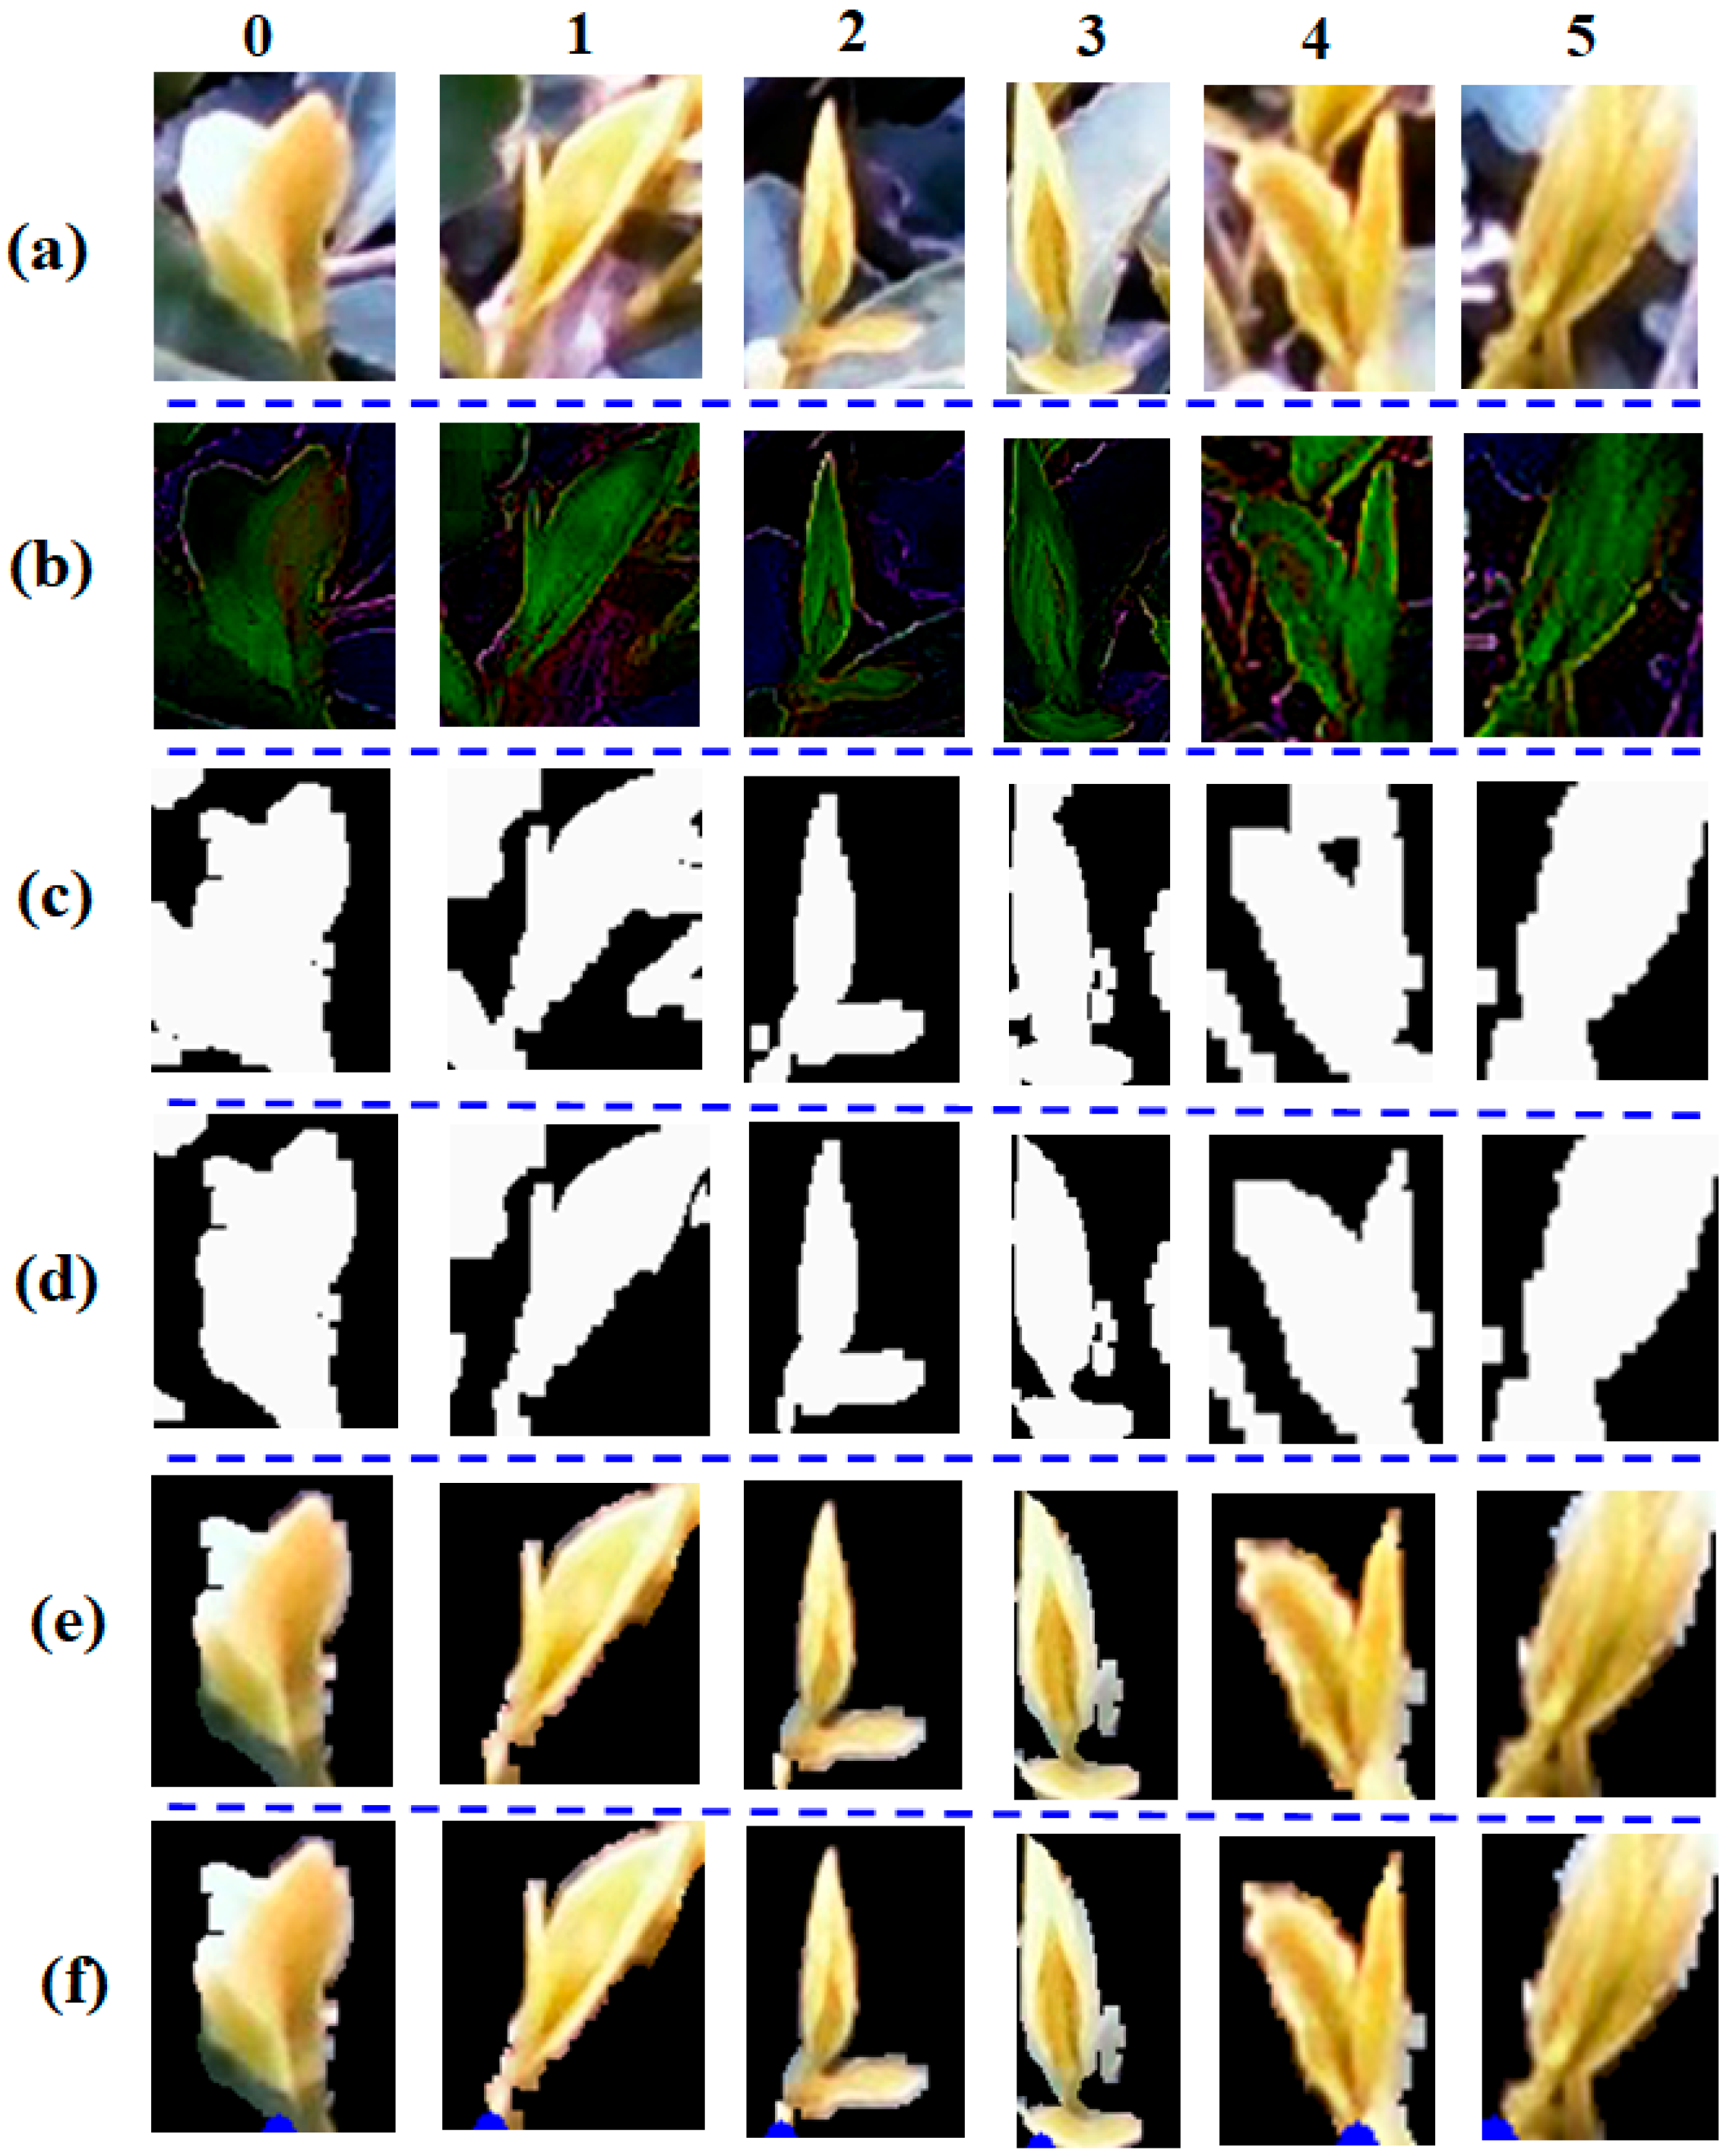
2.3. Position of Picking Points

Tea buds and other tea leaves have irregular and non-uniform shapes and similar colors, while they are closely connected in location and sometimes occluding each other in 2D images. This occlusion condition makes it difficult to accurately detect the shapes of tea buds and their picking points from 2D images alone, even after the proposed object detection algorithm can accurately find the locations of tea buds in the form of bounding boxes. To solve this problem, this paper proposes using a depth filter in 3D space.
First, the bounding boxes of all detected tea buds were cropped into sub-images. Then, all cropped sub-images were processed for segmentation of tea buds with a series of image processing techniques, including (1) edge-preserving and noise-reducing smoothing with a bilateral filter; (2) edge detection with a Laplacian filter, for sharpening, enhancing, and highlighting the textures and edges of tea buds; (3) intensity thresholding for segmenting tea buds with the Otsu method, based on a green color channel; and (4) morphological eroding and dilating, for further removal of background clutter.
When the tea buds were occluded by other objects in 2D images, they were likely separated in 3D space. After the tea bud segmentation, the segmented tea buds were regarded as foreground, and the rest of the pixels were regarded as background. Because a stereo vision (RGB-D) camera was used, depth values were readily available for the pixels of the segmented image from the corresponding depth image.
According to the positioning principle of a binocular camera, the depth values of the pixel coordinates in the tea image are obtained as shown in Figure 4. In addition, the lightweight neural network stereo matching algorithm in the ZED-Mini binocular stereo camera SDK was used, to match the same features in the left and right eye fields of the binocular camera, calculate the parallax of pixel points, and obtain the depth images to visualize the parallax. To obtain clear and smooth dense depth images with edges and sharpness, the resolution, camera frame rate, depth mode (DEPTH_MODE) and sensing mode (SENSING_MODE) were adjusted to 1920 × 1080 pixels, 15FPS, ULTRA, and FILL, respectively.
Therefore, it is known that the points of P in the left and right images of the binocular camera are Pl (xl, yl) and Pr (xr, yr). The three-dimensional coordinates of P in the OL-XLYLZL coordinate system can be obtained as shown in Equation (1), where Z is the depth value of point P.
X = x l b x l x r Y = y l b x l x r Z = f b x l x r
The depth filter, defined in Equations (2) and (3), used the threshold depth value to remove the background pixels behind the tea buds in the depth map.
I gray x , y = I gray x , y , if     I D x , y < Threshold 0 ,     Otherwise
Threshold = M I N D + Leaf_Width
where I g r a y x , y is the gray value at x , y , I D x , y is the depth value at x , y , Threshold is the depth threshold, M I N D is the minimum depth value of all pixels in the image, and Leaf_Width is the width value of the tea leaves.
The gray-scale values of the corresponding pixel points according to the depth were adjusted. The original gray-scale values of the pixel points in the RGB image whose depth is in the range of foreground were retained, otherwise, the gray-scale values were adjusted to 0. The parts of tender leaves behind the identified tea buds were removed and it was ensured that the tea buds were completely extracted. The tender buds located at the back were then detected again in the next detection cycle, which did not cause missed detection.
The widths of 150 tea buds were measured manually to determine Leaf_Width . The measurements included different forms such as unseparated buds, stretched buds, separated buds, and completely stretched buds. Some of the measurements are shown in Figure 5. The maximum value of the measured width (19.34 mm) was taken as the width of tea buds, to protect the integrity of recognized tea buds.
After being segmented by the depth filter, in the same depth plane, there may also be some small parts of other tea buds in the image. Based on the idea of identification focus, only the identified tea buds have the largest contours in the image. Therefore, traversing and calculating the area of all contours in the segmented image, only contours that had the largest area were extracted. The original image was masked to obtain an image with only tea buds identified by the extracted contours. The lowest pixel point of the tea bud’s contour was located, and the coordinates of this point ( x i , y i ) extracted as the picking point. The coordinates of the identification frame were combined to convert the coordinates in the RGB image, according to Equation (4):
x j = left i + x i y j = top i + y i
where x i   ,   y i are the coordinates of the picking point in the single extraction image of the i-th tea leaves, left i   ,   top i are the coordinates of the upper left corner of the identification frame of the i-th tea leaves, x j ,   y j are the coordinates of the picking point of the identified i-th tea leaves in the original field of view of the camera.
The method flow chart of the recognition and positioning of fresh tea buds is shown in Figure 6.

3. Results

3.1. Detection of Tea Buds

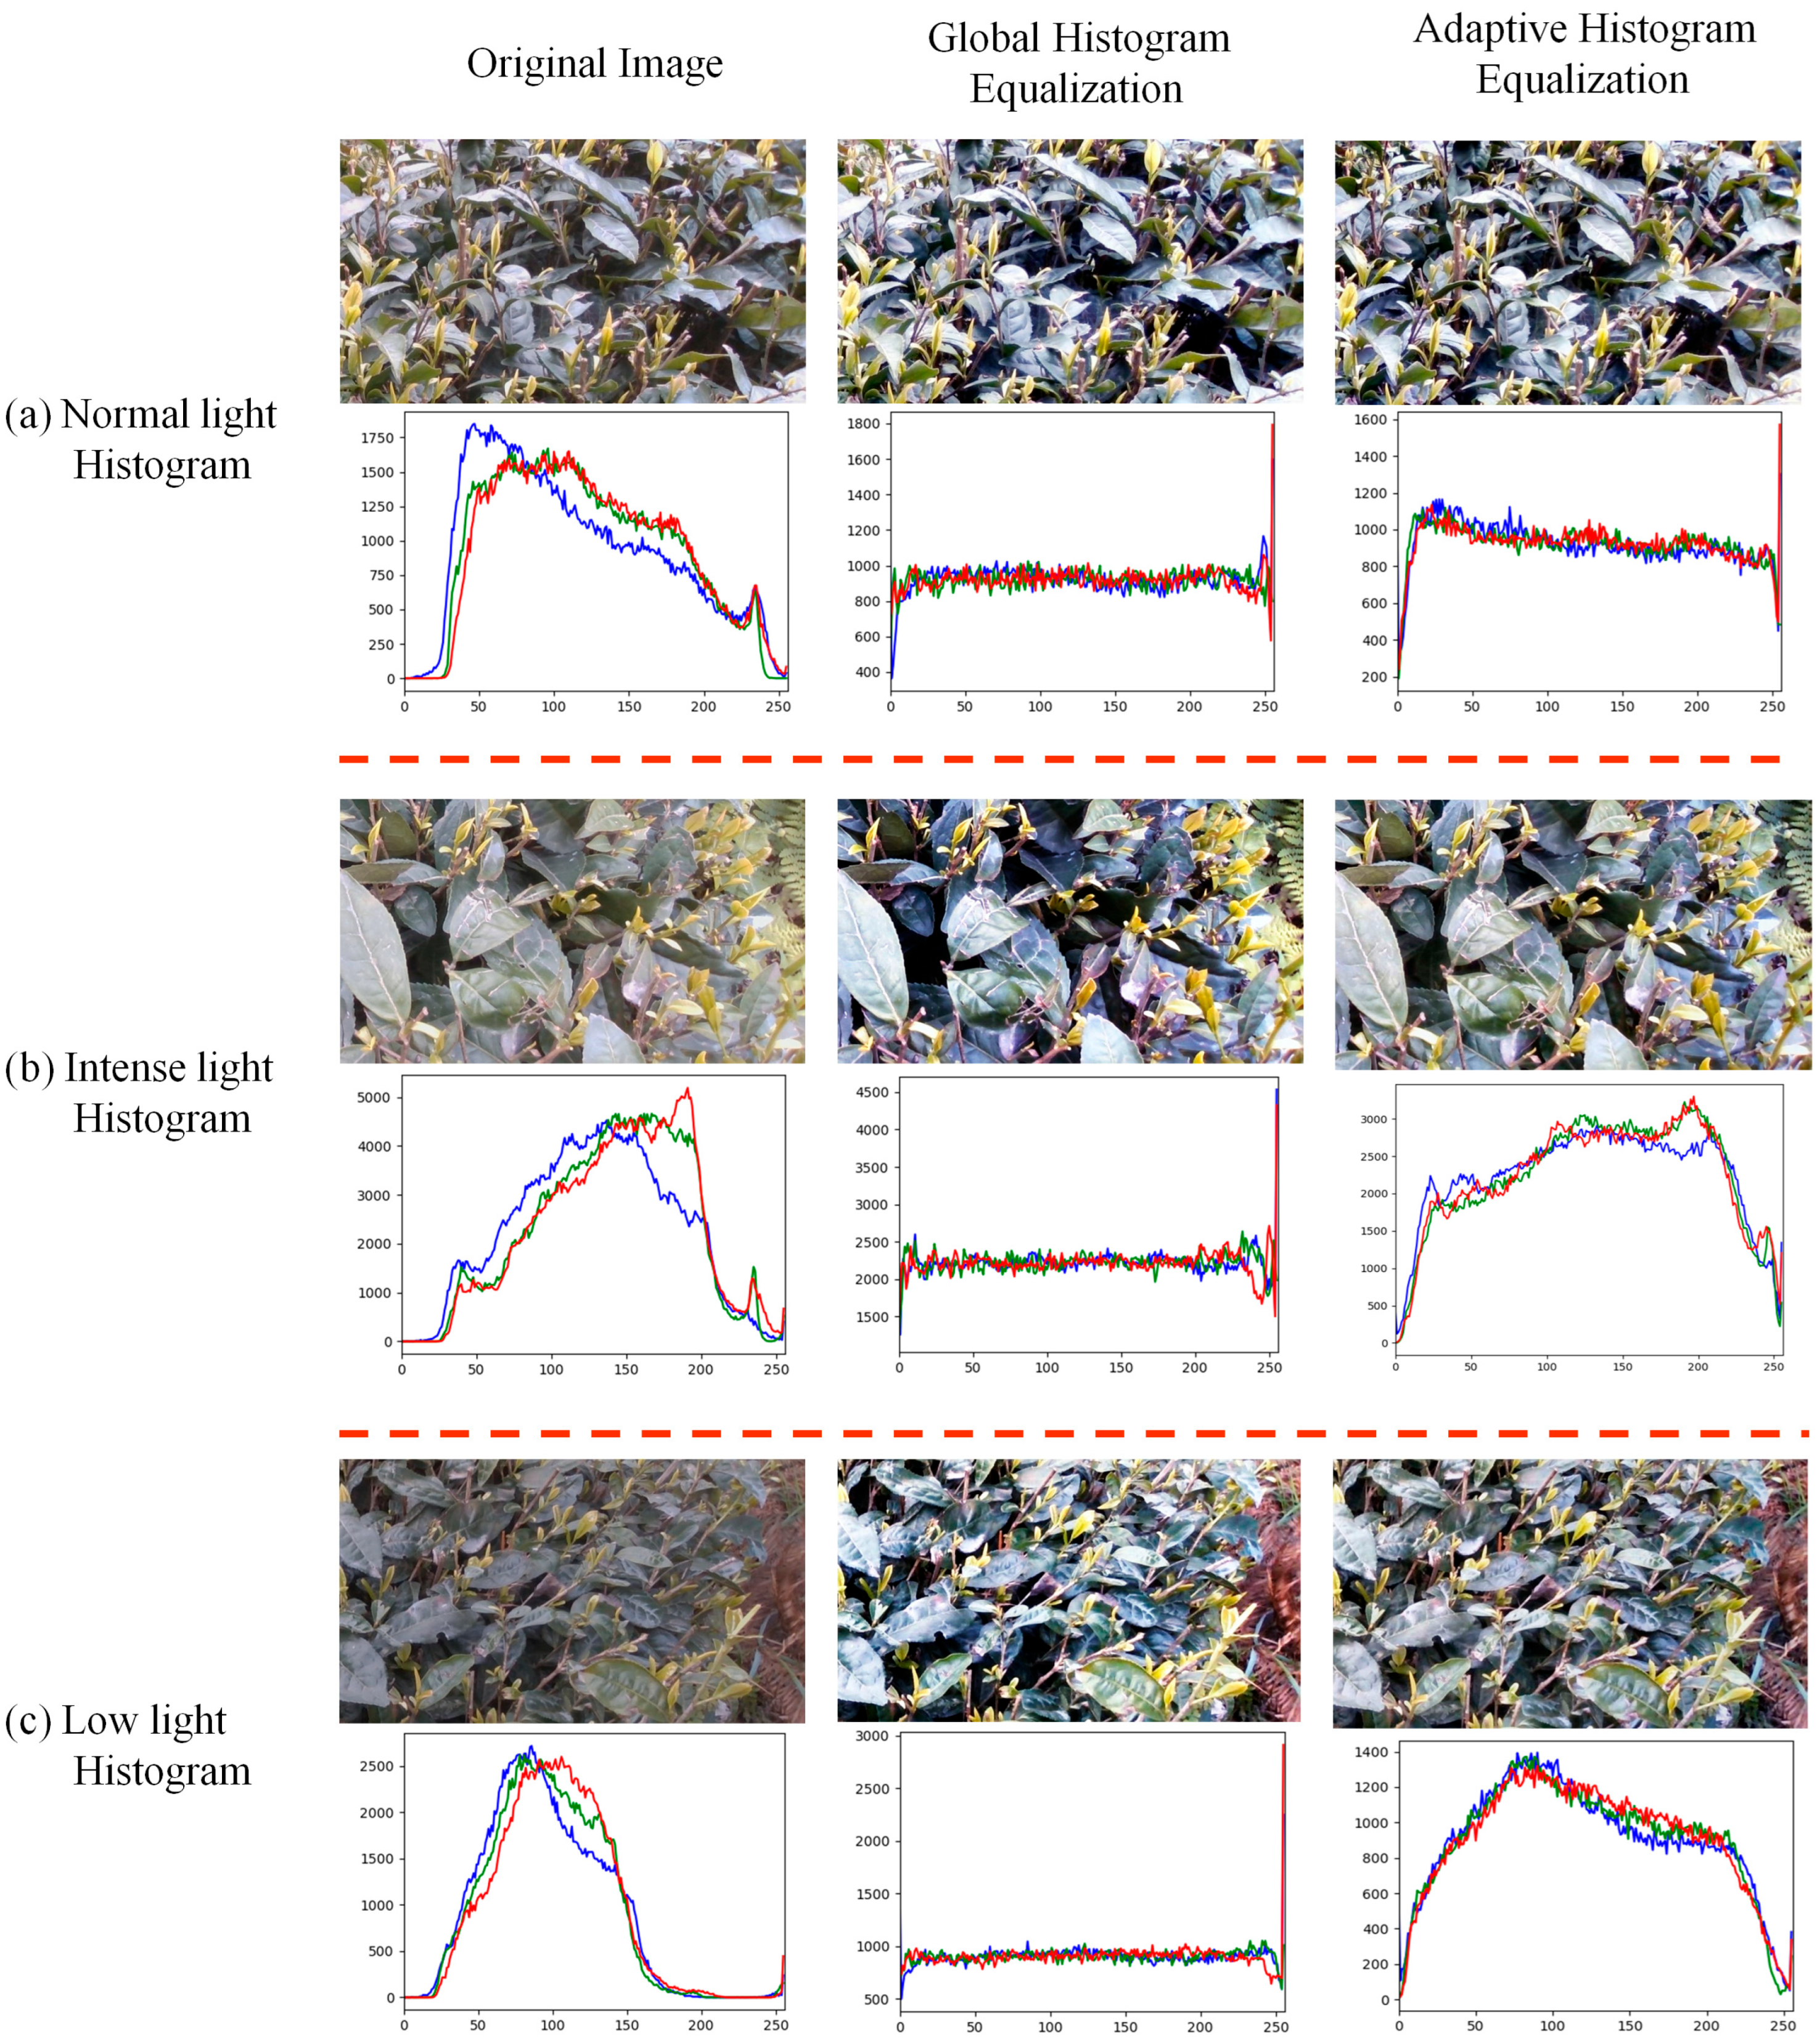
3.1.1. Preprocessing

The RGB color images acquired under the different light conditions (normal: 9–10 a.m., strong: 12–1 p.m., low: 5–6 p.m.) showed different contrast and histograms before and after equalizing the histograms via global and locally adaptive methods, as shown in Figure 7. The images under the normal lighting condition, taken between 9 and 10 a.m., showed overexposure in the bright leaf areas after histogram equalization. Thus, the normal lighting images were assigned to the dataset without changing the intensities through any histogram equalization. The intensity histogram of images taken under the intense light condition, between 12 and 1 p.m., showed overexposure in the highlighted areas, as expected. Adaptive histogram equalization (AHE) performed better in revealing the lost detail in the highlighted areas, compared with global histogram equalization (GHE). Hence, the images taken under the intense light condition were preprocessed with AHE. On the other hand, because the images taken under the low light condition suffered from a loss of detail in the shadowed (or dark) areas, contrast enhancement help to reveal the lost detail. Similar to the intense light condition case, the AHE performed better than GHE in enhancing the contrast, while minimizing the loss of detail in all intensities. Thus, the low-light images were preprocessed with AHE. All image data, corrected for the light effect, were further augmented by unsharp masking for image sharpening, median filtering for removal of salt and pepper noise, and rotation. These preprocessed images were used for training the tea bud detection models.

3.1.2. Model Training

The experiments for model development were performed using Python programs based on Keras for TensorFlow and PyCharm for Python 3.8, on a Windows-10 PC, with an NVIDIA GPU card (GeForce GTX 1650). The hardware and software configurations for model development are summarized in Table 3.
The six object detection models shown in Table 2 were trained with the labeled data in a supervised way. The 15,600 images were divided into training, validation, and testing sets, with a ratio of 8:1:1, and the input image size was adjusted to 416 × 416 (pixels). The training process included two training stages: freezing and thawing. For the freezing stage, the number of layers was 100; the batch size was 4; the initial learning rate was 0.001; and the training epochs were 200. For the thawing stage, the batch size was 1; the initial learning rate was 0.0001; the training epochs were 300; and the confidence score threshold was set to 0.5. During the training process, the Mosaic data augmentation that was first introduced in YOLOv4 was used to increase the generalization power of the models. The non-maximum suppression (NMS) has been a standard in many object detection algorithms producing bounding boxes as output, and was also used in this study to select the best bounding box among many possible candidate boxes. The cosine annealing learning rate scheduler was used to improve the accuracy of the models. The six tea bud detection algorithms (YOLOV4, YOLOV4-light, YOLOV4-light + SENet, YOLOV4-light + ECA, YOLOV4-light + CBAM, and YOLOV4-light + ICBAM) were trained for 3319 min, 2886 min, 3124 min, 2947 min, 3185 min and 3016 min, respectively.

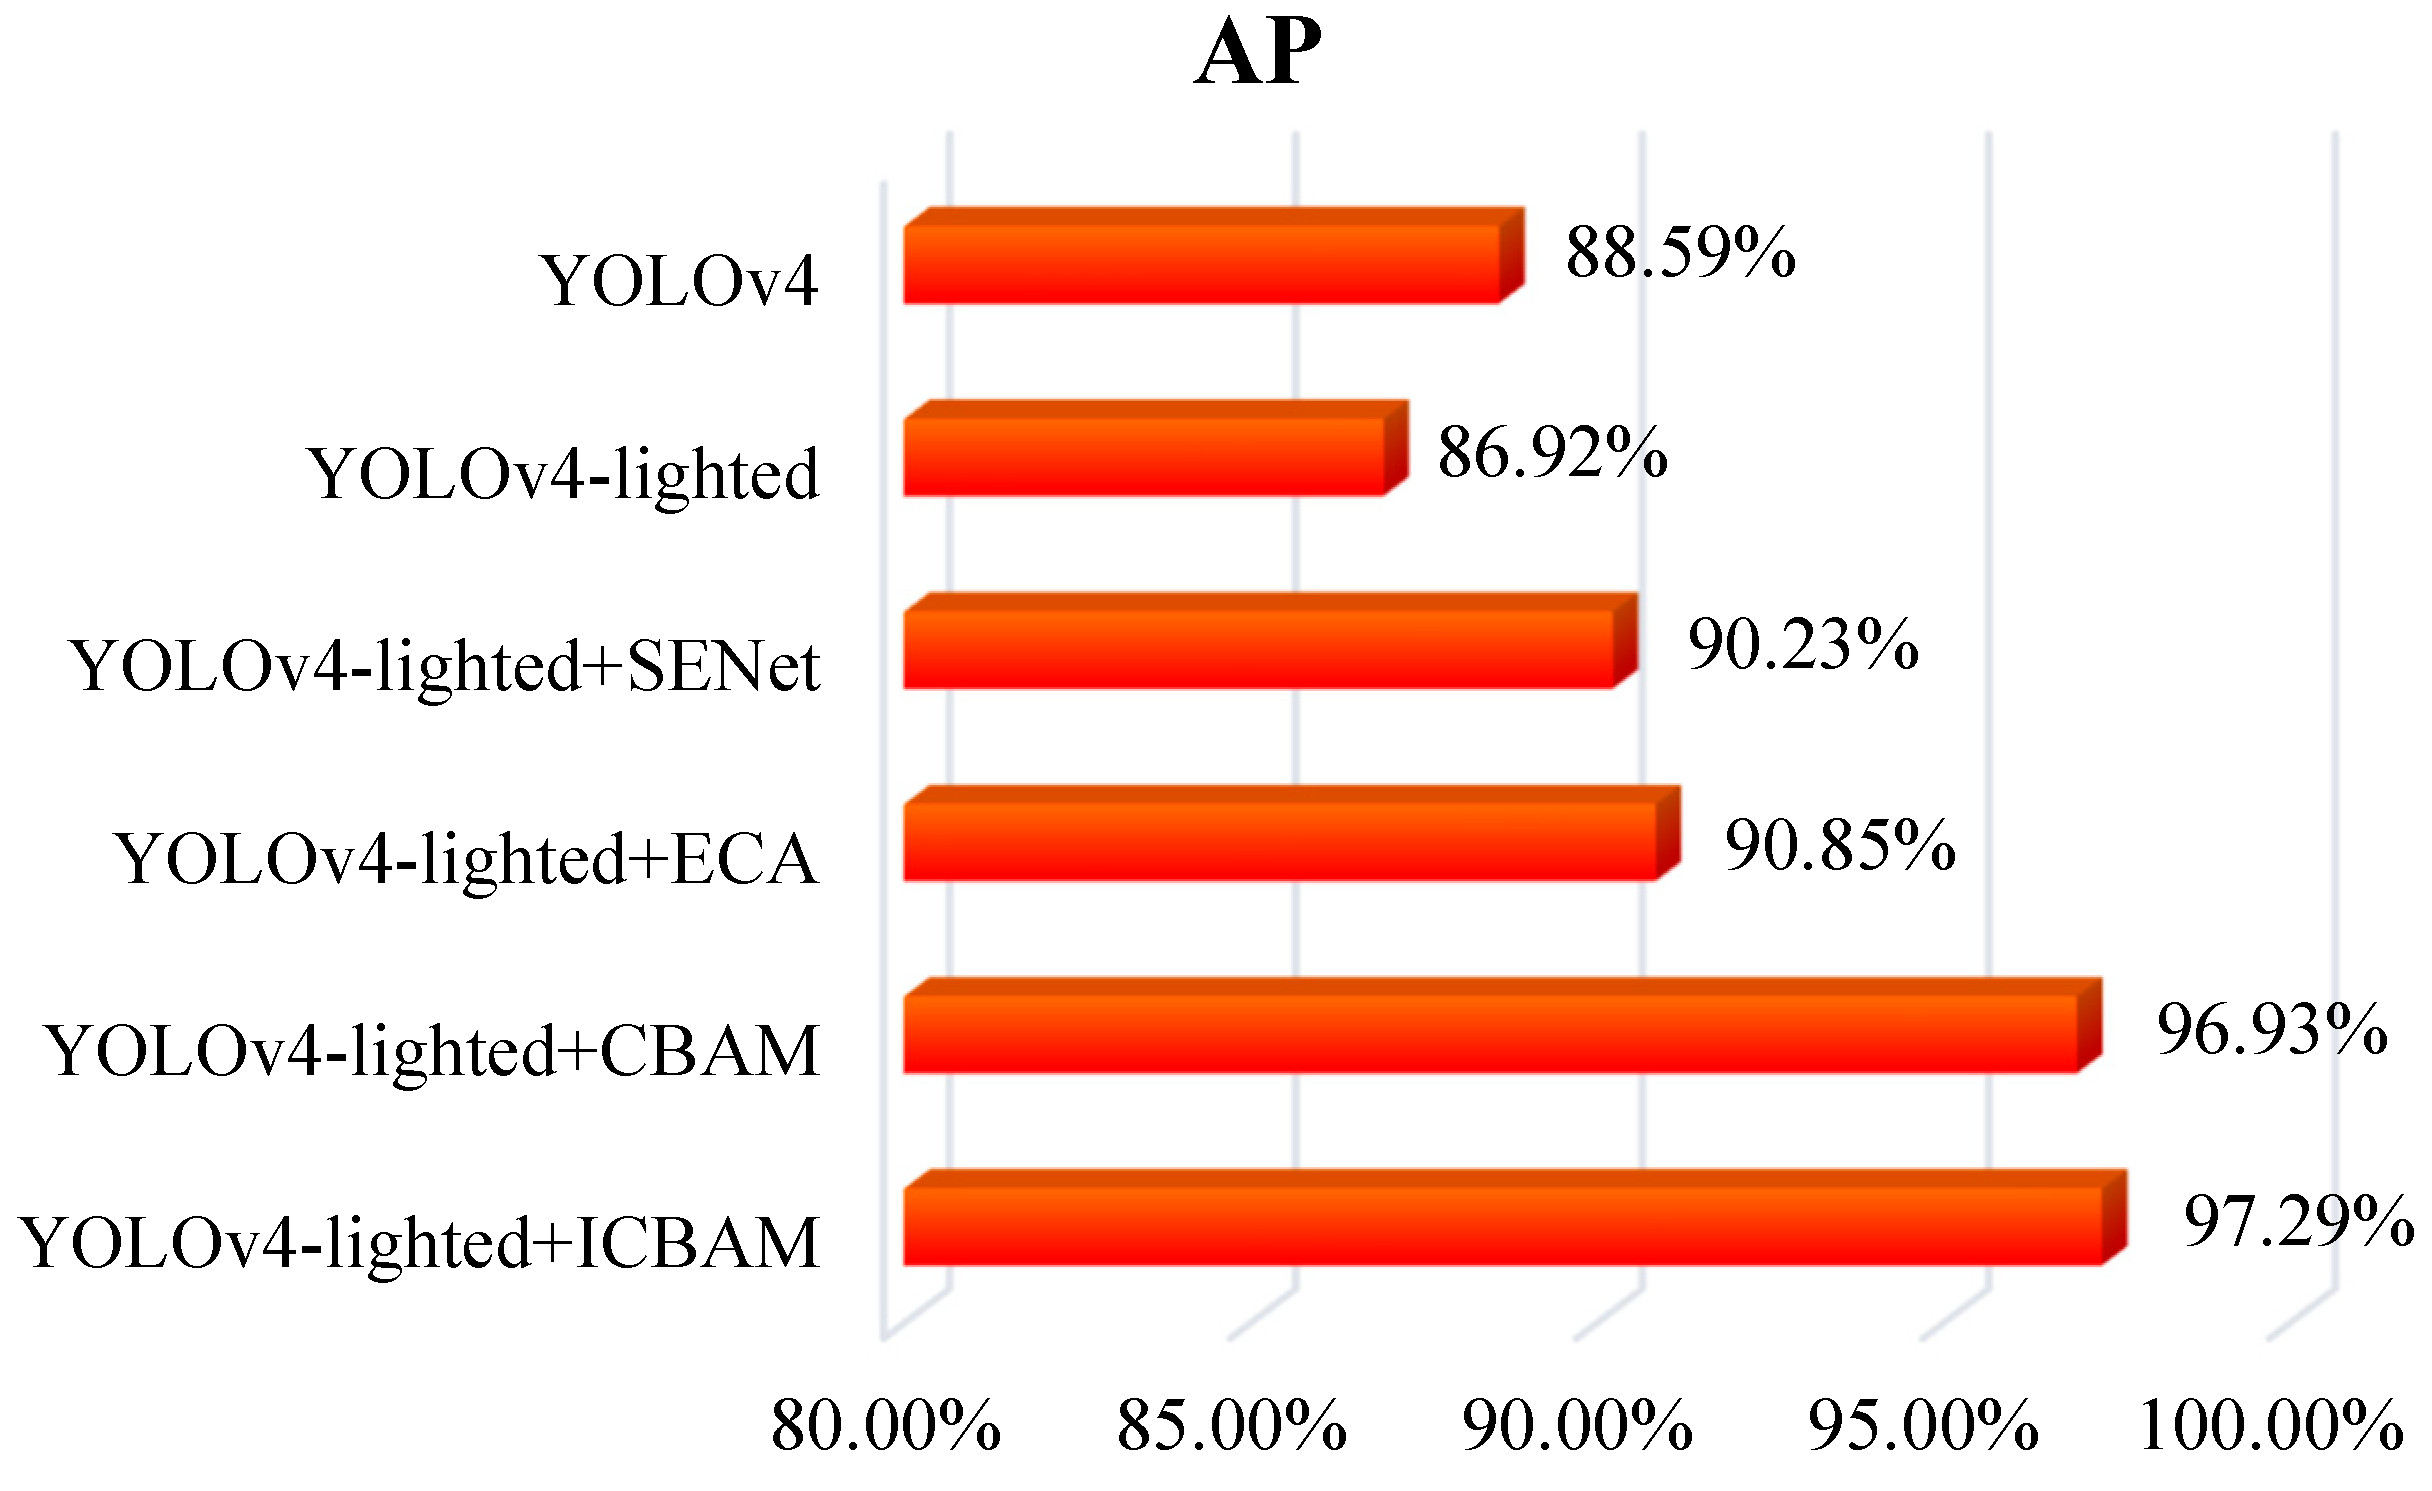
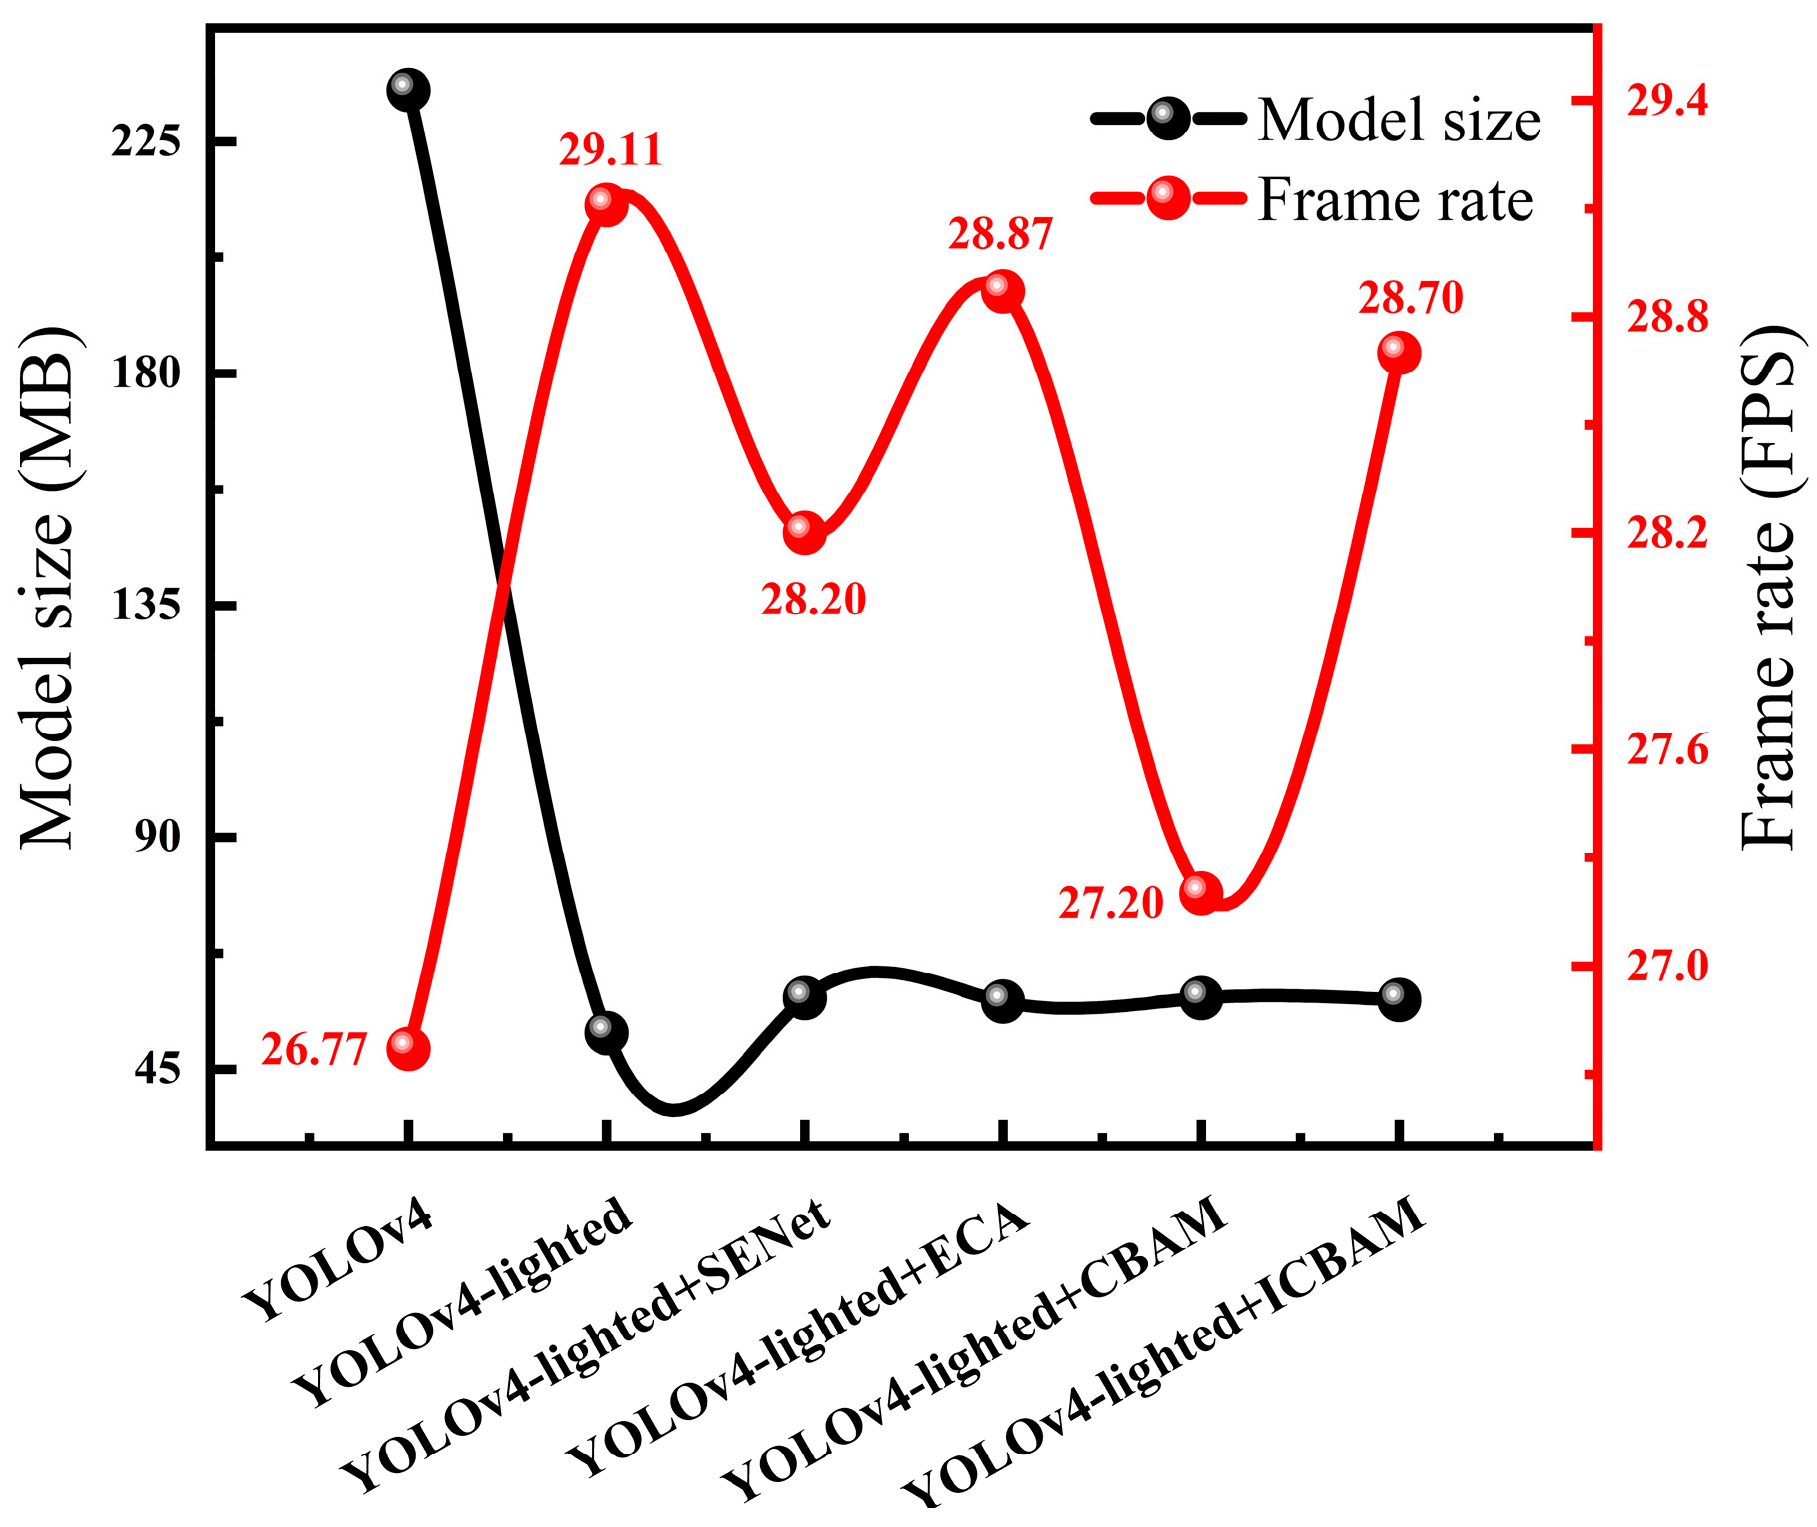
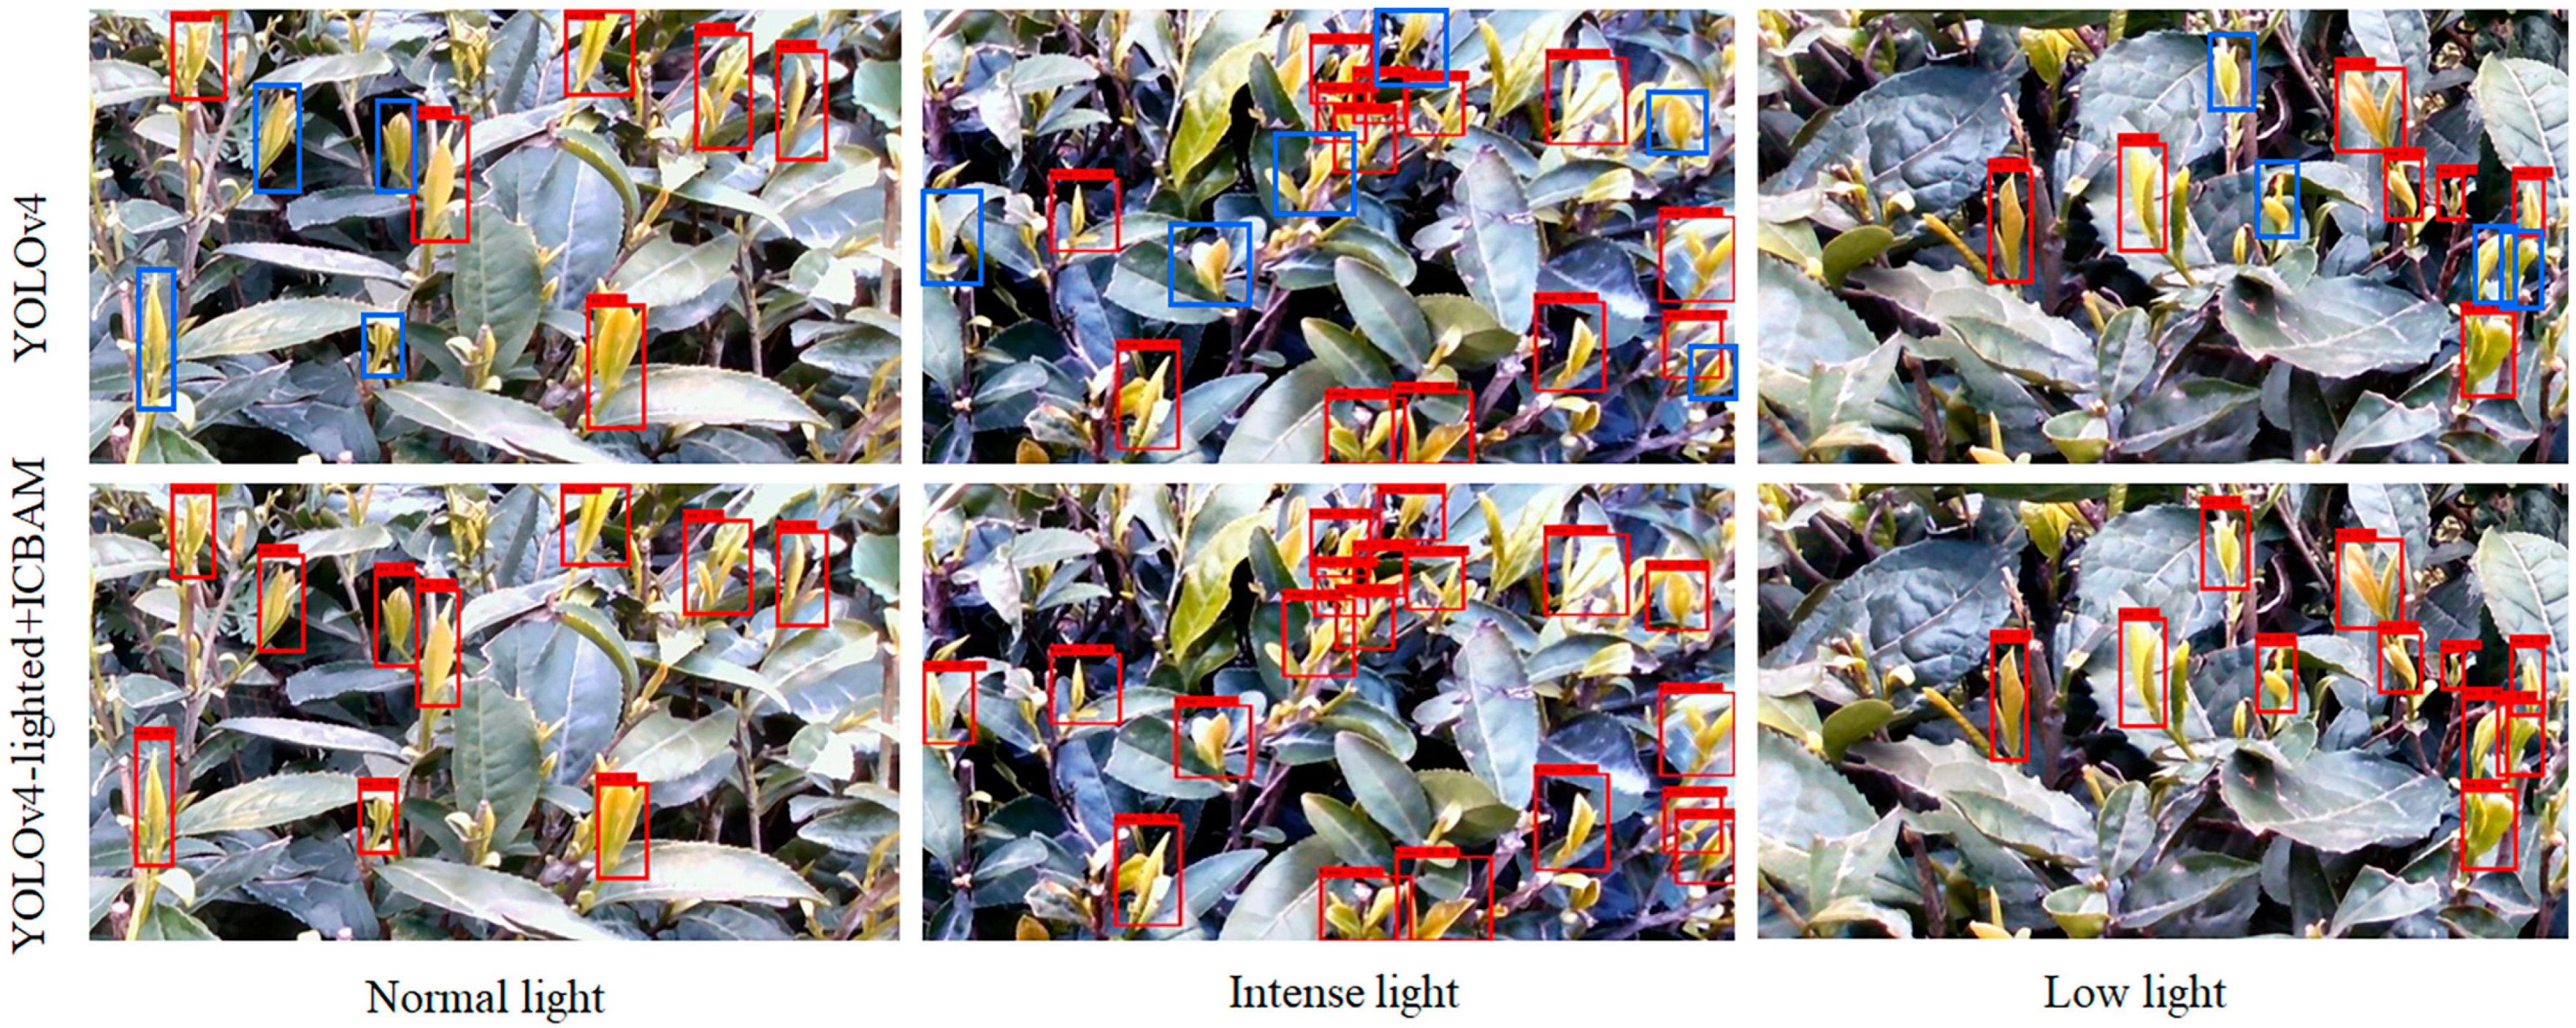
3.1.3. Performance Comparison of Six Tea Bud Detection Models

The performances of the six trained detection models were compared using 1560 RGB images in the test set, and are summarized in Table 4, with accuracy, recall, and F1 score. The confidence score threshold and IoU threshold for the object detection models were 0.5 and 0.3, respectively. Using YOLOv4 as a baseline model, the performance gain of the YOLOv4-lighted and YOLOv4-lighted + SENet models over the baseline model was marginal in precision and F1 score, at the expense of decreased recall, while the performance gain of the YOLOv4-lighted + ECA, YOLOv4-lighted + CBAM, and YOLOv4-lighted + ICBAM models was noticeable. The precision, recall, and F1 score of the YOLOv4-lighted + CBAM and YOLOv4-lighted + ICBAM models increased by over 8%, 7%, and 10% with respect to the baseline model, respectively.
When AP was compared among the six tea bud detection models, as shown in Figure 8, the performance of YOLOv4-lighted + CBAM (97%) and YOLOv4-lighted + ICBAM (97%) was much better than the YOLOv4 (89%), YOLOv4-lighted (87%), YOLOv4-lighted + SENet (90%), and YOLOv4-lighted + ECA (91%) models. The YOLOv4-lighted + ICBAM model was slightly better than the YOLOv4-lighted + CBAM in the AP comparison, by about 0.4%.
In comparing model parameter sizes, the sizes of the five YOLOv4-lighted-based models were reduced to about 23% (ranging from 22.99% to 23.28%) of the size of the baseline YOLOv4 model (see Table 3 and Figure 7). The reduced model size could mean smaller memory usage during inferences. The processing time of each model was also compared in terms of frame rate (frames per second, FPS), to ensure that the reduced model size also resulted in a shorter inference time on the test set (see the red curve in Figure 9). Overall, the FPS of the five YOLOv4-lighted-based models was higher by 1.66 FPS on average than the 26.77 FPS of the baseline YOLOv4. Although the YOLOv4-lighted model showed the fastest inference, with 29.11 FPS, our focus was to determine which one, between YOLOv4-lighted + CBAM and YOLOv4-lighted + ICBAM, was faster, because these two models were the best candidate models from the accuracy evaluation. Note that YOLOv4-lighted + CBAM was slightly better than YOLOv4-lighted + ICBAM in the detection accuracy test measured by precision, recall, and F1 score, whereas YOLOv4-lighted + ICBAM was better than YOLOv4-lighted + CBAM in the AP test. Considering the smaller model size and shorter inference time, the YOLOv4-lighted + ICBAM model was selected as the best tea bud detection model in this paper.
Figure 10a shows weighted heat map images extracted from three feature layers of the YOLOv4-lighted + ICBAM, where detected targets were hotter (red color) than less important pixels (cool blue color). As shown in Figure 10a, the feature layer of 104 × 104 × 128 pixels mainly detected small-sized objects, the second feature layer of 52 × 52 × 256 pixels mainly detected medium-sized targets, and the final feature layer of 26 × 26 × 512 pixels mainly detected large-sized targets. So, the feature layer with smaller data dimensions was more sensitive to larger-sized objects. The feature layer and the confidence score layer were combined, to provide visualized images about how the confidence score and feature layers interacted, before determining the best locations of the bounding boxes for the targets.
Figure 11 shows the target detection results of the YOLOv4-lighted + ICBAM (best) and the YOLOv4 (baseline) models on the test dataset, where the blue boxes are the missed tea buds. Qualitatively, the detection performance of the YOLOv4-lighted + ICBAM model was better than that of YOLOv4, that missed small-sized tea buds or ones in densely populated areas. The attention mechanism used in the improved network models resulted in better sensitivity for the detection of tea buds in areas of densely populated tea leaves, and the use of multiscale feature layers enabled the detection of small tea buds. In addition, the adaptive histogram equalization made the target detection relatively robust to the effect of different lighting conditions.

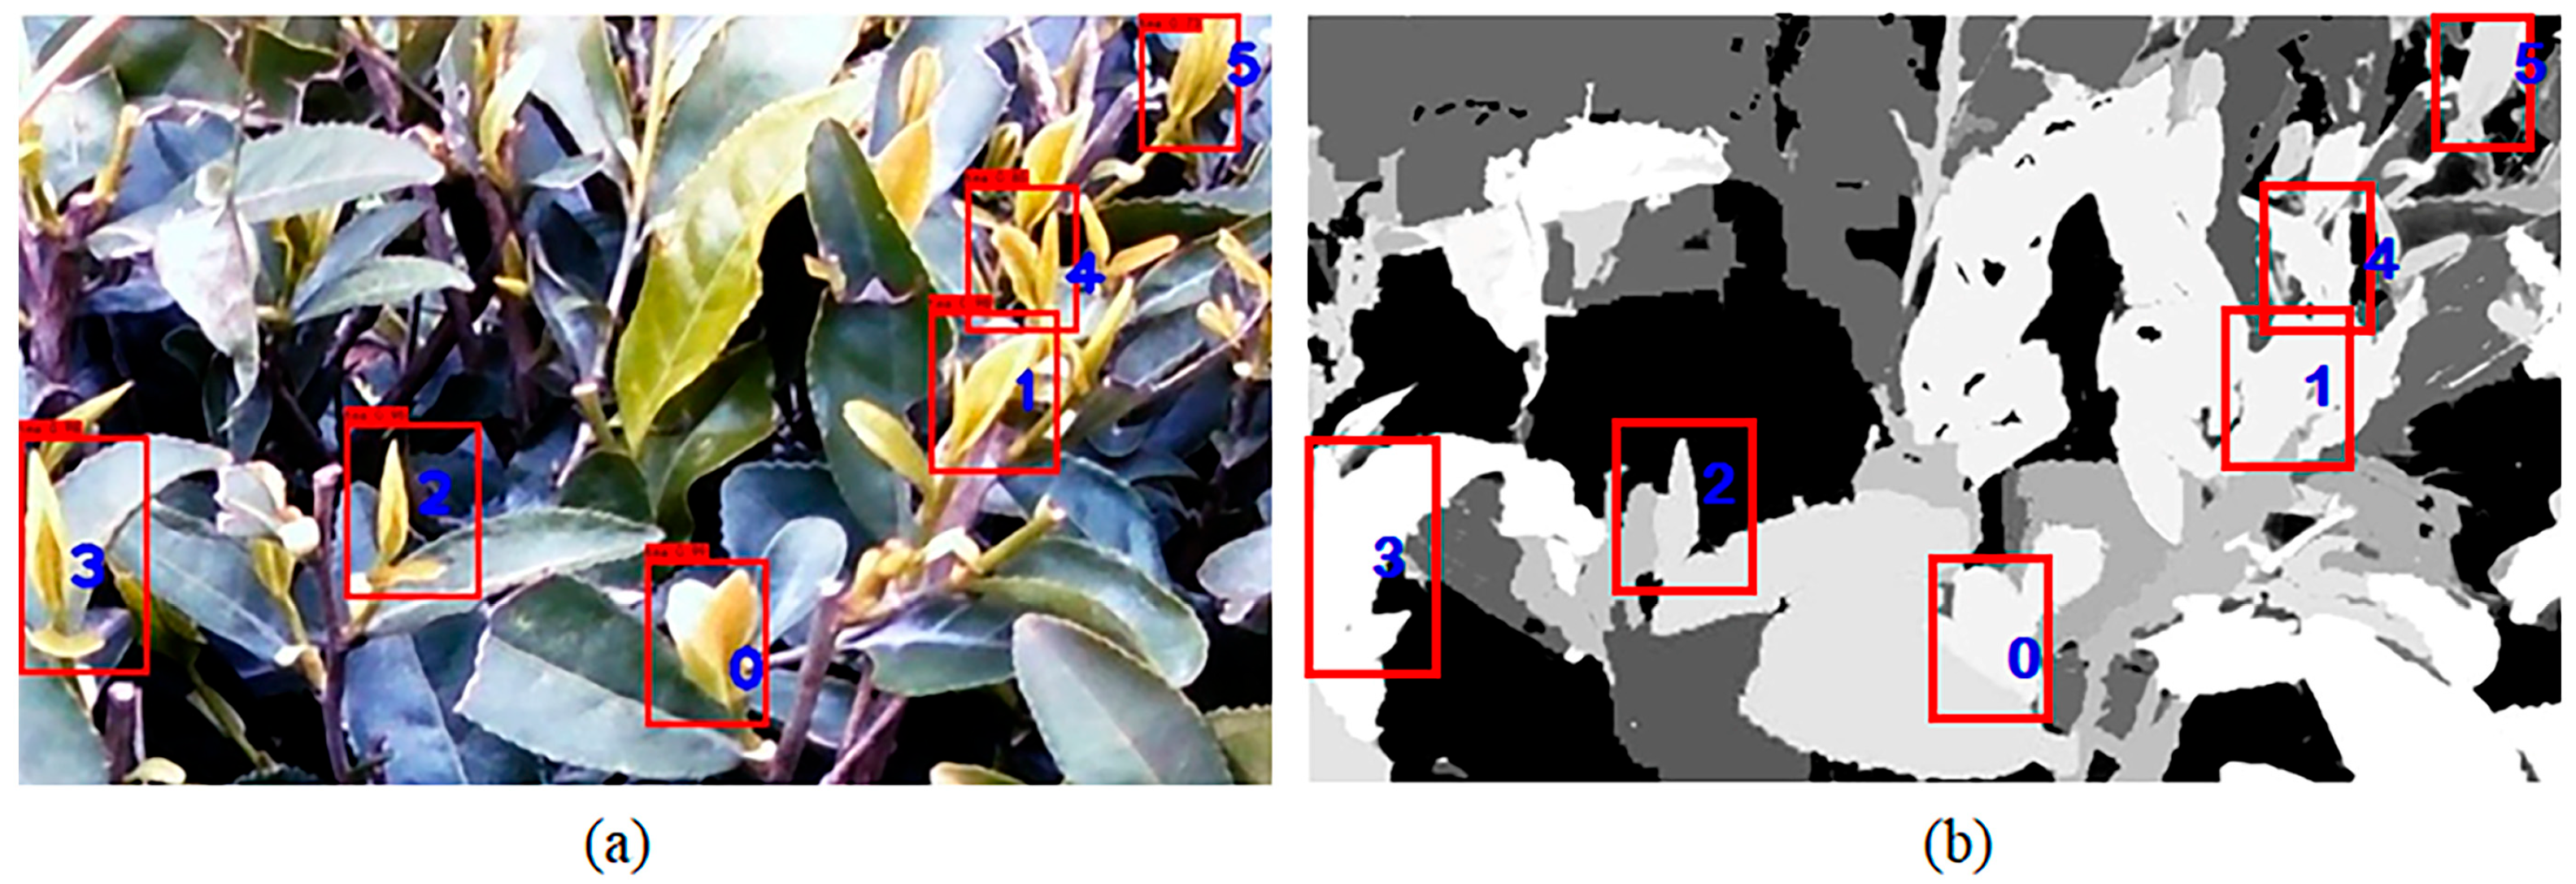
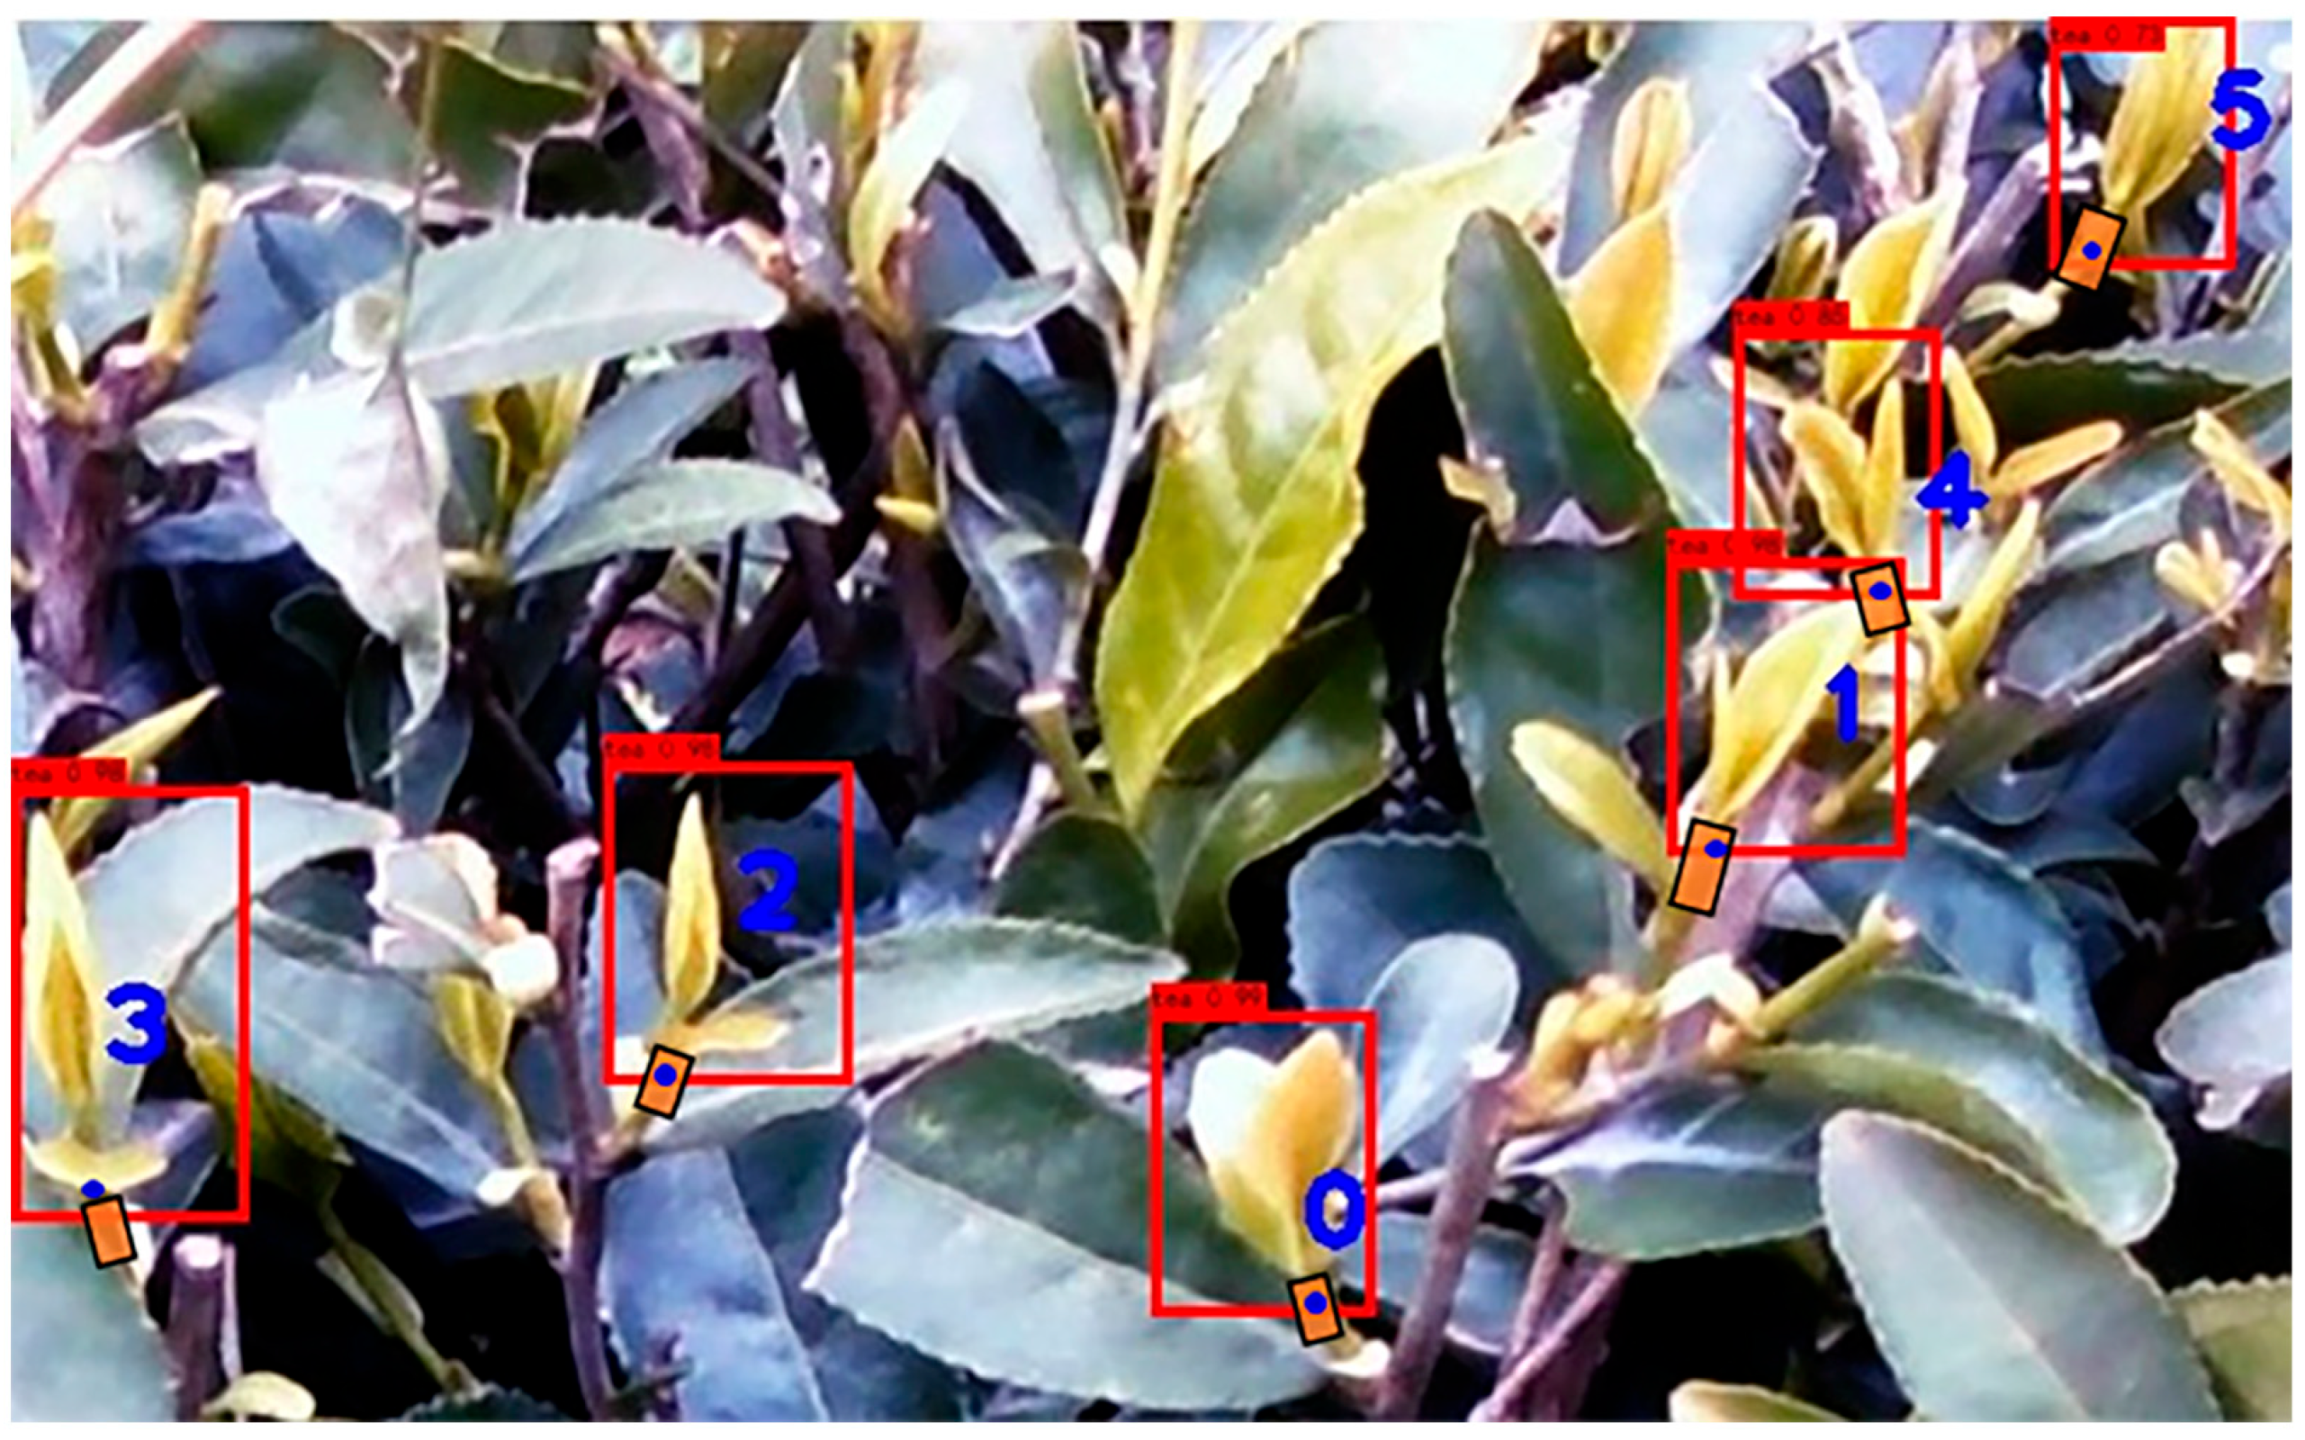
3.2. Position of Picking Points

Note that an RGB color image, and its corresponding depth image, were obtained with a stereo vision camera, such that both images were matched spatially in pixel coordinates. The detection process of picking points started with the RGB images, where tea buds were detected and localized by bounding boxes with the YOLOv4-lighted + ICBAM model, as shown in Figure 12a. Because the color image and its corresponding depth image were spatially registered, the same bounding boxes found over the color image could be applied to the depth image without modification, as in Figure 12b.
Then, the boundary coordinates of each bounding box were used to crop out a sub-image, showing only one single tea bud in each sub-image while still showing other background and/or foreground clutter, as in Figure 13a. Each cropped sub-image was preprocessed by filtering for the increased contrast and sharpness, as in Figure 13b, to make the tea buds’ color greener and the contrast between tea buds and the background greater. Then the greener tea bud images were preprocessed by thresholding for the segmentation, to remove the background clutter, as in Figure 13c. The segmented sub-images still suffered from inaccurate results, because other leaves with a similar color to the color of tea buds appeared in the 2D sub-image. This problem happened due to the depth ambiguity in the 2D image, which was solved by applying a depth threshold filter to the depth sub-image, assuming that the tea buds were standalone and not being touched by other leaves in the 3D space. The images numbered 0, 1, 2, 3, and 4 in Figure 13d show that the incorrect segments of tender leaves behind the identified tea buds, were removed with a depth filter. The last processing step was to remove the scattered small segments and detect the remaining largest segment, whose inside holes were filled in. Figure 13e shows the color images, masked with the final segmentation masks, showing tea buds only. Finally, the major axes of the segmented object in Figure 13f were found and the lowest point along the major axes was marked (with a blue dot) as the picking point.
It was trivial to locate the coordinates of the detected picking points in the original RGB image (Figure 14) because the coordinates of the sub-images originated from the original image. The accuracy of the detected points’ coordinates for picking tea buds was evaluated with the ground truth picking areas (not single points), that were manually determined in each RGB image by a human expert. Figure 14 shows the optimal picking areas denoted as orange rectangular boxes. The evaluation metric was as follows: (1) If a detected picking point fell in its optimal picking area, the positioning was successful, with a score of 1; (2) otherwise, it was a failed positioning, with a score of 0. Table 5 shows the results of the picking point positioning test. The positioning success rate was the proportion of the number of correctly positioned picking points within the targeted picking areas among the correctly identified tea bud objects. The average success rate, and time for picking point positioning, were 87.10% and 0.12 s, respectively. The results showed that the tea bud detection method proposed in this paper, and the localization of the picking points, would be feasible in practice, when the output would be combined with a picking machine. When a tea bud was obstructed by objects in the foreground, it could not be identified and the depth filter was used. If the foreground obstruction was other tea buds, the obstructed tea buds would be detected in the next detection, when the tea buds in the front had been picked.

4. Discussion

In this paper, an improved YOLOv4 object detection model was proposed, to accurately and quickly detect small targets (tea buds) in tea plant images, with the complex background of other tea leaves, and predict their picking points. The improved hybrid attention mechanism was introduced to make the tea bud detection model better adapt to the feature information of tea buds, and the low-dimensional feature layer was introduced to make the model more suitable for detecting tea buds, that were typically smaller than other leaves. The accuracy, recall, and AP values of the proposed model were 93.77%, 93.87%, and 97.95%, respectively. Compared with the original YOLOv4 network, the size of the proposed model was reduced by 75.18%, and the frame rate was increased by 7.21%. At the same time, this paper proposed an improved tea bud detection method, based on the idea of a depth filter. The average localization success rate and the average localization time of each image using this method are 87.10% and 0.12 s, respectively. The methods proposed in this paper can meet the needs of real-time operation.
The results of this study were compared with other studies, as summarized in Table 6. Yang et al. [49], Zhang et al. [20], and Wu et al. [21] used traditional machine learning to segment tea buds, which took a long time and thus was not suitable for recognition in real-time. Xu et al. [24] and Chen et al. [50] proposed deep learning to detect tea buds only, without detecting picking points. Yang et al. [28] proposed a method of extracting picking points by a thinning algorithm on a white background, which was not suitable for the outdoor environment of tea plantations. Wang et al. [29] and Chen et al. [31] used instance segmentation and two-stage target detection algorithms to extract tea buds and picking points, but their identification results were not better than the method proposed in this paper. Overall, our method showed the highest detection accuracy and the shortest processing time, with over 86% accuracy in the positioning of picking points.

5. Conclusions

We proposed an innovative deep-learning technique to detect and recognize Biluochun tea buds, using 15,600 images obtained from videos taken in different light conditions. Image preprocessing was applied to the images, to minimize the different light effects, with adaptive histogram equalization, before applying the input images to the deep learning models. The YOLOv4-lighted + ICBAM model was determined as the best deep learning neural network for the detection of tea buds, compared with YOLOv4 and other YOLOv4-lighted models using SENet, ECA, or CBAM. The model used multiscale feature layers to increase the detectability of small tea buds. The depth ambiguity in 2D object detection was decreased by adopting the depth information obtained by a stereo vision camera, such that the accuracy of finding the tea bud picking points was increased. The test result suggested that the developed method would be suitable for finding the spatial locations of picking points in commercial tea plantations. In conclusion, the results obtained by the methods for tea bud detection and picking point localization suggested that the developed methods would meet the speed and accuracy requirements for commercial tea bud harvest machines and laid a technical foundation for the realization of an automated harvest machine. However, there are still research gaps for future work, in that an actual picking test was not conducted yet, and only one tea variety was used in this study. The general adaptability of the detection model to different types of tea needs to be established through further studies. The developed tea bud detection and recognition technique needs to be tested with a picking machine for the intelligent picking of tea buds.

Author Contributions

S.G., C.W., Y.L. (Yang Liu) and Y.L. (Yuwen Li) captured images and performed the experiment; L.L. provided tea data resources and picking standards. S.G. developed the method and finished writing the program; S.G. prepared for writing the original draft; W.W. and S.-C.Y. jointly designed and guided the experiment and comprehensively revised the manuscript. H.Z. help to review the paper. All authors have read and agreed to the published version of the manuscript.

Funding

This research was funded by the National Nature Science Foundation of China, grant number 32272410, and Jiangsu Province and Education Ministry Co-sponsored Synergistic Innovation Center of Modern Agricultural Equipment, grant number XTCX2016.

Institutional Review Board Statement

Not applicable.

Data Availability Statement

Not applicable.

Acknowledgments

The authors would like to thank ELITE ROBOTS Co., Ltd. (Suzhou, China) for their invaluable assistance with providing a technical platform of the research methods in this paper. We also would like to acknowledge the CEO Yunan Cao, CTO Ran Li, and the Technical Director Kai sun, engineer Xiaofei Liu and Dongdong Wan of ELITE ROBOTS Co., Ltd. (Suzhou, China) for their contribution to the technical guidance and platform equipment for applying the methods in the subsequent actual picking experiment.

Conflicts of Interest

The authors declare no conflict of interest.

References

  1. Diniz, P.; Pistonesi, M.; Alvarez, M.; Band, B.; Araujo, M. Simplified tea classification based on a reduced chemical composition profile via successive projections algorithm linear discriminant analysis (SPA-LDA). J. Food Compos. Anal. 2015, 39, 103–110. [Google Scholar] [CrossRef] [Green Version]
  2. Liu, L.; Fan, Y.; Fu, H.; Chen, F.; Ni, C.; Wang, J.; Yin, Q.; Mu, Q.; Yang, T.; She, Y. “Turn-off” fluorescent sensor for highly sensitive and specific simultaneous recognition of 29 famous green teas based on quantum dots combined with chemometrics. Anal. Chim. Acta 2017, 963, 119–128. [Google Scholar] [CrossRef] [PubMed]
  3. Han, Y.; Xiao, H.; Qin, G.; Song, Z.; Ding, W.; Mei, S. Developing Situations of Tea Plucking Machine. Engineering 2014, 6, 268–273. [Google Scholar] [CrossRef] [Green Version]
  4. Du, Z.; Hu, Y.; Wang, S. Simulation and Experiment of Reciprocating Cutter Kinematic of Portable Tea Picking Machine. Trans. J. CSAM 2018, s1, 221–226. [Google Scholar]
  5. Motokura, K.; Takahashi, M.; Ewerton, M.; Peters, J. Plucking Motions for Tea Harvesting Robots Using Probabilistic Movement Primitives. IEEE Robot. Autom. Lett. 2020, 5, 3275–3282. [Google Scholar] [CrossRef]
  6. Madamombe, G.; Tesfamariam, E.; Taylor, N. Yield decline in mechanically harvested clonal tea (Camellia sinensis (L) O. Kuntze) as influenced by changes in source/sink and radiation interception dynamics in the canopy. Sci. Hortic.-Amst. 2015, 194, 286–294. [Google Scholar] [CrossRef] [Green Version]
  7. Tang, Y.; Han, W.; Anguo, H.; Wang, W. Design and Experiment of Intelligentized Tea-Plucking Machine for Human Riding Based on Machine Vision. Trans. J. CSAM 2016, 7, 15–20. [Google Scholar]
  8. Chen, J.; Yong, C.; Jin, X.; Che, J.; Gao, F.; Li, N. Research on a Parallel Robot for Tea Flushes Plucking. Engineering 2015, 22, 2352–5428. [Google Scholar]
  9. Yang, H.; Chen, L.; Ma, Z.; Chen, M.; Zhong, Y.; Deng, F.; Li, M. Computer vision-based high-quality tea automatic plucking robot using Delta parallel manipulator. Comput. Electron. Agric. 2021, 181, 105946. [Google Scholar] [CrossRef]
  10. Zhao, Y.; Gong, L.; Huang, Y.; Liu, C. A review of key techniques of vision-based control for harvesting robot. Comput. Electron. Agric. 2016, 127, 311–323. [Google Scholar] [CrossRef]
  11. Bulanon, D.M.; Kataoka, T. Fruit detection system and an end effector for robotic harvesting of Fuji apples. J. CIGR 2010, 12, 203–210. [Google Scholar]
  12. Mehta, S.S.; Burks, T.F. Vision-based control of robotic manipulator for citrus harvesting. Comput. Electron. Agric. 2014, 102, 146–158. [Google Scholar] [CrossRef]
  13. Edan, Y.; Rogozin, D. Robotic melon harvesting. IEEE J. Mag. 2000, 16, 831–835. [Google Scholar] [CrossRef]
  14. Hayashi, S.; Shigematsu, K.; Yamamoto, S.; Kobayashi, K.; Kohno, Y.; Kamata, J.; Kurite, M. Evaluation of a strawberry-harvesting robot in a field test. Biosyst. Eng. 2010, 105, 160–171. [Google Scholar] [CrossRef]
  15. Scarfe, A.J.; Flemmer, R.C.; Bakker, H.; Flemmer, C.L. Development of an autonomous kiwifruit picking robot. In Proceedings of the 4th International Conference on Autonomous Robots and Agents, Wellington, New Zealand, 10–12 February 2009; pp. 10–12. [Google Scholar]
  16. Ji, C.; Zhang, J.; Yuan, T.; Li, W. Research on Key Technology of Truss Tomato Harvesting Robot in Greenhouse. In Proceedings of the 2013 International Conference on Materials Engineering and Mechanical Automation (MEMA), Shanghai, China, 1–2 October 2013; pp. 480–486. [Google Scholar]
  17. Henten, E.; Hemming, J.; Tuijl, B.; Kornet, J.; Bontsema, J. Collision-Free Motion Planning for a Cucumber Picking Robot. Biosyst. Eng. 2003, 86, 135–144. [Google Scholar] [CrossRef]
  18. Hemming, J.; Bac, C.W.; Tuijl, J.V.; Barth, R. A robot for harvesting sweet-pepper in greenhouses. Comput. Sci. 2014, 1, 13–18. [Google Scholar]
  19. Wu, X.; Tang, X.; Zhang, F.; Gu, J. Tea buds image identification based on lab color model and K-means clustering. J. CSAM 2015, 36, 161–164. [Google Scholar]
  20. Zhang, L.; Zhang, H.; Chen, Y.; Dai, S. Real-time monitoring of optimum timing for harvesting fresh tea leaves based on machine vision. Int. J. Agric. Biol. Eng. 2019, 12, 6–9. [Google Scholar] [CrossRef]
  21. Kamilaris, A.; Prenafeta-Boldu, F. Deep learning in agriculture: A survey. Comput. Electron. Agric. 2018, 147, 70–90. [Google Scholar] [CrossRef] [Green Version]
  22. Gao, P.; Xu, W.; Yan, T.; Zhang, C.; Lv, X.; He, Y. Application of Near-Infrared Hyperspectral Imaging with Machine Learning Methods to Identify Geographical Origins of Dry Narrow-Leaved Oleaster (Elaeagnus angustifolia) Fruits. Foods 2019, 8, 620. [Google Scholar] [CrossRef] [PubMed] [Green Version]
  23. Qian, C.; Li, M.; Ren, Y. Tea Sprouts Segmentation via Improved Deep Convolutional Encoder-Decoder Network. IEICE Trans. Inf. Syst. 2020, 103, 476–479. [Google Scholar] [CrossRef] [Green Version]
  24. Xu, W.; Zhao, L.; Li, J.; Shang, S.; Ding, X.; Wang, T. Detection and classification of tea buds based on deep learning. Comput. Electron. Agric. 2022, 192, 106547. [Google Scholar] [CrossRef]
  25. Sun, X.; Mu, S.; Xu, Y.; Cao, Z.H.; Su, T. Detection algorithm of tea tender buds under complex background based on deep learning. J. Hebei Univ. 2019, 39, 211–216. [Google Scholar]
  26. Chen, B.; Yan, J.; Wang, K. Fresh Tea Sprouts Detection via Image Enhancement and Fusion SSD. J. Control Sci. Eng. 2021, 26, 13–24. [Google Scholar] [CrossRef]
  27. Li, Y.; He, L.; Jia, J.; Chen, J.; Lyu, L.; Wu, C. High-efficiency tea shoot detection method via a compressed deep learning model. Int. J. Agric. Biol. Eng. 2022, 3, 159–166. [Google Scholar] [CrossRef]
  28. Yang, H.; Chen, L.; Chen, M.; Ma, Z.; Deng, F.; Li, M. Tender Tea Shoots Recognition and Positioning for Picking Robot Using Improved YOLO-V3 Model. IEEE Access 2019, 7, 180998–181011. [Google Scholar] [CrossRef]
  29. Tao, W.; Zhang, K.; Zhang, W.; Wang, R.; Wan, S.; Rao, Y.; Jiang, Z.; Gu, L. Tea Picking Point Detection and Location Based on Mask-RCNN. Inf. Process. Agric. 2021. Available online: https://www.sciencedirect.com/science/article/pii/S2214317321000962 (accessed on 25 December 2022).
  30. Yan, C.; Chen, Z.; Li, Z.; Liu, R.; Li, Y.; Xiao, H.; Lu, P.; Xie, B. Tea Sprout Picking Point Identification Based on Improved DeepLabV3+. Agriculture 2022, 12, 1594. [Google Scholar] [CrossRef]
  31. Chen, Y.; Chen, S. Localizing plucking points of tea leaves using deep convolutional neural networks—ScienceDirect. Comput. Electron. Agric. 2020, 171, 105298. [Google Scholar] [CrossRef]
  32. Redmon, J.; Divvala, S.; Girshick, R.; Farhadi, A. You Only Look Once: Unified, Real-Time Object Detection. IEEE Conf. Comput. Vis. Pattern Recognit. 2016, 27, 779–788. [Google Scholar]
  33. Fu, L.; Feng, Y.; Wu, J.; Liu, Z.; Gao, F.; Majeed, Y.; Al-Mallahi, A.; Zhang, Q.; Li, R.; Cui, Y. Fast and accurate detection of kiwifruit in orchard using improved YOLOv3-tiny model. Precis. Agric. 2021, 22, 754–776. [Google Scholar] [CrossRef]
  34. Magalhães, S.A.; Castro, L.; Moreira, G.; Santos, F.; Cunha, M.; Dias, J.; Moreira, A. Evaluating the Single-Shot MultiBox Detector and YOLO Deep Learning Models for the Detection of Tomatoes in a Greenhouse. Sensors 2021, 21, 3569. [Google Scholar] [CrossRef] [PubMed]
  35. Gao, F.; Fang, W.; Sun, X.; Wu, Z.; Zhao, G.; Li, G.; Li, R.; Fu, L.; Zhang, Q. A novel apple fruit detection and counting methodology based on deep learning and trunk tracking in modern orchard. Comput. Electron. Agric. 2022, 197, 107000–107005. [Google Scholar] [CrossRef]
  36. Li, D.; Sun, X.; Elkhouchlaa, H.; Jia, Y.; Yao, Z.; Lin, P.; Li, J.; Lu, H. Fast detection and location of longan fruits using UAV images. Comput. Electron. Agric. 2021, 190, 106–109. [Google Scholar] [CrossRef]
  37. Xu, Z.F.; Jia, R.S.; Liu, Y.B.; Zhao, C.Y.; Sun, H.M. Fast Method of Detecting Tomatoes in a Complex Scene for Picking Robots. IEEE Access 2020, 8, 55289–55299. [Google Scholar] [CrossRef]
  38. Cao, Z.; Yuan, R. Real-Time Detection of Mango Based on Improved YOLOv4. Electronics 2022, 11, 3853. [Google Scholar] [CrossRef]
  39. Fan, R.; Pei, M. Lightweight Forest Fire Detection Based on Deep Learning. IEEE Access 2021, 1, 1–6. [Google Scholar]
  40. Bochkovskiy, A.; Wang, C.; Liao, H. YOLOv4: Optimal Speed and Accuracy of Object Detection. Comput. Sci. 2020, 2004, 10934. [Google Scholar]
  41. Lee, J.; Lee, B.; Hwang, J.; Ko, K.; Chung, J.; Kim, E.; Lee, S.; Hong, Y. Metabolic Dependence of Green Tea on Plucking Positions Revisited: A Metabolomic Study. J. Agric. Food Chem. 2011, 59, 79–85. [Google Scholar] [CrossRef]
  42. Gall, G.; Colquhoun, I.; Defernez, M. Metabolite Profiling Using 1H NMR Spectroscopy for Quality Assessment of Green Tea, Camellia sinensis. J. Agric. Food Chem. 2004, 52, 692–700. [Google Scholar] [CrossRef]
  43. Misra, D. Mish: A Self Regularized Non-Monotonic Neural Activation Function. Comput. Sci. 2019, 8, 681–684. [Google Scholar]
  44. Wang, C.; Liao, H.; Wu, Y.; Chen, P.; Hsieh, J.; Yeh, I. CSPNet: A New Backbone that can Enhance Learning Capability of CNN. CVF Conf. Comput. Vis. Pattern Recognit. Work. 2020, 28, 1571–1580. [Google Scholar]
  45. Liu, S.; Qi, L.; Qin, H.; Shi, J.; Jia, J. Path Aggregation Network for Instance Segmentation. IEEE CVF Conf. Comput. Vis. Pattern Recognit. 2018, 18, 8759–8768. [Google Scholar]
  46. Jie, H.; Li, S.; Gang, S. Squeeze-and-Excitation Networks. IEEE Trans. Pattern Anal. Mach. Intell. 2017, 1, 7132–7141. [Google Scholar]
  47. Wang, Q.; Wu, B.; Zhu, P.; Li, P.; Zuo, W.; Hu, Q. ECA-Net: Efficient Channel Attention for Deep Convolutional Neural Networks. IEEE CVF Conf. Comput. Vis. Pattern Recognit. 2020, 1, 11531–11539. [Google Scholar]
  48. Woo, S.; Park, J.; Lee, J.; Kweon, I. CBAM: Convolutional Block Attention Module. Comput. Vis. 2018, 11211, 3–19. [Google Scholar]
  49. Yang, F.; Yang, L.; Tian, Y.; Yang, Q. Recognition of the tea sprout based on color and shape features. Trans. J. CSAM 2009, 40, 119–123. [Google Scholar]
  50. Chen, Y.; Wu, C.; Chen, S. Application of Deep Learning Algorithm on Tea Shoot Identification and Localization. Comput. Sci. 2018, 3, 159–169. [Google Scholar]
Figure 1. Depth measurement errors of the stereo camera. (a) Test setup; (b) Spatial distributions of measured depth errors. The numbers from 200 to 1800 are in millimeters.
Agriculture 13 00518 g001
Figure 2. Labeled images.
Agriculture 13 00518 g002
Figure 3. Improved method of YOLOv4. CBM, Conv + Batch Nomalization + Mish; RB, Resblock_body; RESn, Residual Networks; SENet, cross-stage partial network; ECA, efficient channel attention; CBAM, convolutional block attention module; ICBAM, self-improved attention mechanism; SPP, spatial pyramid pooling; H, Hight; W, width. (a) Improved YOLOv4 model. The red boxes are the contribution of the improved method as compared to the benchmark method in the methodology diagram; (b) Improved hybrid attention mechanism (ICBAM).
Agriculture 13 00518 g003
Figure 4. Positioning principle of a binocular camera. OL-XLYLZL and OR-XRYRZR are the left and right eye coordinate systems of the binocular camera, respectively; OL and OR are the optical centers of the left and right eyes, respectively; f is the focal length of the binocular camera; b is the baseline distance of the binocular camera. The coordinates of the tea to be located are point P in the camera coordinate system, and its coordinates are (X, Y, Z).
Agriculture 13 00518 g004
Figure 5. Measurement of the width of tea leaves.
Agriculture 13 00518 g005
Figure 6. Flow chart of methodology.
Agriculture 13 00518 g006
Figure 7. Contrast and histograms of original color and contrast-enhanced images after global and adaptive histogram enhancement under different light conditions: (a) normal (9–10 a.m.), (b) strong (12–1 p.m.), and (c) low (5–6 p.m.). The different colors in the graphs indicate the distribution of the number of pixels in the r, g, b channels.
Agriculture 13 00518 g007
Figure 8. AP values of different recognition models.
Agriculture 13 00518 g008
Figure 9. Comparison curve of size and frame rate of different recognition models.
Agriculture 13 00518 g009
Figure 10. Prediction mechanism. (a) Heat maps of feature layers (warmer colors for predicted targets); (b) Targets from the feature layers and the confidence score layer are combined; (c) Detected targets superimposed on the original image.
Agriculture 13 00518 g010
Figure 11. Tea bud detection results of YOLOv4 and YOLOv4-lighted + ICBAM, where the spatial location of each detected tea bud is described by a bounding box. A red box means a hit, whereas a blue box means a miss.
Agriculture 13 00518 g011
Figure 12. (a) Detected and localized tea buds in a color image, and (b) its depth image.
Agriculture 13 00518 g012
Figure 13. Detection and segmentation of tea buds and localization of picking points. (a) Cropped sub-image by the object detection model; (b) Preprocessed image; (c) Segmented image; (d) Depth filter; (e) Masked color image after size filtering; (f) Localization of picking points as the lowest pixel of each contour.
Agriculture 13 00518 g013
Figure 14. Picking points localized in the original RGB image.
Agriculture 13 00518 g014
Table 1. Dataset composition.
Lighting
Condition
Original
Image
Contrast
Enhanced
Added Salt and Pepper NoiseRotatedTotal
Normal light13000130026005200
Intense light01300130026005200
Low light01300130026005200
Table 2. Comparison of model sizes.
YOLOv4YOLOv4-lightedSENetECACBAMICBAMNumber of Parameters
64,429,405
14,811,101
14,984,253
14,811,116
14,984,550
14,820,358
Table 3. Hardware and software configurations for model development.
ComponentDescription
CPUIntel Core i5-10400F (2.9 GHz)
GPU hardwareNVIDIA GeForce GTX 1650
GPU programming libraryCUDA 11.0 and CUDNN 8.0
Integrated development environmentPyCharm 2021.1.1
Operating systemWindows 10
Table 4. Performance of six tea bud detection models.
ModelPrecision (%)Recall (%)F1 Score
YOLOv485.9486.210.84
YOLOv4-lighted86.5281.230.84
YOLOv4-lighted + SENet87.1384.930.86
YOLOv4-lighted + ECA86.3887.920.87
YOLOv4-lighted + CBAM94.3093.660.94
YOLOv4-lighted + ICBAM94.1993.500.94
Table 5. Results of picking point positioning test.
Experiment NumberNumber of
Tea Buds
Detected
Tea Buds
Correct
Picking Points
Correct
Positioning Rate (%)
Average
Positioning Time (s)
124221986.360.12
230272488.880.15
347433888.370.10
Average34312787.100.12
Table 6. Results in this paper compared with results from other state-of-the-art models.
PaperBackgroundMethod/ModelPicking PointPrecisionRecallF1-ScoreAccuracyTime
Yang et al. [49]SimpleColor and shape characteristics0.940.45
Zhang et al. [20]ComplexBayesian discriminant principle0.901.21
Wu et al. [19]ComplexK-means clustering method0.948.79
Xu et al. [24]ComplexDenseNet2010.990.890.95
Yang et al. [28]Simpleimproved
YOLO-V3 and K-means method
0.920.910.92
Wang et al. [29]ComplexMask-RCNN0.940.92
Chen et al. [50]ComplexFaster R-CNN0.860.13
Chen et al. [31]ComplexFaster R-CNN and FCN0.790.900.85
Our methodComplexYOLOv4-lighted + ICBAM0.940.940.940.980.12
Disclaimer/Publisher’s Note: The statements, opinions and data contained in all publications are solely those of the individual author(s) and contributor(s) and not of MDPI and/or the editor(s). MDPI and/or the editor(s) disclaim responsibility for any injury to people or property resulting from any ideas, methods, instructions or products referred to in the content.

