Article

Simultaneous Determination of γ-Oryzanol in Agriproducts by Solid-Phase Extraction Coupled with UHPLC–MS/MS

1
College of Life Science, Yangtze University, Jingzhou 434025, China
2
Key Laboratory of Biology and Genetic Improvement of Oil Crops, Ministry of Agriculture and Rural Affairs, Wuhan 430062, China
3
Laboratory of Quality & Safety Risk Assessment for Oilseed Products (Wuhan), Ministry of Agriculture and Rural Affairs, Wuhan 430062, China
4
Oil Crops Research Institute, Chinese Academy of Agricultural Sciences, Wuhan 430062, China
5
Hubei Hongshan Laboratory, Wuhan 430070, China
*
Authors to whom correspondence should be addressed.
Agriculture 2023, 13(3), 531; https://doi.org/10.3390/agriculture13030531
Submission received: 11 January 2023 / Revised: 8 February 2023 / Accepted: 17 February 2023 / Published: 22 February 2023
(This article belongs to the Special Issue Sensors Applied to Agricultural Products)

Abstract

:
In this work, a simple, rapid and cost-effective method for the simultaneous quantification of two major γ-oryzanol components in agriproducts was established by silica solid-phase extraction (SPE) coupled with UHPLC–MS/MS. Silica SPE sorbents consist of unbonded silica gel with high polarity and can retain most of the analytes with acidic properties. Silica sorbents are cost-effective materials and that can be prepared simply without a large volume of toxic chlorinated solvent. Silica SPE sorbents were utilized to extract and purify cycloartenyl ferulate (CF) and 24-methylene cycloartanyl ferulate (24-CF) in cereal products. Various parameters affecting the isolation recoveries were studied. By coupling with ultra-high-performance liquid chromatography–mass spectrometry (UHPLC–MS/MS), a novel method for the quantification of CF and 24-CF in agriproducts was developed and validated. The procedure used silica sorbent to purify the analytes in 30 min without complicated steps, which improved the simplicity and efficiency. The limits of quantification and the limits of detection of CF and 24-CF were 0.3 and 1.0 μg kg−1, respectively. Extraction recoveries ranged from 86.93% to 108.75% with inter-day and intra-day precisions less than 10.84%. The results of 50 agriproducts indicated that the rice bran had the highest averaged amount of 34.3 × 10³ μg kg−1 for CF and 42.6 × 10³ μg kg−1 for 24-CF, making it a perfect source of human nutritional supplement substances from agriproducts.

1. Introduction

Rice (Oryzae sativa L.) and wheat (Triticum aestivum) are the most important cereal crops in the world and are consumed as dietary food by nearly half of the global population [1]. As the primary source of carbohydrates for energy, rice can not only provide protein and starch from kernels but also contains nutritional substances, including minerals, γ-oryzanol, tocopherols and tocotrienols from the outer layer of kernel as rice bran [2]. γ-Oryzanol is a mixture of triterpene alcohol and sterol ferulates, which mainly consists of cycloartenyl ferulate (CF), 24-methylene cycloartanyl ferulate (24-CF), campesteryl ferulate, and β-sitosteryl ferulate [3]. Owing to its distribution in crops and anti-oxidant function in human, γ-oryzanol is the characteristic compound of rice and possesses health-promoting benefits, including hypolipemic [4], anti-cancer [5], anti-inflammation, anti-oxidant [6] and anti-diabetic activities [7]. Therefore, it is significant to develop a simple, fast and efficient method to quantify the content of γ-oryzanol in agriproducts.
Various instrumental methods have been reported to analyze γ-oryzanol and its profile in cereal and its product. Based on the physical characteristics and molecular structure, spectrophotometric techniques, including near infrared spectroscopy, ultraviolet spectroscopy and nuclear magnetic resonance, have been utilized to detect the total amount of γ-oryzanol in rice and rice bran oil [8,9,10]. To elucidate the content and profile, high-performance liquid chromatographic separation techniques have also been utilized to identify and quantify γ-oryzanol with different methods such as ultraviolet/visible dual detectors [11], diode arrays [12], mass spectrometry [13] and high-resolution quadrupole time-of-flight mass-spectrometric detection (HR-Q-TOF-MS) [14]. Owing to high chromatographic resolution, accuracy and efficiency, ultra-high-performance liquid chromatography–mass spectrometry (UHPLC–MS/MS) is the most robust method for simultaneous determination of γ-oryzanol in complicated matrices.
The major challenge in quantifying the amount of γ-oryzanol and its profile in agriproducts is the extraction and purification of the analytes from high protein and lipid samples. The well-established pretreatments are alkalization, preparative thin-layer chromatography [15], liquid-to-liquid extraction [16], accelerated solvent extraction [14], microwave-assisted extraction [17], hydrostatic countercurrent chromatography [18] and supercritical carbon dioxide extraction [19]. Most of these isolation and enrichment techniques require a large volume of organic solvents and are complicated, with labor-intensive procedures and sophisticated apparatus. Therefore, a rapid, efficient and accurate method for the analysis of γ-oryzanol in agriproducts is still necessary.
Owing to its simplicity and universality, solid-phase extraction (SPE) procedure has been widely applied in for routine analysis in official testing centers and accepted as the gold standard extraction and purification method of analytes in complicated matrices. To date, various type of SPE sorbents have been introduced and utilized, including Diol SPE [14], molecularly imprinted polymers (MIPs) [11,20], amorphous carbon nanoparticles [21] and mixed-mode anion exchange (MAX) [22]. The Diol SPE sorbents possess the capability to separate steryl-ferulate-rich lipid from sterols and neutral lipids. The steryl-ferulate-rich lipids are then analyzed by UHPLC-HR-Q-TOF-MS and further differentiated among different rice varieties according to the profile of steryl ferulate and some small lipids. Thongchai et al. synthesized MIP sorbents via photopolymerization reaction by using diethylaminoethyl methacrylate as a function monomer, γ-oryzanol as a template, dodecanol as a porogen, 2,2′-dimethoxy-2-phenylacetophenone as an initiator and ethylene glycol dimethacrylate as a cross-linker. The results showed that the detected linearity ranged from 10 to 50 μg mL−1, and the limit of quantification was 5.70 μg mL−1. Mixed-mode MAX sorbents, which consist of non-polar and strong ion-exchange functional groups, have been applied to enrich and purify CF, 24-CF and campesteryl ferulate in rice and its products, and the amount of those substances was determined by HPLC-MS/MS. It was found that the MAX sorbents could minimize the matrix effect ranging from 1.6% to 10.8%, and the limits of quantification were 2.0–3.5 μg L−1. Nevertheless, the only commercial sorbents are Diol and MAX, and the price for the SPE columns is expensive (Oasis MAX 6 cc Vac per cartridge is nearly CNY 68, Waters, Milford, MA, USA). Therefore, it is highly valuable to develop novel and cost-effective sorbents to separate γ-oryzanol from agriproducts.
In this study, we proposed a SPE UHPLC–MS/MS method to identify and quantify γ-oryzanol and its profile in cereal products. Due to its wide versatility and application, silicon dioxide was selected to extract and purify γ-oryzanol in cereal-based products, followed by immediate analysis using UHPLC–MS/MS. Silicon dioxide can adsorb complicated matrices, including pigments, soaps, phospholipids, phosphorus and other minor substance in vegetable oil [23,24], and the targeted compounds were enriched during the eluting step. Under optimized conditions, γ-oryzanol in protein and lipid matrices was simultaneously quantified without complicated steps. To the best of our knowledge, this is the first report on the quantification of γ-oryzanol in cereal and its products using silica SPE sorbents coupled with UHPLC–MS/MS analysis.

2. Materials and Methods

2.1. Chemicals and Materials

Methanol (MeOH), acetonitrile (CH3CN), ethyl acetate (EtOAc), isopropanol, acetone, dichloromethane (DCM), petroleum ether (PE) and n-hexane of HPLC grade were purchased from FTSCI (Hubei) Science and Technology Co., Ltd. (Wuhan, China). Unless otherwise mentioned, all other inorganic chemicals and organic solvents were of analytical reagent grade or better. The ultra-pure water (18 mΩ) was produced from a water purification system from Millipore Co., Ltd. (Milford, MA, USA).
Different types of the other SPE sorbents, HLB 500 mg (6 mL) sorbents from Jiangsu Green Union Scientific Instrument Co., LTD (Taizhou, China), WondaSep® WCX 500 mg (6 mL) sorbents from Shimadzu Global Laboratory Consumables Co., LTD (Shanghai, China), Florisi 1 g (6 mL) sorbents from Agilent Technologies Inc., (Santa Clara, CA, USA) and Sep-Pak® Vac 6cc (500 mg) Diol sorbents from Waters (Wexford, Ireland) were also used for comparison with ProElut silica sorbents.

2.2. Standards

CF and 24-CF with purity of ≥98% were obtained from Herb Substance Biotechnology Co., Ltd. (Chengdu, China). Stock solutions were freshly prepared for all standards by accurately weighing 10 ± 0.1 mg of all standards and dissolving separately in 10 mL of isopropanol. A series of standard solutions with a concentration of 1 mg mL−1 were prepared by diluting the stock solutions with methanol and storing in the dark at −18 °C until use. A working standard solution of 1 μg mL−1 was prepared by adding an appropriate amount of methanol to dilute the stock solutions before the experiment.

2.3. Sample Preparation

To analyze the content and distribution of CF and 24-CF from cereal products, rice, rice bran, corn and corn germ were collected from the main production area of China and stored at room temperature before preparation. Detailed information of these samples, including production area and harvest year, was listed in Table S1. All the samples were ground into powders which passed through 0.850 mm filter. Next, 0.5 g of the sample was accurately placed into a 15 mL centrifuge tube. When adding 6 mL of n-hexane, the tube with suspension was immersed in water at 25 °C for 25 min. After centrifugation at 5000 rpm for 10 min, 2 mL of the supernatant was added into a clean tube for the further SPE procedure.

2.4. Solid-Phase Extraction Procedure

2.4.1. Conditioning Step

To remove the impurity of the substance, silica solid-phase steps were performed with ProElut silica 500 mg (6 mL) sorbents from Beijing Dikma Technology Co., LTD (Beijing, China). The silica sorbents were first conditioned with 4 mL of n-hexane.

2.4.2. Loading Step

A total of 2 mL of the sample extractant was loaded at a controlled flow rate of 1 mL min−1.

2.4.3. Washing Step

Afterward, those sorbents were washed with 2 mL of acetone/n-hexane (4:96, v/v) to remove the most of triglycerides and other lipid substances.

2.4.4. Eluting Step

Subsequently, all the analytes were eluted with 4 mL of ethyl acetate and dried under a gentle nitrogen stream at 25 °C. The final residue was reconstituted with 100 μL of methanol for MS analysis. All the prepared samples were detected in triplicate by the optimized SPE UHPLC–MS/MS method.

2.5. UHPLC–MS/MS Analysis

The Shimadzu 8050 UHPLC–MS/MS system (Kyoto, Japan) employed for the determination of CF and 24-CF included a triple quadrupole mass spectrometer with an electrospray ionization (ESI) source, an LC-30AD apparatus with a SIL-30AC auto-sampler, a CTO-20AC thermostat column compartment and two LC-30AD pumps. The separation of CF and 24-CF was performed on a Themo Syncronis C18 column (2.1 × 100 mm, 3 μm, Boston, MA, USA) at 40 °C. Mobile phase A consisted of aqueous 2 mmol L−1 ammonium acetate, and mobile phase B was methanol. A linear gradient elution procedure was performed as follows: 0 min, 30% A; 1.1 min, 5% A, 6 min, 5% A, 6.1 min, 30% A, 9 min, 30% A. The mobile phase flow rate was set to 300 μL min−1, and an aliquot of 1 μL sample was injected into a UHPLC–MS/MS system.

2.6. Peak Identification

The chromatographic peaks of CF and 24-CF in multiple reaction monitoring (MRM) transitions were identified by the comparison of the retention time, the quantifier and quantification ion pairs in the authentic standard solution. The maximum peak area per unit resolution was established by the optimization of the ion spray interface and mass-spectrometric parameters. The MRM transitions for all target compounds are listed in Table S2. The optimized procedure and acquisition of MS were performed via Shimadzu 5.91 Lab Solution software (Kyoto, Japan).

2.7. Method Validation

To evaluate the ruggedness and robustness, the proposed method was assessed by European Commission Decision 2002/657/EC and Joint Research Centre (JRC) Technical Reports with minor modifications [25,26]. The analytical performance of this method was tested, including the linearity range, limits of detection (LODs), limits of quantification (LOQs), accuracy and intra-day and inter-day precision. The recoveries were evaluated by spiking the rice bran with CF and 24-CF standard solutions at different concentrations. Under optimized conditions, the amount of γ-oryzanol was enriched and analyzed by SPE UHPLC–MS/MS.

2.8. Statistical Analysis

All the samples were performed in triplicate, and the results were performed as average ± standard deviation. The statistical differences were analyzed by Student’s t-test, and the significance level < 0.01 was evaluated as statistically significant. Statistical analysis was conducted using the @ Risk 5.5.1 software package (Palisade, Australia).

3. Results and Discussion

3.1. Optimization of UHPLC–MS/MS

Owing to the medium polarity characteristic of CF and 24-CF, the chromatographic conditions were optimized, including different mobile phases (MeOH/H2O, CH3CN/H2O) and the concentration of ammonium acetate (1, 2, 5 and 10 mmol L−1). The symmetric chromatographic peak and highest resolution were achieved for all analytes under conditions of MeOH and 2 mmol L−1 of ammonium acetate. The results indicated that the eluting capacity and the ionization efficiency were strongly related to the concentration of ammonium acetate, which could adjust pH of the mobile phase during MS analysis.
In the comparison between the silica-based C18 column and Syncronis C18 column, the Syncronis C18 column (2.1 mm × 100 mm, 3 μm) obtained repeatable and consistent chromatography separations with high sensitivity owing to double end-capping, which provides extra surface coverage and inertness toward basic compounds. Afterward, the mobile phase flow rate and the column temperature were optimized accordingly to achieve an acceptable chromatographic peak. The flow rate was set to 300 μL min−1, and the separation temperature was fixed at 40 °C, which could shorten the chromatographic time from 12 to 9 min with robust and high-resolution separation [27].
Additionally, the fragmentation parameters and collision energy of all analytes were optimized when the standard solution of CF and 24-CF were directly injected into the mass spectrometer. Under the optimized collision energy conditions, abundant and stable ions/fragments were formed in the negative mode of ESI, and the [M-H] was used as the parent ion for MRM quantification. As illustrated in Figure S1, the major parent ions of 601.14/615.4 for CF and 24-CF were produced, the qualitative ions 586/600.3 were generated by the loss of methyl (MW15) and the quantitative ions 133.1 were generated by the loss of triterpene alcohol esters. According to European Commission Decision 2002/657/EC, the identification points (IPs) in Table S2 were calculated as 4, which fully satisfied the performance of the analytical method for routine quantification [28].

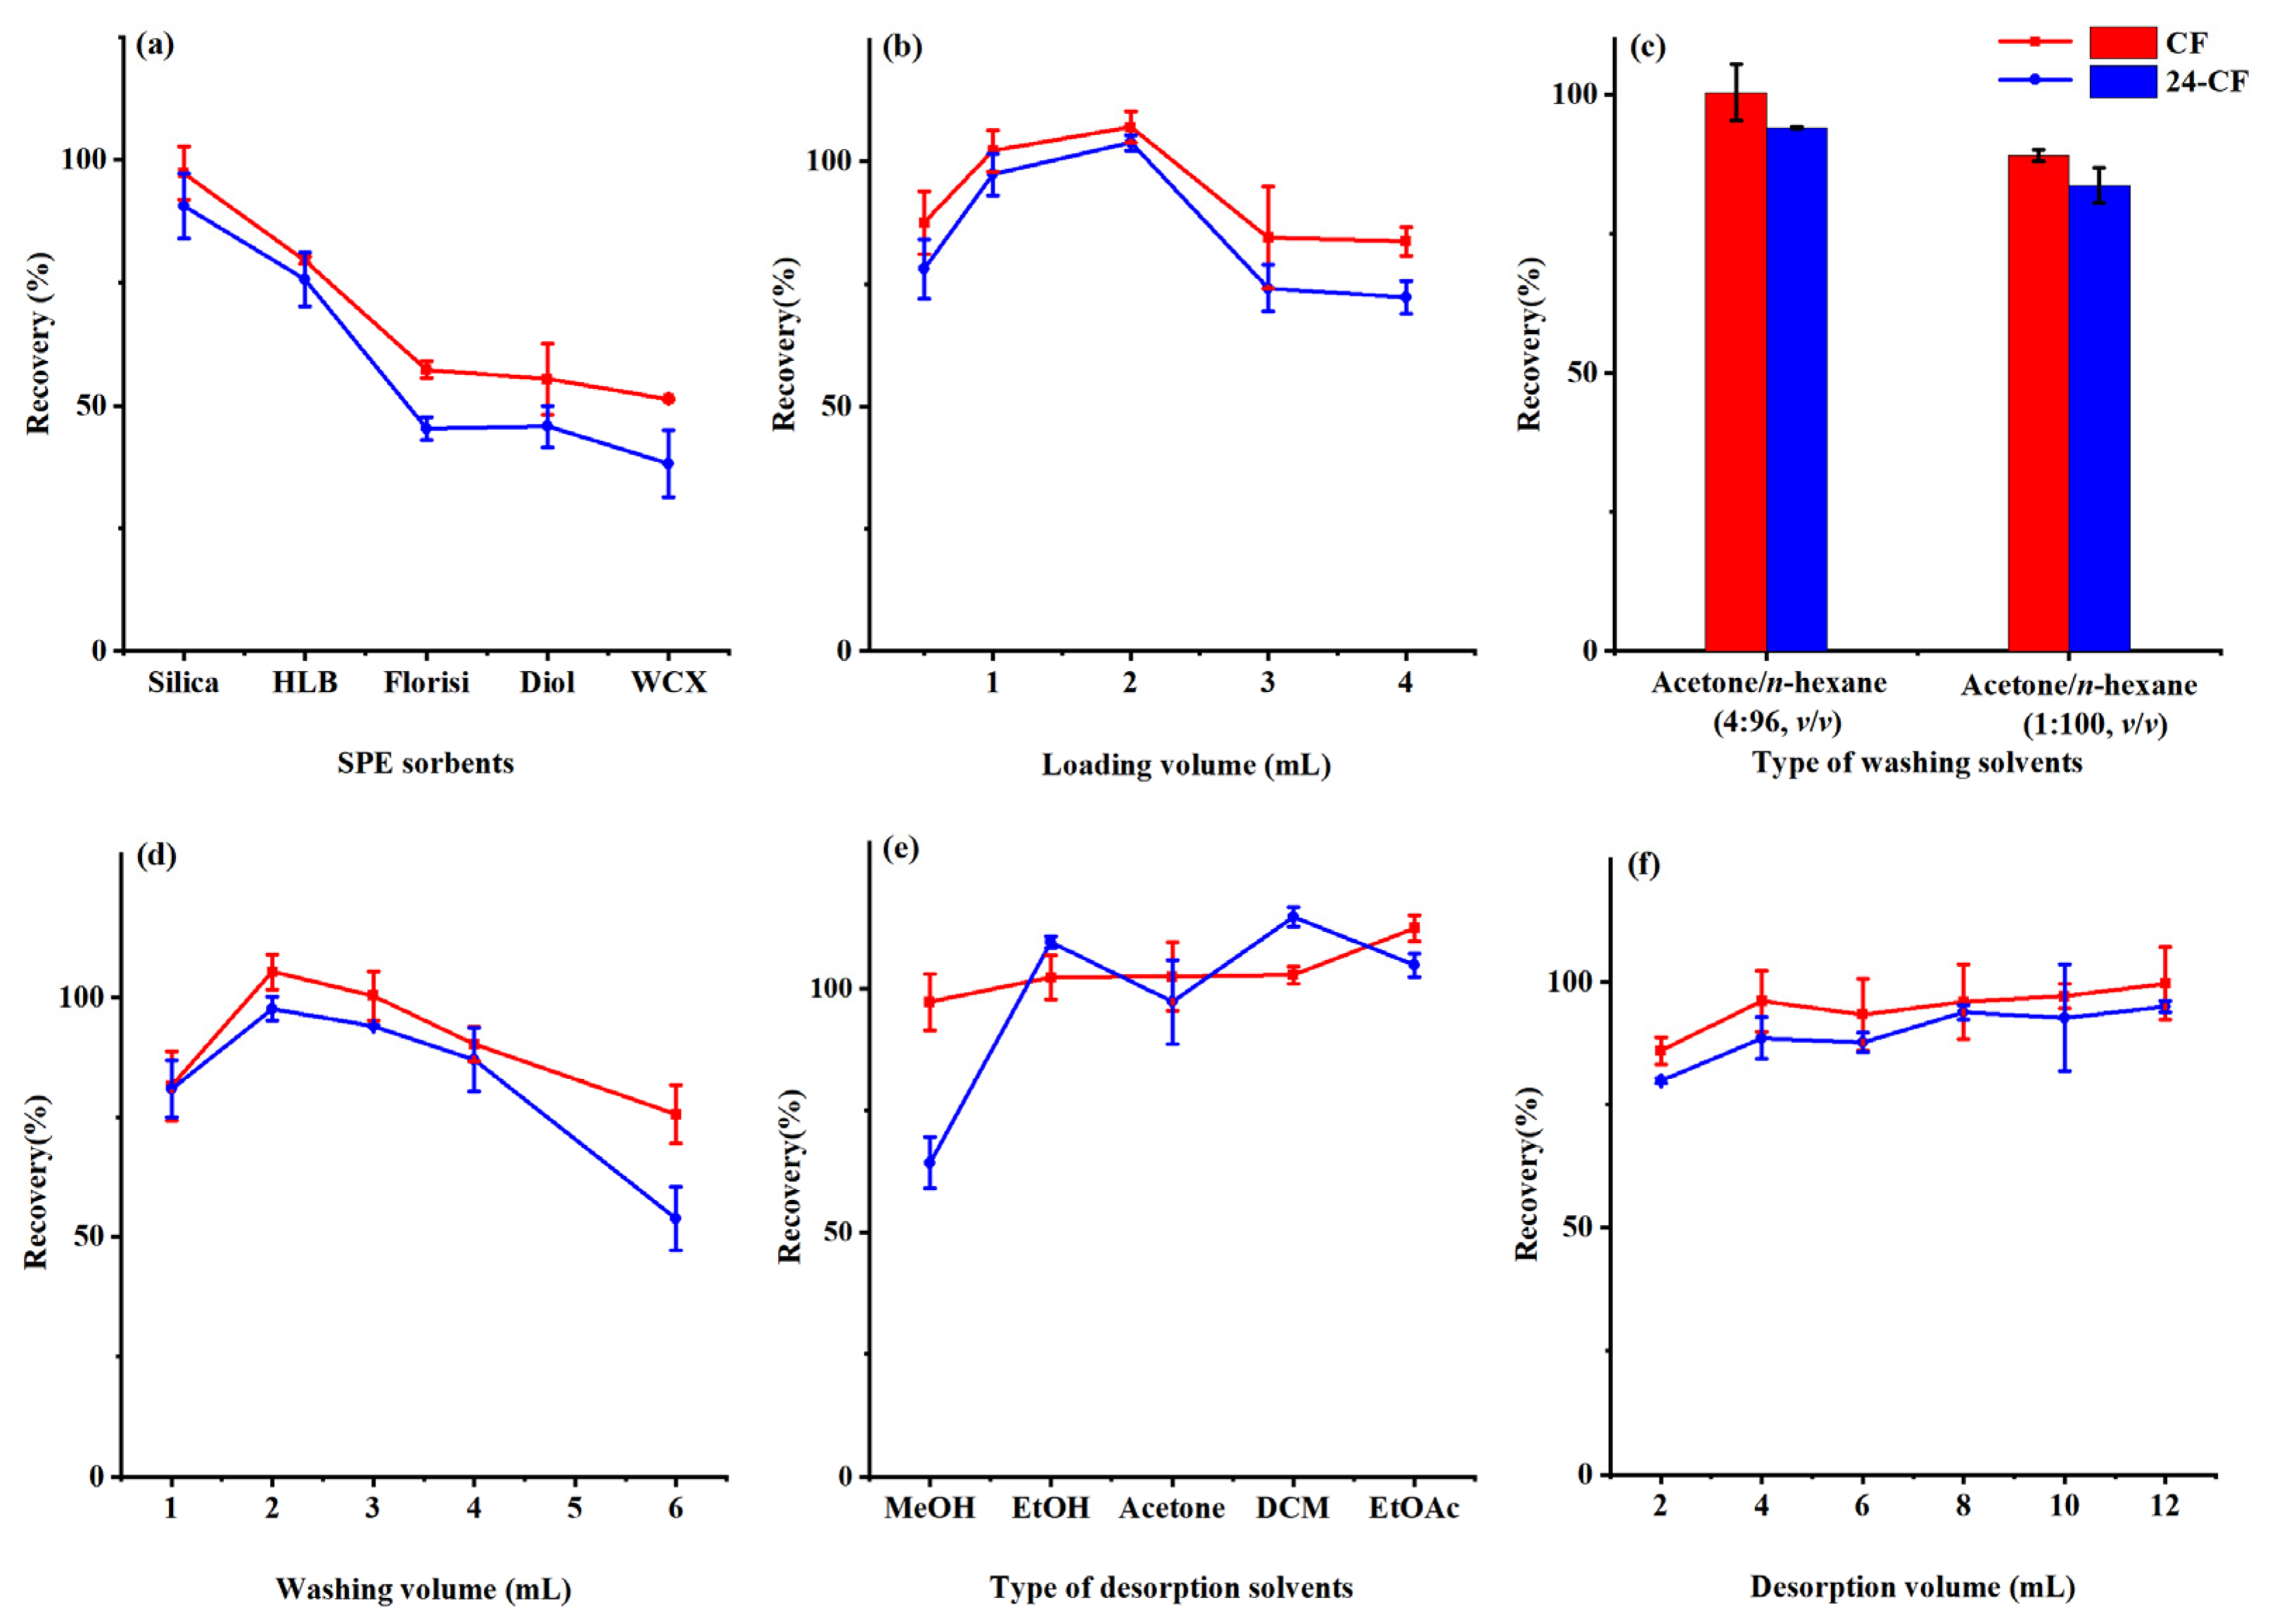
3.2. Optimization of SPE Conditions

To explore the application of silica sorbents for the determination of CF and 24-CF in agriproducts, blank rice bran extractant was prepared and spiked with 10 μg kg−1 γ-oryzanol. Different experiment conditions affecting the enrichment efficiency were optimized accordingly, including SPE sorbents, loading volume, washing and desorption conditions. The SPE procedure was optimized using 2 mL of blank rice bran extractant spiked with 10 μg kg−1 CF and 24-CF.

3.2.1. Optimization of SPE Sorbents

Owing to the vital role of sorbent during the SPE procedure, different types of SPE sorbents were collected and tested to compare the enrichment efficiency. HLB sorbents are hydrophilic–lipophilic-balanced, water-wettable, reversed-phase sorbents and are synthesized from two monomers, namely N-vinylypyrrolidone and the lipophilic divinybenzene. These sorbents have unique reversed-phase capacity with a neutral polar hook to enhance the retention of analytes. WCX sorbents are mixed-mode sorbents with ion-exchange and reversed-phase capacity. These sorbents can be used for all types of basic analytes. Florisi sorbents are used to extract pesticide residues and are highly polar, highly active porous adsorbents that can adsorb target compounds of low and medium polarity, such as organic pesticides containing chlorine, nitrogen and phosphorus. Diol sorbents are prepared by the silica-based polar phase with neutral properties and comprise another type of silica in routine applications, especially when the analyte is undesirable or requires a weak interacting phase. ProElut silica sorbents consist of unbonded silica gel with high polarity which can retain most of the analytes with acidic properties. As presented in Figure 1a, the results indicated that the recoveries of ProElut silica sorbents were 97.26% and 90.58% for CF and 24-CF, and the recoveries of HLB, WCX, Florisi and Diol were all less than 80% for all target compounds. Therefore, silica sorbents were selected as the SPE sorbents in the following study.

3.2.2. Optimization of the Loading Volume

The loading step is critical to retaining the analytes on the sorbents during the SPE procedure, and the efficiency of loading volume was evaluated by increasing extract samples from 0.5 to 4 mL. As depicted in Figure 1b, the extracting recoveries were increased with the increase in the volume of loading solvent from 0.5 to 2 mL, and the recoveries were gradually decreased when the loading volume was more than 2 mL. This phenomenon could be attributed to the overloading of protein-based substances on the SPE sorbents. Therefore, the loading volume was fixed at 2 mL.

3.2.3. Optimization of the Washing Conditions

To minimize the effect of matrices during the MS detection, the type and volume of organic solvents were investigated to remove the interference of proteins and lipids which were retained on the silica sorbents. As presented in Figure 1c, the recoveries were dramatically enhanced from 88.99% to 100.38% for CF and 83.67% to 99.04% for 24-CF when the polar solvent acetone was mixed with non-polar n-hexane. Acetone/n-hexane (4:96, v/v) was used not only for removing triglyceride compounds but also water-soluble substances, including pigments, phenolic compounds and proteins. Further, the volume of washing solvents was also tested from 1 to 6 mL. Figure 1d indicated that the recoveries increased from 1 to 2 mL and gradually decreased from 2 to 6 mL. Finally, 2 mL of acetone/n-hexane (4:96, v/v) was used as the washing solvent.

3.2.4. Optimization of the Desorption Conditions

To ensure excellent recoveries of CF and 24-CF, the type and volume of the desorption solvent were systematically evaluated using organic solvents, namely MeOH, EtOH, acetone, DCM and EtOAc. As showed in Figure 1e, the efficiency of the desorption solvent was in the sequential order: EtOAc > DCM > EtOH > acetone > MeOH. The organic solvent possessing ester moiety had a better desorption efficiency than other structure of solvents, illustrating that the interaction of hydrogen bonds could be attributed to retained CF and 24-CF on the surface of silica sorbents. Additionally, the influence of EtOAc volume, ranging from to 2 to 12 mL, was examined. As presented in Figure 1f, the recoveries gradually increased from 2 to 4 mL and almost remained constant from 4 to 12 mL. When a larger amount of desorption solvent was used, the deviation of recoveries for the parallel samples was over the acceptable range owing to the dilution effect. Finally, 4 mL of EtOAc was selected as the desorption solvent in the SPE procedure.

3.3. Method Validation

3.3.1. Linearity and Sensitivity

Under optimized conditions, the SPE UHPLC–MS/MS method was validated and summarized in Table 1. The calibrations of all analytes were carried out by triplicate analysis and constructed by plotting peak areas at different concentrations ranging from 1.0 to 200.0 μg kg−1. Good linearities of CF and 24-CF were achieved via the concentration ranges, and the calibrated equations were linearly established with correlation coefficients (R2) of more than 0.9942. The LODs were evaluated as the lowest detectable concentrations with signal-to-noise ratios of at least 3, and the LOQs were evaluated as the lowest quantified concentrations with signal-to-noise ratios of at least 10. The LODs and LOQs for CF and 24-CF were 0.3 and 1.0 μg kg−1, which illustrated that the proposed method was suitable to quantify the amount of CF and 24-CF in agriproducts.

3.3.2. Accuracy and Reproducibility

The accuracy of the proposed method was assessed in terms of trueness (systematic error) and calculated as the mean recovery. Rice brans were spiked with the standard solutions at different concentrations (5, 50, 100 μg kg−1). As shown in Table 2, the recoveries of CF and 24-CF ranged from 86.93% to 104.10% and 91.25% to 108.75%, respectively. The intra-day and inter-day precision were evaluated by analyzing the spiked samples within one day, and the inter-day precision was studied independently in three different days. The results of the intra-day and inter-day precisions were less than 10.81% and 10.84%, respectively, which showed that the method had good stability and robustness for detecting CF and 24-CF in agriproducts.

3.3.3. Matrix Effect

Due to protein and oil substances in the complicated samples, the ion intensity of the analytes was diminished or increased during UHPLC–MS analysis. The matrix effect could result in the variation of accuracy and repeatability of the analytical method. In this work, the matrix effect of the SPE sorbents to quantify CF and 24-CF in agriproducts was assessed by the following equation: M a t r i x   e f f e c t   % = C u r v e   s l o p e m a t r i x + s t d C u r v e   s l p o e s t d 1 × 100 % . The results indicated that slight ion suppression ranging from −8.52% to −2.65% was detected when the sample was extracted and quantified by the developed method, which was indicated that the efficiency of silica sorbents could satisfy the routine analysis of nutritional compounds in agriproducts.

3.4. Application of SPE UHPLC–MS/MS for the Determination of CF and 24-CF in Cereal Products

Under optimized conditions, the SPE UHPLC–MS/MS method was applied to analyze CF and 24-CF in agriproducts, namely 20 rice bran, 10 rice, 10 corn and 10 corn germ samples. The results are presented in Table 3. The overall amounts of CF analyzed in different types of cereal samples were 559.8–29.2 × 10³ (rice), 2.1 × 10³–325.9 × 10³ (rice bran), 134.9–853.2 (corn) and 471.2–1.9 × 10³ μg kg−1 (corn germ), and the overall amounts of 24-CF were 573.6–21.7 × 10³ (rice), 4.1 × 10³–322.8 × 10³ (rice bran), 42.2–195.4 (corn) and 178.8–447.7 μg kg−1 (corn germ). The variation of CF and 24-CF in cereal products was attributed to breed variety, geographical production and field and harvest management. Compared with corn and rice and its products, rice bran had the highest averaged quantity of 34.3 × 10³ μg kg−1 CF and 42.6 × 10³ μg kg−1 24-CF, making it a perfect source for human uptake of nutritional supplement substances from agriproducts.
Various analytical methods to detect CF and 24-CF in oilseeds had been proposed and compared with the SPE UHPLC–MS/MS method. As listed in Table 4, most of these methods were achieved by solid-to-liquid extraction or SPE via high-performance liquid chromatography coupled with UV/DAD detectors. The proposed silica SPE sorbents could extract and purify CF and 24-CF in complicated matrix with lower LOQs than the reported methods. The preparation step was performed in 30 min, avoiding a complex extraction procedure, a large volume of toxic chlorinated solvent or expensive synthetic sorbents. The proposed study is the first to use silica SPE sorbents coupled with UHPLC–MS/MS, providing a simple, sensitive and cost-effective approach that meets the requirement of routine analysis for the accurate determination of γ-oryzanol in agriproducts.

4. Conclusions

In this work, silicon dioxide was utilized as a simple, efficient and cost-effective sorbent to prepare γ-oryzanol in the SPE procedure for the first time. The developed method was used to extract and purify CF and 24-CF from agriproducts and simultaneously quantified by UHPLC–MS/MS. Silica sorbents are widely used and commercial materials, and their utilization could simplify the SPE procedure and the use of toxic chlorinated solvent. In addition, the cost-effectiveness and availability of sorbents makes this technique more acceptable for routine analysis. The procedure possesses limited risk of cross-contamination and purified the analytes in 30 min, which improved the accuracy and efficiency. Under optimized conditions, the limits of quantification were 1.0 μg kg−1 for CF and 24-CF with excellent linearities and reproducibility. Taken together, the proposed SPE UHPLC–MS/MS method could be applied in the quality evaluation and nutritional assessment of γ-oryzanol in agriproducts.

Supplementary Materials

The following supporting information can be downloaded at: https://www.mdpi.com/article/10.3390/agriculture13030531/s1, Figure S1: Proposed mechanism for the ion fragment of cycloartenyl ferulate, 24-methylene cycloartanyl ferulate; Table S1: Detailed information of rice, corn and germ samples used in the validated study; Table S2: MRM transitions for the detection of cycloartenyl ferulate (CF) and 24-methylene cycloartanyl ferulate (24-CF).

Author Contributions

L.L.: Data curation, investigation, methodology, resources, software, validation, visualization, writing–original draft. L.Z.: Funding acquisition, project administration, supervision, writing—review and editing. M.G.: Conceptualization, methodology, investigation, supervision, visualization. F.M.: Conceptualization, formal analysis, investigation, validation, writing—review and editing, funding acquisition. All authors have read and agreed to the published version of the manuscript.

Funding

This work was funded by National Key R&D Program of China (2021YFD1600101), the Central Public-Interest Scientific Institution Basal Research Fund (1610172021005), the National Natural Science Foundation of China (31201447) and the Earmarked Fund for China Agriculture Research System (CARS-12).

Institutional Review Board Statement

Not applicable.

Data Availability Statement

All the related data were provided in this paper.

Conflicts of Interest

The authors declare no conflict of interest.

References

  1. Hammann, S.; Korf, A.; Bull, I.D.; Hayen, H.; Cramp, L.J.E. Lipid profiling and analytical discrimination of seven cereals using high temperature gas chromatography coupled to high resolution quadrupole time-of-flight mass spectrometry. Food Chem. 2019, 282, 27–35. [Google Scholar] [CrossRef] [PubMed] [Green Version]
  2. Sohail, M.; Rakha, A.; Butt, M.S.; Iqbal, M.J.; Rashid, S. Rice bran nutraceutics: A comprehensive review. Crit. Rev. Food Sci. 2017, 57, 3771–3780. [Google Scholar] [CrossRef] [PubMed]
  3. Pokkanta, P.; Sookwong, P.; Tanang, M.; Setchaiyan, S.; Boontakham, P.; Mahatheeranont, S. Simultaneous determination of tocols, γ-oryzanols, phytosterols, squalene, cholecalciferol and phylloquinone in rice bran and vegetable oil samples. Food Chem. 2019, 271, 630–638. [Google Scholar] [CrossRef]
  4. Yan, S.; Chen, J.; Zhu, L.; Guo, T.; Qin, D.; Hu, Z.; Han, S.; Wang, J.; Matias, F.B.; Wen, L.; et al. Oryzanol alleviates high fat and cholesterol diet-induced hypercholesterolemia associated with the modulation of the gut microbiota in hamsters. Food Func. 2022, 13, 4486–4501. [Google Scholar] [CrossRef] [PubMed]
  5. Doello, S.; Liang, Z.; Cho, I.K.; Kim, J.B.; Li, Q.X. Cytotoxic Effects of 24-Methylenecyloartanyl ferulate on A549 nonsmall cell lung cancer cells through MYBBP1A up-regulation and AKT and Aurora B kinase inhibition. J. Agric. Food Chem. 2018, 66, 3726–3733. [Google Scholar] [CrossRef] [PubMed]
  6. Rao, Y.P.C.; Sugasini, D.; Lokesh, B.R. Dietary gamma oryzanol plays a significant role in the anti-inflammatory activity of rice bran oil by decreasing pro-inflammatory mediators secreted by peritoneal macrophages of rats. Biochem. Biophys. Res. Commun. 2016, 479, 747–752. [Google Scholar] [CrossRef]
  7. Ghatak, S.B.; Panchal, S.S. Anti-diabetic activity of oryzanol and its relationship with the anti-oxidant property. Int. J. Diabetes Dev. Ctries. 2012, 32, 185–192. [Google Scholar] [CrossRef]
  8. Bucci, R.; Magrì, A.D.; Magrì, A.L.; Marini, F. Comparison of three spectrophotometric methods for the determination of γ-oryzanol in rice bran oil. Anal. Bioanal. Chem. 2003, 375, 1254–1259. [Google Scholar] [CrossRef]
  9. Endo, Y.; Aso, Y. Determination of gamma-oryzanol in refined rice bran oil by nuclear magnetic resonance method. J. Nutr. Sci. Vitaminol. 2019, S65, S72–S74. [Google Scholar] [CrossRef]
  10. Kaewsorn, K.; Sirisomboon, P. Study on evaluation of gamma oryzanol of germinated brown rice by near infrared spectroscopy. J. Innov. Opt. Health Sci. 2014, 7, 1450002. [Google Scholar] [CrossRef] [Green Version]
  11. Thongchai, W.; Liawruangrath, B. Determination of gamma oryzanol in rice bran oil by HPLC with molecularly imprinted solid-phase extraction. Int. Food Res. J. 2016, 23, 1389–1395. [Google Scholar]
  12. Stöggl, W.; Huck, C.; Wongyai, S.; Scherz, H.; Bonn, G. Simultaneous determination of carotenoids, tocopherols, and γ-oryzanol in crude rice bran oil by liquid chromatography coupled to diode array and mass spectrometric detection employing silica C30 stationary phases. J. Sep. Sci. 2005, 28, 1712–1718. [Google Scholar] [CrossRef]
  13. Yu, S.G.; Nehus, Z.T.; Badger, T.M.; Fang, N.B. Quantification of vitamin E and gamma-oryzanol components in rice germ and bran. J. Agric. Food Chem. 2007, 55, 7308–7313. [Google Scholar] [CrossRef] [PubMed]
  14. Zhu, D.; Nystrom, L. Differentiation of rice varieties using small bioactive lipids as markers. Eur. J. Lipid Sci. Technol. 2015, 117, 1578–1588. [Google Scholar] [CrossRef]
  15. Evershed, R.P.; Spooner, N.; Prescott, M.C.; Goad, L.J. Isolation and characterisation of intact steryl ferulates from seeds. J. Chromatogr. 1988, 440, 23–35. [Google Scholar] [CrossRef]
  16. Pereira-Caro, G.; Watanabe, S.; Crozier, A.; Fujimura, T.; Yokota, T.; Ashihara, H. Phytochemical profile of a Japanese black-purple rice. Food Chem. 2013, 141, 2821–2827. [Google Scholar] [CrossRef] [PubMed]
  17. Maryono; Herawati, N.; Gaffar, M.A.F.; Sartini; Aliyah; Wahyudin, E. Microwave-assisted extraction and identification of gamma-oryzanol from rice bran (Oryza sativa L. cv Ciliwung). Pharg. J. 2021, 13, 1242–1247. [Google Scholar]
  18. Angelis, A.; Urbain, A.; Halabalaki, M.; Aligiannis, N.; Skaltsounis, A. One-step isolation of gamma-oryzanol from rice bran oil by non-aqueous hydrostatic countercurrent chromatography. J. Sep. Sci. 2011, 34, 2528–2537. [Google Scholar] [CrossRef]
  19. Balachandran, C.; Mayamol, P.N.; Thomas, S.; Sukumar, D.; Sundaresan, A.; Arumughan, C. An ecofriendly approach to process rice bran for high quality rice bran oil using supercritical carbon dioxide for nutraceutical applications. Bioresour. Technol. 2008, 99, 2905–2912. [Google Scholar] [CrossRef]
  20. Sorouraddin, S.M.; Mogaddam, M.R.A. Development of molecularly imprinted-solid phase extraction combined with dispersive liquid–liquid microextraction for selective extraction and preconcentration of triazine herbicides from aqueous samples. J. Iran. Chem. Soc. 2016, 13, 1093–1104. [Google Scholar] [CrossRef]
  21. Farajzadeh, M.A.; Mohebbi, A.; Fouladvand, H.; Mogaddam, M.R.A. A new and facile method for preparation of amorphous carbon nanoparticles and their application as an efficient and cheap sorbent for the extraction of some pesticides from fruit juices. Microchem. J. 2020, 155, 104795. [Google Scholar] [CrossRef]
  22. Li, H.Y.; Yang, H.; Ma, C.Y.; Zhang, W.Y.; Xu, Q.Y.; Chen, M.X.; Ma, Y.N. Determination of three oryzanols in rice by mixed-mode solid-phase extraction coupled with high performance liquid chromatography-tandem mass spectrometry. Chin. J. Chromatogr. 2022, 40, 746–752. [Google Scholar] [CrossRef] [PubMed]
  23. Rossi, M.; Gianazza, M.; Alamprese, C.; Stanga, F. The role of bleaching clays and synthetic silica in palm oil physical refining. Food Chem. 2003, 82, 291–296. [Google Scholar] [CrossRef]
  24. Yao, Y.Z.; Liu, C.S.; Xiong, W.; Liang, Q.; Xuan, P.; Zeng, X.D.; Zeng, S.Q.; Zhou, Q.; Huang, F.H. Silicon dioxide as an efficient adsorbent in the degumming of rapeseed oil. J. Clean. Prod. 2020, 268, 122344. [Google Scholar] [CrossRef]
  25. Commission Decision of 14 August 2002 Implementing Council Directive 96/23/EC Concerning the Performance of Analytical Methods and the Interpretation of Results, Official Journal of the European Commission No. OJ L221. 17 August 2002. Available online: http://data.europa.eu/eli/dec/2002/657/oj (accessed on 30 December 2022).
  26. Wenzl, T.; Haedrich, J.; Schaechtele, A.; Robouch, P.; Stroka, J. Guidance Document for the Estimation of LOD and LOQ for Measurements in the Field of Contaminants in Feed and Food; Joint Research Centre, European Commission: Geel, Belgium, 2016. [Google Scholar]
  27. Waraksa, E.; Kowalski, K.; Kłodzinska, E.; Rola, R.; Ciekot, J.; Filipiak, W.; Bienkowski, T.; Namiesnik, J. A rapid and eco-friendly method for determination of the main components of gamma-oryzanol in equestrian dietary and nutritional supplements by liquid chromatography—Tandem mass spectrometry. J. Pharm. Biomed. Anal. 2019, 172, 339–348. [Google Scholar] [CrossRef] [PubMed]
  28. Commission Decision of 12 August 2002 Implementing Council Directive 96/23/EC Concerning the Performance of Analytical Methods and the Interpretation of Results (Text with EEA Relevance, Notified under Document Number C(2002) 3044), Official Journal of the European Commission Modified. Available online: https://eur-lex.europa.eu/legal-content/EN/TXT/?uri=CELEX%3A32002D0657&qid=1672370786868 (accessed on 30 December 2022).
  29. Lu, W.Y.; Niu, Y.G.; Yang, H.S.; Sheng, Y.; Shi, H.M.; Yu, L.L. Simultaneous HPLC quantification of five major triterpene alcohol and sterol ferulates in rice bran oil using a single reference standard. Food Chem. 2014, 148, 329–334. [Google Scholar] [CrossRef] [PubMed]
Figure 1. Optimization of SPE conditions for SPE sorbents (a), loading volume (b), type of washing solvents (c), washing volume (d), type of desorption solvents (e) and desorption volume (f).
Agriculture 13 00531 g001
Table 1. The linear range, calibration equation, correlation coefficients (R2), limit of detection (LOD) and limit of quantification (LOQ) for CF and 24-CF.
AnalyteLinear
Range
(μg kg−1)
Linear EquationR2LOD
(μg kg−1)
LOQ
(μg kg−1)
CF1.0–200.0Y = 28821.9X − 29653.20.99640.31.0
24-CF1.0–200.0Y = 25392.0X − 15358.00.99420.31.0
Table 2. Recoveries and precisions for the determination of CF and 24-CF in rice bran.
AnalyteRecovery (%, n = 6)Intra-Day Precision (RSD%, n = 6)Inter-Day Precision (RSD%, n = 6)
10 μg kg−150 μg kg−1100 μg kg−110 μg kg−150 μg kg−1100 μg kg−110 μg kg−150 μg kg−1100 μg kg−1
CF104.1087.6086.933.942.089.895.093.0410.84
24-CF108.7592.4091.255.837.9410.816.814.783.17
Recoveries and intra-day and inter-day precisions were investigated as mean value in sextuplicate analysis.
Table 3. Results for the determination of γ-oryzanol compounds in agriproducts.
Samplesγ-Oryzanol Concentrations (µg kg−1)
CF24-CF
MaxMinMeanMaxMinMean
Rice
(n = 10)
29.2 × 103559.84.1 × 10321.7 × 103573.63.6 × 103
Corn
(n = 10)
853.2134.9529.2195.442.2150.9
Rice bran
(n = 20)
325.9 × 1032.1 × 10334.3 × 103322.8 × 1034.1 × 10342.6 × 103
Corn germ
(n = 10)
1.9 × 103471.2769.6447.7178.8286.9
Table 4. Comparison of preparation techniques and LOQs with the reported methods.
MatrixAnalytesPreparation TechniqueDeterminationPreparation Time
(min)
LOQsRecoveriesRef.
Rice bran oilγ-oryzanolDilution with n-hexaneUV detector5 min--[8]
Rice bran oilMajor triterpene alcohol and sterol ferulatesSPEHPLC-UV25 min0.50~0.60 μg mL−195.1~99.4%[29]
Thai purple rice bran oilγ-oryzanolMolecularly imprinting polymer SPEHPLC-DAD45 min5.7 μg mL−1101.22~118.45%[11]
Germinated brown riceγ-oryzanolLiquid-to-liquid extractionHPLC-DAD-FLD25 min0.632~2.166 μg kg−199.4~102.9%[3]
Riceγ-oryzanolSPEUPLC-HR-Q-TOF-MS60 min--[14]
Riceγ-oryzanolSPEHPLC-MS/MS30 min2.0~3.5 μg L−186.1~110.6%[22]
Rice branγ-oryzanolSPEUHPLC–MS/MS30 min1.0 μg kg−186.93~108.75%This study
Disclaimer/Publisher’s Note: The statements, opinions and data contained in all publications are solely those of the individual author(s) and contributor(s) and not of MDPI and/or the editor(s). MDPI and/or the editor(s) disclaim responsibility for any injury to people or property resulting from any ideas, methods, instructions or products referred to in the content.

