Article

Nitrogen Nutrition Differentially Affects Concentrations of Photosynthetic Pigments and Antioxidant Compounds in Mexican Marigold (Tagetes erecta L.)

by
María Guadalupe Peralta-Sánchez
1,
Fernando C. Gómez-Merino
2,3,
Olga Tejeda-Sartorius
4 and
Libia I. Trejo-Téllez
1,2,*
1
Laboratory of Plant Nutrition, Department of Soil Science, College of Postgraduates in Agricultural Sciences Campus Montecillo, Montecillo, Texcoco 56264, State of Mexico, Mexico
2
Department of Genetic Resources and Productivity-Plant Physiology, College of Postgraduates in Agricultural Sciences Campus Montecillo, Montecillo, Texcoco 56264, State of Mexico, Mexico
3
Laboratory of Plant Tissue Culture, Department of Sustainable Agri-Food Innovation, College of Postgraduates in Agricultural Sciences Campus Córdoba, Manuel León, Amatlán de los Reyes 94953, Veracruz, Mexico
4
Genetic Resources and Productivity-Fruticulture, College of Postgraduates in Agricultural Sciences Campus Montecillo, Montecillo, Texcoco 56264, State of Mexico, Mexico
*
Author to whom correspondence should be addressed.
Agriculture 2023, 13(3), 517; https://doi.org/10.3390/agriculture13030517
Submission received: 27 January 2023 / Revised: 16 February 2023 / Accepted: 19 February 2023 / Published: 21 February 2023
(This article belongs to the Topic Natural Compounds in Plants)

Abstract

:
Nitrogen is a major plant macronutrient and its supply affects the entire metabolism of plants. This study evaluated the effect of different nitrogen concentrations in the nutrient solution: 0, 4.2, 8.4, and 12.6 mg L−1 Mexican marigold (Tagetes erecta L.) var. Inca plants in an open soilless culture system under greenhouse conditions on the concentration of chlorophylls, carotenoids, phenolics, and flavonoids derived from the secondary metabolism, as well as on the antioxidant activity in different tissues. With the 12.6 mg N L−1 dose, chlorophylls a, b, and total chlorophyll concentrations increased by 98.8, 11.9, and 56.6%, respectively. The highest concentrations of total carotenoids in flowers, 28–30%, were recorded in plants with doses of 8.4 mg N L−1. With doses of 12.6 mg N L−1, phenolic compounds and total flavonoids increased in leaves, but decreased in flowers. The low and medium N concentrations increased the antioxidant activity with respect to the control without N by 53% and 50.2%, respectively. We conclude that the applications of N in Tagetes erecta differentially affected the concentrations of photosynthetic pigments and biomolecules with antioxidant capacity, and that such effects were dependent on the doses of N tested and the plant organ evaluated.

1. Introduction

Plants are capable of synthesizing various compounds with antioxidant properties [1]. These compounds include ascorbic acid, glutathione, proline, phenolic acids, flavonoids, chlorophylls, and carotenoids, among others [1,2], which can be found in practically all cell compartments [3].
In non-photosynthetic organs such as fruits, seeds, roots, and flowers, carotenoids act as photoprotectors, antioxidants, and attractants. For example, in Japanese pit-tosporum (Pittosporum tobira (Thunb.) W. T. Aiton), the red dry-carotenoids called tobiraxanthin A, B, C, and D attract birds that disperse its seeds and are precursors of plant hormones, stimulate flower growth, and trigger stress responses [4].
On the other hand, the structures of phenolic compounds (phenolic acids and polyphenols) with attached hydroxyl groups give them antioxidant capacity [5]. Polyphenols include flavonoids, phenolic acids, and tannins, among others.
Within the Asteraceae family, the largest within the angiosperms, there are species that are a source of natural antioxidants with therapeutic, edible, and ornamental uses [6]. In ornamental species within this family (i.e., Asteraceae), the chemical composition of plant tissues has been little investigated. Such composition may potentially include secondary metabolites with important biological activity both for plants and humans [1,7].
Among the species of the Asteraceae family, special attention has been paid to the Mexican marigold (Tagetes erecta L.), which is native to Mexico and is used for ornamental, medicinal, and food purposes [8]. The main pigments present in this species are flavonoids and carotenoids [9]. In the petals of its inflorescences, 20 times more carotenoids are synthesized and accumulated than in leaves [8]. Importantly, different factors affect the synthesis and accumulation of such compounds in plant tissues [6]. Among such factors, nutrient supply has been demonstrated to significantly influence the synthesis of bioactive molecules in plants [10].
Nitrogen (N) is the major macronutrient for plants, being a key component of nucleic acids, amino acids, proteins, some hormones, and chlorophylls, among others. This essential element modulates the biosynthesis of secondary metabolites such as flavonoids, glucosinolates, and carotenoids, among others [11], as well as chlorophylls [12], although differential results have been observed between species. In kale (Brassica oleraea L. var. acephala DC), increasing N supply stimulated the concentration of lutein and β- [13]. Likewise, N supply stimulated the synthesis of lutein, zeaxanthin, and β-carotene in parsley (Petroselinum crispum Nym.) [14].
Nevertheless, N can also decrease the biosynthesis and accumulation of active substances in different plant species [15]. In Kacip Fatimah (Labisia pumila), the highest total production of phenolic compounds was in the absence of N [11]. In lavender (Lavandula angustifolia Mill.) flowers, the polyphenol content decreased when applying high nitrogen fertilization [16]. In mustard (Brassica juncea Coss), when increasing the nitrogen dose from 0 to 25 mM in the nutrient solution, the concentrations of total phenolic compounds decreased [17]. Furthermore, the application of 120 to 160 kg N ha−1 caused a significant decrease in the content of flavonoids in pot marigold (Calendula officinalis L. ‘Tokaj’) flowers [18].
In different Tagetes species, N may improve vegetative growth and stimulate flower blooming after the application of 110 kg N ha−1, increasing the number of flowers per plant and floral yield [19]. Moreover, through optimal N nutrition, it is possible to improve the longevity and quality of Tagetes flowers [20]. Nevertheless, few studies have addressed the importance of N in the secondary metabolism of Tagetes erecta L. The objective of this study was to analyze the effect of different concentrations of N on the biosynthesis of photosynthetic pigments and biomolecules with antioxidant capacity in this species, established in hydroponics under greenhouse conditions.

2. Materials and Methods

2.1. Experimental Conditions and Plant Material

The study was carried out in hydroponics under greenhouse conditions, with mean day and night temperature of 27 and 13.5 °C, and relative humidity of 37 and 85%, respectively. The photoperiod had a duration of 11.5 h and an average photosynthetic photon flux (PPF) of 720 µmol m−2 s−1. When Mexican marigold (Tagetes erecta L.) var. Inca seedlings reached 21 days old, they were transplanted into 1 L capacity black plastic pots containing an inert mixture of tezontle:perlite (60:40, v:v) as substrate. The tezontle had an average particle size of 3 mm. The experimental area was 140 m2.
In soilless systems, the N doses normally range from 180 to 230 mg/L in nutrient solutions with closed irrigation systems, in which the nutrient solution is reused for several days. In our study, a soilless culture with an open irrigation system was used. Furthermore, five irrigations per day of 50 mL were applied in each pot. This experimental management required the use of diluted nutrient solutions, with the aim of not increasing the electrical conductivity in the substrate.

2.2. Experiment Management

After transplantation, seedlings were irrigated with water for 4 d. Water used for the initial irrigation was taken from a deep water well and had the following chemical composition (molc m−3): 0.294 NO3, 0.062 H2PO4, 0.186 SO42−, 0.1 K+, 1.356 Ca2+, and 2.527 Mg2+. Subsequently, irrigation was performed using Steiner’s nutrient solution [21] at 5% of its original strength, which was prepared with reagent grade salts (J. T. Baker, Phillipsburg, NJ, USA) and supplemented with micronutrients from the Tradecorp AZ™ commercial product, at the concentrations described by Trejo-Téllez et al. [22]. The pH of the nutrient solution was adjusted to 5.5 with H2SO4 1 N. Once adjusted, the nutrient solution was supplied through a drip irrigation system. Five irrigations per day of 50 mL were carried out in each pot. Irrigation was programmed using a timer and supplied with ½ HP pumps. In order to avoid any influence from environmental and agronomic conditions prior to the start of treatments, all flower buds were removed from the plants 30 days after transplantation.

2.3. Evaluated Treatments

The application of treatments began 30 days after transplantation (dat), at the beginning of flowering. Treatments evaluated consisted of applying different nitrogen concentrations in the nutrient solution: 0, 4.2, 8.4, and 12.6 mg L−1. In order to guarantee the absence of N in the first dose to be applied, we used distilled water in the formulation of the nutrient solutions with the different doses of N. Chemicals used were reagent grade salts provided by J. T. Baker (USA). Table 1 shows the compounds and their amounts used in the preparation of the nutrient solutions.

2.4. Experimental Design

The experimental design used was completely randomized, with 140 replicates per treatment. The experimental unit consisted of a pot with a single plant.

2.5. Study Variables

2.5.1. Chlorophylls a, b, Total Chlorophylls, and Chlorophyll a/Chlorophyll b Ratio

Leaf chlorophyll concentration was determined 30 days after the start of treatments (dast), in extracts obtained from a triple ethanolic extraction as described by Harbone [23]. The phase separation was conducted through centrifugation (14,000 rpm, 5 min, 4 °C), and a 65 μL aliquot was taken from the obtained extract and 170 μL of 98% ethanol was added in the same reaction tube. The reaction sample was vortexed and read on a spectrophotometer (Thermo Scientific Multiskan GO, Walthan, MA, USA), at wavelengths of 645 and 665 nm. With the chlorophyll a and b concentration values, their ratio of such molecules was estimated.

2.5.2. Total Carotenoids

The inflorescences were harvested by hand when all the buds reached their highest anthesis (36 dast). Harvested inflorescences were dried in a forced air oven (Felisa FE291AD; Guadalajara, Mexico) at 40 °C for 48 h. Subsequently, the samples were weighed on an analytical scale (Ohaus Adventurer Pro; Parsippany, NJ, USA), finely ground, and stored in plastic containers with a lid at 4 °C, for later analysis.
The extraction technique of total carotenoids in flowers was carried out with the method described by Nagata et al. [24]. The extract absorbances were measured in a spectrophotometer (Thermo Scientific, Multiskan GO; Walthan, MA, USA) at 453, 503, 645, and 663 nm wavelengths. To estimate total carotenoids, the following formula was used: Total carotenoids (mg 100 mL−1) = (0.216 × A663) − (1.220 × A645) − (0.304 × A505) + (0.452 × A453).

2.5.3. Total Phenolic Compounds

Total phenolic compounds were determined in leaves and inflorescences. The extraction was conducted according to the Folin and Ciocalteu method described by Waterman and Mole [25], using the methodology for solid plant material. A mass of 100 mg of plant material was taken, to which 500 µL of 80% methanol was added at 4 °C and centrifuged for 20 min at 15,000 rpm. After centrifugation, a volume of 50 µL of the supernatant was taken, adding 50 µL of deionized water and 100 µL of the Folin reagent; the preparation was vortexed, and after 1 min, a volume of 200 µL 20% Na2CO3 was added. The reaction mixture was left at rest for 2 h in the darkness. The determination was carried out in the spectrophotometer (Thermo Fisher Scientific Genesys 10 UV, Madison, WI, USA) at 760 nm using gallic acid as standard. Gallic acid is an antioxidant compound commonly found in extracts of T. erecta, along with gallicin, quercetagetin, 6-hydroxykaempferol-O-hexoside, and patuletin-O-hexoside [26].

2.5.4. Total Flavonoids

Total flavonoid concentrations were evaluated in leaves and inflorescences, following the methodologies described by Ghasemki et al., Ebrahimzadeh et al., and Nanyonga et al. [27,28,29], with some modifications. A mass of 75 mg dry plant material was taken, adding 1.5 mL of 80% methanol, and incubated for 1 h at 70 °C. After incubation, the mixture was centrifuged for 20 min at 15,000 rpm. From the supernatant, a volume of 200 µL was taken, adding 600 µL of 80% methanol, 40 µL of 10% aluminum chloride, 40 µL of 1 M potassium acetate, and 1120 µL of distilled water. The reaction mixture was left to rest for 40 min at room temperature in the darkness. The samples obtained were analyzed in the aforementioned Genesys 10 UV spectrophotometer, at 415 nm using quercetin as standard.

2.5.5. Antioxidant Activity

The determination of the antioxidant activity in leaves and inflorescences was carried out following the methodologies described by Castañeda et al., Chizzola et al., Ibarra et al., and Kuskoski et al. [30,31,32,33], with some modifications. We took 100 mg of fresh plant material, and after adding 1.5 mL of 60% ethanol, the mixture was left to rest for 24 h at 4 °C. Subsequently, the mixture was centrifuged for 20 min at 15,000 rpm, and from the supernatant, 400 µL was taken, adding 600 µL 80% methanol. A volume of 1 mL of 2,2-diphenyl-1-picrylhydracil free radical (DPPH) was added to the mixture, which was then incubated for 60 min at room temperature in the darkness. Once the incubation ended, samples were read in the Genesys 10 UV spectrophotometer at a wavelength of 517 nm. Trolox (6-hydroxy-2,5,7,8-tetramethylchroman-2-carboxylic acid) was used as standard.

2.6. Statistical Analysis of the Results

The data obtained were statistically analyzed according to the established experimental design. An analysis of variance (ANOVA) was performed using the SAS statistical package [34]. Means were compared with the Tukey test (p ≤ 0.05).

3. Results

Different N doses applied through the nutrient solution to Mexican marigold plants 30 dast triggered different growth and reproductive responses (Figure 1). Control plants (without receiving N) were shorter, and developed fewer flowers, as compared to the rest of the treatments tested. In the treatments that included N supply, the size and number of flowers were proportional to the amount of macronutrient applied.
Our results demonstrate that the concentration of N can be adjusted to 12.6 mg L−1 instead of 168 mg N L−1 recommended in the original formulation of Steiner’s nutrient solution at 100% of its strength [21]. Furthermore, the experimental conditions tested here show that we can apply five irrigations per day in an open hydroponic system to produce high quality marigold flowers under greenhouse conditions.

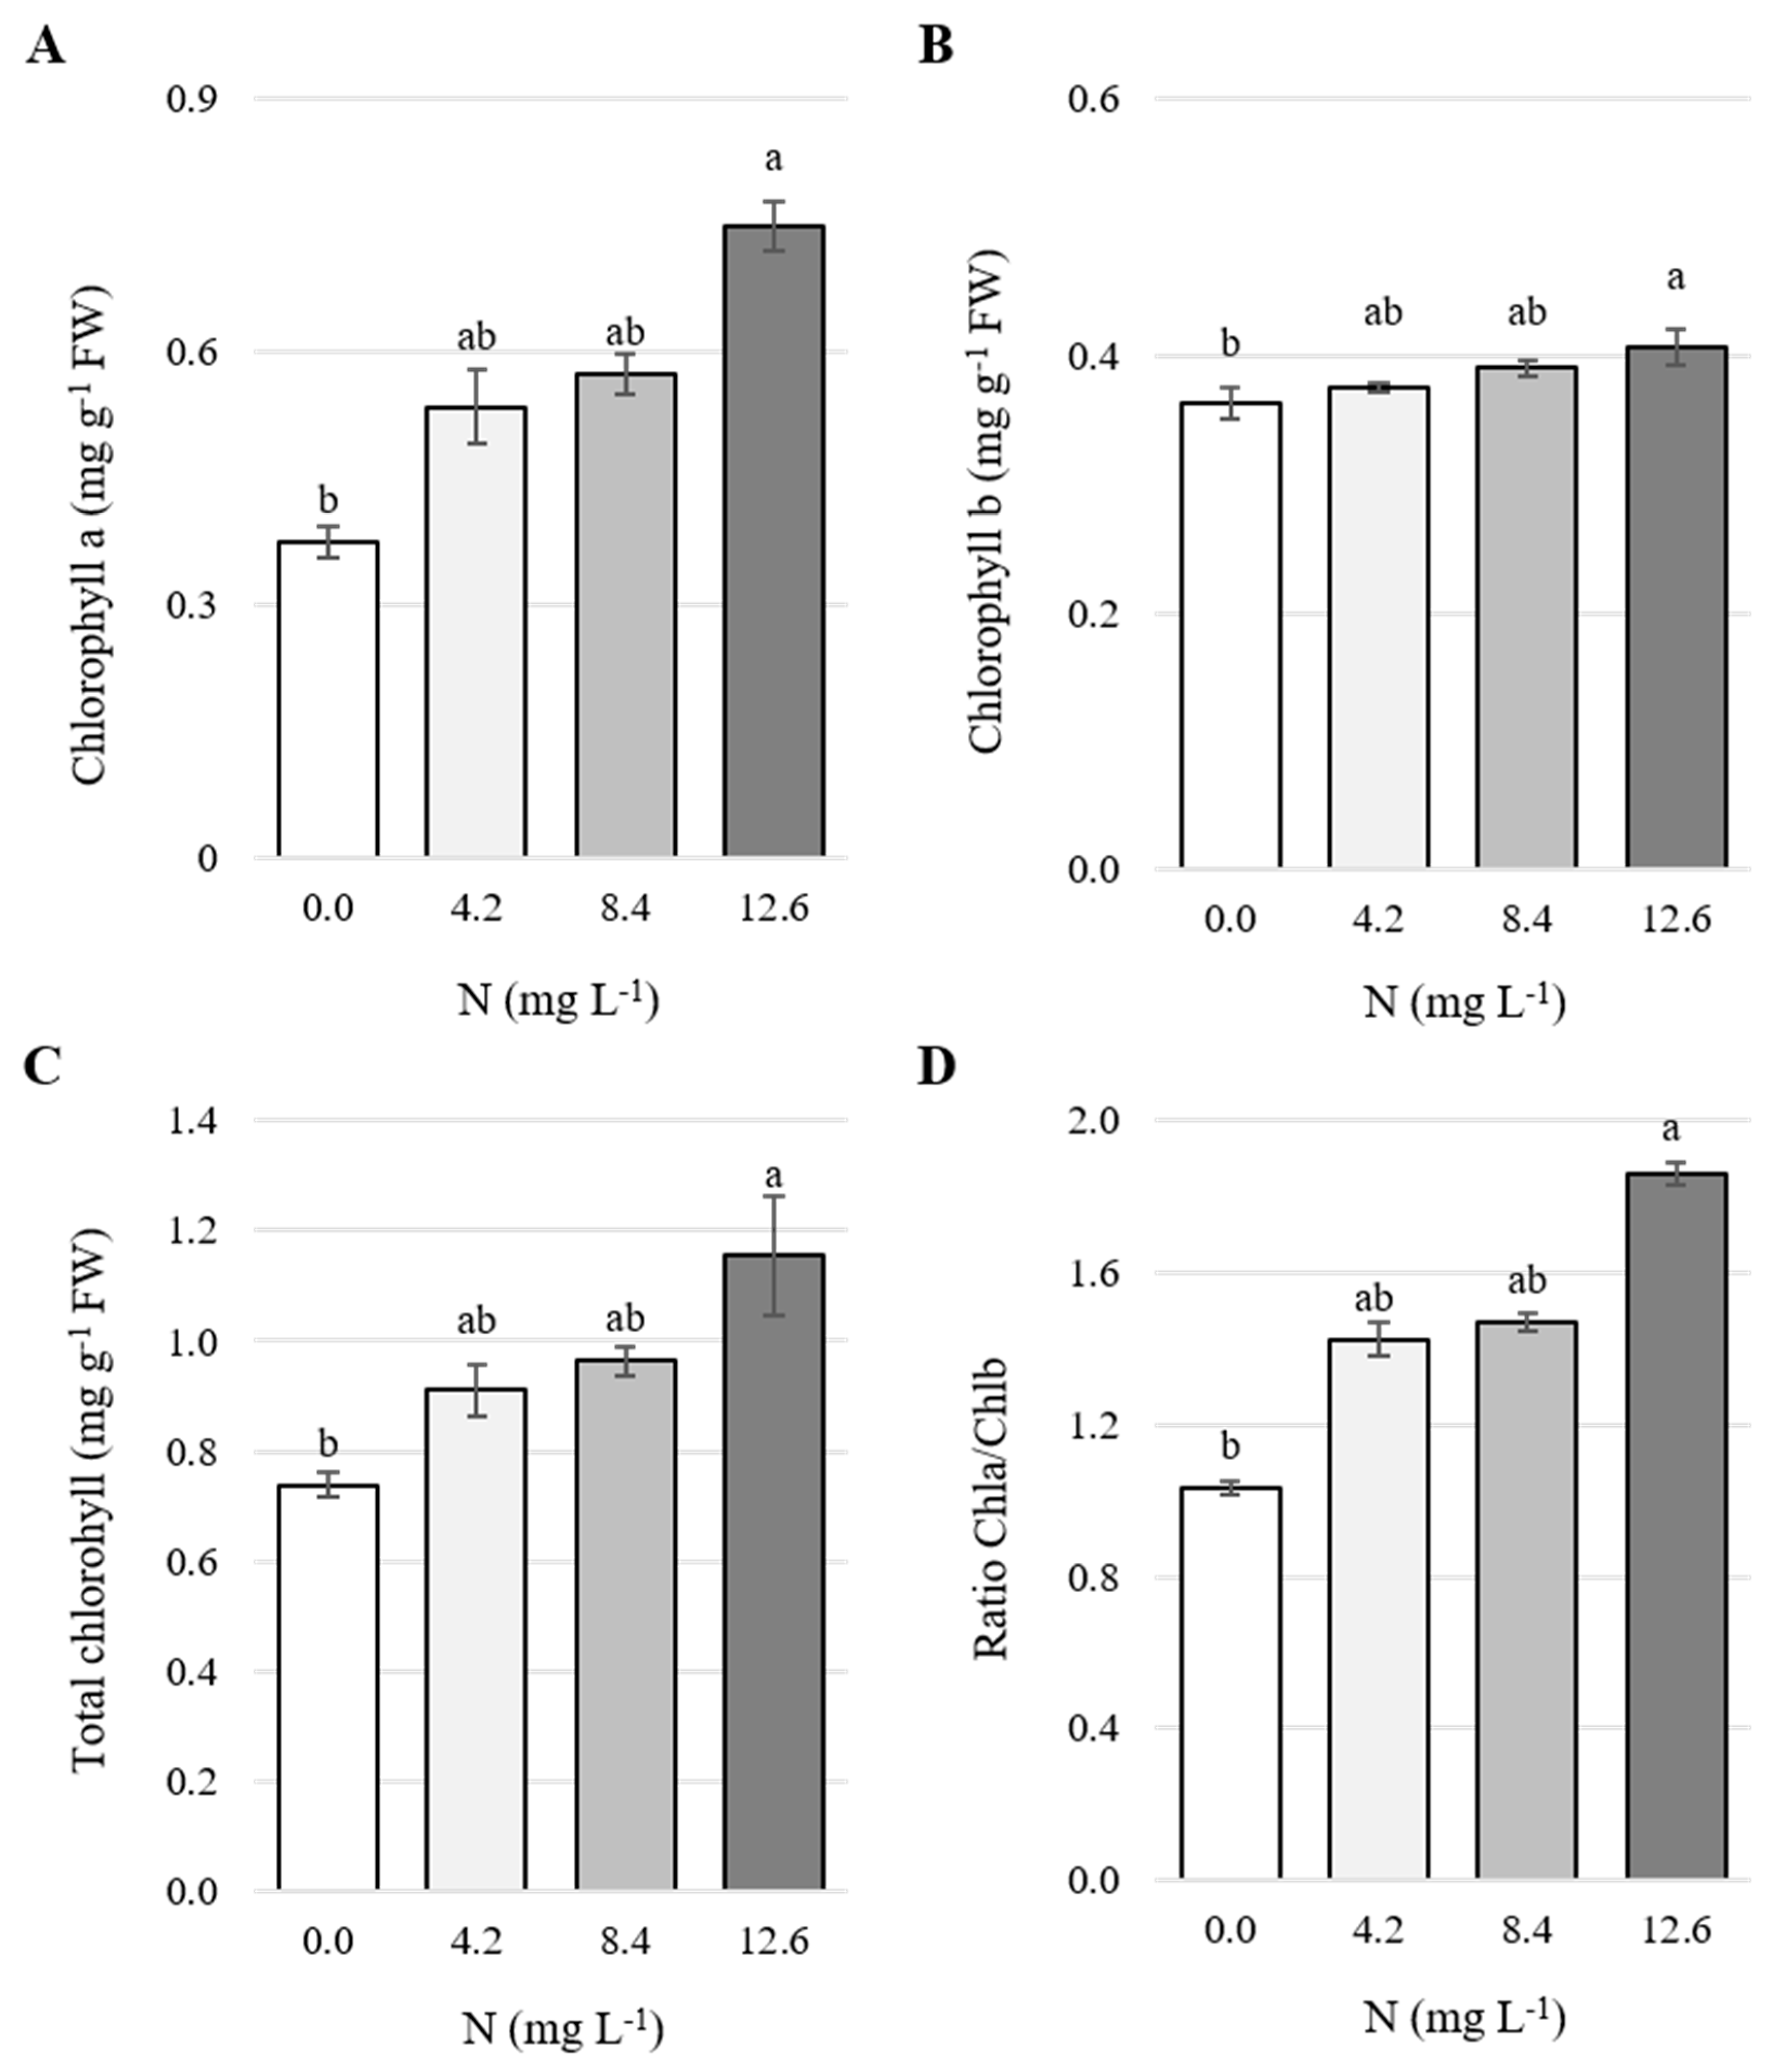
3.1. Concentration of Chlorophylls in Leaves

In this study, the 12.6 mg N L−1 dose significantly increased the concentrations of chlorophylls a, b, and total chlorophylls by 99.8, 11.9, and 56.6%, respectively, compared to the control (Figure 2A–C). This same trend was observed in the chlorophyll a/b ratios (Figure 2D).

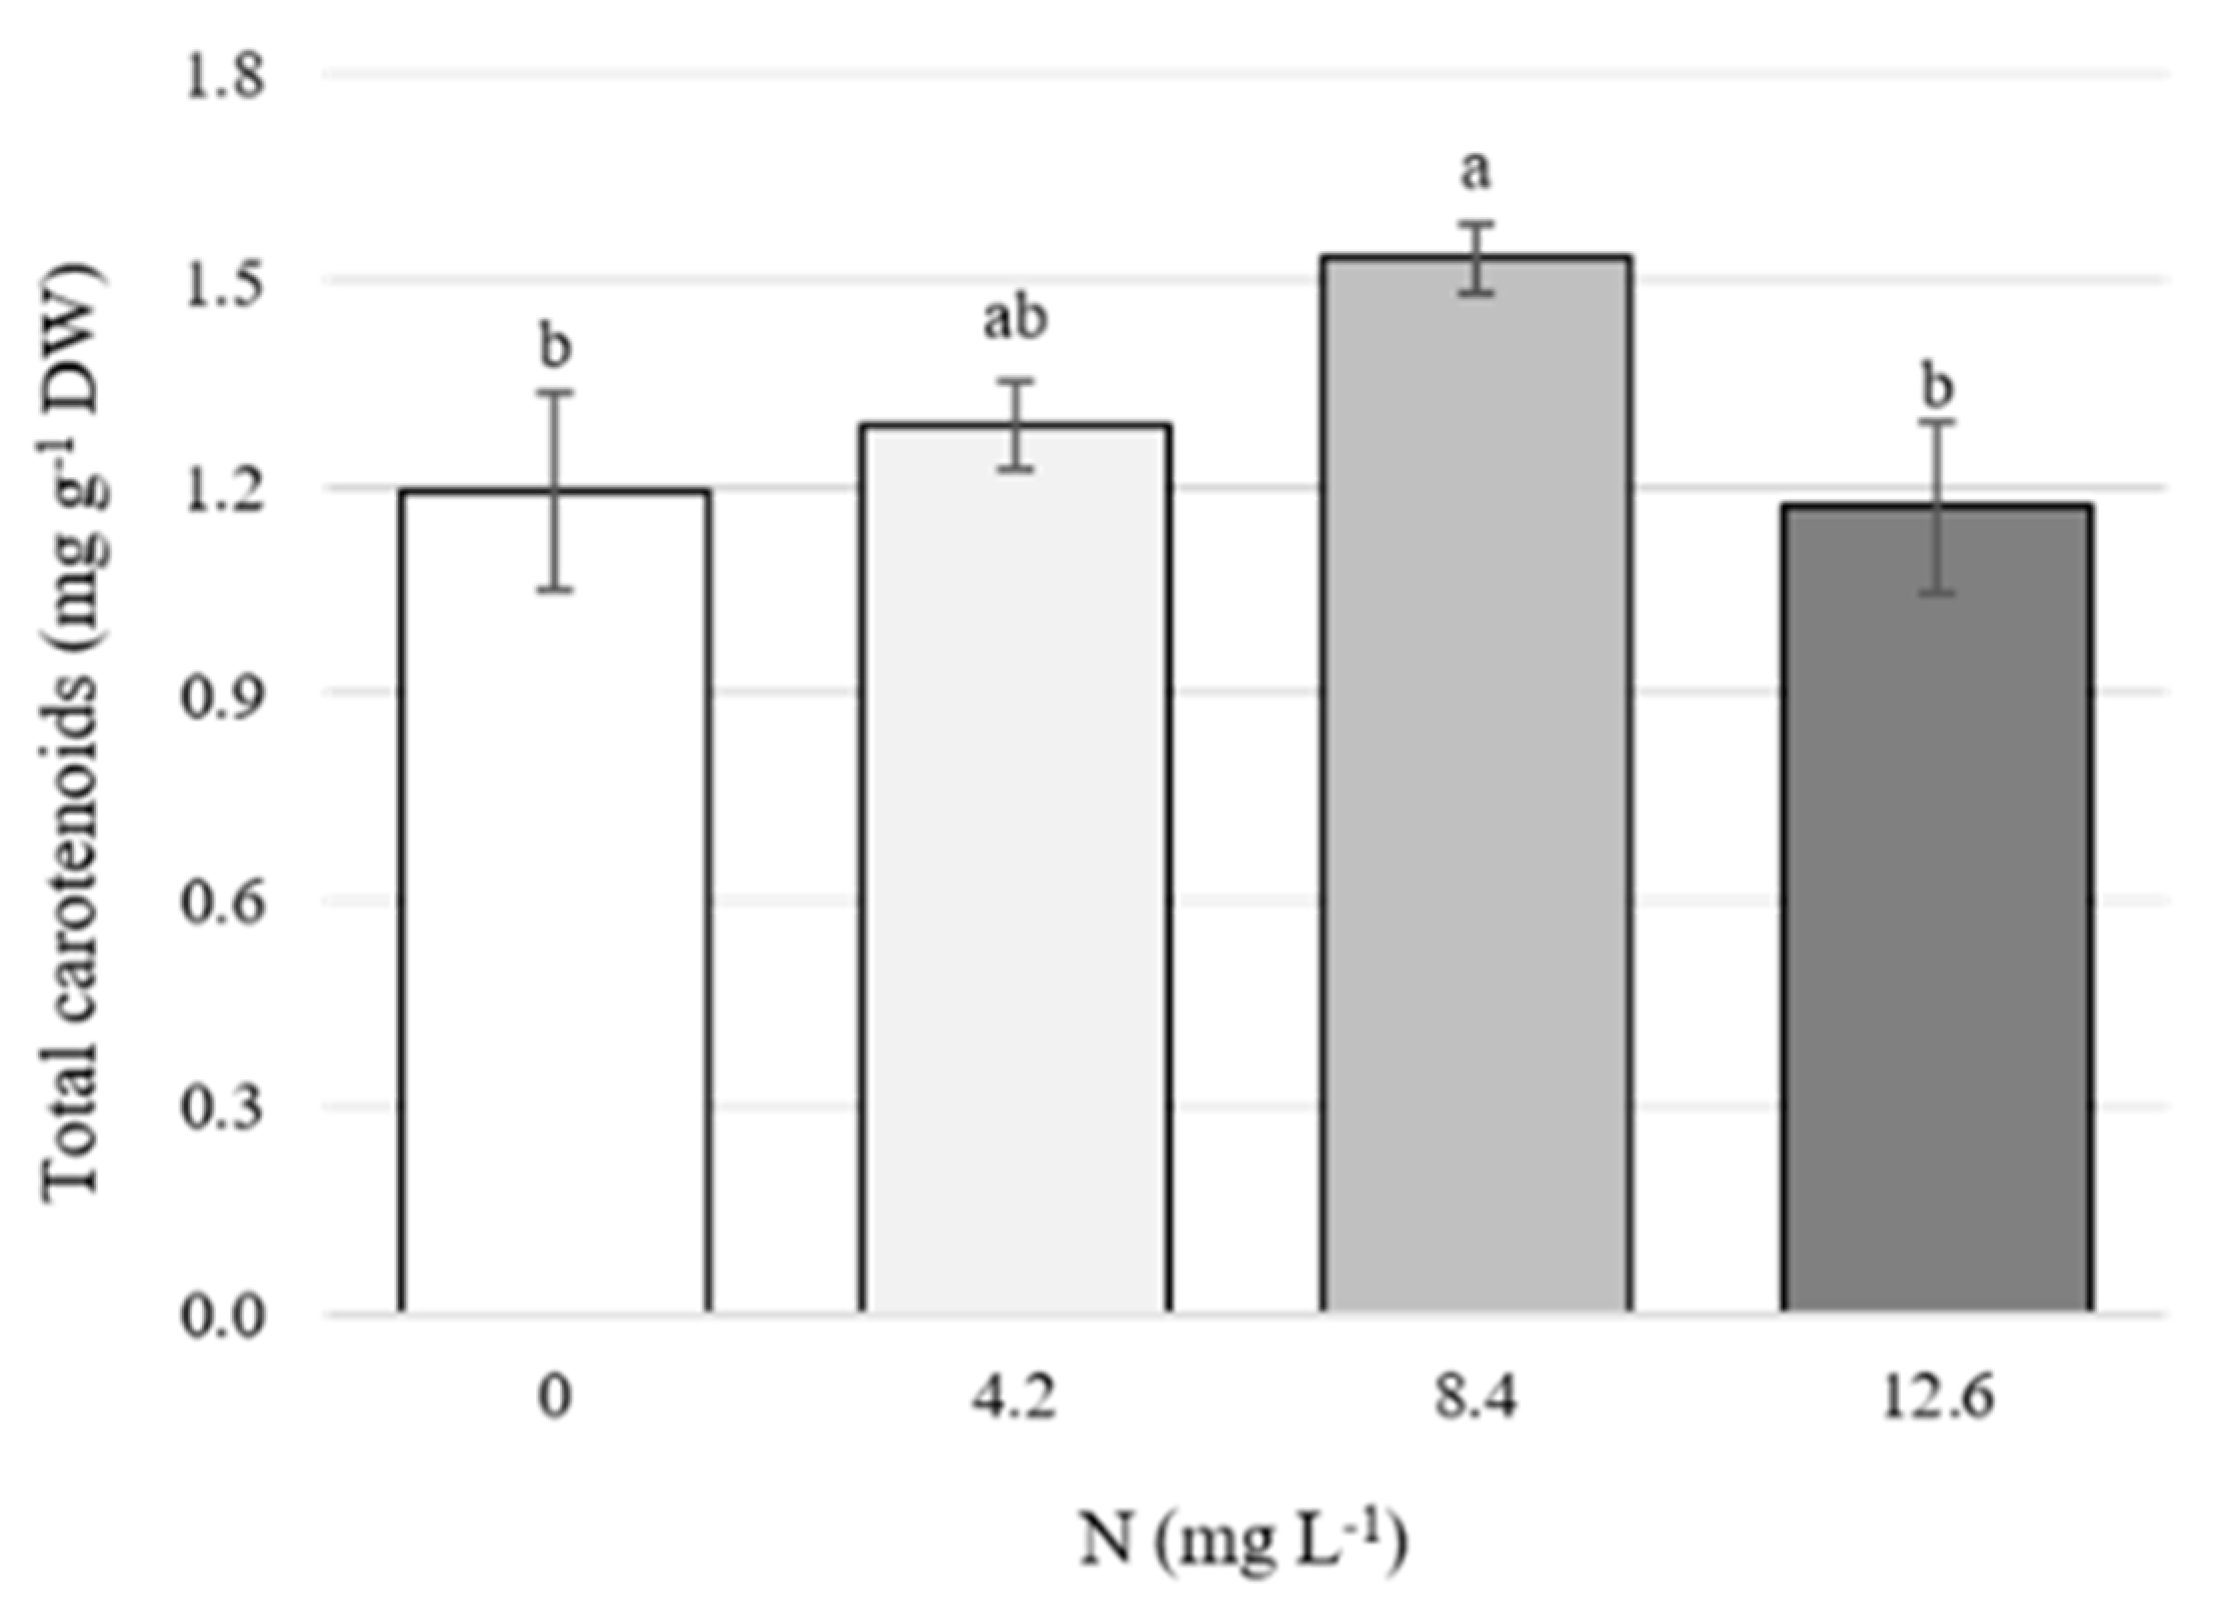
3.2. Concentrations of Total Carotenoids in Flowers

In this study, the highest concentrations of total carotenoids in flowers were recorded in plants treated with 8.4 mg N L−1 in the nutrient solution, with values 28.3% higher than the control (Figure 3).

3.3. Concentration of Total Phenols in Leaves and Flowers

In leaves, in general, there is no evidence of an effect of N on the concentration of total phenolic compounds. The highest mean was obtained in the control treatment, and this is not statistically different from the results obtained with the intermediate and high N doses evaluated (8.4 and 12.6 mg L−1) (Figure 4A). Interestingly, the lowest concentration was observed in leaves of plants treated with 4.2 mg N L−1.
In flowers, the highest concentration of total phenolic compounds was recorded with the lowest N dose applied, which significantly exceeded the control, by 36% (Figure 4B). In this study, leaves and flowers showed a marked difference regarding the concentration of total phenolic compounds, being higher in flowers, regardless of the N dose applied (Figure 4).

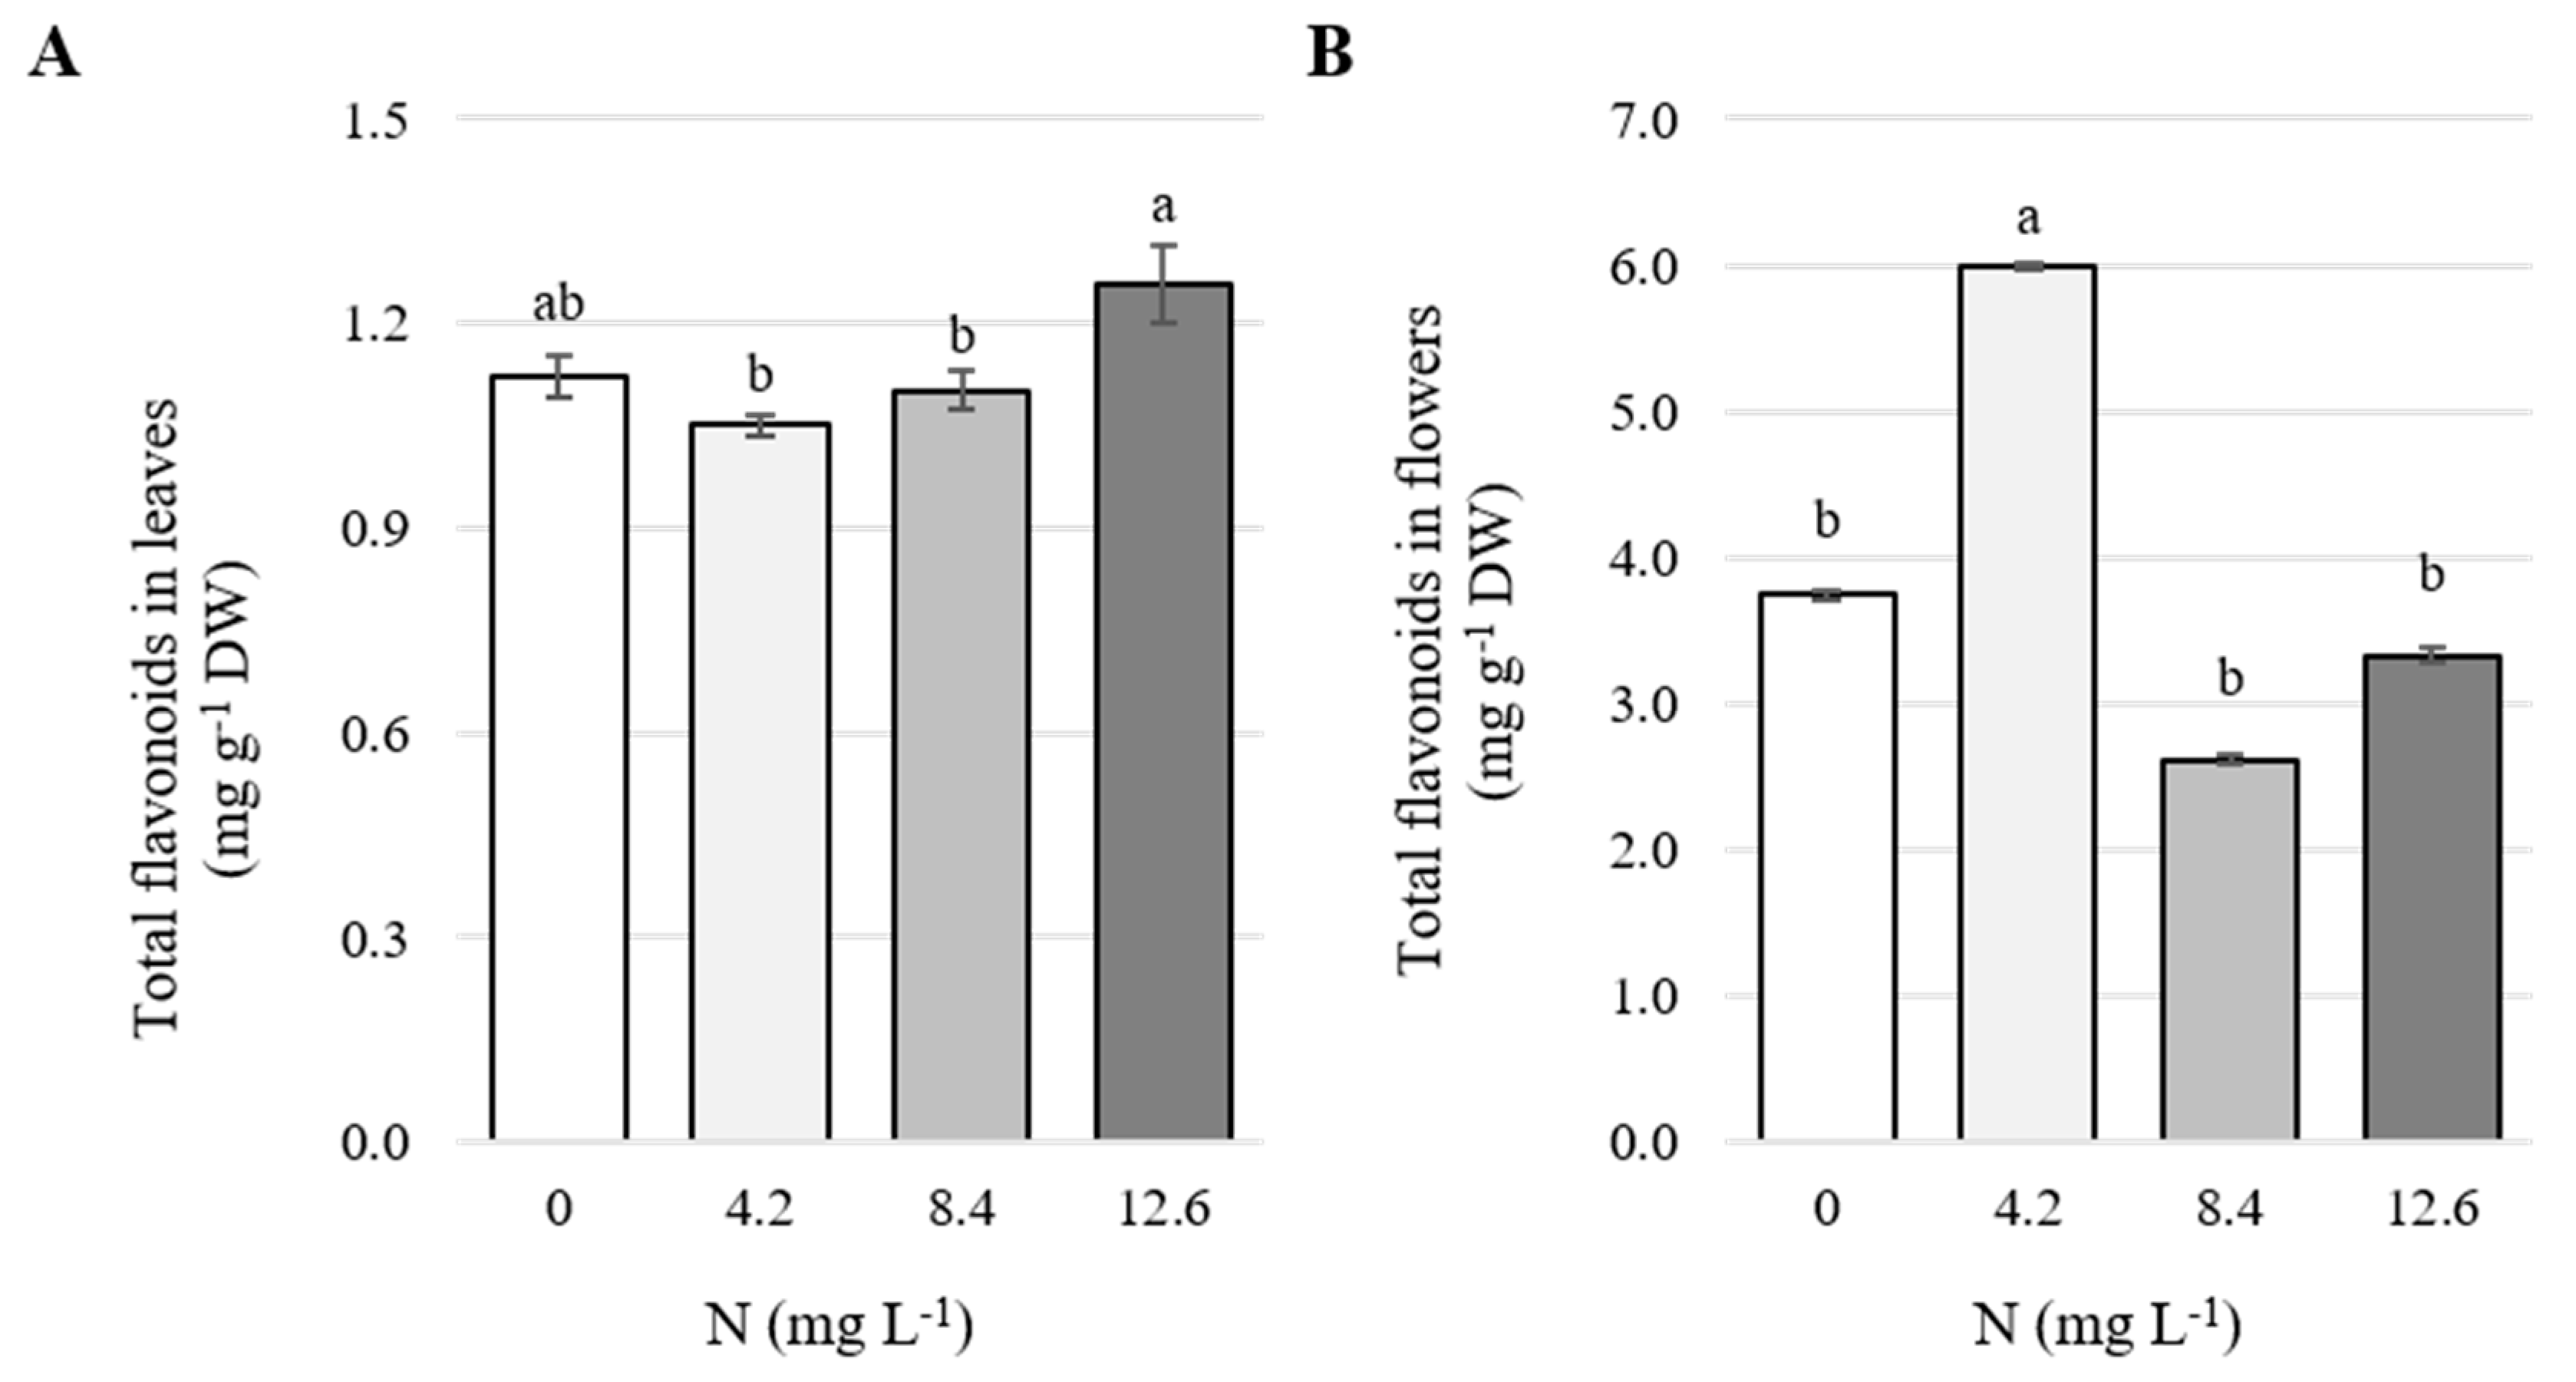
3.4. Concentration of Total Flavonoids in Leaves and Flowers

In leaves, the treatment with the highest N dose surpassed the concentration of flavonoids compared to those with the lowest and medium doses by 19.6% and 14.1%, respectively (Figure 5A).
In flowers, the lowest N dose supplied (4.2 mg L−1) increased the concentration of total flavonoids by 60% compared to the control, whereas the medium (8.4 N L−1) and highest doses (12.6 mg N L−1) increased it by 128.9 and 79.9%, respectively (Figure 5B).

3.5. Antioxidant Activity in Flowers

The low and medium N concentrations (i.e., 4.2 and 8.4 mg L−1) increased the antioxidant activity compared to the control without N by 53 and 50.2%, respectively (Table 2).

4. Discussion

4.1. Concentration of Chlorophylls

One of the biochemical parameters most related to the nitrogen status in plants is the chlorophyll content, since most of N is a structural constituent of this molecule [12]. Increasing concentrations of chlorophylls coincide with the increase in the N supply in Tagetes erecta L. [26,35,36], Tagetes spp. [20]. Likewise, in other species such as pinto peanut (Arachis pintoi Krapov. & W. C. Greg.) [37], sugarcane (Saccharum spp. Hybrids) [12], Chinese wingnut (Cyclocarya paliurus [Batalin] Iljinsk.) [15], and maize (Zea mays L.) [38], increases in the concentration of chlorophylls have been observed due to N applications. Furthermore, N has an important role in the formation of chloroplasts [39] and promotes the absorption of Mg, a structural element of chlorophyll [40]. Thus, high N levels in leaf tissue may influence chlorophyll concentrations, as 50–70% of the N present in the leaves is a constituent of chlorophylls a and b, and carotenoids bound to chloroplasts, providing raw material for the Calvin cycle [41]. Photosynthesis requires a large quantity of proteins, such as Rubisco and the light-capturing complex, which represents 69–75% of N in leaves. Furthermore, 25–31% of N constitutes non-photosynthetic components such as cell wall, mitochondria, peroxisomes, and cytosol [42]. Chlorophylls a and b are essential for the primary reaction of photosynthesis. Therefore, the total chlorophyll concentration and the chlorophyll a/b ratio directly influence the photosynthetic capacity of the plant [43]. Under our experimental conditions, the highest level of N applied resulted in the highest concentration of chlorophylls, as compared to the control. This finding may explain, at least in part, the stimulated growth and flower yield observed in plants exposed to the highest N concentration in the nutrient solution (i.e., 12.6 mg N L−1) compared to the control.

4.2. Concentration of Total Carotenoids in Flowers

Carotenoids are responsible for the yellow to red coloring in flowers [44]. Contrary to what is observed in our study, in lavender flowers, high N doses caused significant increases in carotenoids [16]. In Tagetes erecta L. [35] and kale leaves, increasing N doses increased the concentration of carotenoids [13]. In parsley, increases in lutein, zeaxanthin, and β-carotene were reported when increasing the nitrogen dose [14]. Likewise, in tomato fruits, a positive relationship has been observed between the N dose and the content of total carotenoids [45] and lutein [46].
Carotenoids show qualitative differences according to organs and plant species. More than 90% of the carotenoids in Tagetes petals are lutein and its derivatives [44]. Its inflorescences are commercially valuable as a natural source of lutein pigments (yellow-orange) where they are found forming esters with different fatty acids [47]. Lutein is a natural antioxidant and main pigment present in Tagetes erecta L. [9], and this species may contain approximately 80–90% of lutein in its flowers [8].
The relative amount of nitrogen as ammonium to nitrate as a total nitrogen concentration has been stated to have a distinctive effect on carotenoid production [48]. As previously mentioned, N is the most important macronutrient in the biosynthesis of chlorophyll and carotenoids, but the application of N can produce differential effects. The inverse correlation between N concentration and carotenoids observed in this study may be due to the optimal availability of N, which plays a vital role in cell division and formation of active photosynthetic pigments [49].

4.3. Concentration of Total Phenolic Compounds in Leaves and Flowers

In this study, the difference in phenolic compounds between plant organs analyzed can be attributed to the fact that N deficiency induces photosynthesis inhibition, growth retardation, loss of chlorophyll, and leaf senescence; therefore, N deficiency stimulates the phenylpropanoid metabolism and particularly induces the accumulation of phenylalanine ammonium lyase (PAL) [50], the first enzyme that participates in this metabolic pathway and that degrades phenylalanine into ammonium and transcinnamic acid.
The flowers of Tagetes erecta are rich in phenolic compounds [7], although fertilization with N and P may reduce the ability of the plant to synthetize such molecules. Phenylalanine is a key amino acid for the synthesis of phenolic compounds, although under normal conditions, it participates preferentially in protein synthesis [51,52]. The inverse relationship between nitrogen nutrition and phenolic compounds can be explained with the protein competition model, which establishes that when biomass increases in response to high N nutrition, phenolic concentrations decrease due to increased demand of proteins for growth, and reduces the partition of carbon skeletons to phenolic compounds [53]. On the other hand, the accumulation of polyphenols might be induced by the carbon/nitrogen ratio in the plant. That is, nitrogen-based metabolites change to carbon metabolites under nitrogen-deficient conditions [54]. In Tagetes erecta plants without N supply, 22.9% increases in gallic acid concentration were recorded, compared to plants fertilized with N [7]. In lavender leaves, high doses of nitrogen fertilization produced a higher concentration of polyphenols, although in flowers, low N doses were those which stimulated the biosynthesis of said polyphenols [16], which is similar to our study in Mexican marigold flowers. Likewise, similar results were observed in wheat (Triticum aestivum L. ssp. aestivum) [55] and Kacip Fatimah [11] in response to different N supply.
However, in blueberry (Vaccinium corybosum L.), when increasing the nitrogen dose, the concentration of phenolic compounds in leaves decreased by 49% [56]. Similar reductions due to the effect of N have also been observed in sesame (Sesanum indicum L.) seeds [50]. In grape (Vitis vinifera L.), the low availability of nitrogen during flowering improved the biosynthesis of phenolic compounds, mainly flavonol glycosides [57].
Although numerous studies have investigated the influence of nitrogen fertilization on the content of phenolic compounds, the results are not conclusive due to the diversity of responses observed [58].
The higher concentration of these compounds found in flowers of some species may be due to a higher content of specialized metabolites derived from aromatic amino acids that originate particularly from phenylalanine and include benzenoids and phenylpropanoids [59].

4.4. Concentrations of Total Flavonoids in Leaves and Flowers

In Kacip Fatimah leaves a negative relationship between the applied nitrogen concentration and the total flavonoid concentration was observed. When increasing the N dose from 0 to 90 kg ha−1, the concentration of flavonoids decreased by 41.8%, while it increased by 43.8% and 57.8% when the N dose increased from 0 to 180 and from 0 to 270 kg ha−1, respectively [10,11]. In artichoke (Cynara scolymus L.), increasing levels of N stimulate growth, but reduce the concentration of total flavonoids [52], and therefore, for medicinal use, it is recommended to apply low N doses. In amaranth (Amaranthus hypochondriacus L.) stems and leaves of the Abukussa 7 variety, there was an increase in the content of total flavonoids (30.6 mg g−1 GAE) in control plants without N supply [60].
In calendula, the flowers of plants receiving the highest nitrogen doses (120 and 160 kg ha−1) had lower contents of phenolic compounds [18]. In sesame seeds, as the N dose increases, the content of total flavonoids decreases [50].
There is an inverse relationship between the concentration of flavonoids and the supply of N in plants. Under N deficiency conditions, the phenylalanine concentration increases as a result of restriction in protein synthesis [52]. The shikimate pathway provides phenylalanine not only for protein synthesis, but also for the synthesis of secondary metabolites such as flavonoids [61]. Thus, N can regulate flavonoid biosynthesis by controlling the allocation of C flux between the primary and secondary metabolism [15]. According to the hypothesis of the carbon/nitrogen balance (CNB), the concentrations of carbon-based secondary metabolites (i.e., terpenes, phenolic compounds, etc.) that only have C, H, and O in their structure are inversely correlated with the availability of N [57]. The accumulation of polyphenolic compounds could be due to the induction of defense mechanisms in plants to cope with the nutritional stress caused by N deficiency [60]. In fact, flavonoid content increases in response to N and P depletion in plants, and manipulation of these macroelements can be used to control the levels of desirable compounds and improve plant quality [61].

4.5. Antioxidant Activity in Flowers

In lavender flowers, the highest antioxidant activity was obtained with the low N dose [16]. In Indian mustard (Brassica juncea Coss) leaves, increasing the applications of N decreases the activity of the DPPH radical [17], which has also been observed in Kacip Fatimah [10], artichoke [52], and wheat [62]. In sesame seeds, the total antioxidant activity was reduced by the high level of N applied [51]. In tomato, a reduction of the inhibition of the DPPH radical from 65.40% to 40.64% was reported when increasing the levels of applied N [45].

5. Conclusions

Under our experimental conditions, N supply differentially affected the concentrations of the molecules measured and the antioxidant activity according to the concentration tested (i.e., 0.0, 4.2, 8.4, and 12.6 mg N L−1), and the organ measures (i.e., leaves or flowers). Increasing doses of nitrogen raised the concentration of the photosynthetic pigments, such as chlorophylls a, b, and total, which confirms the relationship that exists between N and the structural part of chlorophyll molecules. The concentration of carotenoids was highest with the dose of 8.4 mg N L−1 in flowers. Total phenolic compounds and flavonoids increased in leaves with doses of 12.6 mg N L−1, but decreased in flowers. The concentration of phenolic compounds and flavonoids in flowers increased with a low N dose (4.2 mg L−1). Likewise, the antioxidant activity in flowers increased with the low and intermediate level of N. In general, the concentrations of antioxidant compounds analyzed showed an inverse correlation with the nitrogen doses applied.

Author Contributions

Conceptualization, L.I.T.-T. and F.C.G.-M.; methodology, M.G.P.-S. and L.I.T.-T.; software, L.I.T.-T. and O.T.-S.; validation, F.C.G.-M. and O.T.-S.; formal analysis, L.I.T.-T.; investigation, M.G.P.-S.; resources, L.I.T.-T.; writing—original draft preparation, M.G.P.-S. and F.C.G.-M.; writing—review and editing, L.I.T.-T.; supervision, L.I.T.-T.; project administration, F.C.G.-M.; funding acquisition, L.I.T.-T. All authors have read and agreed to the published version of the manuscript.

Funding

This study was partially financed by the Mexico’s National Council of Science and Technology (CONACYT). The funding sponsor had no role in the design of the study; in the collection, analyses, or interpretation of data; in the writing of the manuscript, and in the decision to publish the results.

Institutional Review Board Statement

Not applicable.

Data Availability Statement

The data presented in this study are available on request from the corresponding author. The data are not publicly available due to space restrictions.

Conflicts of Interest

The authors declare no conflict of interest. The funders had no role in the design of the study; in the collection, analyses, or interpretation of data; in the writing of the manuscript, or in the decision to publish the results.

References

  1. Kasote, D.M.; Katyare, S.S.; Hegde, M.V.; Bae, H. Significance of antioxidant potential of plants and its relevance to therapeutic applications. Int. J. Biol. Sci. 2015, 11, 982–991. [Google Scholar] [CrossRef] [Green Version]
  2. Pérez-Gálvez, A.; Viera, I.; Roca, M. Carotenoids and chlorophylls as antioxidants. Antioxidants 2020, 9, 505. [Google Scholar] [CrossRef] [PubMed]
  3. Caverzan, A.; Casassola, A.; Patussi, B.S. Reactive oxygen species and antioxidant enzymes involved in plant tolerance to stress. In Abiotic and Biotic Stress in Plants; Shanker, A.K., Shanker, C., Eds.; Intech Open: Rijeka, Croatia, 2016; pp. 463–480. [Google Scholar] [CrossRef] [Green Version]
  4. Maoka, T. Carotenoids as natural functional pigments. J. Nat. Med. 2020, 74, 1–16. [Google Scholar] [CrossRef] [PubMed] [Green Version]
  5. Minatel, I.O.; Vanz, B.C.; Ferreria, M.I.; Gomez, G.H.A.; Chen-Yen, O.C.; Pereira, L.G.P. Phenolic compounds: Functional properties, impact of processing and bioavailability. In Phenolic Compounds. Biological Activity; Soto-Hernández, M., Palma-Tenango, M., García-Mateos, M.R., Eds.; Intech Open: Rijeka, Croatia, 2017; pp. 1–24. [Google Scholar]
  6. Bessada, S.M.F.; Barreira, J.C.M.; Oliveira, M.B.P.P. Asteraceae species with most prominent bioactivity and their potential applications: A review. Ind. Crops Prod. 2015, 76, 604–615. [Google Scholar] [CrossRef]
  7. Burlec, A.F.; Arsene, C.; Gille, E.; Hăncianu, M.; Cioancă, O. Ornamental Asteraceae species as new sources of secondary metabolites. Indian J. Pharm. Educ. Res. 2017, 51, 425–428. [Google Scholar] [CrossRef] [Green Version]
  8. Mir, R.A.; Ahanger, M.A.; Agarwal, R.M. Marigold: From mandap to medicine and from ornamentation to remediation. Am. J. Plant Sci. 2019, 10, 309–338. [Google Scholar] [CrossRef] [Green Version]
  9. Siddhu, N.; Saxena, J. Evaluation of in vitro antioxidant activity of flowers of Tagetes erecta. Int. J. Pharmacogn. Phytochem. Res. 2017, 9, 975–979. [Google Scholar] [CrossRef] [Green Version]
  10. Ibrahim, M.H.; Jaafar, H.Z.E.; Rahmat, A.; Rahman, Z.A. Involvement of nitrogen of flavonoids, glutathione, anthocyanin, ascorbic acid and antioxidant activities of Malaysian medicinal plant Labisia pumila Blume (Kacip Fatimah). Int. J. Mol. Sci. 2012, 13, 393–408. [Google Scholar] [CrossRef] [Green Version]
  11. Ibrahim, M.H.; Jaafar, H.Z.E.; Rahmat, A.; Rahman, Z.A. Effects of nitrogen fertilization on synthesis of primary and secondary metabolites in three varieties of Kacip Fatimah (Labisia pumila Blume). Int. J. Mol. Sci. 2011, 12, 5238–5254. [Google Scholar] [CrossRef]
  12. Bassi, D.; Menossi, M.; Mattiello, L. Nitrogen supply influences photosynthesis establishment along the sugarcane leaf. Sci. Rep. 2018, 8, 2327. [Google Scholar] [CrossRef] [Green Version]
  13. Kopsell, D.A.; Kopsell, D.E.; Curran-Celentano, J. Carotenoid pigments in kale are influenced by nitrogen concentration and form. J. Sci. Food Agric. 2007, 87, 900–907. [Google Scholar] [CrossRef]
  14. Chenard, C.H.; Kopsell, D.A.; Kopsell, D.E. Nitrogen concentration affects nutrient and carotenoid accumulation in parsley. J. Plant Nutr. 2005, 28, 285–297. [Google Scholar] [CrossRef]
  15. Deng, B.; Li, Y.; Xu, D.; Ye, Q.; Liu, G. Nitrogen availability alters flavonoid accumulation in Cyclocarya paliurus via the effects on the internal carbon/nitrogen balance. Sci. Rep. 2019, 9, 2370. [Google Scholar] [CrossRef] [PubMed] [Green Version]
  16. Biesiada, A.; Sokół-Łętowska, A.; Kucharska, A. The effect of nitrogen fertilization on yielding and antioxidant activity of lavender (Lavandula angustifolia Mill.). Acta Sci. Pol. Hortorum Cultus 2008, 7, 33–40. [Google Scholar]
  17. Li, J.; Zhu, Z.; Gerendás, J. Effects of nitrogen and sulfur on total phenolics and antioxidant activity in two genotypes of leaf mustard. J. Plant Nutr. 2008, 31, 1642–1655. [Google Scholar] [CrossRef]
  18. Król, B. The effect of different nitrogen fertilization rates on yield and quality of marigold (Calendula officinalis L. Tokaj) raw material. Acta Agrobot. 2011, 64, 29–34. [Google Scholar] [CrossRef] [Green Version]
  19. Shafiullah, M.I.; Shah, F.A.; Khan, T.; Khan, T.; Ahmad, I.; Shahid, M.A.; Khan, S. Response of Marigold (Tagetes erecta L.) to different levels of nitrogen at Bagh E Naran Park Peshawar. Int. J. Environ. Sci. Nat. Res. 2018, 14, 555873. [Google Scholar] [CrossRef]
  20. Souri, M.K.; Rahmani, R.; Ahmadi, M.; Rezainejad, A. Morphophysiological and nutrient uptake characteristics of marigold (Tagetes spp.) under different levels of nitrogen fertilization. Horticult. Int. J. 2018, 2, 63–66. [Google Scholar] [CrossRef] [Green Version]
  21. Steiner, A. The universal nutrient solution. In Proceedings of the 6th International Congress on Soilless Culture, Lunteren, The Netherlands, 29 April–5 May 1984; pp. 633–649. [Google Scholar]
  22. Trejo-Téllez, L.I.; Peralta-Sánchez, M.G.; Gómez-Merino, F.C.; Rodríguez-Mendoza, M.N.; Serrato-Cruz, M.A.; Arévalo-Becerril, A.E. Sodium chloride on dry biomass and macronutrient cations absorption in cempasúchil (Tagetes erecta Linn.). Rev. Mex. Cienc. Agríc. 2013, 4, 979–990. [Google Scholar]
  23. Harbone, J.B. Clorophyll extraction. In Phytochemical Methods: A Guide to Modern Techniques of Plant Analysis; Harbone, J.B., Ed.; Chapman and Hall: London, UK, 1973; pp. 205–207. [Google Scholar]
  24. Nagata, M.; Yamashita, I. Simple method for simultaneous determination of chlorophyll and carotenoids in tomato fruit. Nippon Shokuhin Kogyo Gakkaish 1992, 39, 925–928. [Google Scholar] [CrossRef] [Green Version]
  25. Waterman, P.G.; Mole, S. Analysis of Phenolic Plant Metabolites, 1st ed.; Blackwell Scientific Publications: Oxford, UK, 1994; 238p. [Google Scholar]
  26. Gong, Y.; Liu, X.; He, W.-H.; Xu, H.-G.; Yuan, F.; Gao, Y.-X. Investigation into the antioxidant activity and chemical composition of alcoholic extracts from defatted marigold (Tagetes erecta L.) residue. Fitoterapia 2012, 83, 481–489. [Google Scholar] [CrossRef] [PubMed]
  27. Ghasemi, K.; Ghasemi, Y.; Ebrahimzadeh, M.A. Antioxidant activity, phenol and flavonoid contents of 13 citrus species peels and tissues. Pak. J. Pharm. Sci. 2009, 22, 227–281. [Google Scholar]
  28. Ebrahimzadeh, M.A.; Pourmorad, F.; Bekhradnia, A.R. Iron chelating activity, phenol and flavonoid content of some medicinal plants from Iran. Afr. J. Biotechnol. 2008, 7, 3188–3192. [Google Scholar]
  29. Nanyonga, S.K.; Opoku, A.R.; Lewu, F.B.; Oyedeji, O.O.; Singh, M.; Oyedeji, A.O. Antioxidant activity and cytotoxicity of the leaf and bark extracts of Tarchonanthus camphorates. Trop. J. Pharm. Res. 2013, 12, 377–383. [Google Scholar] [CrossRef] [Green Version]
  30. Castañeda, C.B.; Ramos, L.E.; Ibáñez, V.L. Evaluación de la capacidad antioxidante de siete plantas medicinales peruanas. Rev. Horiz. Méd. 2008, 8, 56–72. [Google Scholar]
  31. Chizzola, R.; Michistschs, H.; Franz, C. Antioxidative properties of Thymus vulgaris leaves: Comparison of different extracts and essential oil chemotypes. J. Agri. Food Chem. 2008, 56, 6897–6904. [Google Scholar] [CrossRef] [PubMed]
  32. Ibarra, E.E.; Pacheco, S.M.; García, M.R.; San Miguel, C.R.; Ramírez, V.G.; Soto, H.R.M. Actividad antioxidante de alcaloides de Erythrina americana Miller. Rev. Fitotec. Mex. 2011, 34, 241–246. [Google Scholar]
  33. Kuskoski, E.M.; Asuero, A.G.; Troncoso, A.M.; Mancini-Filho, J.; Fett, R. Aplicación de diversos métodos químicos para determinar actividad antioxidante en pulpa de frutos. Ciênc. Tecnol. Aliment. 2005, 25, 726–732. [Google Scholar] [CrossRef] [Green Version]
  34. SAS Institute Inc. SAS/STAT Users Guide, Version 9.3; SAS Institute Inc.: Cary, NC, USA, 2011. [Google Scholar]
  35. Hassanain, M.A.; Osman, A.R.; Sewedan, E.; El-Dein, M.S. Influence of nitrogen and yeast on production of marigold plants Tagetes erecta. World Rural Observ. 2018, 10, 37–46. [Google Scholar] [CrossRef]
  36. Polara, N.D.; Gajipara, N.N.; Barad, A.V. Effect of nitrogen and phosphorus nutrition on growth, flowering, flower yield and chlorophyll content of different varieties of African marigold (Tagetes erecta L.). J. Appl. Hortic. 2015, 17, 44–47. [Google Scholar] [CrossRef]
  37. Porto, S.R.M.; Deitos, F.D.; Vieira, P.A.J.; Bonomo, P.; Silva, S.I.; Nascimento, C.C.; Rodriguez, B.P.H.; Santos, B.M. Chlorophyll and carbohydrates in Arachis pintoi plants under influence of water regimes and nitrogen fertilization. Rev. Bras. Zootec. 2013, 42, 388–394. [Google Scholar] [CrossRef] [Green Version]
  38. Abubakar, A.W.; Manga, A.A.; Kamara, A.Y.; Tofa, A.I. Physiological evaluations of maize hybrids under low nitrogen. Adv. Agric. 2019, 2019, 1–6. [Google Scholar] [CrossRef] [Green Version]
  39. Bojović, B.; Marković, A. Correlation between nitrogen and chlorophyll content in wheat (Triticum aestivum L.). Kragujev. J. Sci. 2009, 31, 69–74. [Google Scholar]
  40. Gárate, A.; Bonilla, I. Nutrición mineral y producción vegetal. In Fundamento de Fisiología Vegetal; Azcón-Bieto, J., Talón, M., Eds.; McGraw-Hill Interamericana: Barcelona, España, 2009; pp. 113–129. [Google Scholar]
  41. Fornari, Z.E.; Gaviraghi, L.; Basso, C.J.; Pinheiro, M.M.V.; Vian, A.L.; Santi, A.L. Relationship between photosynthetic pigments and corn production under nitrogen sources. Pesqui. Agropecu. Trop. 2020, 50, e63661. [Google Scholar] [CrossRef]
  42. Wang, S.; Guan, K.; Wang, Z.; Ainsworth, E.A.; Zheng, T.; Townsend, P.A.; Li, K.; Moller, C.; Wu, G.; Jiang, C. Unique contributions of chlorophyll and nitrogen to predict crop photosynthetic capacity from leaf spectroscopy. J. Exp. Bot. 2021, 72, 341–354. [Google Scholar] [CrossRef] [PubMed]
  43. Croft, H.; Chen, J.M.; Luo, X.; Bartlett, P.; Chen, B.; Staebler, R.M. Leaf chlorophyll content as a proxy for leaf photosynthetic capacity. Glob. Chang. Biol. 2016, 23, 3513–3524. [Google Scholar] [CrossRef] [Green Version]
  44. Tanaka, Y.; Sasaki, N.; Ohmiya, A. Biosynthesis of plant pigments: Anthocyanins, betalains and carotenoids. Plant J. 2008, 54, 733–749. [Google Scholar] [CrossRef] [PubMed]
  45. Porto, J.S.; Reboucas, T.N.H.; Moraes, M.O.B.; Bomfim, M.P.; Lemos, O.L.; Luz, J.M.Q. Quality and antioxidant activity of tomato cultivated under different sources and doses of nitrogen. Rev. Caatinga Mossoró 2016, 29, 780–788. [Google Scholar] [CrossRef] [Green Version]
  46. Zhang, E.; Duan, Y.; Tan, F.; Zhang, S. Effects of long-term nitrogen and organic fertilization on antioxidants content of tomato fruits. J. Hortic. 2016, 3, 1–5. [Google Scholar] [CrossRef] [Green Version]
  47. Gupta, P. Carotenoids of therapeutic significance from marigold. Nat. Prod. Chem. Res. 2014, 2, e110. [Google Scholar] [CrossRef] [Green Version]
  48. Legha, M.R.; Prasad, K.V.; Singh, S.K.; Kaur, C.; Arora, A.; Kumar, S. Induction of carotenoid pigments in callus cultures of Calendula officinalis L. in response to nitrogen and sucrose levels. In Vitro Cell. Dev. Biol.-Plant 2012, 48, 99–106. [Google Scholar] [CrossRef]
  49. Razaq, M.; Zhang, P.; Hai-long, S.; Salahuddin. Influence of nitrogen and phosphorous on the growth and root morphology of Acer mono. PLoS ONE 2017, 12, e0171321. [Google Scholar] [CrossRef] [PubMed] [Green Version]
  50. Prinsi, B.; Negrini, N.; Morgutti, S.; Espen, L. Nitrogen starvation and nitrate or ammonium availability differently affect phenolic composition in green and purple basil. Agronomy 2020, 10, 498. [Google Scholar] [CrossRef] [Green Version]
  51. Elhanafi, L.; Houhou, M.; Rais, C.; Mansouri, I.; Elghadraoui, L.; Greche, H. Impact of excessive nitrogen fertilization on the biochemical quality, phenolic compounds, and antioxidant power of Sesamum indicum L. seeds. J. Food Qual. 2019, 2019, 1–6. [Google Scholar] [CrossRef] [Green Version]
  52. Allahdadi, M.; Farzane, P. Influence of different levels of nitrogen fertilizer on some phytochemical characteristics of artichoke (Cynara scolymus L.) leaves. J. Med. Plants Stud. 2018, 6, 109–115. [Google Scholar]
  53. Onyango, C.M.; Harbinson, J.; Imungi, J.K.; Onwonga, R.N.; van Kooten, O. Effect of nitrogen source, crop maturity stage and storage conditions on phenolics and oxalate contents in vegetable amaranth (Amaranthus hypochondriacus). J. Agric. Sci. 2012, 4, 219–230. [Google Scholar] [CrossRef] [Green Version]
  54. Becker, C.; Urlić, B.; Špika, M.J.; Kläring, H.P.; Krumbein, A.; Baldermann, S.; Ban, S.G.; Perica, S.; Schwarz, D. Nitrogen limited red and green leaf lettuce accumulate flavonoid glycosides, caffeic acid derivatives, and sucrose while losing chlorophylls, β-carotene and xanthophylls. PLoS ONE 2015, 10, e0142867. [Google Scholar] [CrossRef]
  55. Stumpf, B.; Yan, F.; Honermeier, B. Influence of nitrogen fertilization on yield phenolic compounds in wheat grains (Triticum aestivum L. ssp. aestivum). J. Plant Nutr. Soil Sci. 2019, 182, 111–118. [Google Scholar] [CrossRef] [Green Version]
  56. Yañez-Mansilla, E.; Cartes, P.; Reyes-Díaz, M.; Ribera-Fonseca, A.; Rengel, Z.; Lobos, W.; Alberdi, M. Leaf nitrogen thresholds ensuring high antioxidant features of Vaccinium corymbosum cultivars. J. Soil Sci. Plant Nutr. 2015, 15, 574–586. [Google Scholar] [CrossRef]
  57. Heimler, D.; Romani, A.; Ieri, F. Plant polyphenol content, soil fertilization and agricultural management: A review. Eur. Food Res. Technol. 2017, 243, 1107–1115. [Google Scholar] [CrossRef]
  58. Amarowicz, R.; Cwalina-Ambroziak, B.; Janiak, M.A.; Bogucka, B. Effect of N fertilization on the content of phenolic compounds in Jerusalem Artichoke (Helianthus tuberosus L.) tubers and their antioxidant capacity. Agronomy 2020, 10, 1215. [Google Scholar] [CrossRef]
  59. Peled-Zehavi, H.; Oliva, M.; Xie, Q.; Tzin, V.; Oren-Shamir, M.; Aharoni, A.; Galili, G. Metabolic engineering of the phenylpropanoid and its primary, precursor pathway to enhance the flavor of fruit and the aroma of flowers. Bioengineering 2015, 2, 204–212. [Google Scholar] [CrossRef] [PubMed]
  60. Munene, R.; Changamu, E.; Koir, N.; Gweyi-Onyango, J. Effects of different nitrogen forms on growth, phenolics, flavonoids and antioxidant activity in amaranth species. Trop. Plant Res. 2017, 4, 81–89. [Google Scholar] [CrossRef]
  61. Lillo, C.; Lea, U.S.; Ruoff, P. Nutrient depletion as a key factor for manipulating gene expression and product formation in different branches of the flavonoid pathway. Plant Cell Environ. 2008, 31, 587–601. [Google Scholar] [CrossRef] [PubMed]
  62. Kong, L.; Xie, Y.; Hu, L.; Si, J.; Wang, Z. Excessive nitrogen application dampens antioxidant capacity and grain filling in wheat as revealed by metabolic and physiological analyses. Sci. Rep. 2017, 7, 43363. [Google Scholar] [CrossRef] [PubMed] [Green Version]
Figure 1. Mexican marigold (Tagetes erecta L.) var. Inca plants treated for 30 d with different levels of N during the flowering phase.
Agriculture 13 00517 g001
Figure 2. Leaf concentrations of chlorophyll a (A), b (B), total (C) and the chlorophyll a/chlorophyll b ratio (D) in Mexican marigold (Tagetes erecta L.) var. Inca plants treated for 30 d with different levels of N in the nutrient solution during the flowering phase. Means ± SD with different letters in each variable indicate significant differences (Tukey, p ≤ 0.05) among treatments. FW = fresh weight; n = 4.
Agriculture 13 00517 g002
Figure 3. Total carotenoids in flowers of Mexican marigold (Tagetes erecta L.) var. Inca plants treated for 30 days with different levels of N in the nutrient solution during the flowering phase. Means ± SD with different letters indicate significant differences (Tukey, p ≤ 0.05) among treatments. DW = dry weight; n = 10.
Agriculture 13 00517 g003
Figure 4. Total phenolic compounds in leaves (A) and flowers (B) of Mexican marigold (Tagetes erecta L.) var. Inca plants treated for 30 days with different levels of N in the nutrient solution during the flowering phase. Means ± SD with different letters indicate significant differences (Tukey, p ≤ 0.05) among treatments. FW = fresh weight; n = 4.
Agriculture 13 00517 g004
Figure 5. Total flavonoids in leaves (A) and flowers (B) of Mexican marigold (Tagetes erecta L.) var. Inca plants treated for 30 days with different levels of N in the nutrient solution in the flowering phase. Means ± SD with different letters indicate significant differences (Tukey, p ≤ 0.05) among treatments. DW = dry weight; n = 4.
Agriculture 13 00517 g005
Table 1. Reagent grade salts and their amounts used in the formulation of the nutrient solutions applied to Mexican marigold (Tagetes erecta L.) var. Inca seedlings in hydroponics.
Reagent Grade SaltsNitrogen in the Nutrient Solution (g L−1)
04.28.412.6
(mg L−1)
KH2PO46.80456.8045 6.80456.8045
Ca(OH)216.6709
Ca(NO3)2 4H2O35.422553.133853.1338
MgSO4 7H2O24.647024.647024.647024.6470
K2SO413.068813.068813.068813.0688
KOH8.41588.4158
KNO315.165015.1650
CH4N2O7.7220
Table 2. Antioxidant activity in Mexican marigold (Tagetes erecta L.) var. Inca flowers after 30 days of treatment with different nitrogen levels.
Nitrogen in the Nutrient Solution (mg L−1)Antioxidant Activity
(μM eq. Trolox g−1 Fresh Matter)
01125.62 ± 79.4 b
4.21722.60 ± 2.8 a
8.41690.21 ± 4.2 a
12.61495.45 ± 180.8 ab
Means ± SD with different letters in each column indicate significant differences (Tukey, p ≤ 0.05) among treatments. n = 4.
Disclaimer/Publisher’s Note: The statements, opinions and data contained in all publications are solely those of the individual author(s) and contributor(s) and not of MDPI and/or the editor(s). MDPI and/or the editor(s) disclaim responsibility for any injury to people or property resulting from any ideas, methods, instructions or products referred to in the content.

