Article

Design and Experimental Testing of a Centrifugal Wheat Strip Seeding Device

1
School of Agricultural Engineering and Food Science, Shandong University of Technology, Zibo 255000, China
2
Zibo Investment Promotion Development Center, Zibo 255086, China
3
Shandong Academy of Agricultural Machinery Sciences, Jinan 250010, China
*
Author to whom correspondence should be addressed.
Agriculture 2023, 13(10), 1883; https://doi.org/10.3390/agriculture13101883
Submission received: 6 September 2023 / Revised: 17 September 2023 / Accepted: 19 September 2023 / Published: 26 September 2023
(This article belongs to the Special Issue Design, Optimization and Analysis of Agricultural Machinery)

Abstract

:
Wheat sowing has the characteristics of wide and short sowing periods, and there are situations in which the suitable sowing period is missed. In order to meet the needs of high-speed sowing, a centrifugal wheat strip seeding device was designed, the principle of which is that rotating parts were mainly composed of centrifugal concave plate and guide strip rotating in the shell to provide the mechanical force and drive the airflow and then realize high-speed seeding. The influence of the rotational speed of the seed discharging plate, the seed feed rate, and the dip angle of the guide strip on the distribution of the flow field and trajectory of seeds in the device was analyzed. The aerodynamic characteristics of seeds and the distribution of the gas-phase flow field inside the seed displacer under airflow were analyzed by CFD–DEM coupled simulation. The effects of three operating parameters on the coefficient of variation of sowing uniformity (CVSU) and the row-to-row seeding amount coefficient of variation (RSCV) were clarified, and the simulation results were verified by bench experiments after secondary optimization. When the centrifugal concave plate rotational speed, seed feed rate, and guide strip angle were 408 rpm, 4938 grains/s, and 69°, the results showed that CVSU and RSCV were 1.12% and 2.39%, respectively, which was in line with the standards for grain strip seeders stipulated. The designed seed discharge device can sow 3.4 ha per hour. This study provides a reference for research of centrifugal airflow-assisted high-speed seeding devices for wheat.

1. Introduction

The sowing period is the first part of the wheat production process, the optimization of which improves sowing speed, ensures sowing quality, and plays a very important role in increasing and stabilizing the yield of a crop. China has a large wheat planting area; the planting area of winter wheat in 2022 was about 23,518,500 hectares [1]. Sowing wheat during the appropriate sowing period can make full use of heat resources, cultivate strong seedlings, ensure the formation of robust large tillers and developed root systems, manufacture and accumulate more nutrients, and enhance resistance to adversity to improve the rate of spikes and cultivate strong stalks and large spikes to lay a sound foundation. However, the suitable sowing period for wheat is short [2], and there are cases when wheat sowing is not carried out within the suitable sowing period due to the efficiency of seed dischargers, affecting the wheat yield. At present, the wheat seeders are mainly mechanical and pneumatic. Mechanical seeders are mainly external groove wheel seeders, the advantage of which is a stable and adjustable sowing volume, and the disadvantage of which is the existence of pulsation, which can easily produce uneven sowing, crowded seedling growth, lack of seedlings, and the broken ridge phenomenon. In addition, there are also problems such as difficult seed filling, uneven seed filling, and a high leakage rate arising from high-speed seeding. The adopted pneumatic seeder is a high-speed and precision pneumatic seed discharger, and the seed filling method is mainly through the equipped fan, which rotates to generate negative pressure airflow: the seed is sucked into the seed disk hole when the seed moves to the negative pressure domain [3,4,5]. However, the increase in the total negative pressure required for seed filling will cause an increase in the rotational speed of the fan system in the wide operation mode, resulting in increased vibration and a substantial increase in energy consumption. At the same time, the pneumatic seed dispenser has poor stability of instantaneous speed of seed drop in the seed dispensing process, which leads to poor grain spacing [6,7,8].
The quality of seed sowing is related to the performance of the seed discharger. The seed filling process determines the quality and speed of seed discharge. Lei et al. [9] designed a Venturi-based airflow collector-exhaust seed discharger to improve the seed filling rate by driving the seeds into the centrifugal mixer through a fan blast. Liao et al. [10] designed a double-cylinder seed discharger to accomplish high-speed seed discharging of six rows by negative pressure filling and positive pressure discharging. This method can meet the agronomic requirements of rapeseed and wheat seeds.
During the working process of a seed discharger, the seed-to-seed and seed-to-guide strip interactions are a more complicated seed flow problem than a discontinuous medium problem. Deng et al. [11] simulated wheat seed movement characteristics under different guide strips of a centrifugal seed discharger using EDEM; Liu et al. [12] designed a cone-guided horizontal plate wheat seeder and conducted a one-way experiment on the effect of no guide strip, a straight guide strip, and an involute guide strip on the seeding effect using EDEM; Xu et al. [13] analyzed the performance of four structures of slotted-wheel seed dischargers for discharging rice seeds using EDEM simulation. At the same time, the rotation of the centrifugal concave plate and the guide strip causes airflow and the role of the airflow in the complex area of the aerodynamic characteristics of the seeds is routinely difficult to calculate. Cheng et al. [14] optimized the precision seeding performance of the seed discharger by analyzing the flow field conditions at different seed suction ports using the FLUENT 2020R2 software. Xing et al. [15] designed and optimized the negative pressure duct of the rice seed discharger and optimized the duct structure by analyzing the suction hole configuration on the duct using the FLUENT 2020R2 software.
In this study, a centrifugal wheat strip seeding device was studied to address the above problems, including the design of a centrifugal force-based combination of seed plate and dip guide wheel. The flow field characteristics of the seed discharge device were simulated following the following steps: (1) selecting reasonable parameter intervals by using ANSYS-FLUENT. (2) The motion characteristics of seeds and the consistency of seed discharge under different guide strips, rotational speeds, and seed feed rates of a centrifugal concave plate were simulated using a CFD–DEM coupled analog simulation. (3) Experiments were conducted on a seed rowing experimental bench and the simulation results were verified with data collected by a multichannel real-time weighing device, and finally design parameters were optimized to improve the performance of the system for seed discharging to meet the production requirements of high-speed seed discharge.

2. Materials and Methods

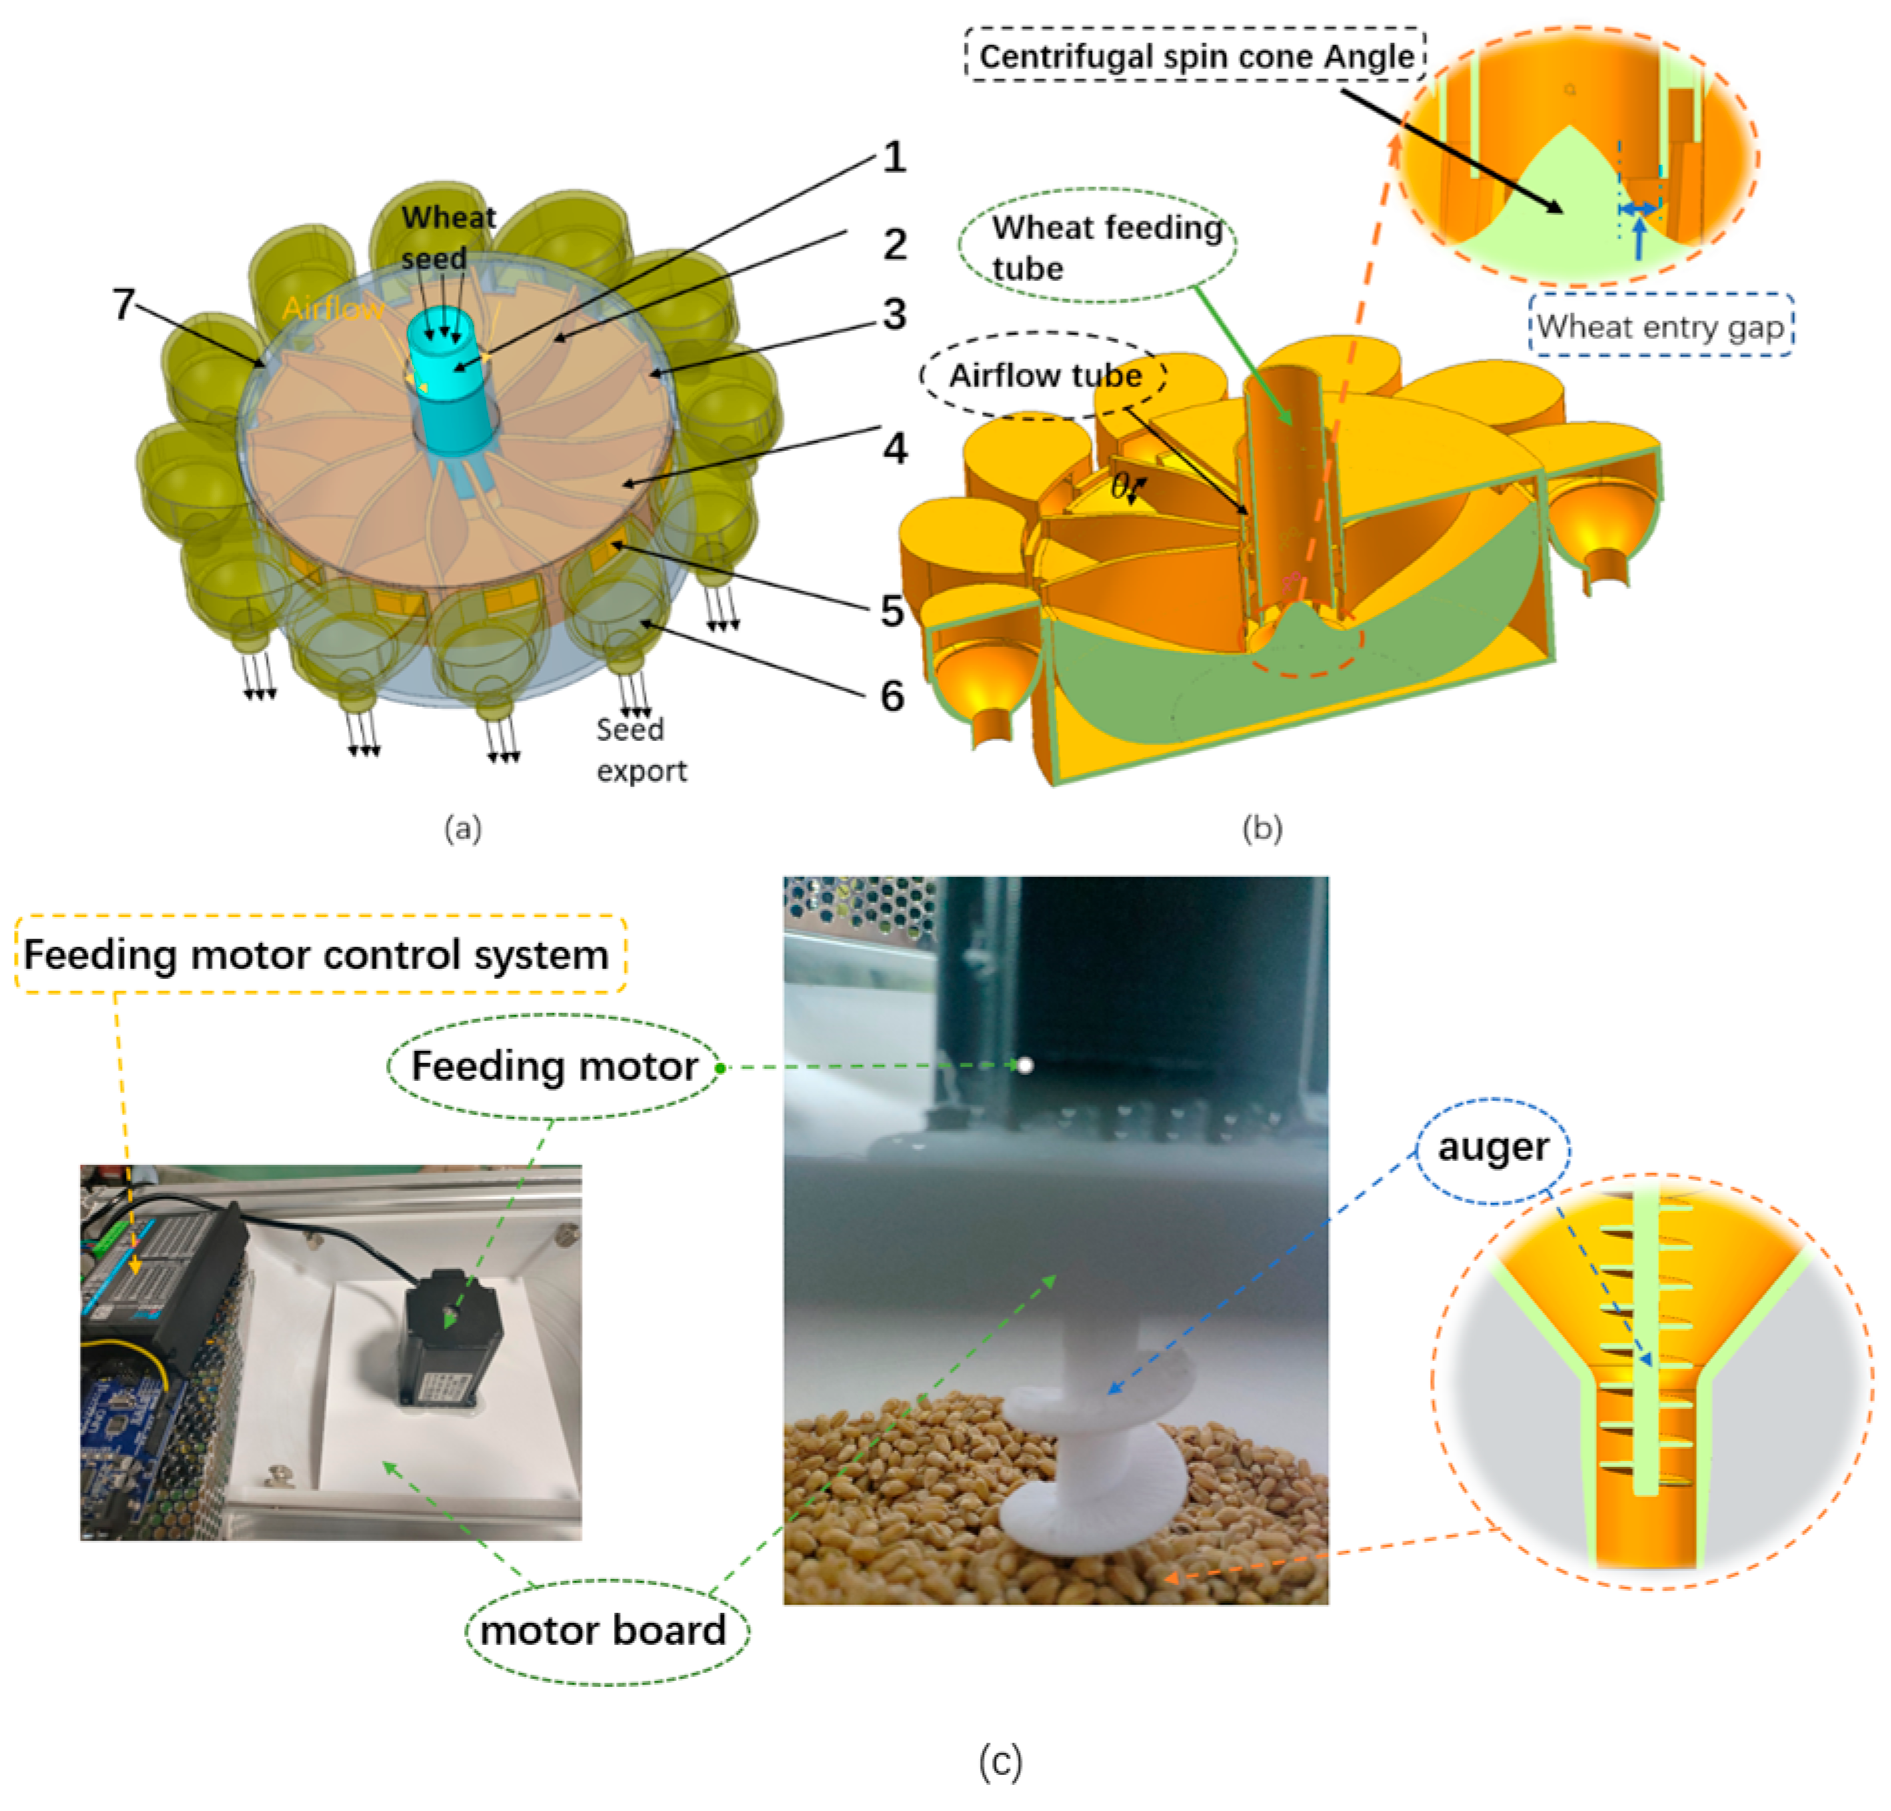
2.1. Structure and Principle of Centrifugal Wheat Strip Seeding Device

The structure of the centrifugal wheat strip seeding device is shown in Figure 1. This device consists of seed feed tubes, centrifugal concave plates, dip guide strips, seed discharge notches, a shell, shell outlets, and inoculation capsules. Among them, the dip guides make an angle of θ with the centrifugal concave plate. There is an airflow channel outside seed feed tube, and the centrifugal concave plate rotates to create a negative pressure inside seed discharger. When the seeding device works, the seed flows from the seed box into the seed feed tube and is then accelerated under the effect of gravity and negative pressure to fall onto the centrifugal concave plate in the cone angle for seed distribution. Seeds in the cone angle are evenly distributed and accelerated away from the wheat seed feed gap between seed tube and cone angle by the combined effect of the support force of guide strips and concave plate and airflow drag force. At the end of the centrifugal concave plate set seed notch, with the fluid phase of the forces, the ends of guide strips on the seed support force seeds through the shell outlet into the inoculation capsule. The seed decelerates and relieves pressure in the inoculation capsule and leaves the seed dispenser after the direction changes toward the ground, completing a uniform 12-row row. The CFD–DEM coupled [16,17,18,19] simulation simulates the movement of seeds during the seed discharge work, as shown in Figure 2.

2.2. Mathematical Modeling Analysis of CFD–DEM Coupling

Air conveying can be categorized into dilute-phase flow and dense-phase flow based on the gas–solid mass ratio (ψ), and the ψ of the centrifugal wheat strip seeding device is less than 10%, which belongs to dilute-phase flow. The coupled CFD–DEM simulation method [20,21,22] was used to investigate the motion characteristics and distribution process of wheat seeds.
The gas motion in the CFD part was analyzed in the Eulerian framework of ANSYS-FLUENT and the effect of gas phase was analyzed by adding a void fraction α g to the conservation equation. The gas-phase fluid dynamics was expressed in terms of a continuity equation and the momentum conservation equation, as shown in Equations (1) and (2) below:
t ρ g α g + 𝛻 ρ g α g u g = 0
t ρ g α g u g + 𝛻 α g ρ g u g u g = α g 𝛻 p g + 𝛻 α g τ g + α g ρ g g F P
where ρ g , u g , p g , t, g , α g are gas-phase density, gas-velocity vector, gas-phase pressure, instantaneous time, gravitational acceleration, and void fraction, respectively. F P is the gas–solid two-phase flow resistance, which is the exchange of momentum between the solid and gas phases. τg represents the fluid stress tensor, calculated as:
τ g = μ g 𝛻 u g + μ g 𝛻 μ g T
where μ g is the dynamical viscosity, 𝛻 μ g and 𝛻 μ g T are the gradient matrix of the velocity field and its transpose matrix, respectively.
In the DEM model, real-time information about the position and velocity of particles is explicitly tracked by Newton’s second law of motion in a Lagrangian manner. Considering particle–particle and particle–excluder collisions, the collision force term (FC,ij) is added for solving the momentum exchange. The translational and rotational equations of motion for a single particle i are given by:
m i d u i d t = m i g + F d , i + F M a g , i + F S a f f , i + j m F c , i j
I i d ω i d t = T i = j = 1 n i T t + T r + T n
where m i , u i , and ω i are the particle mass, translational velocity, and rotational velocity of particle i. F d , i is the drag force on particles in a gas–solid two-phase flow. F M a g , i is the Magnus lift generated by the rotation of the particles. F S a f f , i is the Saffman lift force on particles in a gas–solid two-phase flow. Σ F c , i j is the collision force between particles and between particles and the seed discharger. n i denotes the number of particles interacting with particle i , I i and T i represent the moment of inertia and total torque of particle I, respectively, T t and T r are rolling friction moments, generated by the moment of particle j acting on particle i and the tangential force. T n is the moment, which is generated by the normal force when it is not directed towards the center of mass of the particle.
The gas-particle interaction is mainly calculated numerically through the momentum exchange between the gas and solid phases, where the trailing force plays an important role in the momentum exchange between the two phases. In this paper, the interaction between gas and particles is simulated by the Di Felice drag model, Equation (6):
F d , i = 1 8 ρ g C d π d i 2 α g 2 β u g u i u g u i
where d i is the diameter of the wheat seed particle. u g u i is the slip velocity between the gas and the particles C d is the drag coefficient, β is the model coefficient described by the following equation:
C d = 24 R e p ( stokes ) R e p 1 24 R e p 1 + 0.1875 R e p 1 < R e p 5 24 R e p 1 + 0.15 R e p 0.687 5 < R e p 800 24 R e p 1 + 0.167 R e p 0.667 800 < R e p 1000 0.4392 1000 < R e p 30000
R e p = ρ g d i α g u g u i μ g
where μ g is the airflow viscosity and R e p is the Reynolds number, which is taken as 1600 for this experiment [16]. The remaining force in Equation (4) can be expressed as:
F M a g , i = π 8 C l ρ g d i 2 u i u g 2 ω i 𝛻 × u i u g u i u g ω i 𝛻 × u g
F s a f f , i = 1.615 d i 2 ρ g μ g u g u i d u g d y
Σ F c , i j = Σ F n , i j d + Σ F t , i j d
where C l is an empirical coefficient, related to R e i . Fnd is the damping force of the particles against the wall and the wheat seed; Ftd is the tangential damping force.

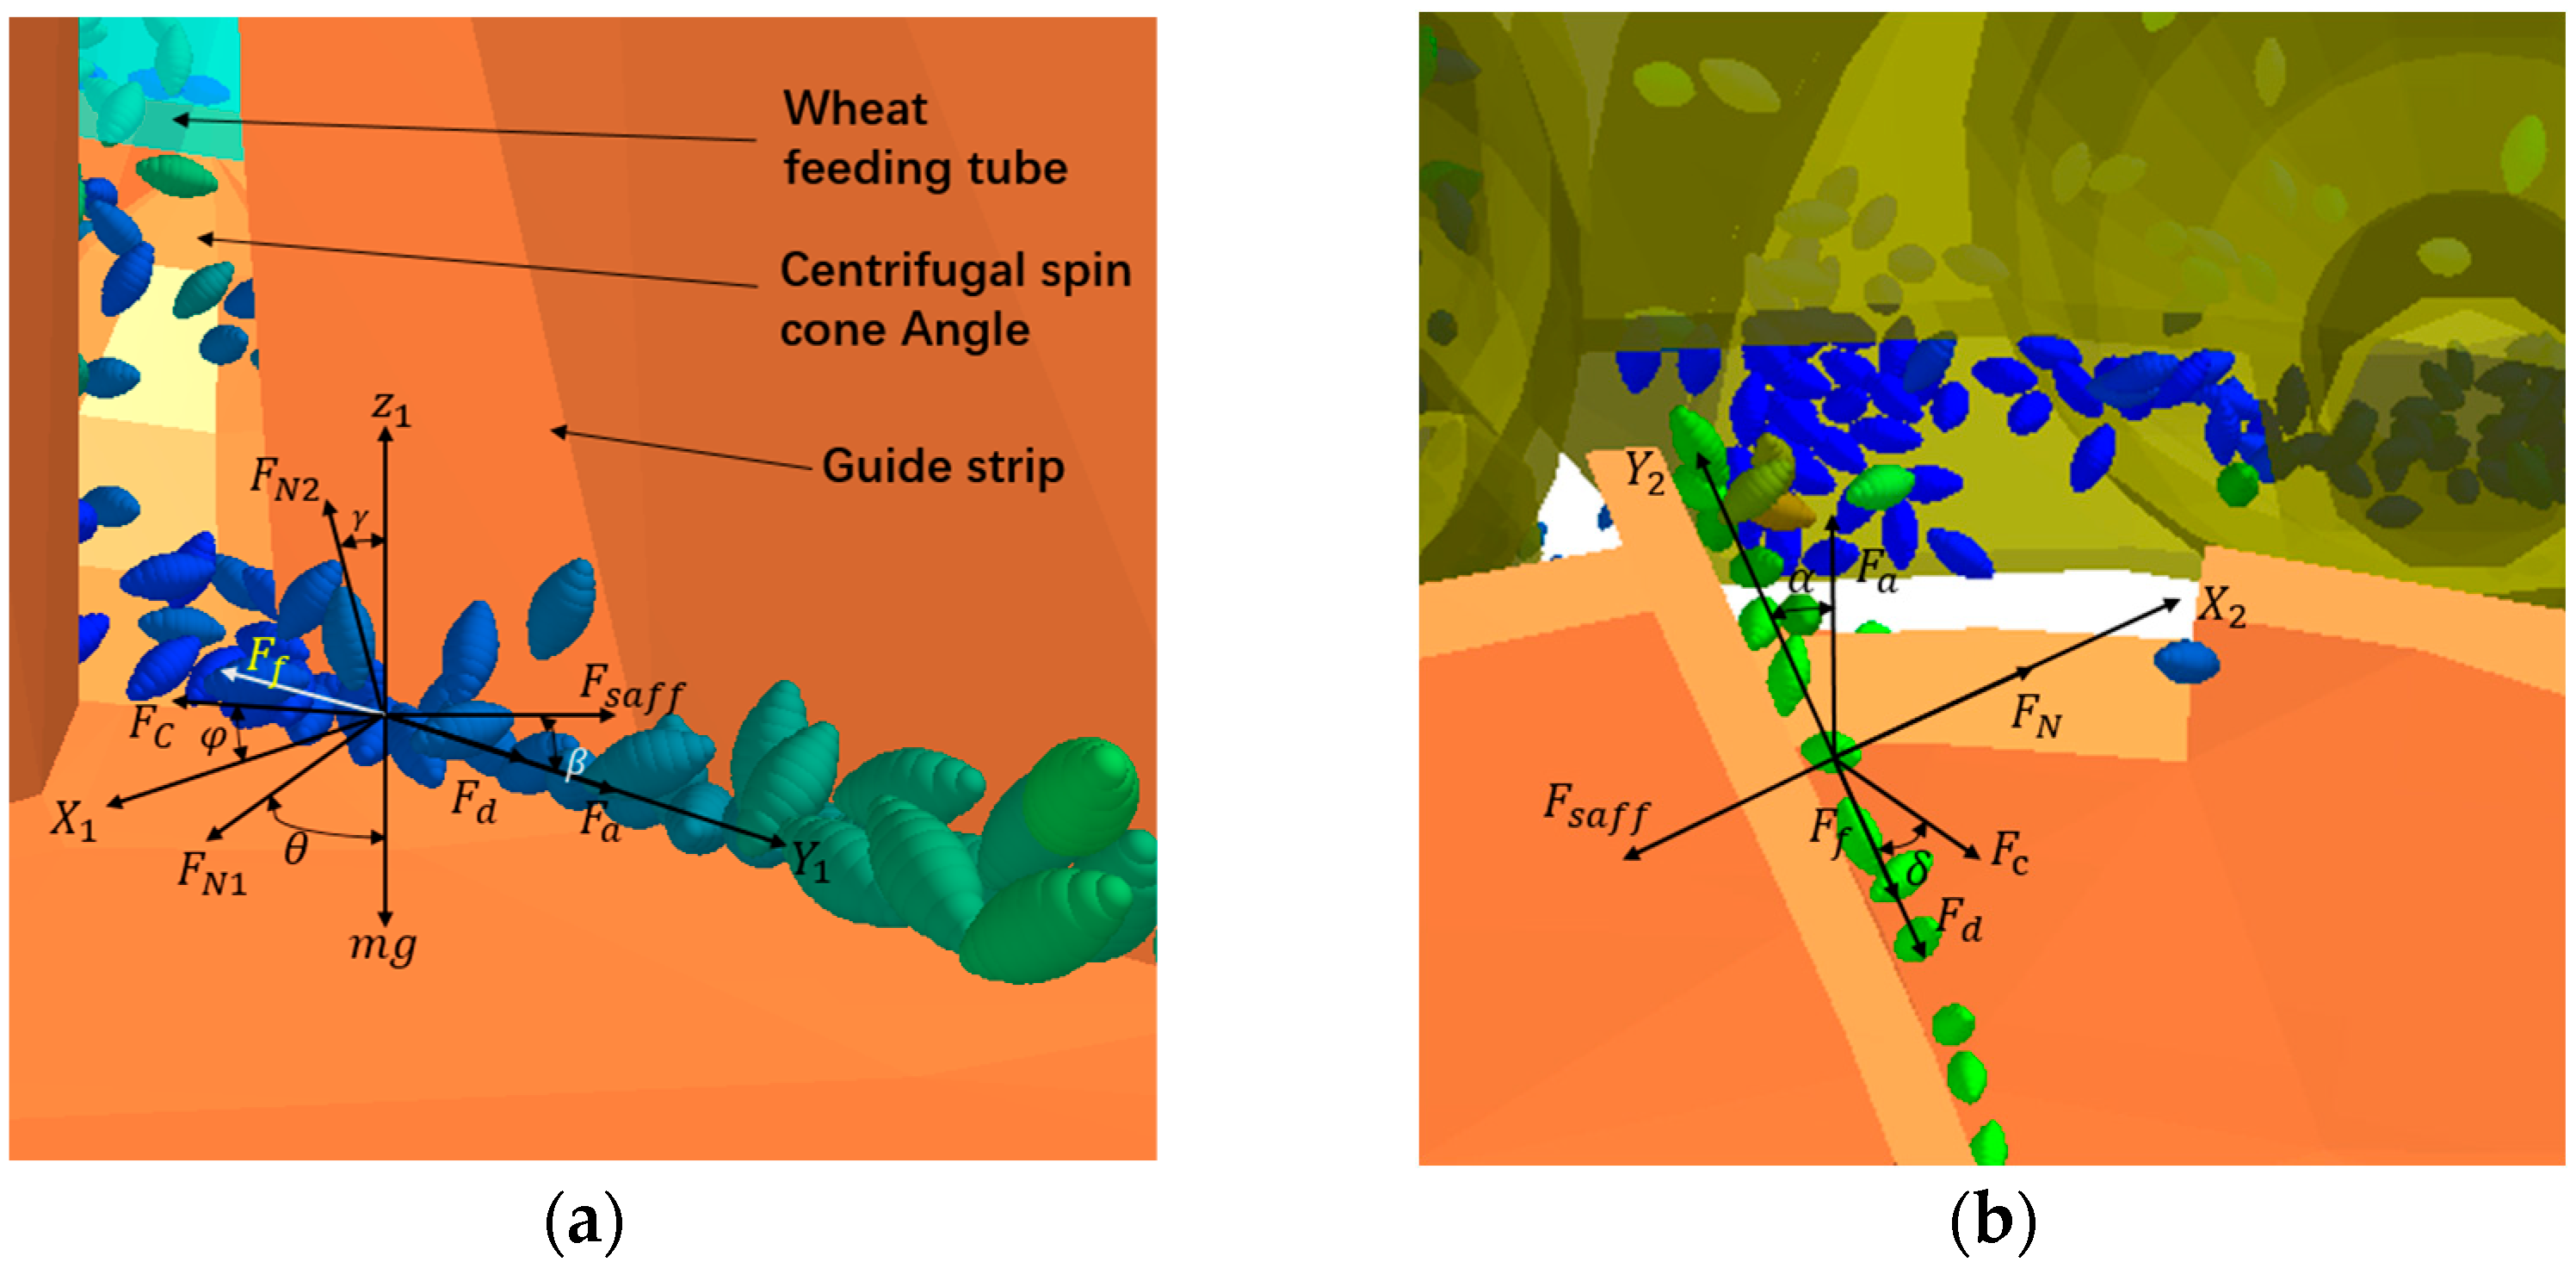
2.3. Mechanical Analyses of Wheat Seeds during Operation of Seed Discharging Equipment

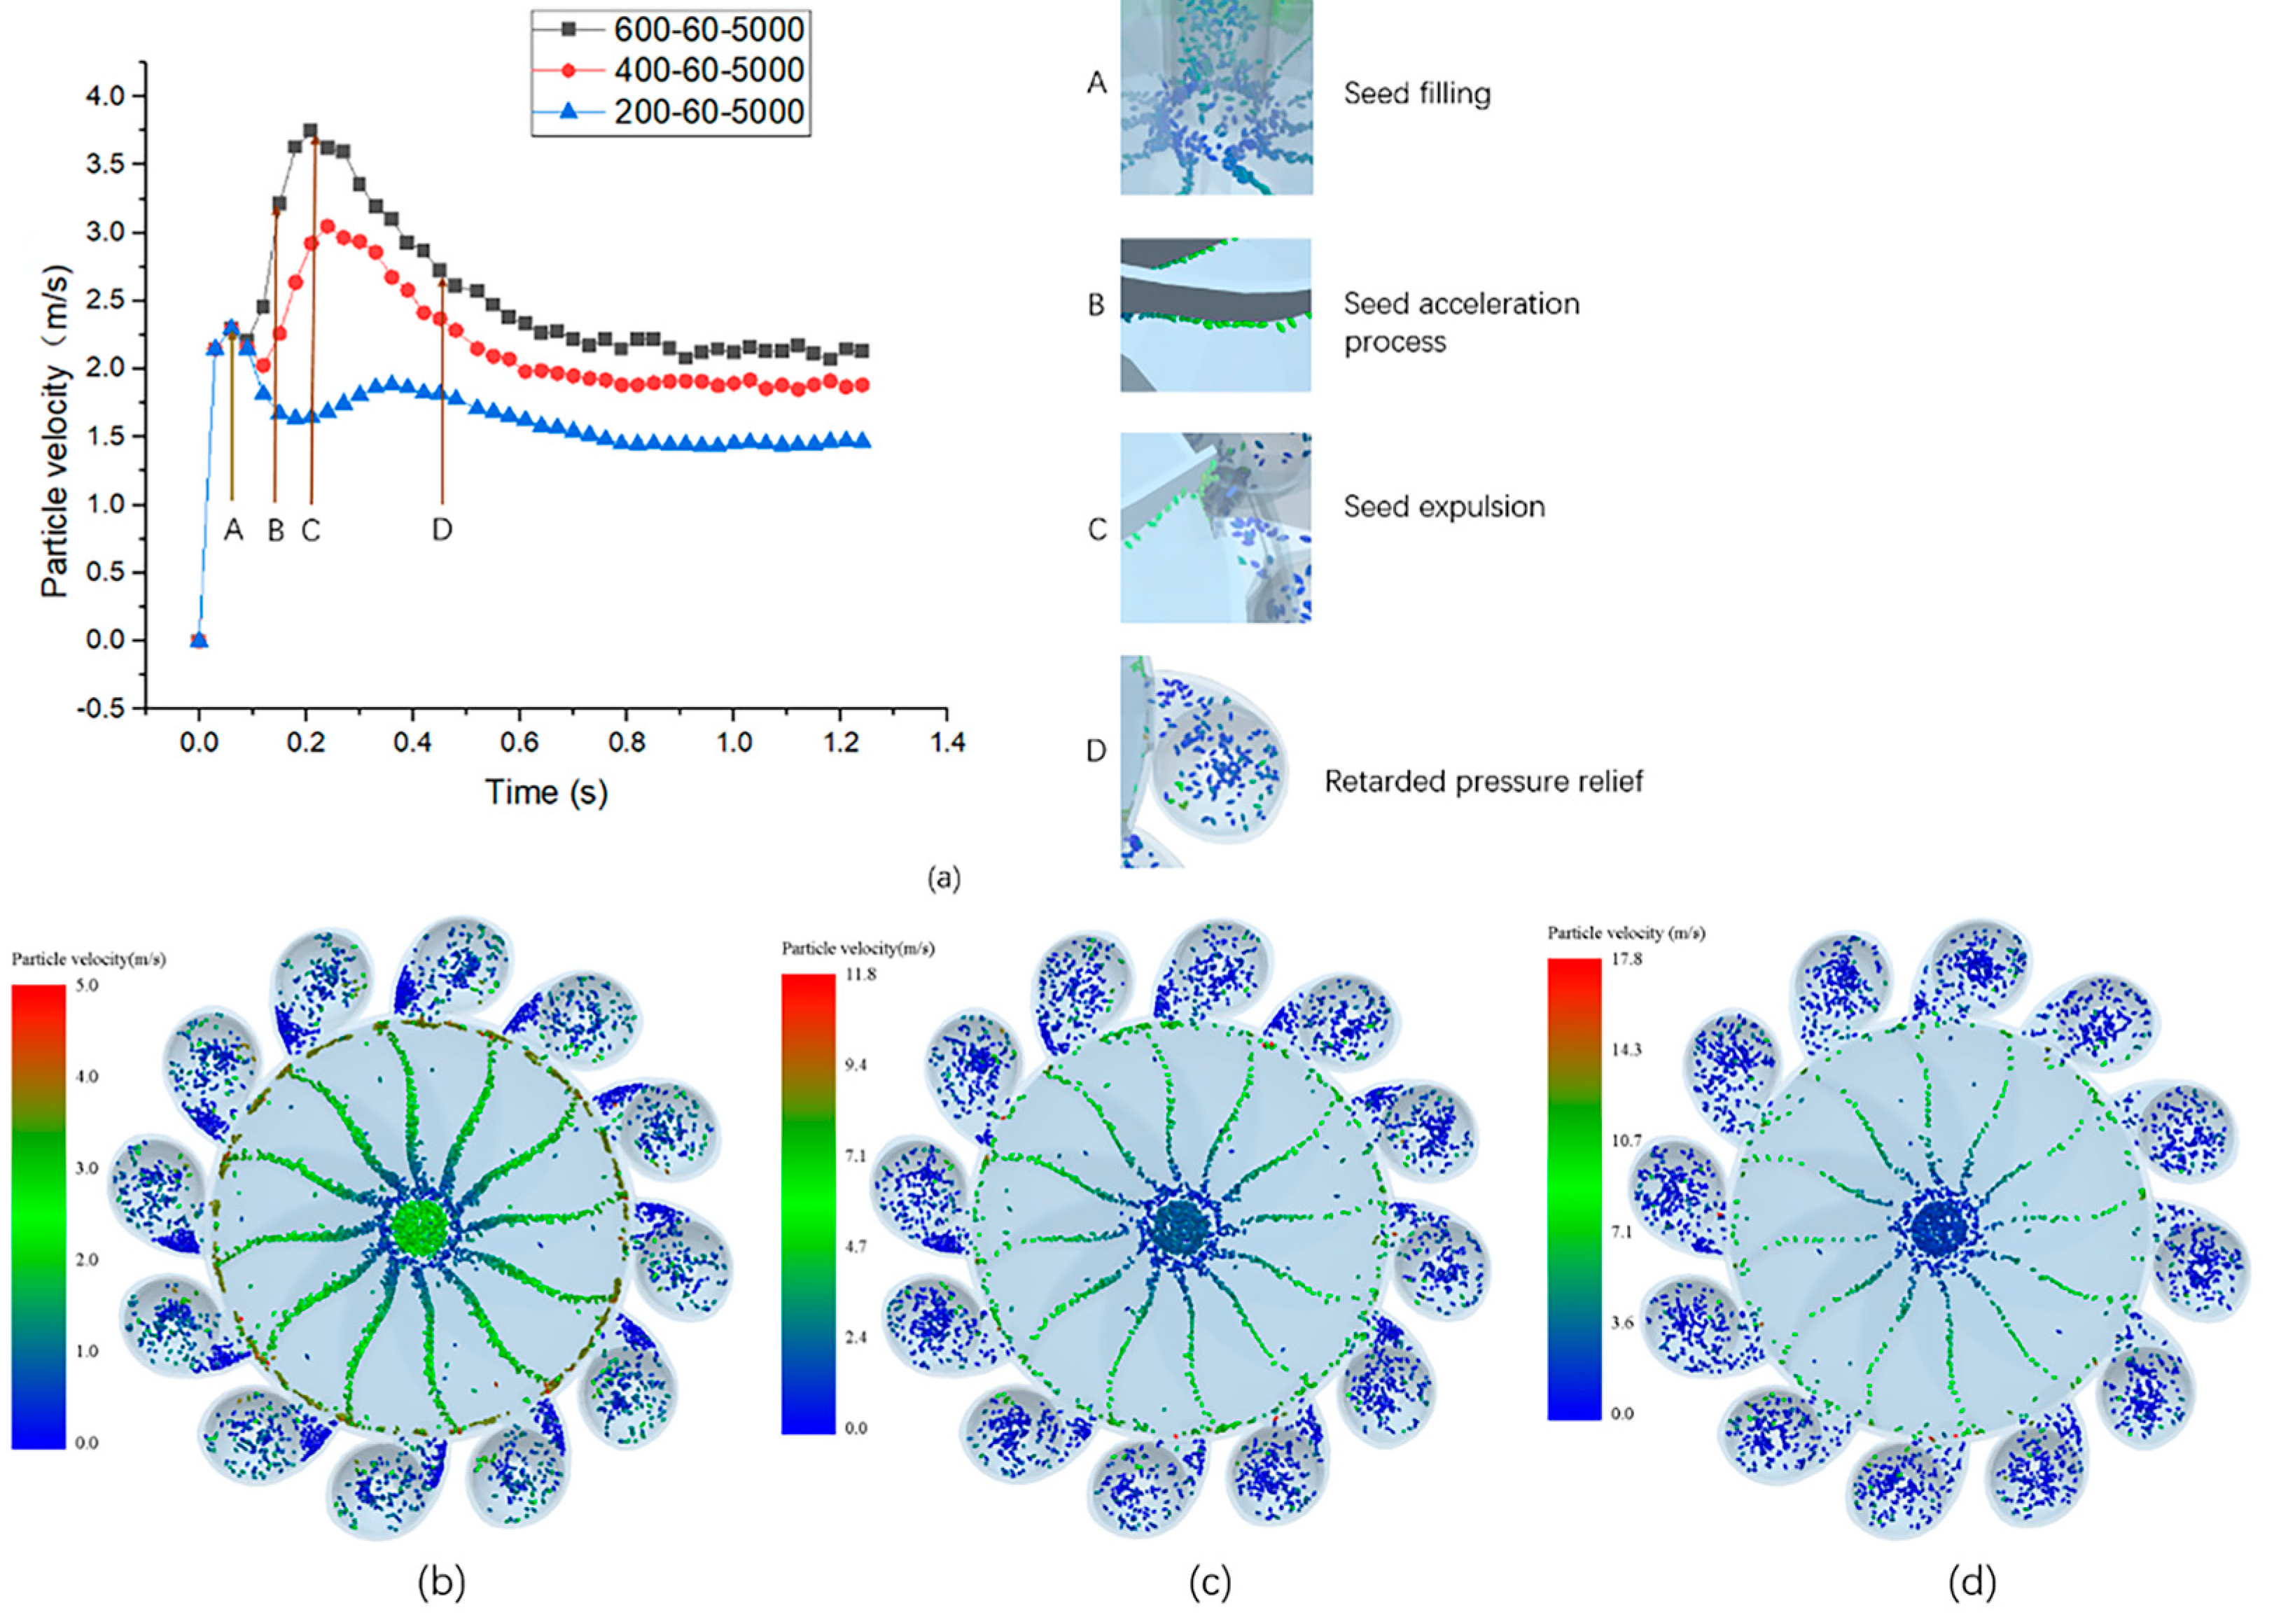
2.3.1. Theoretical Analysis of Wheat Seed Particle Filling Process

Seed flow from the wheat feeding tube falls on the cone angle of the centrifugal concave plate and is evenly diverted to the gap of the guide strip to achieve seed filling. Seeds at the top of the guide strip are subjected to gravity, gas-phase drag force, Magnus lift force, collision force between the seed particles, the support force of the guide strip, etc., among which the Magnus force has much less effect on the particles than the other forces, so it is ignored [23,24,25]. In addition, the gas-phase drag force is related to the velocity and density of fluid affected by the air pressure, and the drag force is related to the air pressure. The barometric pressure formula is as follows:
P r = s ρ g ω a r c c o s θ l 2 V 2 l 1 V 1
where P r is the theoretical pressure at the inlet. s is the correction coefficient, related to the cross-sectional area between adjacent guide strips. ω is the angular velocity of the centrifugal concave plate, rpm. θ is the tilt angle of the guide strip. l 1 and l 2 are the distances of the first section of the guide strip and the end of the guide strip from the center of the axis, m, and V 1 and V 2 are the radial airflow velocities at the inlet and the outlet, m/s, respectively.
The velocity of seed particles is lower than the airflow velocity during seed filling, and the direction of trailing force F d is the reverse of the relative motion of seed particles and airflow, N; as shown in Figure 3a, the forces in each direction on the seed particles are:
X : F N 1 sin θ + F c cos φ = F s a f f sin β
Y : F d + F α + F s a f f cos β > F N 2 sin γ + F f + F c sin φ
Z : m g + F N 1 cos θ = F N 2 cos γ
where F N 1 is the support force of the guide strip on the seed, N; F N 2 is the support force of the centrifugal concave plate on the seed, N; F f is the friction force of seed, N; F a is the centrifugal force of seed, N; m is the mass of seed, Kg; θ is the installation angle of the guide strip (°): φ is the angle of collision force, F c , with the positive X direction in the XY plane (°); β is the angle of Saffman lift force with positive Y direction (°). γ is the angle between concave disk support force F N 2 and Z axis positive direction in the YZ plane (°).
From Equations (13)−(15), the seed moves along the guide strip with variable acceleration from the end of the guide strip to the seed exit notch area.

2.3.2. Theoretical Analyses of the Wheat Seed Particle Discharge Process

Wheat seed particles rise along the guide strip on the centrifugal concave plate due to gas-phase drag force, centrifugal force, and Saffman lift. After reaching the notch area of the seed discharge device, the gas flow rate decreases because of the pressure relief and deceleration effect of the inoculation capsule. At this time, the gas-phase resistance is in the opposite direction to the movement of the seed particles. The end of the guide is bent in the opposite direction of rotation to provide outward support to the seed, as shown in Figure 3b, and the forces in all directions on the seed particles are:
X : F s a f f = F c sin δ + F N + F a sin α
Y : F a cos α F f + F d + F c cos δ
where F N is the support force of the guide strip on the seed particles, N; δ is the angle between the collision force F c and the forward direction of the seed in the XY plane, α is the phase angle between the centrifugal force and the forward direction of the seed (°); F f is contact drag (the component of the combined force of gravity mg, the supporting force of the centrifugal concave plate on the seed F N 3 , and the friction force in the Y direction in the YZ plane).
The influence of each parameter on the seed combined force during the process of wheat seed filling and discharging, in which the guide strip inclination θ affects both gas-phase drag force and support force and friction force of the guide strip on the seeds and the rotational speed ω affects gas-phase drag force and centrifugal force, was analyzed. The amount of seed per unit cross-section of the wheat seed delivery tube (i.e., seed delivery volume) affects the thickness of the seed layer, the collision force between the seed particles, and the support of seed by the guide strip. The results concluded that the rotational speed of the centrifugal concave plate, the seed feed rate, and the inclination of the guide strip had the greatest influence on the seed filling effect of the seed dispenser. Among them, the gas-phase drag force is affected by the airflow and varies in real time, so the influence of rotational speed, guide strip dip angle, and seed feed rate on the working performance of the seed discharger is investigated by coupled DEM-CFD calculation and optimization.

2.4. Materials and Methods for CFD–DEM Coupled Simulation

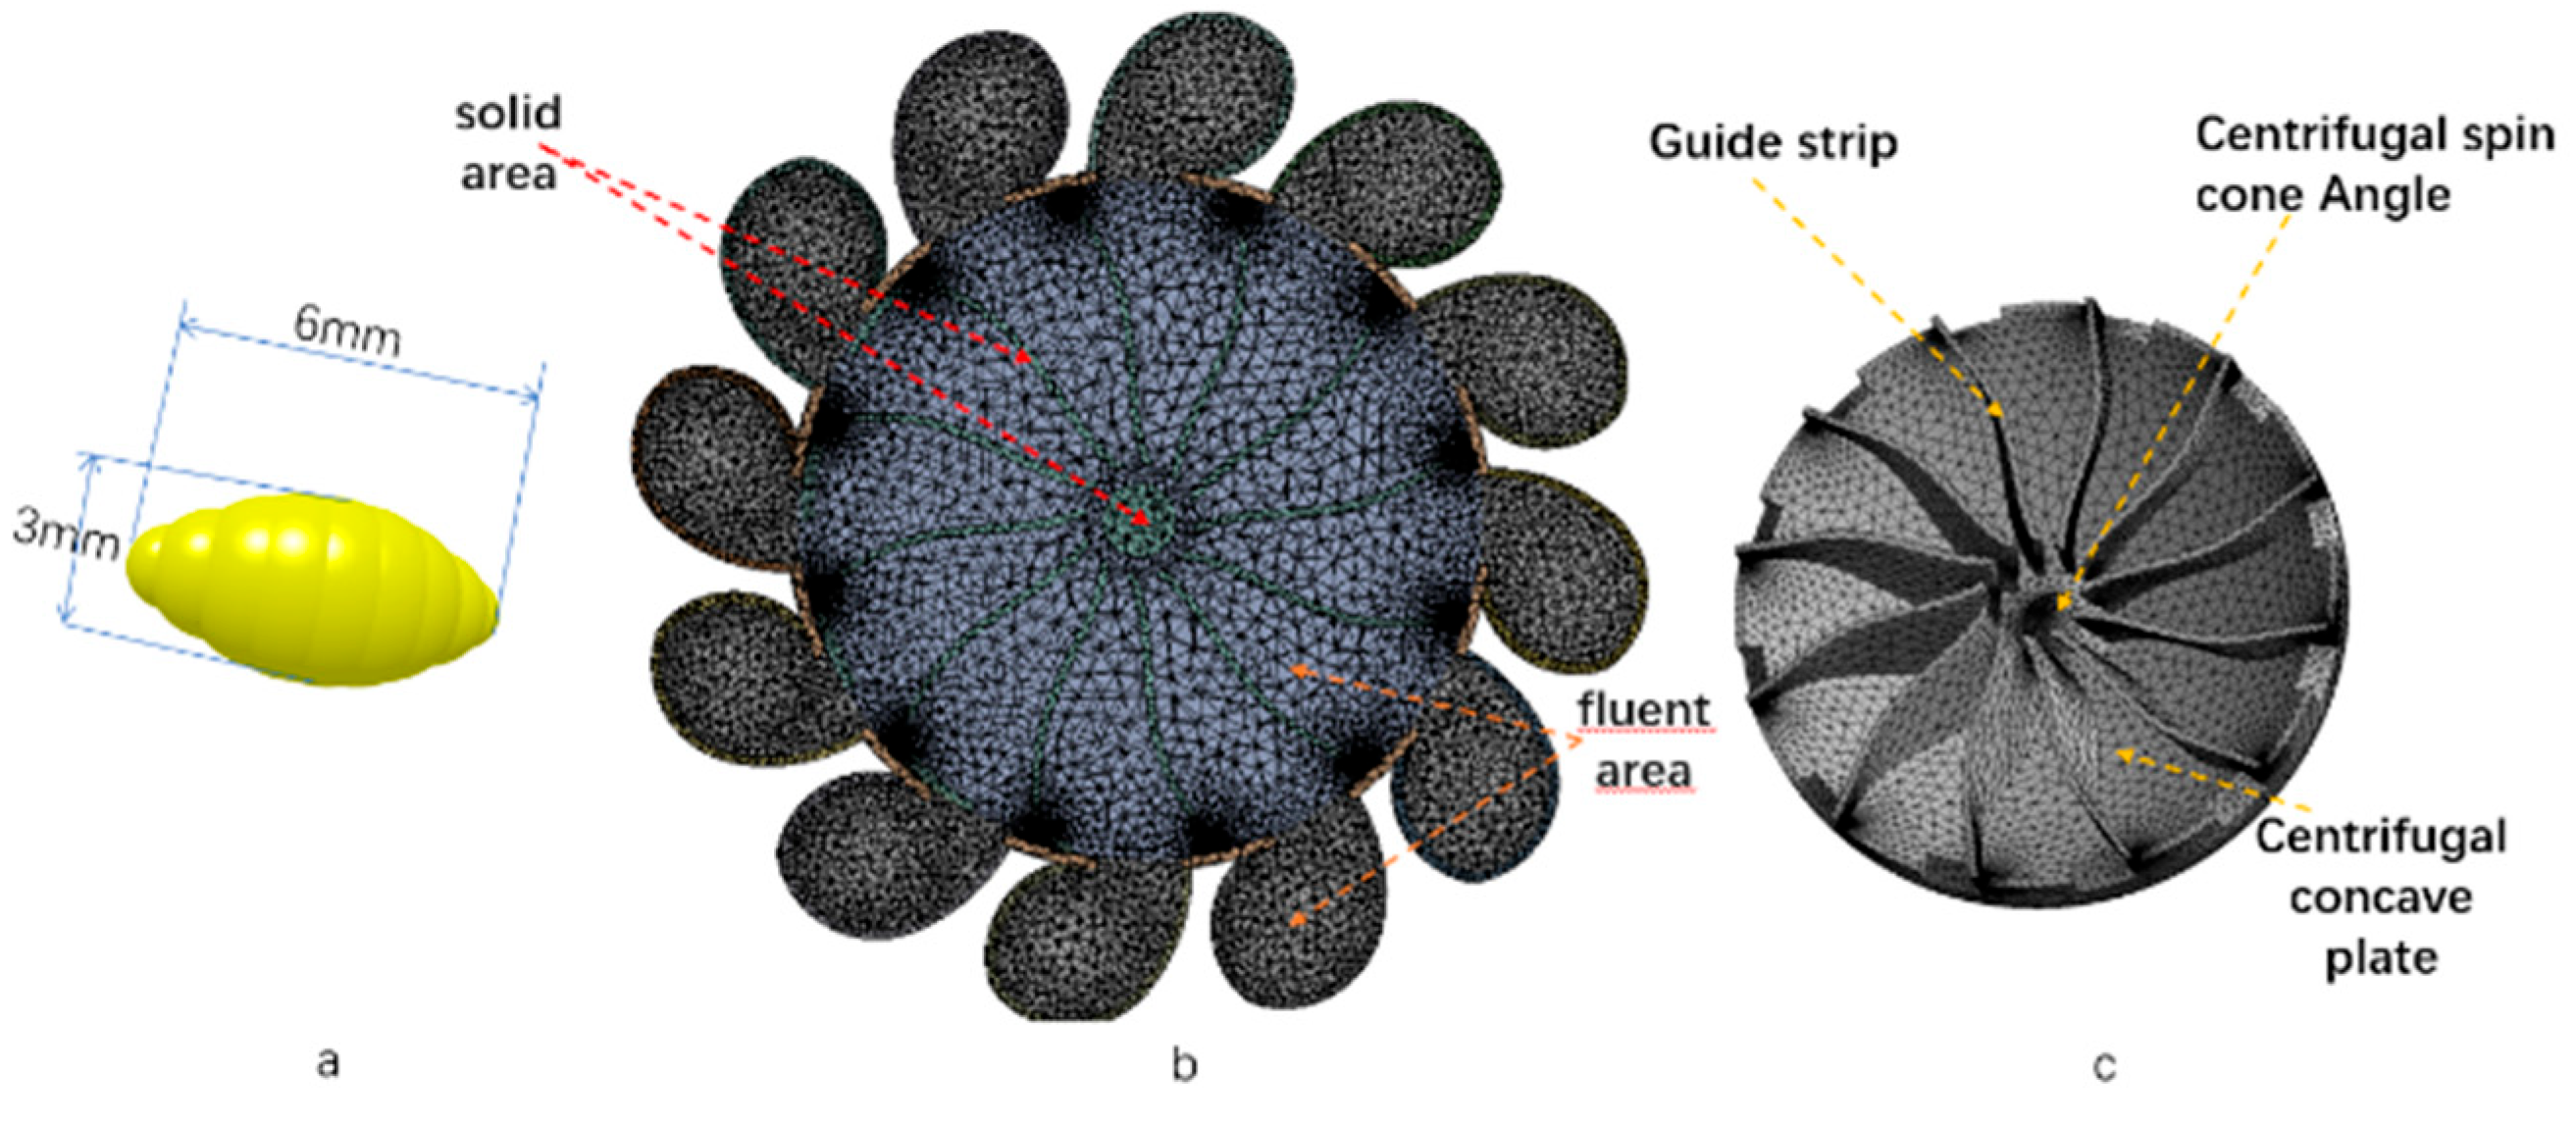
2.4.1. Modeling of Centrifugal Wheat Strip Seeding Device and Seed Modeling

The 3D model of the seed dispenser was drawn using the 3D drawing software UG NX 10.0. The simplified version was imported into the EDEM (v2020.2) in STP format and the rotation of the centrifugal concave plate and guide bar assembly was set by Addin Motion. A particle plant for seed generation was provided in the wheat feeding tube. The seed dispenser was assembled using 3D printing in ABS material, and the Hertz–Mindlin (no slip) standard rolling friction contact model was chosen as the contact model. The three-dimensional physical parameters of wheat seeds (Jiemai 22) were measured and modeled using the bonded particle modeling (BPM) method (Figure 4a). The static and dynamic friction coefficients between seed particles and seed discharger were verified experimentally by the stacking angle of wheat, and the modulus of elasticity was determined by the straight shearer, which had a small error and ensured the high accuracy of the simulation model. The parameters are shown in Table 1. The geometry bin group was placed at the outlet of the inoculation capsule to collect the real-time seed output of each capsule.
The UG model was imported into ANSYS Workbench through an x_t file, and the tetrahedral meshing was carried out, in which the mesh encryption at the inlet and outlet is 3 mm, the mesh encryption at the interface between the rotating body and FLUENT is 6 mm, and the rest of the area is 9 mm, as shown in Figure 4b. The number of grids is 22,593. The minimum mesh size is 3 mm and the maximum mesh size is 9 mm, both of which are three times larger than the diameter of particles. To compile the UDF, DEFINE_CG_MOTION is used to control the centrifugal concave plate and the dip guide strip (Figure 4c) to rotate around the Y axis at a set speed, defining it as the solid phase and the rest of it as the fluid phase. The fluid phase material is defined as air. The inlet of the model was set as the pressure inlet and the pressure was set to standard atmospheric pressure (101.325 kPa), the outlet was set as the pressure outlet. A k-epsilon viscous model, standard wall functions, and no-slip boundary conditions were used with a time step of 0.0002 and a step size of 20,000.
From Equations (6) and (10), it is deduced that the drag force and Saffman force in the gas phase are affected by the flow velocity, pressure of flow field, etc. Flow field simulations were performed using ANSYS-FLUENT 2020R2 software to analyze the effect of flow field on each of the flow field forces in the gas phase [26,27,28]. Different rotational speeds guide strip dip angles were set (Table 2), with the same inclination of different rotational speeds as a group, for a total of 5 groups of 105 tests, through the anemometer measurement experiment to verify the simulation results.
EDEM simulation experiments are carried out to study the amount of congestion of the seed feed rate at different speeds [29]. In conjunction with the speed ranges in Table 2, 21 sets of 105 experiments were carried out with different seed feeds at the same speed, with EDEM material properties as in Table 1, with a time step of 0.000001 s and a total time of 4 s.

2.4.2. CFD–DEM Coupled Seeding Simulation Experiment Based on Dense Discrete Phase Model (DDPM)

EDEM turns on the coupling switch and FLUENT selects a transient model and reads the DDPM coupling interface for CFD–DEM coupling [30]. To achieve a coupled simulation, the principle of the DDPM coupling interface is to exchange information between two mathematical models, CFD and DEM. In order to ensure calculation accuracy, after the successful connection between FLUENT and EDEM, the input mesh > reorder > rd > rd is used until the output of rd = 1 in the coding window of FLUENT, the calculation method of the coupled model is phase coupled SIMPLE, the time step is 0.00004 s, and the number of steps is 100,000. The EDEM has a time step of 0.000001 s and saves data every 0.01 s.
According to the flow distribution of FLUENT pre-experiment, combined with experimental analysis of EDEM’s rotational speed and seed feed rate (Table 3), the flow field is stable at 200–600 rpm, and the seed feed does not block the seed inlet at the rate of 6000 grains/s or less. The independent variables of the Design-Expert 13 orthogonal experiment were selected to analyze the effects of three factors, namely, rotational speed ( x 1 ), guide strip dip angle ( x 2 ), and seed feed rate ( x 3 ), on CVSU and RSCV through the results of three-factor, three-level orthogonal experiments, and the factors and levels of orthogonal experiments are shown in Table 4.
The real-time seed output of each outlet was counted by geometry bin group at the outlet of the inoculation capsule, and the seed output of individual outlets from 1–4 s was divided into 3 equal parts by time. The seed output of each seed outlet in each period Q i j (i = 1, 2, 3, j = 1~12, j   ϵ   N * ) was counted. The expressions for evaluation indicators of CVSU and RSCV are:
  CVSU = j = 1 12 1 i 1 i = 1 3 Q i j Q i j ¯ 2 Q i j ¯ × 100 %
R S C u = i = 1 3 1 j 1 j = 1 12 Q i j Q ¯ i j 2 Q i j ¯ × 100 %
where Q ¯ i j is the average amount of seed discharged at a particular output or at a particular time (i = 1, 2, 3, j = 1~12, j   ϵ   N * ).

3. Results and Discussion

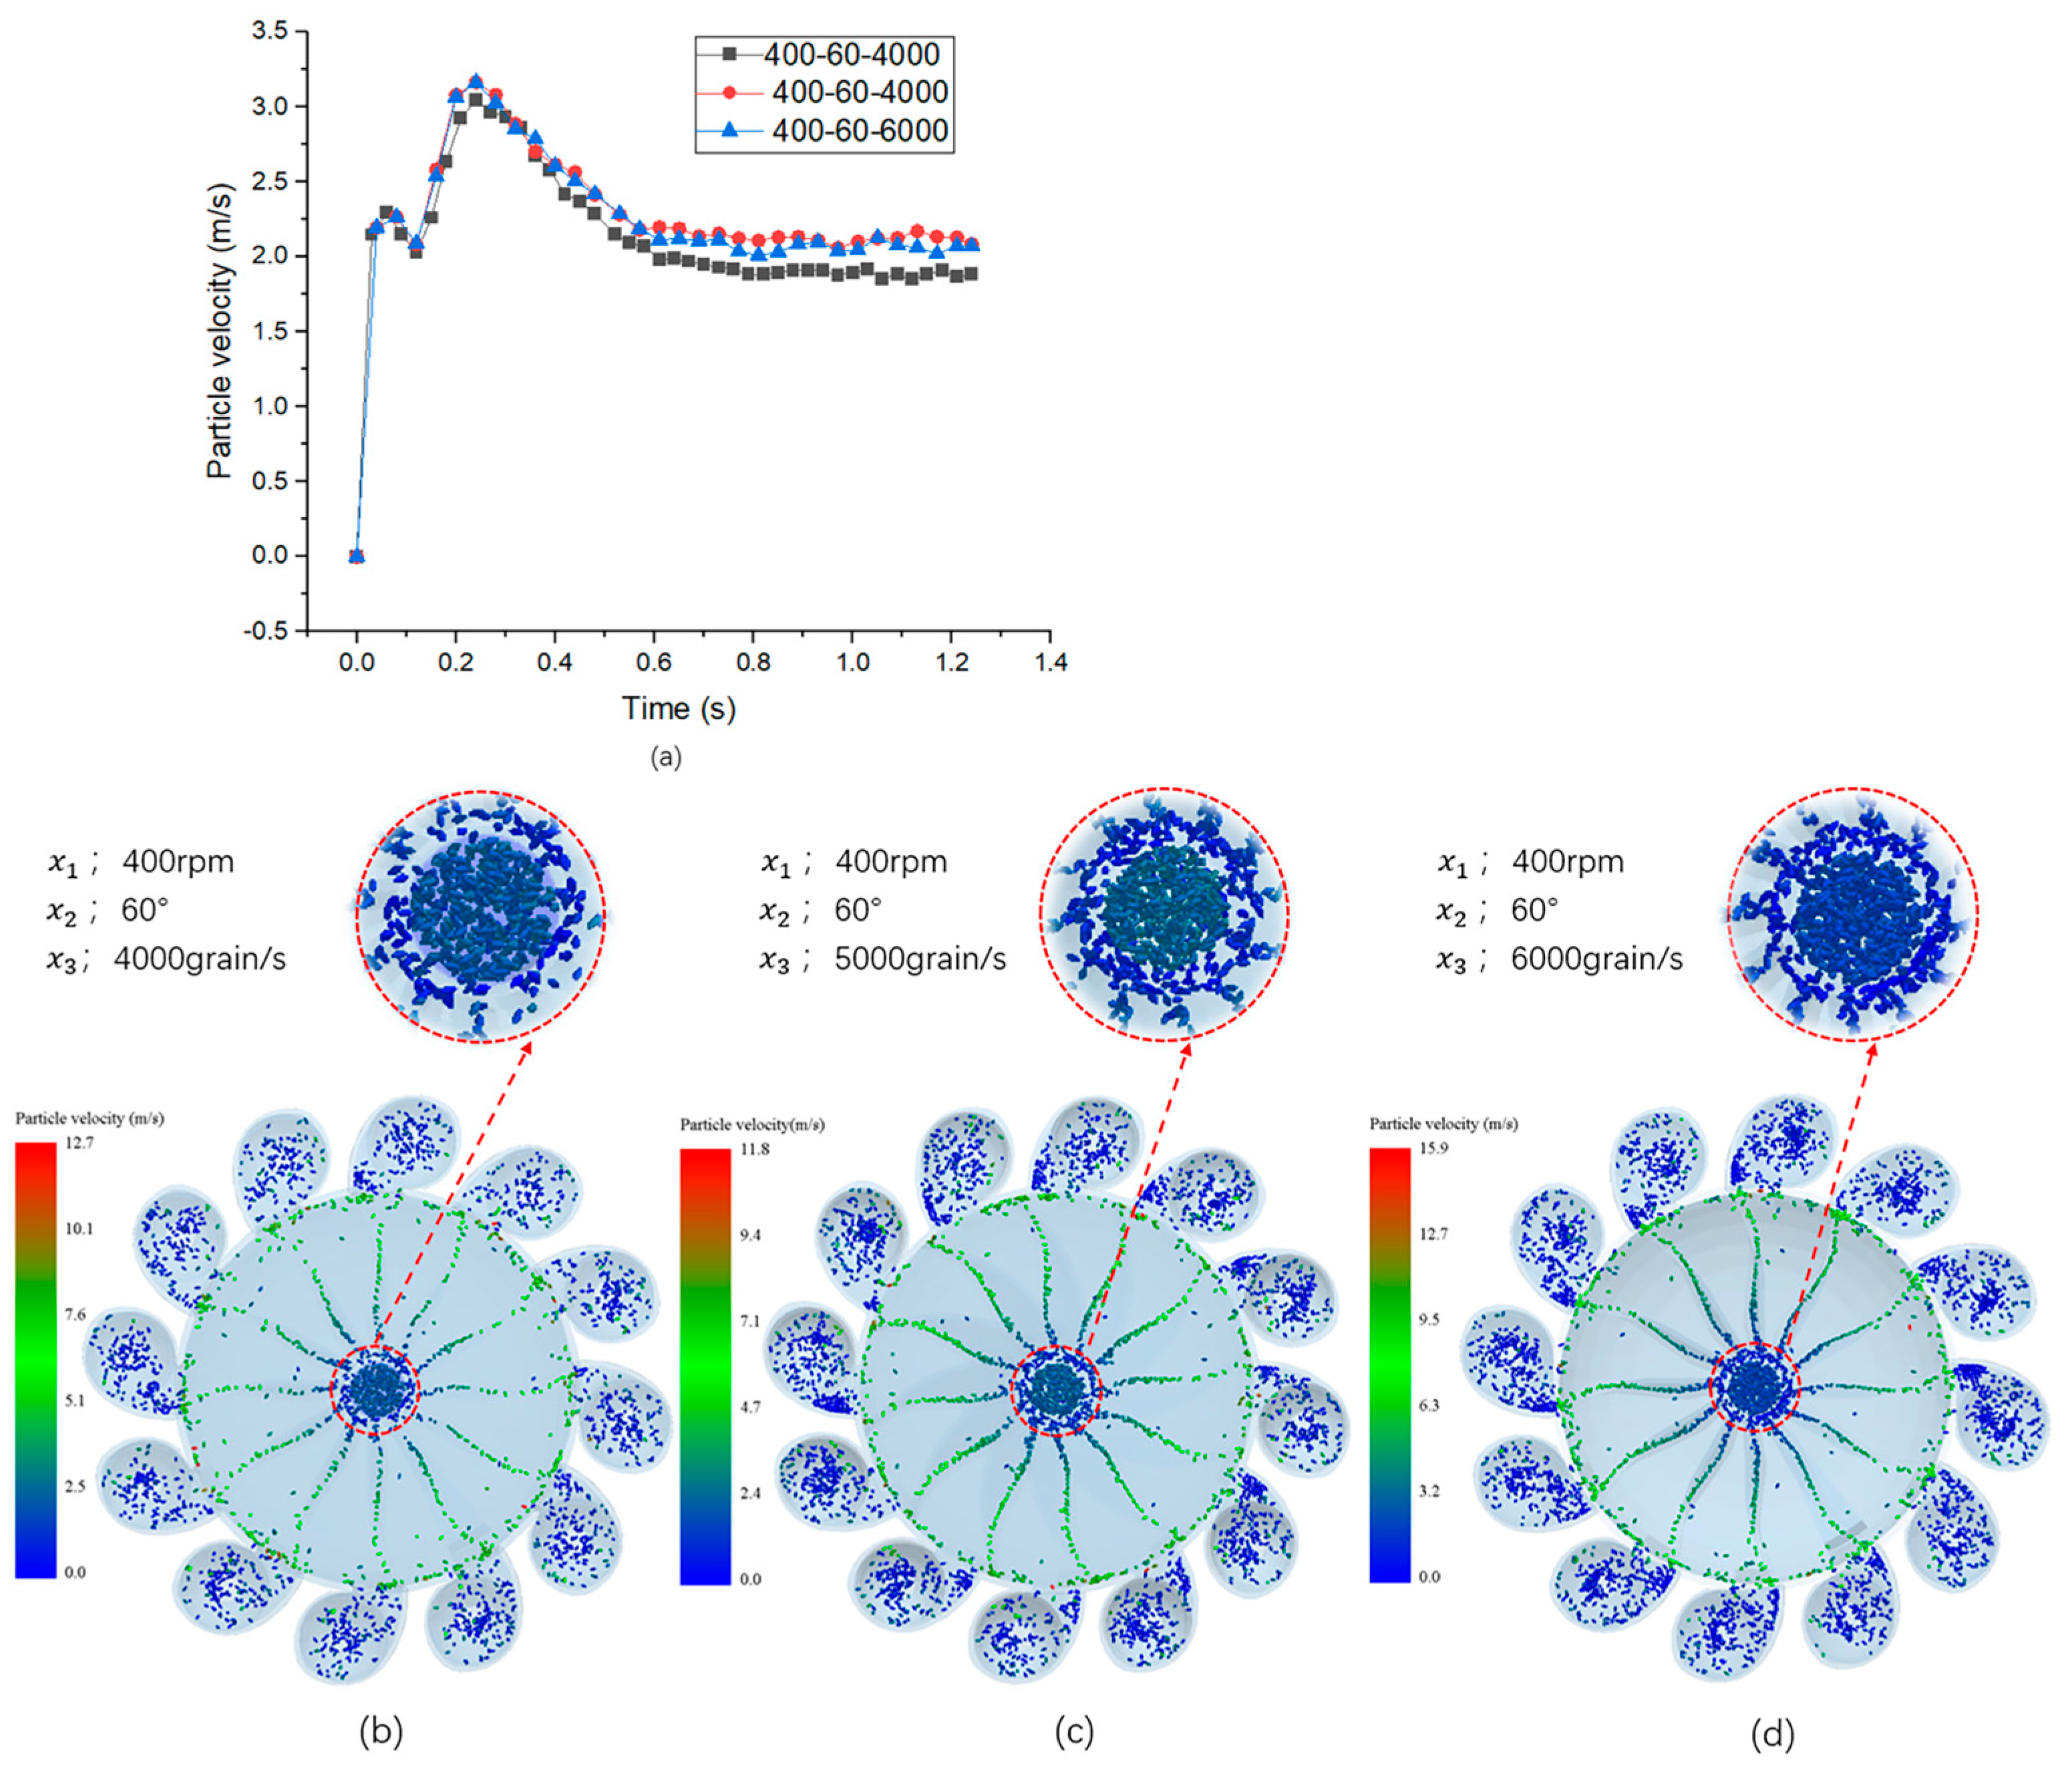
3.1. Analysis of the Results of the Coupling Experiment

The results and evaluation metrics of the orthogonal experiment are shown in Table 5.

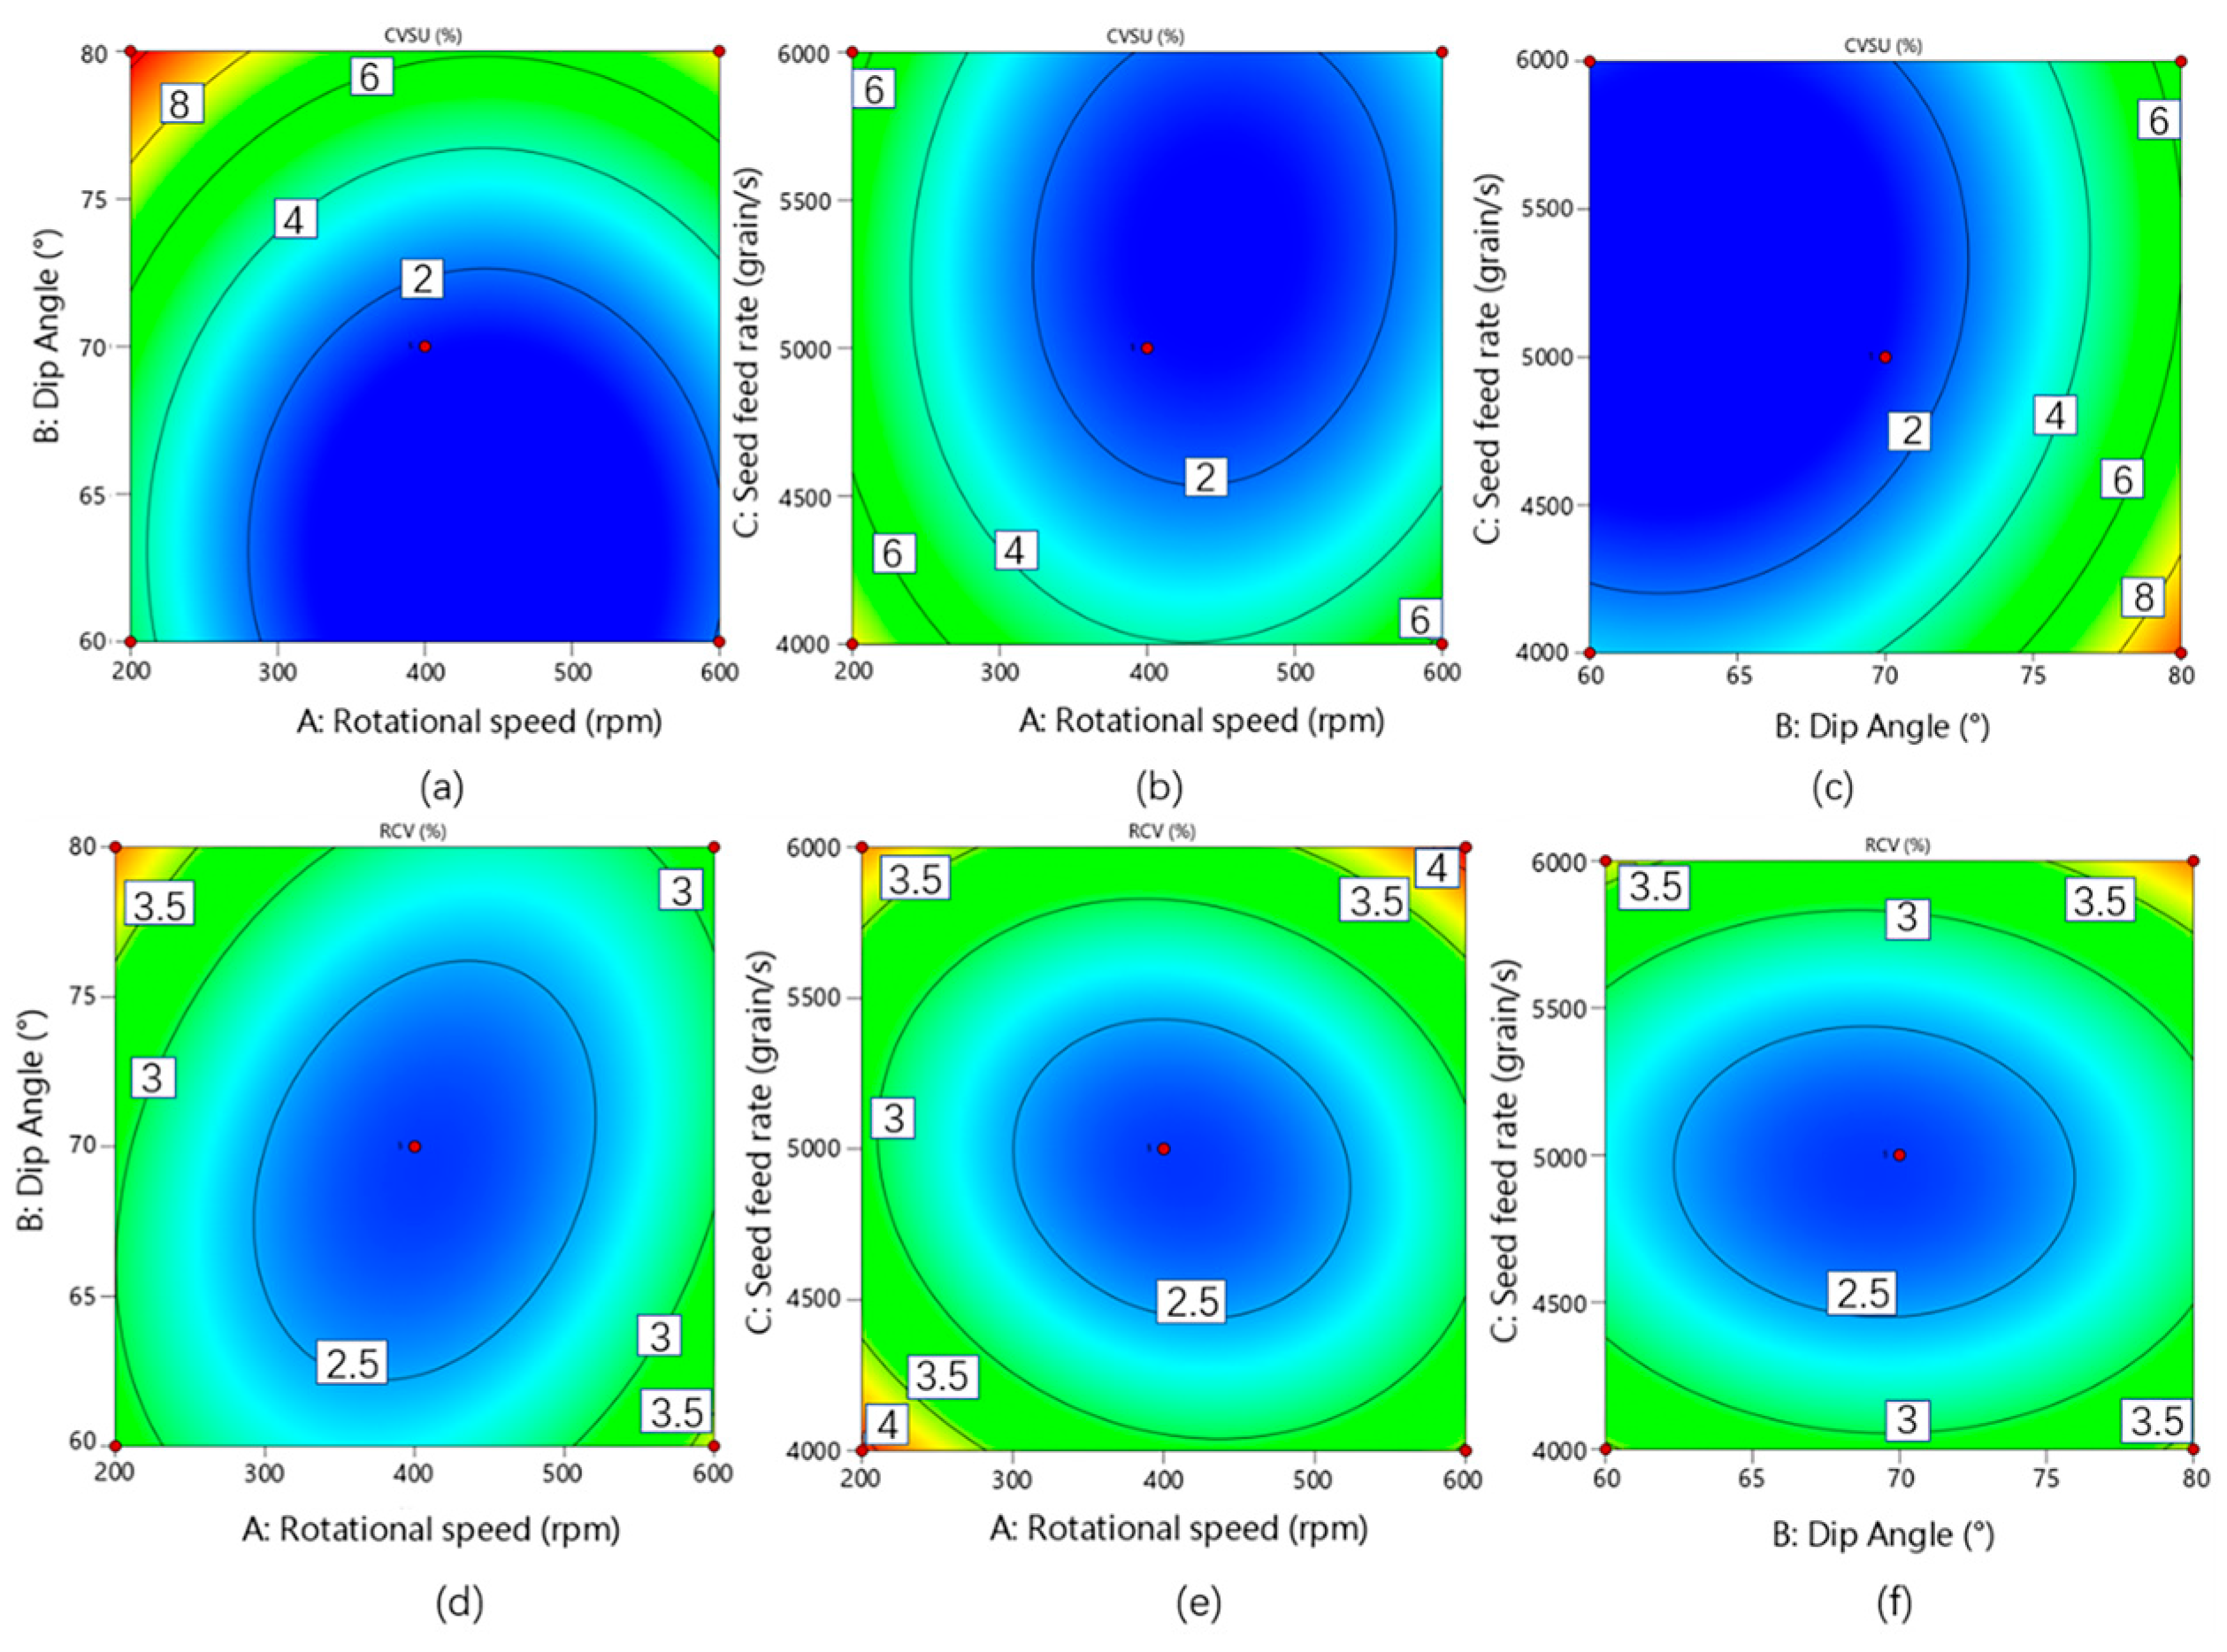
3.2. Analysis of the Effect of Factors on CVSU

The variance results (Table 6) showed that the effects of rotational speed, guide strip dip angle, and seed feed rate were all highly significant for CVSU. The effects of three factors on the CVSU all tend to decrease and then increase with the increase in factor values, and the order of priority was B > A > C. The three factors had the same trend of influence on CVSU. For example, with a guide strip dip angle of 60° and a seed feed rate of 5000 grains/s, the rotational speed was increased from 200 rpm to 600 rpm, and the CVSU decreased from 4.78% to 1.82% and then rose from 1.22% to 2.31%, which on the one hand means that the time for the end of the guide strip to sweep over the two adjacent seed outlets becomes shorter with the increase in rotational speed and on the other hand means that the increase in rotational speed also accelerates the air-phase force, which was dominated by a drag force, as shown by Equation (13) and CFD–DEM coupling results, which leads to change in flow field and the shell seed outlet, as indicated by the coupling results as well.
From Equation (13) and the coupling results of CFD–DEM, it can be seen that the increase in rotational speed causes changes in the flow field, the pressure difference at the inlet increased as the rotational speed increased, and an unstable high-pressure region gradually appeared at the guide strip and the shell seed outlet, which affects the flow field velocity. The difference in flow velocity between the shell seed outlet and the guide strip is shown in Figure 5d–f, and the variation of flow field pressure is shown in Figure 5a–c. Seeds were dispersed away from the seed inlet in a more orderly manner by airflow forces, which was due to uniform airflow velocity and smooth pressure favoring smooth seed discharge [31]. And then the CVSU rises with the increase in rotational speed, one reason being that the increase in rotational speed increases the seed pickup frequency of the guide strip, which makes the difference in seed pickup between the guide strips increase. Another factor was that (Figure 6d) under the influence of higher rotational speed, a small number of seeds left the guide strip after impact and stayed between the outside of the guide strip and the shell and then entered into the inoculating capsule under the effect of airflow drag force, which affected the orderly discharge of seeds.
In addition, the effect of seed feed rate on CVSU is illustrated by an example. At a rotational speed of 400 rpm and a guide strip dip angle of 60°, the seed feed rate was increased from 4000 grains/s to 6000 grains/s, and the CVSU was reduced from 2.66% to 1.22% and then increased to 1.31%. Referring to Figure 7, it can be seen that the thickness of the seed layer diverted at the centrifugal spin cone angle of the concave plate increased with the increase in the seed feed rate, which improves the scattered seed diversion effect. However, as the seed feed rate continues to increase, the thickness of seed layer on the centrifugal spin cone angle increases, and, at the same time, the flow field changes as the amount of seed becomes larger (Figure 8), which leads to a deterioration in the seed dispersion effect. A guide strip dip angle is mainly a centrifugal concave plate tilted to the plate on the guide strip and the plate surface of different dip angles will affect the gas flow rate. A tilted guide strip is conducive to compression of air and acceleration of the speed of airflow. Through analysis, it can be seen that when the guide strip dip angle was too small, the role of seed in the airflow was strong, the airflow was low, and the seeds dispersed. When the guide strip dip angle was too large and the airflow was slightly less concentrated, the role of seed force was smaller.

3.3. Analysis of the Row-to-Row Seeding Amount Coefficient of Variation (RSCV) across Rows of Displacement

The experimental (Table 5) and variance results (Table 6) showed that the effect of rotational speed and guide strip dip angle on RSCV was significant, and the effect of seed feed rate on the RSCV was extremely significant, with the degree of influence being C > B > A in that order. As shown in Figure 9d–f, the trend of three factors for RSCV was the same as that for CVSU (Figure 9a–c), but in a slightly different way. RSCV decreases and then increases as the three factors increase. The increase in rotational speed, dip angle, and seed feed rate caused orderly increases in airflow velocity, seed layer thickness, and seed taking uniformity, and the wheat seeds taken between 12 guides at the same time moved to the inoculation capsule on the centrifugal concave plate by the airflow-assisted force, and at this time, the RCV had a decreasing trend. Then, as the rotational speed, dip angle, and seed feed rate increased continuously, there were some problems as the effect of scattering seed diversion became weaker and the drag force of airflow became weaker, resulting in the phenomenon that the seeds left the guide strip and were discharged by drag force alone, and the RSCV rose gradually.

3.4. Quadratic Optimization

3.4.1. Model Tuning and Parameter Optimization

The two-dimensional contour plots were plotted by Design-Expert to co-ordinate and analyze the pattern and degree of influence for rotational speed, guide strip dip angle, and seed feed rate on CVSU and RSCV (e.g., Figure 9). It can be seen from (a), (b), (d), and (e) that the increase in RPM favors the decrease in both metrics, and the CVSU reaches the optimal solution region in preference to the RSCV, but both metrics increase as the RPM continues to increase. As the guide strip dip angle increased, the CVSU was in an upward trend, and the RSCV showed a decreasing and then increasing trend as shown in Figure 9a,c,d,f.
According to the influence analysis of the three factors (speed, guide angle, seed feed rate) in Figure 9 on the two indicators (CVSU and RSCV), combined with the rationality analysis of the optimal value given by Design-Expert (Table 7), the rotational speed was 408 rpm, the dip angle was 69°, and the seed feed was 4938 grains/s, which was in the optimal solution area. The 1000-grain weight of wheat seed is 43.6 g, the sowing amount per hectare is 228 KG, and the optimized seeding device can sow 3.4 hectares per hour, which was determined to be the optimal solution. The parameters were modified and the optimized CFD–DEM coupled simulation experiments were carried out. The results showed that the flow velocity was increased, the flow field was stable, and the internal pressure was more uniform, as shown in Figure 10a,b.

3.4.2. Bench Experiment Results

To verify the accuracy of optimized simulation results, a centrifugal concave plate with 69° tilted guide strips was printed by a 3D printer for bench-top experiments. The bench experiment is shown in Figure 11. The bench experiment was unable to show the internal flow field, so the simulation results were verified by measuring the flow velocity and pressure at the center of the inoculation capsule utilizing a hand-held wind speed, volume, and pressure measuring instrument. Because of the shielding of tilting guide strips, it was not possible to collect seed distribution shapes at the same time by the high-speed camera, so the choice was made to collect the real-time seed yield results from 12 ports through multiple real-time weighing devices to compare with the simulation results. Nine groups with large differences were selected from the CFD–DEM coupled simulation results of optimal values and the bench experiment results, as shown in Figure 10c. Comparing the seed yield of the simulation experiment, the evaluation index is shown in Figure 10d. The experimental results show that the flow field effect of the bench experiment was consistent with that of simulation experiment, and the difference between the number of seeds collected by the multichannel real-time weighing device and the simulation seed discharge effect was small. Due to the large radius of the centrifugal concave plate (265 mm), the slight shaking of the bench at high speeds affects the perpendicularity between the motor and centrifugal concave plate, which ultimately affects the seed discharging effect.

4. Conclusions

In this study, a centrifugal wheat strip seeding device was designed to meet the demand for high sowing operation speed in sustainable agriculture. The magnitudes of effects for guide strip dip angle, centrifugal concave plate speed, and seed feed rate on the internal flow field, seed movement characteristics, and sowing performance were investigated using CFD–DEM coupled simulation based on the DDPM interface. The conclusions were as follows:
(1)
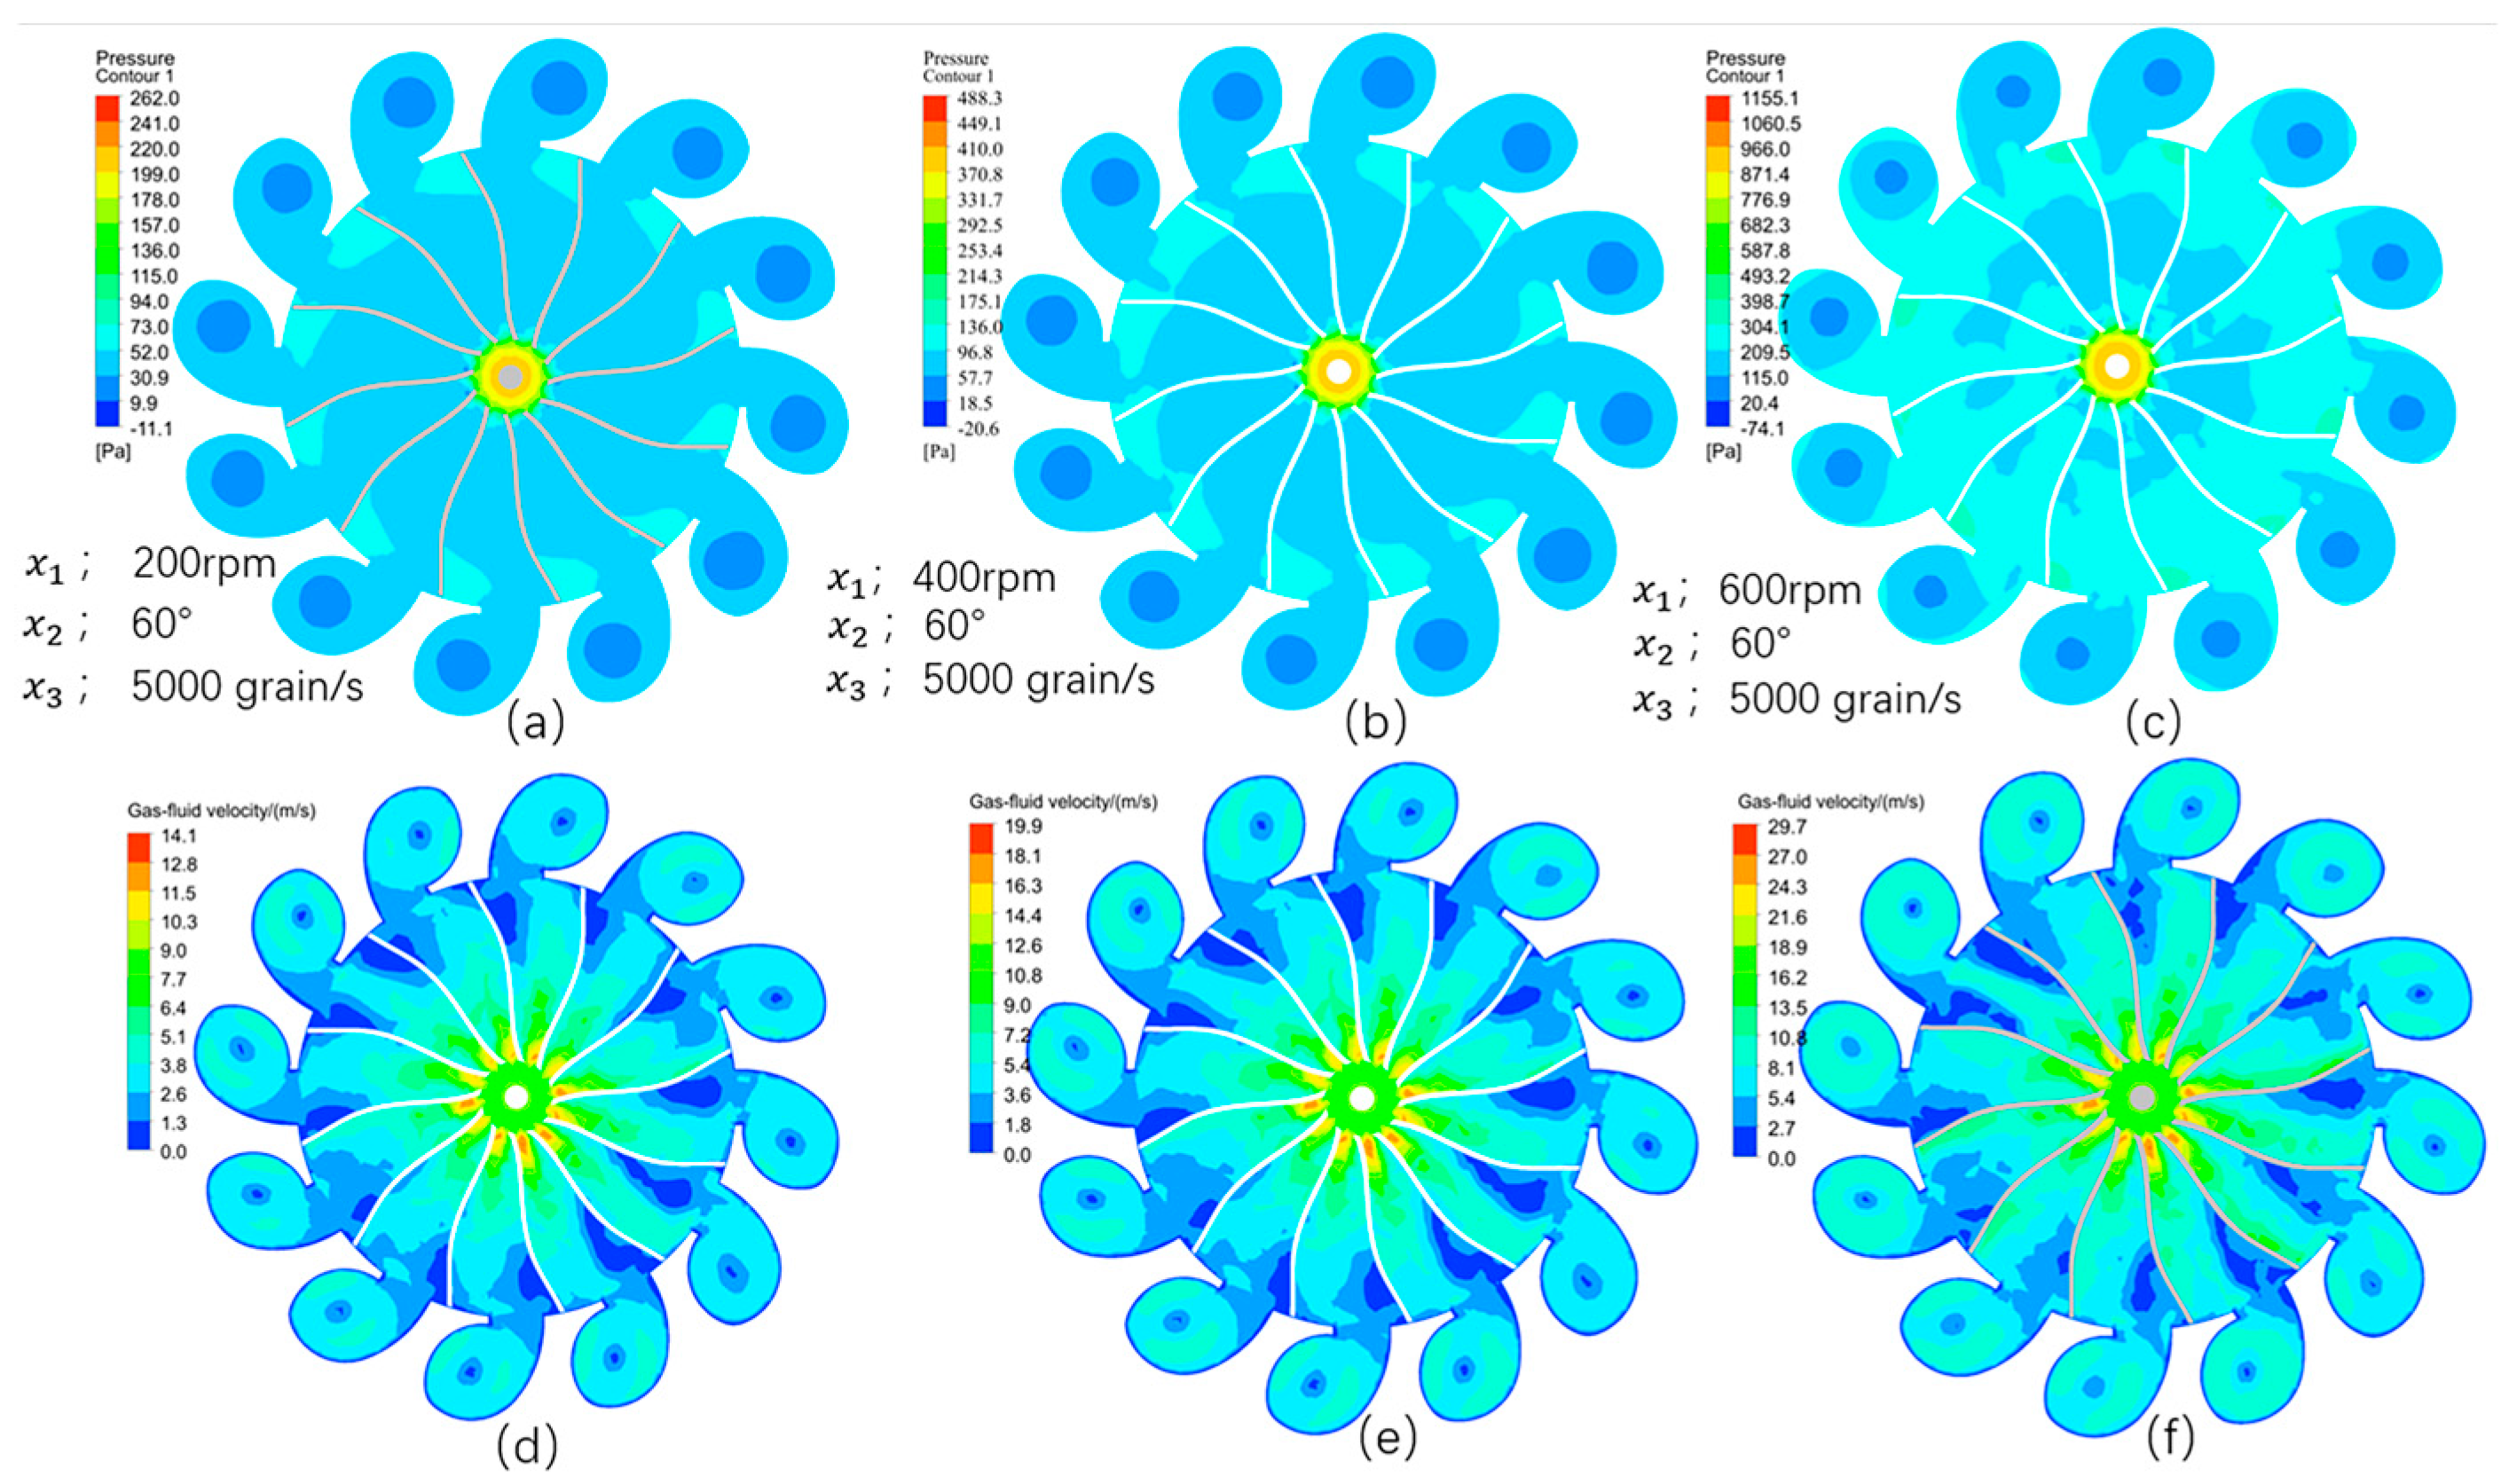
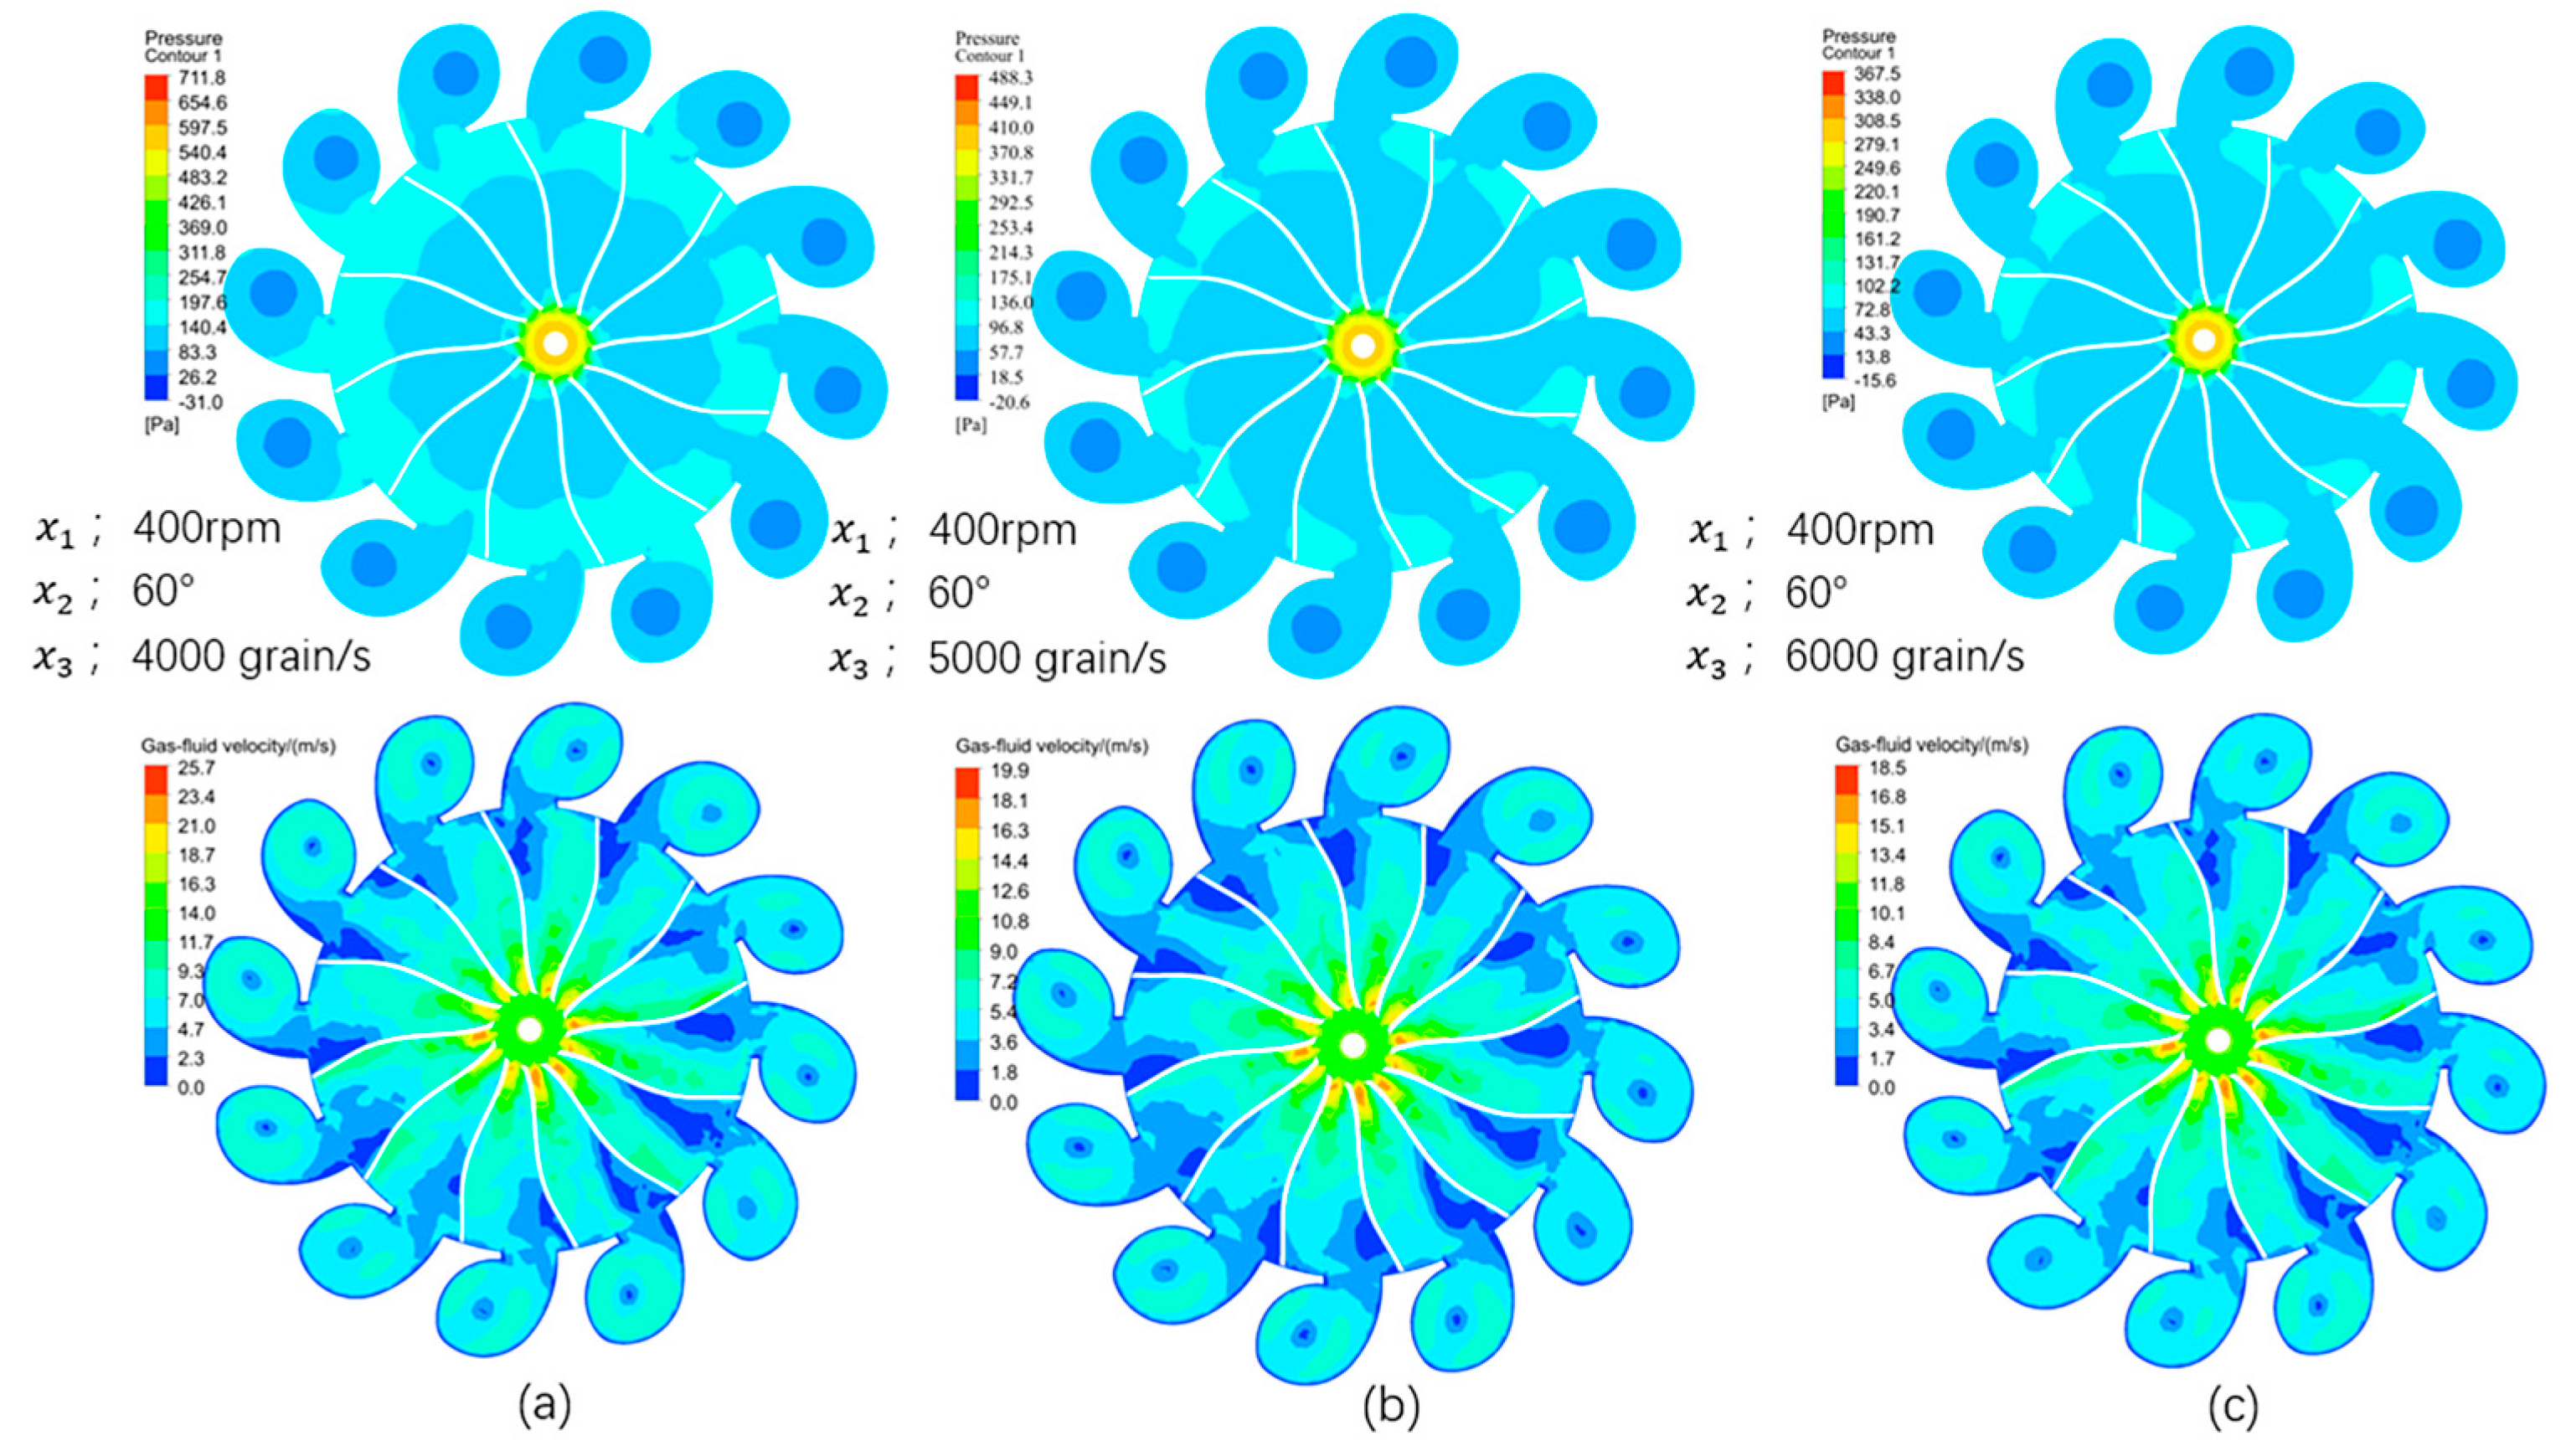
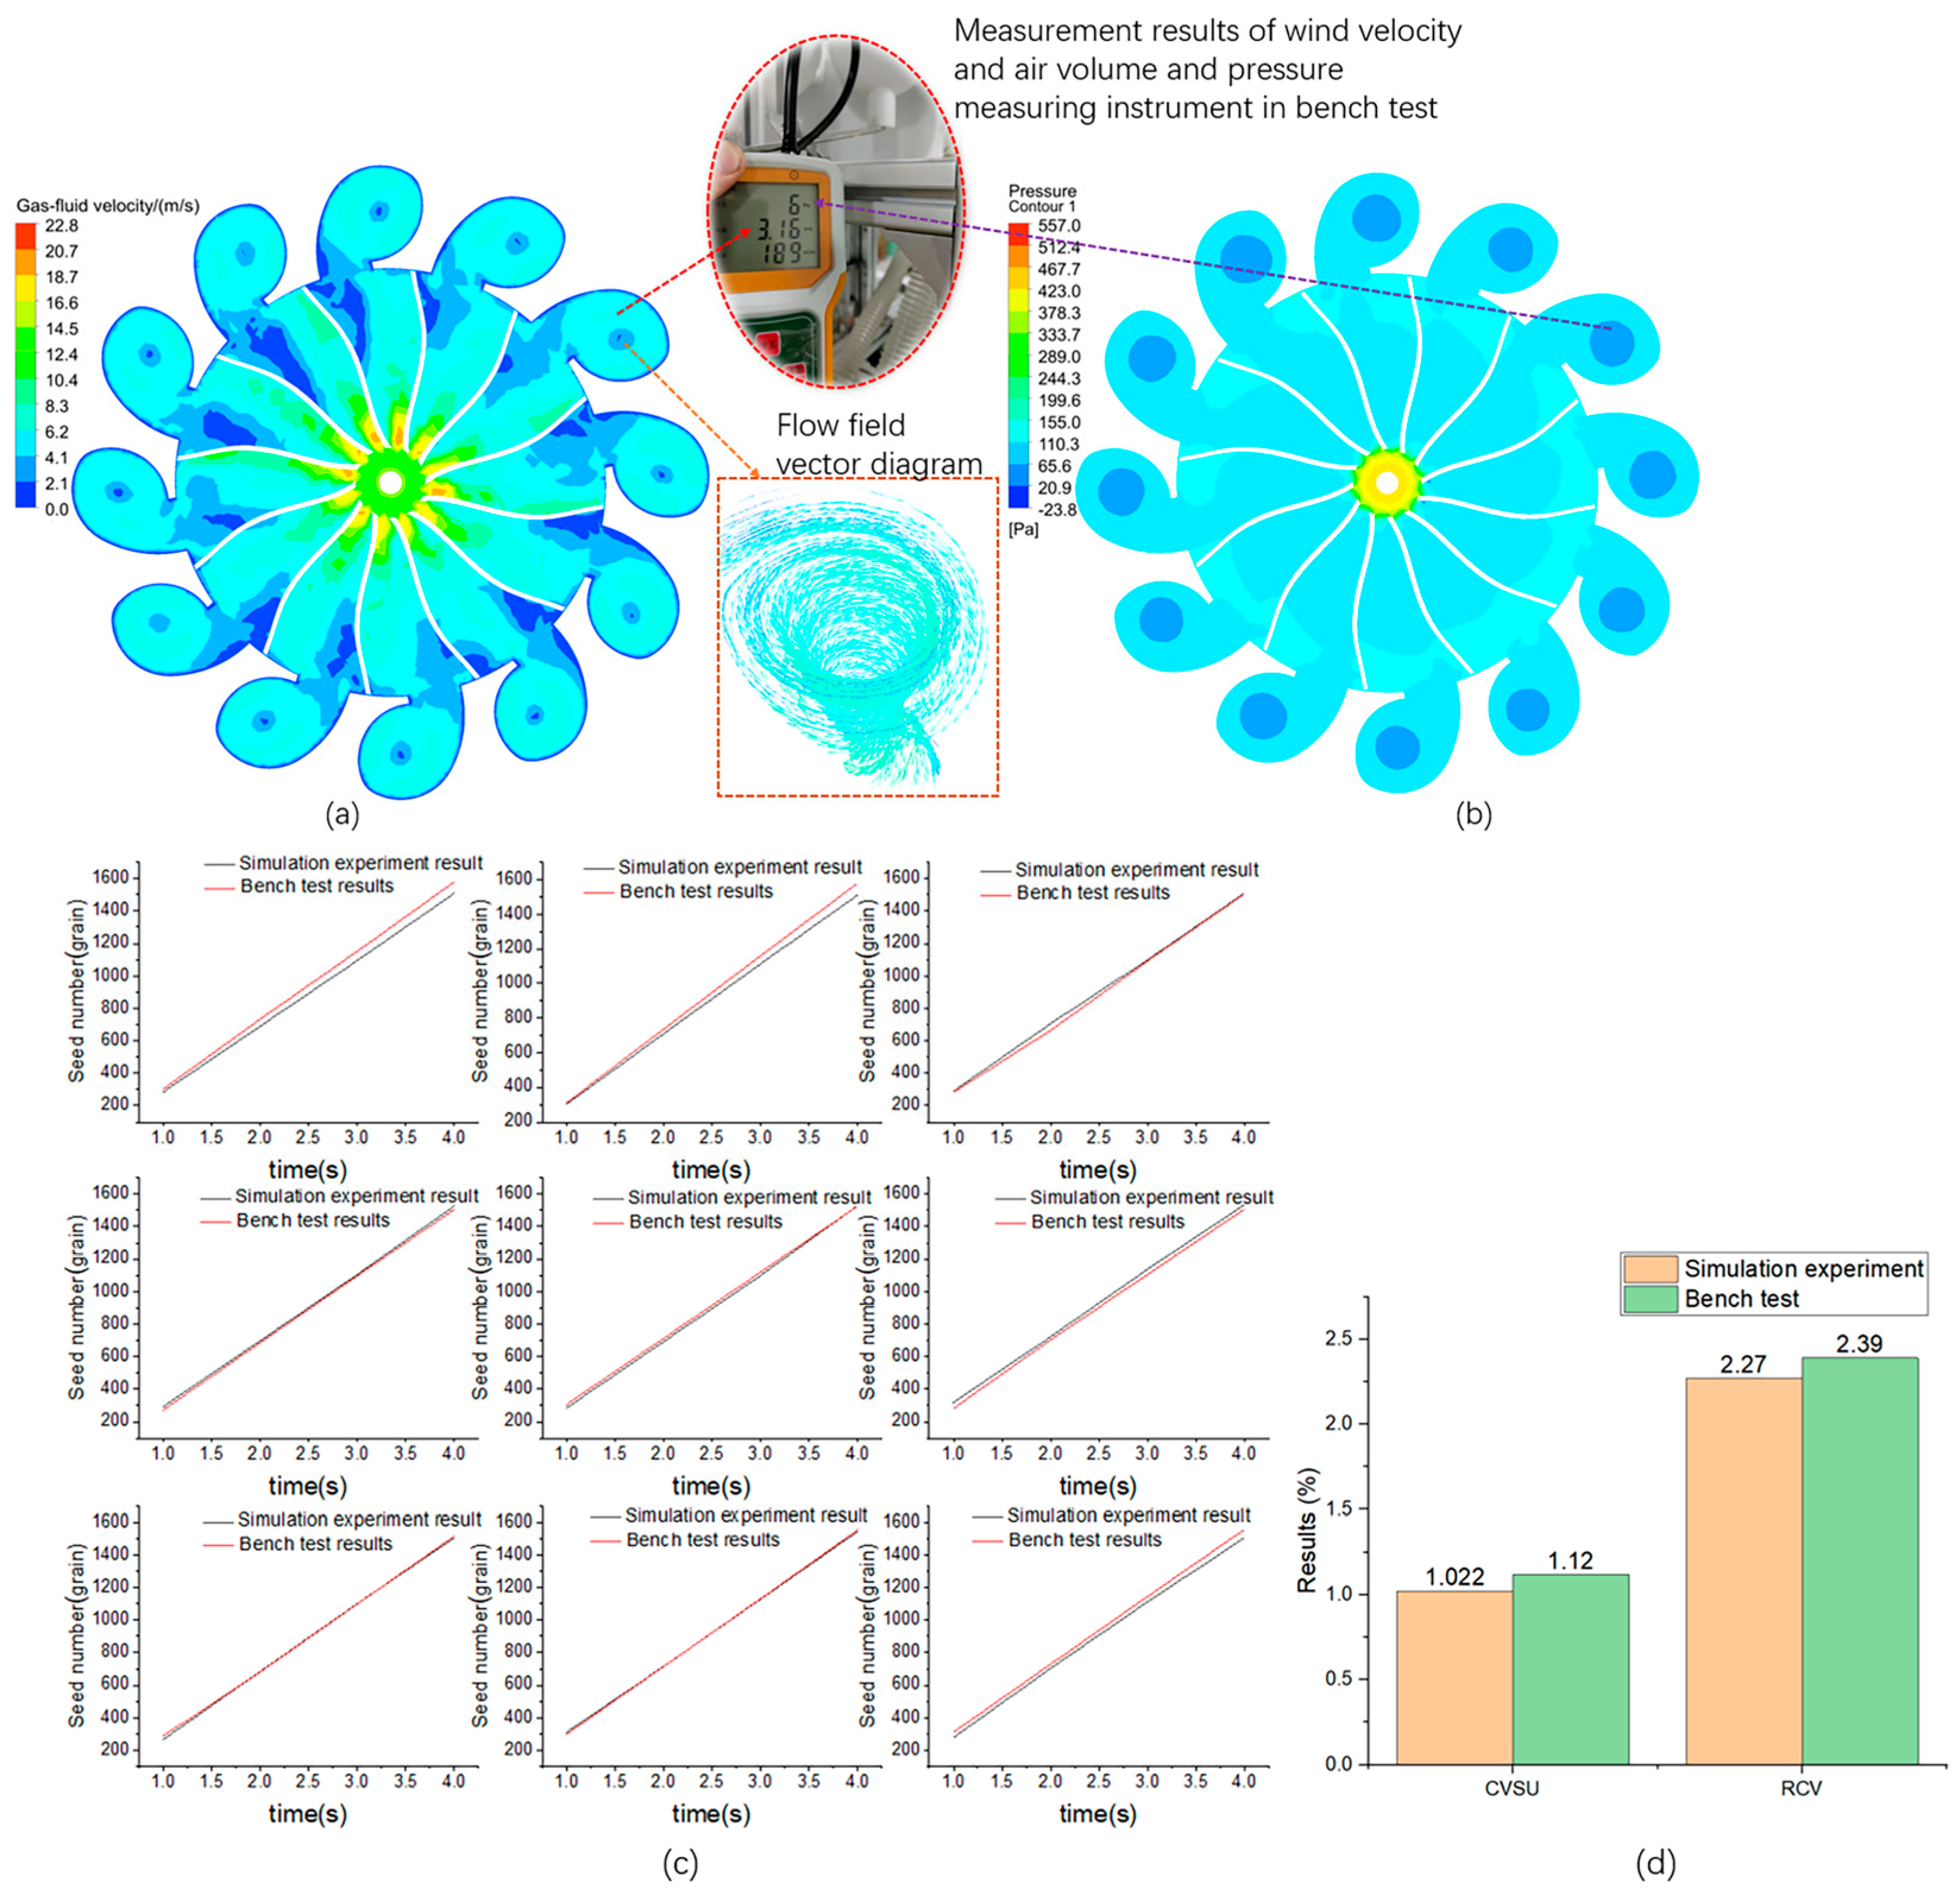
ANSYS-FLUENT was used to simulate the flow field characteristics of the seeding device, the effects of different parameters on the distribution of the flow field, flow velocity, and pressure at the seed inlet, inside the device, and on the inoculation capsule were analyzed, and the rotational speed, the guide strip dip angle, and the seed feed rate were determined to be the main parameters. As a result of the coupled CFD–DEM simulation, it is observed that the flow field velocity increases with the speed of rotation and guide strip dip angle and decreases with the seed feed rate. As the flow rate increases, local turbulence occurs in the flow field, which affects seed discharge.
(2)
The orthogonal experimental design was chosen to obtain the primary and secondary factors affecting the seeding performance indexes of the centrifugal wheat strip seeding device, and the reliability of the influence of rotational speed, guide strip dip angle, and seed feed rate on the seeding indexes CVSU and RSCV was verified. The optimal solution for quadratic optimization was determined: 408 rpm, 4938 grains/s, and 69° guide strip angle.
(3)
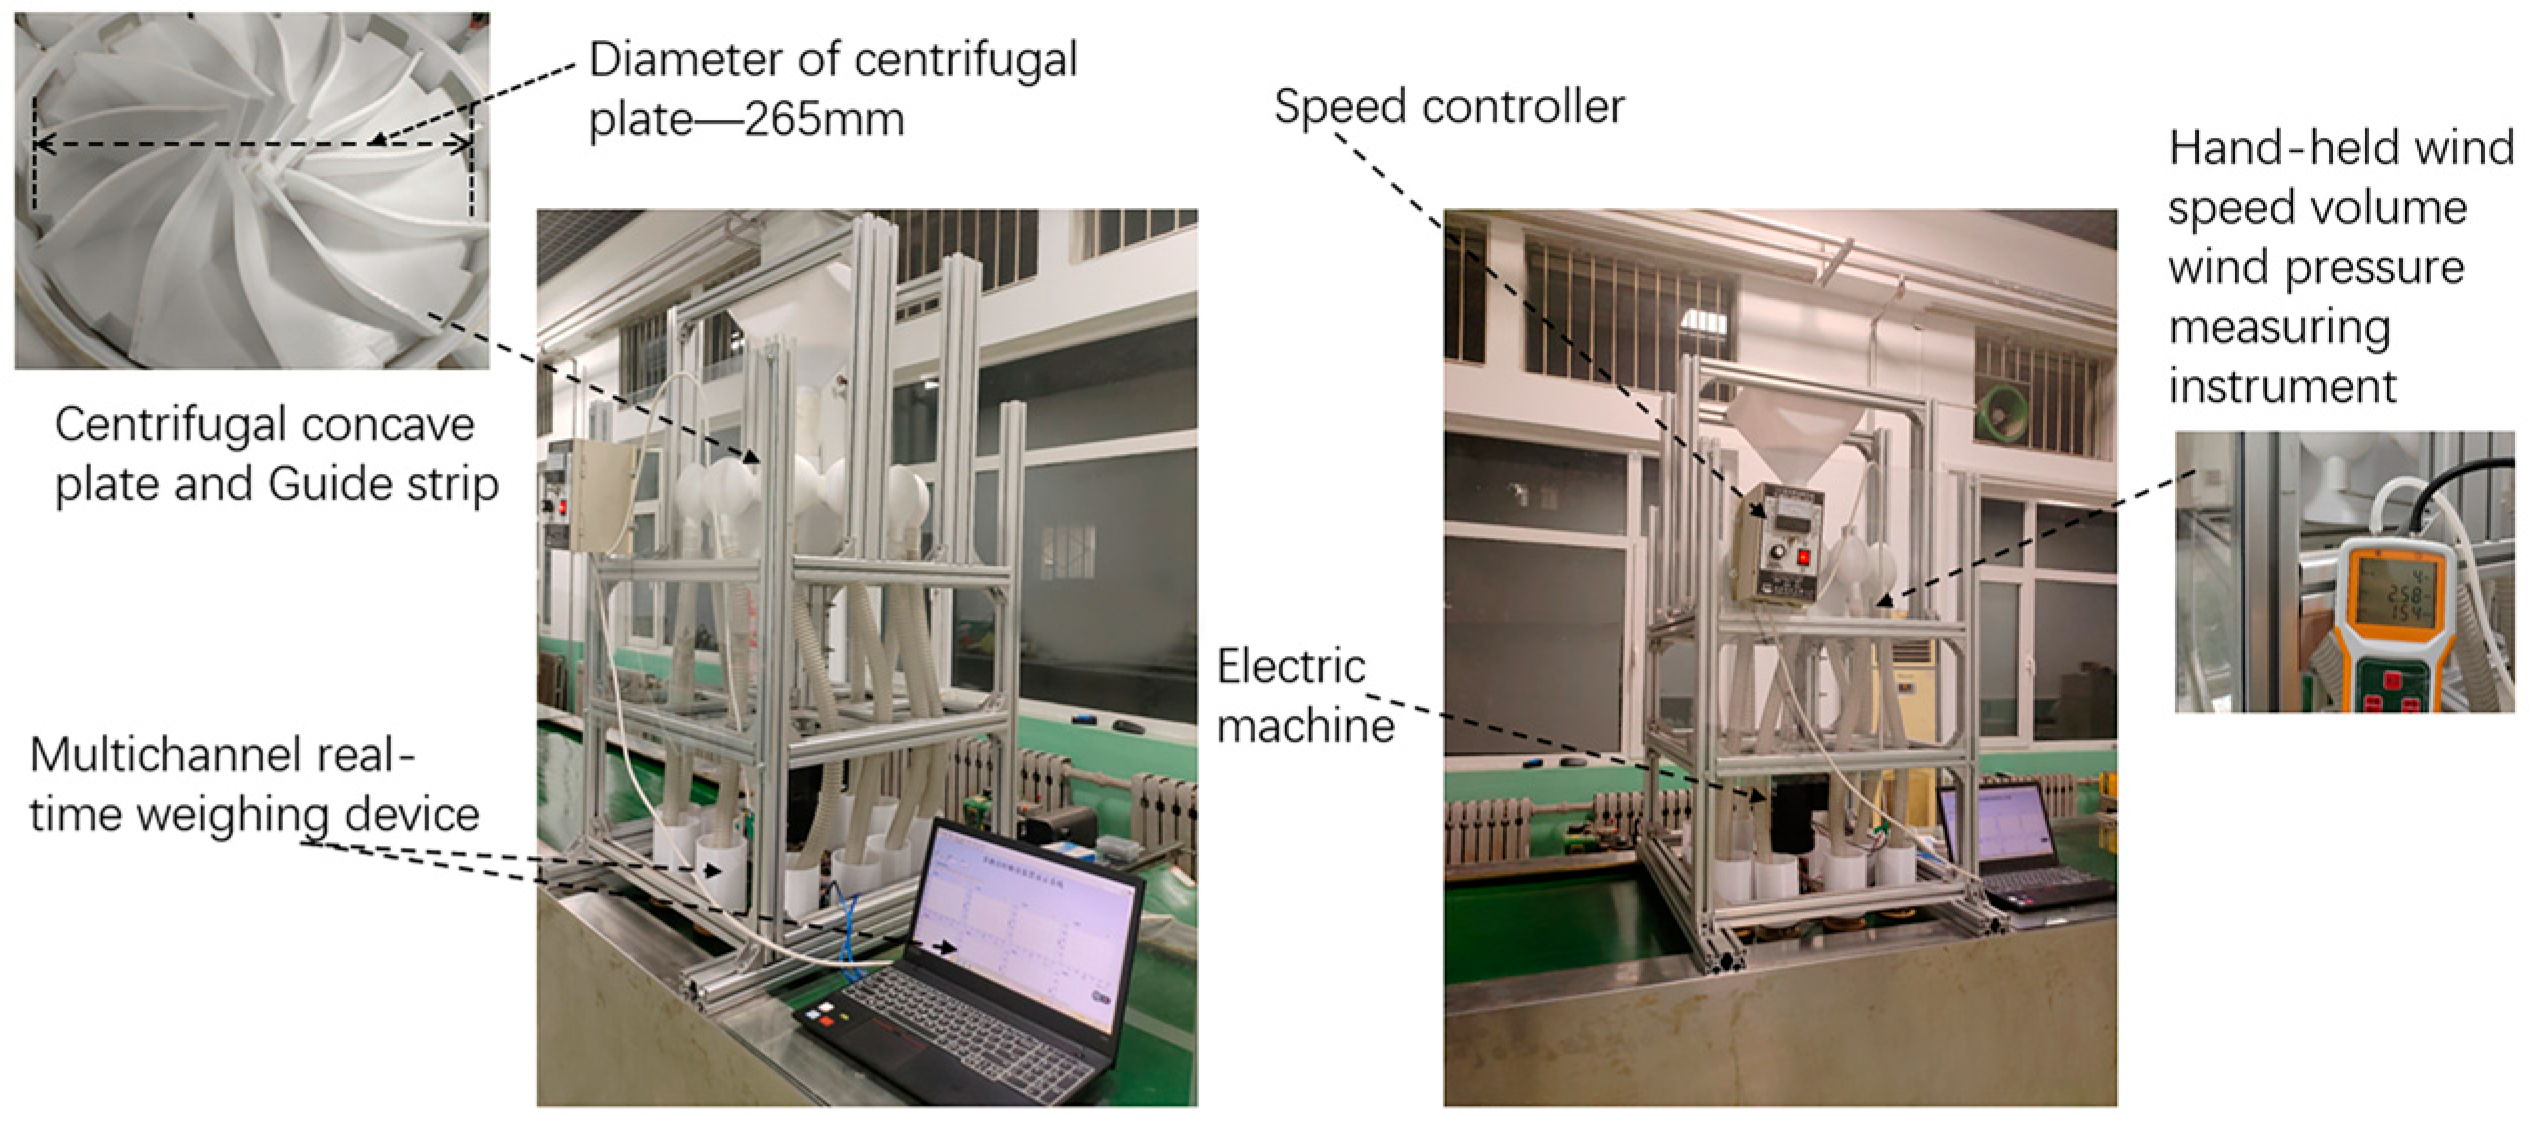
Bench experiments were conducted to verify the simulation results by collecting real-time seed output from each port through the multichannel real-time weighing device. The optimized simulation results were CVSU of 1.022% and RSCV of 2.27% and the bench experiment results were CVSU of 1.12% and RSCV of 2.39%.

Author Contributions

Conceptualization, X.A. and X.Z.; methodology, X.W.; machine design, Y.H. and X.A.; software, H.L. and L.L.; validation, X.C. and M.L. (Minghao Liu); writing—original draft preparation, X.A. and Y.H.; writing—review and editing, X.A. and M.L. (Meng Liu); supervision, X.C.; funding acquisition, X.A. and X.Z. All authors have read and agreed to the published version of the manuscript.

Funding

This work was supported financially by the National Natural Science Foundation of China (Grant No. 51805300 and Grant No. 32101631) and the Youth Innovation Team Project of Shandong Colleges and Universities.

Institutional Review Board Statement

Not applicable.

Informed Consent Statement

Not applicable.

Data Availability Statement

All data are presented in this article in the form of figures and tables.

Acknowledgments

The authors would like to thank their teacher and supervisor for the advice and help during the experiments. We also appreciate the editor and anonymous reviewers for their valuable suggestions for improving this paper.

Conflicts of Interest

The authors declare no conflict of interest.

References

  1. NBSPRC. Announcement on 2022 Grain Production Data. Mod. Flour Milling Ind. 2023, 37, 18. [Google Scholar]
  2. Teng, S.H.; Li, X.X.; Liu, Q.J. Effects of Climate Change on Main Growth Stages of Winter Wheat in Linyi and Determination of Suitable Sowing Time. J. Agric. 2023, 13, 18–24. [Google Scholar]
  3. Shu, C.X.; Wei, Y.P.; Liao, Y.T.; Lei, X.L.; Li, Z.D.; Wang, D.; Liao, Q.X. Influence of air blower parameters of pneumatic seed-metering system for rapeseed on negative pressure characteristics and air blower selection. Trans. CSAE 2016, 32, 26–33. [Google Scholar]
  4. Chen, H.T.; Li, T.H.; Wang, H.F.; Wang, Y.; Wang, X. Design and parameter optimization of pneumatic cylinder ridge three-row close-planting seed-metering device for soybean. Trans. CSAE 2018, 34, 16–24. [Google Scholar]
  5. Yong, S.; Liao, Y.T.; Liao, Q.X. Experimental study on pneumatic seed-metering system of 2BFQ-6 precision planter for rapeseed. Trans. CSAE 2012, 28, 57–62. [Google Scholar]
  6. Liao, Y.T.; Huang, H.D.; Li, X.; Yu, J.J.; Yan, Q.X.; Liao, Q.X. Effects of Seed Pre-soaking on Sowing Performance by Pneumatic Precision Metering Device for Papeseed. Trans. Chin. Soc. Agric. Mach. 2013, 44, 72–76. [Google Scholar]
  7. Shi, S.; Zhang, D.X.; Yang, L. Simulation and verification of seed-filling performance of pneumatic-combined holes maize precision seed-metering device based on EDEM. Trans. CSAE 2015, 31, 62–69. [Google Scholar]
  8. Yan, B.X.; Zhang, D.X.; Cui, T.; He, X.T.; Ding, Y.Q.; Yang, L. Design of pneumatic maize precision seed-metering device with synchronous rotating seed plate and vacuum chamber. Trans. CSAE 2017, 33, 15–23. [Google Scholar]
  9. Lei, X.L.; Liao, Y.T.; Zhang, Q.S.; Wang, L.; Liao, Q.X. Numerical simulation of seed motion characteristics of distribution head for rapeseed and wheat. Comput. Electron. Agric. 2018, 150, 98–109. [Google Scholar] [CrossRef]
  10. Liao, Y.T.; Wang, L.; Liao, Q.X. Design and test of an inside-filling pneumatic precision centralized seed-metering device for rapeseed. Int. J. Agric. Biol. Eng. 2017, 10, 56–62. [Google Scholar]
  11. Deng, L.J.; Qiao, T.F. Design and Experiment of Wheat Precision Metering Device Based on EDEM. J. Agric. Mech. Res. 2021, 43, 158–163. [Google Scholar]
  12. Liu, C.L.; Xin, D.; Zhang, F.Y.; Ma, T.; Zhang, H.Y.; Li, Y.N. Design and Test of Cone Diversion Type Horizontal Plate Wheat Precision Seed-metering Device. Trans. Chin. Soc. Agric. Mach. 2018, 49, 56–65. [Google Scholar]
  13. Xu, H.; Tao, D.C.; Tao, Y.H.; Xiao, B.W. Simulation and Experimental Research on Rice Seed Metering Device Based on EDEM. J. Agric. Sci. Technol. 2018, 20, 64–70. [Google Scholar]
  14. Cheng, X.P.; Lu, C.Y.; Meng, Z.J.; Yu, J.Y. Design and parameter optimization on wheat precision seed meter with a combination of pneumatic and type hole. Trans. CSAE 2018, 34, 1–9. [Google Scholar]
  15. Xing, H.; Zang, Y.; Wang, Z.M.; Luo, X.W.; Pei, J. Design and parameter optimization of rice pneumatic seeding metering device with adjustable seeding rate. Trans. CSAE 2019, 35, 20–28. [Google Scholar]
  16. Manjula, E.V.P.J.; Ariyaratne, W.K.H.; Ratnayake, C.; Melaaen, M.C. A review of CFD modeling studies on pneumatic conveying and challenges in modeling offshore drill cutting transport. Powder Technol. 2017, 305, 782–793. [Google Scholar] [CrossRef]
  17. Liu, M.L.; Wen, Y.Y.; Liu, R.Z.; Liu, B.; Shao, Y.L. Investigation of fluidization behavior of high density particle in spouted bed using CFD–DEM coupling method. Powder Technol. 2015, 280, 72–82. [Google Scholar] [CrossRef]
  18. Oke, O.; Wacgem, B.V.; Mazzei, L. Lateral solid mixing gas-fluidized beds: CFD and DEM studies. Chem. Eng. Res. Des. 2016, 114, 148–461. [Google Scholar] [CrossRef]
  19. Chaumeil, F.; Crapper, M. Using the DEM-CFD method to predict Brownian particle deposition in a constricted tube. Particuology 2014, 15, 94–106. [Google Scholar] [CrossRef]
  20. Almohammed, N.; Alobaid, F.; Breuer, M.; Epple, B. A comparative study on the influence of the gas flow rate on the hydrodynamics of a gas–solid spouted fluidized bed using Euler–Euler and Euler–Lagrange/DEM models. Powder Technol. 2014, 264, 343–364. [Google Scholar] [CrossRef]
  21. Gong, F.C.; Huang, H.; Babadagli, T.; Li, H.Z. A resolved CFD–DEM coupling method to simulate proppant transport in narrow rough fractures. Powder Technol. 2023, 428, 118778. [Google Scholar] [CrossRef]
  22. Ma, H.Q.; Zhou, L.Y.; Liu, Z.H.; Chen, M.Y.; Xia, X.H.; Zhao, Y.Z. A review of recent development for the CFD–DEM investigations of non-spherical particles. Powder Technol. 2022, 412, 117972. [Google Scholar] [CrossRef]
  23. He, L.P.; Liu, Z.X.; Zhao, Y.Z. Study on a semi-resolved CFD–DEM method for rod-like particles in a gas-solid fluidized bed. Particuology 2024, 87, 20–36. [Google Scholar] [CrossRef]
  24. Lai, Z.S.; Zhao, J.D.; Zhao, S.W.; Huang, L.C. Signed distance field enhanced fully resolved CFD–DEM for simulation of granular flows involving multiphase fluids and irregularly shaped particles. Comput. Methods Appl. Mech. Eng. 2023, 414, 116195. [Google Scholar] [CrossRef]
  25. Ma, H.Q.; Liu, Z.H.; Zhou, L.Y.; Du, J.H.; Zhao, Y.Z. Numerical investigation of the particle flow behaviors in a fluidized-bed drum by CFD–DEM. Powder Technol. 2023, 429, 118891. [Google Scholar] [CrossRef]
  26. Ye, M.K.; Chen, H.C.; Koop, A. Verification and validation of CFD simulations of the NTNU BT1 wind turbine. J. Wind Eng. Ind. Aerodyn. 2023, 234, 105336. [Google Scholar] [CrossRef]
  27. Campana, L.; Bossy, M.; Henry, C. Lagrangian stochastic model for the orientation of inertialess spheroidal particles in turbulent flows: An efficient numerical method for CFD approach. Comput. Fluids 2023, 257, 105870. [Google Scholar] [CrossRef]
  28. Bumrungthaichaichan, E. A note of caution on numerical scheme selection: Evidence from cyclone separator CFD simulations with appropriate near-wall grid sizes. Powder Technol. 2023, 427, 118713. [Google Scholar] [CrossRef]
  29. Bivainis, V.; Jotautienė, E.; Lekavičienė, K.; Mieldažys, R.; Juodišius, G. Theoretical and Experimental Verification of Organic Granular Fertilizer Spreading. Agriculture 2023, 13, 1135. [Google Scholar] [CrossRef]
  30. Li, K.; Li, S.; Ni, X.; Lu, B.; Zhao, B. Analysis and Experimental of Seeding Process of Pneumatic Split Seeder for Cotton. Agriculture 2023, 13, 1050. [Google Scholar] [CrossRef]
  31. Hu, H.J.; Zhou, Z.L.; Wu, W.C.; Yang, W.H.; Li, T. Distribution characteristics and parameter optimization of an air-assisted centralized seed-metering device for rapeseed using a CFD–DEM coupled simulation. Biosyst. Eng. 2021, 208, 246–259. [Google Scholar] [CrossRef]
Figure 1. Structure of the centrifugal wheat strip seeding device and seed feeding device: (a) is a perspective view, where 1—seed feed tube; 2—dip guide strip; 3—seed outlet notch; 4—centrifugal concave plate; 5—shell outlet; 6—inoculation capsule; 7—shell; (b) is a sectional view; (c) is a seed feeding device.
Agriculture 13 01883 g001
Figure 2. Schematic diagram of the seed filling and discharging process.
Agriculture 13 01883 g002
Figure 3. Schematic diagram of the seed filling and discharge process: (a) seed filling process; (b) seed discharge from the centrifugal concave plate.
Agriculture 13 01883 g003
Figure 4. CFD model grid and DEM model of wheat seeds: (a) wheat seed modeling in EDEM; (b) FLUENT delineation of the model grid; (c) dynamic mesh through UDF-driven centrifugal concave plate and dip angle guide strip.
Agriculture 13 01883 g004
Figure 5. Flow velocity and pressure plots of the coupled CFD–DEM flow field: (a,d) for the 200 rpm condition; (b,e) for the 400 rpm condition; (c,f) for the 600 rpm condition.
Agriculture 13 01883 g005
Figure 6. CFD–DEM coupled seed distribution and seed velocity: (a) shows the variation of seed velocity under each condition, where A, B, C, and D are the four stages of the seed discharging process, respectively; (bd) are the simulation results of seed distribution in the seed discharger under the rotational speeds of 200 rpm, 400 rpm, and 600 rpm, respectively.
Agriculture 13 01883 g006
Figure 7. CFD–DEM coupling of seed distribution and seed velocity: (a) shows the variation of seed velocity under each condition; (bd) are the simulation results of seed distribution in the seed discharger under the seed feed rate of 4000 grains/s, 5000 grains/s, and 6000 grains/s, respectively.
Agriculture 13 01883 g007
Figure 8. CFD–DEM coupled velocity and pressure maps of flow field: (a) velocity and pressure cloud of the flow field for a feed rate of 4000 grains/s; (b) velocity and pressure cloud of flow field for a feed rate of 5000 grains/s; (c) velocity and pressure cloud of flow field for a feed rate of 4000 grains/s.
Agriculture 13 01883 g008
Figure 9. Two-dimensional contours of speed effects, guide strip dip angle, and seed feed rate for CVSU and RSCV: (ac) are for CVSU; (df) are for RSCV.
Agriculture 13 01883 g009
Figure 10. Comparison of flow rate graphs, pressure graphs, experimental results, and bench experiment results of simulation under optimal parameter conditions: (a) flow rate graphs; (b) pressure graphs; (c) comparison of simulation experiments and bench experiments in terms of seed yield; (d) comparison of simulation experiments and bench experiment results for CVSU, RSCV.
Agriculture 13 01883 g010
Figure 11. Diagram of bench-top experimental equipment.
Agriculture 13 01883 g011
Table 1. Simulation parameters of ANSYS-FLUENT and EDEM.
ProjectResearch TargetParameterNumerical Value
EDEM solid phaseWheat seedThree-axis dimensions (mm)5.99 × 3 × 3
Thousand-grain weight (g)43.6
Poisson’s ratio0.42
Shear modulus (PA) 5.1 × 10 7
Equivalent diameter (mm)3.83
Densities/(Kg· m 3 ) 1.35 × 10 3
Seed–seedCrash recovery factor0.42
Coefficient of static friction0.35
Coefficient of kinetic friction0.05
Seed–seed dispenserCrash recovery factor0.75
Coefficient of static friction0.4
Coefficient of kinetic friction0.05
Seed dispenser made of ABSPoisson’s ratio0.384
Shear modulus/PA 2.2 × 10 6
Densities (Kg· m 3 )1050
ANSYS-FLUENT gas phaseAtmosphereGravitational acceleration (m/s2)9.81
Densities (Kg· m 3 )1.225
Stickiness (kg· m 1 ·s) 1.789 × 10 5
Table 2. Simulation experiments for flow field analysis of FLUENT.
ParameterNumerical Value
Rotational speed (rpm)200, 220, 240, 260, 280, 300, 320, 340, 360, 380, 400, 420, 440, 460, 480, 500, 520, 540, 560, 580, 600
Guide strip dip angle ( θ )/(°)50, 60, 70, 80, 90
Table 3. Simulation experiments for seed feed analysis of EDEM.
ParameterNumerical Value
Rotational speed (rpm)200, 220, 240, 260, 280, 300, 320, 340, 360, 380, 400, 420, 440, 460, 480, 500, 520, 540, 560, 580, 600
Seed feed rate (grain/s)3000, 4000, 5000, 6000, 7000
Table 4. Factors and levels of orthogonal experiments.
LevelRotational Speed
A (rpm)
Guide Strip Dip Angle
B (°)
Seed Feed Rate
C (Grain/s)
1200604000
2400705000
3600806000
Table 5. Results of orthogonal experimental design and evaluation indicators.
Lab NumberRotational Speed A (rpm)Guide Strip Dip Angle B (°)Seed Feed Rate C (Grain/s)CVSU (%)RSCV (%)
12006050004.783.25
26006050002.313.65
320080500010.183.92
46008050007.823.23
52007040008.003.98
66007040006.243.68
72007060006.443.96
86007060003.214.17
94006040002.663.58
104008040009.623.73
114006060001.313.61
124008060006.893.9
134007050001.032.17
144007050001.372.32
154007050001.042.42
164007050001.312.28
174007050001.262.23
Table 6. Analysis of variance of three factors of orthogonal experiments.
NormSourceF-Valuep-ValueSignificant
CVSU (%)A—Rotational speed180.72<0.0001***
B—Guide strip dip angle1030.54<0.0001***
C—Seed feed rate140.87<0.0001***
AB0.04540.8374
AC8.100.0248*
BC7.140.0319*
Lack of fit4.950.0782Not significant
Primary and secondary factors B > A > C
RSCV (%)A—Rotational speed5.910.0454*
B—Guide strip dip angle8.360.0233*
C—Seed feed rate13.290.0082**
AB49.720.0002***
AC23.030.002**
BC2.020.198
Lack of fit0.52720.687Not significant
Primary and secondary factors C > B > A
Note: “*” denotes significant (p < 0.05); “**” denotes very significant (p < 0.01); “***” denotes extremely significant (p < 0.001).
Table 7. Optimal values given by the optimization function analysis of Design-Expert 13 software.
NameGoalLower LimitUpper LimitLower WeightUpper WeightImportance
A: Rotational speedIn range200600113
B: Guide strip dip angleIn range6080113
C: Seed feed rateIn range40006000113
CVSUMinimize1.0310.18113
RSCVMinimize2.174.17113
Solutions
1 solution
Rotational speedGuide strip dip angleSeed feed rateCVSURSCVDesirability
408.78869.2744938.0381.0252.2760.973Selected
Disclaimer/Publisher’s Note: The statements, opinions and data contained in all publications are solely those of the individual author(s) and contributor(s) and not of MDPI and/or the editor(s). MDPI and/or the editor(s) disclaim responsibility for any injury to people or property resulting from any ideas, methods, instructions or products referred to in the content.

