Article

Deciphering Genomic Regions and Putative Candidate Genes for Grain Size and Shape Traits in Durum Wheat through GWAS

1
Department of Field Crops, Faculty of Agriculture, Şırnak University, 73300 Şırnak, Turkey
2
Department of Field Crops, Faculty of Agriculture, Çukurova University, 01330 Adana, Turkey
Agriculture 2023, 13(10), 1882; https://doi.org/10.3390/agriculture13101882
Submission received: 22 August 2023 / Revised: 22 September 2023 / Accepted: 23 September 2023 / Published: 26 September 2023

Abstract

:
Durum wheat is an economically and nutritionally important cereal. The increase in durum wheat yield is mostly associated with improving grain traits, and the grain size- and shape-related traits are directly related to wheat yield. In addition, grain size influences the seed germination rate and seedling vigor, which play key roles in stand establishment and yield. Thus, it is important to investigate grain traits both agro-morphologically and genetically. In this study, a panel of durum wheat, consisting of 146 genotypes, was evaluated for grain traits agro-morphologically and a genome-wide association study (GWAS) was conducted to dissect the genomic regions associated with these traits. As a result of the GWAS, a total of 41 marker-trait associations (MTAs) were identified on different chromosomes of durum wheat. Of these MTAs, only 11 were stable across environments. A BLAST search for the flanking sequences of every stable MTA in the Svevo genome identified 18 putative candidate genes directly associated with the seed traits of different plants, particularly wheat seeds. In conclusion, the annotation results and literature information provide strong evidence that the identified stable MTAs and their candidate genes may have important functions in the formation of wheat grain traits. After the validation of these MTAs with different fine-mapping and functional characterization studies, these loci may provide valuable information for geneticists and breeders to improve wheat yield.

1. Introduction

Wheat is one of the most important cereal crops and is consumed as a staple food by humans on almost every continent in the world. It was the first domesticated crop about 10,000–12,000 years ago around the Fertile Crescent and played an important role in initiating the agricultural revolution [1,2,3,4]. The wild form of durum wheat, wild emmer (Triticum turgidum ssp. dicoccoides, AABB), is an allopolyploid in the tetraploid group and probably evolved from the natural hybridization between two diploid species, Triticum urartu (AA) and Aegilops speltoides (BB). After the domestication of wild emmer, the emmer wheat, T. turgidum ssp. dicoccum, formed and this led to the evolution of modern durum wheat, T. turgidum ssp. durum [5,6,7,8]. Durum wheat is an important cereal used for making pasta, flatbread, couscous, bulgur, etc., especially in the Mediterranean region [9]. About 36 million tons of durum wheat are produced on around 13 million hectares worldwide [10]. Turkey and Canada are the top producers of durum wheat, with 2 million hectares per year in each country [11,12]. Durum wheat comprises approximately 5% of total wheat production and is an economically important cereal due to its unique properties [13].
In general, the market price of durum wheat is 20–40% higher than that of bread wheat, sorghum, and corn [14]. Therefore, any approaches to increasing durum wheat yield, such as investigating grain size and shape traits, are important targets for breeders because they have a direct association with wheat yield and milling quality [15]. The grain size and shape are determined by the weight, area, length, width, perimeter, sphericity, and horizontal axis proportion of the grain [15,16]. Additionally, the grain size affects seedling vigor [17,18], which is an important factor for improved stand establishment and yield. Therefore, revealing the genetic basis of grain size and shape may provide significant information to enhance wheat yield.
Linkage mapping or quantitative trait loci (QTL) mapping is a practical method for dissecting the genetic mechanism of target traits, including yield and yield components. To date, several QTL mapping studies have been reported for grain size- and shape-related traits in durum [19,20,21], bread [16,22,23,24,25], and einkorn wheat [26,27]. Despite the success of linkage mapping, it has some fundamental limitations. In linkage mapping, only the allelic polymorphism between parental lines of F2, RIL (recombinant inbred lines), or back-cross populations can be evaluated to identify QTL [28]. Therefore, linkage mapping has a lower power to identify QTL with minor effects and may span 15–20 cM large genomic regions [29,30]. These large distances limit the resolution of mapping, especially in species like wheat with large and complex genomes. However, the genome-wide association study (GWAS) method is implemented in a variety of genotypes from different ancestors; hence, it has a greater allelic variation and higher map resolution due to long-term recombination events and larger population sizes [29]. A GWAS uses single nucleotide polymorphism markers (SNPs) that are dispersed all over the genome and identify associations with agronomically important traits [31].
Previous GWASs reported several MTAs for grain size- and shape-related traits in bread wheat [32,33,34,35,36,37,38,39,40,41], but there are limited reports for durum wheat [31,42] and diploid wheat species, such as einkorn (Triticum monococcum) [43], Triticum urartu [44], and Aegilops tauschii [45,46]. In durum wheat, Wang, et al. [42] reported five MTAs for grain length on chromosomes 2A, 3A, 3B, 6A, and 7A, three MTAs for grain area on chromosomes 3A and 7A (2), and three MTAs for grain width on chromosomes 3A (2) and 4A. In another durum wheat study, Alemu, et al. [31] identified five MTAs for grain length on chromosomes 2B, 4B, 5A, 6A, and 7B, whereas four MTAs were reported for grain width on chromosomes 2A (2), 5A and 7B. The grain size- and shape-related traits in durum wheat still need to be investigated, and their genetic basis needs to be uncovered by newly developed genome-wide scan sequencing methods. SNP genotyping technologies, such as the DArTseq genotyping system (diversity array technology) [47], provide a detailed genome-wide scan with thousands of molecular markers simultaneously. In addition to genotyping systems, phenotyping technologies also increase the accuracy of GWAS analyses. So, digital image analysis software has a higher superiority in terms of precise measurements in contrast to manual phenotyping. These software are increasingly used in plant phenotyping studies [48] and provide detailed imaging of grain characteristics, such as grain size- and shape-related traits [49].
In this study, a panel of durum wheat was genotyped using the DArTseq genotyping system, which comprises highly polymorphic SNP markers with known chromosomal locations and sequences. The seed samples of these genotypes were screened by digital image analysis software to evaluate grain size- and shape-related traits, and a GWAS was performed to identify the marker-trait associations (MTAs) for these traits.

2. Materials and Methods

2.1. Plant Materials

A durum wheat panel consisting of 146 durum wheat (Triticum turgidum L.) advanced lines was used as the plant material. The pedigree of the panel is submitted in Table S1.

Experiment Designs and Measurements

The panel was assessed in a randomized complete block design (RCBD) with three replications over two years (2017-18 and 2018-19) in the experimental area of the Department of Field Crops in the Faculty of Agriculture, Cukurova University at Sarıçam/Adana, Turkey. The trial area is located at 29 m altitude and features an alluvial, medium pH, sandy-clay soil type with a deep and well-drained structure (37°00′45″ N and 35°21′20″ E). Each season was accepted as a different environment and named as follows: E1 (2017–2018) and E2 (2018–2019).
The panel was sown in the plots, which had two 2 m rows with a row spacing of 20 cm and a genotype spacing of 10 cm. In each row, there were 20 seeds. During the growth season, common agricultural practices such as fertilization, irrigation, disease management, and pest and weed control were used. After physiological maturity, completely mature spikes (Zadoks Scale, GS93) [50] were harvested for every individual plant. Ten randomly sampled spikes were manually threshed, and the seeds were bulked for each replication to calculate a thousand-grain weight (TGW) and measure grain size and shape characteristics. TGW was determined by manually counting 250 grains for each replicate and then weighing them in an ultra-analytical balance to convert them to thousand-grain weight. Thirty seeds were used per replication for grain size and shape analyses. All seed samples were first photographed, and then the images were transferred to a computer environment to measure the grain size and shape traits. The following grain size and shape traits were measured using Smart Grain 1.2 software [49]; area size (AS), perimeter length (PL), grain length (L), grain width (W), length–width ratio (LWR), and circularity (CS).

2.2. Genotyping-by-Sequencing (GBS) Analysis

A total of 76.265 SNP markers were obtained from the DArTseq genotyping system. The durum panel was screened by the markers that were produced from the Wheat Chinese Spring IWGSC RefSeq v1.0 genome assembly. Therefore, the D genome markers were eliminated from the raw data, and then the A and B genome markers were updated in the Durum Wheat Genome (cv. Svevo) V1 (https://urgi.versailles.inra.fr/blast/, accessed on 11 May 2023). Each marker sequence query was set to “Best score” to update the marker in the Svevo genome. The chromosome and chromosomal location of each marker were reassigned according to the alignment similarity, which exceeded 95%. The remaining updated markers were then subjected to additional filtering procedures, such as the removal of markers with more than 20% missing data and fewer than 10% minor allele frequency, in order to generate acceptable polymorphic markers. After data refinement, a total of 3251 high-quality and polymorphic SNP markers were obtained for use in the GWAS analysis. Heterozygous alleles were disregarded and marked as missing alleles for each marker.

2.3. Basic Statistical Analysis

The ANOVA was performed by the “metan” R package [51], which was developed for multi-environment variance analysis. The same package was used to calculate the broad-sense heritability and coefficient of variation (CV) for all traits. The broad-sense heritability results across the environment were also confirmed using the H2 = (sg2)/[sg2 + (se2/r)] formula. JASP software Version 0.11.1 was used to generate distribution plots and Pearson’s correlation coefficients between traits as well as between environments [52]. Best linear unbiased predictor (BLUP) values were calculated for each trait across two environments in JMP Genomics 9.0 software [53]. The BLUP values were considered a third environment for use in the GWAS analyses.

2.4. Population Structure and Linkage Disequilibrium (LD) Analyses

The Eigenvector principal component analysis was used to describe the population structure and was plotted in the GAPIT package of R software [54] to determine the number of principal components for use in the GWAS analysis. The LD between pairwise comparisons of SNP markers with a sliding window size of 50 markers was estimated using the squared correlation coefficient (r2) in TASSEL 5.2.86 [55]. The LD decay plot was created using the LD results (pairwise r2 values) from TASSEL 5.0 for the whole genome in R Studio 2022.07.1. The LD blocks were created by HAPLOVIEW v4.1 software (https://www.broadinstitute.org/haploview/haploview, accessed on 11 May 2023) [56].

2.5. Genome-Wide Association Analysis

The mean values of grain size- and shape-related traits and their BLUP values were used in the GWAS analysis to identify MTAs using the GAPIT package of R studio [54]. The HapMap data format was used for genotype files. The GWAS was performed by the FarmCPU (fixed and random model circulating probability unification) GWAS method [57]. FarmCPU uses a multi-locus model for testing markers across a genome. This method uses the mixed linear model and stepwise regression model iteratively to eliminate the disadvantages of the general linear model (GLM) and mixed linear model (MLM). In the GWAS analysis, the markers that exceeded the threshold of an FDR (false discovery rate)-adjusted p-value at the 0.01 level (−log10 p-values ≥ FDR) were considered to have significant associations with the related traits. Manhattan and Q–Q plots were also created and illustrated in the GAPIT package. DArTseq markers were distributed on the durum chromosome by the rMVP package in R Studio [58].

2.6. Candidate Gene Identification

The flanking sequences that covered 1 Mb upstream and downstream of significant environmentally stable markers (MTAs) obtained from the GWAS results were screened against the Triticum turgidum genome (Svevo.v1) using the Ensembl database platform’s BioMart tool (https://plants.ensembl.org/biomart, accessed on 12 May 2023) to find any possible candidate genes. Any match within the 2 Mb flanking region of the MTAs was listed with the gene stable ID, gene starts and ends, and gene description. Additionally, we used the published literature to know the detailed roles of plausible genes in plants, especially in wheat.

3. Results

A durum wheat panel consisting of 146 genotypes was evaluated for grain size- and shape-related traits to identify significant MTAs through a GWAS. The preliminary phenotypic results revealed significant genetic diversity for the studied traits among the genotypes. It was appropriate to use this population variation in the following GWAS processes (Table 1).

3.1. Phenotypic Evaluation of Grain Traits

Grain size and shape traits were evaluated using the image analysis software Smart Grain 1.2 [48]. Almost completely normal distributions were observed for all measured traits in the durum population in the BLUP data and the individual environments (Figure S1). The descriptive statistics for all traits over the two environments are shown in Table 2. Broad-sense heritability values ranged between 0.96 and 0.98. The coefficient of variation percentages were 3.37 (AS), 1.84 (PL), 1.88 (L), 2.16 (W), 2.04 (LWR), 1.23 (CS), and 3.77 (TGW) (Table 2). The variance analyses demonstrated significant differences (p < 0.001) among the genotypes for all calculated traits (Table 1). Significant environmental effects were observed in AS, PL, W, LWR, and TGW. A significant genotype-by-environment interaction was observed for all traits (Table 1). With rare exceptions, significant positive and negative correlations were observed between the traits in the two environments and the BLUP data (Table S2). Moreover, significant positive correlations were calculated between environments and the BLUP data for every single trait, except for E1 vs. BLUP for TGW (Table 3).

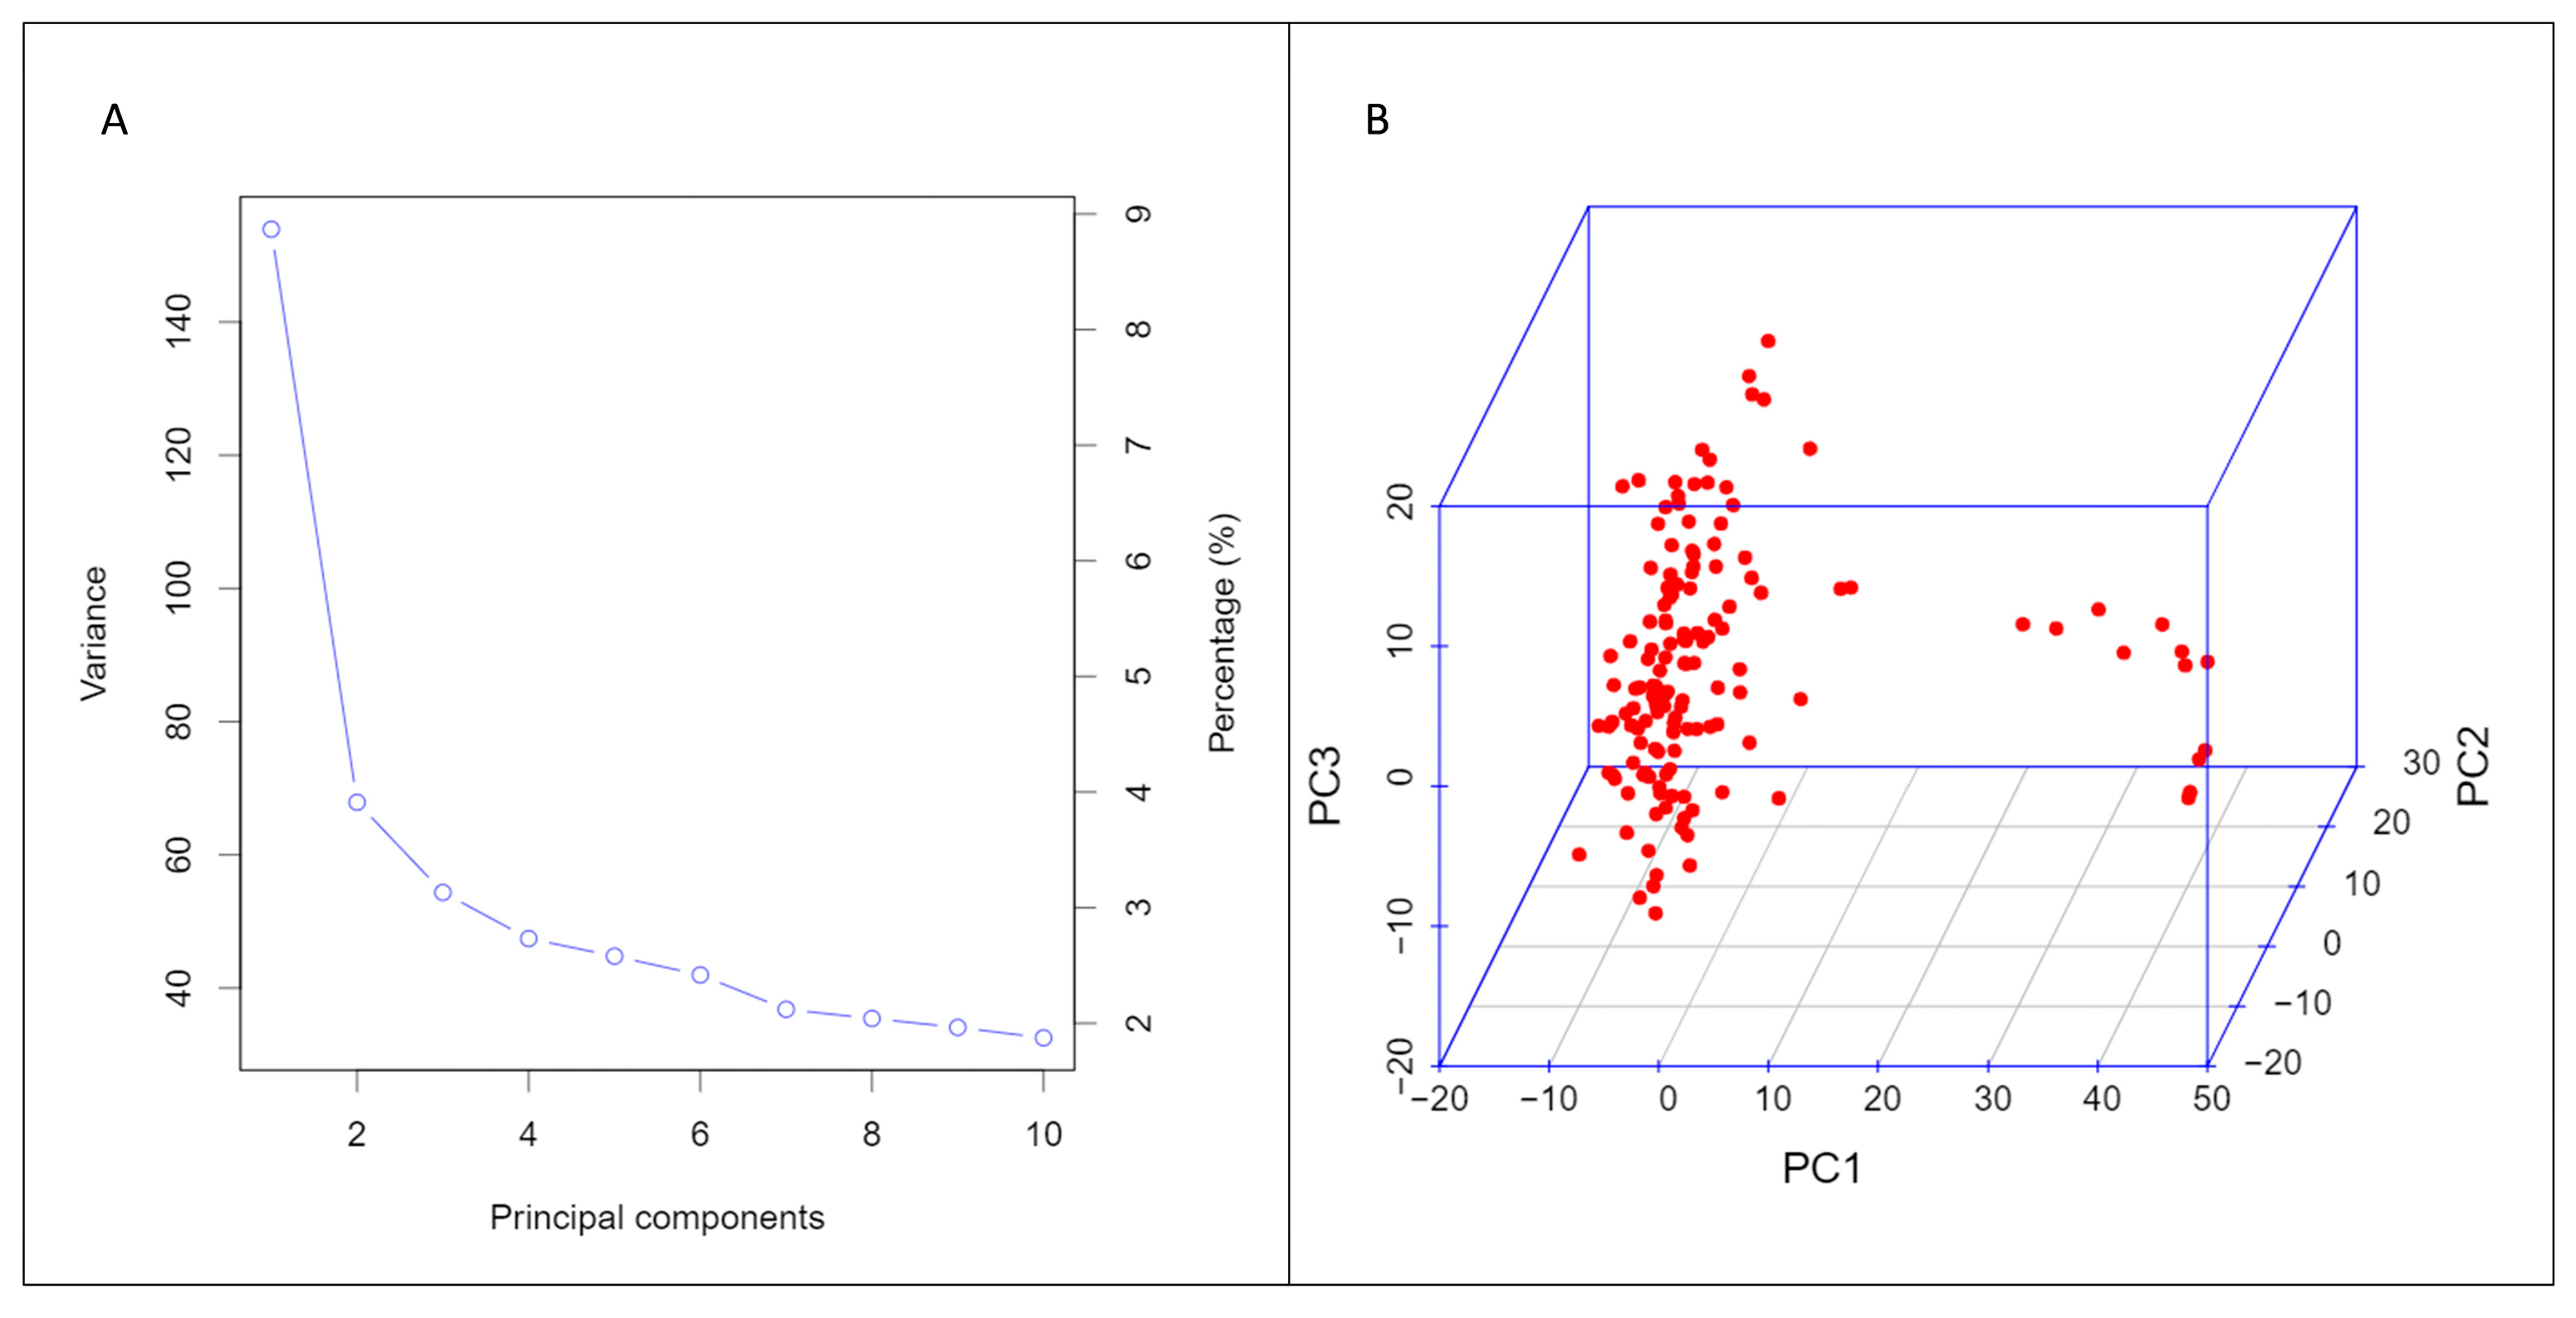
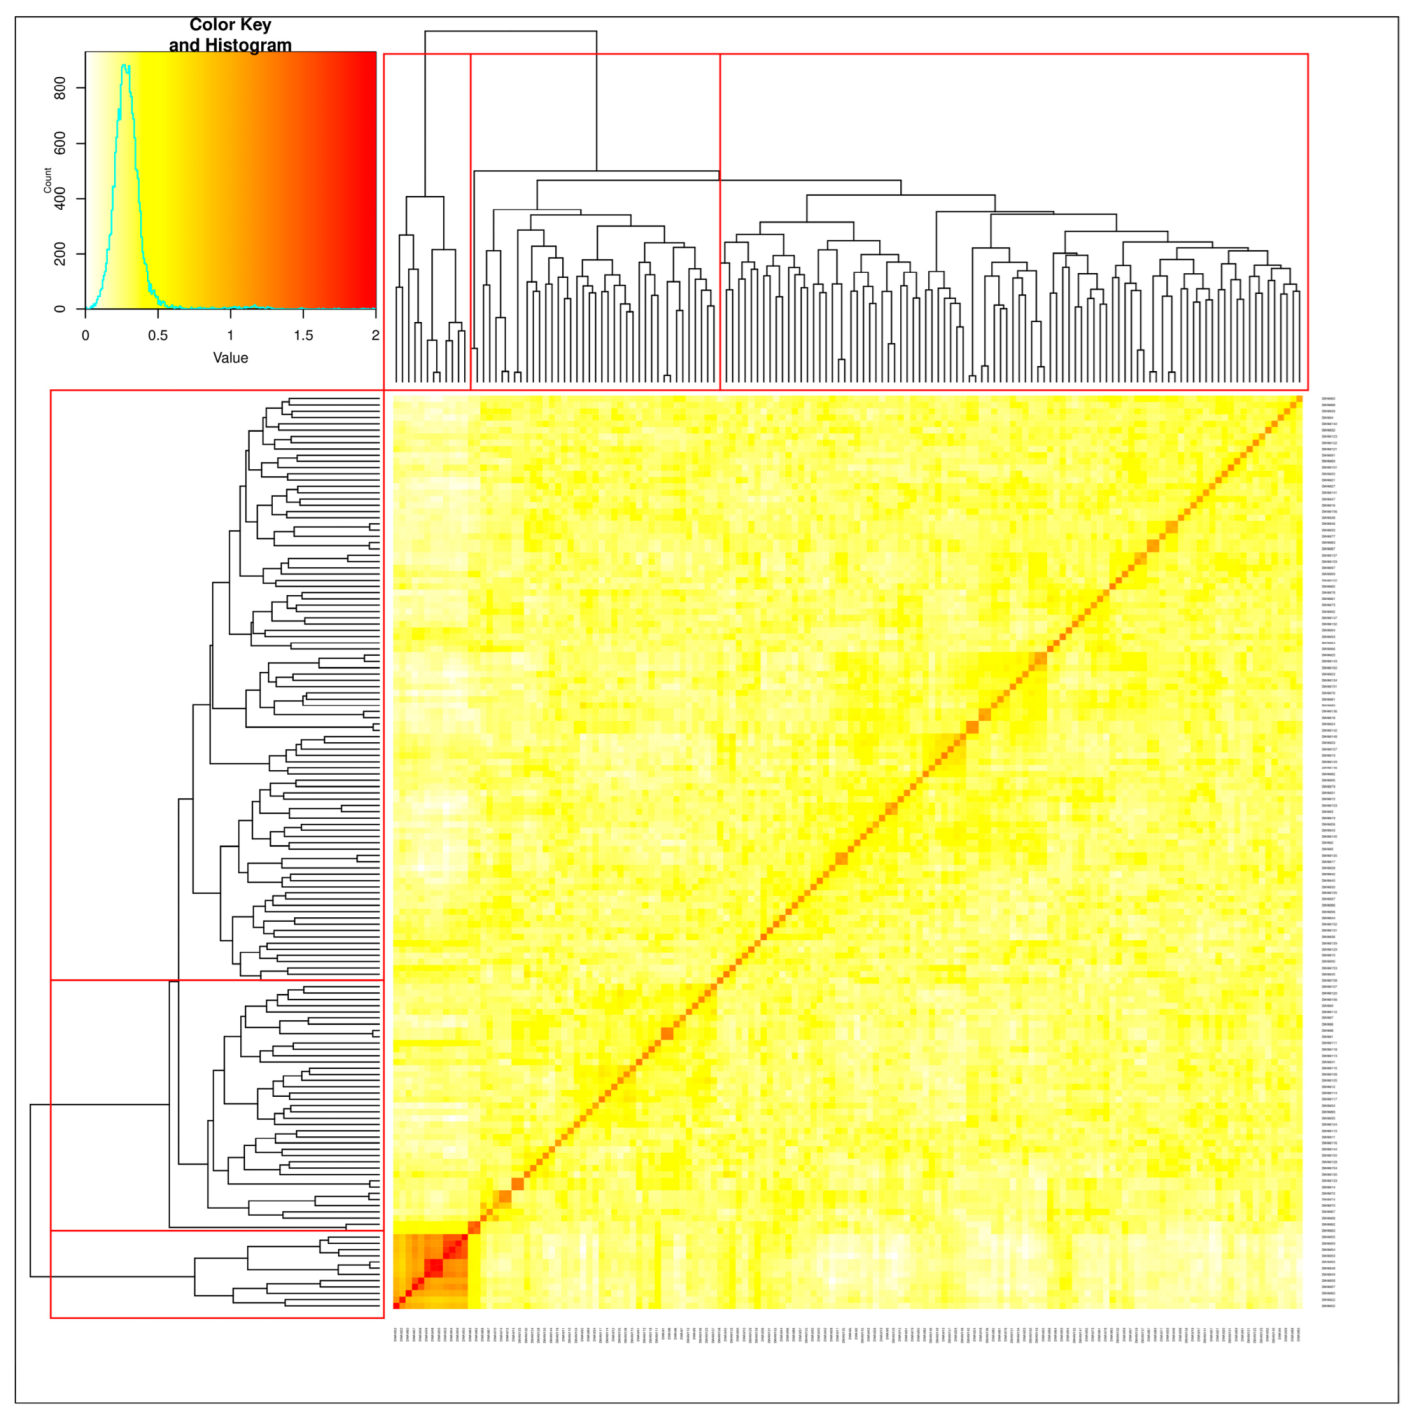
3.2. Structure of Durum Population and SNP Density on the Genomes

As a result of the strict refinement process, 3251 high-quality SNP markers were obtained and distributed in the A and B genomes of durum wheat. Marker coverage of the A (2112 markers) genome was 64.96% of all markers, whereas it was 35.04% in the B (1139 markers) genome. The A genome chromosomes contained 260 (1A), 454 (2A), 307 (3A), 143 (4A), 282 (5A), 276 (6A), and 389 (7A) markers, whereas the B chromosomes contained 186 (1B), 199 (2B), 173 (3B), 96 (4B), 164 (5B), 155 (6B), and 167 (7B) markers. The number of markers on the homologous chromosome in group 2 was the highest (20.08 percent), while those on the homologous chromosome in group 4 were the lowest (7.35 percent).
The population was divided into three subpopulations based on the Eigenvector principal component analysis. There was a sharp drop in the second principal component, but a significant drop was still observed in the third principal component. Accordingly, we chose the third principal component to cluster the populations (Figure 1A,B). The heatmap also verified the clusters using a dendrogram (Figure 2).

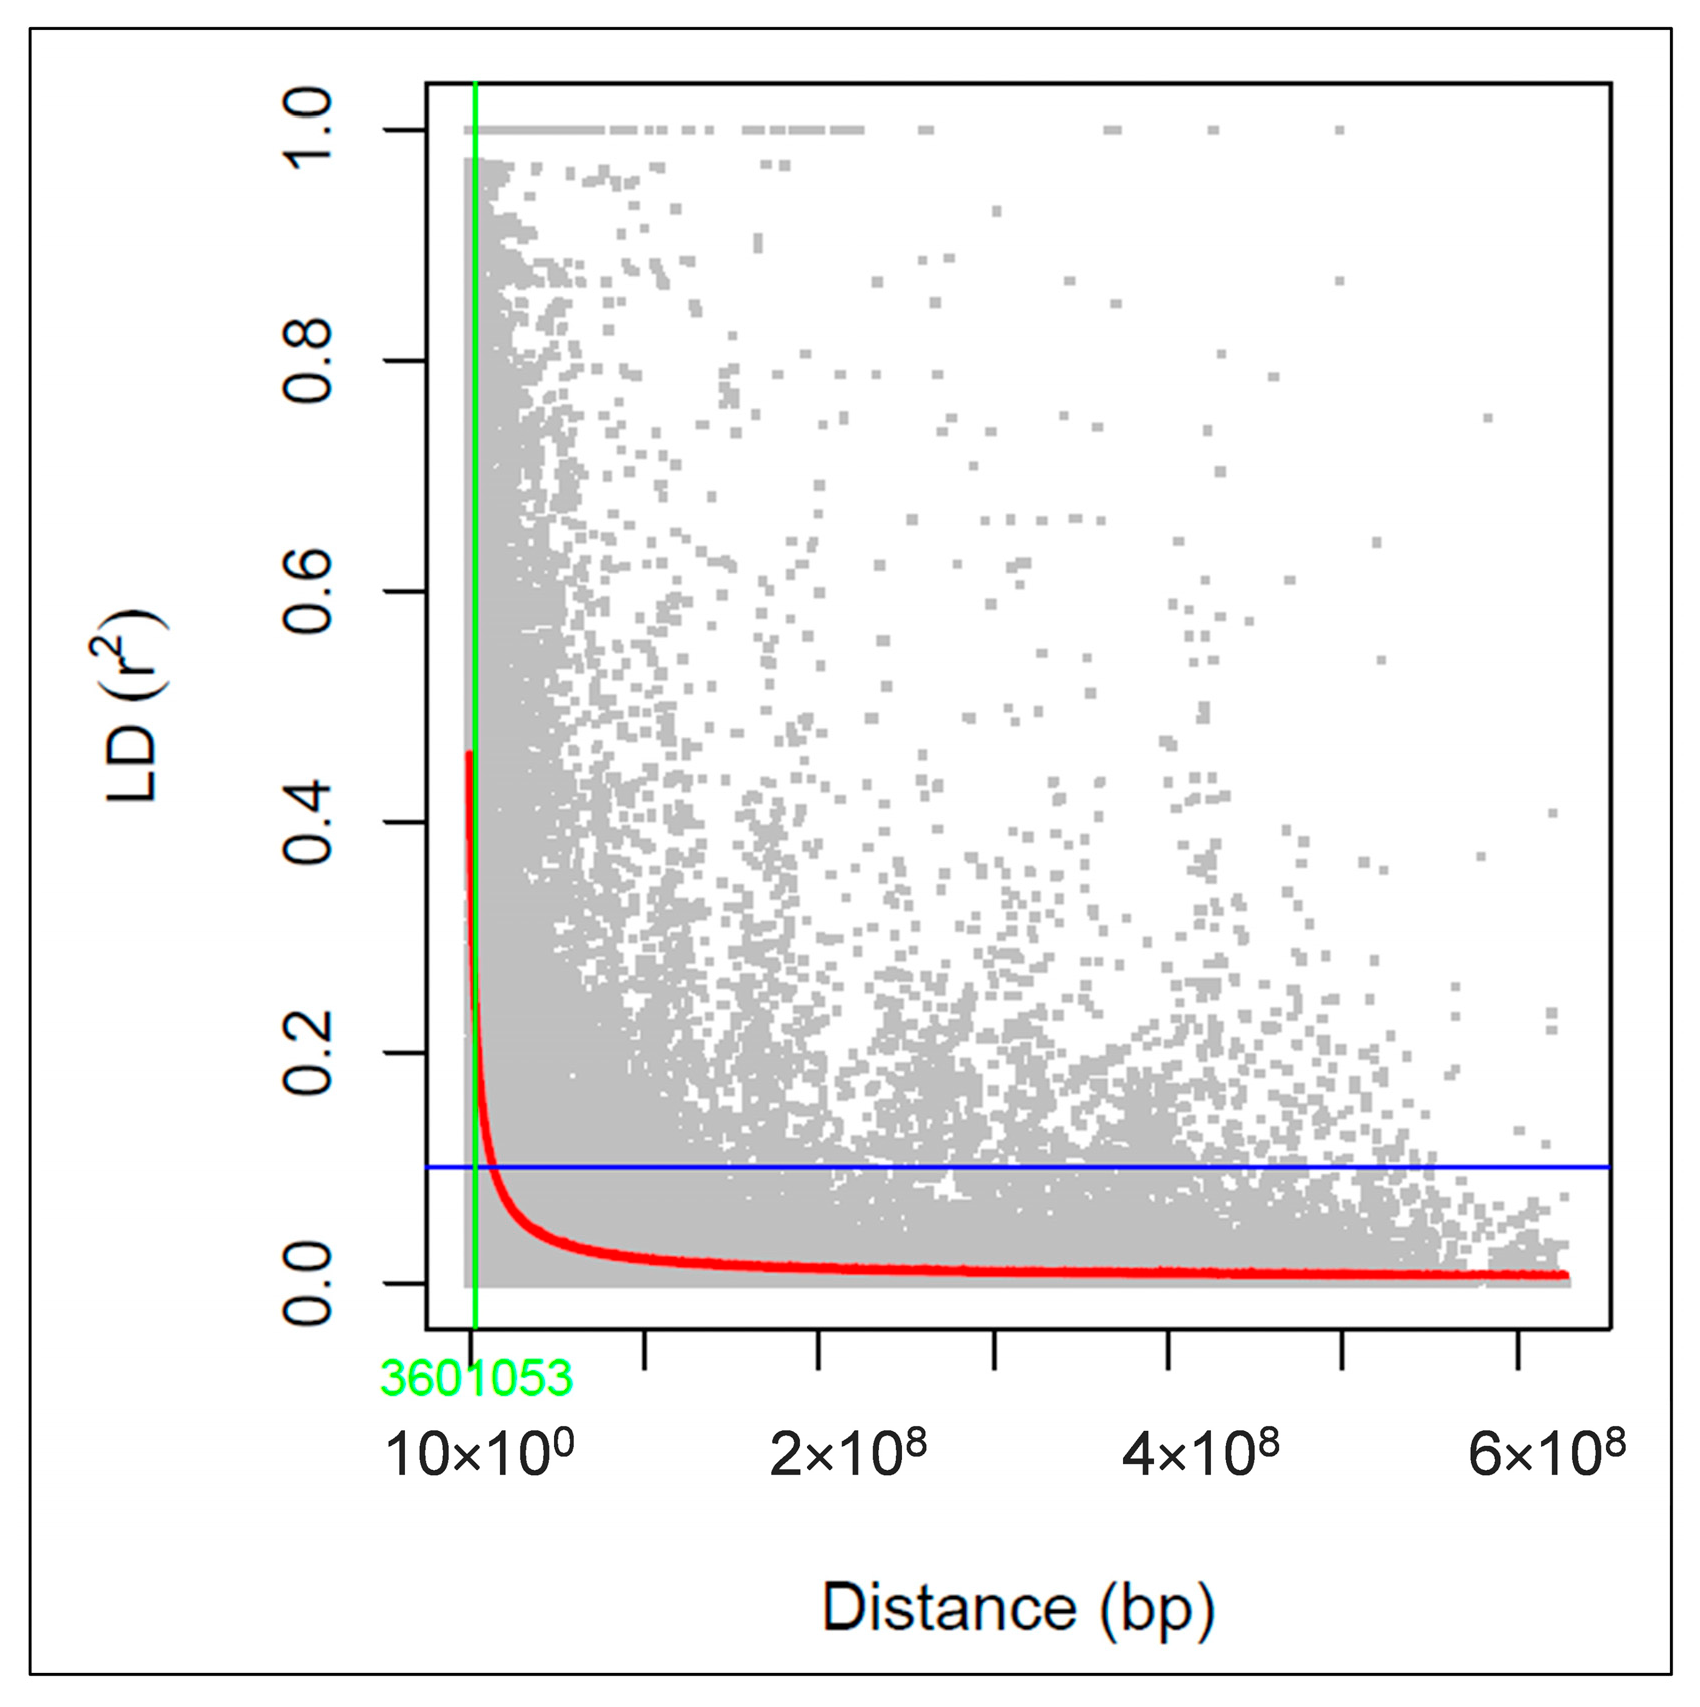
3.3. Linkage Disequilibrium Analysis

The LD was calculated using 3251 SNP markers. Of the 161,276 marker pairs, 106,939 showed a significant linkage disequilibrium at p < 0.01 level, which corresponds to 66% of marker pairs, whereas 54,337 marker pairs had r2 > 0.1. The LD decay was estimated based on the r2 values for the whole durum wheat genome. The LD between the marker pairs decayed at r2 = 0.2 value. The drop point of the LD decay was 3,601,053 bp in the whole genome (Figure 3).

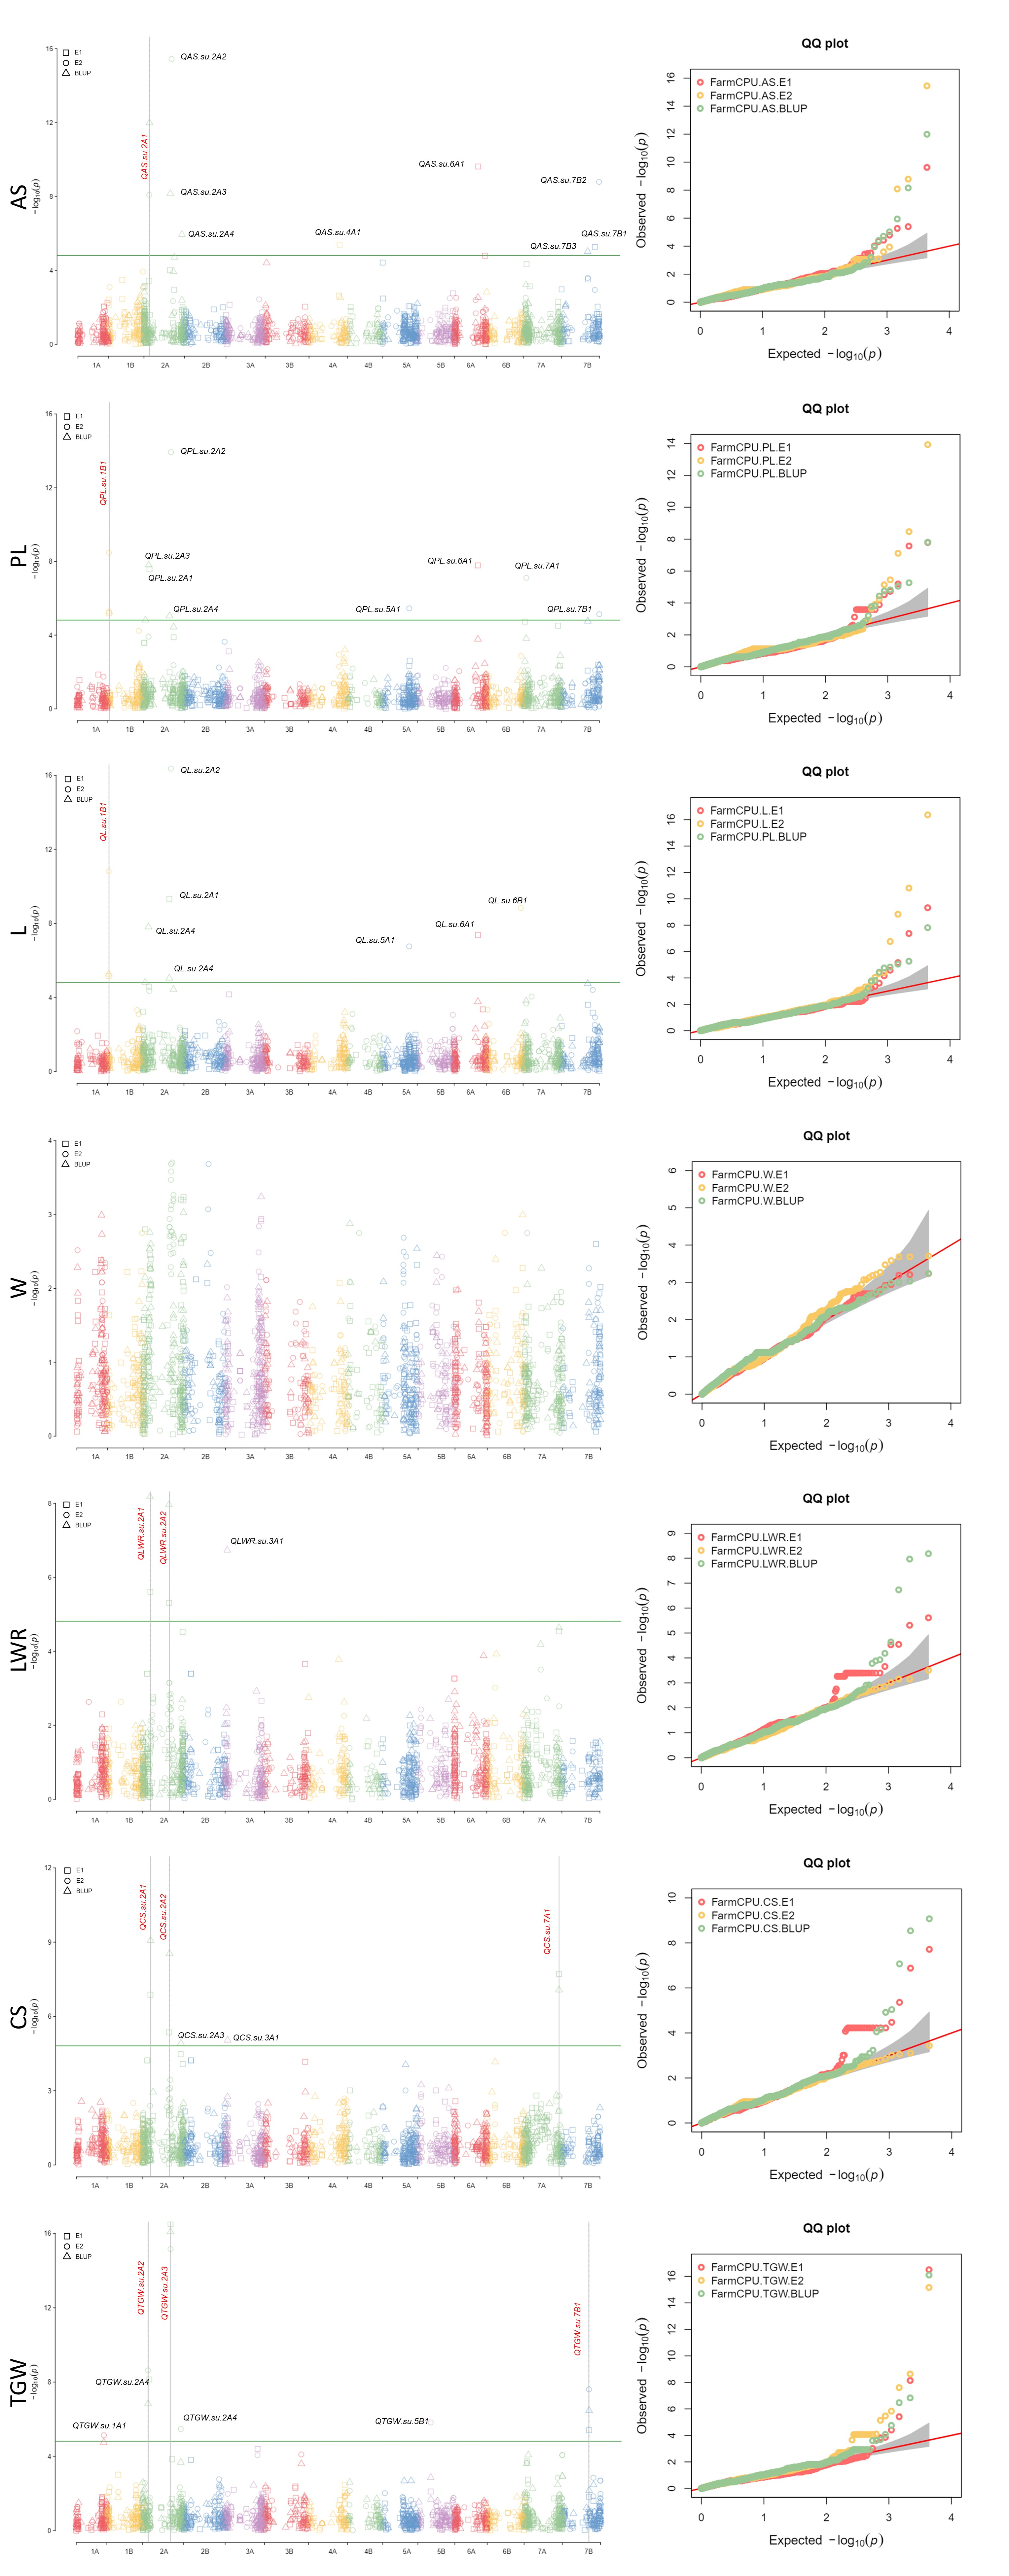
3.4. Genome-Wide Association Analysis

The genome-wide association analysis detected 41 MTAs for all evaluated traits except grain width (W). These MTAs were distributed on chromosomes 1A, 2A (21), 3A (2), 4A, 5A (2), 6A (3), 7A (2), 1B (2), 5B, 6B, and 7B (5) of durum wheat (Table S3, Figure 4). Of the 41 MTAs, only 11 were stable across environments (Table 4). These results are almost completely in agreement with the environmental correlations (Table 3). Therefore, we are going to focus on these MTAs in the following sections.
For grain area size (AS), nine MTAs were identified on chromosomes 2A (4), 4A, 6A, and 7B (3). Here, only QAS.su.2A1 was stable in two environments. For grain perimeter length (PL), nine MTAs were detected on chromosomes 1B, 2A (4), 5A, 6A, 7A, and 7B. QPL.su.1B1 was the only stable MTA in three environments. For grain length (L), eight MTAs were found in chromosomes 1B, 2A (4), 5A, 6A, and 7B. Only one MTA, QL.su.1B1, was stable in all three environments for this trait. For the grain length–width ratio (LWR), three MTAs were identified on chromosomes 2A (2) and 3A. Two MTAs on chromosome 2A, QLWR.su.2A1 and QLWR.su.2A2, were stable in two environments. Regarding grain circularity (CS), five MTAs were discovered on chromosomes 2A (3), 3A, and 7A. Three MTAs, QCS.su.2A1, QCS.su.2A2, and QCS.su.7A1 were stable in two environments. Seven MTAs were found on chromosomes 1A, 2A (4), 5B, and 7B for the thousand-grain weight (TGW), the trait that is influenced by all the traits mentioned above. For this trait, the QTGW.su.2A2, QTGW.su.2A3, and QTGW.su.7B1 were stable in two, three, and three environments, respectively. Although there were 41 different MTAs, some were identified on the same SNP markers, and these SNPs seem to be associated with multiple grain traits in durum wheat. For example, SNP-1095449 was found to be associated with AS, PL, and L (Table S3). Other markers were SNP-991434 (AS, PL, L, and TGW), SNP-1127014 (AS, PL, and L), SNP-1006957 (AS, PL, and L), SNP-1091721 (AS and PL), SNP-10983760 (PL and L), SNP-991737 (L, LWR, and CS), SNP-1150369 (LWR and CS), and SNP-1127543 (LWR and CS) (Table S3).

3.5. Putative Candidate Genes Underlying Grain Size- and Shape-Related Traits in Durum Wheat

The LD blocks were created for the stable MTAs to decide the BLAST search border on the Svevo genome (Figure S2). However, we had to use only the flanking sequences that span 1 Mb upstream and downstream (a total of 2 Mb) of the markers because the LD block intervals were very large (up to 55,532 kb) and corresponded to a large number of candidate genes that are far away from the peak markers (Table 5). However, we are aware that the LD blocks contain markers with substantial linkage disequilibrium and high r2, which is always significant to take into account. In this context, a BLAST search against the Svevo genome detected 118 high-confidence putative candidate genes for all grain traits (Table S4).
The identified genes in the 2 Mb region encode different proteins that have many functions in plants, such as growth and development, stress responses, cell elongation, and seed germination and development. Eighteen of these were found to be associated with seed traits in different plants, especially in wheat (Table 6). Therefore, only the genes associated with seed size and shape will be focused on here. In this context, for AS, QAS.su.2A1 was found in the genes TRITD2Av1G047210 and TRITD2Av1G047390, which encode UDP-glycosyltransferase and glycosyltransferase, respectively. For PL and L, QPL.su.1B1 and QL.su.1B1 were found on the same marker, SNP-100083695, and both MTAs were found in the same genes: TRITD1Bv1G011760, TRITD1Bv1G012100, TRITD1Bv1G012160, TRITD1Bv1G012200, and TRITD1Bv1G012290. The first two genes encode protoheme IX farnesyltransferase and ubiquitin carboxyl-terminal hydrolase, respectively, whereas the last three genes encode histone deacetylase. For LWR, QLWR.su.2A1 was found in TRITD2Av1G065030, which encodes the BRI1-EMS suppressor 1 (BES1)/brassinazole-resistant 1 (BZR1) family (BES1/BZR1 homolog 1). The other MTA, QLWR.su.2A2, was found in TRITD2Av1G180930 and TRITD2Av1G181430, which encode transcription factors and digalactosyldiacylglycerol synthases, respectively. For CS, QCS.su.2A1 was detected together with QLWR.su.2A1 on the same marker, SNP-1150369; hence, it coincided with the same gene, TRITD2Av1G065030. Additionally, QCS.su.2A2 was found together with QLWR.su.2A2, whose coincident genes were already mentioned above. Another stable MTA, QCS.su.7A1, was found in TRITD7Av1G256220, which encodes the B3 domain-containing protein. For TGW, QTGW.su.2A2 was found in TRITD2Av1G048230, TRITD2Av1G048320, and TRITD2Av1G048480, which encode cytochrome P450, patatin, and B3 domain-containing protein, respectively. The other MTA, QTGW.su.2A3, was found in TRITD2Av1G191770 and TRITD2Av1G191850, which encode phospholipase C and the pentatricopeptide repeat-containing protein. The last stable MTA, QTGW.su.7B1, was found in TRITD7Bv1G159220 and TRITD7Bv1G159310, which encode the elongation factor-like protein and ABC transporter B family protein, respectively.

4. Discussion

This study was designed to evaluate the grain size and shape traits of a durum wheat panel with 146 genotypes and to conduct a GWAS to identify the MTAs related to grain size- and shape-related traits.

4.1. Phenotypic Evaluation

After data curation and basic statistical analyses, high genetic diversity was identified among the genotypes (Table 1), and all traits showed a high heritability in the population (Table 2). The majority of trait comparisons revealed a positive correlation, indicating that all traits had an increasing impact on the TGW and, consequently, increased grain weight (Table S2). All traits showed normal distribution, indicating that multiple genes may be responsible for controlling the grain size traits (Figure S1).

4.2. MTAs Identified for Grain Size and Shape Traits

Several GWASs have been conducted on grain size traits in durum [31,42] and bread wheat [33,34,35,36,37,38,39,40,59,60,61], as well as a few diploid wheat species such as Triticum monococcum [43], Triticum urartu [44], and Aegilops tauschii [45,46]. In the present study, 41 MTAs were identified; however, only 11 MTAs were stable across environments (Table 4). Therefore, only the stable MTAs on chromosomes 2A, 1B, and 7A were compared with previously reported MTAs.
For AS, Gao, et al. [33] reported a significant MTA in bread wheat on chromosome 2A at location 742,132,445 bp. The stable MTA for the current study, QAS.su.2A1, was found to be at a distance of 104,655,222 bp, which makes them distinct from one another. In another study, Schierenbeck, et al. [61] reported a significant MTA in bread wheat on chromosome 2A at the 82,350,302 bp position. This MTA is very close to QAS.su.2A1 (104,655,222 bp). Rabieyan, et al. [59] reported a significant MTA on 2A in bread wheat. However, the position of this MTA was reported in cM length; therefore, its short sequence was searched against the bread wheat genome and was found to be 17,954,870 bp, which is relatively close to QAS.su.2A1. In addition to these, Yu, et al. [26] reported a crucial MTA on 2A in einkorn wheat. Nevertheless, this MTA was also identified as a cM length; therefore, it could not be compared to QAS.su.2A1. In a recent einkorn wheat study, Sesiz, et al. [27] reported two QTLs around the tip of two arms of chromosome 2A, which were 34,773,385–53,795,616 bp (1) and 581,712,653–600,943,973 bp (2), respectively. Here, QAS.su.2A1 is incontrovertibly close to the first QTL of einkorn wheat. These findings collectively suggest that QAS.su.2A1 may target a genetic area linked to durum wheat’s grain characteristics.
For PL, no MTAs were encountered on 1B in previous reports. However, in the present study, QPL.su.1B1 was identified on 1B in all three environments at 29,327,461 bp. This makes QPL.su.1B1 unique and a new region of study for grain perimeter length in wheat. Interestingly, for L, the only stable MTA, QL.su.1B1, was detected on the same marker (SNP-100083695) as the QPL.su.1B1. This is not surprising because these traits are known to be highly associated and demonstrated a high positive correlation in this study (Table S2).
For L, Li, et al. [35] reported two important MTAs on chromosome 1B in bread wheat. One MTA was found at 642.6–642.7 Mb, which is far from QL.su.1B1 (29,327,461 bp), whereas the other MTA was found at 26.9–30.8 Mb, which covers QL.su.1B1 completely. This provides strong evidence that QL.su.1B1 may associated with the grain length in wheat. In a different study, Muhammad, et al. [37] reported a significant MTA in bread wheat on 1B at 637.0 Mb, which overlapped with the MTA reported by, Li, et al. [35]. Based on previous reports and present findings, some of the grain-length-associated regions appear to be in the distal region of the short and long arms of chromosome 2A in wheat.
For LWR, two MTAs were identified in the present study, namely QLWR.su.2 and QLWR.su.2A2 at 148,130,749 bp and 505,958,255 bp on 2A, respectively. In a previous study, Gao, et al. [34] reported an important MTA on 2A at 724,513,384 bp. This MTA is far away from our MTAs, which means that our MTAs may be a new genomic region associated with LWR in wheat. No further MTAs were encountered in 2A for this trait in the literature.
For CS, three stable MTAs were identified on 2A (2) and 7A, namely, QCS.su.2A1 (148,130,749 bp), QCS.su.2A2 (505,958,255 bp), and QCS.su.7A1 (673,131,697 bp). For these traits, Gao, et al. [33] reported one MTA on 2A at 742,132,445 bp, which is relatively close to QCS.su.7A1. In another, Sesiz, et al. [27] reported a QTL on 2A at the start position of 106,445,919 bp in einkorn wheat. Our MTA, QCS.su.2A1, is comparatively close to this einkorn QTL. This might be a clue to the position of the CS trait in the wheat genome. No additional MTAs were reported in 2A or 7A for the CS trait.
The most significant grain trait, TGW, is a major determinant of grain yield and is mainly affected by a combination of other grain architecture traits. To date, several GWASs have reported many MTAs for TGW. However, since MTAs were detected only on chromosomes 2A and 7B in the present study, we focused only on these chromosomes. In this context, Rasheed, et al. [38] identified two MTAs on 2A and 7B at 10.5 cM and 222.0 cM, respectively. However, they could not be compared to our MTAs because they were reported in cM length. In another study, Li, et al. [35] reported one MTA on 2A at 760.6–760.7 Mb, which is distant from QTGW.su.2A2 (106,204,569 bp) and QTGW.su.2A3 (531,237,720 bp). Furthermore, Schierenbeck, et al. [61] identified an important MTA on 2A at 82,350,302 bp. This MTA is comparatively positioned near QTGW.su.2A2 (106,204,569 bp). Additionally, two important QTLs were reported on 2A at 33,062,393–59,383,738 bp (1) and 609,490,374–676,558,749 bp (2) in einkorn wheat [27]. Here, QTGW.su.2A2 is close to the first einkorn QTL, whereas QTGW.su.2A3 is close to the second einkorn QTL. In light of this knowledge, when considering the relationship between einkorn and bread wheat in terms of the ancestral A genome, these findings may be pointing out the TGW location on the A genome in wheat species.

4.3. Candidate Gene Prediction

Seed size- and shape-related traits are highly correlated with each other and are important agronomic traits that determine the grain yield in wheat. Therefore, all the identified MTAs are individually or collectively important in terms of finding new genetic pathways to improve the grain yield of wheat.
The BLAST results provided 85 high-confidence putative candidate genes related to stable MTAs (Table S4). Here, only the putative genes that play a proven role in plants’ grain, especially wheat, were selected to examine our results (Table 6).
For AS, QAS.su.2A1 corresponded to UDP-glycosyltransferase. Dong, et al. [62] reported a QTL (GSA1) regulating grain size and abiotic stress tolerance by modulating cell proliferation and expansion, which encodes UDP-glucosyltransferase in rice. They also announced that the overexpression of GSA1 resulted in larger grains. In the present study, QAS.su.2A1 may indicate the genomic region responsible for the formation of large grains by regulating the grain area size.
For PL, QPL.su.1B1 is overlapped with a genomic region that encodes Protoheme IX farnesyltransferase, Ubiquitin carboxyl-terminal hydrolase, and histone deacetylase. Vergès, et al. [63] reported the function of protein farnesylation in the seed development of Arabidopsis. Ubiquitin plays a role in regulating the seed and organ size in plants [64,65,66]. Wang, et al. [67] reported that histone deacetylase interacts with plant steroid hormones, brassinosteroids (BRs), which play a role in many plant characteristics, including seed size. Based on these reports, QPL.su.1B1 and its candidates may regulate the grain size in durum wheat. QPL.su.1B1 was discovered at the same marker as QL.su.1B1 on chromosome 1B. Thus, all putative candidate genes identified for QL.su.1B1 are also valid for this MTA, which provides more clues regarding the role of this MTA in the grain size in durum wheat.
For LWR and CS, QLWR.su.2A1 and QCS.su.2A1, and QLWR.su.2A2 and QCS.su.2A2, were detected on the same markers on 2A, separately. Therefore, putative candidate genes for these MTAs were evaluated together. In this context, QLWR.su.2A1, and QCS.su.2A1 coincided with BES1/BZR1 homolog 1. Jiang, et al. [68] reported that brassinosteroid plays an important role in determining the size, mass, and shape of Arabidopsis seeds. The other MTAs, QLWR.su.2A2 and QCS.su.2A2, overlapped with the transcription factor and late embryogenesis abundant (LEA) hydroxyproline-rich glycoprotein. Some transcription factors have been reported to be part of a group of proteins that regulate grain size [69]. For example, Huang, et al. [70] reported that the WIDE AND THICK GRAIN 1 (WTG1) gene functions as a significant factor in determining the grain size and shape in rice. Importantly, the orthologous of this gene was described in wheat as TaWTG1 on the short arms of group 7 chromosomes in bread wheat [71]. The other protein, LEA, is formed during the late period of seed development, and LEA proteins have been detected in the seeds of different crops, fruits, and vegetables to date [72]. The other CS-related MTA, QCS.su.7A1, coincided with the B3 domain-containing protein. B3 TFs are plant-specific proteins and were first described and cloned in maize (Zea mays) [73]. In addition, Yang, et al. [74] demonstrated that a B3 TF, namely, ZmABI19, plays a role as a grain-filling induction regulator. The reported information supports the potential role of the identified MTAs in regulating the grain traits in durum wheat.
The increase in grain size leads to an increase in the TGW and, thereby, an increase in the grain yield of wheat. In this study, almost all the grain size- and shape-related characteristics demonstrated a significant positive correlation with each other and played roles in increasing the TGW. In the present study, three important and stable MTAs, QTGW.su.2A2, QTGW.su.2A3, and QTGW.su.7B1, were identified for the TGW and corresponded to some protein products that were directly associated with the grain characteristics in different plants. For example, QTGW.su.2A2 coincided with cytochrome P450 (CYP), patatin, and B3 domain-containing proteins. It is reported that CYP family members regulate the seed size in Arabidopsis [75], tomatoes [76], sweet cherries [77], and soybeans [78]. In wheat, Ma, et al. [79] reported a gene, TaCYP78A3, that encodes the wheat cytochrome P450 CYP78A3, which is expressed in wheat reproductive organs. Their results show that TaCYP78A3 increases the size of wheat. Huang, et al. [80] described the role of patatin in seed size in Arabidopsis. In addition, Liu, et al. [81] reported a patatin-related protein, OspPLAIIIα, and found its role in seed size in rice. The B3 domain-containing protein was found for QCS.su.7A1 and discussed for this MTA above. Despite QCS.su.7A1 and QTGW.su.2A2 being located on different chromosomes, both coincided with the same protein products. These results support a plausible role of the B3 domain in the grain architecture of wheat.
The other MTA, QTGW.su.2A3, overlapped with phospholipase C and pentatricopeptide repeat-containing protein. The role of phospholipase C was studied by Yu, et al. [82] who reported that phospholipase C1 modulates the grain size in rice. Yang, et al. [83] reported the function of pentatricopeptide repeat-containing protein EMP9 on maize seed development, and Liu, et al. [84] also reported the role of this protein on maize seeds.
The third MTA, QTGW.su.7B1, coincided with the genes encoding the elongation factor-like protein and ABC transporter B family protein. Transcript elongation factors (TEFs) play a significant role in the regulation, proliferation, and differentiation of cells, and control different stages of growth processes [85]. A member of TEFs, TaTEF-7A, was reported on chromosome 7A in wheat by Zheng, et al. [85]. This protein showed the highest expression in young spikes and developing seeds, and it was reported that it regulates the grain number per spike in wheat. In another study on durum wheat, Giancaspro, et al. [86] identified a perfect candidate on 5B which is involved in the determination of grain weight and encoding the protein elongation factor. In the present study, QTGW.su.7B1 was found on chromosome 7B, which is orthologous with 7A. Although these MTAs were reported on different wheat chromosomes, they have consistently coincided with TEFs in wheat genomes. The other overlapped proteins, ABC transporter B family proteins, are essential for plant development, and they have many functions in seed development [87].
The stable MTAs identified in the present study coincide with the genomic regions that encode protein products that have important roles in regulating plant seed traits. As seen and understood from the literature, some of these MTAs overlap with previously reported genomic regions, whereas some are new regions for grain traits in wheat. In both cases, the identified MTAs demonstrated perfect aspects as candidate genes for related traits. We know that the combination of grain size- and shape-related traits serves to increase or decrease grain yield. Increasing the TGW without decreasing the seed number per spike is the key to increasing wheat yield. However, the TGW is determined by many genes with minor effects. Therefore, not only TGW-related MTAs but also other grain trait MTAs have an important effect on regulating the grain yield of wheat.

5. Conclusions

Since yield is a complex trait and the marker-trait associations of both thousand-grain weight and other grain characteristics are crucial, it is important to identify new genomic regions associated with grain traits to improve wheat yield. To do this, one important way should be to evaluate different germplasms agro-morphologically and screen them on a genomic basis using different genomic approaches. In the current study, a durum wheat panel was assessed for traits related to grain size and shape. Using SNP markers and phenotypic data, a GWAS approach was used to discover the marker-trait associations (MTAs) for associated traits. A total of 41 MTAs were detected for grain size- and shape-related traits. Of these, only 11 MTAs were stable across environments. The positions of these stable MTAs were BLAST searched against the Svevo genome, and 118 high-confidence putative candidate genes were identified. These genes encode different protein products that play important roles in plant growth and development, stress response, cell elongation, and seed germination and development. However, 18 of these were found to be associated with the seed traits in different plants, particularly in wheat grains. In summary, based on the information reported and the annotation results, the identified MTAs may possibly regulate the grain architecture traits in wheat. Ultimately, the results need to be supported by extended approaches, such as converting the SNP markers to Kompetitive allele-specific PCR (KASP) markers and using them in different populations, or should be deeply investigated in gene expression studies.

Supplementary Materials

The following supporting information can be downloaded at: https://www.mdpi.com/article/10.3390/agriculture13101882/s1, Figure S1: Distribution plots of grain size- and shape-related traits of the durum panel in two environments and BLUP data; Figure S2: Created LD blocks for stable MTAs. The markers and blocks for each MTA (some located on the same marker) are shown in yellow. The MTAs are also shown on their own markers; Table S1: The pedigree information of each genotype in the durum panel; Table S2: The Pearson’s correlation coefficient of grain size- and shape-related traits in the durum panel in two environments and the BLUP data; Table S3: All the identified MTAs for grain size- and shape-related traits in durum panel. Stable MTAs are marked by an asterisk; Table S4: Candidate genes identified for only stable MTAs in the Svevo genome. The genes marked by asterisks have a direct relationship with grain traits in different plants or wheat.

Funding

This research received no external funding.

Institutional Review Board Statement

Not applicable.

Data Availability Statement

All data, tables, and figures in this manuscript and Supplementary Files are original.

Conflicts of Interest

The author declares no conflict of interest.

References

  1. Harlan, J.R. Crops and Man; American Society of Agronomy: Madison, WI, USA, 1992. [Google Scholar]
  2. Zohary, D.; Hopf, M. Domestication of Plants in the Old World: The Origin and Spread of Cultivated Plants in West Asia, Europe and the Nile Valley; Oxford University Press: Oxford, UK, 2000. [Google Scholar]
  3. Heun, M.; Schäfer-Pregl, R.; Klawan, D.; Castagna, R.; Accerbi, M.; Borghi, B.; Salamini, F. Site of Einkorn Wheat Domestication Identified by DNA Fingerprinting. Science 1997, 278, 1312–1314. [Google Scholar] [CrossRef]
  4. Ozkan, H.; Brandolini, A.; Schäfer-Pregl, R.; Salamini, F. AFLP analysis of a collection of tetraploid wheats indicates the origin of emmer and hard wheat domestication in southeast Turkey. Mol. Biol. Evol. 2002, 19, 1797–1801. [Google Scholar] [CrossRef]
  5. Nihikiwa, K. Species relationship of wheat and its putative ancestors as viewed from isozyme variation. In Proceedings of the Proceedings of the 6th International Wheat Genetics Symposium, Kyoto, Japan, 28 November–3 December 1983; pp. 59–63. [Google Scholar]
  6. Dvorák, J.; Terlizzi, P.; Zhang, H.B.; Resta, P. The evolution of polyploid wheats: Identification of the A genome donor species. Genome 1993, 36, 21–31. [Google Scholar] [CrossRef]
  7. Dvorák, J.; Zhang, H.B. Variation in repeated nucleotide sequences sheds light on the phylogeny of the wheat B and G genomes. Proc. Natl. Acad. Sci. USA 1990, 87, 9640–9644. [Google Scholar] [CrossRef]
  8. Sarkar, P.; Stebbins, G.L. Morphological evidence concerning the origin of the B genome in wheat. Am. J. Bot. 1956, 43, 297–304. [Google Scholar] [CrossRef]
  9. Royo, C.; Soriano, J.M.; Alvaro, F. Wheat: A Crop in the Bottom of the Mediterranean Diet Pyramid. In Mediterranean Identities; Borna, F.-B., Ed.; IntechOpen: Rijeka, Croatia, 2017; Chapter 16. [Google Scholar]
  10. Chris, G. World Durum Outlook. 2017. Available online: http://www.internationalpasta.org/resources/IPO%20BOARD%202013/2%20Chris%20Gillen.pdf (accessed on 7 April 2017).
  11. Statistic-Canada. Canada: Outlook for Principal Field Crops. 2017. Available online: http://www.agr.gc.ca/eng/industry-markets-and-trade/statistics-and-market-information/by-product-sector/crops-industry/outlook-for-principal-field-crops-in-canada/canada-outlook-for-principal-field-cropsfebruary-16-2016/?id=1455720699951 (accessed on 7 April 2017).
  12. USDA Foreign Agricultural Service. Grain and Feed Annual; GAIN Report No: TR5016; USDA Foreign Agricultural Service: Ankara, Turkey, 2015.
  13. International Grains Council. World Grain Statistics. 2016. Available online: https://www.igc.int/en/subscriptions/subscription.aspx (accessed on 21 May 2020).
  14. Food-Price-Index. Food Price Index (FPI). 2016. Available online: http://www.fao.org/worldfoodsituation/foodpricesindex/en/ (accessed on 22 December 2016).
  15. Breseghello, F.; Sorrells, M.E. Association mapping of kernel size and milling quality in wheat (Triticum aestivum L.) cultivars. Genetics 2006, 172, 1165–1177. [Google Scholar] [CrossRef]
  16. Gegas, V.C.; Nazari, A.; Griffiths, S.; Simmonds, J.; Fish, L.; Orford, S.; Sayers, L.; Doonan, J.H.; Snape, J.W. A genetic framework for grain size and shape variation in wheat. Plant. Cell. 2010, 22, 1046–1056. [Google Scholar] [CrossRef]
  17. Botwright, T.L.; Condon, A.G.; Rebetzke, G.J.; Richards, R.A. Field evaluation of early vigour for genetic improvement of grain yield in wheat. Aust. J. Agric. Res. 2002, 53, 1137–1145. [Google Scholar] [CrossRef]
  18. Farahani, H.A.; Moaveni, P.; Maroufi, K. Effect of seed size on seedling production in wheat (Triticum aestivum L.). Adv. Environ. Biol. 2011, 5, 1711–1716. [Google Scholar]
  19. Desiderio, F.; Zarei, L.; Licciardello, S.; Cheghamirza, K.; Farshadfar, E.; Virzi, N.; Sciacca, F.; Bagnaresi, P.; Battaglia, R.; Guerra, D.; et al. Genomic Regions From an Iranian Landrace Increase Kernel Size in Durum Wheat. Front. Plant Sci. 2019, 10, 448. [Google Scholar] [CrossRef]
  20. Patil, R.M.; Tamhankar, S.A.; Oak, M.D.; Raut, A.L.; Honrao, B.K.; Rao, V.S.; Misra, S.C. Mapping of QTL for agronomic traits and kernel characters in durum wheat (Triticum durum Desf.). Euphytica 2013, 190, 117–129. [Google Scholar] [CrossRef]
  21. Russo, M.A.; Ficco, D.B.M.; Laidò, G.; Marone, D.; Papa, R.; Blanco, A.; Gadaleta, A.; Vita, P.D.; Mastrangelo, A.M. A dense durum wheat × T. dicoccum linkage map based on SNP markers for the study of seed morphology. Mol. Breed. 2014, 2014, 1579–1597. [Google Scholar] [CrossRef]
  22. Ji, G.; Xu, Z.; Fan, X.; Zhou, Q.; Chen, L.; Yu, Q.; Liao, S.; Jiang, C.; Feng, B.; Wang, T. Identification and validation of major QTL for grain size and weight in bread wheat (Triticum aestivum L.). Crop. J. 2023, 11, 564–572. [Google Scholar] [CrossRef]
  23. Kumari, S.; Jaiswal, V.; Mishra, V.K.; Paliwal, R.; Balyan, H.S.; Gupta, P.K. QTL mapping for some grain traits in bread wheat (Triticum aestivum L.). Physiol. Mol. Biol. Plants 2018, 24, 909–920. [Google Scholar] [CrossRef]
  24. Okamoto, Y.; Nguyen, A.T.; Yoshioka, M.; Iehisa, J.C.; Takumi, S. Identification of quantitative trait loci controlling grain size and shape in the D genome of synthetic hexaploid wheat lines. Breed. Sci. 2013, 63, 423–429. [Google Scholar] [CrossRef]
  25. Yan, L.; Liang, F.; Xu, H.; Zhang, X.; Zhai, H.; Sun, Q.; Ni, Z. Identification of QTL for Grain Size and Shape on the D Genome of Natural and Synthetic Allohexaploid Wheats with Near-Identical AABB Genomes. Front. Plant Sci. 2017, 8, 1705. [Google Scholar] [CrossRef]
  26. Yu, K.; Liu, D.; Chen, Y.; Wang, D.; Yang, W.; Yang, W.; Yin, L.; Zhang, C.; Zhao, S.; Sun, J.; et al. Unraveling the genetic architecture of grain size in einkorn wheat through linkage and homology mapping and transcriptomic profiling. J. Exp. Bot. 2019, 70, 4671–4688. [Google Scholar] [CrossRef]
  27. Sesiz, U.; Balyan, H.S.; Özkan, H. QTL detection for grain size and shape traits using an improved genetic map in einkorn wheat (Triticum monococcum L.). Euphytica 2023, 219, 80. [Google Scholar] [CrossRef]
  28. Balasubramanian, S.; Schwartz, C.; Singh, A.; Warthmann, N.; Kim, M.C.; Maloof, J.N.; Loudet, O.; Trainer, G.T.; Dabi, T.; Borevitz, J.O.; et al. QTL Mapping in New Arabidopsis thaliana Advanced Intercross-Recombinant Inbred Lines. PLoS ONE 2009, 4, e4318. [Google Scholar] [CrossRef]
  29. Korte, A.; Farlow, A. The advantages and limitations of trait analysis with GWAS: A review. Plant Methods 2013, 9, 29. [Google Scholar] [CrossRef]
  30. Tuberosa, R.; Salvi, S.; Sanguineti, M.C.; Landi, P.; Maccaferri, M.; Conti, S. Mapping QTLs regulating morpho-physiological traits and yield: Case studies, shortcomings and perspectives in drought-stressed maize. Ann. Bot. 2002, 89, 941–963. [Google Scholar] [CrossRef] [PubMed]
  31. Alemu, A.; Feyissa, T.; Tuberosa, R.; Maccaferri, M.; Sciara, G.; Letta, T.; Abeyo, B. Genome-wide association mapping for grain shape and color traits in Ethiopian durum wheat (Triticum turgidum ssp. durum). Crop. J. 2020, 8, 757–768. [Google Scholar] [CrossRef]
  32. Ali, A.; Ullah, Z.; Alam, N.; Naqvi, S.; Jamil, M.; Bux, H.; Sher, H. Genetic analysis of wheat grains using digital imaging and their relationship to enhance grain weight. Sci. Agric. 2020, 77, e20190069. [Google Scholar] [CrossRef]
  33. Gao, L.; Yang, J.; Song, S.-j.; Xu, K.; Liu, H.-d.; Zhang, S.-h.; Yang, X.-j.; Zhao, Y. Genome–wide association study of grain morphology in wheat. Euphytica 2021, 217, 170. [Google Scholar] [CrossRef]
  34. Gao, Y.; Xu, X.; Jin, J.; Duan, S.; Zhen, W.; Xie, C.; Ma, J. Dissecting the genetic basis of grain morphology traits in Chinese wheat by genome wide association study. Euphytica 2021, 217, 56. [Google Scholar] [CrossRef]
  35. Li, F.; Wen, W.; Liu, J.; Zhang, Y.; Cao, S.; He, Z.; Rasheed, A.; Jin, H.; Zhang, C.; Yan, J.; et al. Genetic architecture of grain yield in bread wheat based on genome-wide association studies. BMC Plant. Biol. 2019, 19, 168. [Google Scholar] [CrossRef]
  36. Malik, P.; Kumar, J.; Sharma, S.; Meher, P.K.; Balyan, H.S.; Gupta, P.K.; Sharma, S. GWAS for main effects and epistatic interactions for grain morphology traits in wheat. Physiol. Mol. Biol. Plants 2022, 28, 651–668. [Google Scholar] [CrossRef]
  37. Muhammad, A.; Hu, W.; Li, Z.; Li, J.; Xie, G.; Wang, J.; Wang, L. Appraising the Genetic Architecture of Kernel Traits in Hexaploid Wheat Using GWAS. Int. J. Mol. Sci. 2020, 21, 5649. [Google Scholar] [CrossRef]
  38. Rasheed, A.; Xia, X.; Ogbonnaya, F.; Mahmood, T.; Zhang, Z.; Mujeeb-Kazi, A.; He, Z. Genome-wide association for grain morphology in synthetic hexaploid wheats using digital imaging analysis. BMC Plant. Biol. 2014, 14, 128. [Google Scholar] [CrossRef]
  39. Tekeu, H.; Ngonkeu, E.L.M.; Bélanger, S.; Djocgoué, P.F.; Abed, A.; Torkamaneh, D.; Boyle, B.; Tsimi, P.M.; Tadesse, W.; Jean, M.; et al. GWAS identifies an ortholog of the rice D11 gene as a candidate gene for grain size in an international collection of hexaploid wheat. Sci. Rep. 2021, 11, 19483. [Google Scholar] [CrossRef]
  40. Yan, X.; Zhao, L.; Ren, Y.; Dong, Z.; Cui, D.; Chen, F. Genome-wide association study revealed that the TaGW8 gene was associated with kernel size in Chinese bread wheat. Sci. Rep. 2019, 9, 2702. [Google Scholar] [CrossRef] [PubMed]
  41. Zanke, C.D.; Ling, J.; Plieske, J.; Kollers, S.; Ebmeyer, E.; Korzun, V.; Argillier, O.; Stiewe, G.; Hinze, M.; Neumann, F.; et al. Analysis of main effect QTL for thousand grain weight in European winter wheat (Triticum aestivum L.) by genome-wide association mapping. Front. Plant. Sci. 2015, 6, 644. [Google Scholar] [CrossRef] [PubMed]
  42. Wang, S.; Xu, S.; Chao, S.; Sun, Q.; Liu, S.; Xia, G. A Genome-Wide Association Study of Highly Heritable Agronomic Traits in Durum Wheat. Front. Plant Sci. 2019, 10, 919. [Google Scholar] [CrossRef] [PubMed]
  43. Volante, A.; Barabaschi, D.; Marino, R.; Brandolini, A. Genome-wide association study for morphological, phenological, quality, and yield traits in einkorn (Triticum monococcum L. subsp. monococcum). G3 Genes|Genomes|Genetics 2021, 11, jkab281. [Google Scholar] [CrossRef]
  44. Talini, R.F.; Brandolini, A.; Miculan, M.; Brunazzi, A.; Vaccino, P.; Pè, M.E.; Dell’Acqua, M. Genome-wide association study of agronomic and quality traits in a world collection of the wild wheat relative Triticum urartu. Plant J. 2020, 102, 555–568. [Google Scholar] [CrossRef]
  45. Arora, S.; Singh, N.; Kaur, S.; Bains, N.S.; Uauy, C.; Poland, J.; Chhuneja, P. Genome-Wide Association Study of Grain Architecture in Wild Wheat Aegilops tauschii. Front. Plant Sci. 2017, 8, 886. [Google Scholar] [CrossRef] [PubMed]
  46. Zhao, X.; Lv, L.; Li, J.; Ma, F.; Bai, S.; Zhou, Y.; Zhang, D.; Li, S.; Song, C.-p. Genome-wide association study of grain shapes in Aegilops tauschii. Euphytica 2021, 217, 144. [Google Scholar] [CrossRef]
  47. Kilian, A.; Wenzl, P.; Huttner, E.; Carling, J.; Xia, L.; Blois, H.; Caig, V.; Heller-Uszynska, K.; Jaccoud, D.; Hopper, C.; et al. Diversity arrays technology: A generic genome profiling technology on open platforms. Methods Mol. Biol. 2012, 888, 67–89. [Google Scholar] [CrossRef]
  48. Furbank, R.T.; Tester, M. Phenomics—Technologies to relieve the phenotyping bottleneck. Trends Plant Sci. 2011, 16, 635–644. [Google Scholar] [CrossRef]
  49. Tanabata, T.; Shibaya, T.; Hori, K.; Ebana, K.; Yano, M. SmartGrain: High-Throughput Phenotyping Software for Measuring Seed Shape through Image Analysis. Plant Physiol. 2012, 160, 1871–1880. [Google Scholar] [CrossRef]
  50. Zadoks, J.C.; Chang, T.T.; Konzak, C.F. A decimal code for the growth stages of cereals. Weed Res. 1974, 14, 415–421. [Google Scholar] [CrossRef]
  51. Olivoto, T.; Lúcio, A.D.C. metan: An R package for multi-environment trial analysis. Methods Ecol. Evol. 2020, 11, 783–789. [Google Scholar] [CrossRef]
  52. Team, J. JASP, Version 0.11.1; [Computer software]; 2019. Available online: https://jasp-stats.org/faq/how-do-i-cite-jasp/ (accessed on 11 May 2023).
  53. SAS Institute Inc. JMP®, Version 9.0; SAS Institute Inc.: Cary, NC, USA, 2021.
  54. Huang, M.; Liu, X.; Zhou, Y.; Summers, R.M.; Zhang, Z. BLINK: A package for the next level of genome-wide association studies with both individuals and markers in the millions. GigaScience 2018, 8, giy154. [Google Scholar] [CrossRef] [PubMed]
  55. Bradbury, P.J.; Zhang, Z.; Kroon, D.E.; Casstevens, T.M.; Ramdoss, Y.; Buckler, E.S. TASSEL: Software for association mapping of complex traits in diverse samples. Bioinformatics 2007, 23, 2633–2635. [Google Scholar] [CrossRef]
  56. Barrett, J.C.; Fry, B.; Maller, J.; Daly, M.J. Haploview: Analysis and visualization of LD and haplotype maps. Bioinformatics 2005, 21, 263–265. [Google Scholar] [CrossRef]
  57. Liu, X.; Huang, M.; Fan, B.; Buckler, E.S.; Zhang, Z. Iterative Usage of Fixed and Random Effect Models for Powerful and Efficient Genome-Wide Association Studies. PLOS Genet. 2016, 12, e1005767. [Google Scholar] [CrossRef]
  58. Yin, L.; Zhang, H.; Tang, Z.; Xu, J.; Yin, D.; Zhang, Z.; Yuan, X.; Zhu, M.; Zhao, S.; Li, X.; et al. rMVP: A Memory-efficient, Visualization-enhanced, and Parallel-accelerated Tool for Genome-wide Association Study. Genom. Proteom. Bioinform. 2021, 19, 619–628. [Google Scholar] [CrossRef]
  59. Rabieyan, E.; Bihamta, M.R.; Moghaddam, M.E.; Mohammadi, V.; Alipour, H. Genome-wide association mapping for wheat morphometric seed traits in Iranian landraces and cultivars under rain-fed and well-watered conditions. Sci. Rep. 2022, 12, 17839. [Google Scholar] [CrossRef]
  60. Muhammad, A.; Li, J.; Hu, W.; Yu, J.; Khan, S.U.; Khan, M.H.U.; Xie, G.; Wang, J.; Wang, L. Uncovering genomic regions controlling plant architectural traits in hexaploid wheat using different GWAS models. Sci. Rep. 2021, 11, 6767. [Google Scholar] [CrossRef]
  61. Schierenbeck, M.; Alqudah, A.M.; Lohwasser, U.; Tarawneh, R.A.; Simón, M.R.; Börner, A. Genetic dissection of grain architecture-related traits in a winter wheat population. BMC Plant Biol. 2021, 21, 417. [Google Scholar] [CrossRef]
  62. Dong, N.Q.; Sun, Y.; Guo, T.; Shi, C.L.; Zhang, Y.M.; Kan, Y.; Xiang, Y.H.; Zhang, H.; Yang, Y.B.; Li, Y.C.; et al. UDP-glucosyltransferase regulates grain size and abiotic stress tolerance associated with metabolic flux redirection in rice. Nat. Commun. 2020, 11, 2629. [Google Scholar] [CrossRef] [PubMed]
  63. Vergès, V.; Dutilleul, C.; Godin, B.; Collet, B.; Lecureuil, A.; Rajjou, L.; Guimaraes, C.; Pinault, M.; Chevalier, S.; Giglioli-Guivarc’h, N.; et al. Protein Farnesylation Takes Part in Arabidopsis Seed Development. Front. Plant. Sci. 2021, 12, 620325. [Google Scholar] [CrossRef] [PubMed]
  64. Song, X.-J.; Huang, W.; Shi, M.; Zhu, M.-Z.; Lin, H.-X. A QTL for rice grain width and weight encodes a previously unknown RING-type E3 ubiquitin ligase. Nat. Genet. 2007, 39, 623–630. [Google Scholar] [CrossRef] [PubMed]
  65. Du, L.; Li, N.; Chen, L.; Xu, Y.; Li, Y.; Zhang, Y.; Li, C.; Li, Y. The Ubiquitin Receptor DA1 Regulates Seed and Organ Size by Modulating the Stability of the Ubiquitin-Specific Protease UBP15/SOD2 in Arabidopsis. Plant Cell 2014, 26, 665–677. [Google Scholar] [CrossRef]
  66. Li, Y.; Zheng, L.; Corke, F.; Smith, C.; Bevan, M.W. Control of final seed and organ size by the DA1 gene family in Arabidopsis thaliana. Genes. Dev. 2008, 22, 1331–1336. [Google Scholar] [CrossRef]
  67. Wang, H.; Jiao, X.; Kong, X.; Liu, Y.; Chen, X.; Fang, R.; Yan, Y. The histone deacetylase HDA703 interacts with OsBZR1 to regulate rice brassinosteroid signaling, growth and heading date through repression of Ghd7 expression. Plant J. 2020, 104, 447–459. [Google Scholar] [CrossRef]
  68. Jiang, W.B.; Huang, H.Y.; Hu, Y.W.; Zhu, S.W.; Wang, Z.Y.; Lin, W.H. Brassinosteroid regulates seed size and shape in Arabidopsis. Plant Physiol. 2013, 162, 1965–1977. [Google Scholar] [CrossRef]
  69. Watt, C.; Zhou, G.; Li, C. Harnessing Transcription Factors as Potential Tools to Enhance Grain Size Under Stressful Abiotic Conditions in Cereal Crops. Front. Plant Sci. 2020, 11, 1273. [Google Scholar] [CrossRef]
  70. Huang, K.; Wang, D.; Duan, P.; Zhang, B.; Xu, R.; Li, N.; Li, Y. WIDE AND THICK GRAIN 1, which encodes an otubain-like protease with deubiquitination activity, influences grain size and shape in rice. Plant J. 2017, 91, 849–860. [Google Scholar] [CrossRef]
  71. Zhang, H.; Ma, J.; Liu, J.; Mu, Y.; Tang, H.; Liu, Y.; Chen, G.; Jiang, Q.; Chen, G.; Wei, Y.; et al. Molecular characterization of the TaWTG1 in bread wheat (Triticum aestivum L.). Gene 2018, 678, 23–32. [Google Scholar] [CrossRef]
  72. Hong-Bo, S.; Zong-Suo, L.; Ming-An, S. LEA proteins in higher plants: Structure, function, gene expression and regulation. Colloids Surf. B Biointerfaces 2005, 45, 131–135. [Google Scholar] [CrossRef] [PubMed]
  73. McCarty, D.R.; Hattori, T.; Carson, C.B.; Vasil, V.; Lazar, M.; Vasil, I.K. The Viviparous-1 developmental gene of maize encodes a novel transcriptional activator. Cell 1991, 66, 895–905. [Google Scholar] [CrossRef]
  74. Yang, T.; Guo, L.; Ji, C.; Wang, H.; Wang, J.; Zheng, X.; Xiao, Q.; Wu, Y. The B3 domain-containing transcription factor ZmABI19 coordinates expression of key factors required for maize seed development and grain filling. Plant Cell 2020, 33, 104–128. [Google Scholar] [CrossRef] [PubMed]
  75. Adamski, N.M.; Anastasiou, E.; Eriksson, S.; O’Neill, C.M.; Lenhard, M. Local maternal control of seed size by KLUH/CYP78A5-dependent growth signaling. Proc. Natl. Acad. Sci. USA 2009, 106, 20115–20120. [Google Scholar] [CrossRef] [PubMed]
  76. Chakrabarti, M.; Zhang, N.; Sauvage, C.; Muños, S.; Blanca, J.; Cañizares, J.; Diez, M.J.; Schneider, R.; Mazourek, M.; McClead, J.; et al. A cytochrome P450 regulates a domestication trait in cultivated tomato. Proc. Natl. Acad. Sci. USA 2013, 110, 17125–17130. [Google Scholar] [CrossRef]
  77. Qi, X.; Liu, C.; Song, L.; Li, Y.; Li, M. PaCYP78A9, a Cytochrome P450, Regulates Fruit Size in Sweet Cherry (Prunus avium L.). Front. Plant Sci. 2017, 8, 2076. [Google Scholar] [CrossRef]
  78. Zhao, B.; Dai, A.; Wei, H.; Yang, S.; Wang, B.; Jiang, N.; Feng, X. Arabidopsis KLU homologue GmCYP78A72 regulates seed size in soybean. Plant Mol. Biol. 2016, 90, 33–47. [Google Scholar] [CrossRef]
  79. Ma, M.; Wang, Q.; Li, Z.; Cheng, H.; Li, Z.; Liu, X.; Song, W.; Appels, R.; Zhao, H. Expression of TaCYP78A3, a gene encoding cytochrome P450 CYP78A3 protein in wheat (Triticum aestivum L.), affects seed size. Plant J. 2015, 83, 312–325. [Google Scholar] [CrossRef]
  80. Huang, S.; Cerny, R.E.; Bhat, D.S.; Brown, S.M. Cloning of an Arabidopsis Patatin-Like Gene, STURDY, by Activation T-DNA Tagging. Plant Physiol. 2001, 125, 573–584. [Google Scholar] [CrossRef]
  81. Liu, G.; Zhang, K.; Ai, J.; Deng, X.; Hong, Y.; Wang, X. Patatin-related phospholipase A, pPLAIIIα, modulates the longitudinal growth of vegetative tissues and seeds in rice. J. Exp. Bot. 2015, 66, 6945–6955. [Google Scholar] [CrossRef]
  82. Yu, M.; Huang, D.; Yin, X.; Liu, X.; Yang, D.; Gong, C.; Wang, H.; Wu, Y. The phosphoinositide-specific phospholipase C1 modulates flowering time and grain size in rice. Planta 2022, 256, 29. [Google Scholar] [CrossRef] [PubMed]
  83. Yang, Y.Z.; Ding, S.; Wang, H.C.; Sun, F.; Huang, W.L.; Song, S.; Xu, C.; Tan, B.C. The pentatricopeptide repeat protein EMP9 is required for mitochondrial ccmB and rps4 transcript editing, mitochondrial complex biogenesis and seed development in maize. New Phytol. 2017, 214, 782–795. [Google Scholar] [CrossRef] [PubMed]
  84. Liu, M.; Tan, X.; Yang, Y.; Liu, P.; Zhang, X.; Zhang, Y.; Wang, L.; Hu, Y.; Ma, L.; Li, Z.; et al. Analysis of the genetic architecture of maize kernel size traits by combined linkage and association mapping. Plant. Biotechnol. J. 2020, 18, 207–221. [Google Scholar] [CrossRef]
  85. Zheng, J.; Liu, H.; Wang, Y.; Wang, L.; Chang, X.; Jing, R.; Hao, C.; Zhang, X. TEF-7A, a transcript elongation factor gene, influences yield-related traits in bread wheat (Triticum aestivum L.). J. Exp. Bot. 2014, 65, 5351–5365. [Google Scholar] [CrossRef] [PubMed]
  86. Giancaspro, A.; Giove, S.L.; Zacheo, S.A.; Blanco, A.; Gadaleta, A. Genetic Variation for Protein Content and Yield-Related Traits in a Durum Population Derived From an Inter-Specific Cross Between Hexaploid and Tetraploid Wheat Cultivars. Front. Plant. Sci. 2019, 10, 1509. [Google Scholar] [CrossRef]
  87. Do, T.H.T.; Martinoia, E.; Lee, Y. Functions of ABC transporters in plant growth and development. Curr. Opin. Plant Biol. 2018, 41, 32–38. [Google Scholar] [CrossRef]
Figure 1. The Eigenvector principal component plot (A) and its 3D demonstration (B). The Eigenvector principal component plot demonstrates the number of components on the X-axis against the proportion of the variance explained on the Y-axis. The circles in the plot show the drop points where the plot forms an elbow and the curve flattens out, whereas the red spots in the 3D principal component plot show clustered genotypes based on the SNP data of the population.
Agriculture 13 01882 g001
Figure 2. Kinship plot of the panel. The heat map of the kinship matrix demonstrates the relationship between genotypes.
Agriculture 13 01882 g002
Figure 3. LD decay plot using the physical position of the SNP markers at an r2 value of 0.1. The LD decay drop point was 3,601,053 bp in the whole durum wheat genome. The arcuated red line is a nonlinear logarithmic regression curve of r2 on genetic distance.
Agriculture 13 01882 g003
Figure 4. Manhattan and QQ plots of the GWAS analyses. Markers that exceeded the FDR-adjusted p-values are marker-trait associations (MTAs). Stable MTAs are indicated by vertical lines connecting overlapping markers. Marker names are illustrated in the plots.
Agriculture 13 01882 g004
Table 1. ANOVA for grain size- and shape-related traits of the durum panel in the two environments.
Mean Square
SourceDfASPLLWLWRCSTGW
Environment111.40933 ***2.61750 ***0.029550.58264 ***0.25699 ***0.00012735.42254 ***
Genotype14514.15645 ***4.99604 ***1.06796 ***0.11702 ***0.13180 ***0.00373 ***156.41942 ***
Gen × Env1454.39758 ***0.74099 ***0.12123 ***0.05957 ***0.02099 ***0.00071 ***75.01062 ***
Residuals5800.484590.129620.022070.005580.002200.000073.89443
*** p < 0.001. AS: area size, PL: perimeter length, L: grain length, W: grain width, LWR: length–width ratio, CS: circularity, and TGW: thousand-grain weight.
Table 2. Evaluations of the durum panel’s grain size- and shape-related traits based on the average of the environments.
VariableMaxMeanMinRangeSkewnessKurtosisCV(%)h2
AS26.5520.6114.3312.220.210.163.370.97
PL23.5919.4816.886.710.490.701.840.97
L9.747.886.792.950.591.001.880.98
W3.933.442.661.26−0.350.912.160.96
LWR3.122.291.921.201.062.032.040.98
CS0.740.680.560.18−0.730.821.230.98
TGW73.8052.1923.8449.96−0.160.823.770.98
CV: coefficient of variation, h2: broad-sense heritability, AS: area size, PL: perimeter length, L: grain length, W: grain width, LWR: length–width ratio, CS: circularity, and TGW: thousand-grain weight.
Table 3. Pearson’s correlation coefficient values between environments for grain size- and shape-related traits in durum wheat panel.
EnvironmentASPLLWLWRCSTGW
E1vs.E20.535 ***0.746 ***0.798 ***0.337 ***0.744 ***0.690 ***0.364 ***
E1vs.BLUP0.868 ***0.931 ***0.946 ***0.856 ***0.948 ***0.920 ***−0.013
E2vs.BLUP0.884 ***0.938 ***0.951 ***0.773 ***0.917 ***0.891 ***0.267 **
** p < 0.01, and *** p < 0.001. AS: area size, PL: perimeter length, L: grain length, W: grain width, LWR: length–width ratio, CS: circularity, and TGW: thousand-grain weight.
Table 4. The detected environmentally stable MTAs for grain size- and shape-related traits in the durum panel.
TraitEnvironmentMTASNP-IDChr.Position (bp)p-Value 1MAFAdd. Eff. 2
ASE2/BLUPQAS.su.2A1SNP-10954492A104,655,2221.02 × 10−120.33−0.76
PLE1/E2/BLUPQPL.su.1B1SNP-1000836951B29,327,4613.37 × 10−90.200.40
LE1/E2/BLUPQL.su.1B1SNP-1000836951B29,327,4611.53 × 10−110.200.22
LWRE1/BLUPQLWR.su.2A1SNP-11503692A148,130,7496.62 × 10−90.280.05
E1/BLUPQLWR.su.2A2SNP-9917372A505,958,2551.09 × 10−80.36−0.05
CSE1/BLUPQCS.su.2A1SNP-11503692A148,130,7498.48 × 10−100.28−0.01
E1/BLUPQCS.su.2A2SNP-9917372A505,958,2552.88 × 10−90.36−0.01
E1/BLUPQCS.su.7A1SNP-10597147A673,131,6971.94 × 10−80.41−0.01
TGWE2/BLUPQTGW.su.2A2SNP-30255482A106,204,5692.35 × 10−90.33−2.90
E1/E2/BLUPQTGW.su.2A3SNP-9914342A531,237,7203.17 × 10−170.40−4.24
E1/E2/BLUPQTGW.su.7B1SNP-53696807B500,369,0022.48 × 10−80.45−2.12
1 The highest p-value over environments, 2 additive effects of the significant MTAs on the related traits.
Table 5. LD block marker intervals, the start-end positions of markers, and stable MTAs inside the blocks.
Chr. aBorder Markers bStart-End Position (bp)Interval (kb)MTA
1BSNP-1115814/SNP-228055024,863,377–36,112,06511,248QPL.su.1B1
QL.su.1B1
2ASNP-979718/SNP-1042666101,167,973–122,694,91521,526 QAS.su.2A1
QTGW.su.2A2
2ASNP-2276567/SNP-100097879143,150,820–152,458,4139307QLWR.su.2A1
QCS.su.2A1
2ASNP-1127014/SNP-4002509501,916,772–557,449,43055,532QLWR.su.2A2
QCS.su.2A2
QTGW.su.2A3
7BSNP-1127813/SNP-100112890500,368,572–515,733,52215,364 *QTGW.su.7B1
a The chromosomes that important LD blocks are positioned on. b The LD blocks’ border markers. * Total length of Block 3 and Block 4 (Figure S2).
Table 6. Candidate genes associated with the seed traits of diverse plants and wheat for stable MTAs.
MTAGene Stable IDStart (bp)End (bp)Gene Description
QAS.su.2A1TRITD2Av1G047210103,948,645103,949,427UDP-glycosyltransferase
TRITD2Av1G047390104,433,296104,434,726Glycosyltransferase
* QCS.su.2A1&QLWR.su.2A1TRITD2Av1G065030148,285,931148,287,017BES1/BZR1 homolog 1
QCS.su.7A1TRITD7Av1G256220673,119,977673,122,833B3 domain-containing protein
* QL.su.1B1&QPL.su.1B1TRITD1Bv1G01176028,778,55728,780,832Protoheme IX farnesyltransferase
TRITD1Bv1G01210029,705,09029,707,420Ubiquitin carboxyl-terminal hydrolase 2
TRITD1Bv1G01216029,874,84829,875,394Histone deacetylase 2 G
TRITD1Bv1G01220029,884,92729,885,280Histone deacetylase 2 G
TRITD1Bv1G01229029,918,54829,918,919Histone deacetylase 2 G
* QLWR.su.2A2&QCS.su.2A2TRITD2Av1G180930505,163,820505,168,048Transcription factor
TRITD2Av1G181270505,956,404505,957,413Late embryogenesis abundant (LEA) hydroxyproline
QTGW.su.2A2TRITD2Av1G048230106,205,594106,206,602Cytochrome P450
TRITD2Av1G048320106,340,477106,344,484Patatin
TRITD2Av1G048480107,026,668107,032,955B3 domain-containing protein G
QTGW.su.2A3TRITD2Av1G191770532,722,987532,723,607Phospholipase C 2 G
TRITD2Av1G191850532,838,099532,841,739Pentatricopeptide repeat-containing protein
QTGW.su.7B1TRITD7Bv1G159220500,914,944500,920,059Elongation factor-like protein
TRITD7Bv1G159310501,013,722501,029,428ABC transporter B family protein
* Overlapped MTAs for different traits.
Disclaimer/Publisher’s Note: The statements, opinions and data contained in all publications are solely those of the individual author(s) and contributor(s) and not of MDPI and/or the editor(s). MDPI and/or the editor(s) disclaim responsibility for any injury to people or property resulting from any ideas, methods, instructions or products referred to in the content.

