
Optimization Design and Experiment for Precise Control Double Arc Groove Screw Fertilizer Discharger
Abstract
:1. Introduction
2. Materials and Methods
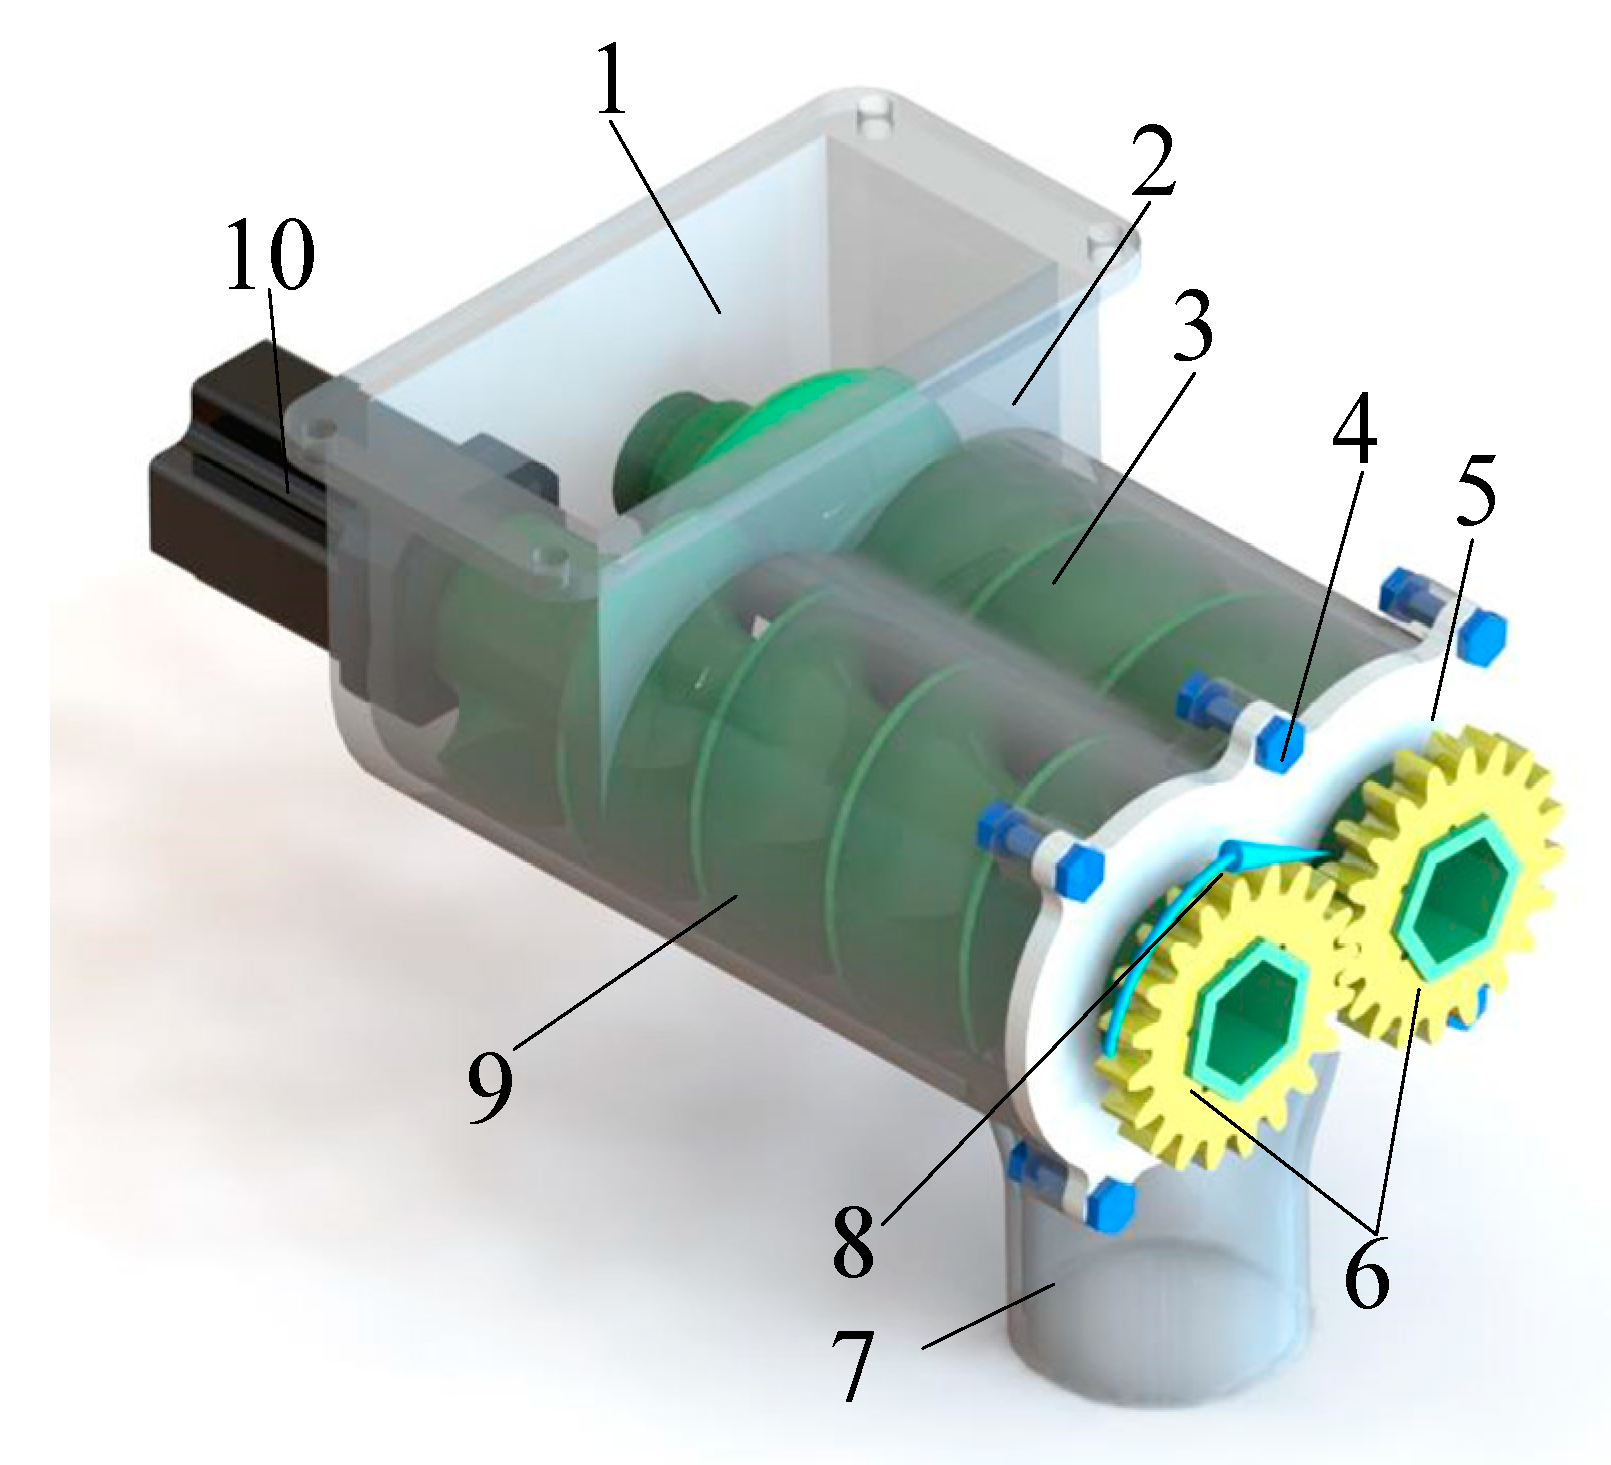
2.1. Design and Working Principle of Double Arc Groove Screw Fertilizer Discharger
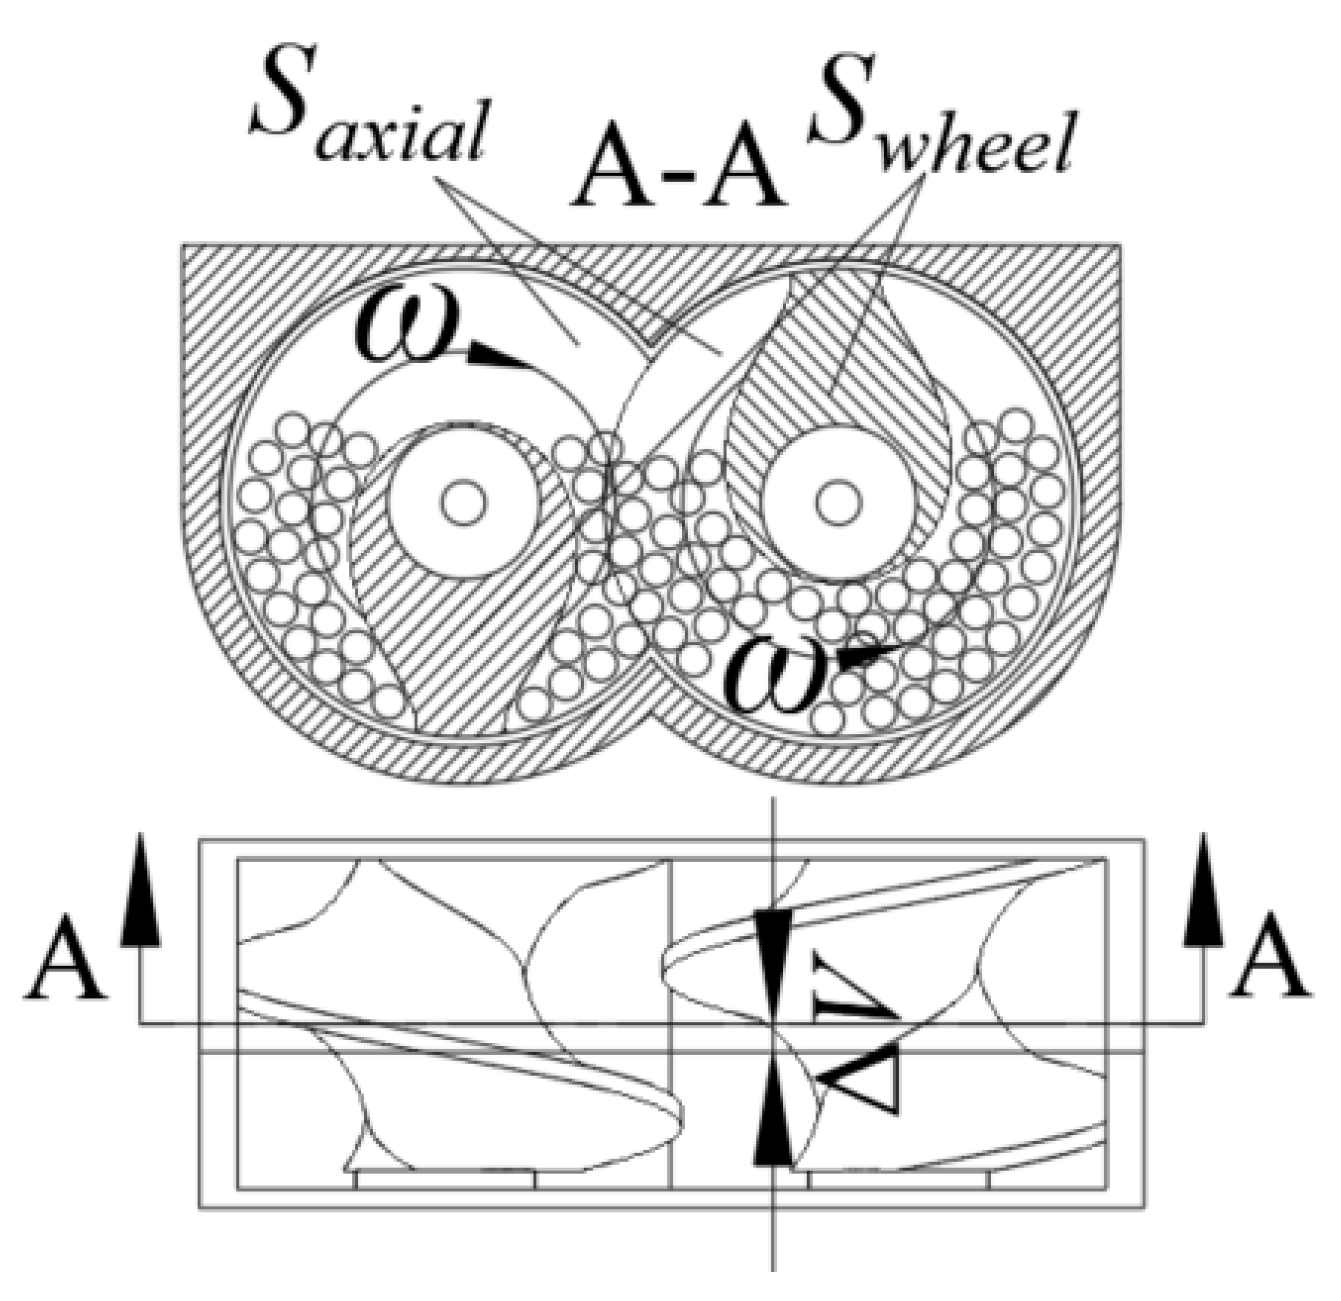
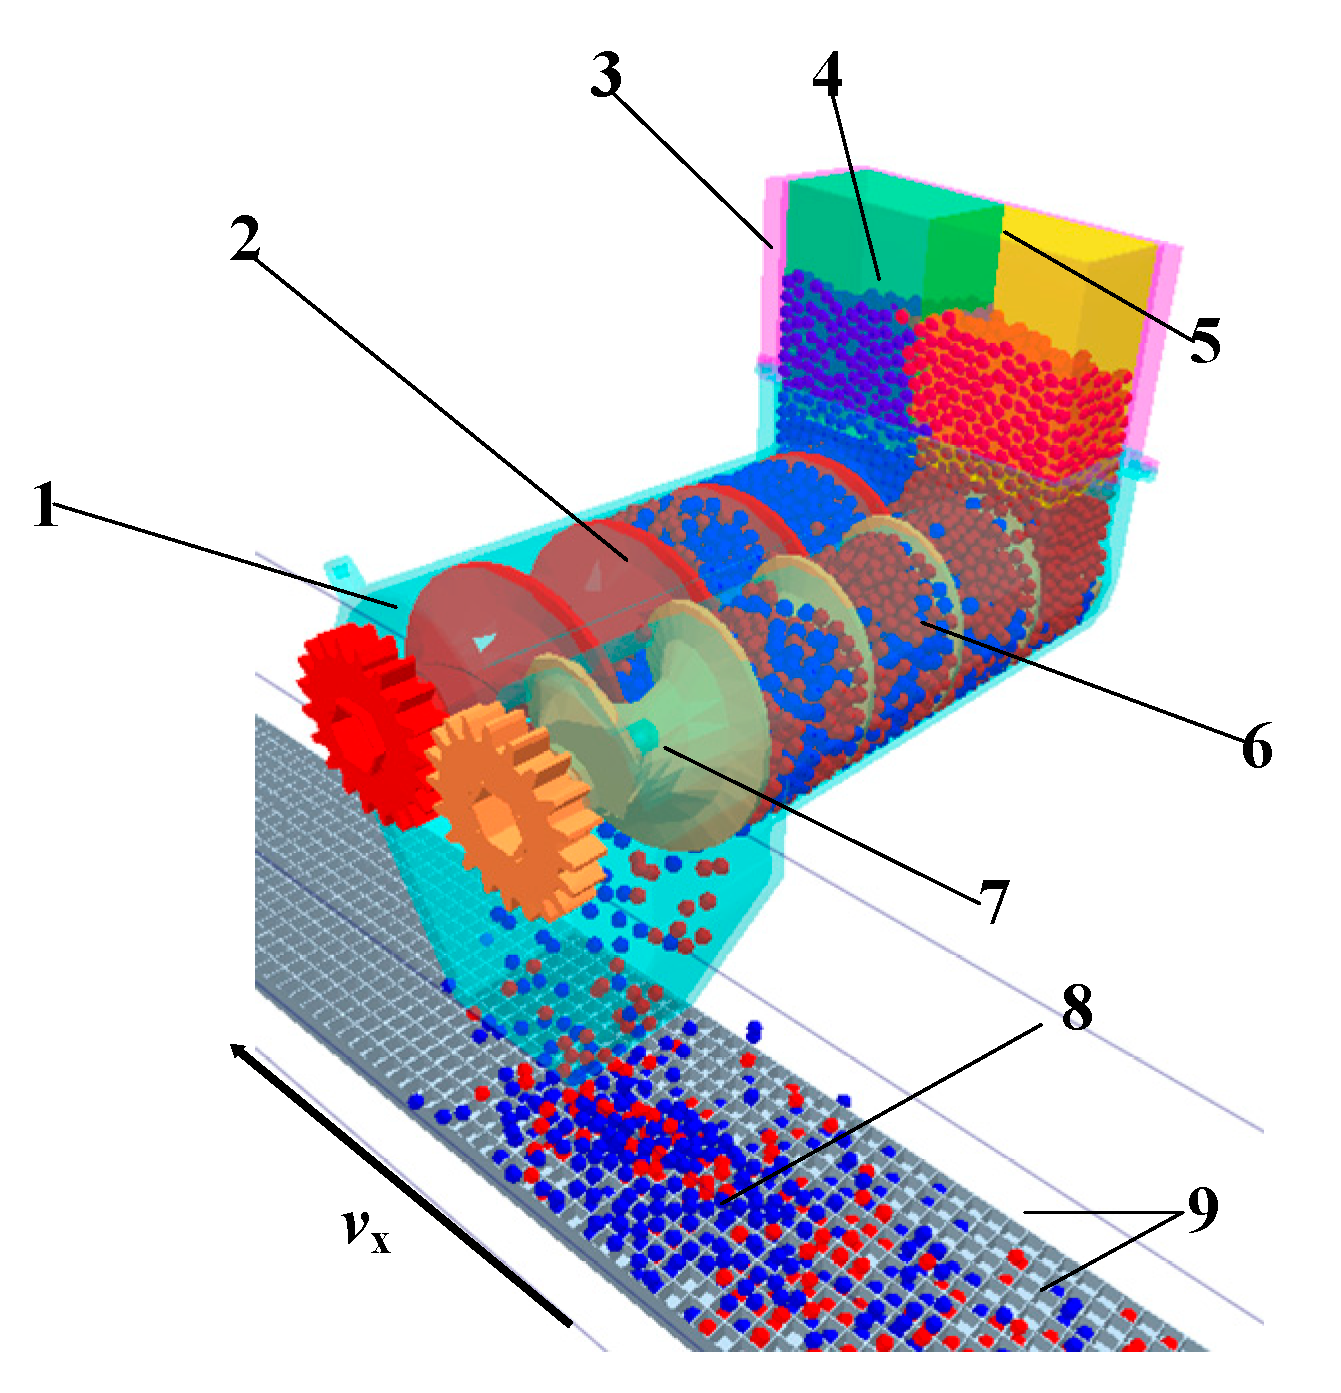
2.1.1. Structure and Working Principle of Double Arc Groove Screw Fertilizer Discharger
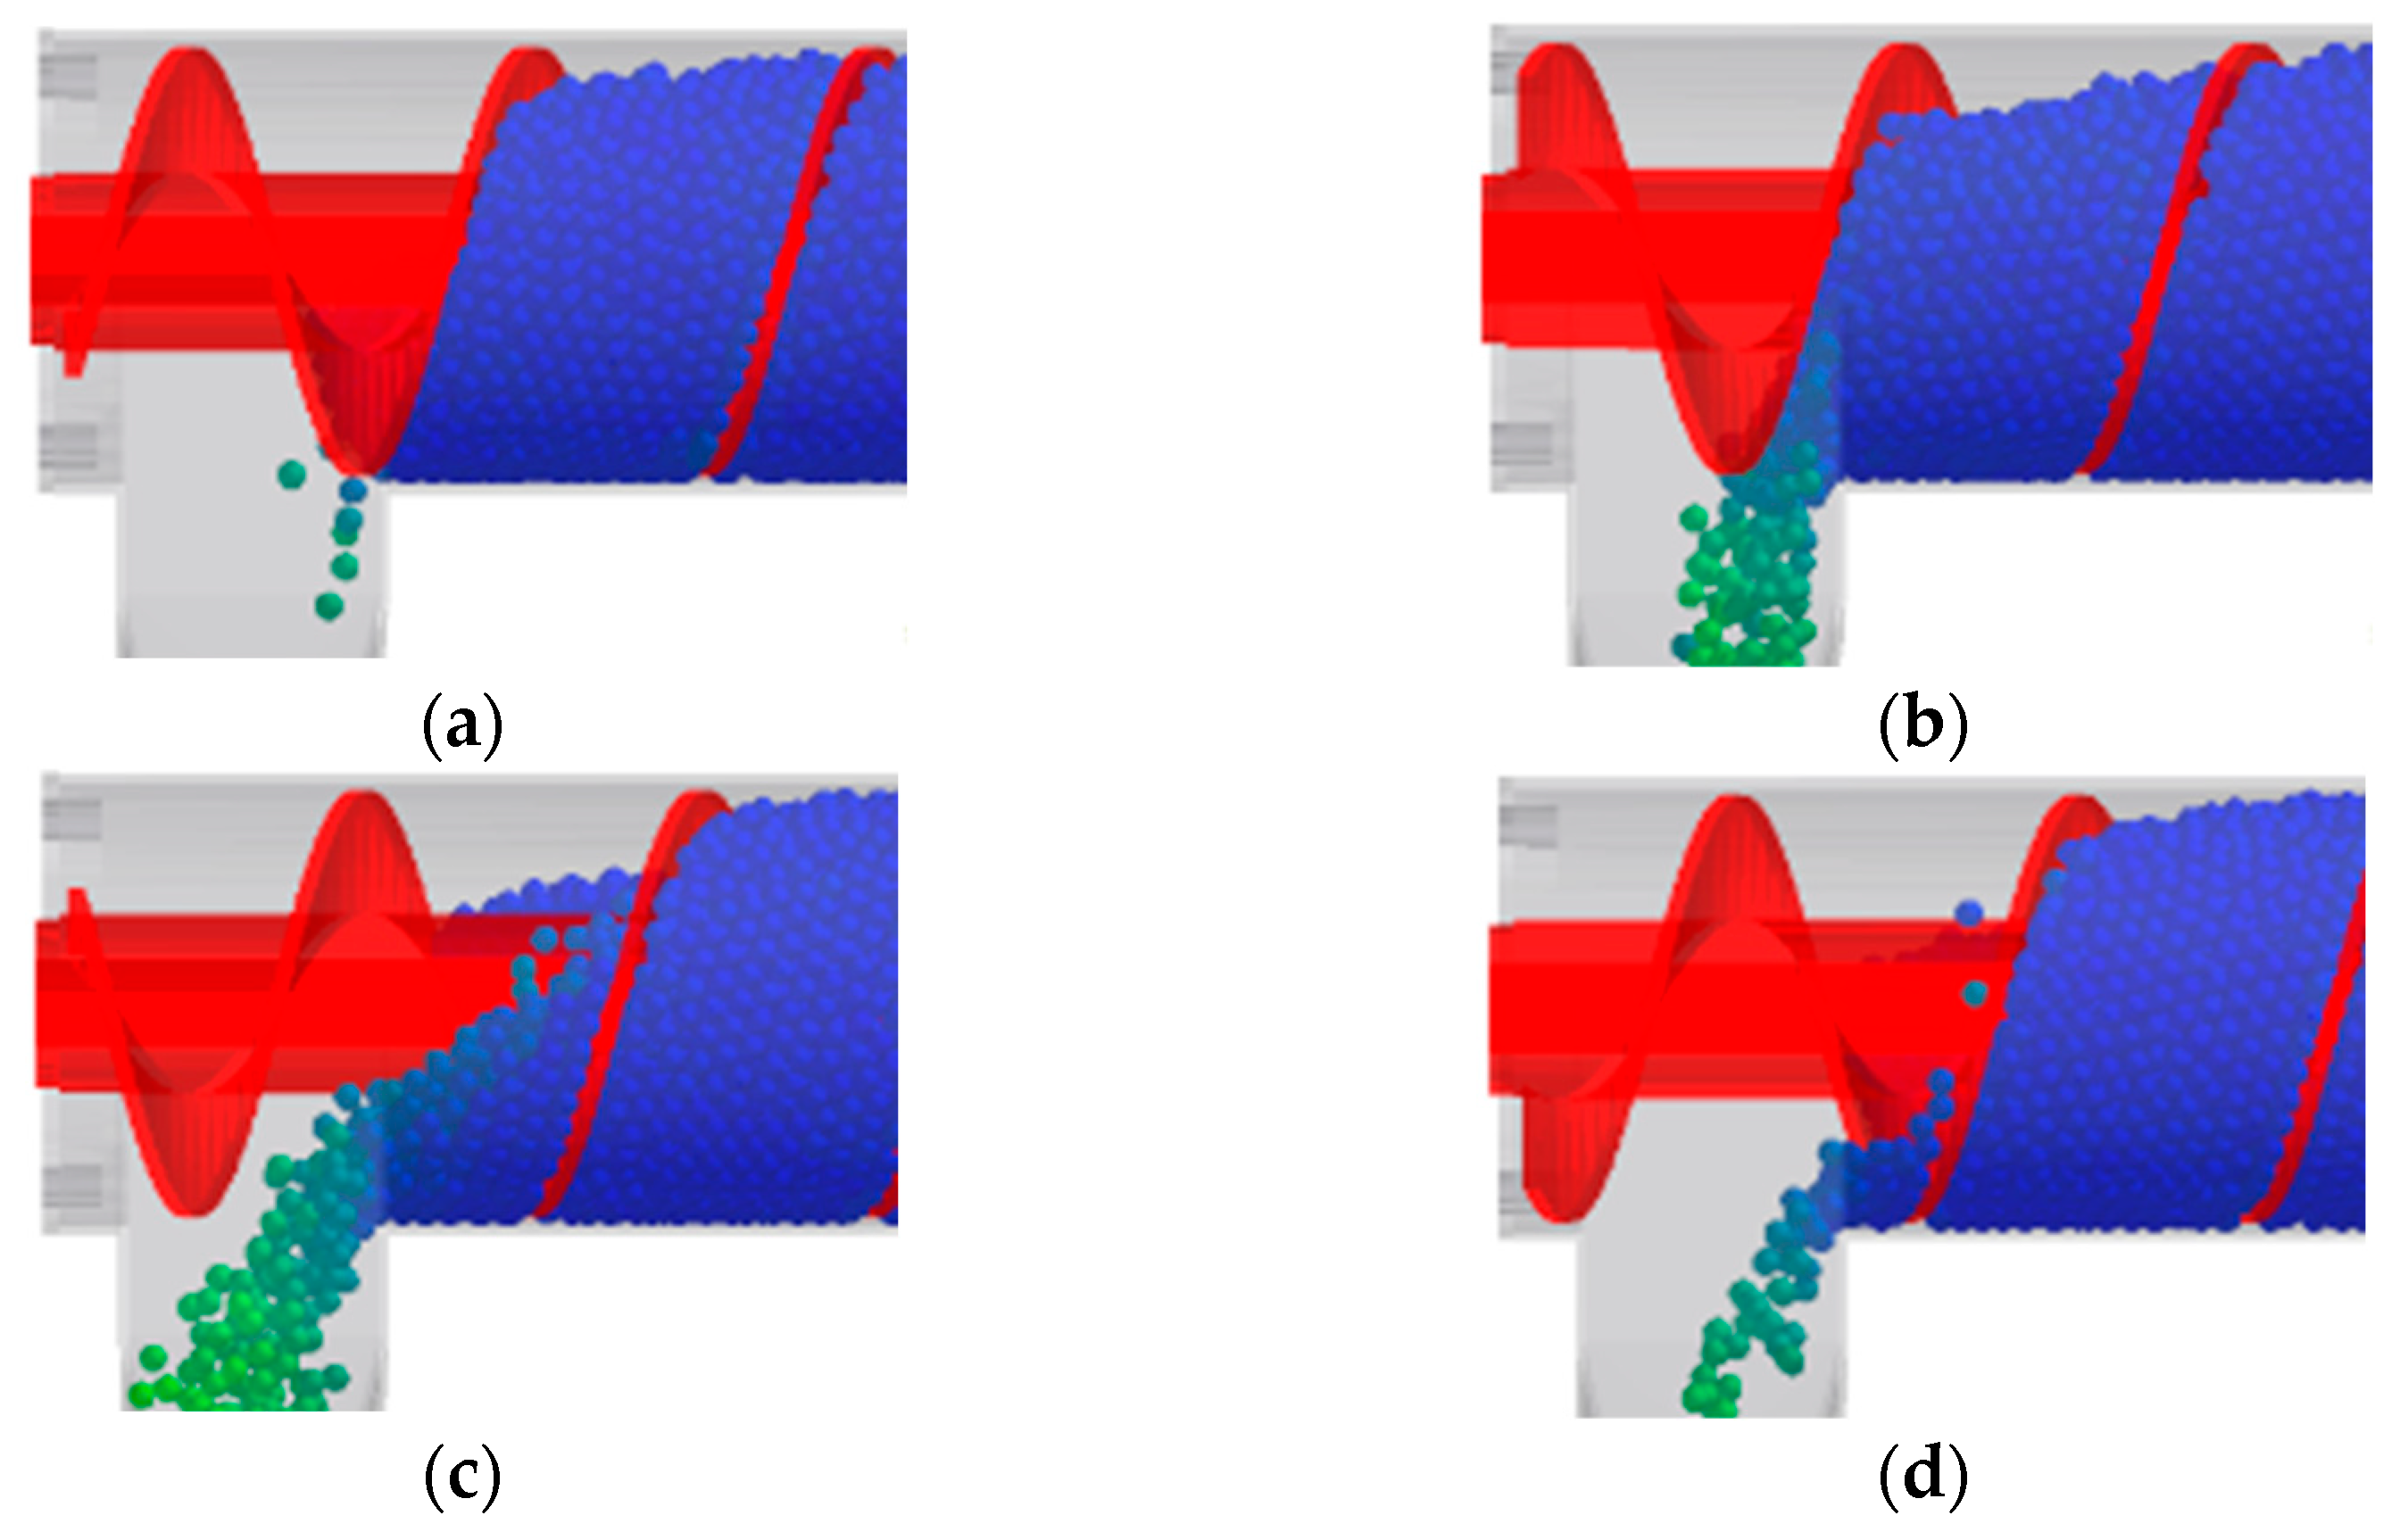
2.1.2. Research on Fertilizer Discharge Characteristics of Single-Screw Fertilizer Discharger
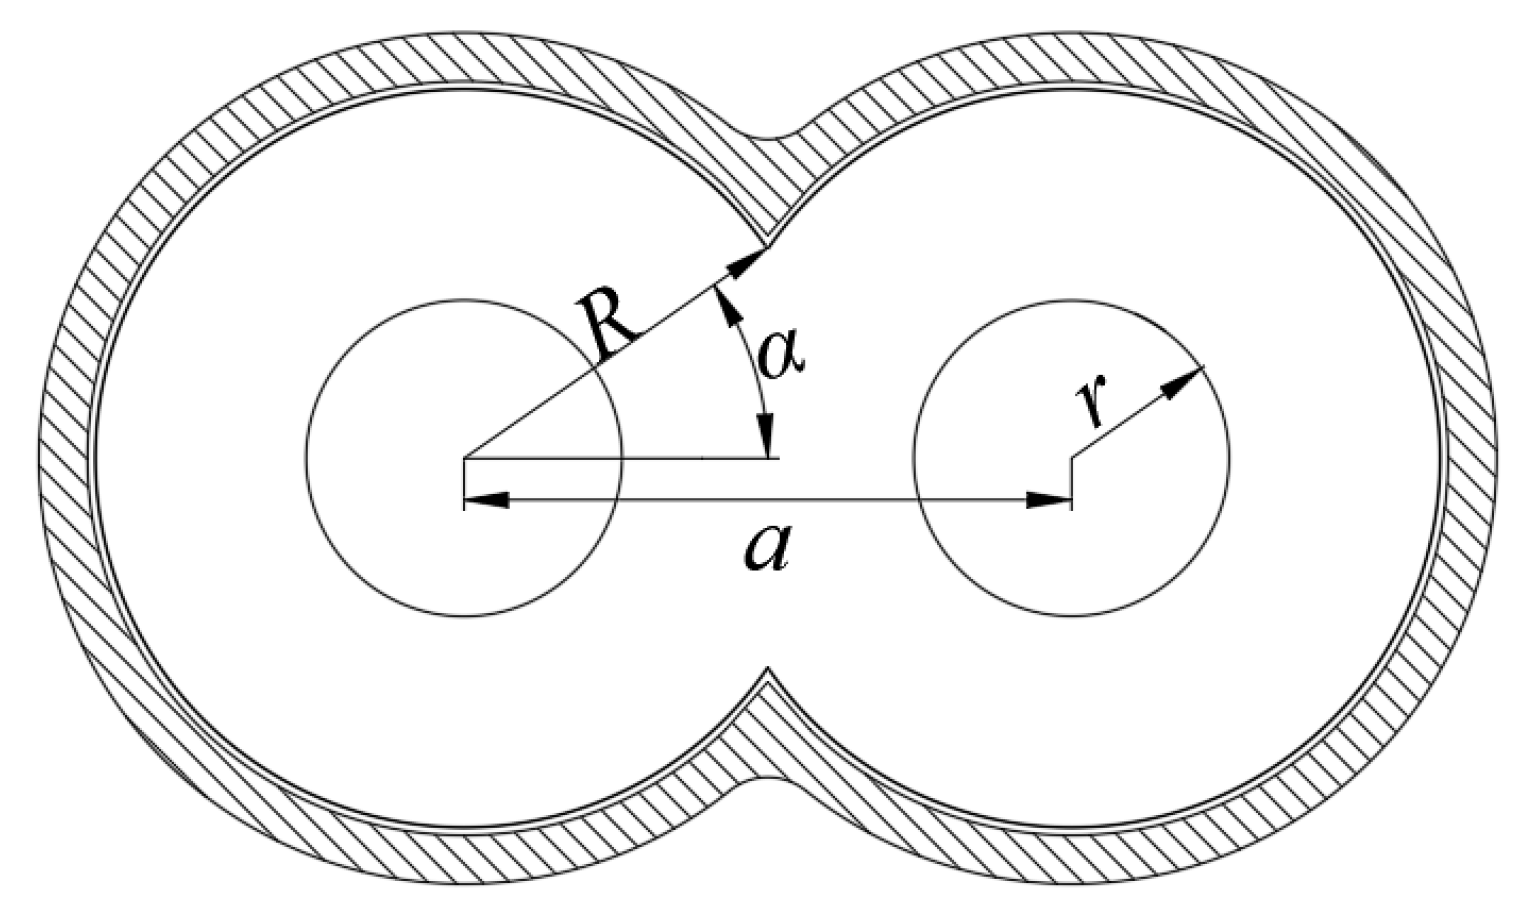
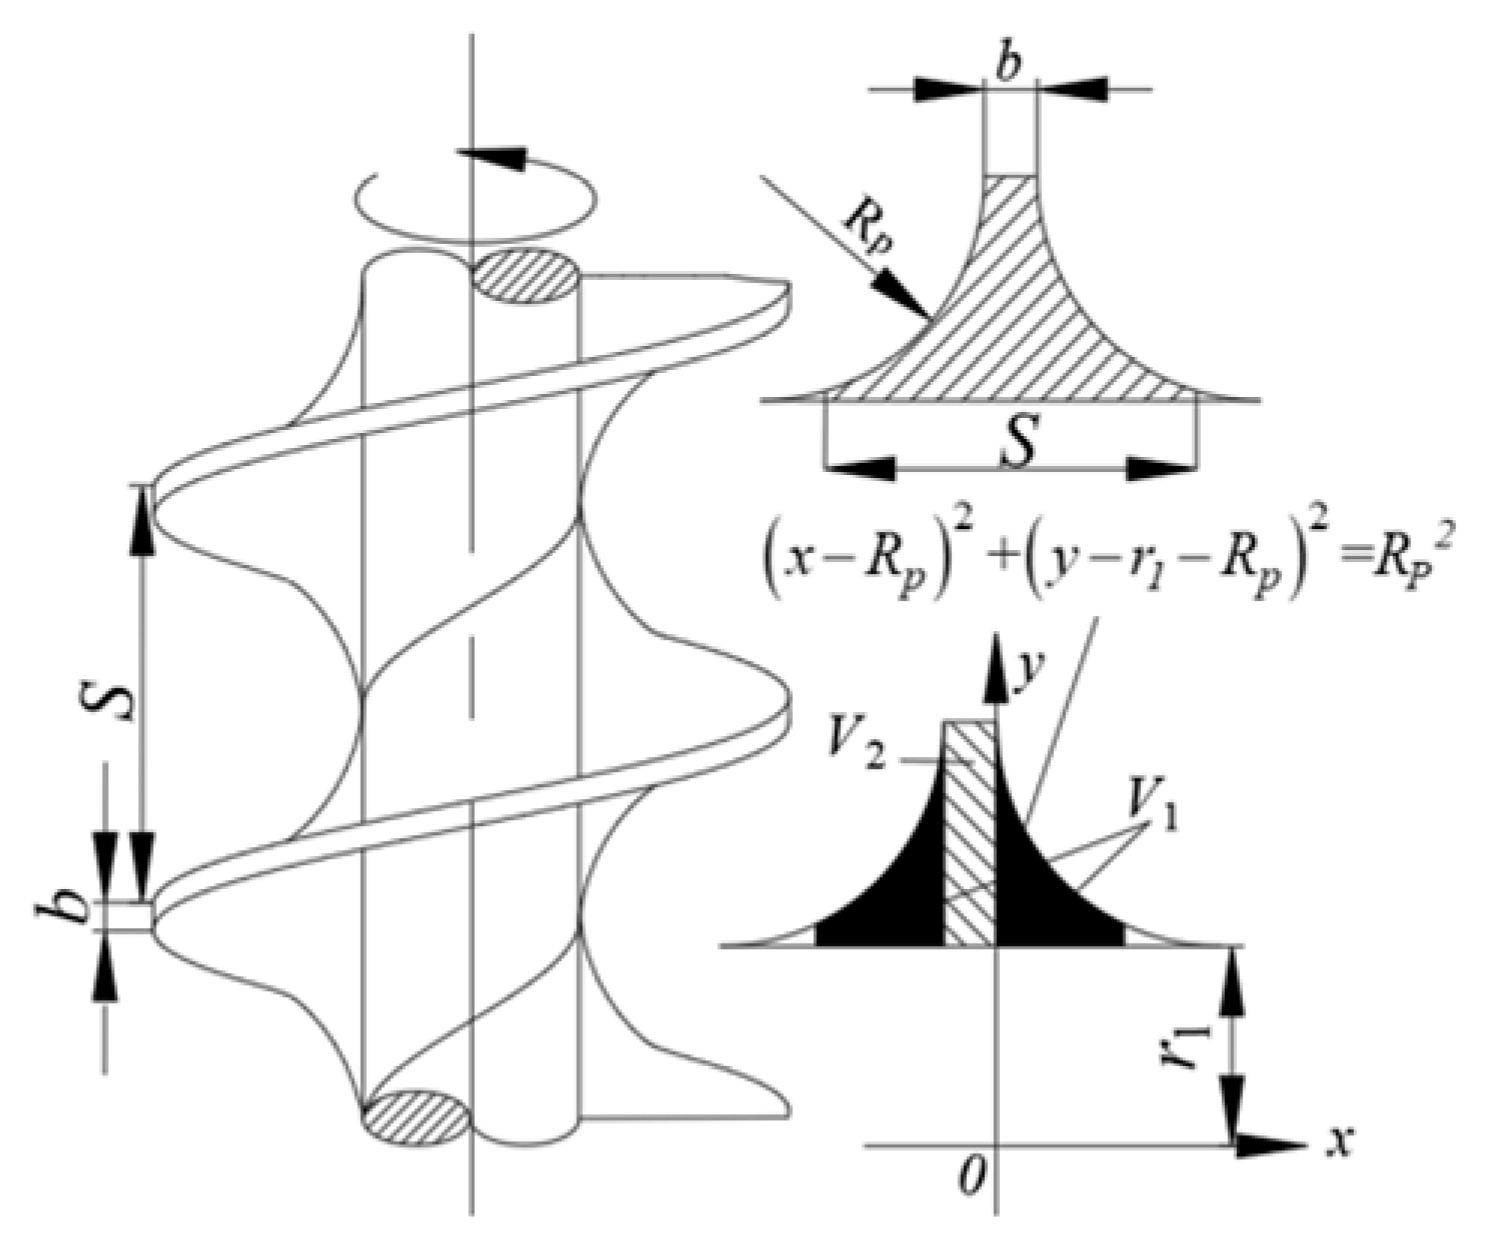
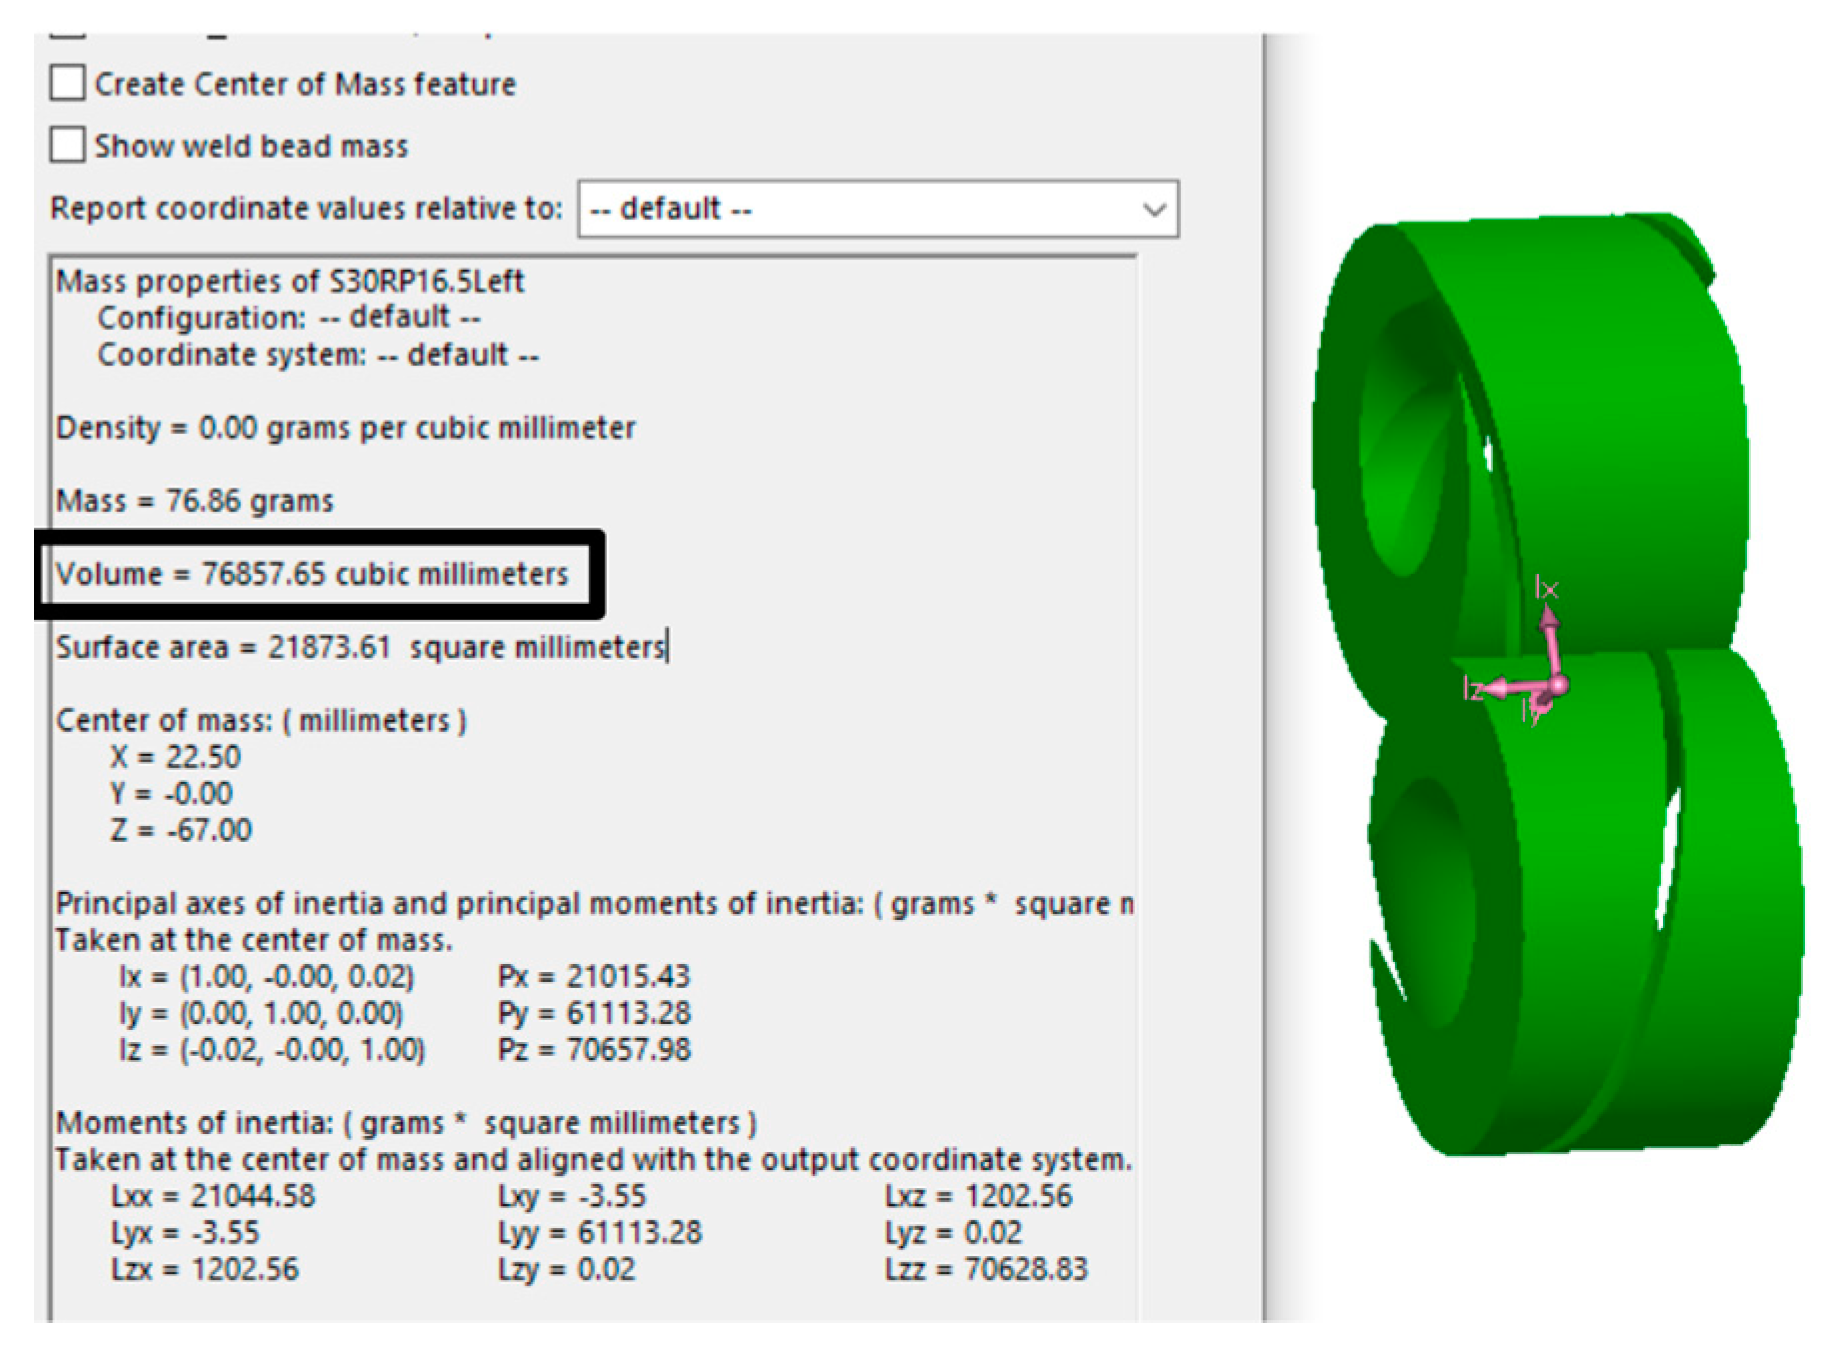
2.1.3. Design of Double Arc Groove Screw Fertilizer Discharger
2.2. Double Arc Groove Screw Fertilizer Discharger
2.2.1. Theoretical Fertilizer Discharge Amount of Double Arc Groove Screw Fertilizer Discharger
2.2.2. Uniformity Analysis of Double Arc Groove Double-Spiral Fertilizer Discharger
3. Simulation Test of Double Arc Groove Screw Fertilizer Discharger
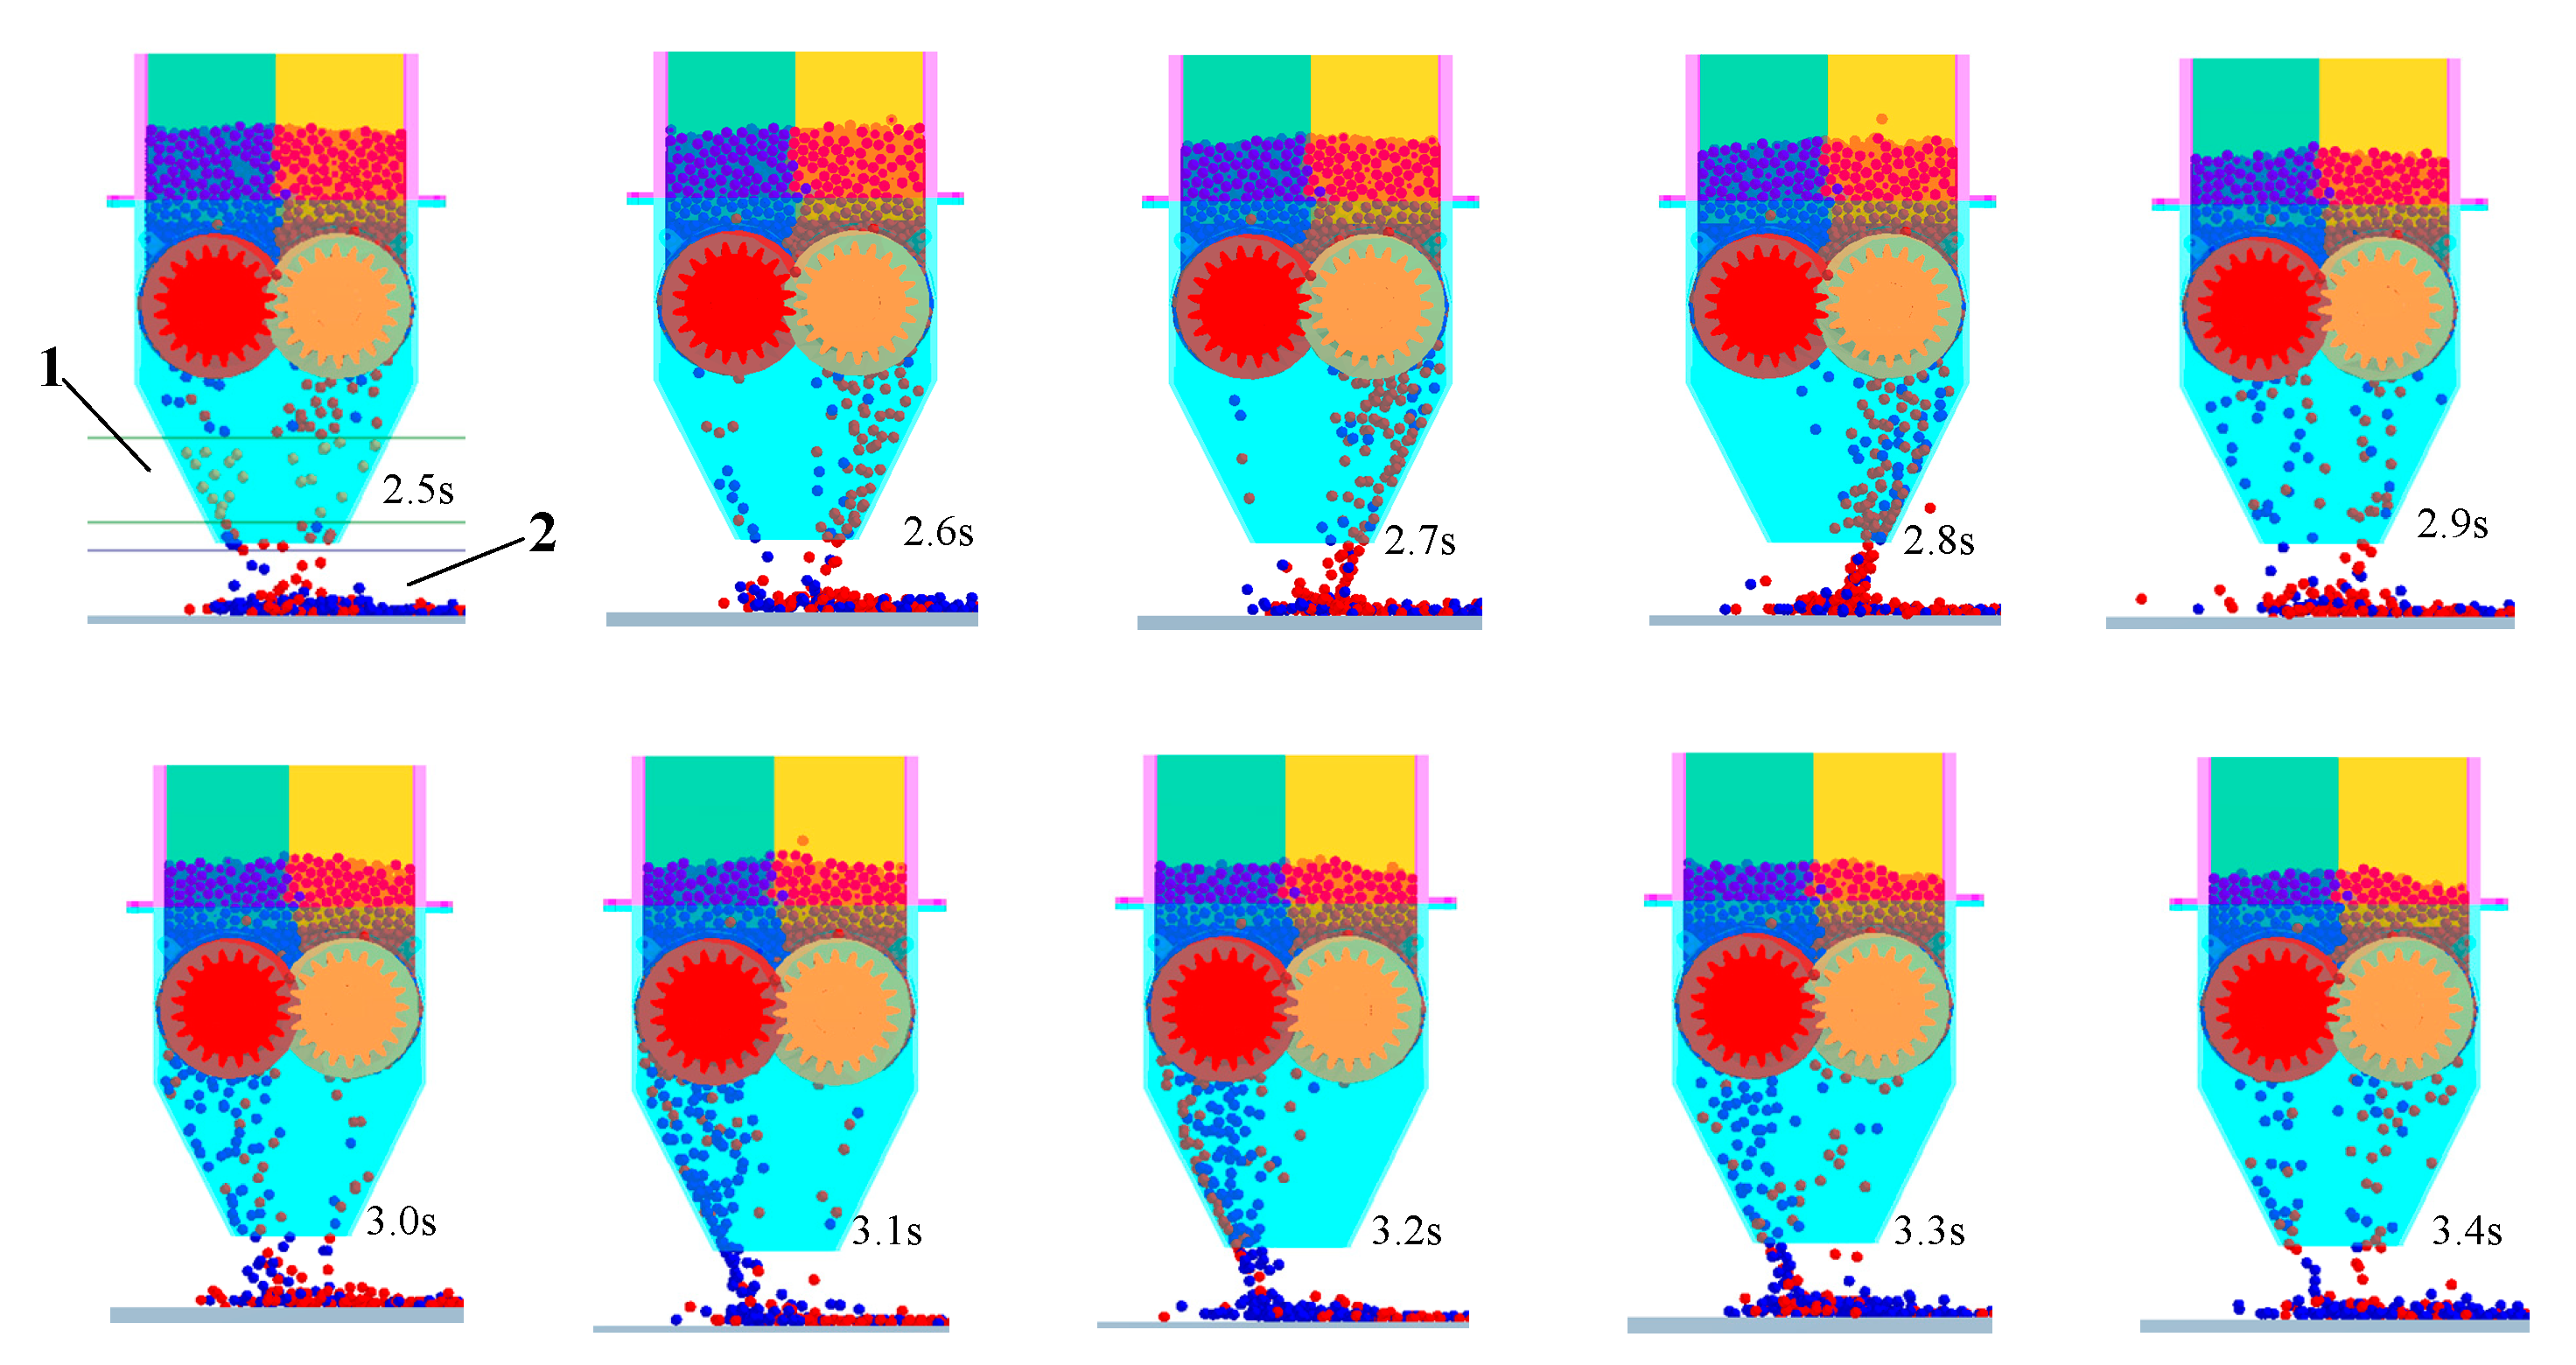
3.1. Simulation Test
3.2. Experimental Factors
3.3. Analysis of Fertilizer Discharge Performance
3.4. Test Indicators
3.5. Test Results and Analysis
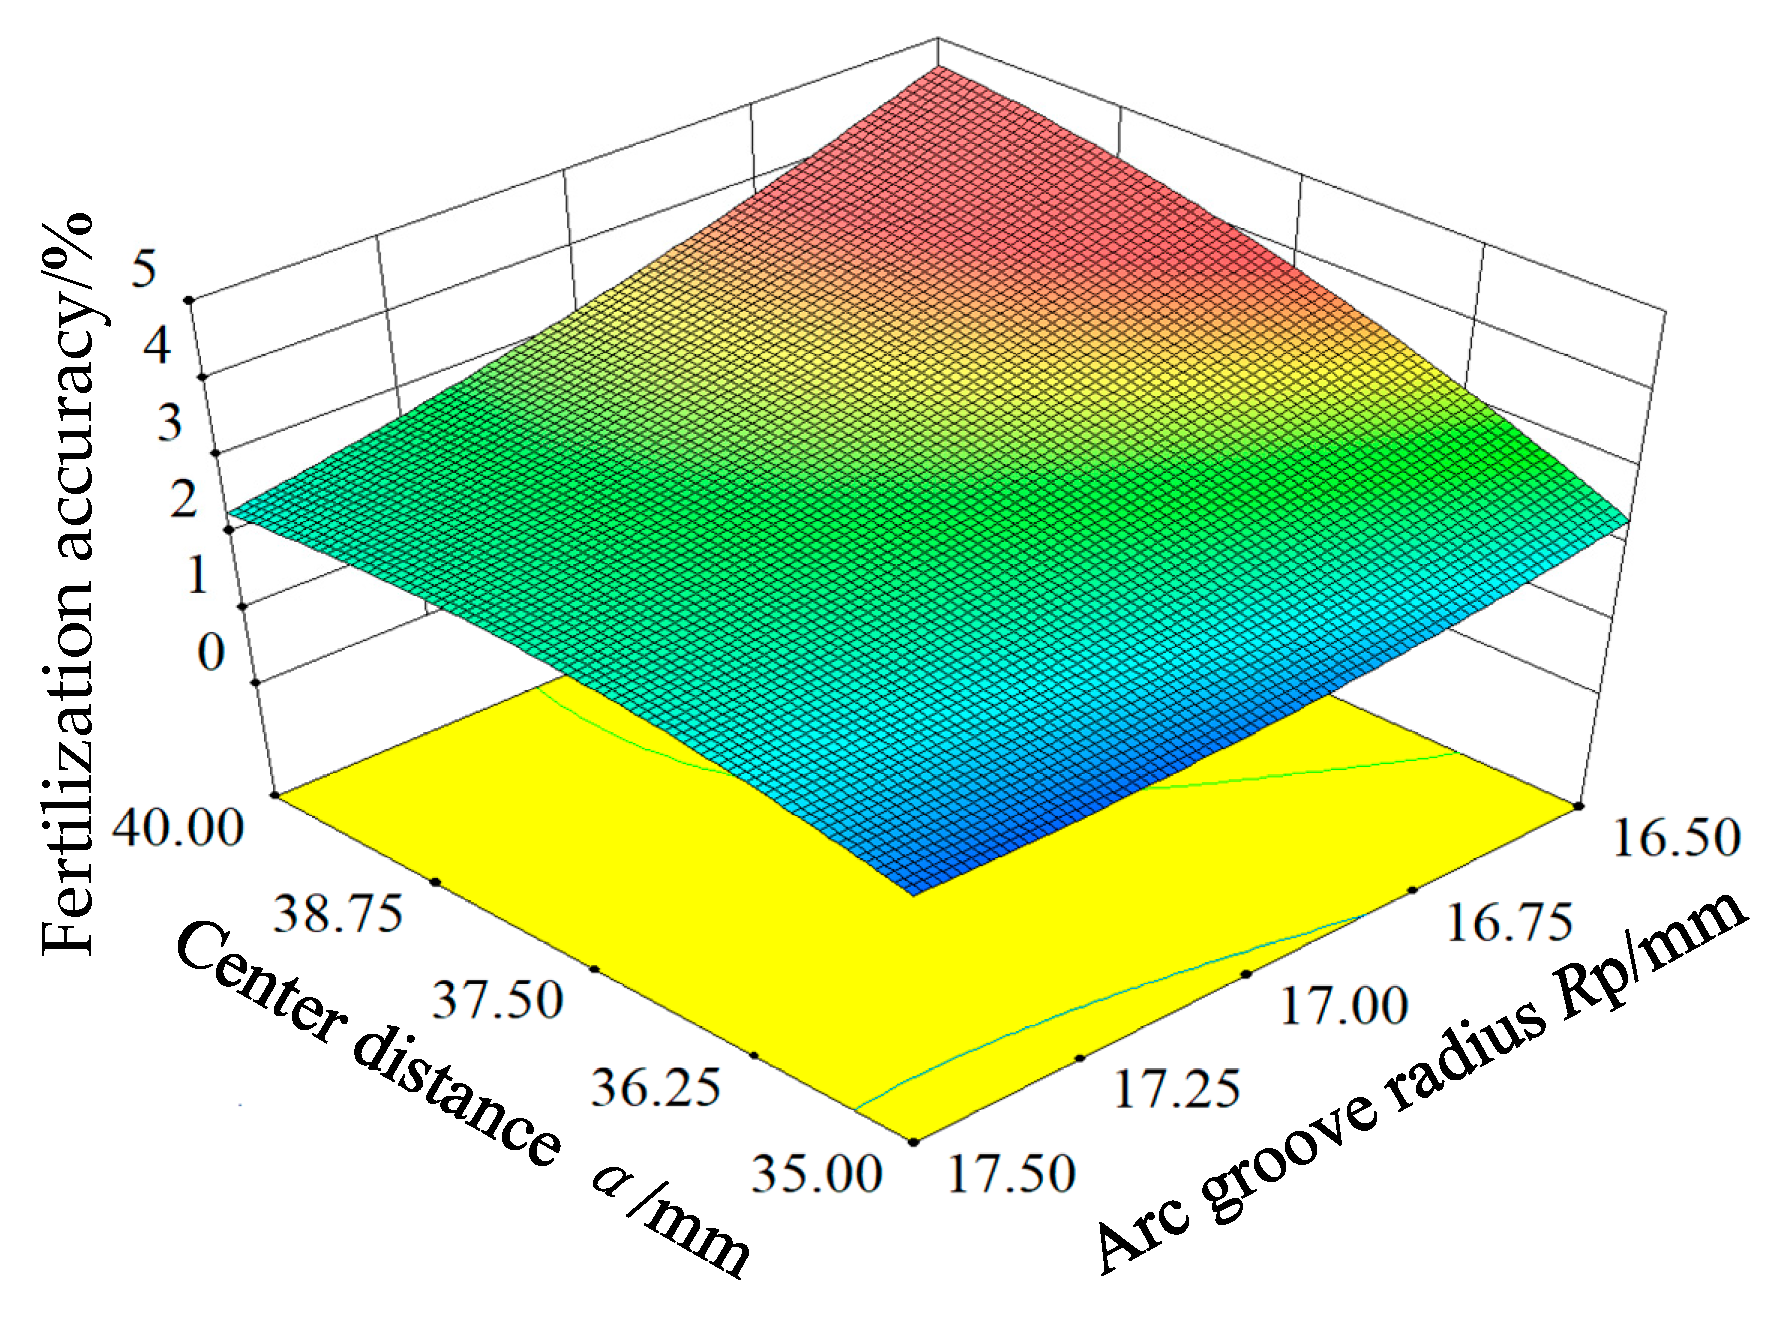
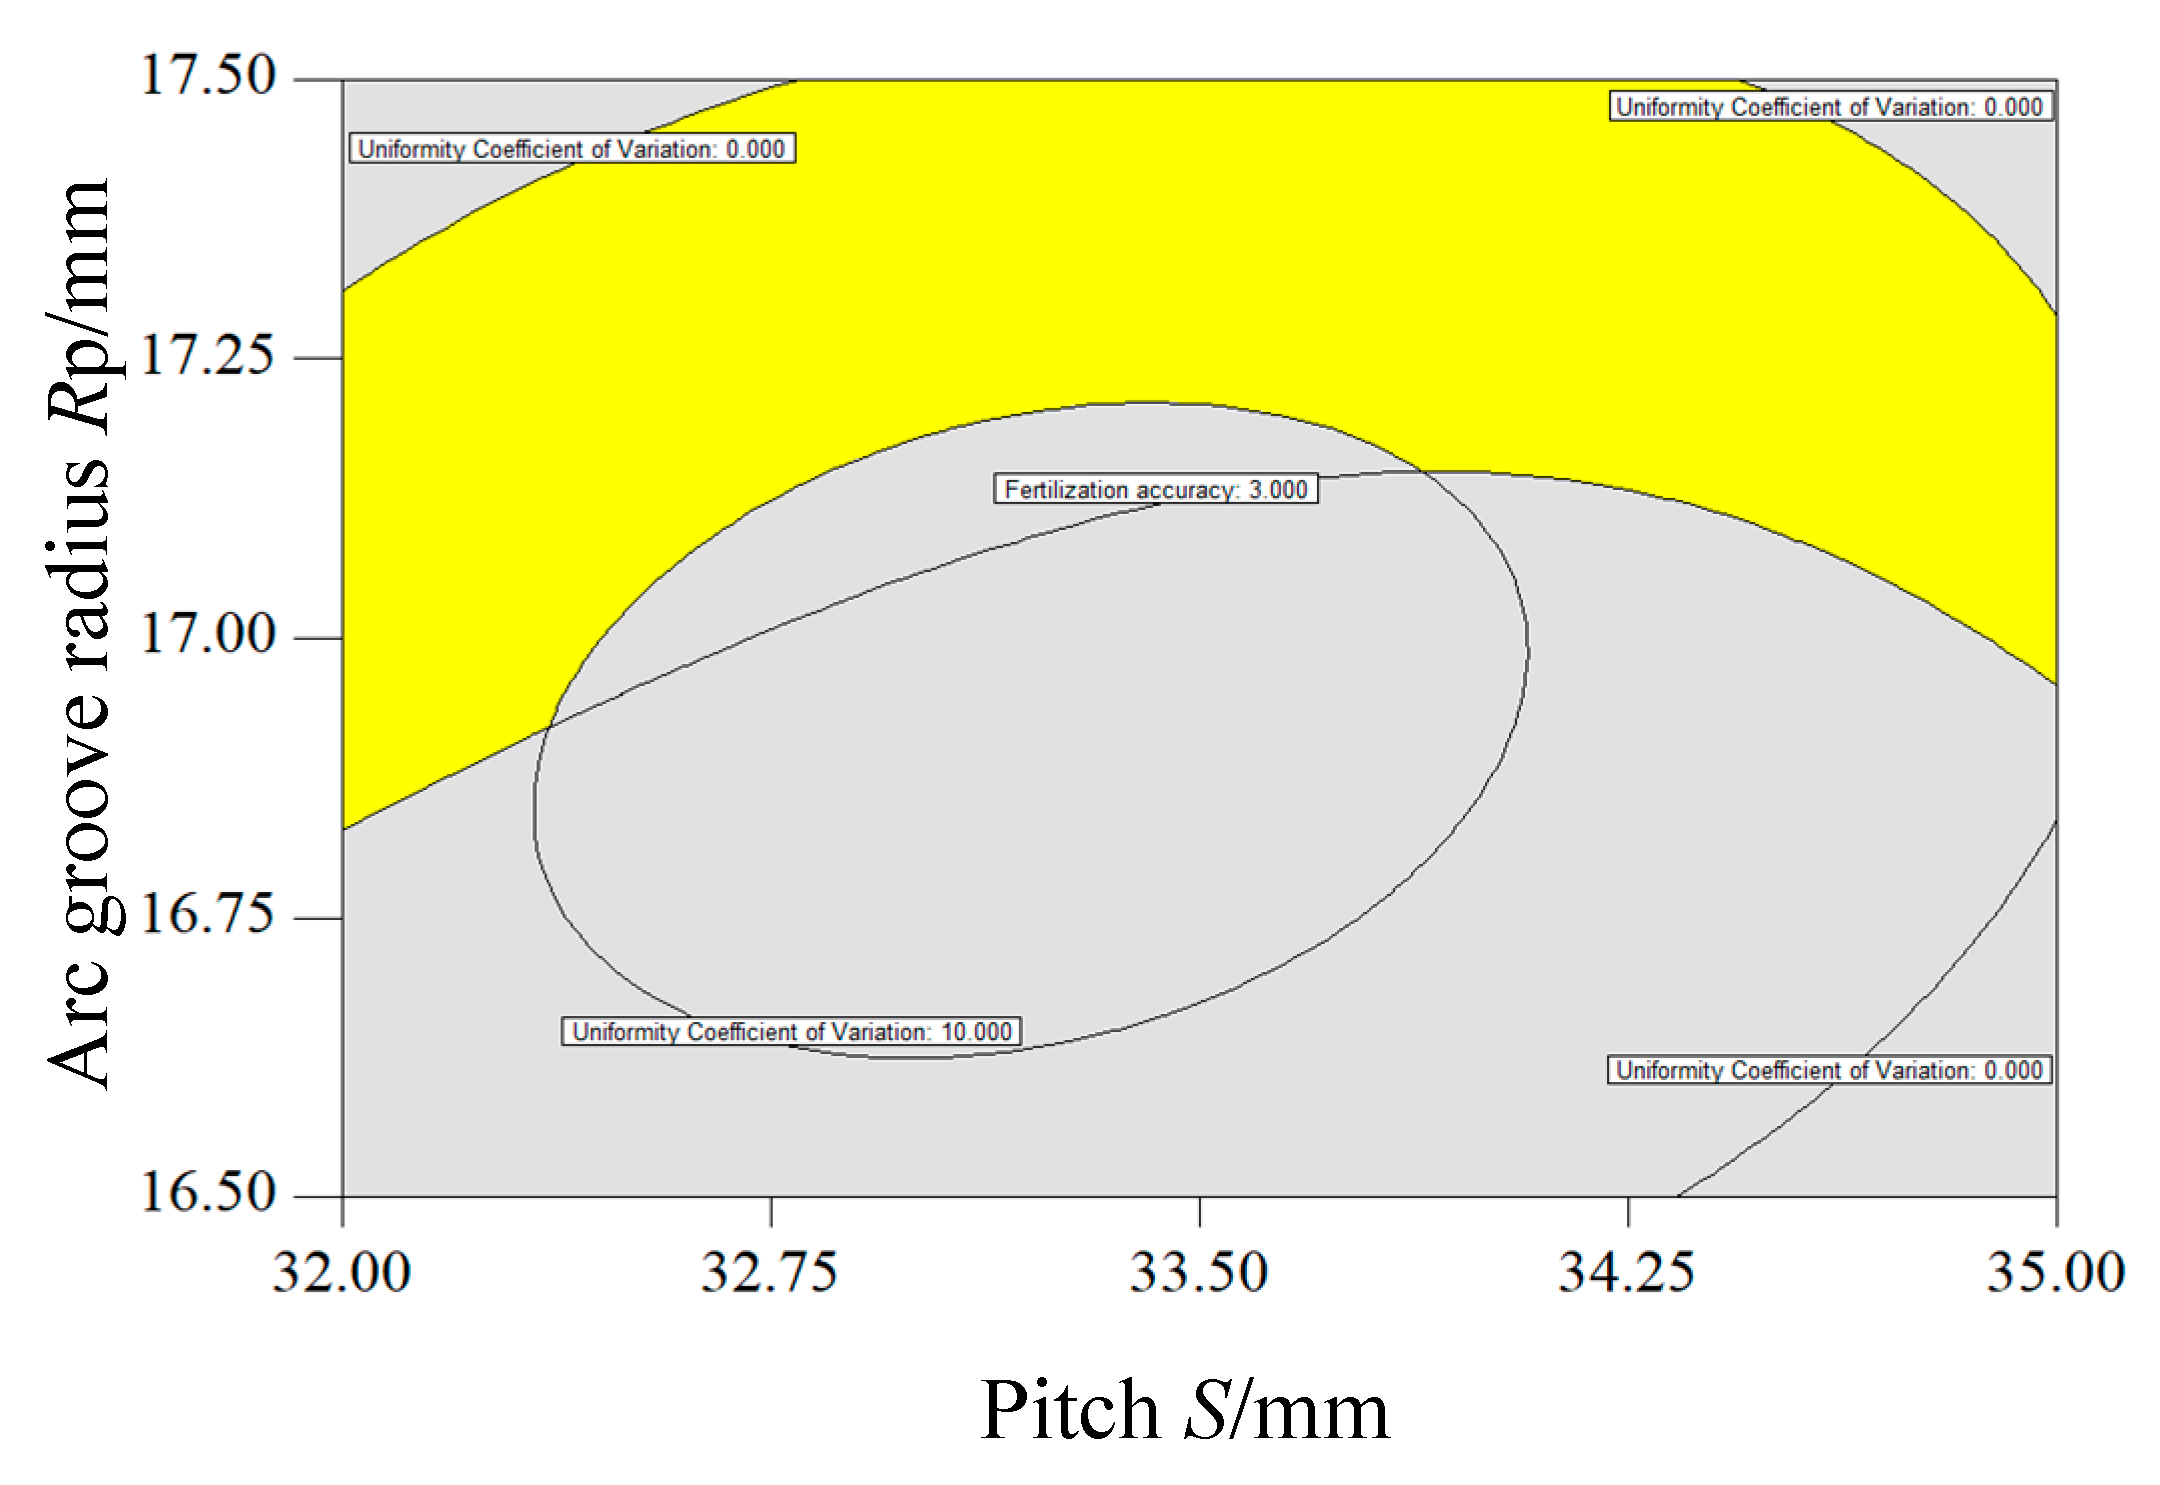
3.6. Influence of Test Factors on Test Indicators
3.7. Parameter Optimization
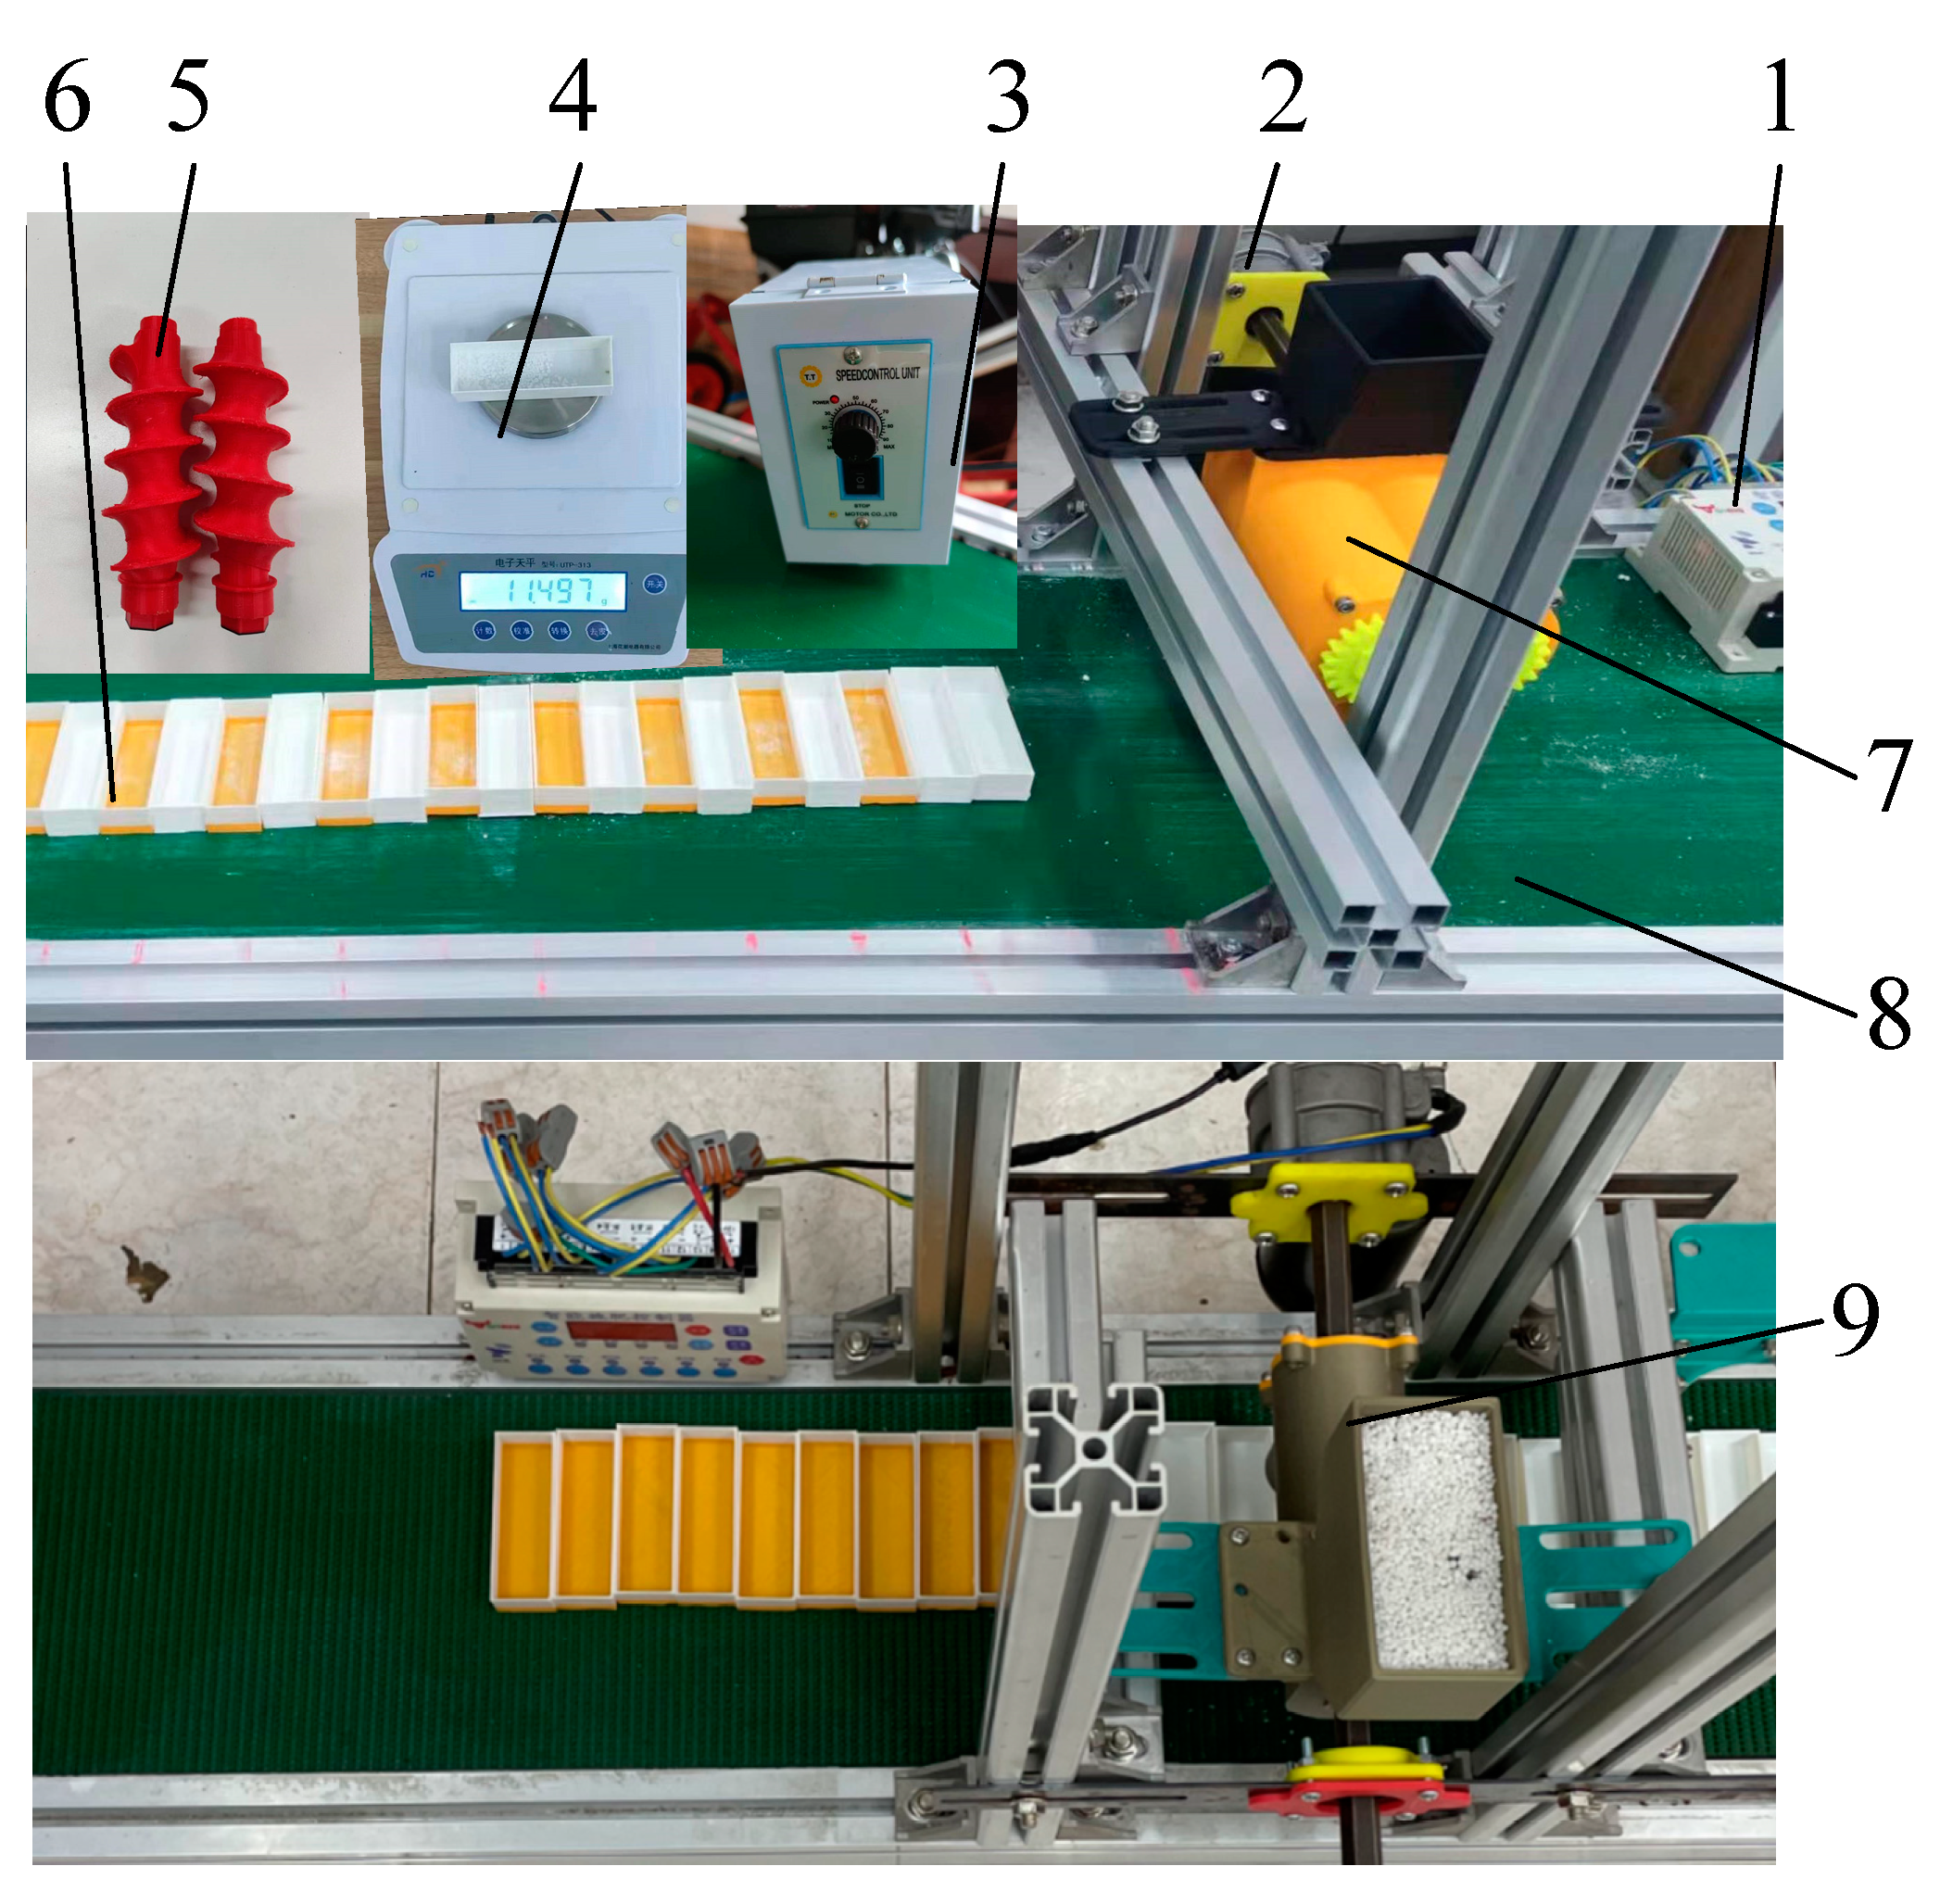
4. Bench Verification and Comparison Test
4.1. Bench Test
4.2. Test Results
5. Conclusions
- (1).
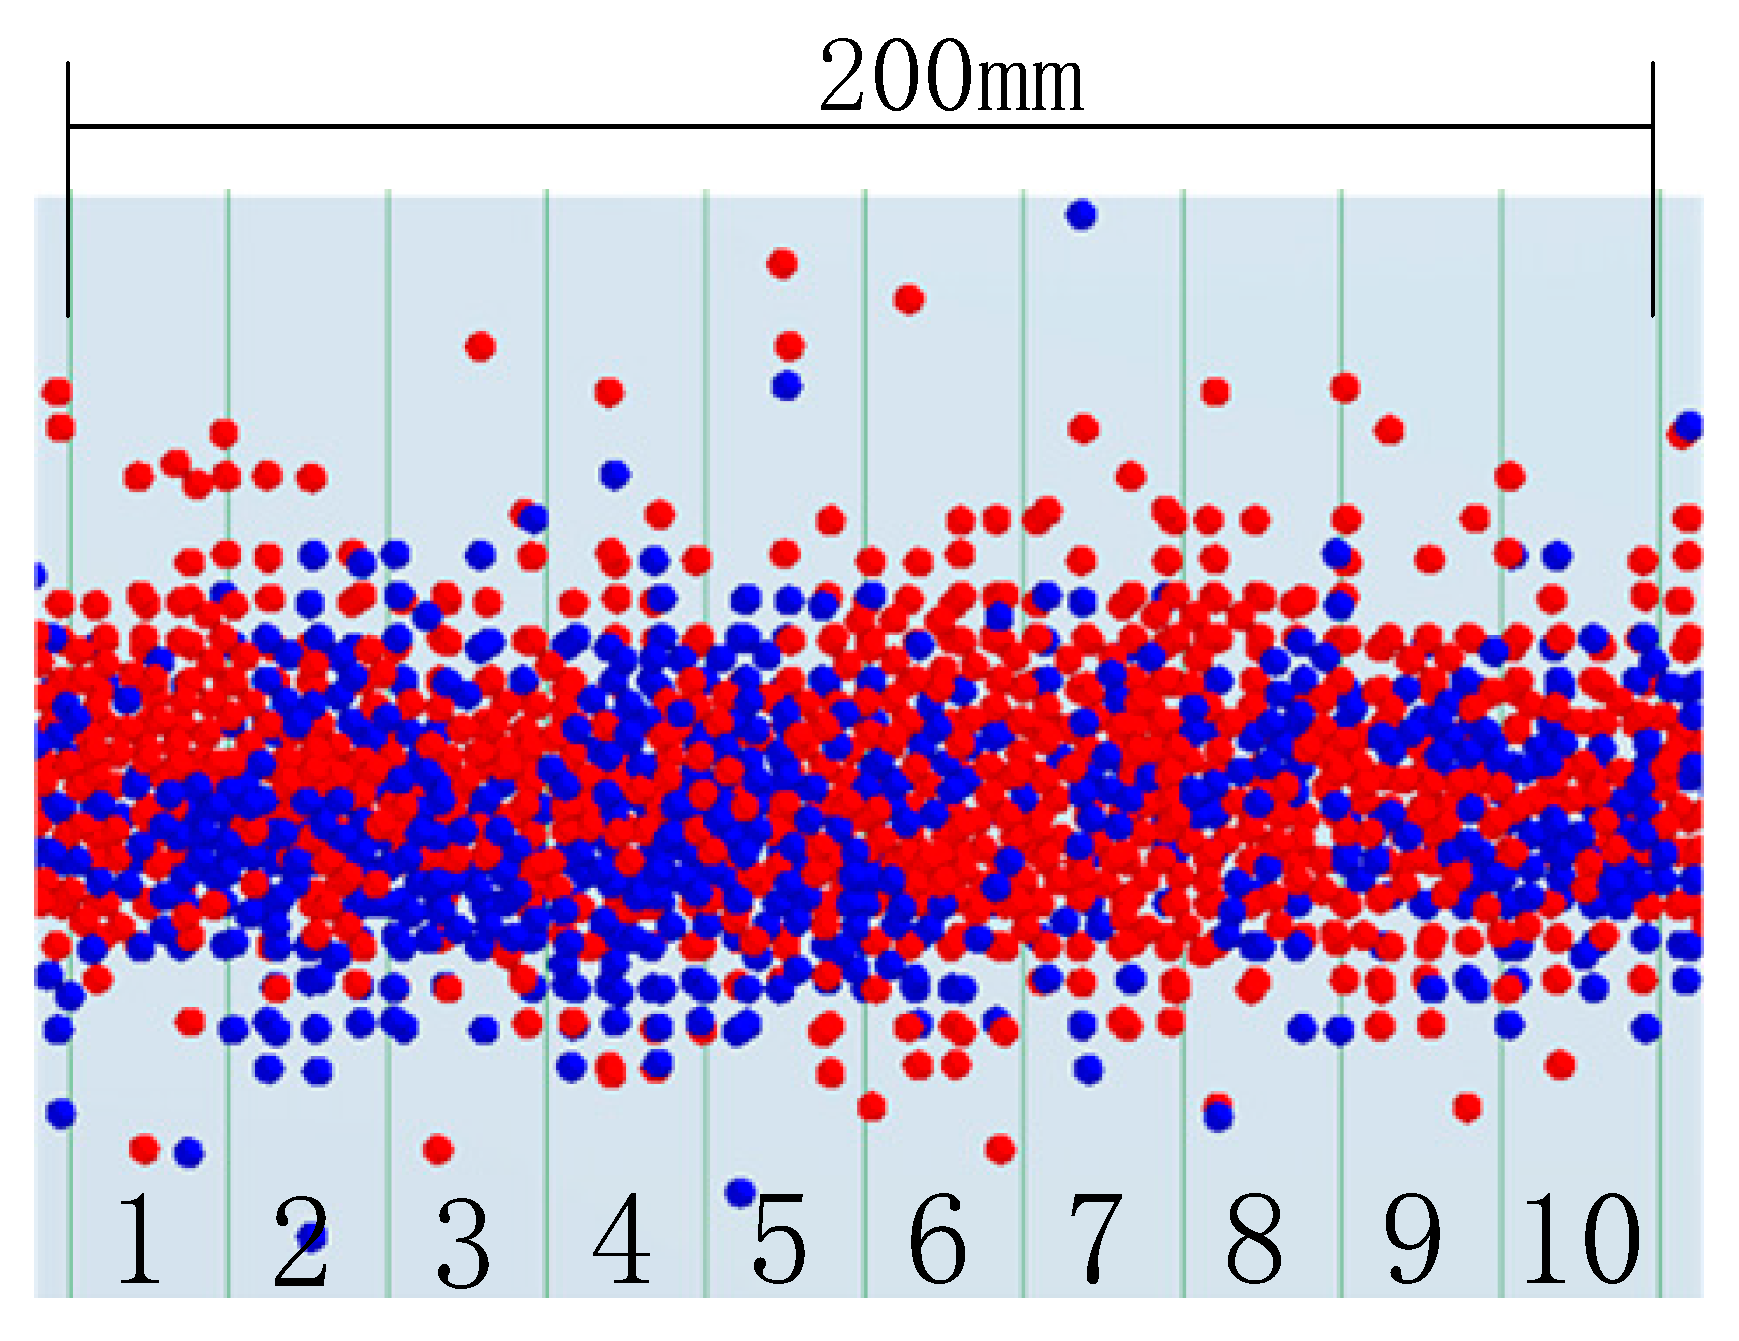
- Through the bench test of the single-screw fertilizer discharger, the uneven fertilizer discharge phenomenon of the single-screw fertilizer discharger was analyzed, and an improvement plan for the double arc groove screw fertilizer discharger was put forward. The instantaneous fertilizer discharge characteristics of the fertilizer discharger were theoretically analyzed, and the factors affecting the fertilizer discharge uniformity of the double arc groove screw fertilizer discharger were obtained, respectively, as the pitch S, the center distance a and the arc groove radius Rp.
- (2).
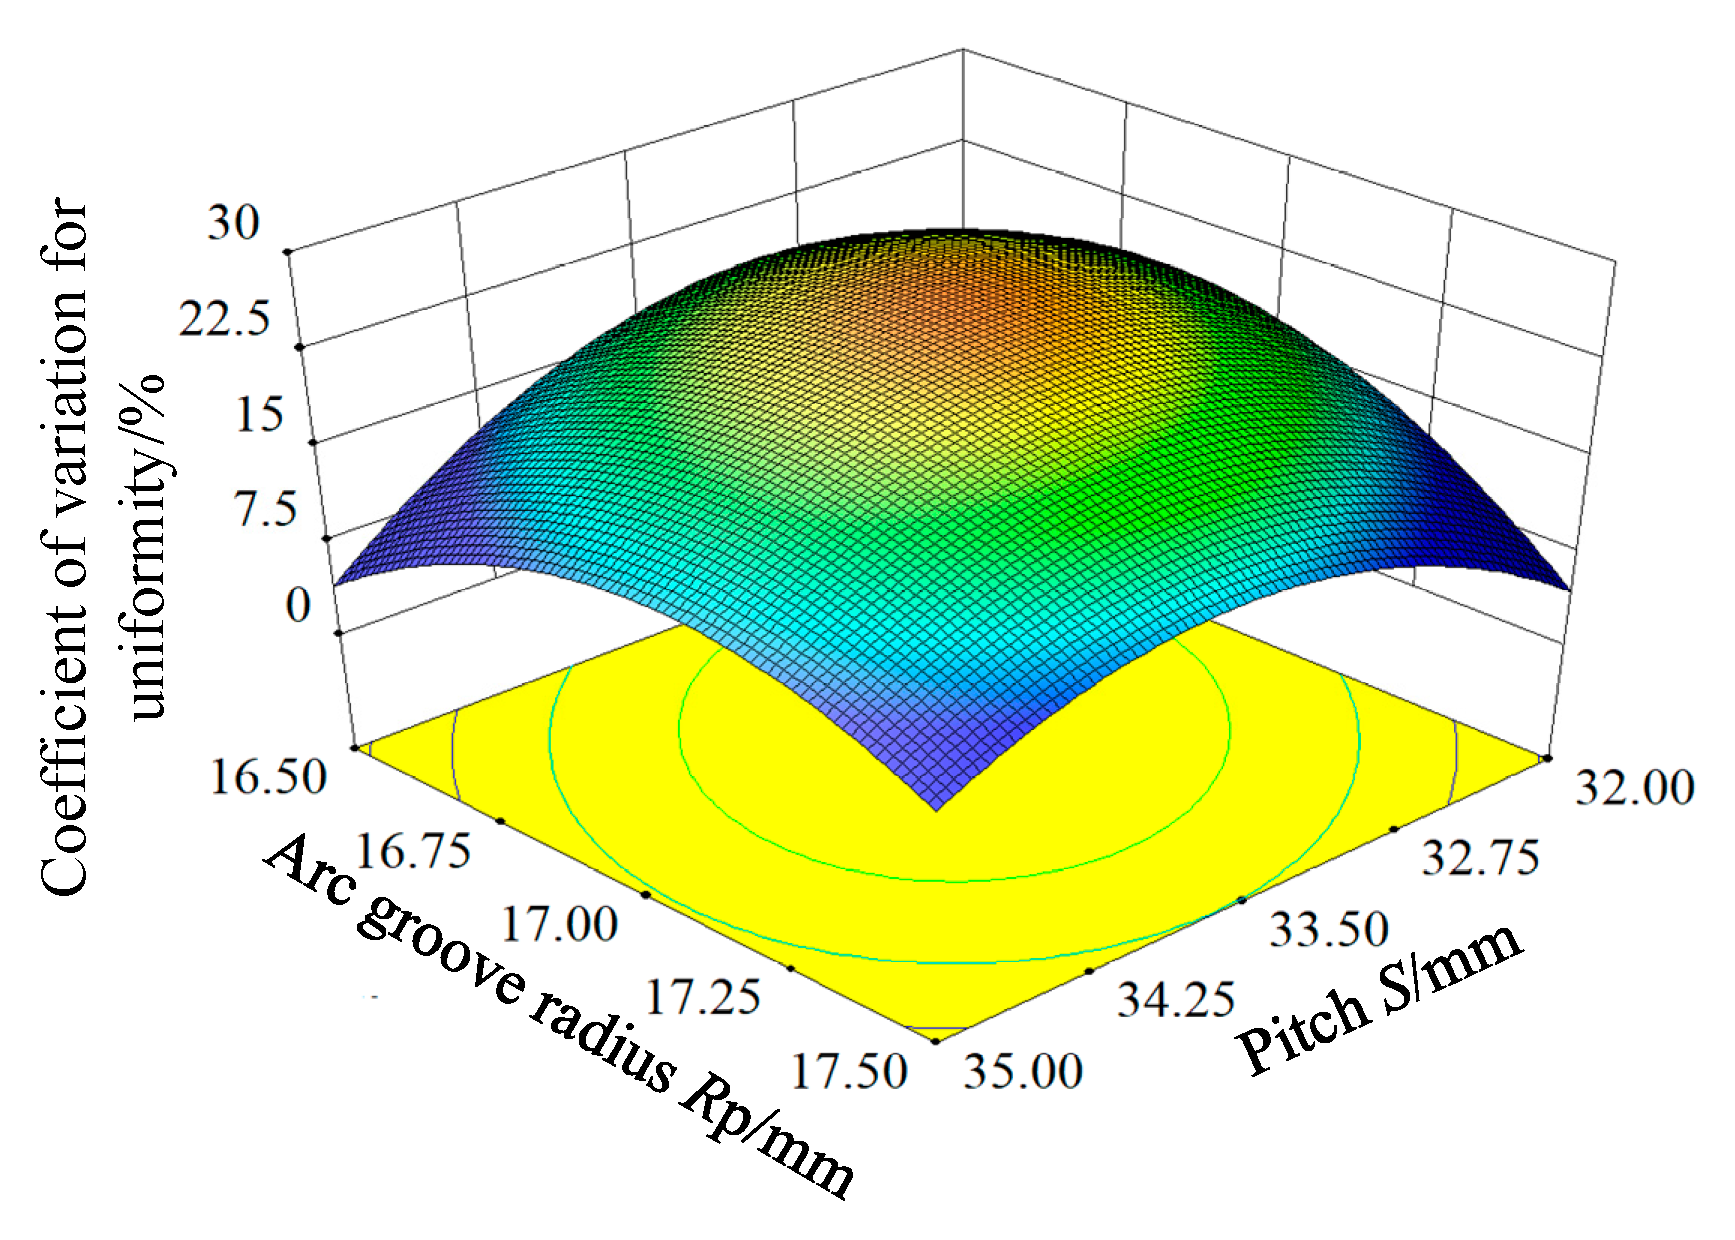
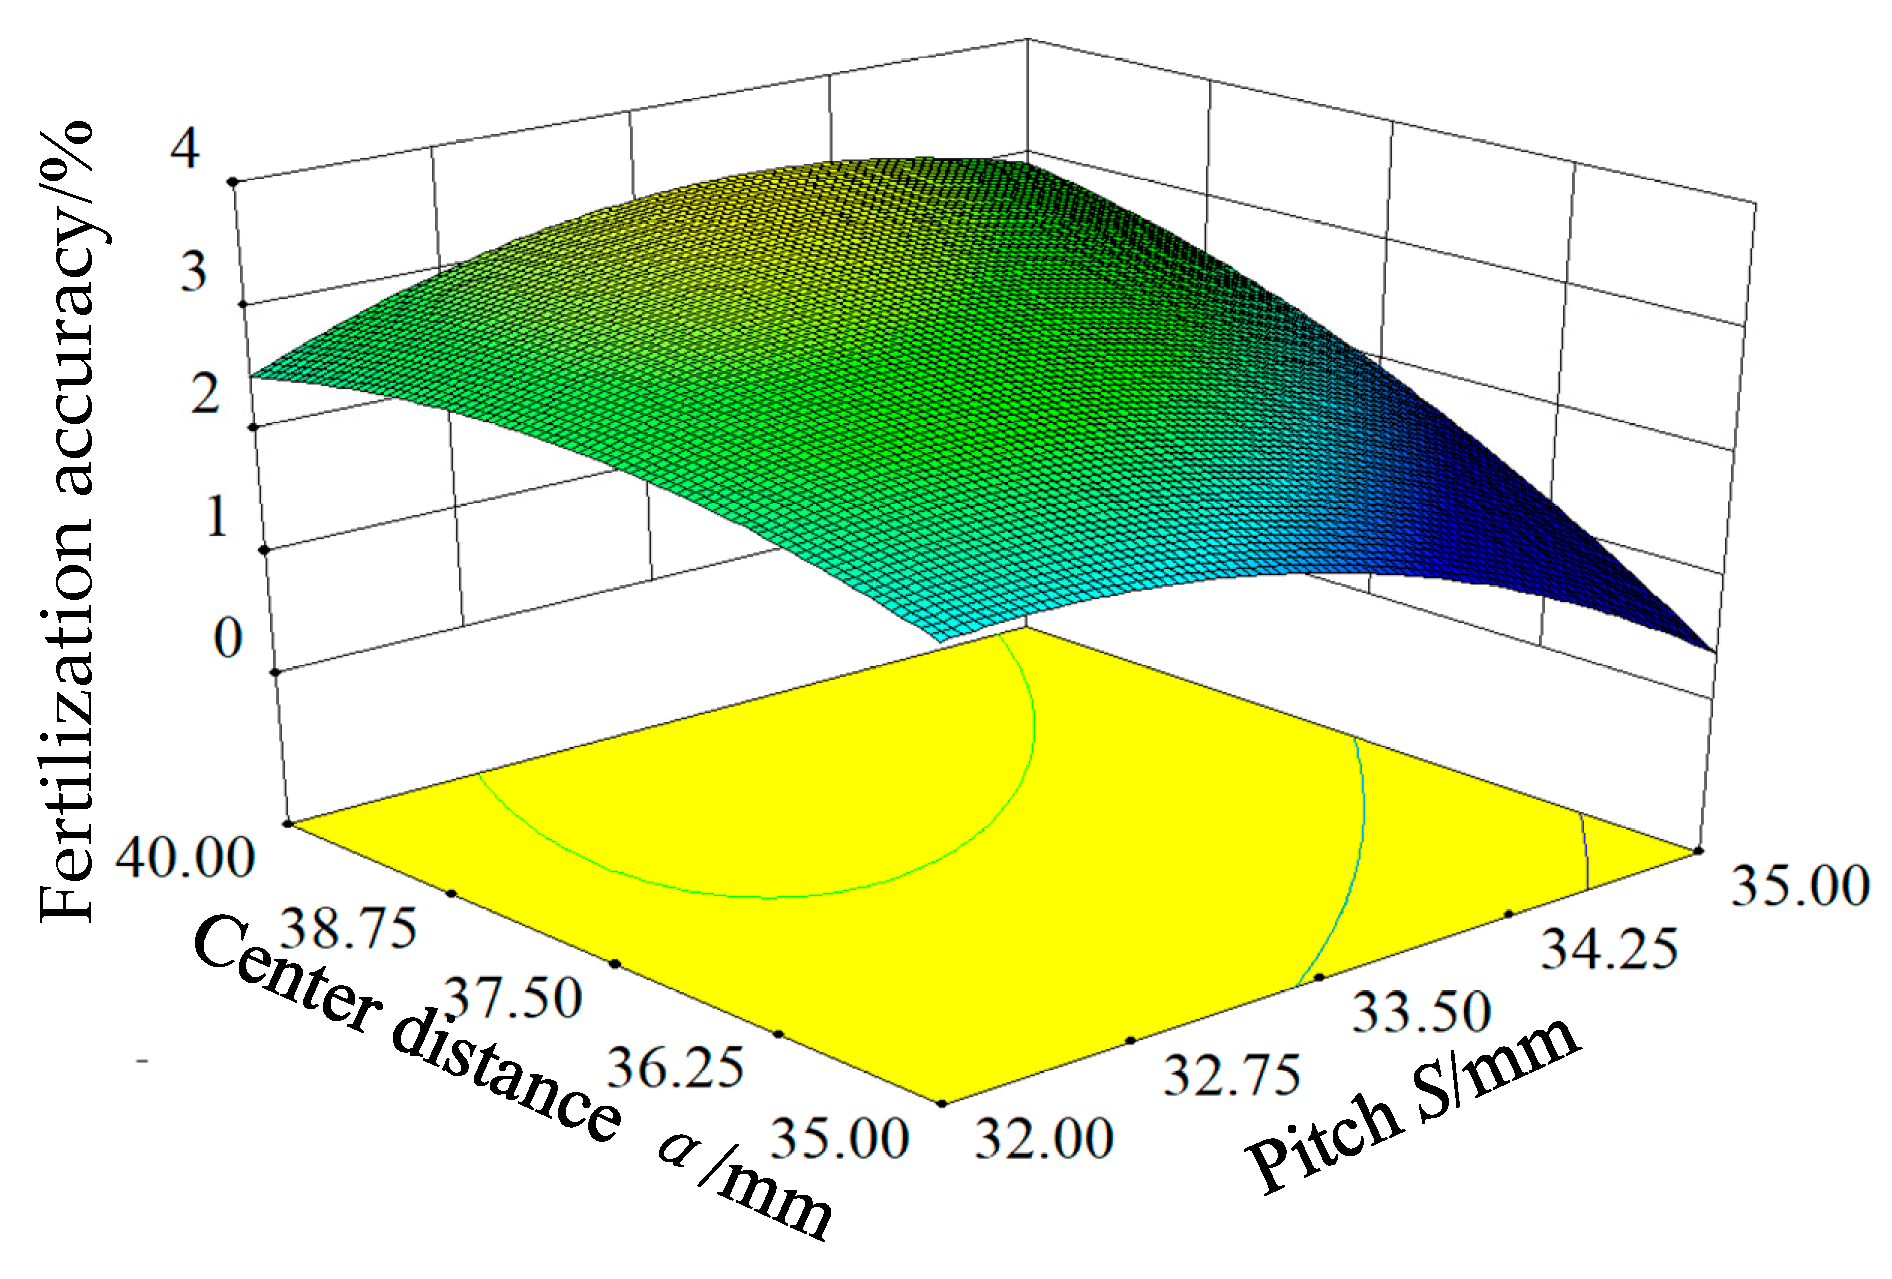
- Taking the pitch S, the center distance a and the arc groove radius Rp as the test factors, and the uniformity coefficient of variation as the test index, the three factors and five levels of quadratic universal rotation combination design test were carried out. According to the established uniformity coefficient of variation, fertilization accuracy regression model and the use of Design-expert8.0.6 software to obtain the relationship between the influence of test factors on test indicators, the effect of the screw pitch and arc groove radius on the uniformity coefficient of variation is extremely significant (p < 0.01). The effect of center distance on the uniformity variation coefficient was significant (0.01 < p < 0.05). The effect of screw pitch, center distance and arc groove radius on the fertilization accuracy was extremely significant (p < 0.01), and in the center distance 40 mm, y1 ≤ 10%, y2 ≤ 3%. On the basis of the minimum manufacturing cost, the optimal parameters of the fertilizer discharger were optimized as a pitch S of 35 mm and an arc groove radius Rp of 17 mm.
- (3).
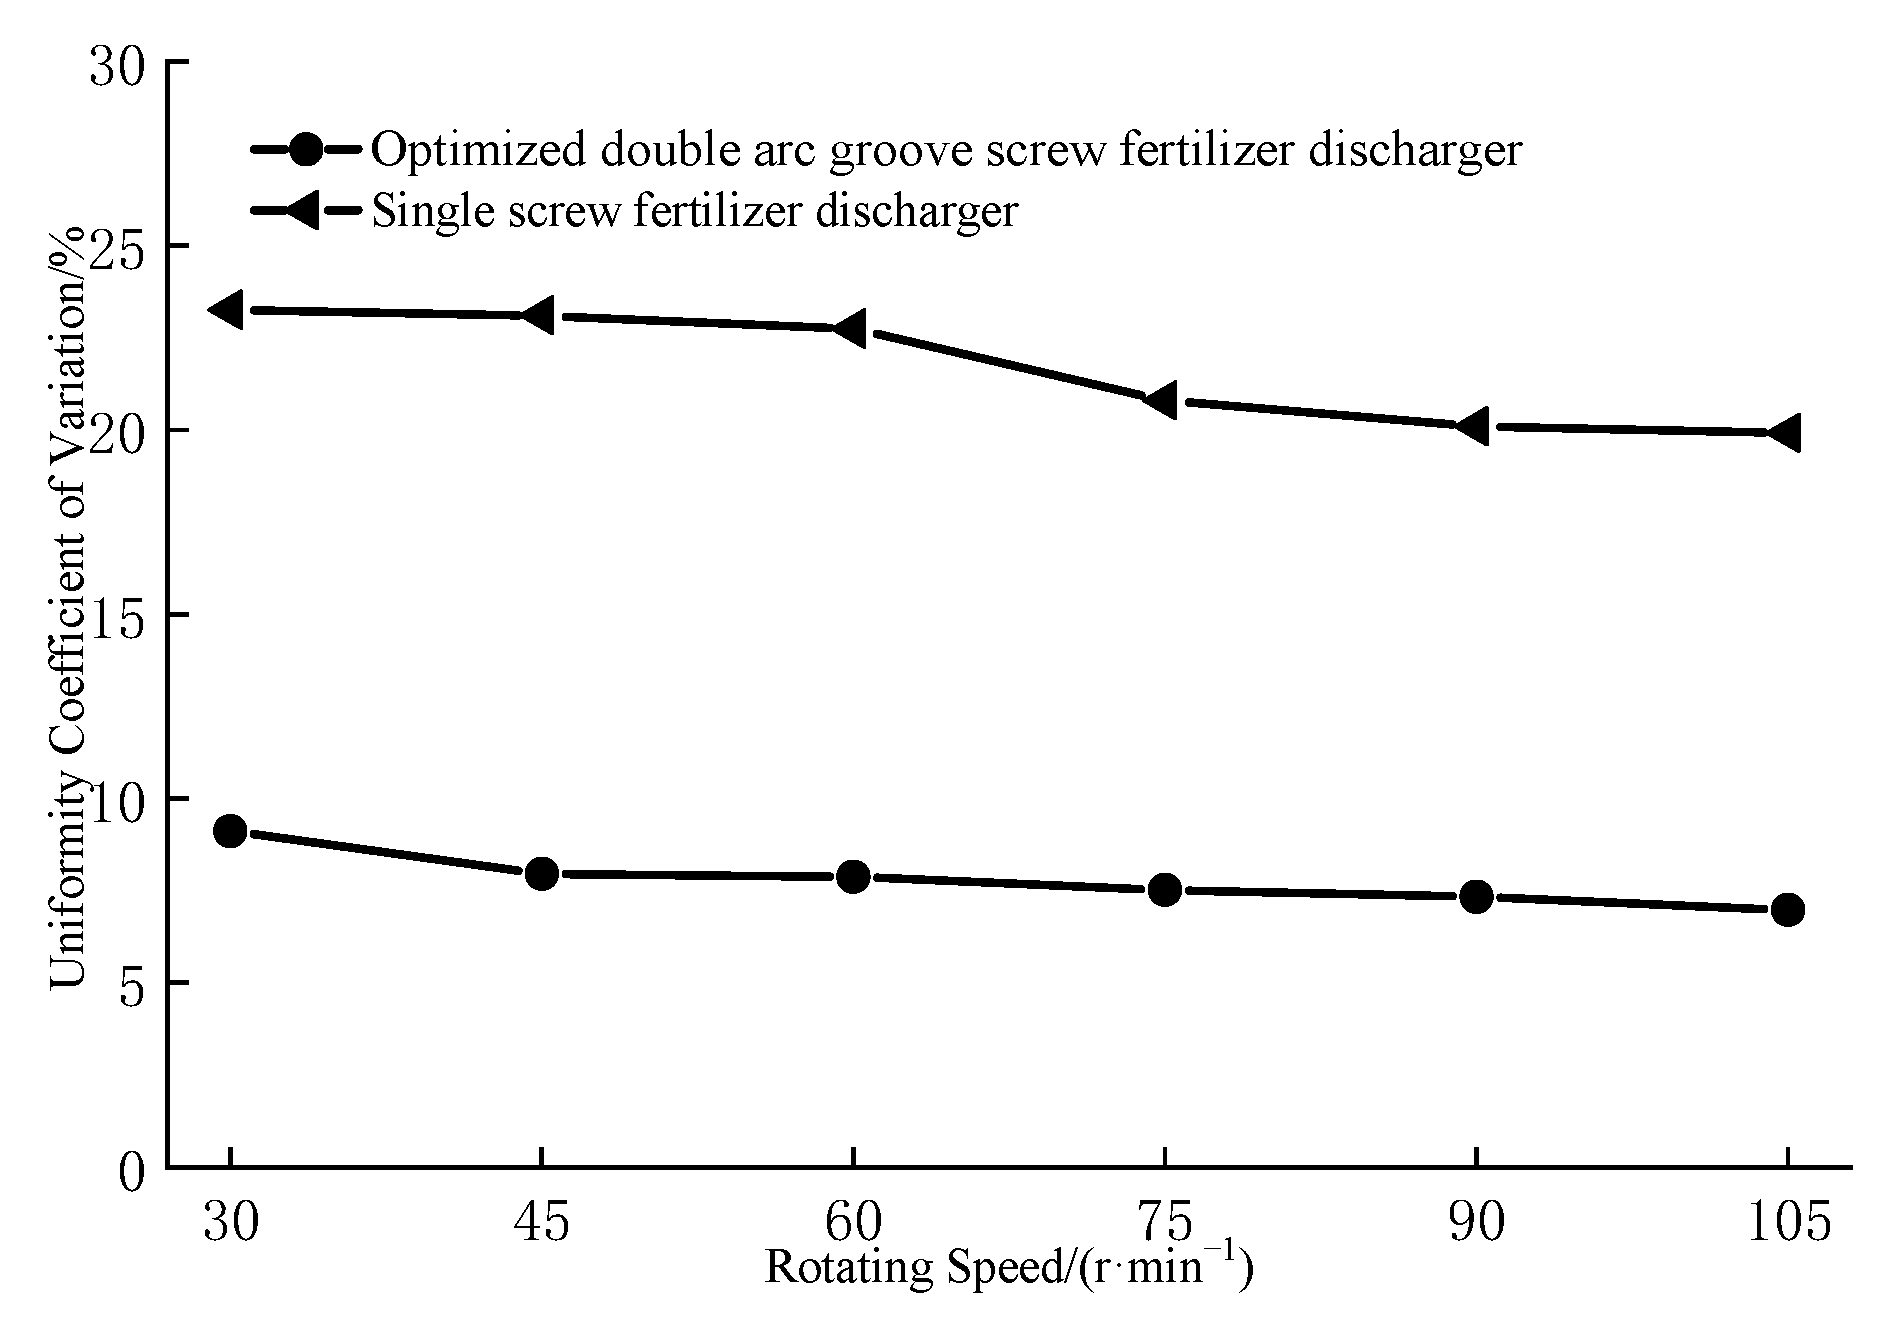
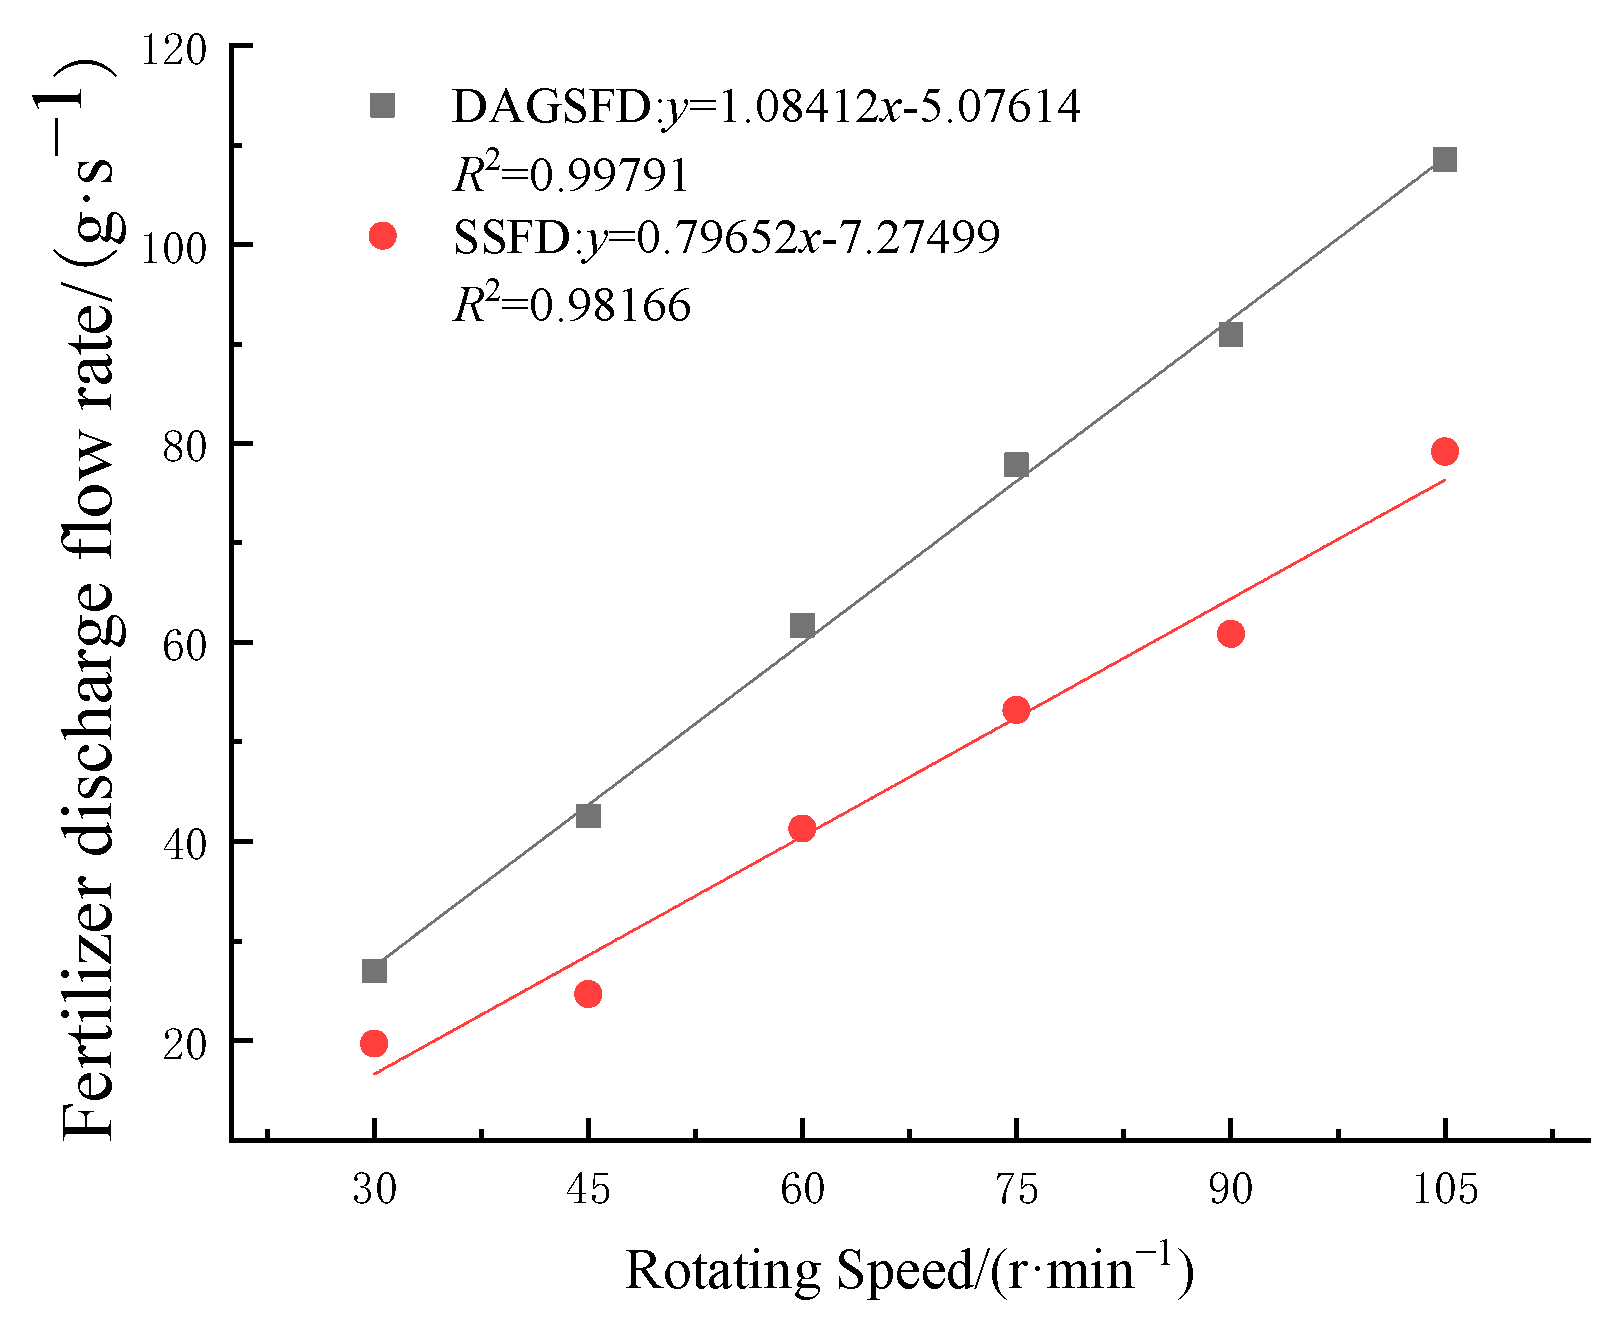
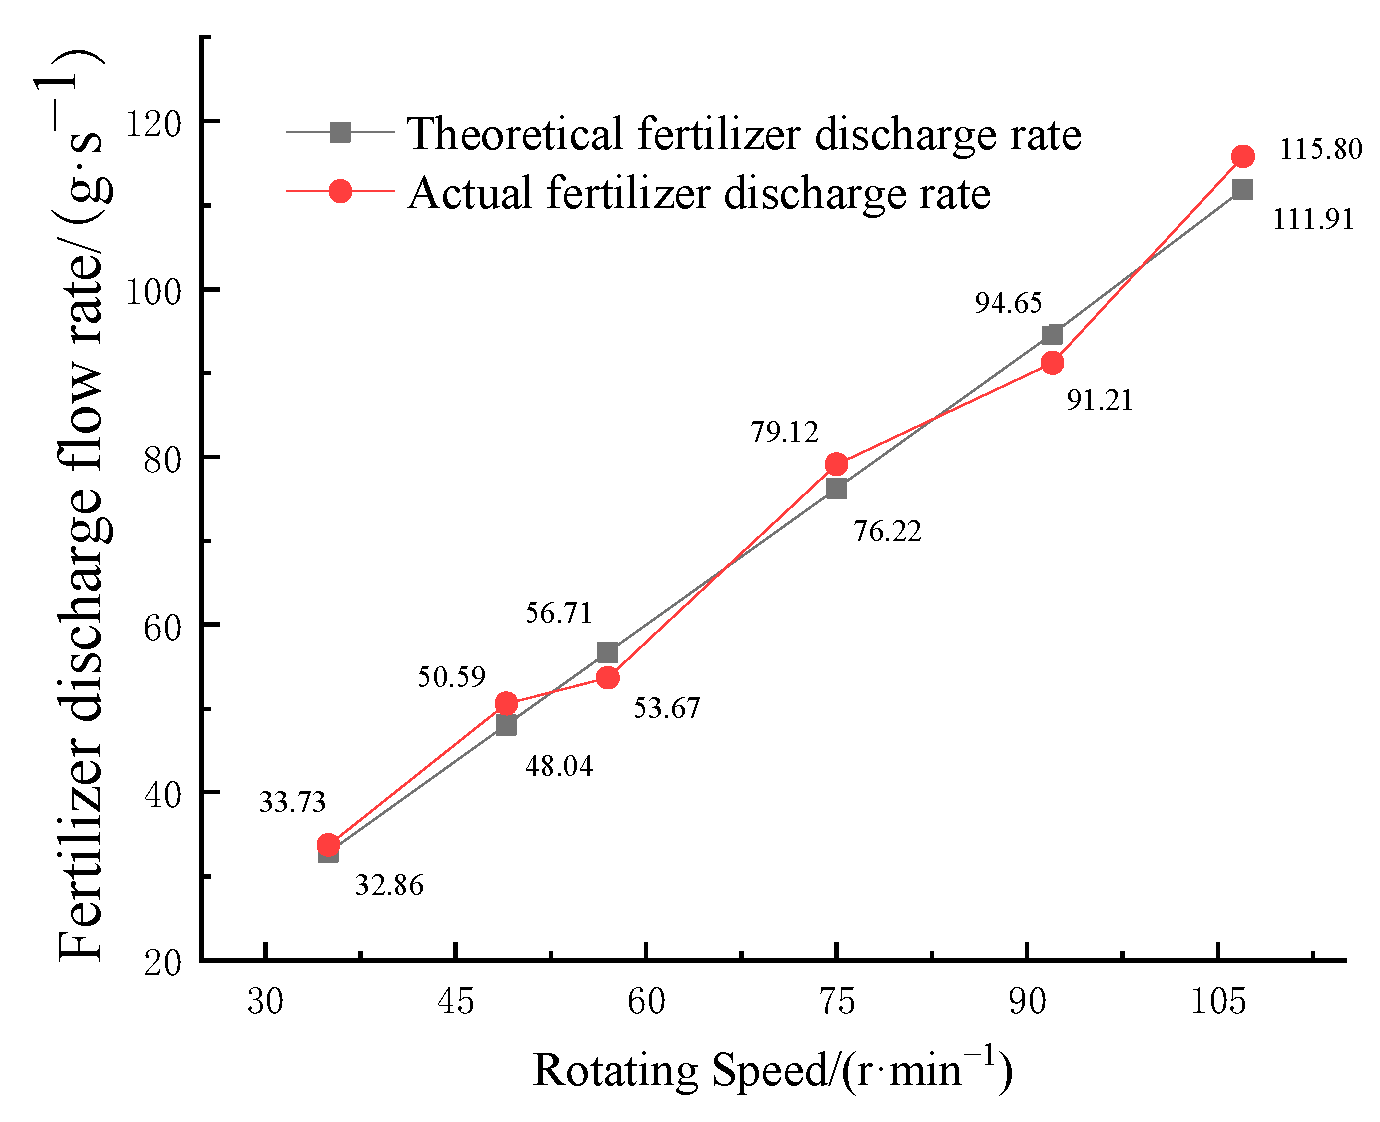
- In order to verify the accuracy of the optimized analysis results, a bench verification test was carried out with Stanley compound fertilizer as the test material. The test results show that the coefficient of variation of uniformity, fertilization accuracy of bench test and the relative error of simulation test are 5.60% and 5.52%, respectively. The optimized fertilization accuracy of the double arc groove screw fertilizer discharger is 3.44%, and the fertilization accuracy is high. The coefficient of variation of the uniformity of the double arc groove screw fertilizer discharger is 14.50% lower than that of the single-screw fertilizer discharger. Moreover, the fitting equation of the fertilizer discharge flow rate of the double arc groove screw fertilizer discharger is significantly better than that of the single-screw fertilizer discharger. Therefore, an electric control fertilizer discharge system was designed based on the optimal parameter fertilizer discharge flow rate fitting equation. The bench test results show that the electric control system can accurately adjust the double arc groove screw fertilizer discharger fertilizer discharge flow rate by adjusting the rotational speed. The double arc groove screw fertilizer discharger controlled by an electronic control fertilizer discharge system has good uniformity in fertilizer discharge and a controllable fertilizer discharge flow, which effectively solves the problem of the uniformity of the fertilizer discharged by the single-screw fertilizer discharger.
Author Contributions
Funding
Institutional Review Board Statement
Data Availability Statement
Conflicts of Interest
References
- Gao, J.J.; Peng, C.; Shi, Q.H. Study on the High Chemical Fertilizers Consumption and Fertilization Behavior of Small Rural Househo in China: Discovery from 1995~2016 National Fixed Point Survey Data. Manag. World 2019, 35, 120–132. [Google Scholar]
- Zhang, W.L.; Wu, S.X.; Ji, H.J.; Kolbe, H. Estimation of Agricultural Non-Point Source Pollution in China and the Alleviating Strategies III. A Review of Policies and Practices for Agricultural Non-Point Source Pollution Control in China. Scientia Agric. Sin. 2004, 2004, 1026–1033. [Google Scholar]
- Ma, C.B. Development trend and Prospect of agricultural fertilizer application in China. China Agric. Technol. Ext. 2016, 32, 6–10. [Google Scholar]
- Luo, X.; Liao, J.; Zang, Y.; Zhou, Z. Improving agricultural mechanization level to promote agricultural sustainable development. Trans. Chin. Soc. Agric. Eng. 2016, 32, 1–11. [Google Scholar]
- Lan, Z.L.; Muhammad, N.K.; Tanveer, A.S. Effects of 25-year located different fertilization measures on soil hydraulic properties of lou soil in Guanzhong area. Trans. Chin. Soc. Agric. Eng. 2018, 34, 100–106. [Google Scholar]
- Shi, Y.Y.; Chen, M.; Wang, X.C.; Mo, O.; Zhang, Y.; Ding, W. Analysis and experiment of fertilizing performance for precision fertilizer applicator in rice and wheat fields. Trans. Chin. Soc. Agric. Mach. 2017, 48, 97–103. [Google Scholar]
- Anton, F.; Hubert, Z.; Georg, B. Mass flowmeter for screw conveyors based on capactitive secsing. In Proceedings of the 2007 IEEE Instrumentation & Measurement Technology Conference IMTC 2007, Warsaw, Poland, 1–3 May 2007; 2007. [Google Scholar]
- Luo, S.; Zhang, X.; Xu, J.; Ma, K. Structural Optimization and Performance Simulation of Spiral Discontinuous Feeding Device. Trans. Chin. Soc. Agric. Eng. 2013, 29, 250–257. [Google Scholar]
- Minglani, D.; Sharma, A.; Pandey, H.; Dayal, R.; Joshi, J.B.; Subramaniam, S. A review of granular flow in screw feeders and conveyors. Powder Technol. 2020, 366, 369–381. [Google Scholar] [CrossRef]
- Van Liedekerke, P.; Tijskens, E.; Ramon, H. Discrete element simulations of the influence of fertilizer physical properties on the spread pattern from spinning disc spreaders. Biosyst. Eng. 2009, 102, 392–405. [Google Scholar] [CrossRef]
- Yu, S.H. Optimization Design of Performance Parameters of Vertical Screw Conveyor. Mach. Design Manuf. 2015, 11, 215–218. [Google Scholar]
- Xue, Z.; Zhao, L.; Wang, F.H.; Wang, S.; Wang, G.; Pan, R. Performance simulation test of the spiral fertilizer distributor based on discrete element method. J. Hunan Agric. Univ. 2019, 45, 548–553. [Google Scholar]
- Kretz, D.; Callau-Monje, S.; Hitschler, M.; Hien, A.; Raedle, M.; Hesser, J. Discrete element method (DEM) simulation and validation of ascrew feeder system. Powder Technol. 2015, 287, 131–138. [Google Scholar] [CrossRef]
- Li, X.X.; Zhao, J.; Ren, Z.Y.; Chen, C.; Wang, Y.; He, P.Y. The design of small vertical screw precision sliver. Trans. Chin. Soc. Agric. Eng. 2018, 40, 75–79. [Google Scholar]
- Yang, Z.; Zhu, Q.C.; Sun, J.F.; Chen, Z.C.; Zhang, Z.W. Study on the performance of fluted roller fertilizer distributor based on EDEM and 3D printing. J. Agric. Mech. Res. 2018, 40, 175–180. [Google Scholar]
- Song, H. Optimization Design and Simulation of Quantitative Screw Conveyor. Master’s Thesis, Qingdao University of Science and Technology, Qingdao, China, 2016. [Google Scholar]
- GB/T35487-2017; General Administration of Quality Supervision, Inspection and Quarantine of the People’s Republic of China. Variable Fertilization Planter Control System; China Standard Press: Beijing, China, 2017.
- Chen, X.F.; Luo, X.W.; Wang, Z.M.; Zhang, M.; Hu, L.; Yang, W.; Zeng, S.; Zang, Y.; Wei, H.; Zheng, L. Design and experiment of fertilizer distribution apparatus with double-level screws. Trans. Chin. Soc. Agric. Eng. 2015, 31, 10–16. [Google Scholar]
- Hu, K.Y.; Dai, L.L.; Pi, Y.A. Theories and Calculation of the Auger-Type Conveyer. J. Nanchang Univ. Eng. Technol. 2000, 22, 29–33. [Google Scholar]
- Lü, J.Q.; Wang, Z.M.; Sun, X.S.; Li, Z.H.; Guo, Z.P. Design and experimental study of feed screw potato planter propulsion. J. Agric. Mech. Res. 2015, 6, 194–196. [Google Scholar]
- Yu, Y.W.; HenrikSaxe, N. Experimental and DEM study of segregation of ternary size particles in a blast furnace top bunker model. Chem. Eng. Sci. 2010, 65, 5237–5250. [Google Scholar] [CrossRef]
- XU, H. Mechanical Engineer’s Manual; Machinery Industry Press: Beijing, China, 2000. [Google Scholar]
- Moysey, P.A.; Thompson, M.R. Modelling the Solids Inflow and Solids Conveying of Single-screw Extruders Using the Discrete Element Method. Powder Technol. 2005, 153, 95–107. [Google Scholar] [CrossRef]
- Ren, L.Q. Experiment Optimization Design and Analysis, 2nd ed.; Higher Education Press: Beijing, China, 2003. [Google Scholar]
- Pan, L.J. Experimental Design and Data Processing; Southeast University Press: Nanjing, China, 2008. [Google Scholar]
- Yang, W.W.; Fang, L.Y.; Luo, X.W.; Li, H.; Ye, Y.Q.; Liang, Z.H. Experimental study on the effect of the parameters of the spiral fertilizer feeder on the performance of the fertilizer. Trans. Chin. Soc. Agric. Eng. 2020, 36, 1–8. [Google Scholar]
- Sugirbay, A.; Zhao, J.; Nukeshev, S.; Chen, J. Determination of pin-roller parameters and evaluation of the uniformity of granular fertilizer application metering devices in precision farming. Comput. Electron. Agric. 2020, 179, 105835. [Google Scholar] [CrossRef]
- Zhang, D.H. Optimization of Screw Conveyor. Master’s Thesis, Dalian University of Technology, Dalian, China, 2006. [Google Scholar]


| Project | Attributes | Value |
|---|---|---|
| Fertilizer granules | Poisson’s ratio | 0.25 |
| Shear modulus Pa | 1.0 × 10⁷ | |
| Density kg·m−3 | 1861 | |
| Fertilizer discharge wheel, shell | Poisson’s ratio | 0.394 |
| Shear modulus Pa | 3.18 × 10⁸ | |
| Density kg·m−3 | 1240 | |
| Granules—Granules | Coefficient of restitution | 0.11 |
| Static friction coefficient | 0.3 | |
| Rolling friction coefficient | 0.1 | |
| Granules—Fertilizer discharge wheels, Housings | Coefficient of restitution | 0.41 |
| Static friction coefficient | 0.32 | |
| Rolling friction coefficient | 0.18 |
| Level | Pitch S/(mm) | Center Distance a/(mm) | Arc Groove Radius Rp/(mm) |
|---|---|---|---|
| 1.682 | 35.00 | 40.00 | 17.50 |
| 1 | 34.39 | 38.99 | 17.25 |
| 0 | 33.50 | 37.50 | 17.00 |
| −1 | 32.61 | 36.01 | 16.70 |
| −1.682 | 32.00 | 35.00 | 16.50 |
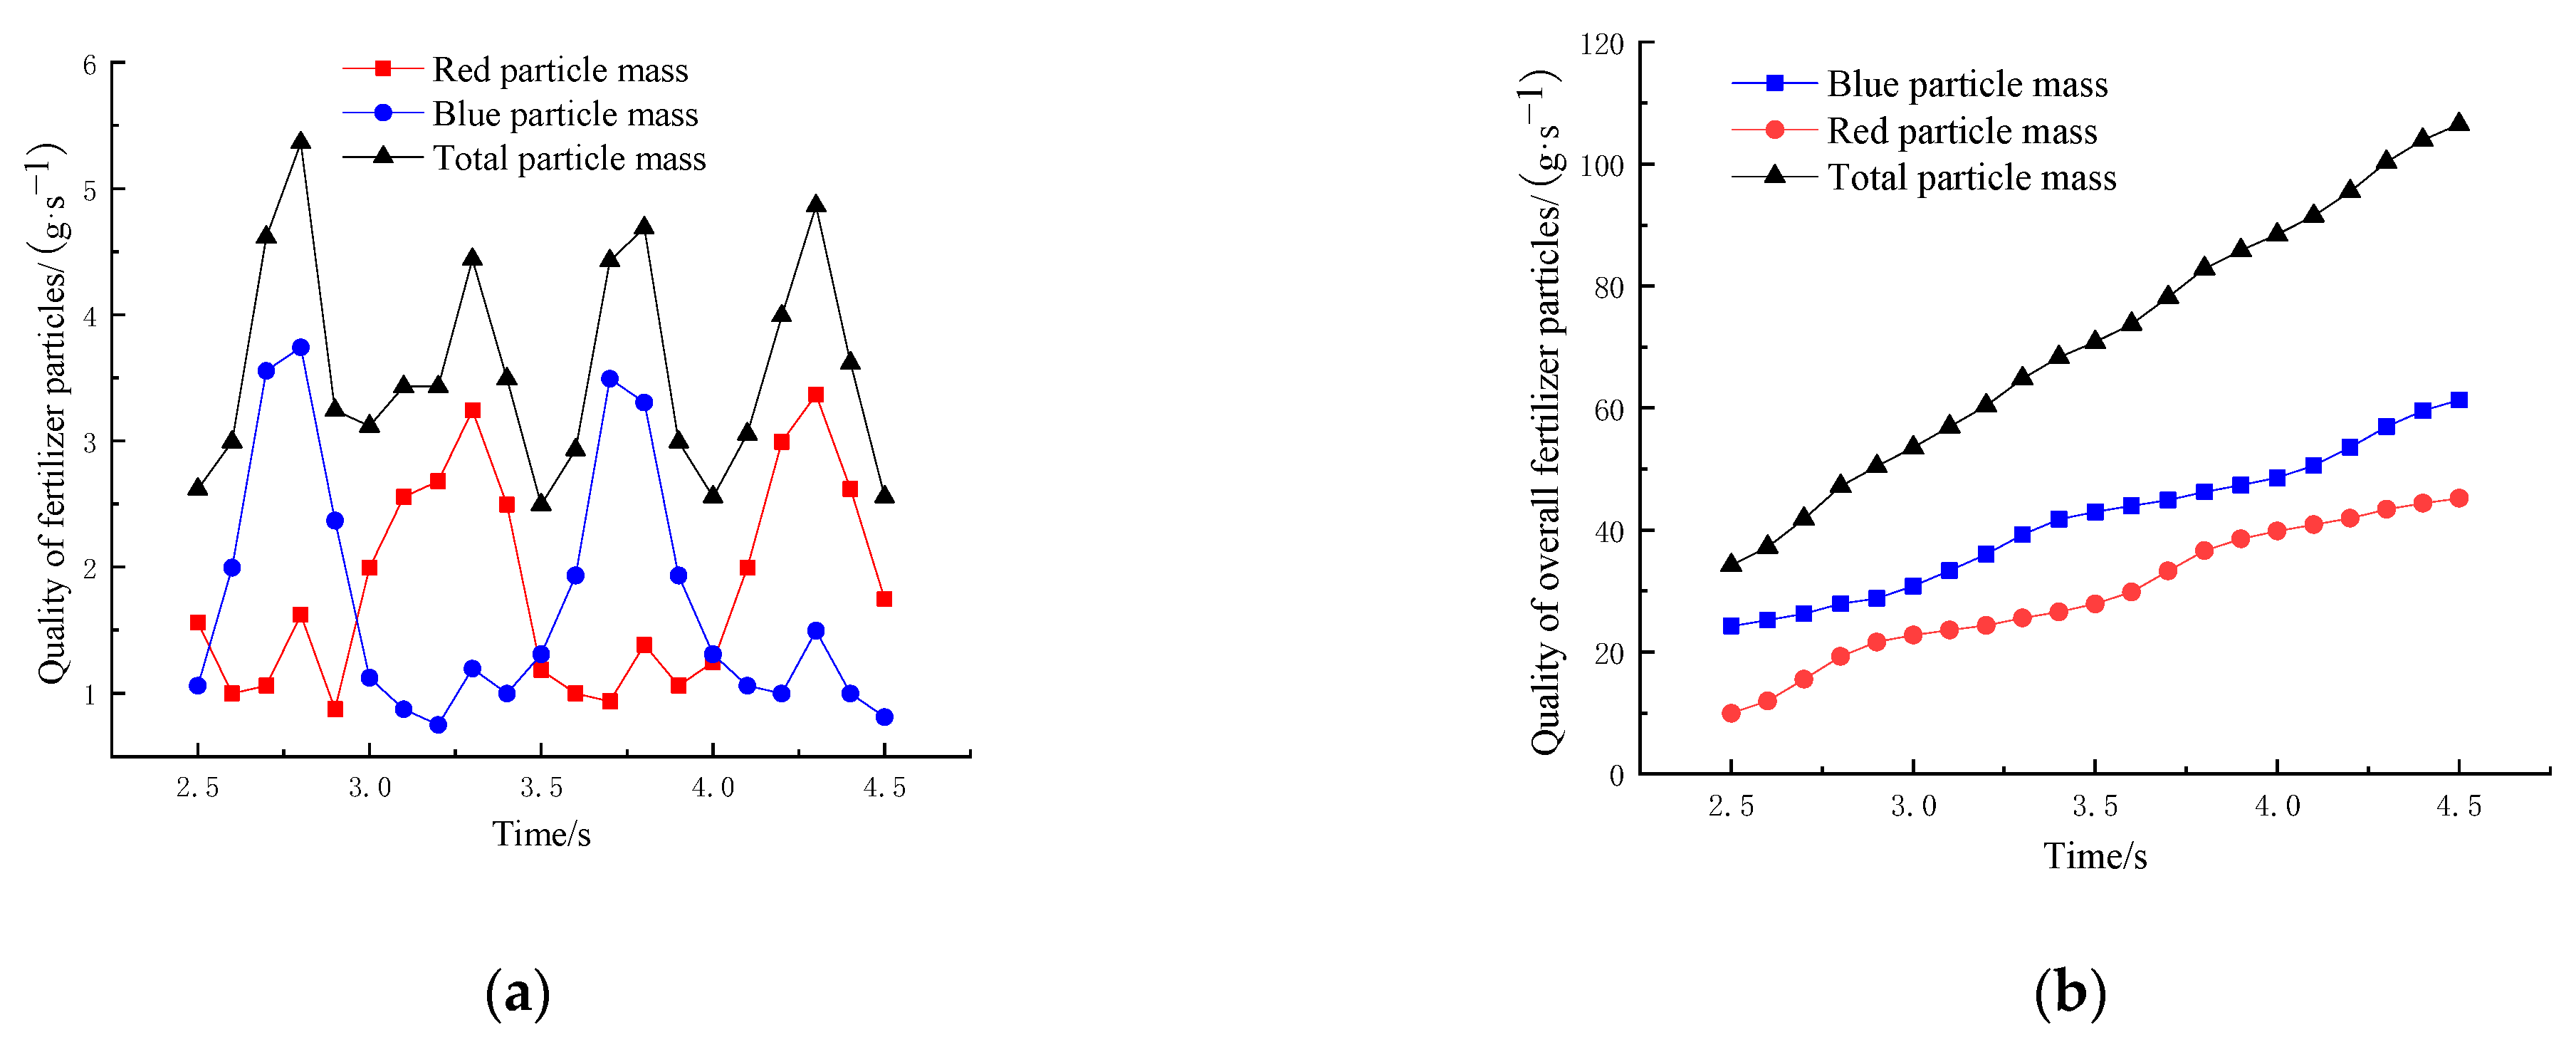
| Project | Red Particle | Blue Particle | Total Particle |
|---|---|---|---|
| average mass/g·s−1 | 1.839 | 1.729 | 3.568 |
| standard deviation/g·s−1 | 0.800 | 0.967 | 0.837 |
| coefficient of variation/% | 43.52 | 55.93 | 23.46 |
| Serial Number | Factor Level | Test Results | |||
|---|---|---|---|---|---|
| x1 | x2 | x3 | Uniformity Coefficient of Variation y1/% | Fertilization Accuracy y2/% | |
| 1 | −1.000 | −1.000 | −1.000 | 18.32 | 3.15 |
| 2 | 1.000 | −1.000 | −1.000 | 14.69 | 2.14 |
| 3 | −1.000 | 1.000 | −1.000 | 18.41 | 3.86 |
| 4 | 1.000 | 1.000 | −1.000 | 12.46 | 3.63 |
| 5 | −1.000 | −1.000 | 1.000 | 13.95 | 2.28 |
| 6 | 1.000 | −1.000 | 1.000 | 14.73 | 1.68 |
| 7 | −1.000 | 1.000 | 1.000 | 12.43 | 2.33 |
| 8 | 1.000 | 1.000 | 1.000 | 13.01 | 2.58 |
| 9 | −1.682 | 0.000 | 0.000 | 17.36 | 2.76 |
| 10 | 1.682 | 0.000 | 0.000 | 14.15 | 2.03 |
| 11 | 0.000 | −1.682 | 0.000 | 13.37 | 1.85 |
| 12 | 0.000 | 1.682 | 0.000 | 12.22 | 3.33 |
| 13 | 0.000 | 0.000 | −1.682 | 16.58 | 3.76 |
| 14 | 0.000 | 0.000 | 1.682 | 15.33 | 2.63 |
| 15 | 0.000 | 0.000 | 0.000 | 23.74 | 3.17 |
| 16 | 0.000 | 0.000 | 0.000 | 24.16 | 3.11 |
| 17 | 0.000 | 0.000 | 0.000 | 23.76 | 2.7 |
| 18 | 0.000 | 0.000 | 0.000 | 23.57 | 2.93 |
| 19 | 0.000 | 0.000 | 0.000 | 23.94 | 2.88 |
| 20 | 0.000 | 0.000 | 0.000 | 25.86 | 3.07 |
| Evaluation Indicators | Source of Variance | Sum of Square | DF | Mean Square | F Value | p Value |
|---|---|---|---|---|---|---|
| Coefficient of variation for uniformity | Model | 425.46 | 9 | 47.27 | 61.48 | <0.0001 |
| x1 | 13.58 | 1 | 13.58 | 17.66 | 0.0018 | |
| x2 | 3.92 | 1 | 3.92 | 5.09 | 0.0476 | |
| x3 | 10.30 | 1 | 10.30 | 13.40 | 0.0044 | |
| x1x2 | 0.79 | 1 | 0.79 | 1.03 | 0.3335 | |
| x1x3 | 14.96 | 1 | 14.96 | 19.46 | 0.0013 | |
| x2x3 | 0.15 | 1 | 0.15 | 0.20 | 0.6668 | |
| x12 | 119.05 | 1 | 119.05 | 154.83 | <0.0001 | |
| x22 | 221.53 | 1 | 221.53 | 288.11 | <0.0001 | |
| x32 | 113.26 | 1 | 113.26 | 147.31 | <0.0001 | |
| Residual | 7.69 | 10 | 0.77 | |||
| Lack of fit | 4.07 | 5 | 0.81 | 1.12 | 0.4510 | |
| Pure error | 3.62 | 5 | 0.72 | |||
| Total variation | 433.15 | 19 |
| Evaluation Indicators | Source of Variance | Sum of Square | DF | Mean Square | F Value | p Value |
|---|---|---|---|---|---|---|
| Fertilization accuracy | Model | 6.99 | 9 | 0.78 | 32.62 | <0.0001 |
| x1 | 0.58 | 1 | 0.58 | 24.41 | 0.0006 | |
| x2 | 2.33 | 1 | 2.33 | 97.75 | <0.0001 | |
| x3 | 2.47 | 1 | 2.47 | 103.78 | <0.0001 | |
| x1x2 | 0.33 | 1 | 0.33 | 13.94 | 0.0039 | |
| x1x3 | 0.10 | 1 | 0.10 | 4.16 | 0.0688 | |
| x2x3 | 0.20 | 1 | 0.20 | 8.20 | 0.0169 | |
| x12 | 0.62 | 1 | 0.62 | 25.86 | 0.0005 | |
| x22 | 0.27 | 1 | 0.27 | 11.49 | 0.0069 | |
| x32 | 0.08 | 1 | 0.08 | 3.50 | 0.0908 | |
| Residual | 0.24 | 10 | 0.02 | |||
| Lack of fit | 0.09 | 5 | 0.02 | 0.57 | 0.7252 | |
| Pure error | 0.15 | 5 | 0.03 | |||
| Total variation | 7.23 | 19 |
| Fertilizer Type | Test Type | Test Index | |
|---|---|---|---|
| Uniformity Coefficient of Variation/% | Fertilization Accuracy/% | ||
| Optimized DAGSFD | Simulation test | 6.78% | 3.26% |
| Bench test | 7.16% | 3.44% | |
| SSFD | Bench test | 21.66% | 4.28% |
Disclaimer/Publisher’s Note: The statements, opinions and data contained in all publications are solely those of the individual author(s) and contributor(s) and not of MDPI and/or the editor(s). MDPI and/or the editor(s) disclaim responsibility for any injury to people or property resulting from any ideas, methods, instructions or products referred to in the content. |
© 2023 by the authors. Licensee MDPI, Basel, Switzerland. This article is an open access article distributed under the terms and conditions of the Creative Commons Attribution (CC BY) license (https://creativecommons.org/licenses/by/4.0/).
Share and Cite
Dun, G.; Wu, X.; Ji, X.; Liu, W.; Mao, N. Optimization Design and Experiment for Precise Control Double Arc Groove Screw Fertilizer Discharger. Agriculture 2023, 13, 1866. https://doi.org/10.3390/agriculture13101866
Dun G, Wu X, Ji X, Liu W, Mao N. Optimization Design and Experiment for Precise Control Double Arc Groove Screw Fertilizer Discharger. Agriculture. 2023; 13(10):1866. https://doi.org/10.3390/agriculture13101866
Chicago/Turabian StyleDun, Guoqiang, Xingpeng Wu, Xinxin Ji, Wenhui Liu, and Ning Mao. 2023. "Optimization Design and Experiment for Precise Control Double Arc Groove Screw Fertilizer Discharger" Agriculture 13, no. 10: 1866. https://doi.org/10.3390/agriculture13101866