Article

Design and Test of a Tractor Electro-Hydraulic-Suspension Tillage-Depth and Loading-Control System Test Bench

1
College of Engineering, Nanjing Agricultural University, Nanjing 210031, China
2
College of Emergency Management, Nanjing Tech University, Nanjing 210009, China
*
Authors to whom correspondence should be addressed.
Agriculture 2023, 13(10), 1884; https://doi.org/10.3390/agriculture13101884
Submission received: 10 September 2023 / Revised: 22 September 2023 / Accepted: 23 September 2023 / Published: 27 September 2023
(This article belongs to the Special Issue Agricultural Machinery Design and Agricultural Engineering)

Abstract

:
Electro-hydraulic suspension systems are one of the key working systems of tractors. Due to the complex and changeable working conditions in the field, it is of great significance to shorten the development cycle of the control strategy and reduce the development cost by using the indoor bench for test verification at the beginning of the study. Based on this, this paper has proposed a complete set of tractor hydraulic-suspension tillage-depth and loading-control test-bench designs. The system was mainly composed of three parts: an industrial computer, a suspension electro-hydraulic control system, and a loading electro-hydraulic control and data-acquisition system. The human–computer interaction interface of the test-bench measurement and control system was built, and the loading-force control system and suspension tillage-depth and loading integrated-control system were built based on PID and fuzzy PID control algorithms, respectively. The system can realize the control of suspension tillage depth and loading during the operation process and has the functions of the real-time acquisition, display, and data storage of related sensor signals during the working process. The test results showed that the response time of the loading-control system was less than 1.2 s, and the maximum steady-state error was less than 0.8%. The response time of the suspension control system was less than 2.3 s, and the maximum steady-state error was less than 1%. The system has good responsiveness and stability. These research results can provide platform and method of support for the development and test of tractor electro-hydraulic suspension systems.

1. Introduction

As the core component of tractor operation, the main function of the tractor electro-hydraulic suspension system is to connect and pull various agricultural machinery, so as to realize the control of agricultural machinery and control the attitude and operation depth. Therefore, the performance of the tractor suspension system is the key to determining the quality and efficiency of tractor operation [1,2,3]. With the development of measurement and control technology, an indoor simulation test system was built to simulate the tractor operation, which provides a new means for the experimental study of tractor suspension systems [4,5,6,7]. Compared with complex and changeable field operation conditions, in the initial research stage, it is of great significance and function to shorten the development cycle of the tractor suspension tillage-depth control strategy and reduce the development cost by using the bench to verify and debug the suspension system [8,9].
For the tractor hydraulic-suspension test bench, relevant scholars have conducted a lot of research. In terms of hardware, Zhu et al. [10] designed a weight-loading mechanism and completed the tractor three-point suspension static settlement test. Shang et al. [11] proposed the loading method of the electro-hydraulic proportional valve and designed the angle adjustment cylinder to ensure the verticality of the loading cylinder. Cong et al. [12] designed a tractor hydraulic-suspension automatic hanging device, which improved the detection efficiency of the hydraulic-suspension device-detection loading test bench. Based on field test results of ploughing resistance, Li et al. [13] simulated the steady-state resistance and dynamic resistance in the process of ploughing based on the electro-hydraulic proportional relief valve. Zhu et al. [14] designed a tractor pallet based on a supporting hydraulic cylinder, which can simulate the change in the working slope of the tractor when working in hilly and mountainous areas. In terms of software, Tan et al. [15,16] realized the modeling of hydraulic systems through traditional theoretical methods and adopted the method of fuzzy control to realize step loading. In order to verify the effectiveness of the tractor-suspension tillage-depth control strategy, Han et al. [17] built a tractor hydraulic-suspension tillage-depth and engine-load comprehensive control test bench. Based on the engine model, the tractor load control during suspension system operation was realized, and good test results were obtained. In view of the fact that static loading cannot truly restore field-operation load characteristics, Zong et al. [18] developed a tractor three-point suspension loading test bench based on CRIO to simulate the field dynamic load, which provides a platform for the reliability test of tractor three-point suspension. Based on the designed loading profiling test platform, Zhu et al. [14] proposed a comprehensive control strategy for loading profiling, which met the test requirements of the tractor electric-suspension control system in hilly and mountainous areas. In summary, at present, most of the research on the tractor hydraulic-suspension test bench focuses on the design of the loading system, which mainly reflects the loading of a certain force in a certain direction, and the loading form is relatively simple. Moreover, it mainly detects the maximum lifting force of the suspension system, and there are few studies on the comprehensive test bench for suspension operation and loading force.
This paper has proposed a complete set of tractor electro-hydraulic-suspension tillage-depth and loading-control test-bench designs. Firstly, based on theoretical analysis and field ploughing resistance tests, a double-cylinder loading-control scheme using an electro-hydraulic proportional valve was designed to realize the simulation of steady-state resistance and dynamic resistance in the field. Then, according to the working principle of tractor hydraulic suspension, a hydraulic principle scheme of suspension systems based on the threaded cartridge valve was designed, and the valve block was processed and designed. Secondly, based on the industrial computer, the human–computer interaction page of the test-bench measurement and control system was built, and the loading-force control system and suspension tillage-depth and loading comprehensive-control system were built based on PID and fuzzy PID control algorithms, respectively. Finally, the performance test was carried out based on the built test bench.

2. Materials and Methods

2.1. Theoretical Analysis

2.1.1. Plough Body Force Model

The process of tractor ploughing is mainly affected by soil resistance. Studying the soil resistance of the plough body has important guiding significance for the simulation loading of the tractor electro-hydraulic-suspension test bench. The stress analysis of the plough body is shown in Figure 1. When the tillage depth remains unchanged, the empirical formula is calculated according to the ploughing resistance. At this time, the horizontal and vertical resistances are proportional to the tillage depth [19].
R x = k H b d R s = k V b d
where R x is the horizontal traction resistance, N; R s is the vertical resistance, N; k H is the horizontal soil specific resistance, N/cm2; k V is the vertical soil specific resistance, N/cm2; b is the plough width, cm; d   is   the   tillage   depth ,   cm .
When the tillage depth changes, it is assumed that the plough body moves from tillage depth d 1 to d 2 . At this time, the force of the plough body is:
R x = k d δ x δ x 2 + δ z 2 R d = k d δ z δ x 2 + δ z 2
where R x is the horizontal resistance, N; R d is the vertical dynamic resistance, N; tillage depth d = d 1 + d 2 / 2 , cm; δ x is the displacement of the plough body in the horizontal direction, cm; δ z is the displacement of the plough body in the vertical direction, cm.
Because of δ x δ z , we obtain:
R x = k d R d = k d δ z δ x = R x z t ˙ x t ˙  
where z ( t ) ˙ is the lifting speed of the plough body; x ( t ) ˙ is the traction speed of the tractor.
In summary, the plough body is subjected to horizontal traction resistance, vertical traction resistance and vertical dynamic resistance during operation. When designing the loading model, the horizontal traction resistance and the vertical traction resistance can be combined into the steady-state resistance R w . In addition, the vertical direction is the dynamic resistance R d .
R w = R x 2 + R s 2 R d = k d δ z δ x = R x z t ˙ x t ˙  

2.1.2. Slip Model

Tires can reflect the relationship between driving force and slip ratio, and relevant scholars have conducted a lot of research [20,21,22]. Because the test bench is fixed, the slip rate cannot be directly measured. Therefore, the DUGOFF tire model is used to simulate the slip rate. The relationship between the driving force and the slip rate of the tractor was expressed as:
S = F t C + F t   S < φ F z 2 C + φ F z φ 2 F z 2 4 C φ F z 4 C F t + φ 2 F z 2 S φ F z 2 C + φ F z
where F t is the gross tractive force of the tractor; x ( t ) ˙ is the traction speed of the tractor. Considering that the tractor advances at a uniform speed on flat ground and the ploughing speed is low, F t R x , N; C is the longitudinal stiffness of the tire under standard tire pressure, N/cm; F z is the vertical reaction force of ground to the tractor, N.

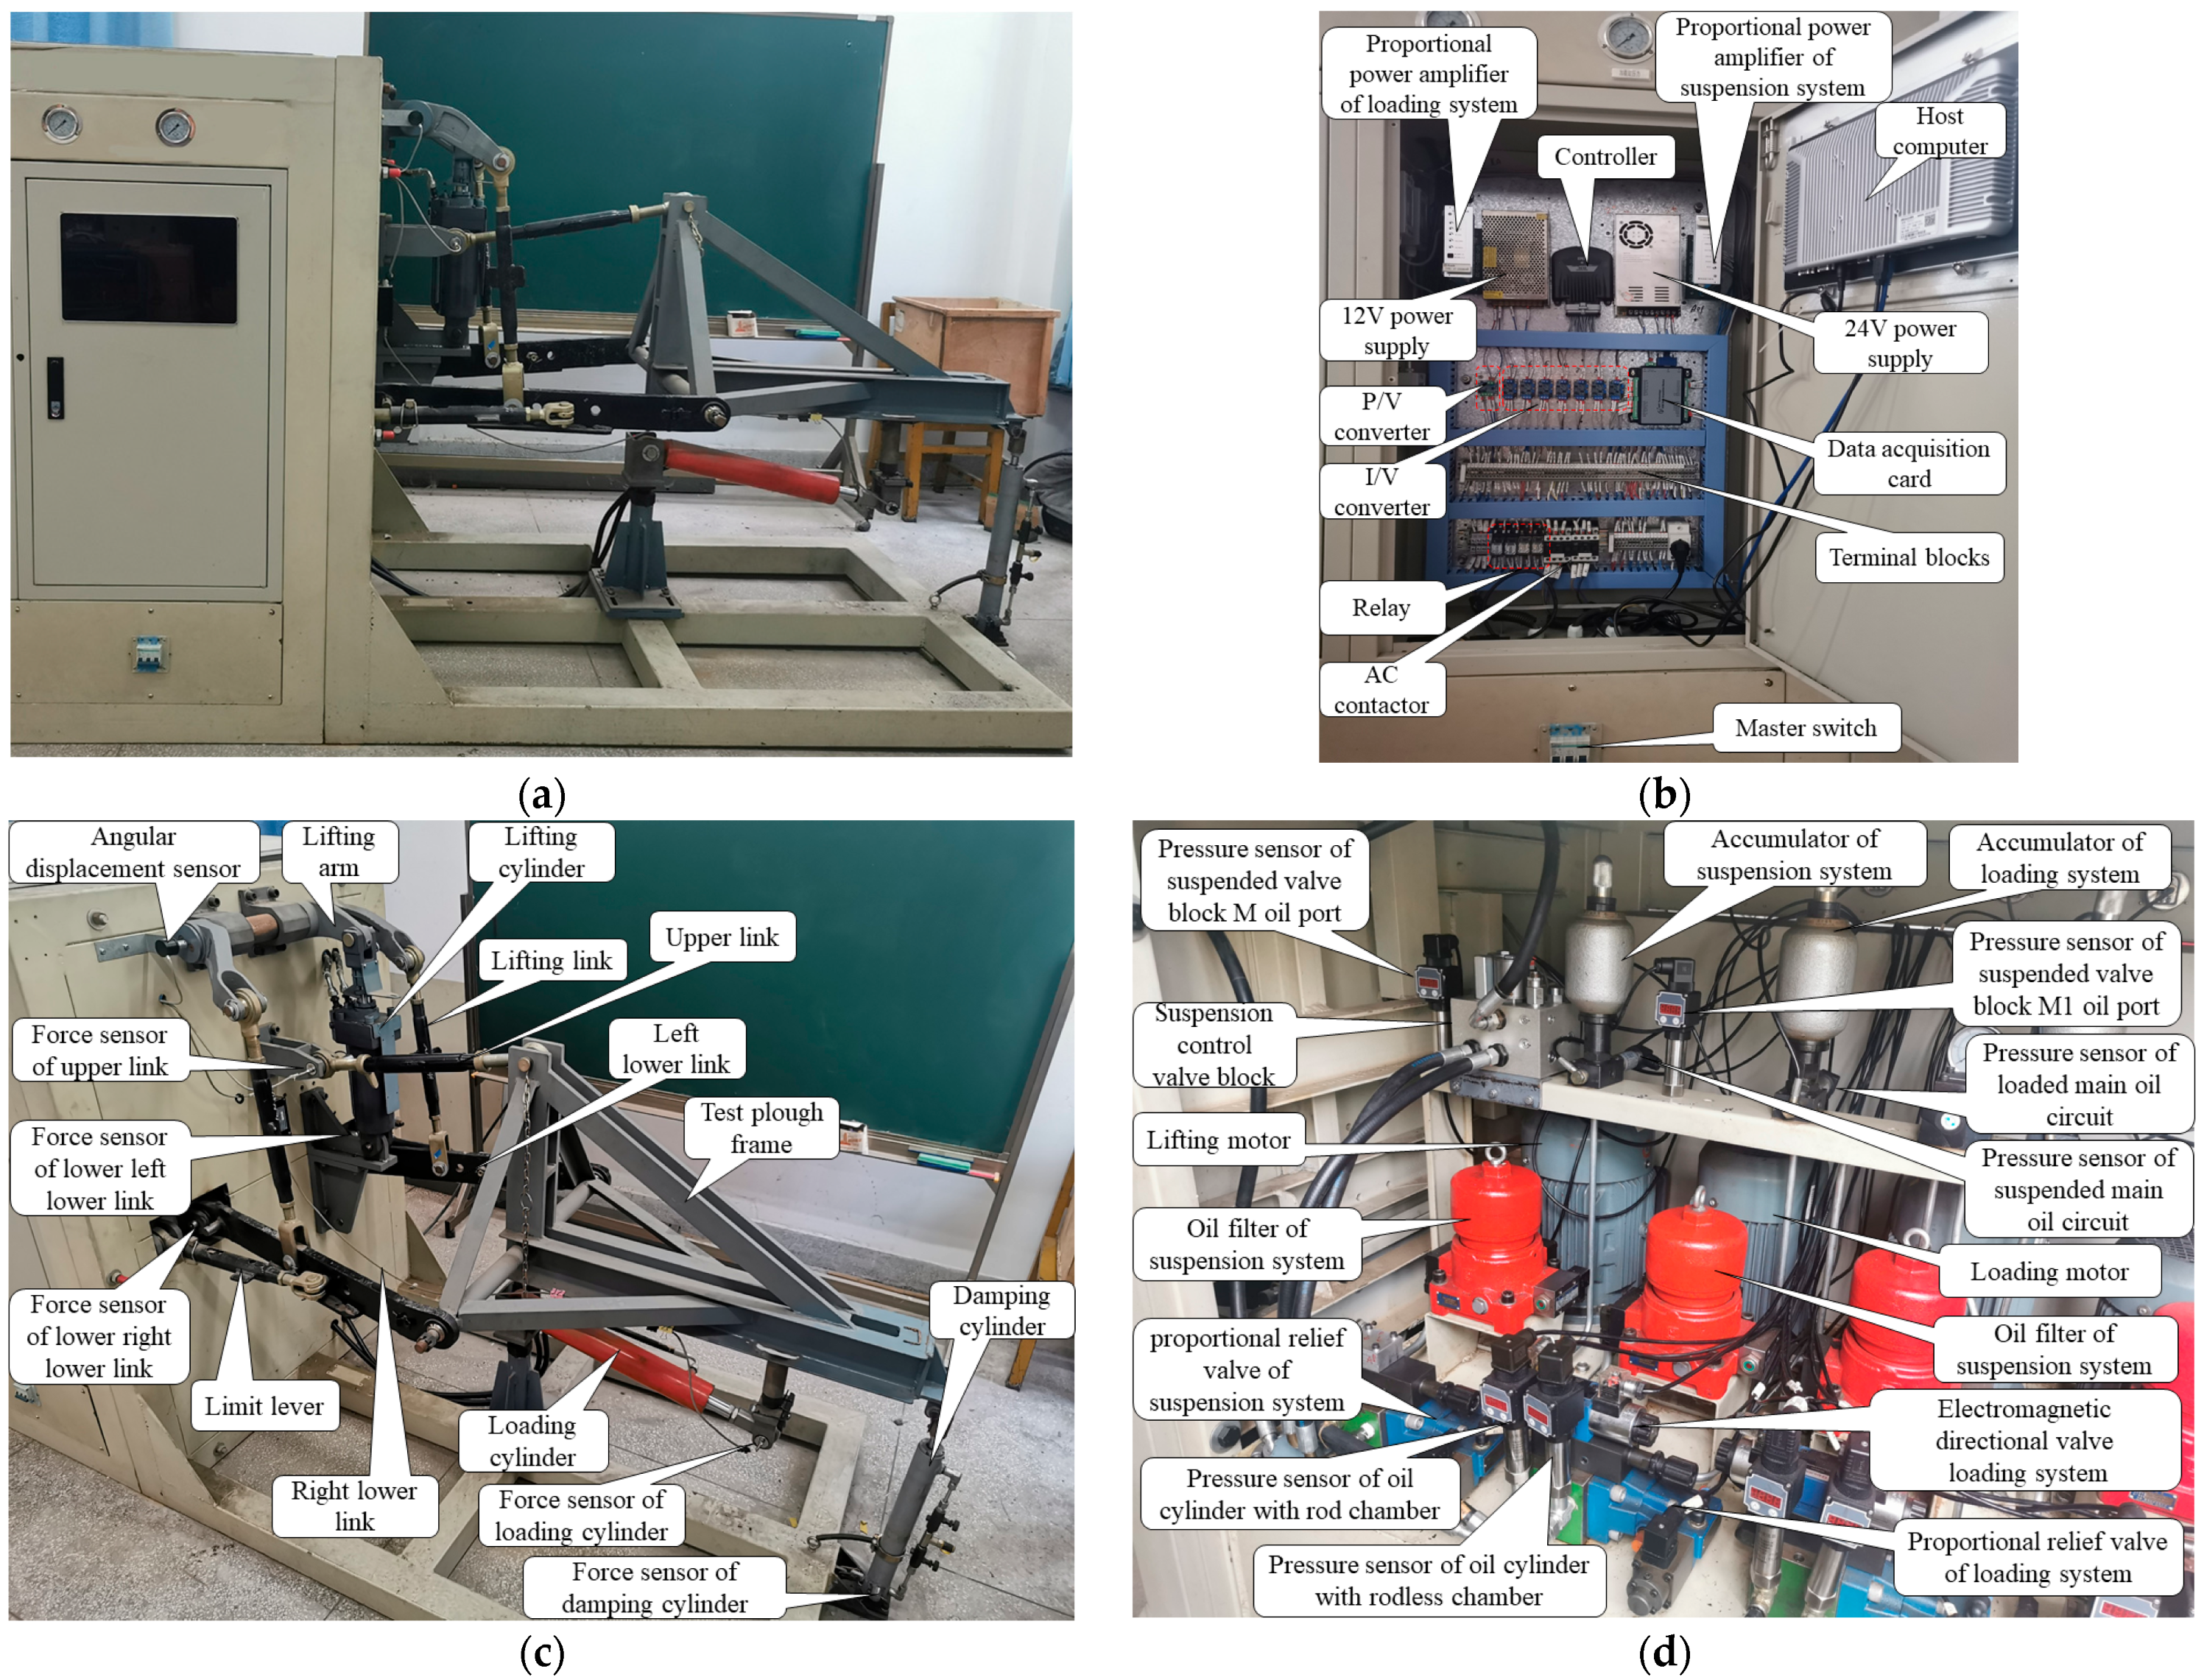
2.2. The Overall Structure Scheme of the Test Bench

The test bench of the tractor electro-hydraulic-suspension tillage-depth and loading-control system was mainly composed of three parts: suspension control system, resistance simulation loading system, and control cabinet, as shown in Figure 2. The suspension system mainly includes a lifting cylinder, lifting arm, upper link, lower link, lifting link, limit link, traction resistance sensor, and displacement sensor. The control cabinet sends out control instructions according to the feedback signal of the sensor to drive the lifting cylinder to drive the lifting arm to rotate, and the lifting arm drives the lower link movement through the lifting link to realize the lifting and lowering of the test plough frame. The resistance simulation loading mechanism mainly includes a loading cylinder, damping cylinder, loading cylinder fixed column, and tension pressure sensor. The loading cylinder and damping cylinder were used to simulate the steady-state resistance and dynamic resistance of the test plough frame, respectively. The control cabinet controls the magnitude of the applied resistance through the feedback signal of the sensor. At the same time, a chute was designed on the fixed column of the loading cylinder to change the loading direction of the steady-state resistance. At the connection between the damping cylinder and the test plough frame, a leaving hook device was designed. When the test plough frame is lifted off the ground, the leaving hook device is automatically opened.

2.3. Hardware Composition of Electro-Hydraulic Measurement and Control System

The hardware of the measurement and control system of the tractor electro-hydraulic-suspension tillage-depth and loading-control system test bench was mainly composed of three parts: industrial computer, suspension control system, and loading and data-acquisition system, as shown in Figure 3. Among them, the suspension control system mainly controls the tillage depth through the controller to control the lifting or lowering valve; the data-acquisition system realizes the acquisition and recording of the sensor signal, as well as the on–off and size control of the loading force through the electromagnetic directional valve and the electro-hydraulic proportional relief valve; and the industrial computer realizes the input of the operation panel and the monitoring of the test-bench data by building a human–computer interaction interface.

2.3.1. Industrial Computer

The industrial control computer of the system adopts the Shenzhen Guanyi Technology (Shenzhen, China) PX1511 full-plane capacitive touch-screen industrial control integrated computer, which realizes the connection with the data-acquisition card and the controller through USB and KVASER CAN communication lines, respectively, and realizes the transmission, processing, display and storage of all data signals of the test bench.

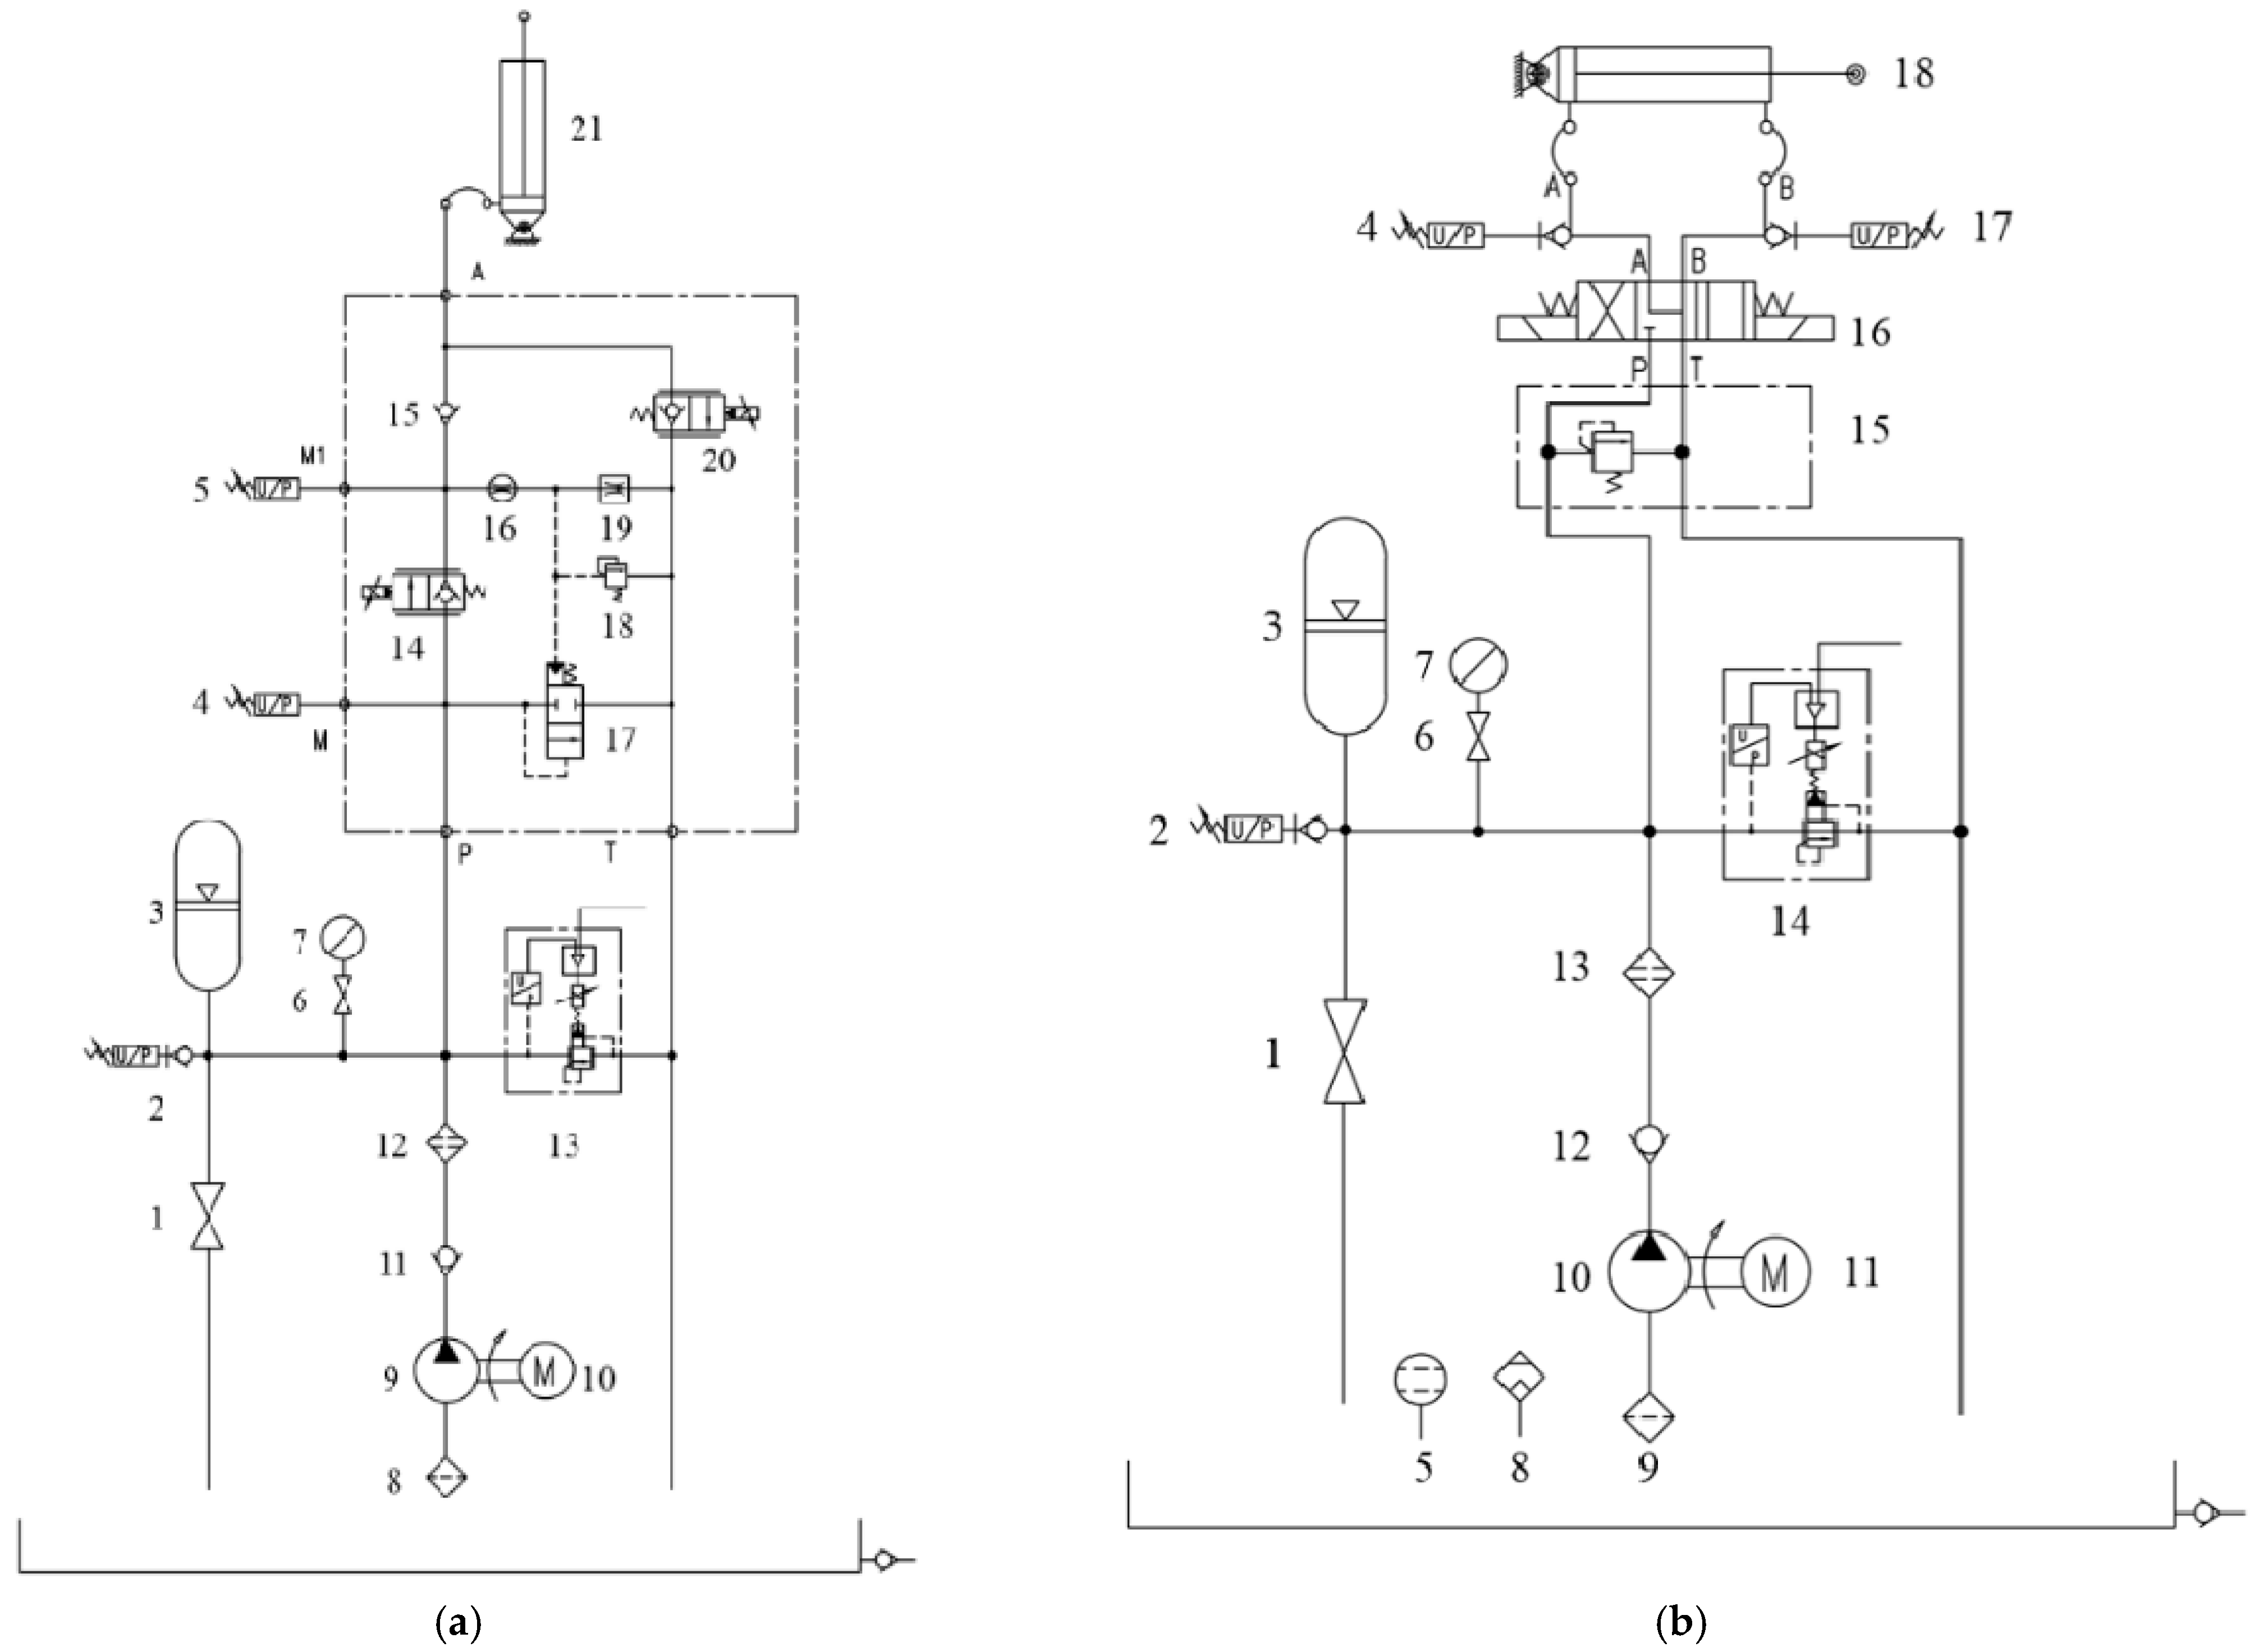
2.3.2. Suspension Electro-Hydraulic Control

(1) EPEC3610 controller. The EPEC3610 produced by the Finnish company was selected as the controller of the test bench. The feedback signal processing of the suspension system sensor and the operation of the control strategy are completed in the control system, and the output control signal is controlled by the electro-hydraulic proportional valve to drive the lifting cylinder to perform the action. The controller has 22 I/O pins, the power supply voltage is AC 12 V, and the system I/O pin address allocation is shown in Figure 4a.
(2) Suspension hydraulic system. The suspension hydraulic system was mainly composed of an oil pump, motor, two-position two-way proportional flow control valve, pressure compensation valve, safety valve, throttle valve, check valve, proportional relief valve, and other major hydraulic components. The working principle is shown in Figure 5a. During the lifting operation, the motor starts and the oil pump produces high-pressure oil, which flows to lifting valve 14 through the check valve and the pipeline filter and is finally transported to the lifting cylinder. The pressure compensation valve, 17, ensures the stability of the flow during the lifting process by compensating the pressure difference before and after the lifting valve. Throttle valve 19 plays the role of shunting in the lifting process, thereby reducing the impact of the lifting cylinder action; during the descending operation, check valve 15 cuts off the oil back to the lifting oil circuit, and the oil in the lifting cylinder returns to the oil tank through descending valve 20. The proportional relief valve is connected in parallel to the main oil circuit, and the control of the lifting oil pressure is realized by the feedback oil pressure signal of the main oil circuit oil pressure sensor, 2. The accumulator and high-pressure ball valve play the role of loading energy storage and unloading partial pressure, respectively. The electro-hydraulic proportional relief valve is connected in parallel in the main oil circuit, and the oil pressure of the main oil circuit is controlled by controlling the input voltage. The specifications of the relevant hydraulic components are shown in Table 1.
(3) Sensors. There were five sensors in the suspension control system of the suspension test bench. Three force sensors installed on the upper link and the left and right, and two lower links were used to collect the traction resistance of the tractor during the operation and provide the force feedback signal for the tillage-depth control of the test bench. The angular displacement sensor installed at the position of the lifting arm was used to collect the displacement of the oil cylinder. Based on the actual tillage depth and the pre-experimental data of the oil cylinder displacement test, it was converted into the tillage-depth signal of the test bench. The oil pressure sensor installed on the main oil circuit of the suspension hydraulic system was used to feedback the oil pressure of the main oil circuit, which was convenient for realizing the oil pressure control of the suspension system. The relevant performance parameters of the sensor are shown in Table 2.

2.3.3. Loading Electro-Hydraulic Control and Data-Acquisition System

(1) USB3136A data-acquisition card. The USB3136A data-acquisition card produced by Beijing Altai company was used to collect the signal of the sensor of the test bench, which mainly includes the oil pressure signal of the M port before the lifting valve and the oil pressure signal of the M1 port after the valve. The loading system loads the cylinder-force sensor signal, the damping cylinder-force sensor signal, the oil pressure signal of the main oil circuit, the oil pressure signal of the front chamber of the loading cylinder, and the pressure signal of the rear chamber of the loading cylinder. The interface definition is shown in the Figure 4b. The data-acquisition card consists of 16 analog input channels, the maximum acquisition rate is 500 Ksps, the resolution reaches 12 bits, and the sampling range includes ±10 V, ±5 V, ±2 V, or ±1 V. It provides a guarantee for the high-speed and accurate acquisition of the test-bench measurement and control system signal.
(2) Sensors. There were seven sensors in the loading-control and data-acquisition system. Two oil pressure sensors installed at the M port in front of the lifting valve and the M1 port behind the valve were used to collect the oil pressure signal and feedback the oil pressure fluctuation during the operation. Two force sensors installed in the loading cylinder and the damping cylinder were used to collect the signal of the loading force, and the loading force was controlled by the feedback to the control unit. Two oil pressure sensors installed in the front and rear chambers of the loading cylinder were used to collect the oil pressure fluctuation during the loading process. The oil pressure sensor installed on the main oil circuit of the loading hydraulic system was used to sense the oil pressure of the main oil circuit, which was convenient for monitoring and controlling the oil pressure of the main oil circuit. The relevant performance parameters are shown in Table 2.
(3) Loading hydraulic system. The loading hydraulic system adopts the loading mode of the electro-hydraulic proportional valve. The working principle is shown in Figure 5b. When the motor starts, the high-pressure oil produced by the oil pump flows to electromagnetic directional valve 16 through the check valve and the pipeline filter, and finally it is transported to the loading cylinder. The on and off of the loading force of the loading system is controlled by controlling the electromagnetic directional valve. When the left electromagnet is energized, the solenoid valve is in the left position. At this time, the cylinder is extended, and the backward thrust is applied to the test plough frame. When the right electromagnet is energized, the solenoid valve is in the right position. At this time, the oil cylinder is retracted, and the forward tension is applied to the test plough frame. When the electromagnet is not energized, the cylinder is unloaded. Similarly, the proportional relief valve is connected in parallel to the main oil circuit, and the loading force of the loading cylinder is controlled by the feedback oil pressure signal of the main oil circuit oil pressure sensor, 2. The safety valve, 15, plays a protective role to prevent the system oil pressure from being too high. The principle of the accumulator and high-pressure ball valve is the same as that in the suspension system, which plays the role of loading energy storage and unloading partial pressure in the loading system. The specifications of the relevant hydraulic components are shown in Table 3.

2.4. Software Design of Measurement and Control System

The measurement and control system software of the test bench runs in the industrial computer. The software design mainly includes the main functional modules of the system, database management module and communication module. The main functional modules include data-acquisition function, test parameter setting function and equipment control function. Among them, the data-acquisition function includes the setting of acquisition parameters, data processing and data display. The test parameter setting function includes parameter target value setting and test condition setting. The equipment control functions include the automatic control and manual control of the suspension and loading of the test bench. The database management module includes the recording of test data and the reading of target value files. The communication module is mainly the CAN communication between the industrial computer and the controller, so as to realize the mutual transmission of signals. The software design schematic diagram of the measurement and control system is shown in Figure 6.

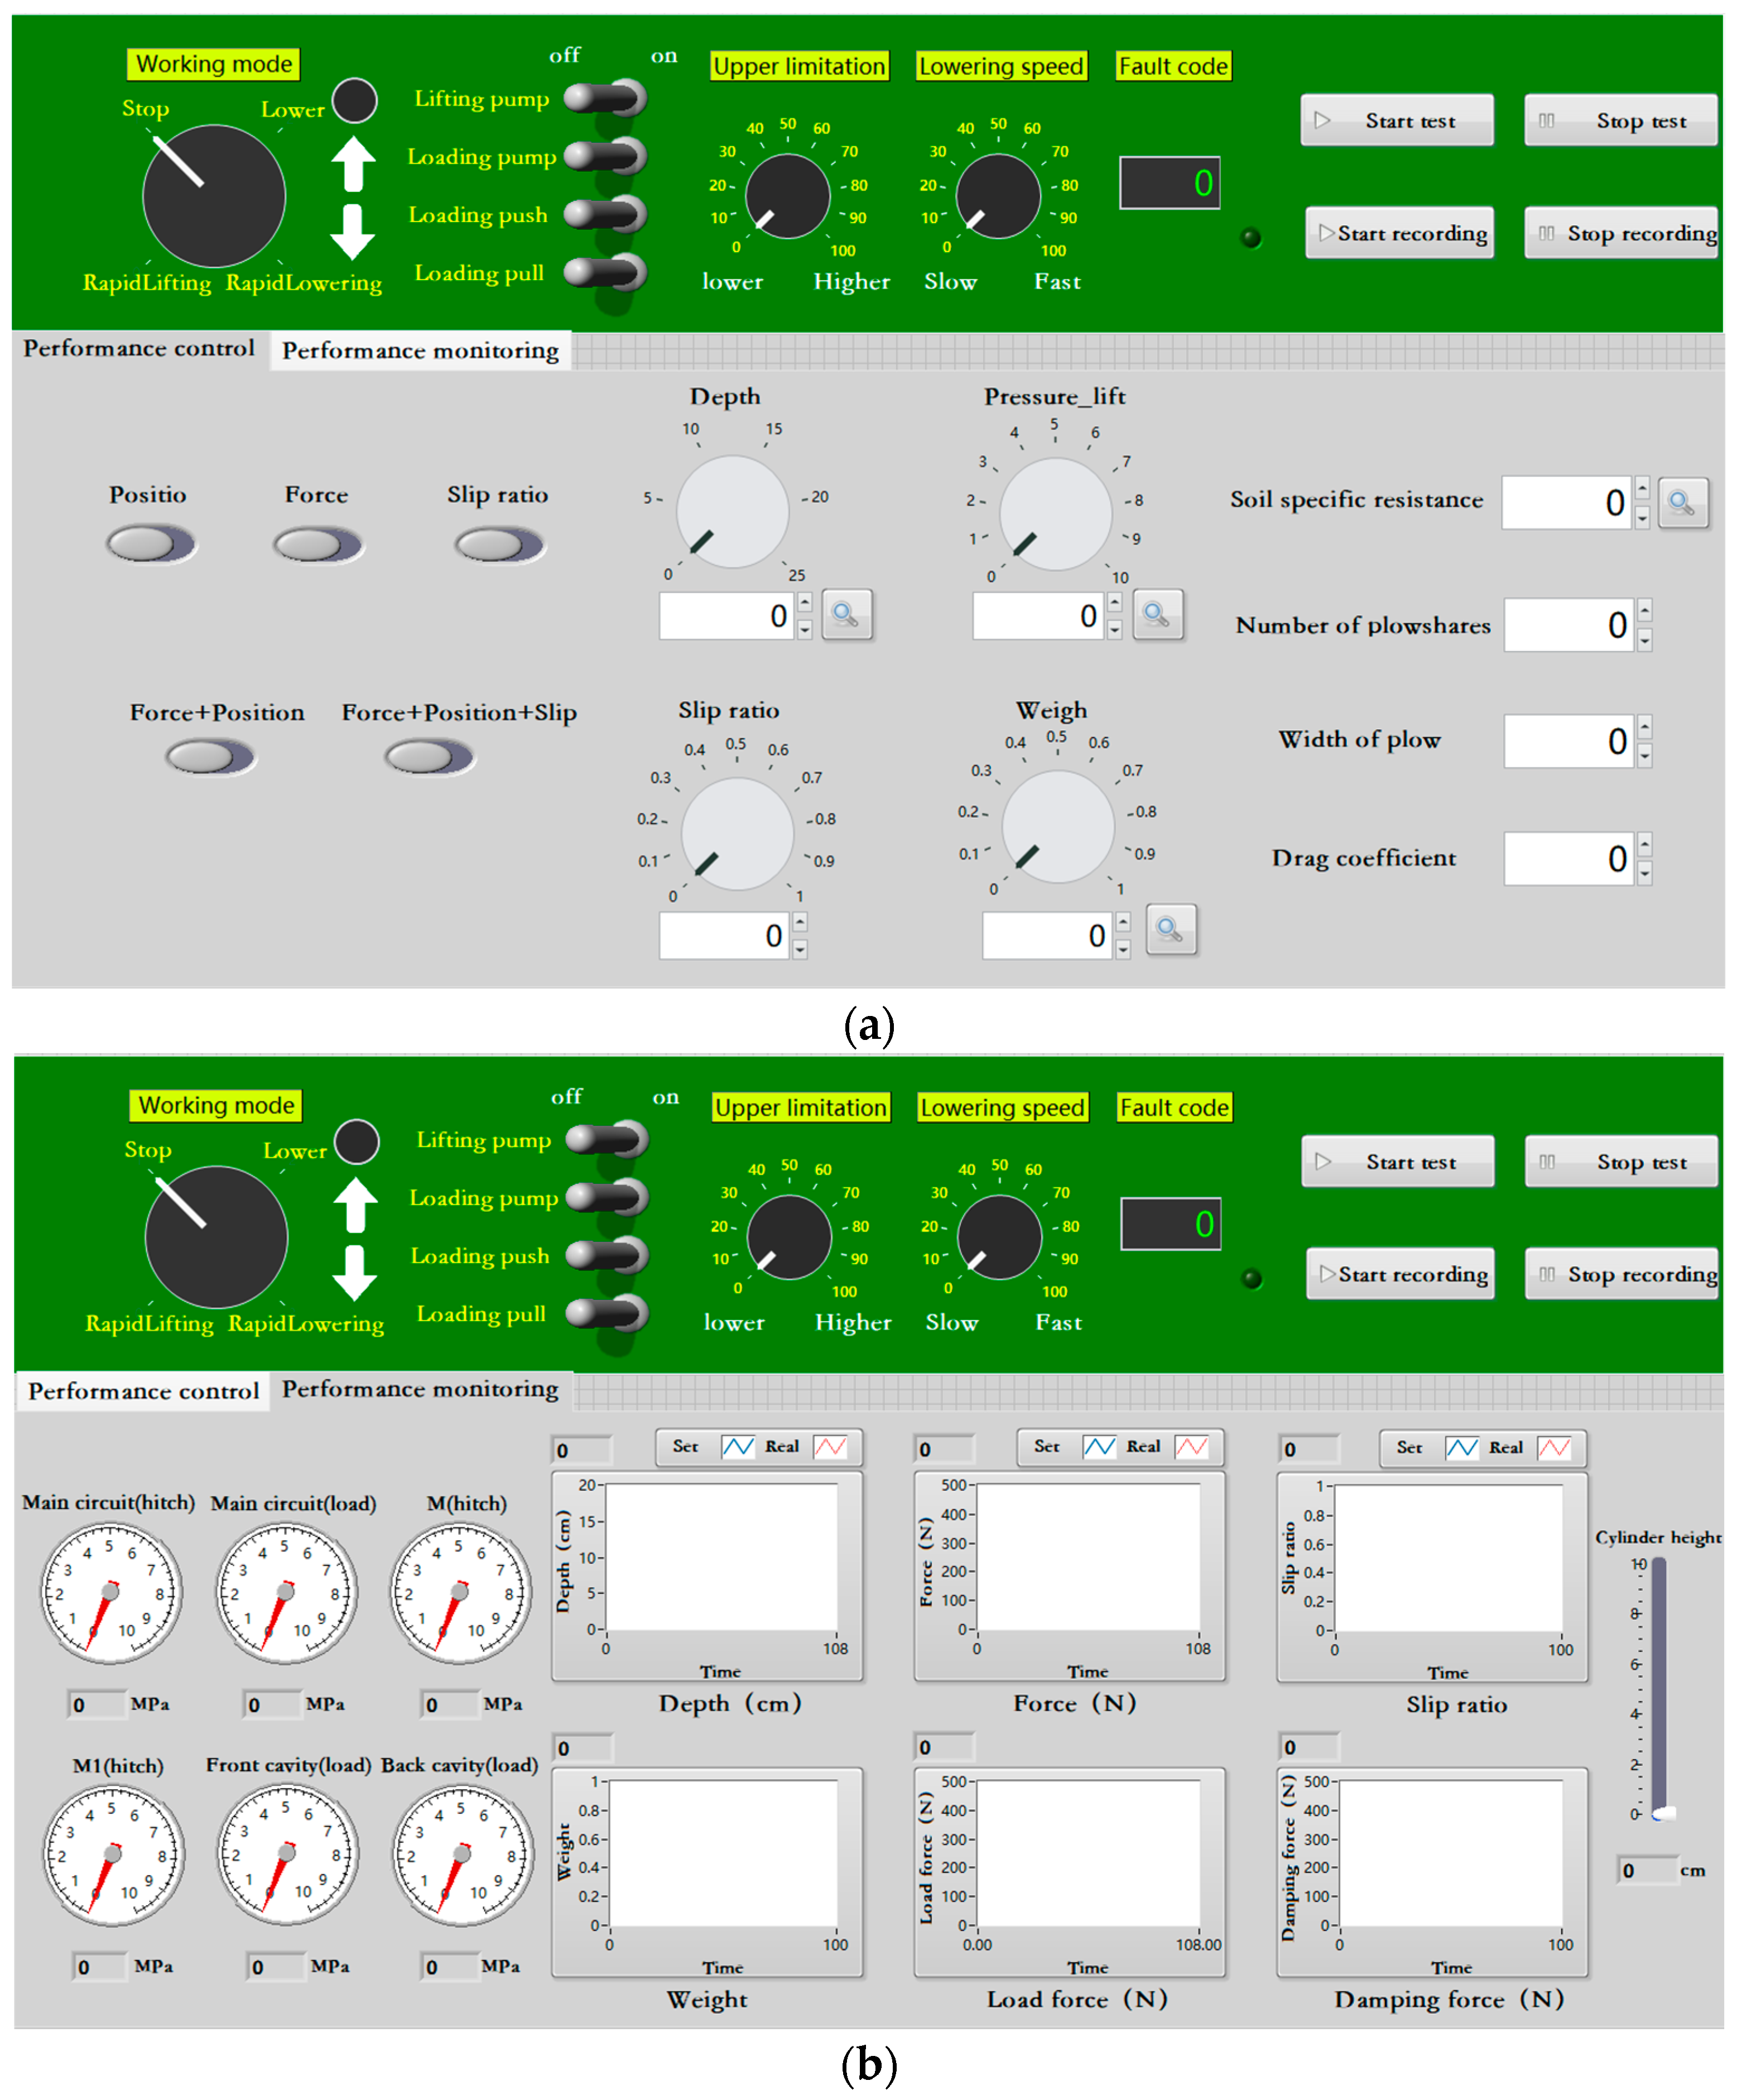
2.4.1. Measurement and Control System Operation Panel

Based on the host computer, the virtual instrument operation panel of the test bench was developed. The buttons, switches and display windows on the panel are convenient for the operation of the test bench and the observation of real-time monitoring signals. The operation panel is shown in Figure 7. The whole operation panel was composed of three parts: the main interface, performance control interface and performance monitoring interface. The main interface mainly includes the start and stop of the test, the recording of the test data, the selection of the working mode, the monitoring of the signal communication of the test bench, the start and stop of the lifting pump and the loading pump, the on–off of the loading force of the loading cylinder, the limit of the lifting height, the adjustment of the descending speed, and the display of the fault code. The performance control interface mainly includes the selection of tillage-depth control method, the input of the control target signal and the simulation of working condition signals, such as working soil and farm tool parameters. The performance monitoring interface displays the relevant state signals of the test bench in real time, mainly including the oil pressure signal, tillage-depth signal, traction signal, loading force signal and slip rate signal of the suspension system and loading system.

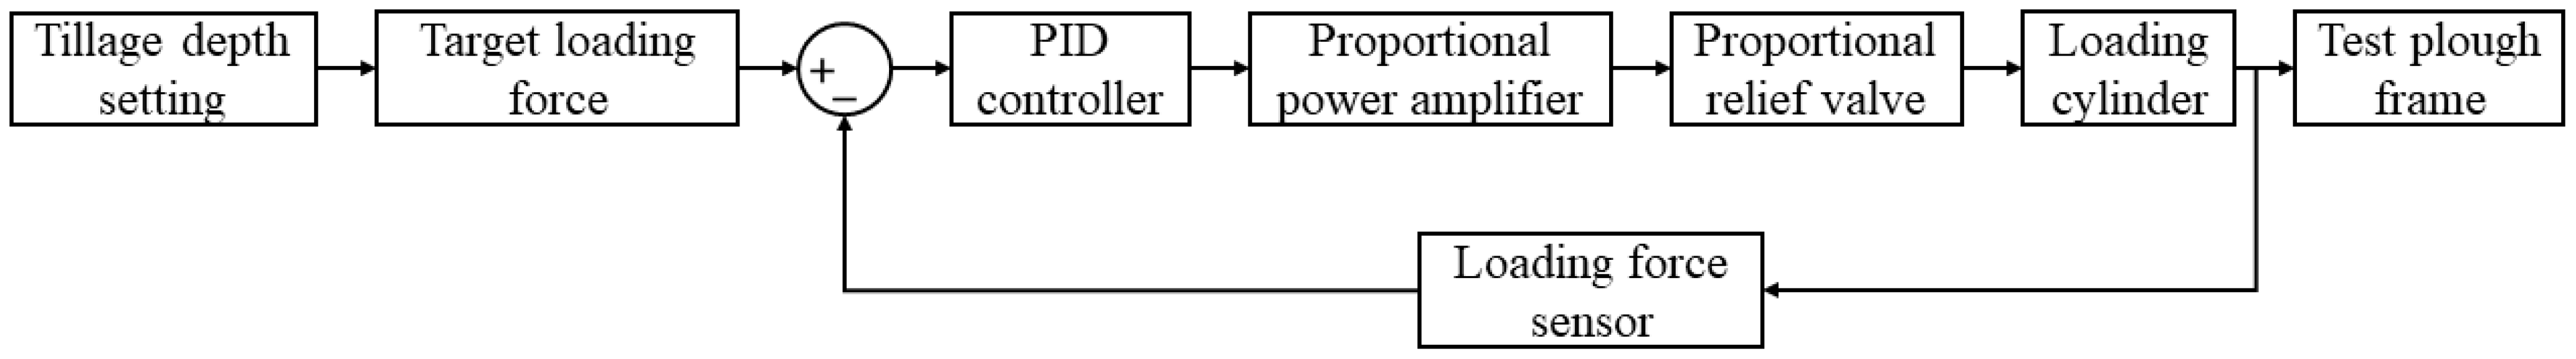
2.4.2. Loading-Control System Based on PID

In order to realize the continuous adjustment of the tractor-ploughed soil resistance during the operation of the test bench by the measurement and control system to simulate the resistance change in the actual operating conditions, a test-bench loading-control system based on PID was designed. The block diagram of the loading-control system is shown in Figure 8. When the test bench is working, the target tillage depth is set through the human–computer interaction interface, and the set target tillage depth is converted into the corresponding target loading force based on the selected parameters of the ploughing operation conditions. The loading cylinder force sensor feeds back the difference between the actual loading force and the target value into the PID controller to calculate the control amount. The proportional power amplifier drives the proportional relief valve to adjust the oil pressure of the loading system, so as to promote the loading cylinder to realize the control of the loading force.

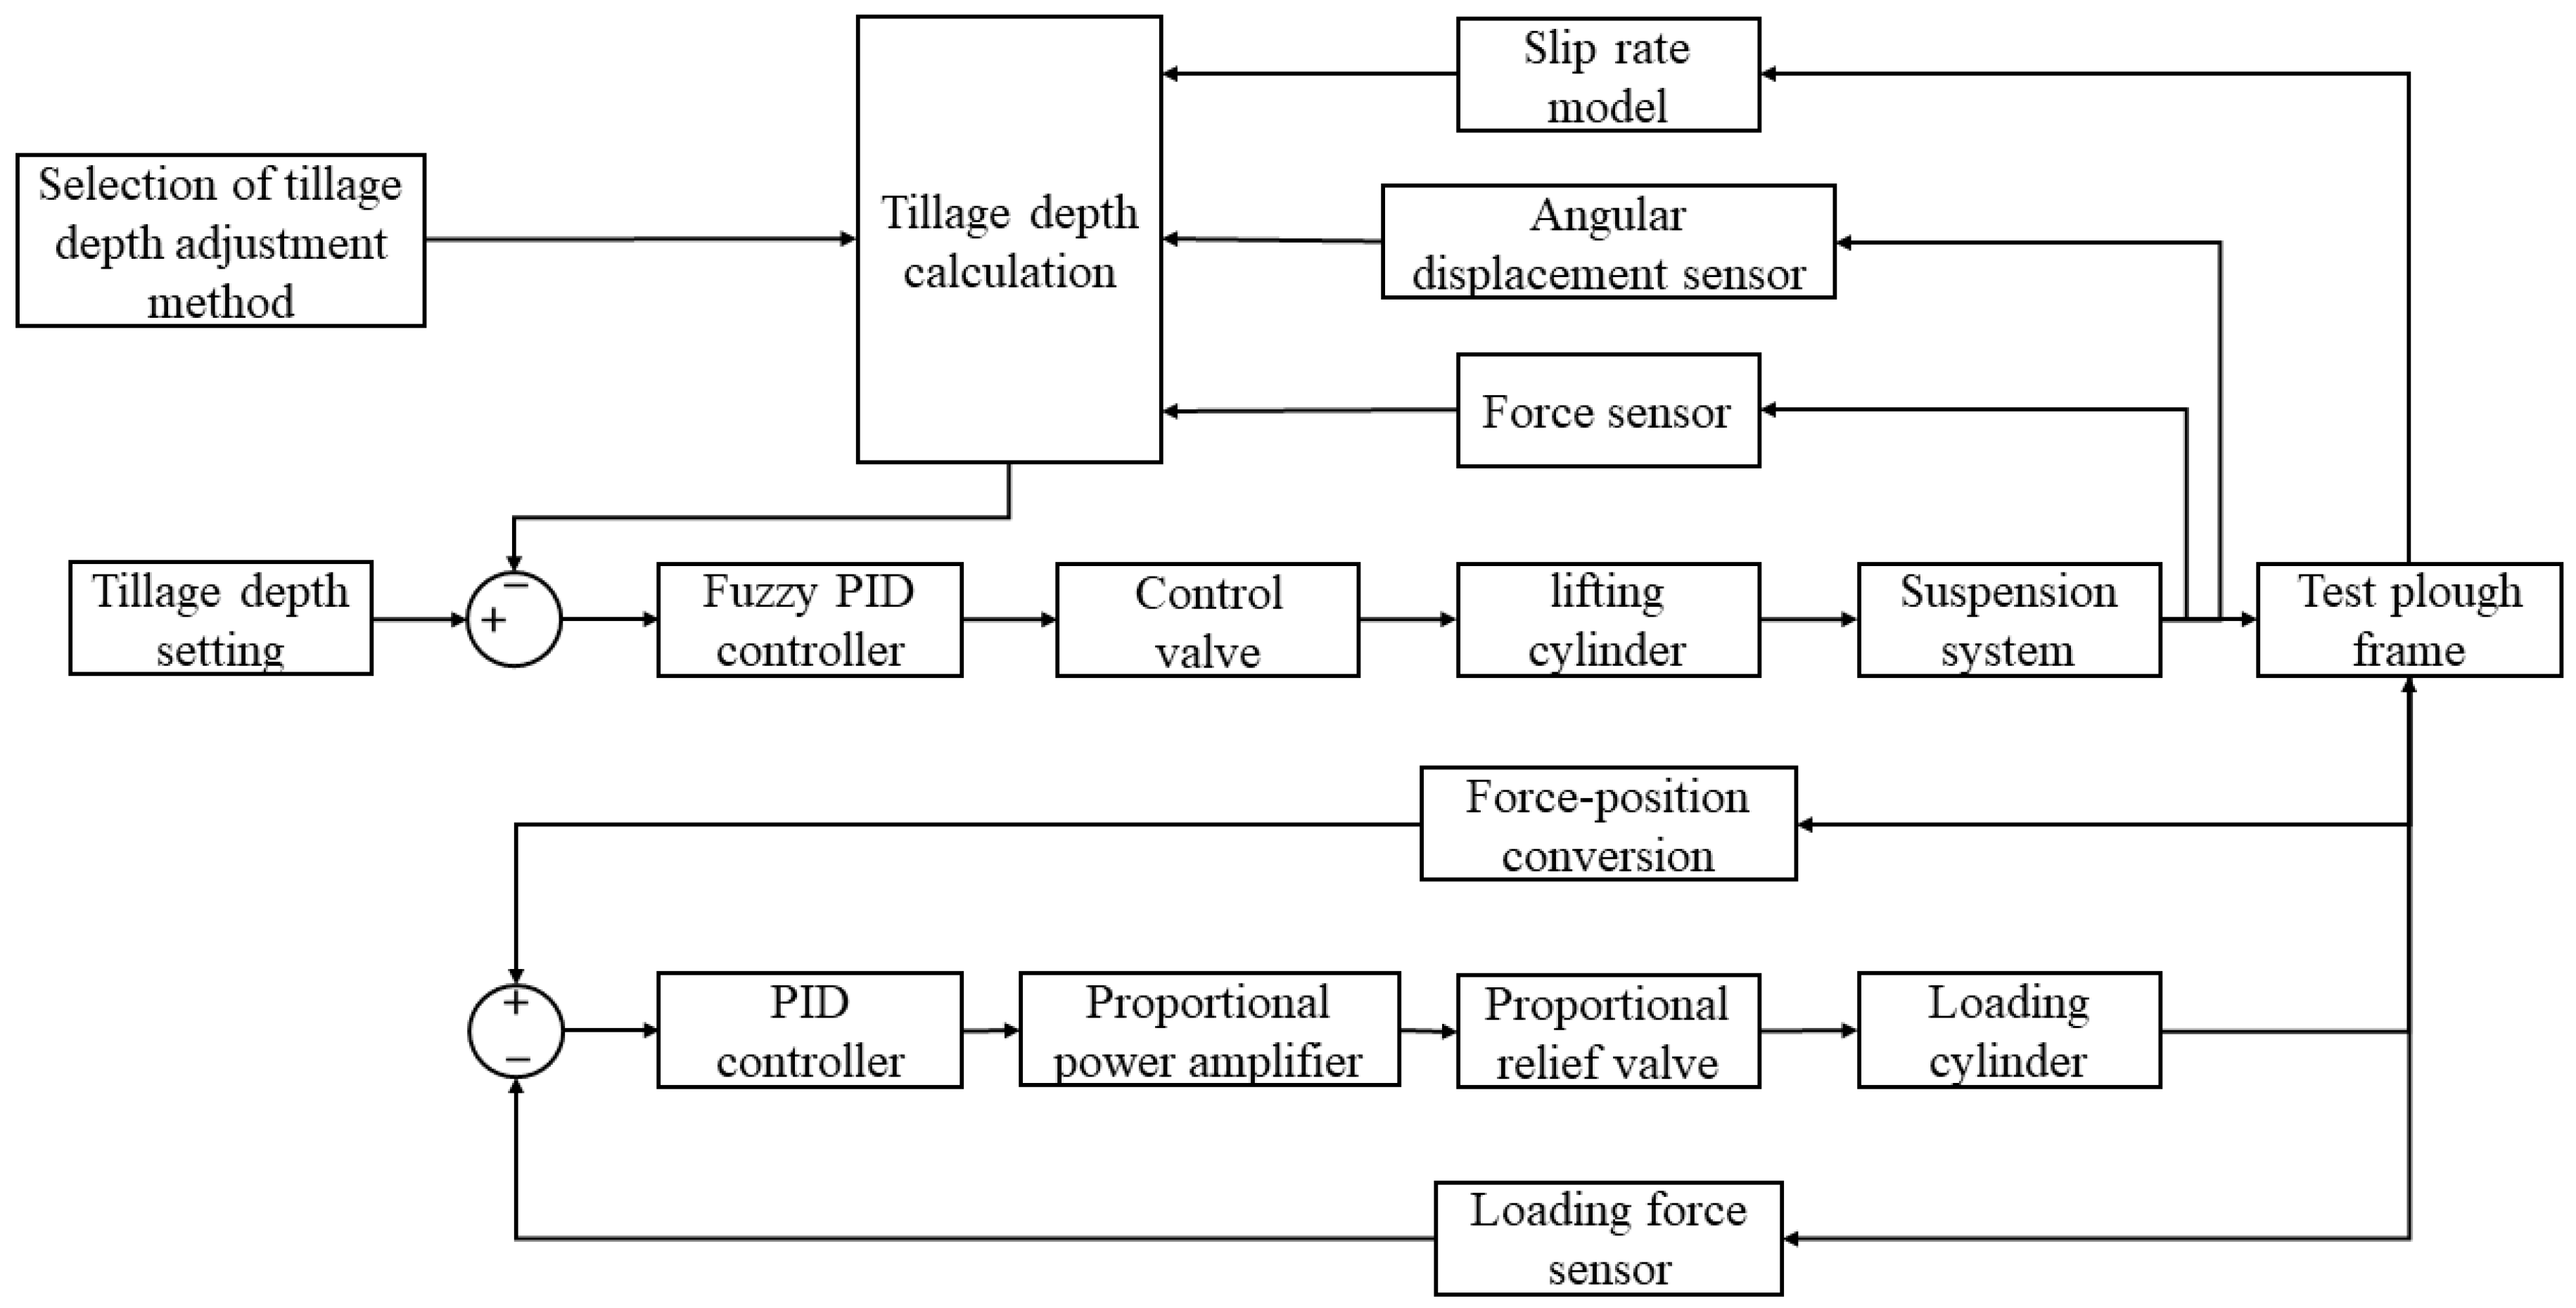
2.4.3. Suspension Control System Based on Fuzzy PID

In order for the measurement and control system to control the tillage depth during the operation of the test bench, a test-bench suspension-control system based on fuzzy PID was designed. The block diagram of the suspension-control system is shown in Figure 9. When the test bench is working, the target tillage depth is set through the human–computer interaction interface, and the corresponding tillage-depth adjustment method is selected. On the one hand, based on the selected tillage-depth adjustment method, the controller calculates the tillage-depth control amount according to the input target value and the feedback signal of the angular displacement sensor, the force sensor and the slip rate model, so as to drive the flow of the tillage-depth control valve to control the system flow, thus promoting the lifting cylinder to realize the control of the tillage depth. On the other hand, the actual tillage depth obtained by the angular displacement sensor is fed back to the loading-control system to calculate the target loading force. The loading-control system changes the size of the loading force in real time according to the change in the tillage depth and realizes the simulation of the working resistance during the operation.
The fuzzy controller adopts the structure of double input and three output. The input was the deviation and the rate of deviation change, and the output was the correction of the three parameters of proportion, integral and differential. According to the characteristics of the tractor electro-hydraulic-suspension tillage-depth control system studied, the basic domain values of each parameter were determined. The error of tillage depth E was [−25, 25], and the error change rate EC was [−6000, 6000]. The proportional correction K P was [−50, 50], the integral correction K I was [−10, 10], and the differential correction K D was [−1, 1]. The domain was discretized, and the discrete domain was set to {−3, −2, −1, 0, 1, 2, 3}. The quantization factor and scale factor were calculated as follows: k E = 0.12 , k E C = 0.0005 , k K P = 0.06 , k K I = 0.3 , k K D = 3 .

3. Results

According to the design scheme of the test bench, the tractor electro-hydraulic-suspension and loading test bench was built. The specific components are shown in Figure 10 and the main performance parameters of the test bench are shown in Table 4. In order to verify the actual effect of the test bench, a performance test of the test bench was carried out.

3.1. Calibration Test

Before the performance test of the bench, preliminary experiments were required, mainly including the calibration of relevant sensors and hydraulic actuators and components, so as to ensure the accuracy and reliability of the test bench results.

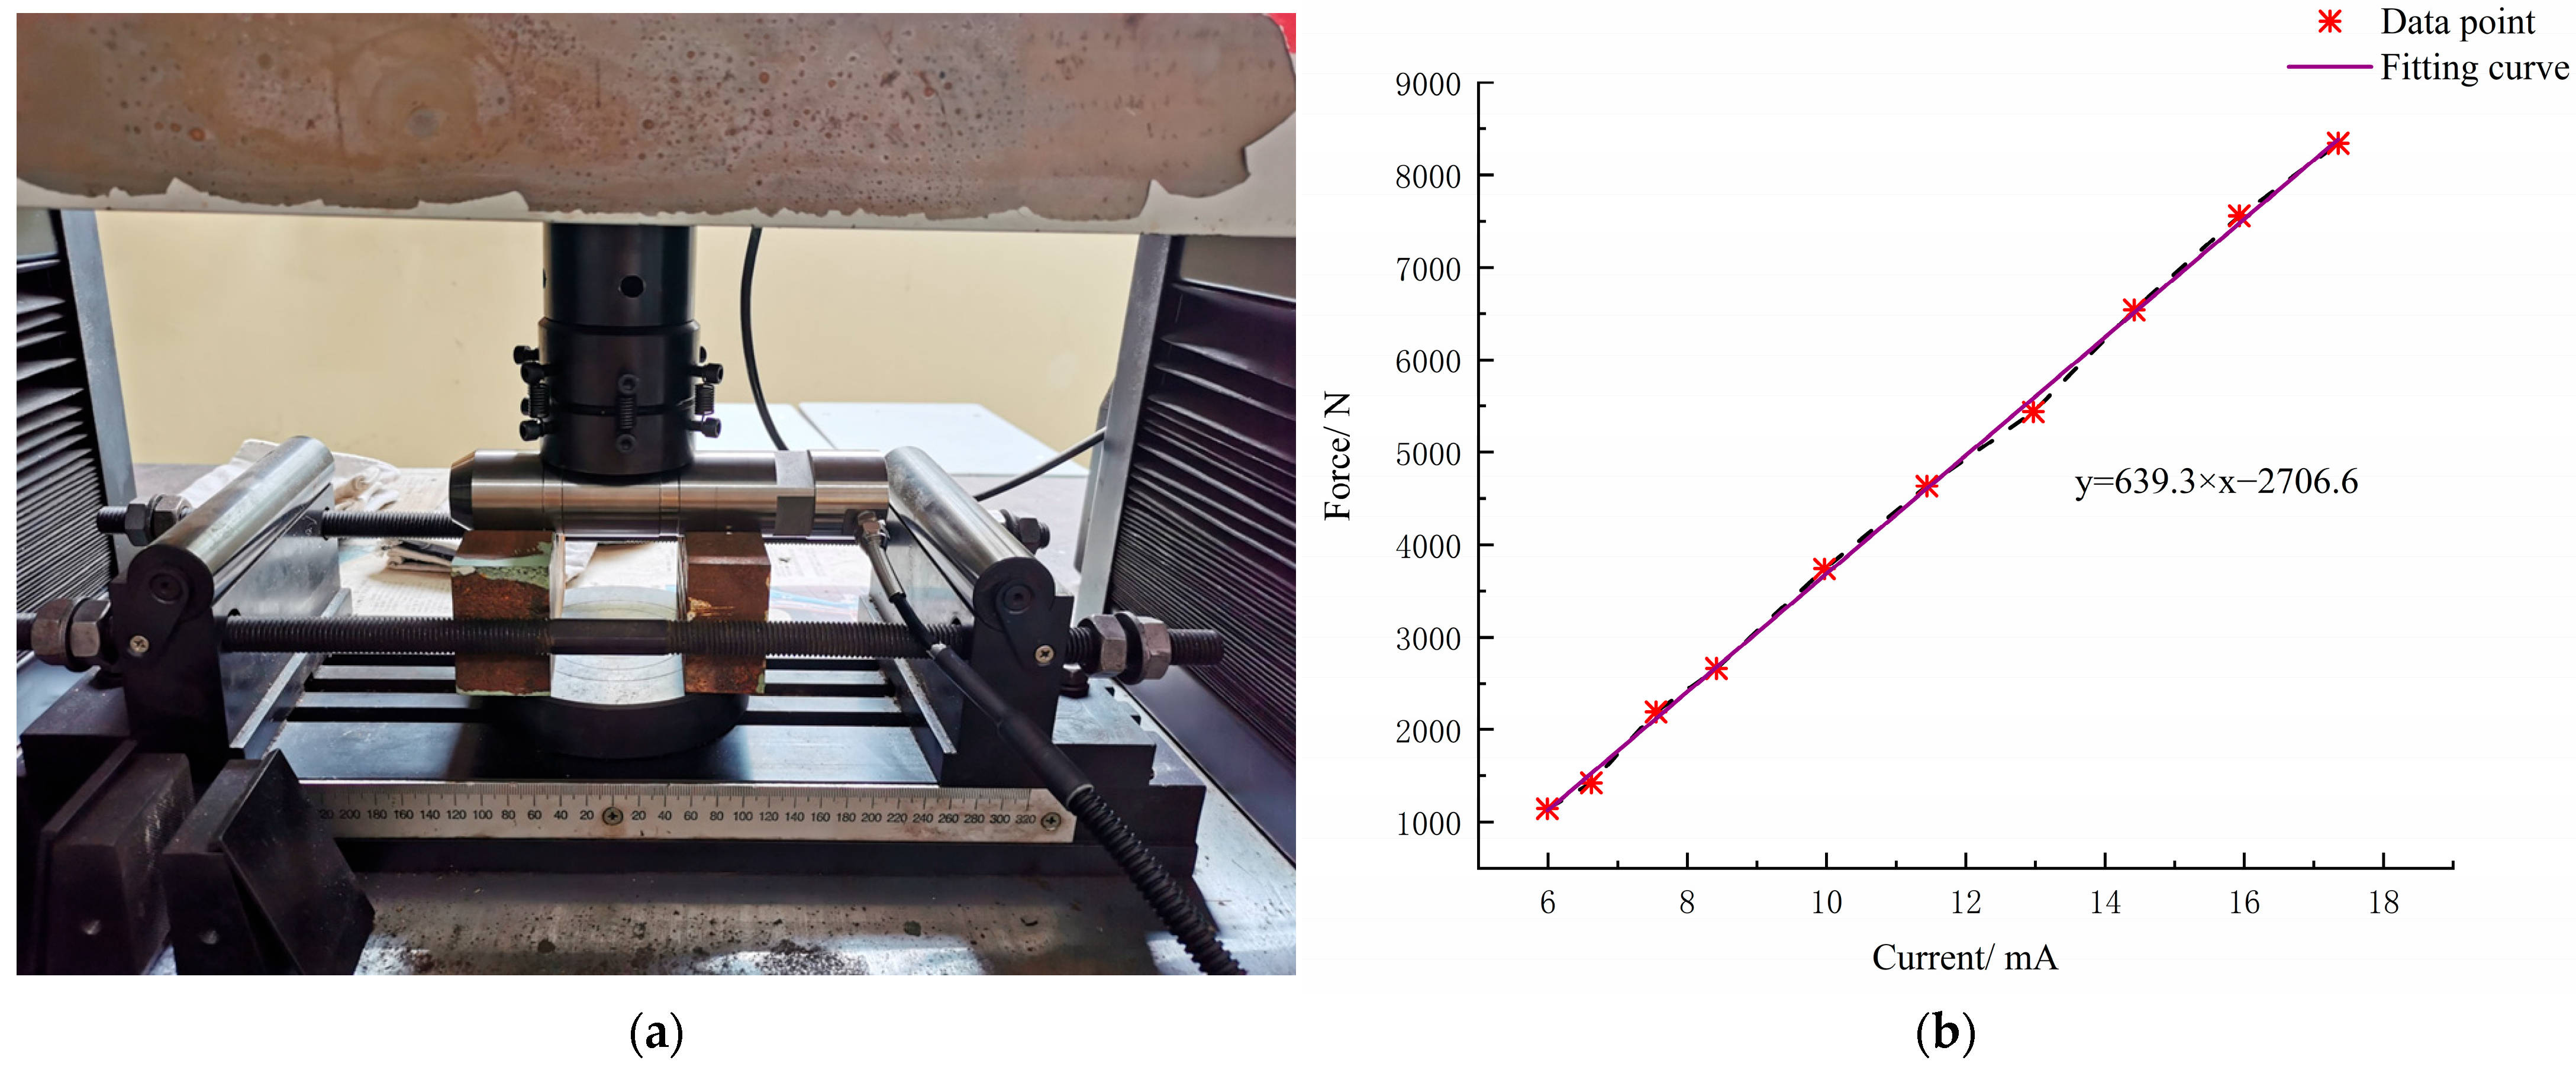
3.1.1. Calibration Test of Force Sensor

The force sensor was used to sense the ploughed-soil resistance signal in the suspension control system and the loading resistance signal in the loading-control system. These signals were used as feedback signals for closed-loop control. In order to achieve the precise control of the system, the force sensor needs to be calibrated. The test bench selects the force sensor with a range of 0~25 kN and an output of 4~20 mA standard industrial current signal. The force sensor was calibrated under the tension and pressure test bench of Nanjing Agricultural University, and the calibration site is as shown in Figure 11a. The output current of the sensor under different force sources was recorded, and the relationship between the output current of the sensor and the force was obtained by fitting, as shown in Figure 11b.

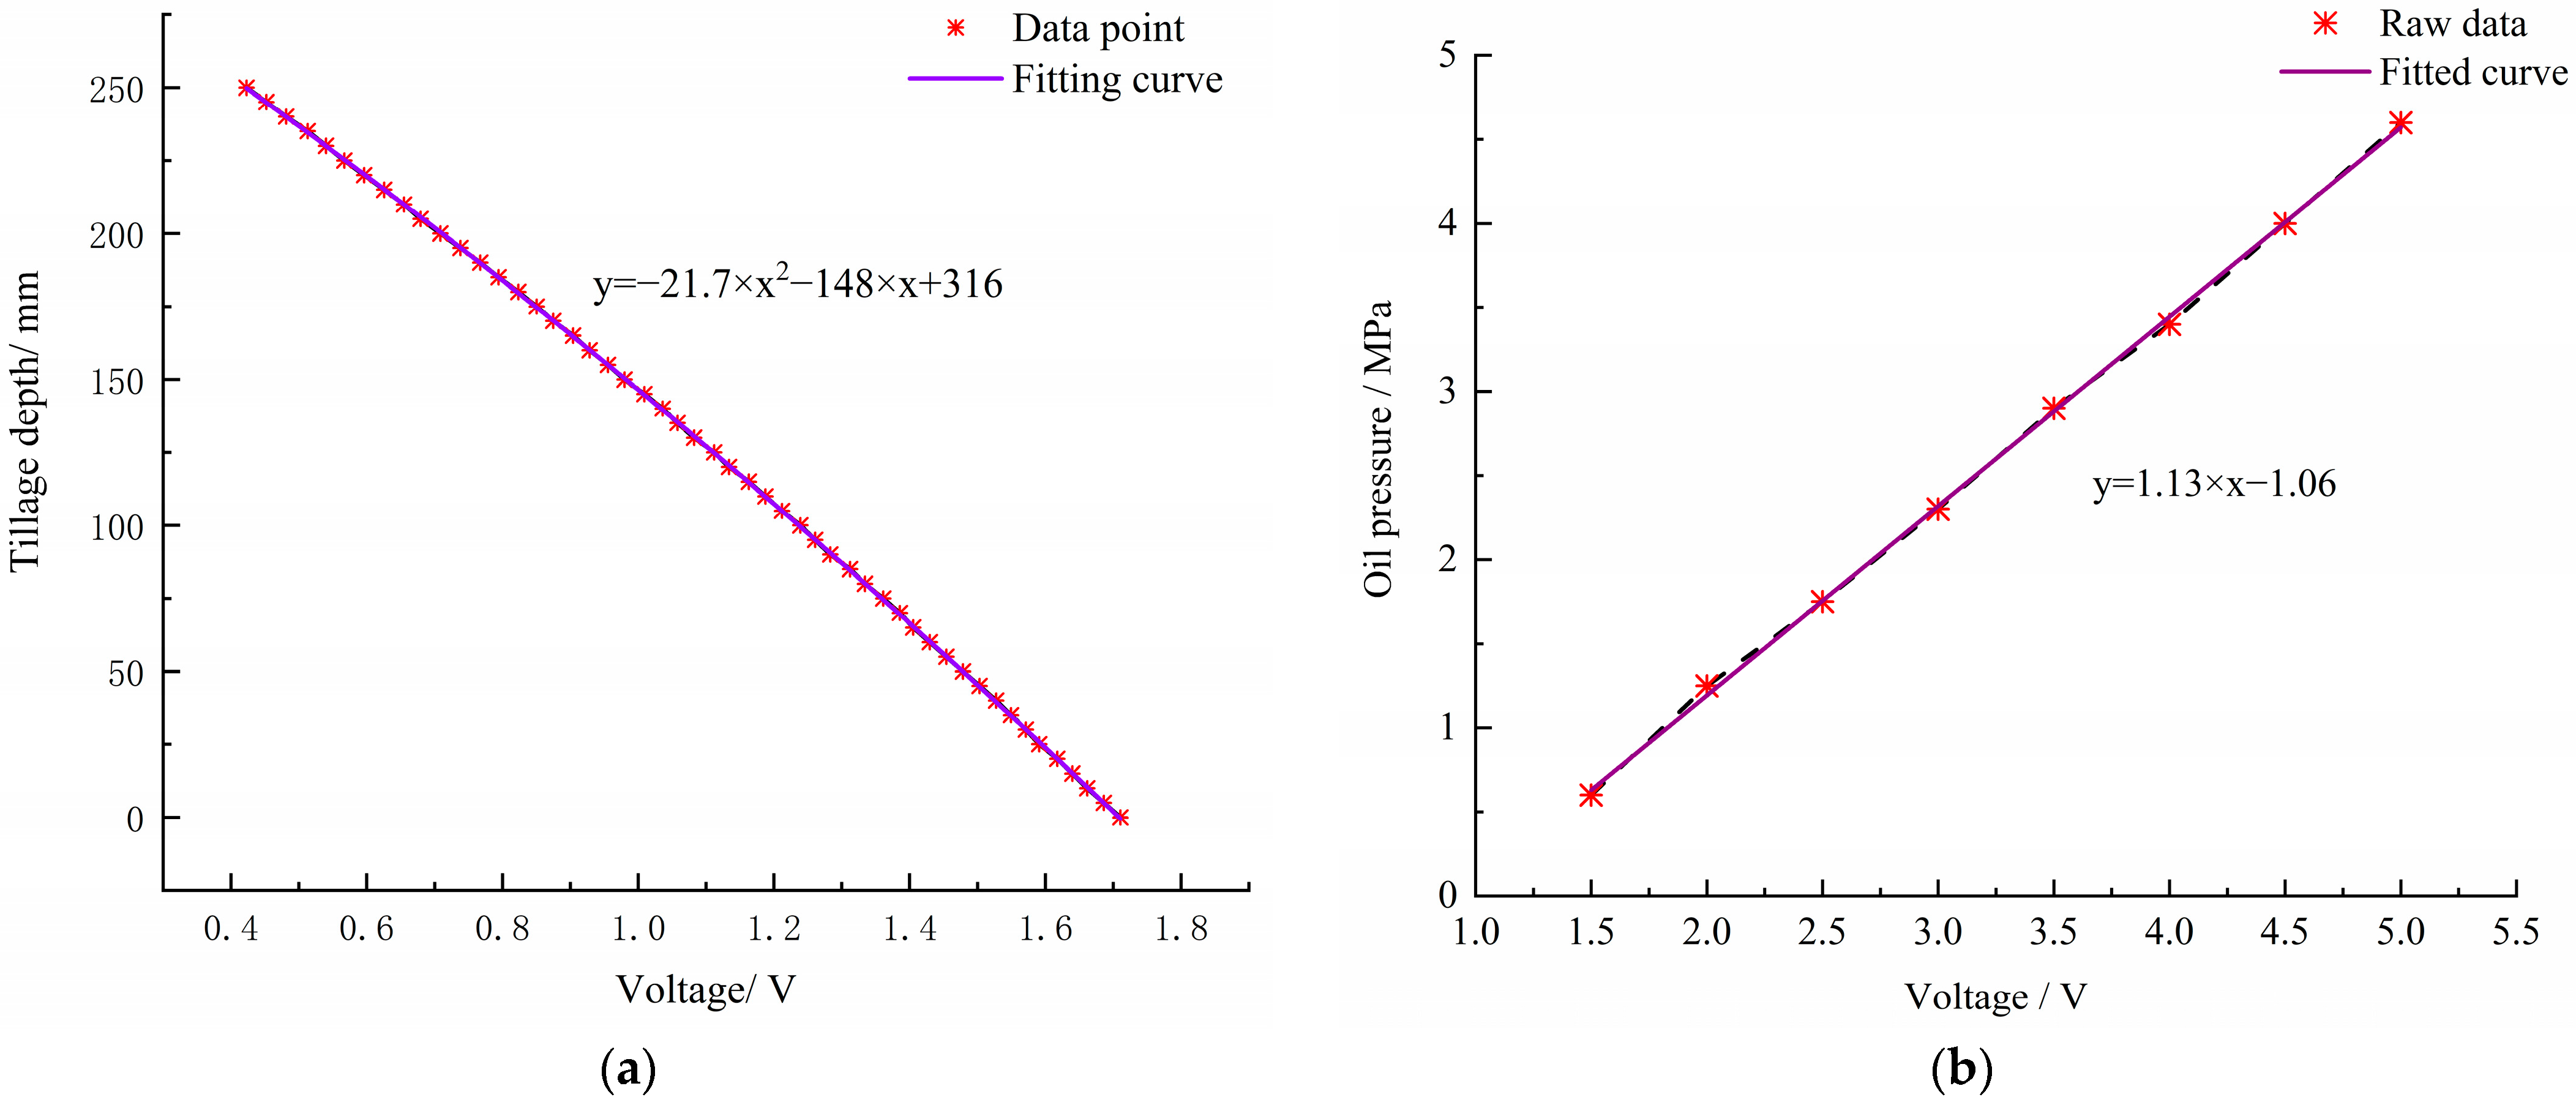
3.1.2. Calibration Test of Angular Displacement Sensor

In the actual operation process, it is difficult to measure the tillage depth of farm tools directly, so the indirect measurement method was adopted. The test bench feeds back the tillage-depth signal through the angular displacement sensor installed at the lifting arm position. Therefore, it is necessary to calibrate the relationship between the measured value of the angular displacement sensor and the actual tillage depth. When calibrating, the position of the lower limit of the lifting arm was taken as the starting point, corresponding to the position of the deepest tillage depth; with 3 mm tillage depth as the interval, the experiment was repeated many times, and the output voltage of the sensor at different positions was recorded. The result is shown in Figure 12a.

3.1.3. Calibration Test of Electromagnetic Proportional Relief Valve

The experimental platform adopts the electromagnetic proportional relief valve to adjust the oil pressure of the hydraulic system, and the supporting amplifier is its driving device. The electromagnetic proportional relief valve in the working process of the test bench was calibrated by differential input. By inputting 0~10 V voltage input to the amplifier, a current of 100 mA~800 mA is generated to drive the electromagnetic proportional relief valve. The input voltage of the amplifier and the output pressure of the relief valve are measured, and the fitting curve is shown in Figure 12b.

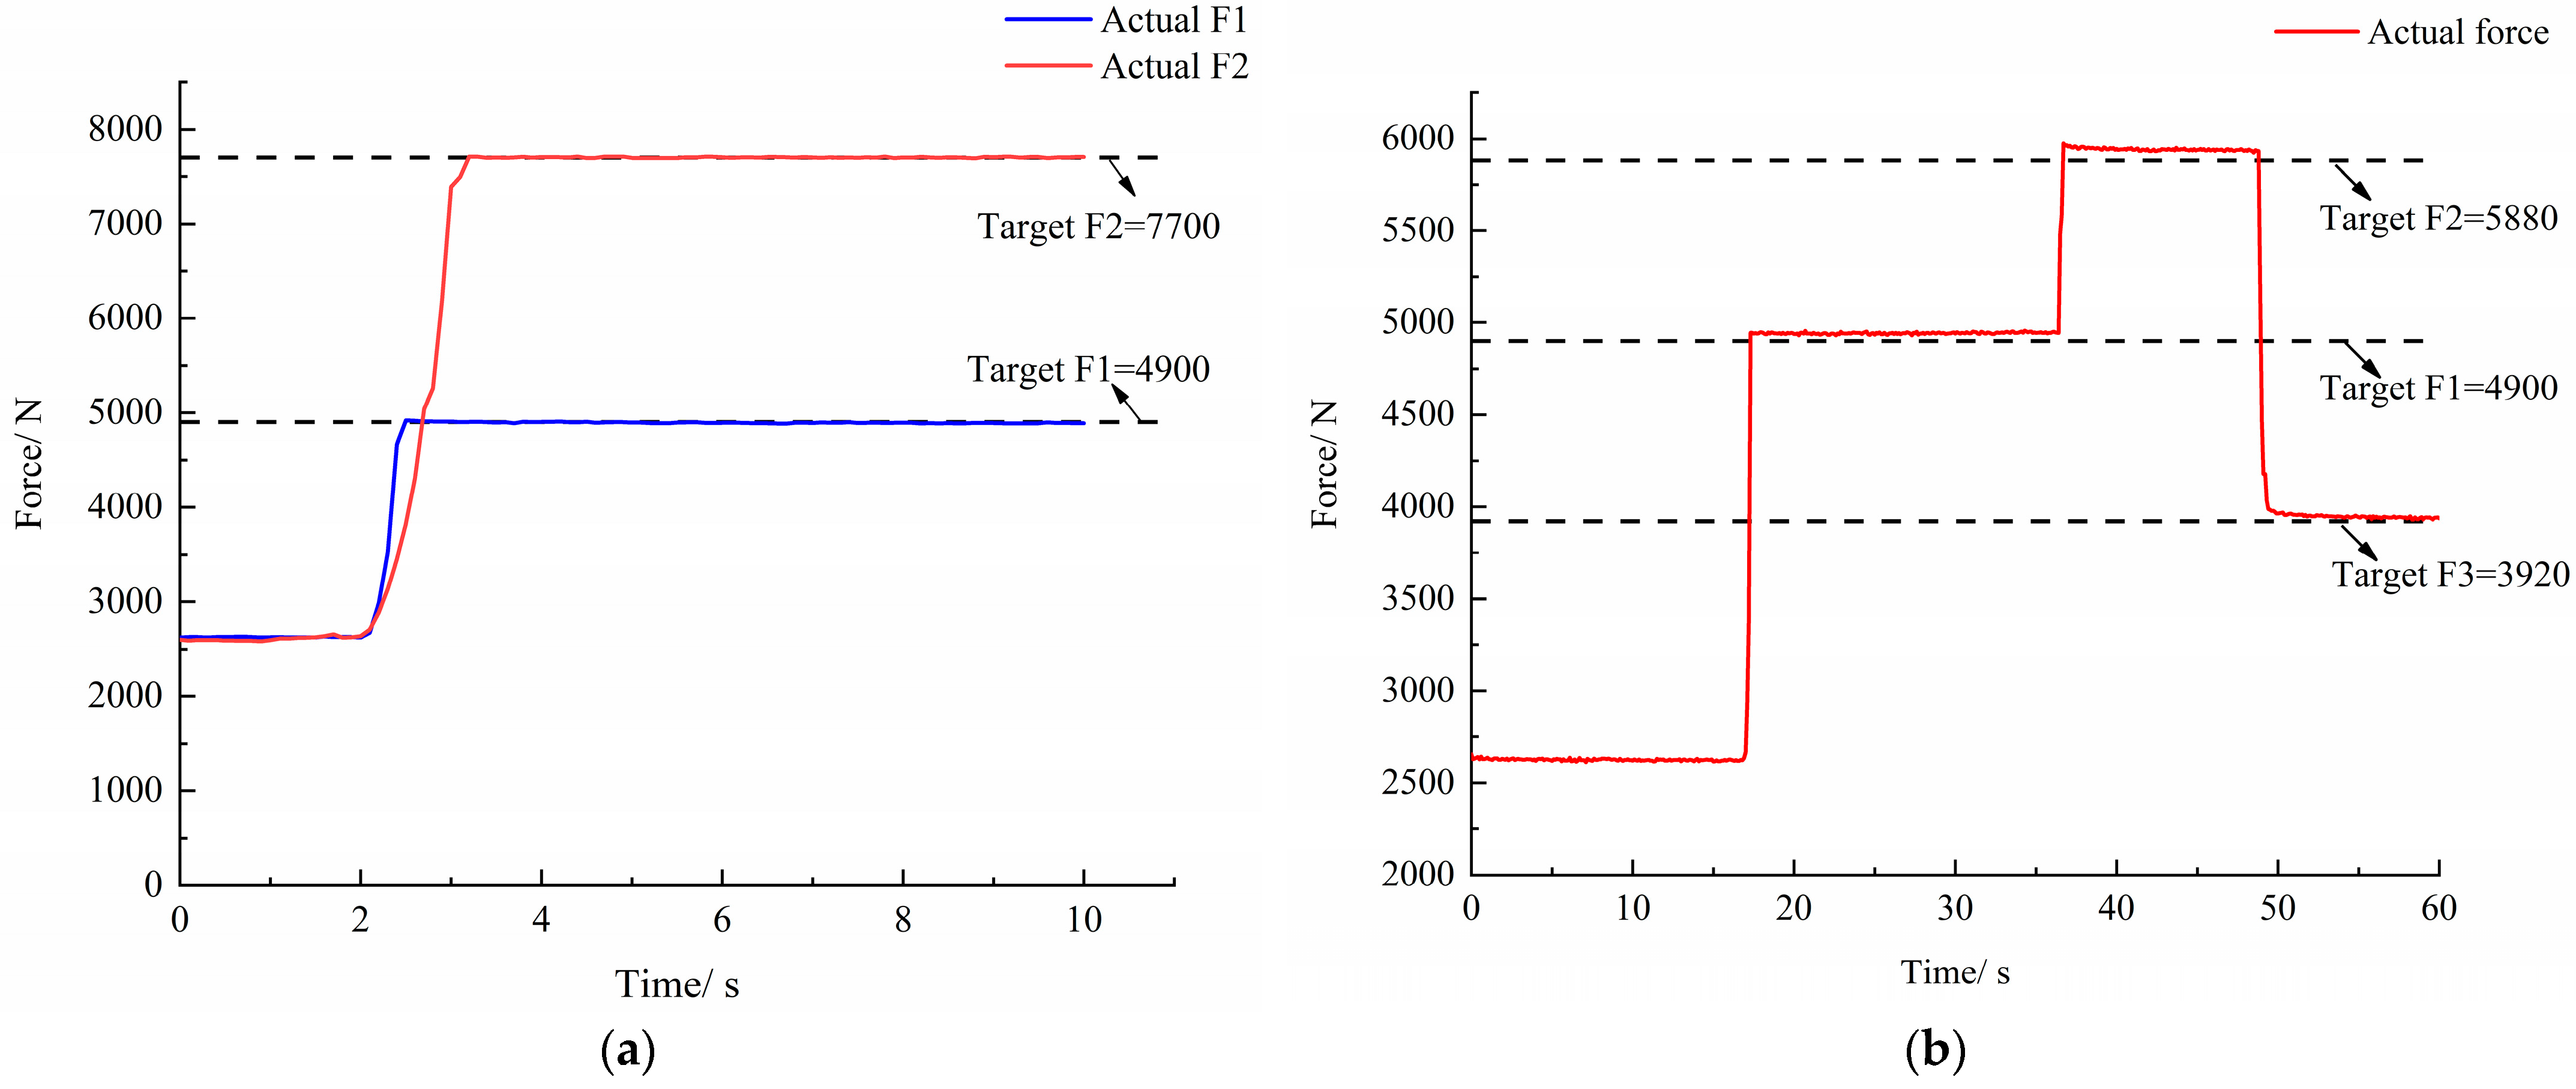
3.2. Loading-Control Test

In order to simulate the soil resistance during the operation of the tractor, to be closer to the actual working process of the tractor suspension system, the loading system of the test bench needs to realize different forms of loading force output. The bench test of the loading system was given two kinds of target signals: constant and step, and the actual response signals under different signals were analyzed.
Constant-resistance loading is mainly used to simulate the force of the plough body when the tractor works at a constant tillage depth. The constant-resistance loading target used in this bench loading test corresponds to the target tillage depth of 100 mm. Two different soil conditions with soil-specific resistance of 3.5 N/cm−2 and 5.5 N/cm−2 were simulated, and the corresponding target resistance of the plough was 4900 N and 7700 N. The experimental results are shown in Figure 13a. It can be seen from Figure 13a that there was an initial loading force of 2600 N after opening the system, which is due to the back pressure of 0.8 MPa in the oil circuit of the system. When the electro-hydraulic suspension system was loaded with constant resistance, the adjustment time from the oil circuit opening to the realization of the loading target was less than 1.2 s, and the steady-state error was less than 1%.
In order to simulate the force change in the plough body when the tillage depth changes during the operation, the step-signal loading test was carried out. We set the target tillage depth from 100 mm to 120 mm, and then from 120 mm to 80 mm, and the soil-specific resistance remained constant at 3.5 N/cm−2. At this time, the corresponding target loading force steps from 4900 N to 5880 N, and then from 5880 N to 3920 N. The experimental results are shown in Figure 13b. It can be seen from Figure 13b that when the target loading force changes step by step, the system adjustment time is less than 1 s, and the steady-state error is less than 1%. In summary, the loading system has high accuracy, good system responsiveness, and stability. It can meet the test requirements of tractor electro-hydraulic-suspension system loading.

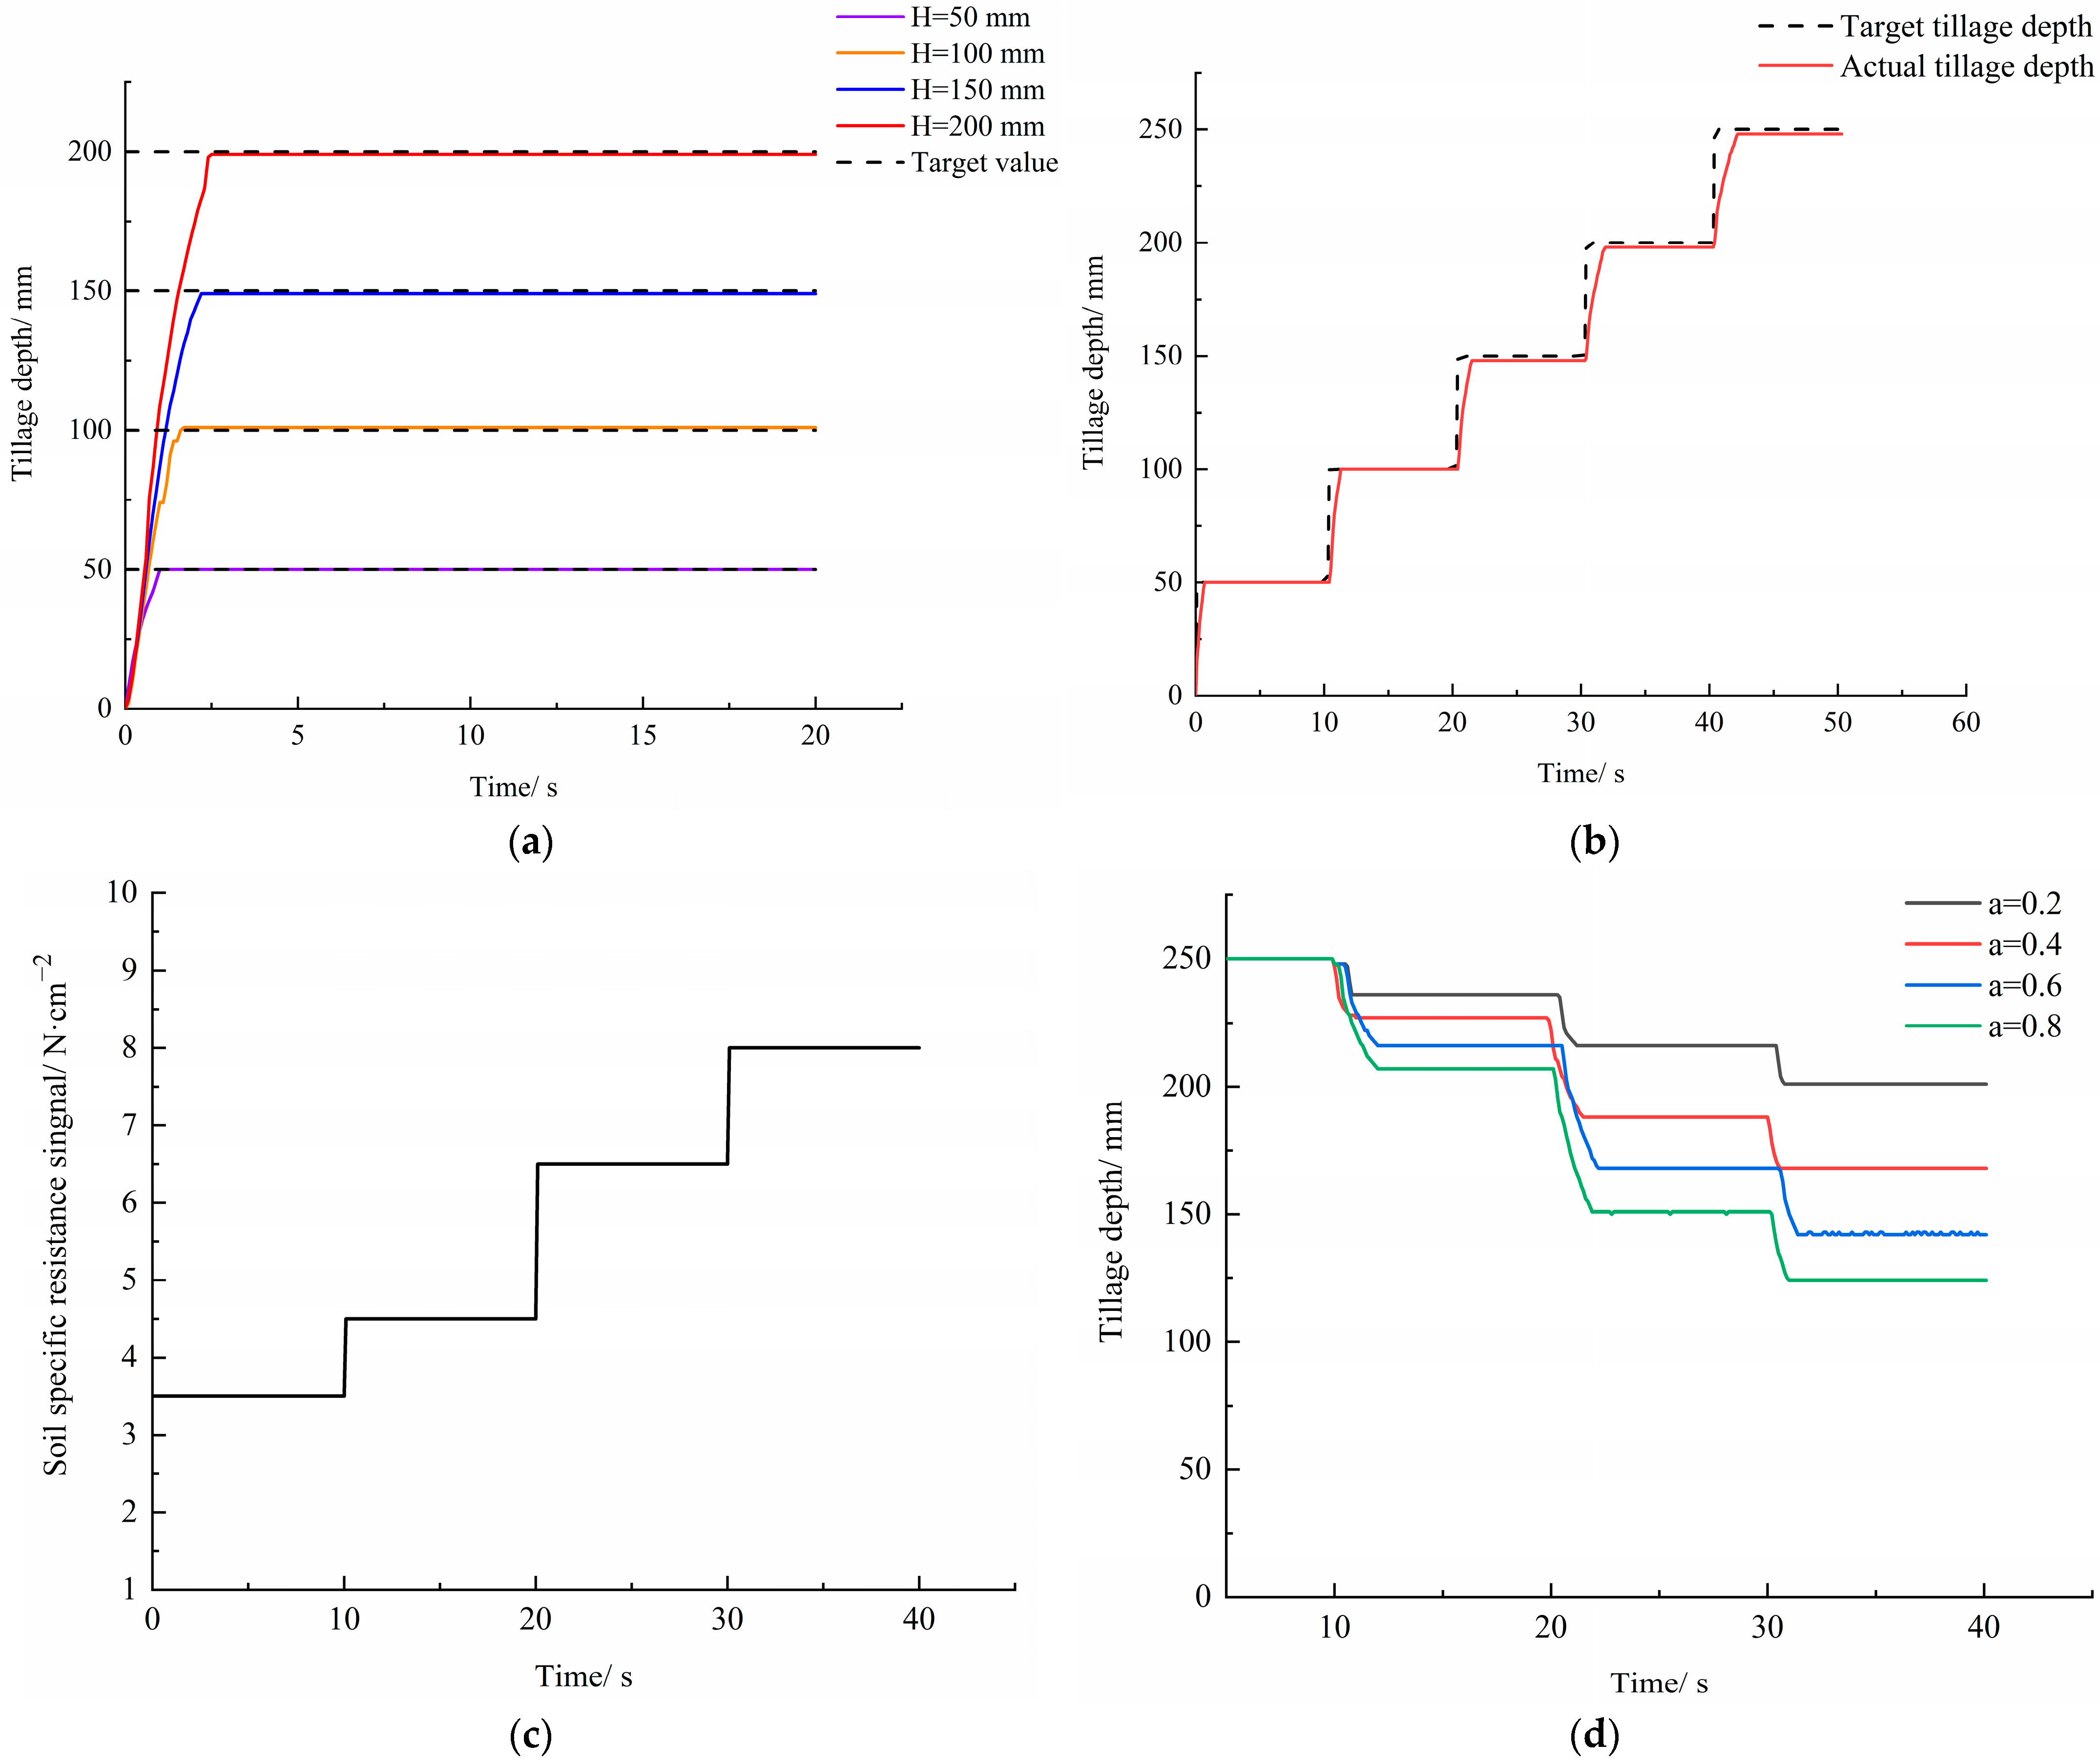
3.3. Tillage-Depth Control Test

In order to verify the performance of the tillage-depth control system of the test bench, two different control modes—position control and draft-position integrated control—were tested, respectively. In the position control test, a fixed-target position control test with target tillage depths of 50 mm, 100 mm, 150 mm and 200 mm and a variable-target tillage-depth control test with intervals of 50 mm and steps to 250 mm were carried out, respectively. The experimental results are shown in Figure 14. It can be seen from Figure 14a,b that when the fixed-target tillage-depth control was carried out, the system response time was less than 2.3 s, and the steady-state error was less than 1%. When the target tillage depth changed step by step, the response time of the system to the next target tillage depth was less than 1.8 s. In the draft-position integrated tillage-depth control test, the target value of tillage depth was set to 250 mm; the soil-specific resistance change is shown in Figure 14c, and the force adjustment weight coefficients were set to 0.8, 0.6, 0.4, and 0.2, respectively. Regarding when the soil conditions change, the results of the comprehensive control test under different weight coefficients are shown in Figure 14d. When the soil conditions changed, the response time of tillage-depth adjustment was less than 1.7 s, and the stability error of tillage depth was less than 1%. With the increase in soil-specific resistance, the difference between the actual tillage depth obtained under the comprehensive adjustment of force and position and the set target tillage depth was also increased. Under the influence of the same resistance, the change in tillage depth was determined by the weight coefficient. The greater the weight coefficient of force adjustment, the greater the change in tillage depth. The smaller the weight coefficient of force adjustment, the smaller the change in tillage depth.

4. Conclusions

In this paper, a complete tractor hydraulic-suspension tillage-depth and loading-control test bench was designed. The system was mainly composed of three parts: an industrial computer, a suspension electro-hydraulic control system, and a loading electro-hydraulic control and data-acquisition system. The system can control the suspension tillage depth and loading force of a tractor electro-hydraulic suspension system.
The measurement and control system of a tractor electro-hydraulic-suspension tillage-depth and loading-control test bench was developed, and the human–computer interaction interface of the measurement and control system was built. This can realize the adjustment of the target signal during the operation of the test bench, as well as the acquisition, display and data preservation of the relevant sensor signals, and it has good operability.
Loading-control and tillage-depth control tests were carried out on the test bench. The test results showed that the loading system can realize the fixed-target loading and variable-target loading of the plough body. The system response time was less than 1.2 s, and the maximum steady-state error was less than 0.8%. The suspension control system can realize the fixed-target position control, variable-target position control, and force position comprehensive control of tillage depth. The system response time was less than 2.3 s, and the maximum steady-state error was less than 1%. The system has good responsiveness and stability and can meet the working requirements of the tractor electro-hydraulic-suspension system.

Author Contributions

Conceptualization, X.S., Z.L. and T.W.; writing—original draft preparation, X.S.; writing—review and editing, X.S., Y.S., Y.W. and J.Q.; English language and style, X.S. All authors have read and agreed to the published version of the manuscript.

Funding

This research was funded by the National Key Research and Development Plan of China (Grant No. 2022YFD2001202) and Postgraduate Research and Practice Innovation Program of Jiangsu Province, China (Grant No. KYCX22_0716).

Institutional Review Board Statement

Not applicable.

Informed Consent Statement

Not applicable.

Data Availability Statement

Not applicable.

Acknowledgments

The authors would like to thank all teachers and students for their invaluable support.

Conflicts of Interest

The authors declare no conflict of interest.

References

  1. Sun, X.X.; Lu, Z.X.; Song, Y.; Cheng, Z.; Jiang, C.X.; Qian, J.; Lu, Y. Development Status and Research Progress of a Tractor Electro-Hydraulic Hitch System. Agriculture 2022, 12, 1547. [Google Scholar] [CrossRef]
  2. Xu, J.; Li, R.; Li, Y.; Zhang, Y.; Sun, H.; Ding, X.; Ma, Y. Research on Variable-Universe Fuzzy Control Technology of an Electro-Hydraulic Hitch System. Processes 2021, 9, 1920. [Google Scholar] [CrossRef]
  3. Wang, L.; Wang, Y.; Dai, D.; Wang, X.; Wang, S.M. Review of Electro-hydraulic Hitch System Control Method of Automated Tractors. Int. J. Agric. Biol. Eng. 2021, 14, 1–11. [Google Scholar] [CrossRef]
  4. Wang, L.; Zong, J.H.; Wang, Y.; Fu, L.L.; Mao, X.; Wang, S.M. Compilation and Bench Test of Traction Force Load Spectrum of Tractor Three-point Hitch Based on Optimal Distribution Fitting. Trans. CSAE 2022, 38, 41–49. [Google Scholar]
  5. Tao, Q.W.; Yan, X.H.; Tong, Y.K.; Yan, Y.X.; Xu, L.Y. Current Status and Prospect of Tractor Indoor Bench Test Technology. J. Chin. Agric. Mech. 2021, 42, 121–128. [Google Scholar]
  6. Xu, L.Y.; Zhao, Y.R.; Zhao, X.P.; Liu, M.L.; Ni, Q. Design and Test of Multifunctional Test System for Electric Tractor. Trans. Chin. Soc. Agric. Mach. 2020, 51, 355–363. [Google Scholar]
  7. Li, Q.H. Study on the Electrohydraulic Force-Loading System for the Indoor Simulation of Tractor-Implement Work Unit. Master’s Thesis, China Agriculture University, Beijing, China, 2000. [Google Scholar]
  8. Anche, G.M.; Devika, K.B.; Subramanian, S.C. Robust Pitching Disturbance Force Attenuation for Tractor Considering Functional Constraints. IEEE Access 2020, 8, 86419–86432. [Google Scholar] [CrossRef]
  9. Shen, W.; Wang, J.H.; Huang, H.L.; He, J.Y. Fuzzy Sliding Mode Control with State Estimation for Velocity Control System of Hydraulic Cylinder Using a New Hydraulic Transformer. Eur. J. Control 2019, 48, 104–114. [Google Scholar] [CrossRef]
  10. Zhu, C.Y. Development of Tractor Hydraulic Suspension Test Bench. Master’s Thesis, Jiangsu University, Zhenjiang, China, 2014. [Google Scholar]
  11. Shang, G.G.; Gu, X.; Zhu, C.Y. Research on Hydraulic Hitch Test Bench of Tractor. Eur. J. Control 2015, 34, 162–166. [Google Scholar]
  12. Cong, Q.; Ma, B.S.; Li, K.; Chen, T.K.; Gou, R.R.; Yang, Q.W. Design and Simulation Analysis of Tractor Hydraulic Hitch Detection Loading Test Stand. Chin. Hydraul. Pneum. 2020, 8, 1–16. [Google Scholar]
  13. Li, W.M. Design and Study on Electro-Hydraulic Loading System of Tractor’s Hitch Test-Bed. Master’s Thesis, Nanjing Agriculture University, Nanjing, China, 2014. [Google Scholar]
  14. Zhu, Z.X.; Chen, Y.M.; Zhai, Z.Q.; Zhu, S.H.; Mao, E.R. Design of The Profiling Test-bed for Tractor Loading in Hills. J. China Agric. Univ. 2022, 27, 173–185. [Google Scholar]
  15. Tan, Y.; Xie, B.; E, Z.M. Study of Hydraulic Hitch System Controlling Technology for Tractor Working Units. J. China Agric. Univ. 2002, 7, 64–67. [Google Scholar]
  16. Tan, Y.; Li, Q.H.; Xie, B.; E, Z.M. Study on an Electrohydraulic Loading System for Indoor Experiment Bench of Tractor Working Units. J. China Agric. Univ. 2001, 6, 67–70. [Google Scholar]
  17. Han, J.; Yan, X.; Tang, H. Method of Controlling Tillage Depth for Agricultural Tractors Considering Engine Load Characteristics. Biosyst. Eng. 2023, 227, 95–106. [Google Scholar] [CrossRef]
  18. Zong, J.H.; Wang, L.; Lv, D.X.; Zhang, Q.; Wang, D.M. Research and Test of Tractor’s Three-point Suspension Electro-hydraulic Loading System. J. Agric. Mech. Res. 2024, 46, 242–248. [Google Scholar]
  19. Ding, W.M. Agricultural Machinery; China Agricultural Press: Beijing, China, 2011. [Google Scholar]
  20. Vincent, M.; Guillaume, M.; Thibault, D.; Vincent, A.; Jeremy, V. Model Learning of the Tire–road Friction Slip Dependency under Standard Driving Conditions. Control Eng. Pract. 2022, 121, 105048. [Google Scholar]
  21. Ying, X.D.; Lu, Z.X. Simulation Research on Acceleration Slip Regulation System for Four-Wheel Drive Tractor Using Fuzzy Control Method. Agric. Equip. Veh. Eng. 2010, 12, 6–10. [Google Scholar]
  22. Liu, Z.X.; Zhang, D.W.; Li, Y.D. Research on Acceleration Slip Regulation System for Four-wheel Drive Vehicle Using Fuzzy Control Method. Trans. Chin. Soc. Agric. Mach. 2005, 12, 21–24. [Google Scholar]
Figure 1. Force analysis of plough body.
Agriculture 13 01884 g001
Figure 2. Overall structure diagram of the test bench.
Agriculture 13 01884 g002
Figure 3. Hardware composition of measurement and control system.
Agriculture 13 01884 g003
Figure 4. The pin definition of the EPEC3610 controller and USB3136A data-acquisition card. (a) EPEC3610 controller; (b) USB3136A data-acquisition card.
Agriculture 13 01884 g004
Figure 5. Hydraulic system diagram. (a) Suspension hydraulic system; (b) Loading hydraulic system. The hydraulic components represented by the serial number.
Agriculture 13 01884 g005
Figure 6. The software design schematics of test bench.
Agriculture 13 01884 g006
Figure 7. Measurement and control system operation panel. (a) Performance control interface; (b) Performance monitoring interface.
Agriculture 13 01884 g007
Figure 8. The block diagram of the loading-control system.
Agriculture 13 01884 g008
Figure 9. The block diagram of the suspension control system.
Agriculture 13 01884 g009
Figure 10. Test-bench physical map. (a) Integral structure; (b) Control cabinet; (c) Machine construction; (d) Hydraulic system.
Agriculture 13 01884 g010
Figure 11. Calibration test of force sensor. (a) Test site; (b) Test result.
Agriculture 13 01884 g011
Figure 12. Calibration results. (a) The results of angular displacement sensor; (b) The results of electromagnetic proportional relief valve.
Agriculture 13 01884 g012
Figure 13. The results of loading-control test. (a) Fixed target; (b) Variable target.
Agriculture 13 01884 g013
Figure 14. The results of tillage-depth control test. (a) Position control of fixed target; (b) Position control of variable target; (c) Soil-specific resistance; (d) Draft-position integrated control.
Agriculture 13 01884 g014
Table 1. Suspension hydraulic system hydraulic-component model.
NumberNameModelKey Parameter
1High-pressure ball valveCJZQ-H10LNominal pressure32 MPa
2, 4, 5Pressure sensorJP801Measuring range0–16 Mpa
3AccumulatorNXQA-L0.4/20L-ANominal pressure20 MPa
6SwitchCS-7002s
7Pressure gaugeYN60-IIIMeasuring range0–20 Mpa
8Suction filterWF-4BFiltering precision100 um
9Oil pump
electrical machine
CBN-E316Delivery capacity16 mL/r
Rated speed2000 r/min
10Check valveYP2-112M-4Power4 kW
11FilterCVT-04Opening pressure60 L/min
12High-pressure ball valveZUI-H40X5DFBPFiltering precision5 um
13Proportional relief valveDBEM10-30B/100Working pressure10 Mpa
14Lifting proportional valveSP10-20-0-N-00Flow rate68 L/min
15Check valveCV10-20-0-N-5Opening pressure0.03 Mpa
16DampingOR9030 Φ0.8Pore diameter0.8 mm
17Pressure-compensated valveEP10-S35T-0-N-230Spring specifications1.59 Mpa
18Overflow valveRVD58-20A-0-N-30Working pressure16 Mpa
19Throttle valveFR08-20F-0-N-M0.4Flow rate0.4 L/min
20Descending proportional valveSP10-20-0-N-00Flow rate68 L/min
21Lifting cylinderΦ100 × 200
Table 2. Sensor performance parameters.
NameModelRangeSupply VoltageOutput SignalPrecision
Force sensorJHZX-2.5t25 kN24VDC4~20 mA0.1%F·S
Pressure sensorJP80116 MPa24VDC4~20 mA0.1%F·S
Angular displacement sensorPandAuto-P303690°5VDC0–5 V0.3%F·S
Table 3. Loading hydraulic system hydraulic-component-related models.
NumberNameModelKey Parameter
1High-pressure ball valveCJZQ-H10LNominal pressure32 MPa
2, 4, 17Pressure sensorJP801Measuring range0–16 Mpa
3AccumulatorNXQA-L0.4/20L-Anominal pressure20 MPa
5Level meterYWZ-200T
6SwitchCS-7002s
7Pressure gaugeYN60-IIIMeasuring range0–20 Mpa
8Air filterEF3-40Filtering precision0.279 mm
9Suction filterWF-4BFiltering precision100 um
10Oil pump
Electrical machine
CBN-E310Delivery capacity16 mL/r
Rated speed2000 r/min
11Check valveYP2-100L1-4Power2.2 kW
12FilterCVT-04Maximum flow rate60 L/min
13Proportional relief valveZUI-H40X5DFBPFiltering precision5 um
14Safety valveDBEM10-30B/100Working pressure10 Mpa
15Magnetic exchange valveDBDH10P10/25Maximum pressure of P port63 Mpa
Maximum pressure of T port31.5 Mpa
16Oil pump
Electrical machine
4WE10FA20BWorking pressure31.5 Mpa
Flow rate100 L/min
18Check valveΦ63 × 350
Table 4. The main performance parameters of the test bench.
ParameterUnitsValue
Total dimension
(length × width × height)
mm2450 × 1200 × 1600
Matching tractor powerkW51.5~73.5
Peak tractionKN25
Maximum oil pressureMPa16
Flow rateL/min60
Adjustment range of tillage depthmm0~250
Disclaimer/Publisher’s Note: The statements, opinions and data contained in all publications are solely those of the individual author(s) and contributor(s) and not of MDPI and/or the editor(s). MDPI and/or the editor(s) disclaim responsibility for any injury to people or property resulting from any ideas, methods, instructions or products referred to in the content.

