Article

Single- and Multiple-Adulterants Determinations of Goat Milk Powder by NIR Spectroscopy Combined with Chemometric Algorithms

1
College of Quality and Technical Supervision, Hebei University, Baoding 071002, China
2
College of Mechanical and Electronic Engineering, Nanjing Forestry University, Nanjing 210037, China
3
National & Local Joint Engineering Research Center of Metrology Instrument and System, Hebei University, Baoding 071002, China
4
Hebei Key Laboratory of Energy Metering and Safety Testing Technology, Hebei University, Baoding 071002, China
*
Author to whom correspondence should be addressed.
Agriculture 2022, 12(3), 434; https://doi.org/10.3390/agriculture12030434
Submission received: 29 January 2022 / Revised: 14 March 2022 / Accepted: 16 March 2022 / Published: 21 March 2022
(This article belongs to the Special Issue Sensors Applied to Agricultural Products)

Abstract

:
In this work, we quantified goat milk powder adulteration by adding urea, melamine, and starch individually and simultaneously, with the utilization of near infrared (NIR) spectroscopy coupled with chemometrics. For single-adulterant samples, the successive projections algorithm (SPA) selected three, three, and four optimal wavelengths for urea, melamine, and starch, respectively. Models were built based on partial least squares regression (PLS) and the selected wavelengths, exhibiting good predictive ability with an R p 2 above 0.987 and an RMSEP below 0.403%. For multiple-adulterants samples, PLS2 and multivariate curve resolution alternating least squares (MCR-ALS) were adopted to build the models to quantify the three adulterants simultaneously. The PLS2 results showed adequate precision and results better than those of MCR-ALS. Except for urea, MCR-ALS models presented good predictive results for milk, melamine, and starch concentrations. MCR-ALS allowed detection of adulteration with new and unknown substitutes as well as the development of models without the need for the usage of a large data set.

Graphical Abstract

1. Introduction

Recently, goat milk powder has attracted much attention for its nutritive value, which is associated with important functional properties that promote health. It is recognized worldwide as the closest dairy product to human milk, considering the secondary structures of milk proteins, amino acid compositions, and smaller fat globules. These benefit digestibility and help reduce the risk of allergies for consumers [1,2]. Worldwide goat milk production has increased in the last 50 years and has reached 13.5 million tons per year. Market trends suggest an increase of approximately 9.7 million tons (a growth of 53%) by 2030. Globally, goat milk production represents 1.9% of all milk production, while cow milk production is still the largest, at 83.1% [3,4,5].
Considering nutritional characteristics, production, and market supply, goat milk has a higher commercial value than cow milk. In France, generally, the average value of goat milk is four times higher than that of cow milk [5]. In such a scenario, driven by economic interests, goat milk is highly susceptible to adulteration. The current globalization trends and worldwide rapid distribution systems have enabled food fraud to produce international impacts with far-reaching and negative consequences [6]. Therefore, the detection of goat milk fraud is critical for the removal of unqualified products from the supply chain to ensure food safety and to gain consumer confidence.
Goat milk powder can be easily and simply adulterated by adding common adulterants, such as urea, melamine, and starch, into raw milk powder. The common methods used for adulterants’ detection in milk are the evaluation of physical-chemical parameters such as specific gravity, freezing point, defatted dry extract, and fat percentage [6,7]. However, these methods are time-consuming, and the outcomes are not accurate. More efficient methodologies, such as chromatographic [8], electrophoretic [9], immunoenzymatic [10], and DNA-based [11] methods, have been investigated by researchers, although there are other issues that need to be addressed, for example, laborious samples, pretreatment steps with environmental unfriendly reagents, expensive instruments, and indoor laboratory environments. Therefore, rapid and green analytical methodologies have been proposed as an alternative to the traditional methods for identification of food adulteration and other aspects of food quality.
Near infrared (NIR) spectroscopy, one of the vibrational spectroscopy methods, presents unique advantages: absence of sample pretreatment, nondestructive testing, and rapidity [12]. Due to the natural features of NIR spectroscopy data, chemometric tools are necessary to mathematically process and analyze data sets in a statistical multivariate way [13]. Many studies and applications worldwide have demonstrated that NIR spectroscopy combined with chemometric models can obtain reliable, efficient, and accurate test results to provide information about product quality in the food, chemical, and pharmaceutical industries [12,14,15]. Nevertheless, the technique has limitations at present with regard to the included interference information and the weak sensibility to minor constituents, which may be affected by the physical state of the tested samples, the variability in the matrix, and the measuring operation [16].
Qualitative and quantitative models based on NIR spectroscopy developed in different studies have been used to detect different adulterants in milk and dairy products from cows, demonstrating high predictive capacity [17,18,19]. For goat milk and its derivatives, a few studies that reported using NIR spectroscopy have focused on the adulteration by adding cow milk [20,21,22]. Other common adulterants in cow milk have not been sufficiently investigated in goat milk. Additionally, there has been relatively little research conducted on predictive models for the simultaneous determination of multiple adulterants. Given the above, we aimed to study quantitative models for common single and multiple adulterants in goat milk, employing NIR spectroscopy and chemometrics.

2. Materials and Methods

2.1. Sample Preparations

The goat milk powder (Meiling, Shaanxi Province, China; protein content: 21.0%, carbohydrate content: 42.0%, and fat content: 22.0%) used in the experiment was purchased from a local supermarket. Urea, starch, and melamine powder were obtained from Baoding Huaxin Reagent and Instrument Co., Ltd. (Baoding, China) with purity of ≥99.5%. Goat milk powder samples with a single adulterant were prepared by adding urea, melamine, and starch, separately. For the urea–milk powder mixture, urea was added at levels of 0.5, 0.8, 1, 2, 5, 8, or 10 g/100 g. For the melamine–milk powder mixture, melamine was added at 0.01, 0.05, 0.1, 0.5, 1, 5, or 10 g/100 g. For the starch—milk powder mixture, starch was added at levels of 1, 5, 10, 15, 20, 25, or 30 g/100 g. Goat milk powder samples with multiple adulterants were prepared by adding the groups of urea, melamine, and starch according to Table 1. All the mixture samples were homogeneously mixed before spectral collection.
Urea and melamine are industrial chemicals. They are added to milk powder to increase the nitrogen content, resulting in a falsely high protein content. Starch is a kind of food ingredient and additive. It is allowed to be added to some dairy products. However, excessive addition unlawfully increases the profit on the sale of the product while reducing nutritional value. According to the above, adulteration concentrations of urea and melamine were lower than those of starch in this work. Concentrations of different adulterants largely ranged from low levels to high levels, which allowed us to consider prediction results under various adulteration conditions.

2.2. Acquisition of NIR Spectra Data

A Bruker MPA FT-NIR spectrometer (Bruker Optik GmbH, Ettlingen, Germany) set to integrating sphere diffuse reflection measurement mode was employed to acquire NIR spectral data, in a range of 12,500–4000 cm−1, at a 16 cm−1 spectral resolution, and by integrating 64 scans. The samples were placed into a sample cup rotating during spectra collection. For pure goat milk powder, 20 spectra were obtained and divided randomly into a calibration set (14 spectra) and prediction set (6 spectra). The same operations for pure adulterants (3) and mixtures (3 × 7 + 7) powder were also performed. In total, 640 spectra were collected.

2.3. Pretreatment and Successive Projections Algorithm

The acquired spectra contained external disturbance, which adversely affected the extraction and analysis of target information. Initially, 5 pretreatment techniques: moving average smoothing (MAS) (five-point window), normalizing (NOR) (area normalization), standard normal variable (SNV) [23], Savitzky-Golay smoothing (SGS) (second-order polynomial fitting and five-point window), and Savitzky-Golay first-order derivative (SGD1) (second-order polynomial fitting and five-point window), were applied by using the software of Unscrambler X (CAMO, Oslo, Norway).
The recorded NIR spectra exhibited high dimensionality, multicollinearity, and redundancy due to the strong correlation over contiguous wavelength channels. It was necessary to use a wavelength optimization algorithm to choose vital wavelengths for modeling, which also lowered computation time and detector cost. The successive projections algorithm (SPA) applied herein is a forward variable selection method. SPA performs calculation depending on a criterion of choosing the maximum projection of the selected wavelength on other wavelength variables in each subsequent cycle. SPA mostly enables minimizing the collinearity and reducing redundant information in spectral vector space [24].

2.4. Partial Least Squares Regression (PLS)

We used PLS to define the mathematical relationship between spectra and adulteration concentrations. PLS is a heuristic method based on linear algebra, employing a soft modeling approach where no assumption is imposed on the data distribution [25]. The algorithm overcomes the overlapping and interference contained in spectra by using powerful multicomponent analysis [26]. PLS subjects independent and dependent variables to a suitable bilinear decomposition and conducts regressions in the latent space. PLS is a versatile method that is dominant in many areas, often providing better models than other regression methods.
There are two approaches available in PLS regression when more than one dependent property is expected for calibration. Each of all properties is calibrated separately to develop models (PLS1) or all properties are calibrated simultaneously to establish one model (PLS2). Compared to PLS1, PLS2 is simpler and more convenient, modeling all the target properties at once. However, PLS1 models generally outperform PLS2 models, except when the dependent variables are strongly correlated [27]. In this work, PLS1 and PLS2 were applied to build quantitative models for single-adulterant samples and multiple-adulterants samples, respectively. Five-fold cross-validation was used to evaluate both PLS1 and PLS2 models’ efficiency.

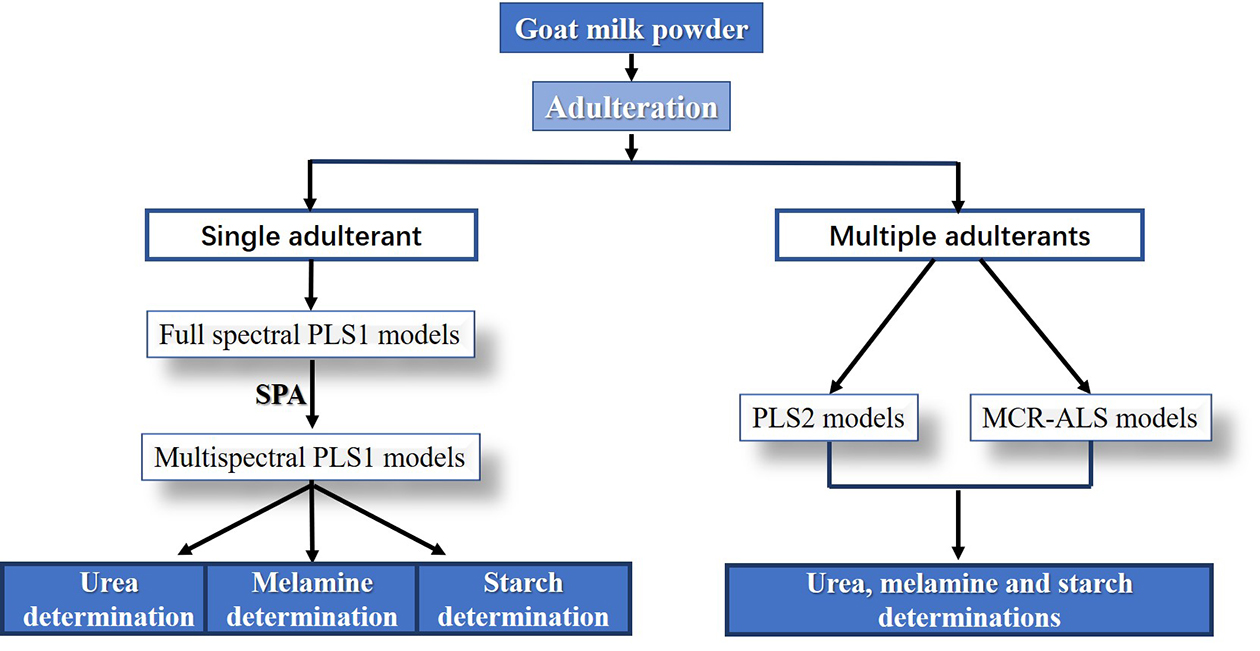
2.5. Multivariate Curve Resolution Alternating Least Squares (MCR-ALS)

Multivariate curve resolution alternating least squares (MCR-ALS) is a powerful resolution method allowing quantification in the analysis of complex mixtures by using spectroscopic means. MCR-ALS has been successfully applied to the resolutions of multidimensional spectroscopy [28], spectroscopic images [29], multiple coeluted peaks in chromatography [30], mixtures in flow injection analysis [31], and components in kinetic reactions [32], as well as to studies of protein folding processes [33], electrophoretic characteristics of peptides [34], and conformational changes of polynucleotide [35]. The use of MCR-ALS can be more beneficial for the identification of adulteration with new and unknown substitutes because it enables estimating pure spectral profiles from first-order spectrophotometric data and building models by adopting selectable constraint settings without the need for a large data set [36,37]. For all the foregoing reasons, we proposed using MCR-ALS to build calibration models to simultaneously quantify adulterants for analysis of samples with multiple adulterants. Figure 1 shows the steps of the MCR-ALS resolution process.
Iterations continue until convergence is achieved, i.e., when, in two successive iterative cycles, the relative divergence in the standard deviations of the residuals between experimental and ALS calculated data values is less than a previously ascertained value (usually set to 0.1%) or the maximum number of iterations is reached [38]. The performance of the iterative ALS procedure is evaluated by 3 parameters: the percent of lack of fit (LOF), the percent of variance explained (EV), and the standard deviation of residuals with respect to experimental data ( σ ), which are calculated according to the following equations [39]:
L O F % = i , j ( d i j d ^ i j ) 2 i , j d i j 2 × 100
E V % = i , j d ^ i j 2 i , j d i j 2 × 100
σ = i , j ( d i j d ^ i j ) 2 n r o w s × n c o l u m n s
where d i j represents an element in experimental matrix data D and d ^ i j is the corresponding value calculated based on the results of MCR-ALS models.
In this work, the number of the MCR-ALS components was set to 4, which was the number of the components included in multiple adulterants samples. The iterative ALS procedure began with an initial estimation of the spectral profile for each analyte (goat milk, urea, melamine, and starch). The initial estimate was manually generated by using the pure spectra of the four analytes as the input. The non-negativity spectra profile constraint was applied because all the spectral values were non-negative after 3 different pretreatments (NON, NOR, and MAS). Additionally, the non-negativity concentration profile constraint and concentration correlation constraint were adopted. Only the concentrations of goat milk powder and melamine in the calibration samples (98 samples = 14 × 7 mixtures) obtained by ALS at each iteration were correlated with previously known referenced concentration values, which were input into the concentration correlation constraint. The concentrations of urea and starch in both the calibration and prediction sets (140 samples) were all predicted by MCR-ALS based on the resolved spectra. In this work, the MCR-ALS procedure was conducted through a graphical user interface [40] in the MATLAB environment R2018b (The MathWorks Inc., Natick, MA, USA).

3. Results and Discussion

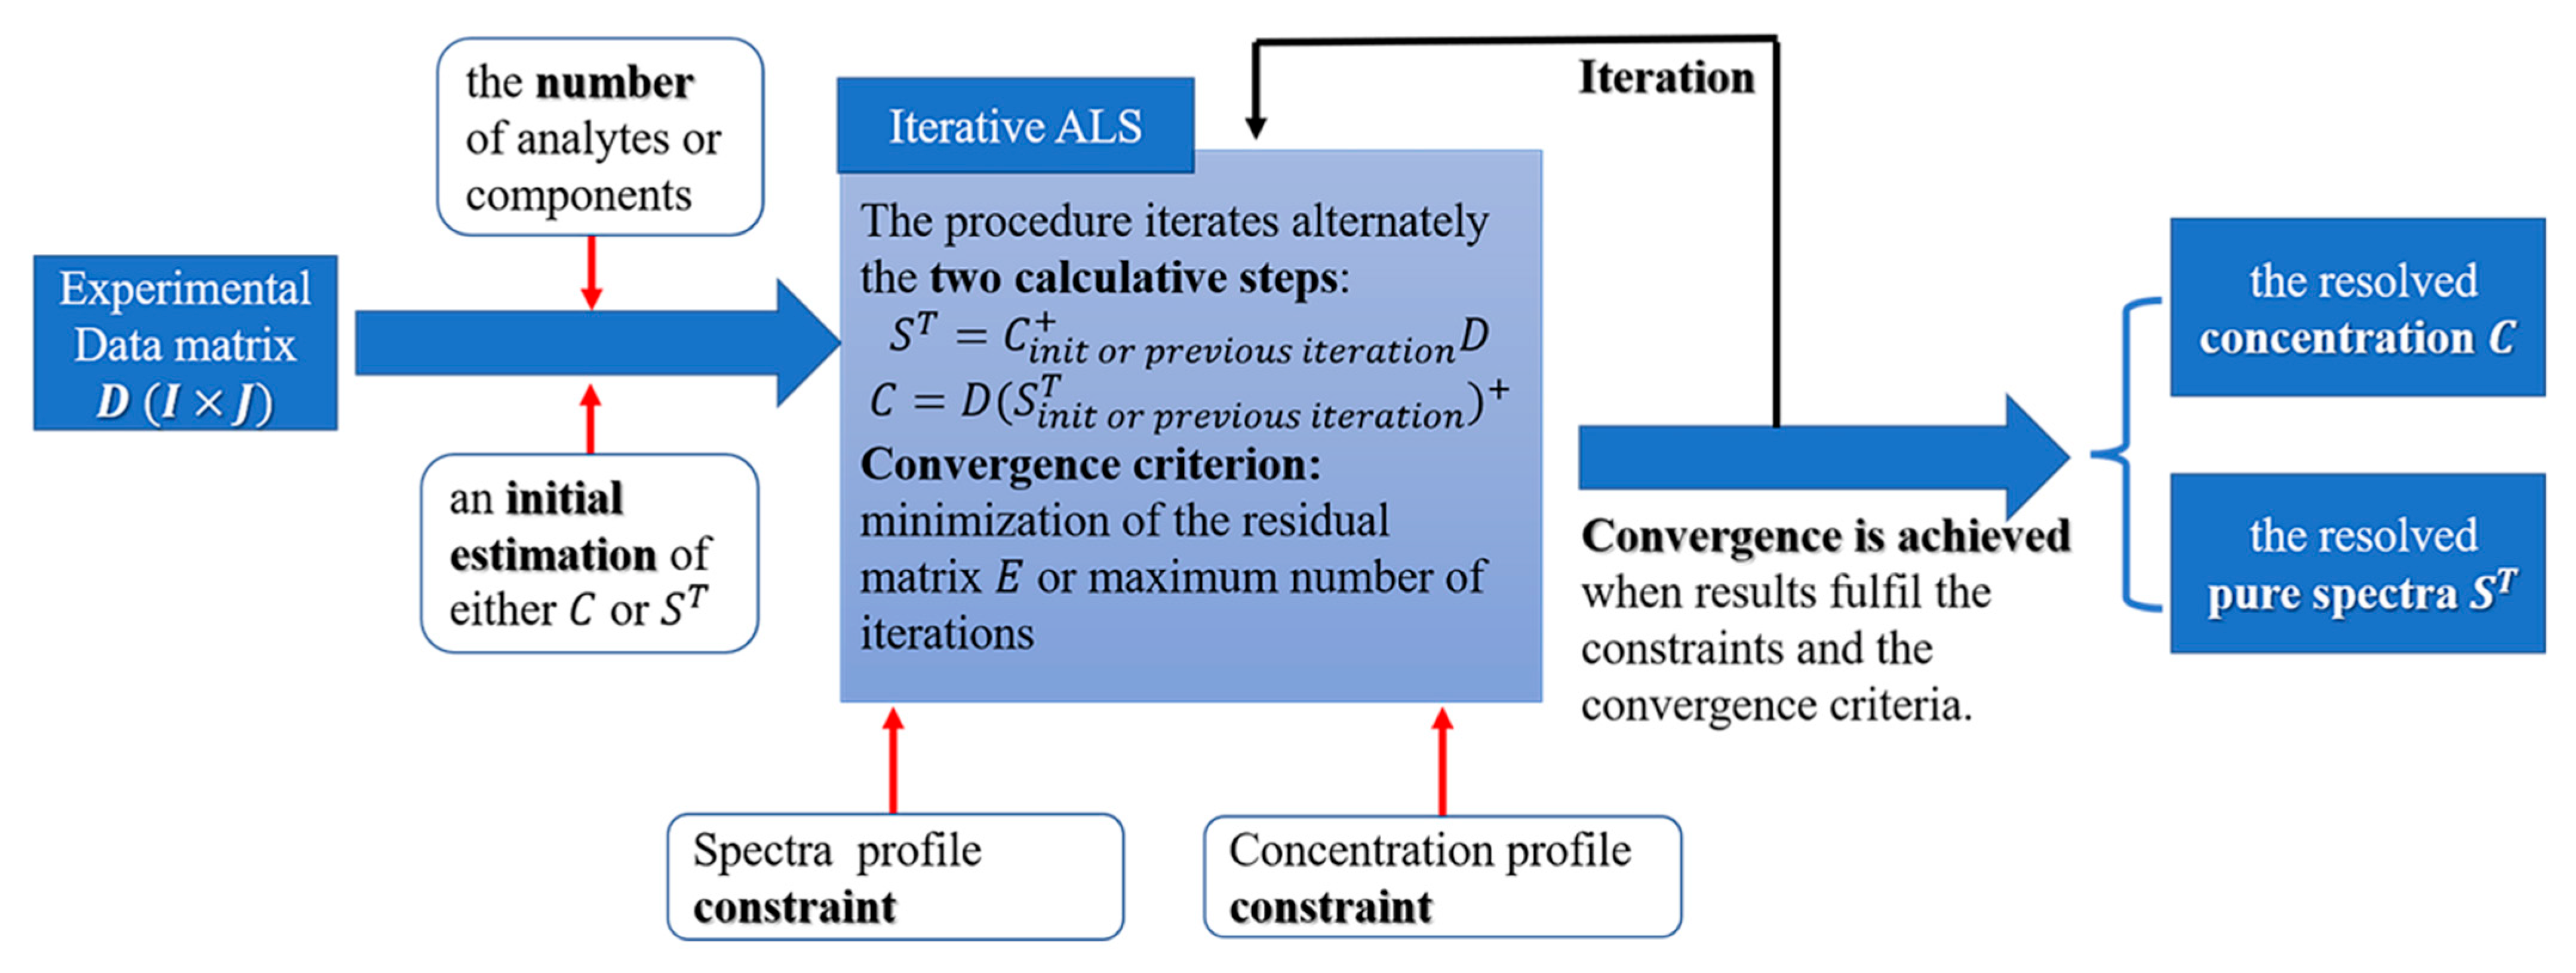
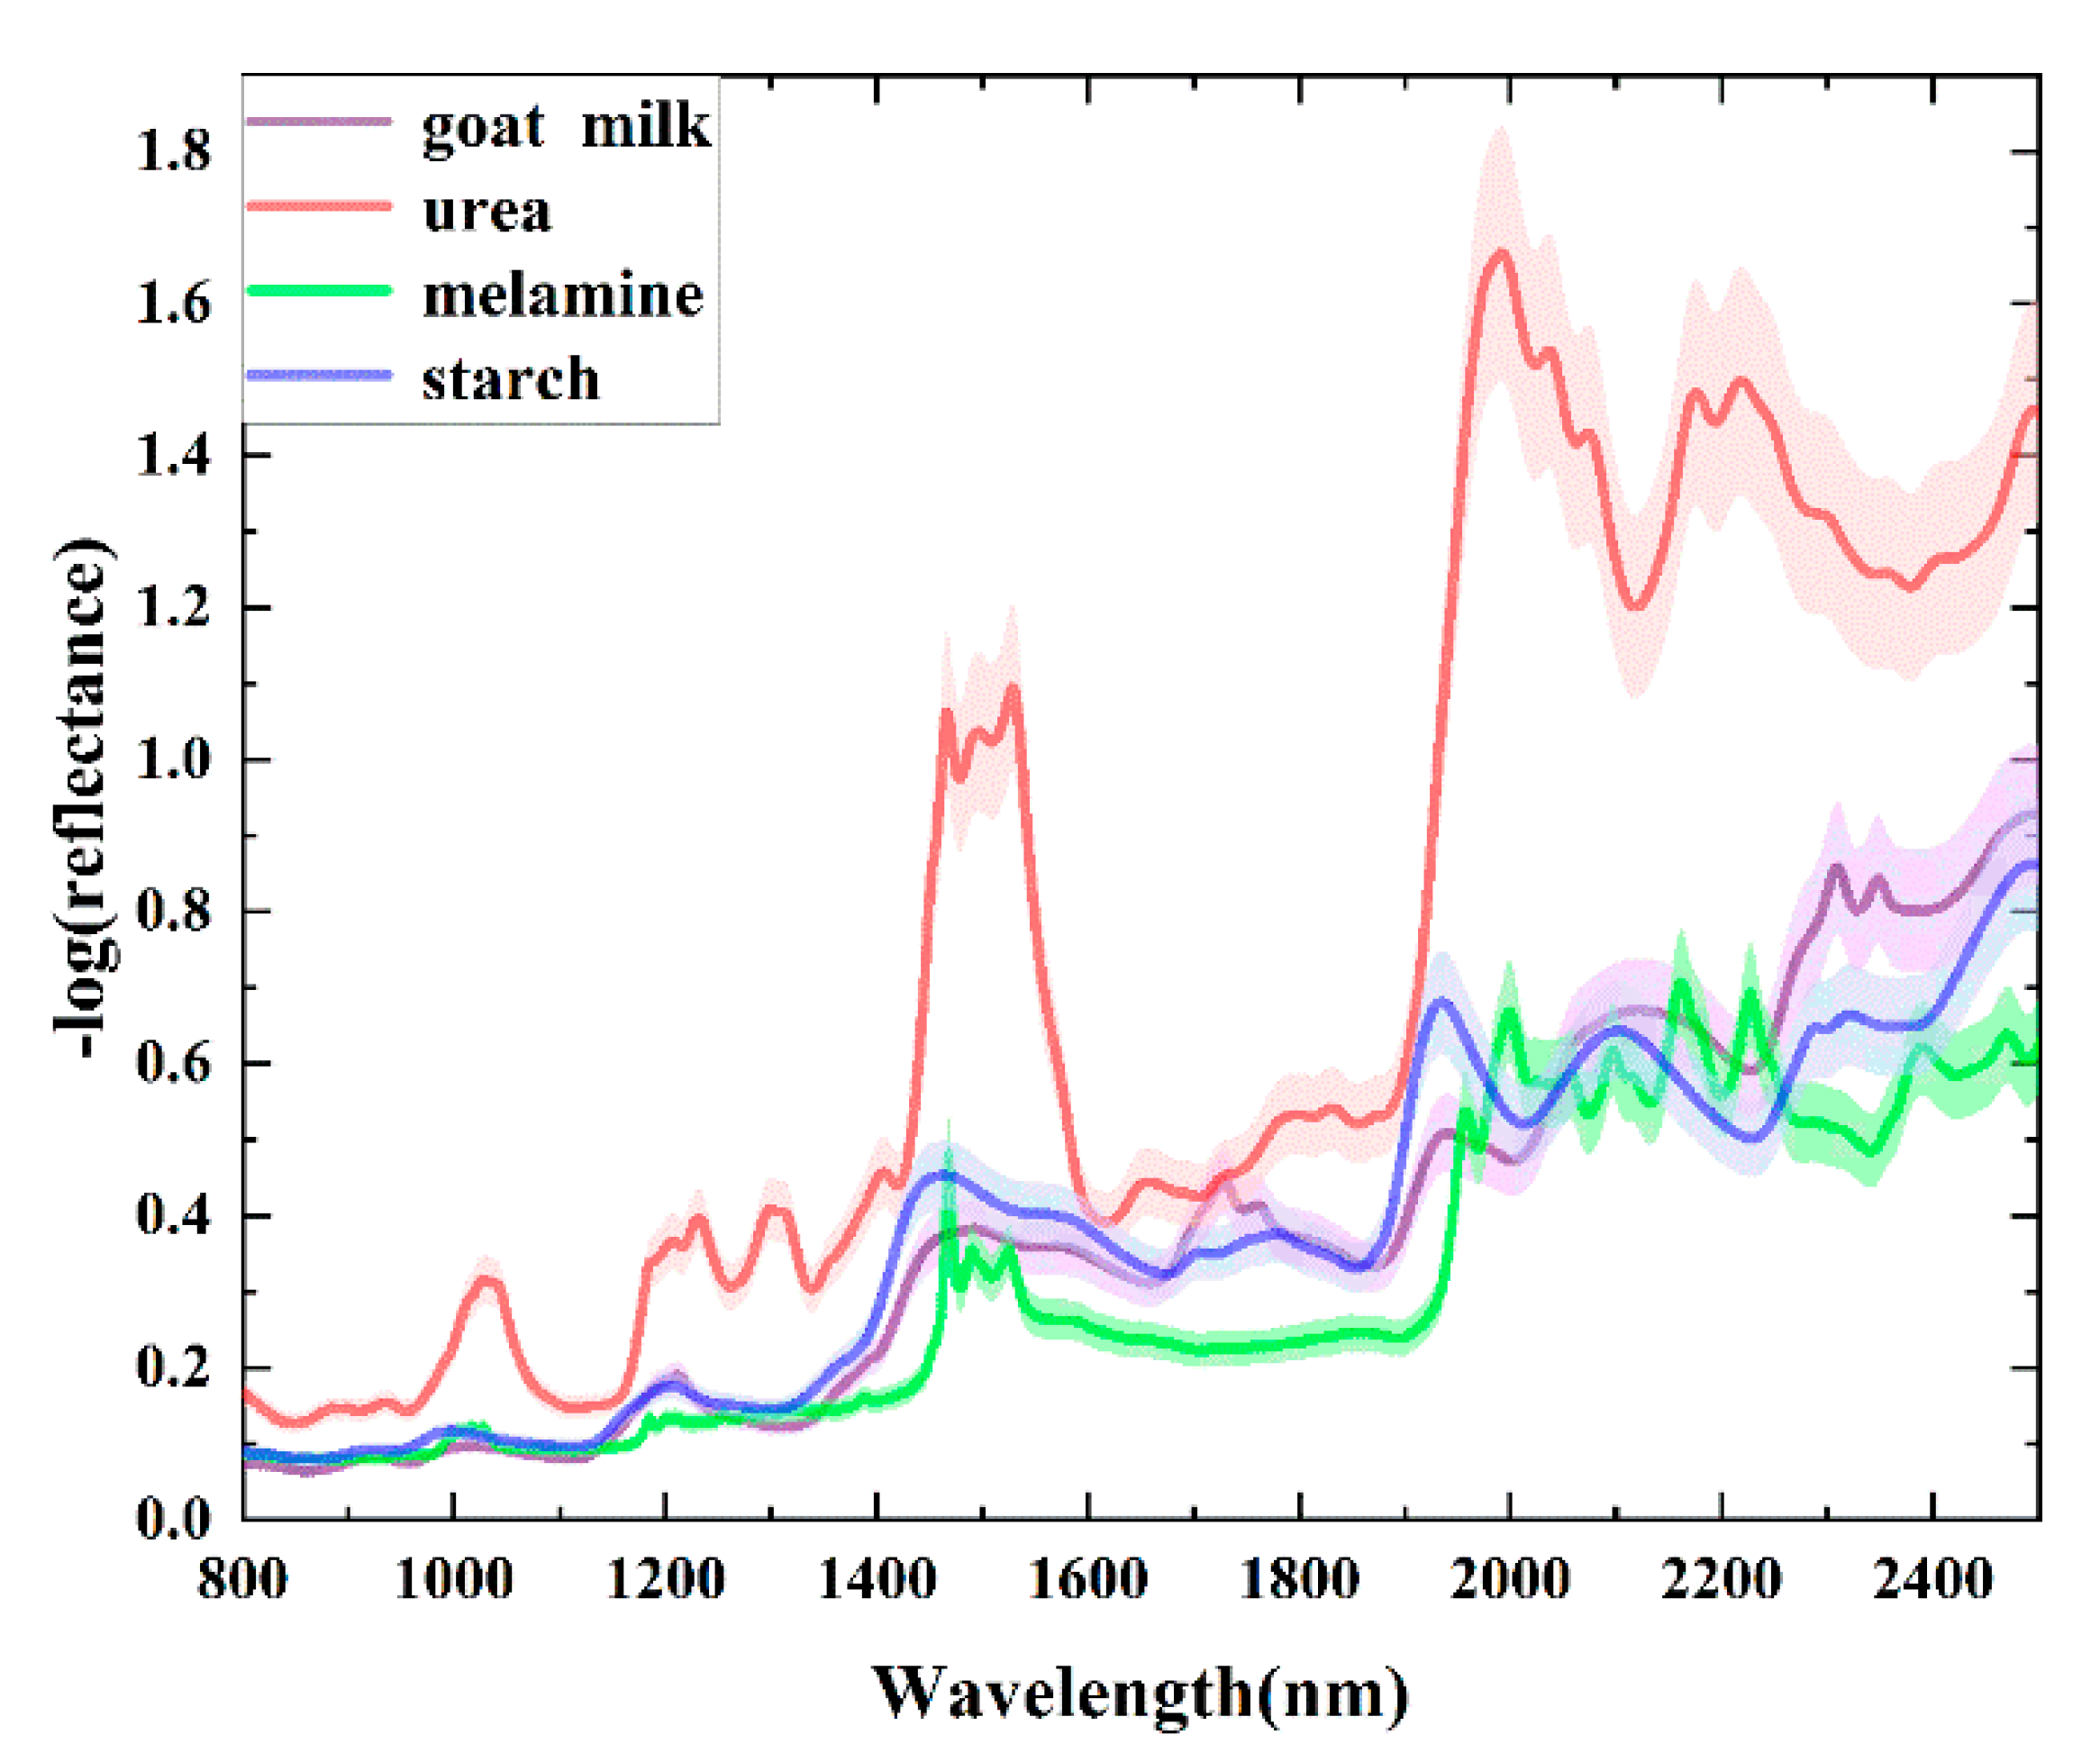
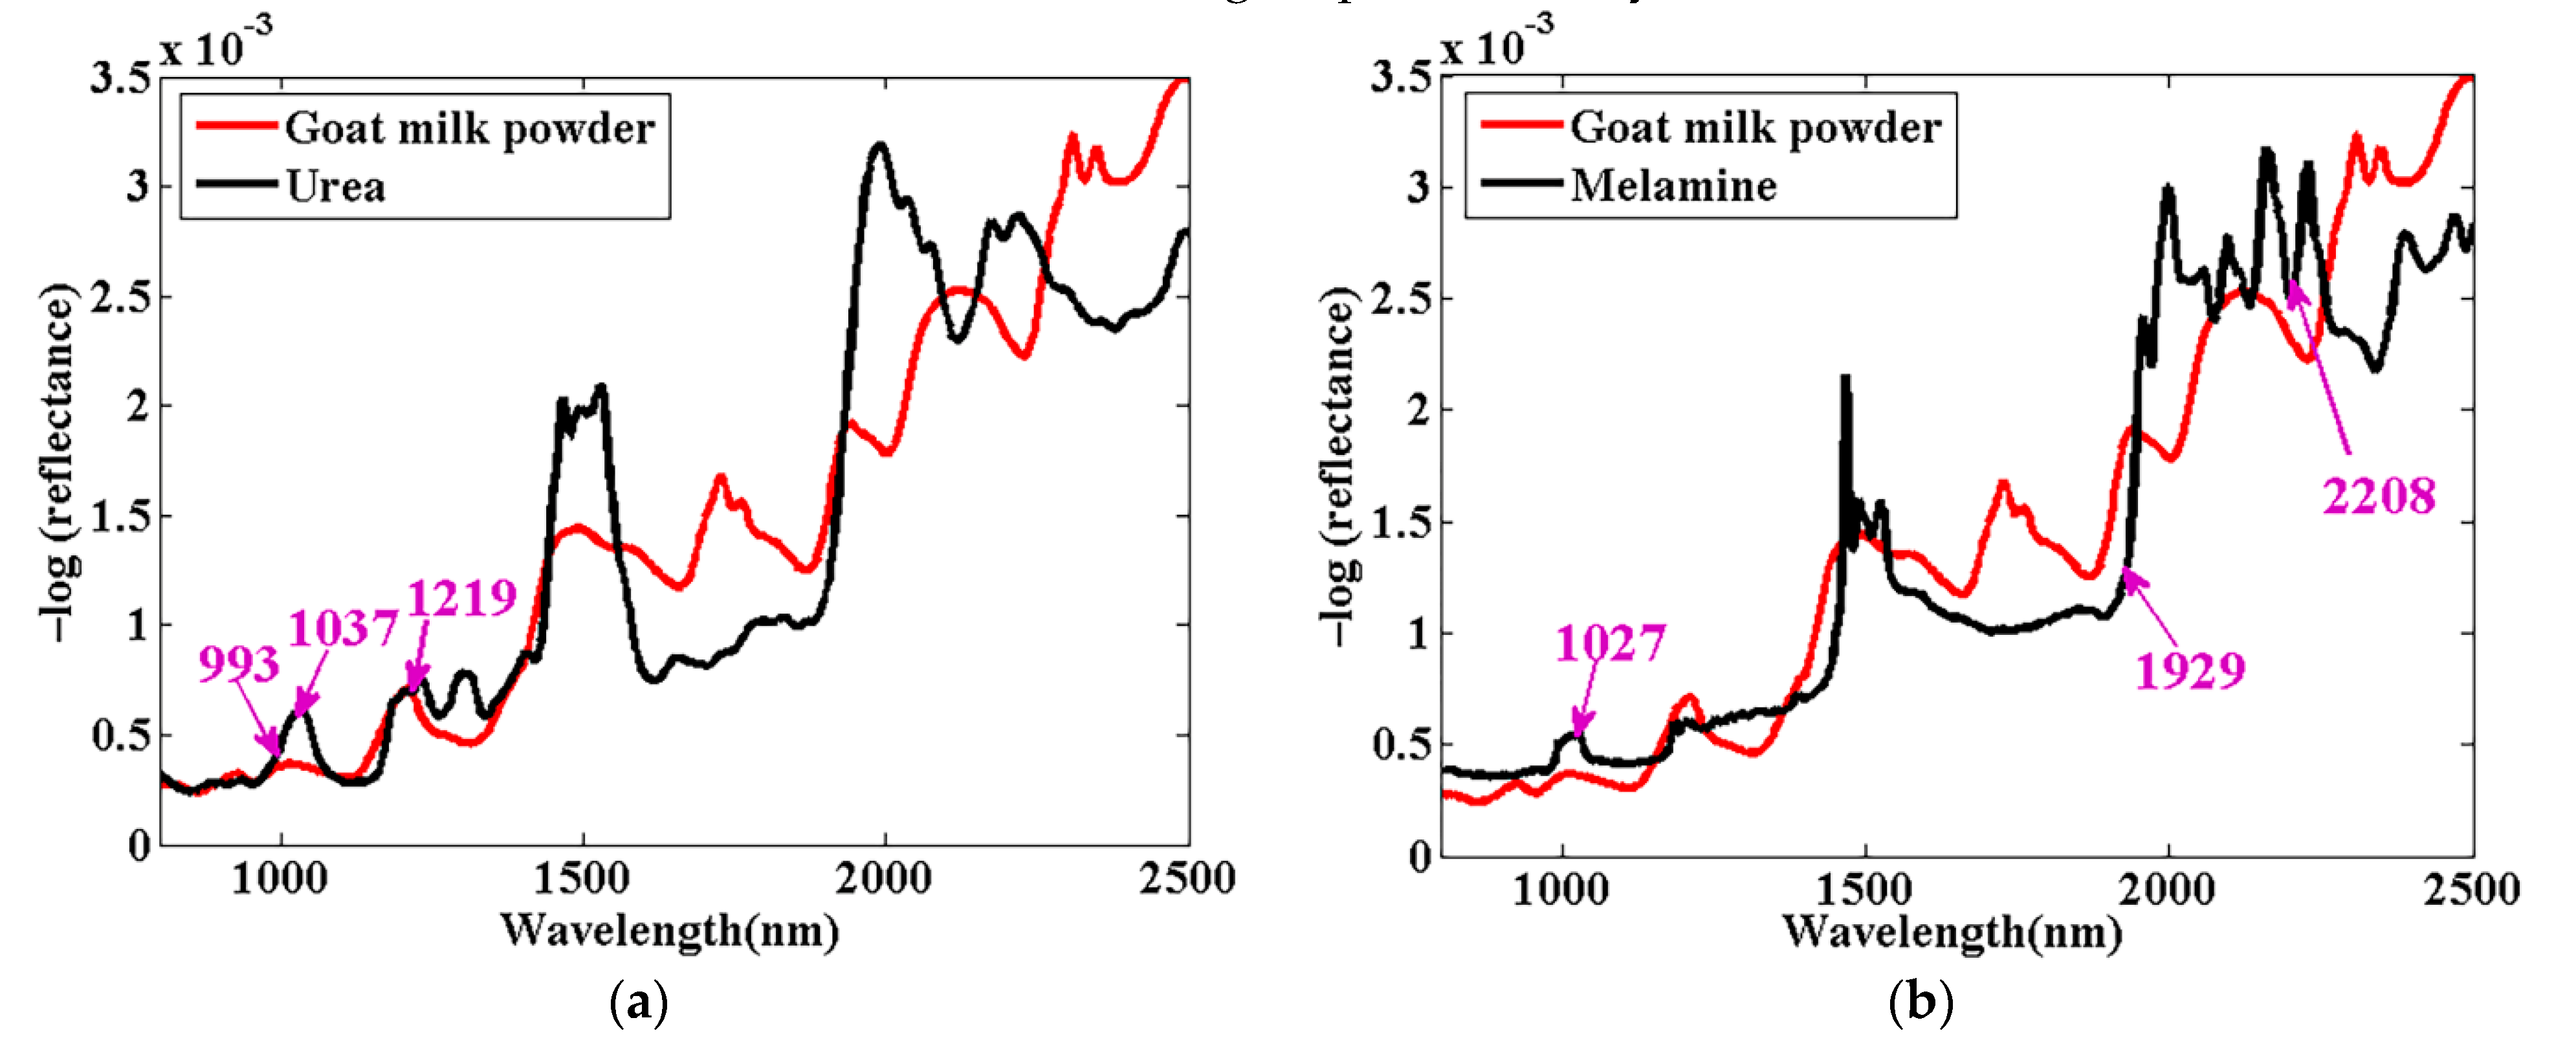
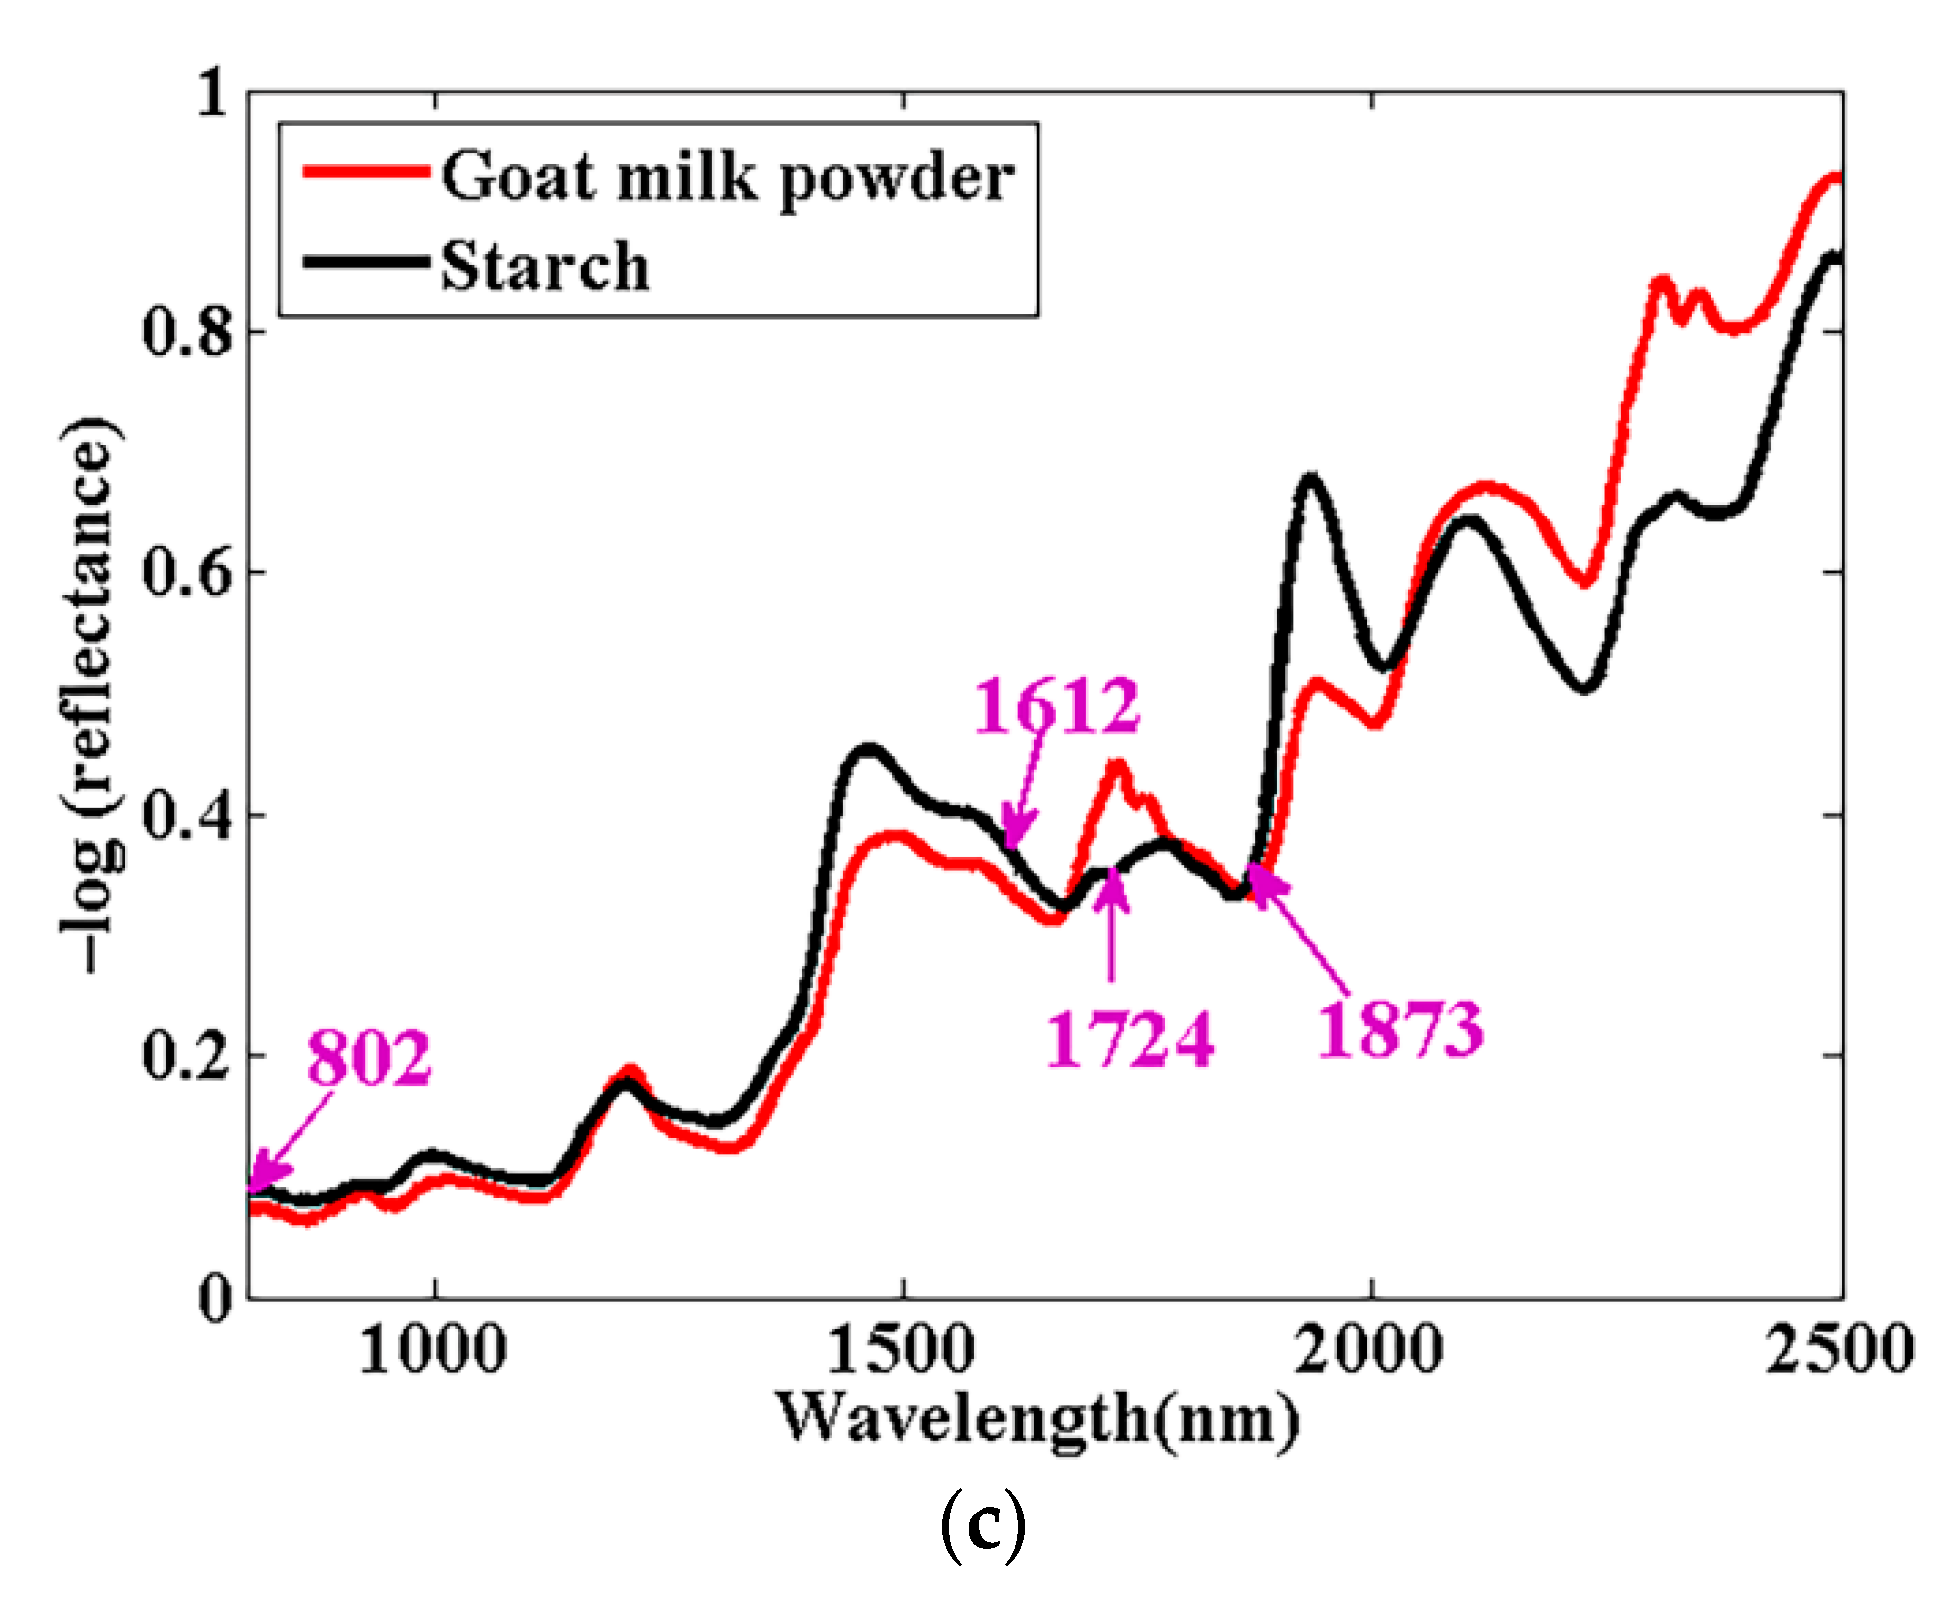
3.1. Raw Spectral Characteristic Analysis

Figure 2 shows the raw NIR spectra of the goat milk (in purple), urea (in orange), melamine (in green), and starch (in blue). As can be seen, the spectra of goat milk were similar to those of starch, with smooth peaks and valleys. The spectra of urea and melamine, with sharper profiles, exhibited distinct differences from goat milk. From the spectral profiles of goat milk and starch, the two main absorption peaks observed, one at 1450 nm and the other at 1923 nm, were both associated with the O–H water bond [7]. The bands corresponding to fat content appeared at 1200 nm (the second overtone from –CH stretching) and 1724–1754 nm (the first overtone of –CH stretching) [21,41]. A spectral peak between 1724 and 1754 nm was observed only from the goat milk spectra. The prominent band at 2000 nm observed from the spectra of urea and melamine was attributed to amide bond [21]. The molecular structures of urea, melamine, and starch illustrated in Figure 3 were consistent with the above-mentioned spectral characteristics. In Figure 2, the spectra of urea present an overall high absorbance level. This was due to the intensity also being dependent on particle size, influencing the scattering of photons within the powder. The particle size of pure urea powder was different from that of the others in our experiment.

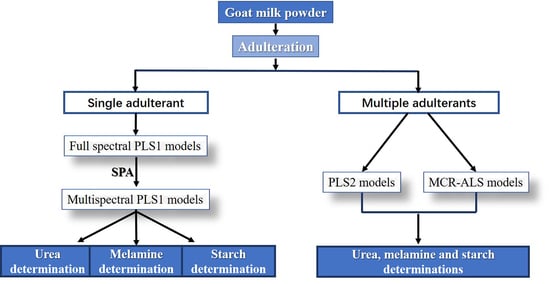
3.2. Adulteration Analysis of Single Adulterant

3.2.1. Spectral Pretreatment and Full Spectral Model

The performance of the PLSR models for single-adulterant samples using different pretreatment methods based on the full spectral range is shown in Supplementary Material Table S1. All the PLSR models presented a strong ability to quantify the adulteration levels with an R 2 above 0.978 and an RMSE below 0.543%. For urea adulteration, the best performance was obtained by using NOR pretreatment six LVs, reaching an R c v 2 of 0.993 and RMSECV of 0.307% in the five-fold cross-validation and an R p 2 of 0.992 and RMSEP of 0.321% in the prediction set. For melamine adulteration, the best PLSR model was obtained by employing NOR pretreatment and six LVs, reaching an R c v 2 of 1.000 and RMSECV of 0.040% in the five-fold cross-validation and an R p 2 of 1.000 and RMSEP of 0.042% in the prediction set. For starch adulteration, the best output was obtained after the application of MAS as the pretreatment and six LVs, achieving an R c v 2 of 1.000 and RMSECV of 0.132% in the five-fold cross-validation and an R p 2 of 1.000 and RMSEP of 0.139% in the prediction set. Figure S1 visualizes the process of selecting LV numbers in the best models for the three adulterants. Table 2 shows the averages of the specific predictive values of each adulterant in prediction set based on the corresponding best models and the absolute errors. The quantification achieved adequate results with absolute errors 0.4% or less for all adulterants. To illustrate the good fit of the three best models, the predicted vs. reference plots for the prediction set are shown in Figure 4.

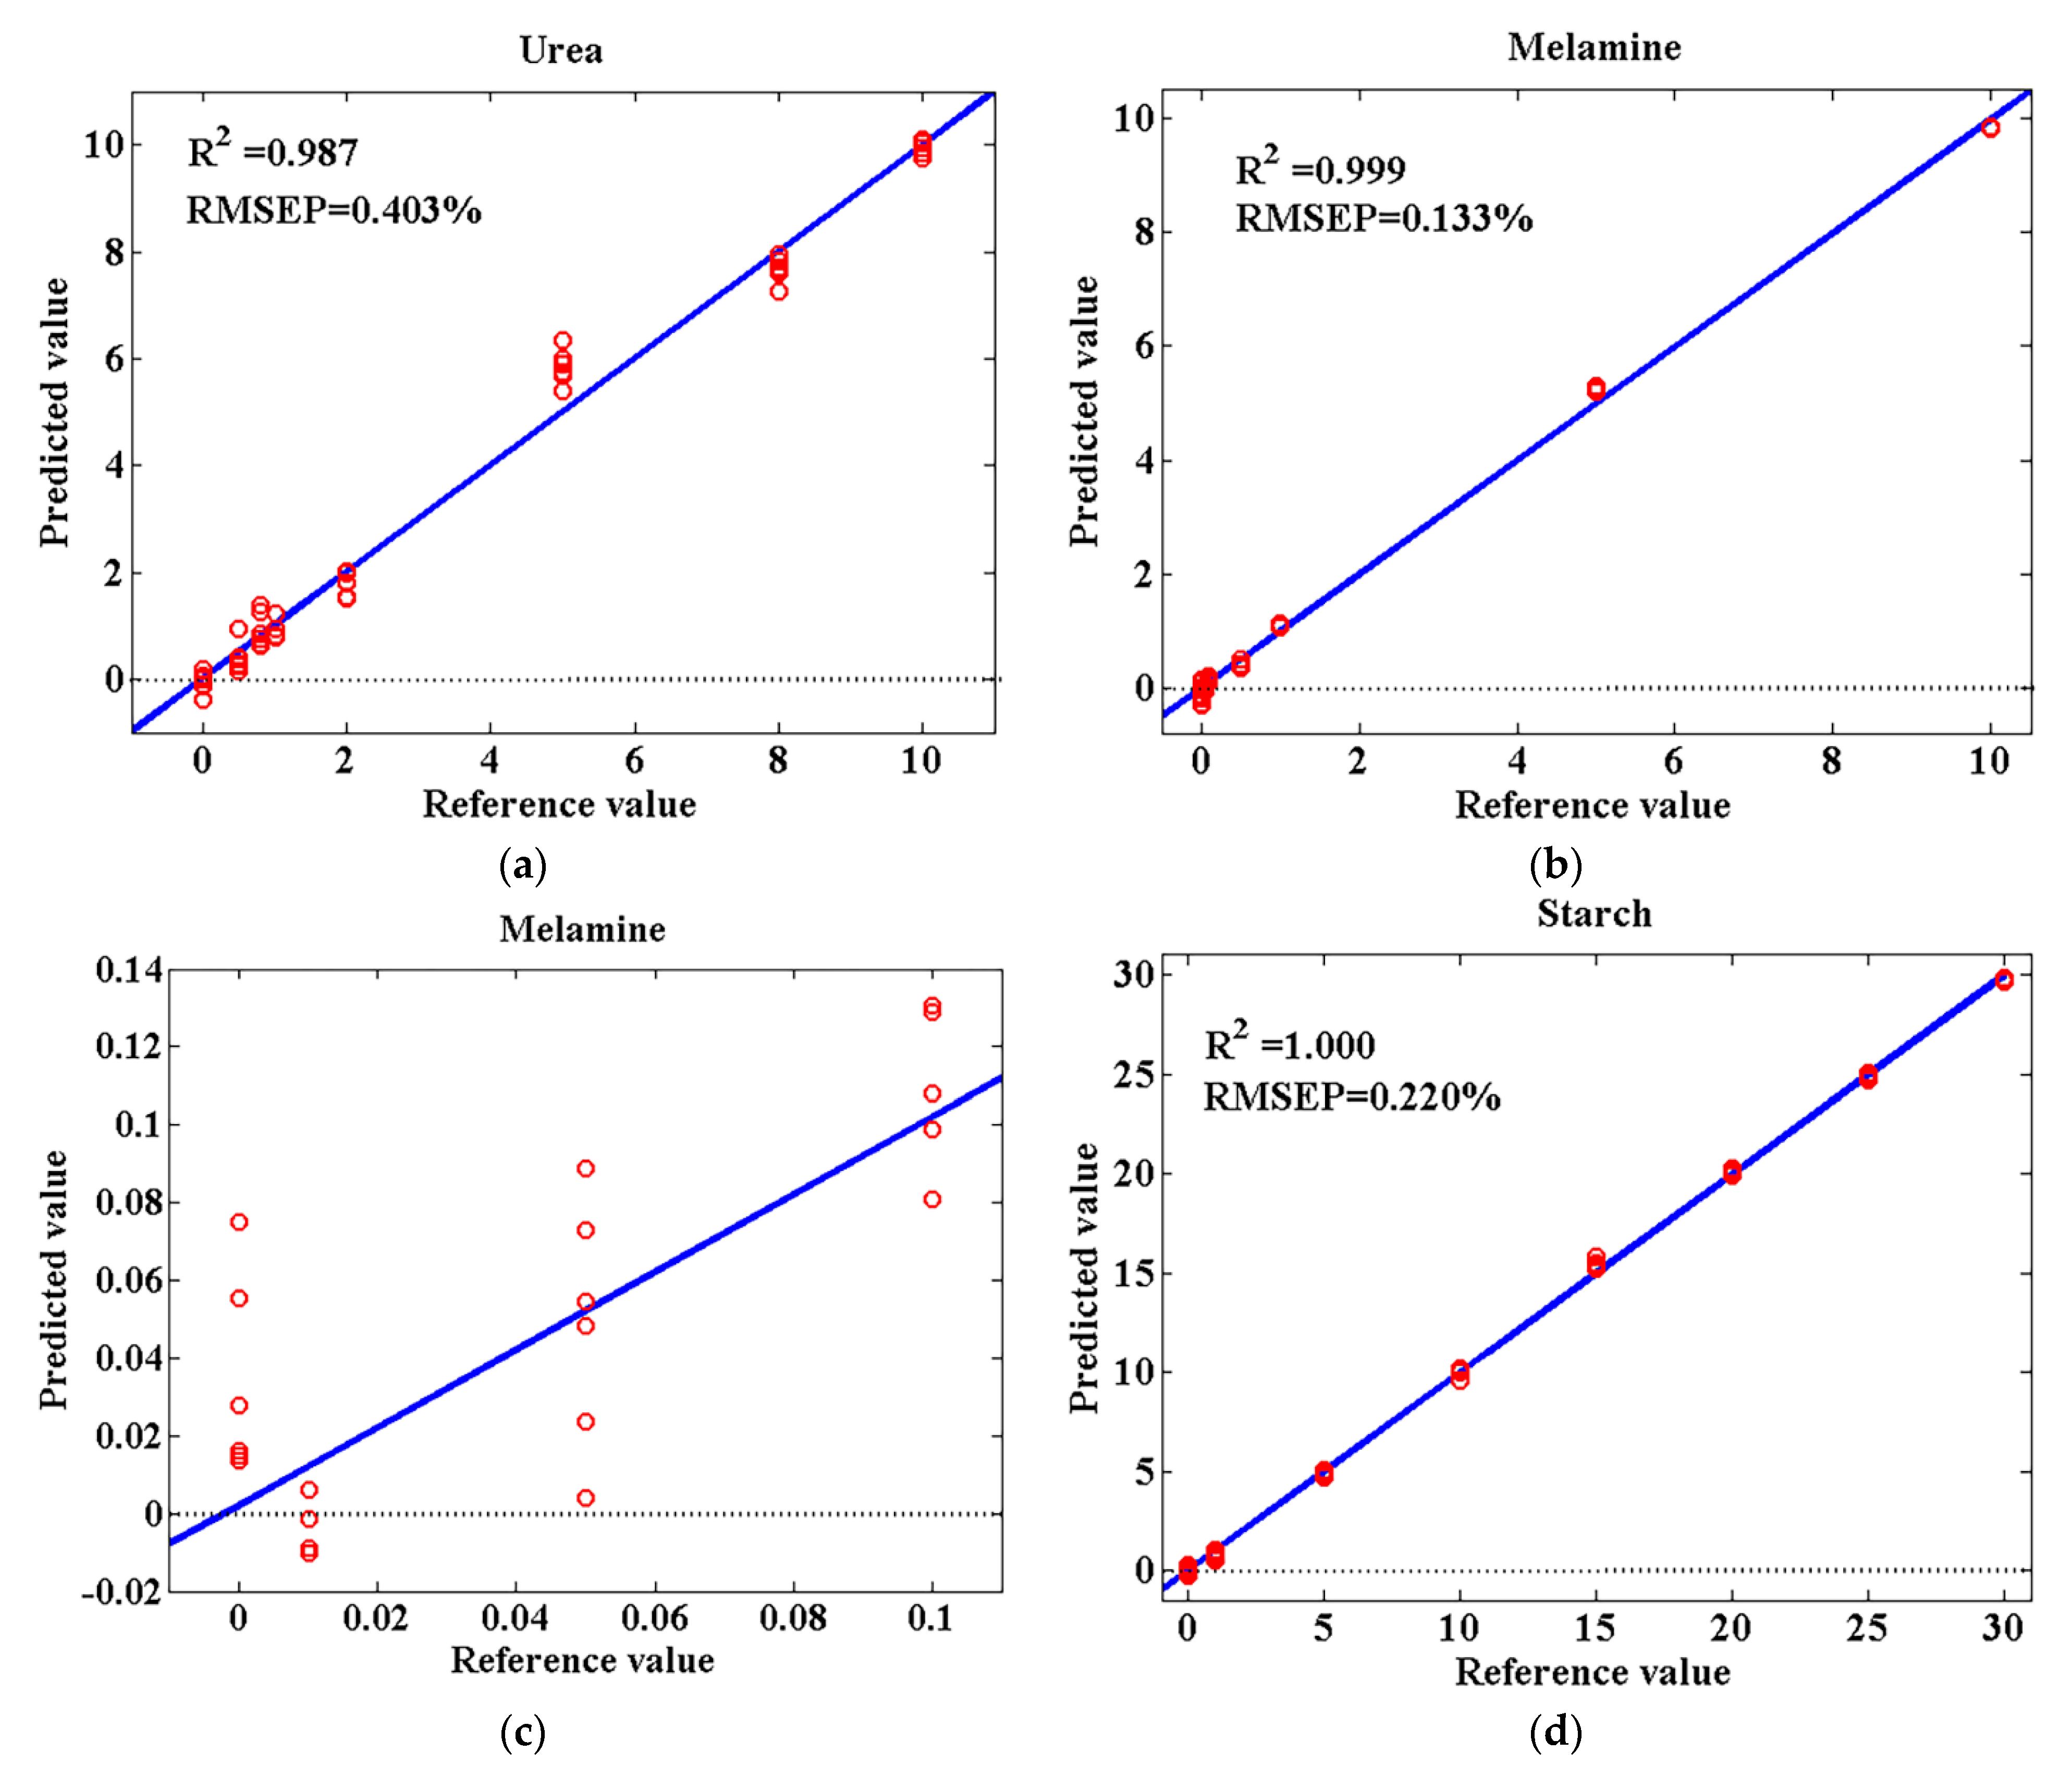
3.2.2. Multispectral Models Optimized by SPA

To reduce the number of input variables for modeling and to improve the robustness of the quantitative model, SPA screened the characteristic wavelengths of the optimal pretreatment spectra. The results for each of the three single adulterant samples are shown in Table 3. Only three wavelengths of 993, 1037, and 1219 nm; three wavelengths of 1027, 1929, and 2208 nm; and four wavelengths of 802, 1612, 1724, and 1873 nm were selected as the characteristic wavelength subsets to determine the adulteration levels of the three adulterants (urea, melamine, and starch, respectively). The SPA algorithm is essentially based on mathematical statistics. The selection criteria were driven by using a searching algorithm with prediction accuracy (RMSE) [42]. Hence, the selection results lacked interpretability and were not quite consistent with the spectral characteristics discussed in Section 3.1.
To display the distribution of the characteristic wavelengths and to present the influence of spectral pretreatment, the average spectra of goat milk powder and the three adulterants after the application of optimal pretreatments are illustrated in Figure 5 with the flagged characteristic wavelengths. The scattering effect induced by the particle size of pure urea powder (mentioned in the Section 3.1) could be eliminated by spectral pretreatment (shown in Figure 5a). As can be seen from Figure 5, the characteristic wavelengths of 1037 nm in Figure 5a and 1027 nm in Figure 5b were distributed around an absorption peak, where spectral profiles after the NOR pretreatment exhibited more obvious differences between the goat milk and urea or melamine adulterant. Likewise, Masemola and Cho [43] selected 1027 and 1036 nm as the characteristic wavelengths to estimate leaf nitrogen concentration from the spectra (400–2500 nm) of whole fresh and dry leaves of Eucalyptus grandis. As shown in Figure 5c, 1724 nm was selected as one of the key variables for quantification of starch adulteration in goat milk powder. Similarly, Qiu et al. [44] and Lee et al. [45] identified 1724 nm as the characteristic wavelength in their research on cultivar classification of sweet corn seeds and prediction of the amylose content of polished rice. The peak around 1724 nm corresponded to the first overtone vibration absorption of the -CH2 and -CH function groups in carbohydrate [44].
Multispectral PLSR models of three kinds of single-adulterant samples were established individually using the corresponding characteristic wavelengths, and the performance statistics of the models are shown in Table 4. The results demonstrated good quantification ability, although the precision of the models was slightly poorer than that of the full spectral models. Such reduction in numbers of the input wavelengths for modeling would benefit the development and application of online or portable instruments for processing monitoring and market inspection. Predicted vs. reference plots for prediction sets of the three multispectral PLSR models are shown in Figure 6. As can be seen in Figure 6, the limits of detection of the multispectral models were 0.5%, 0.05%, and 1% for urea-, melamine-, and starch-adulterated samples, respectively. The regression equations derived from the multispectral PLSR models to determine the adulteration levels of each of the three adulterants were as follows:
Y u r e a = 70.68 145.20 X 993 + 302.71 X 1037 116.60 X 1219
  Y m e l a m i n e = 18.73 + 17.47 X 1027 34.20 X 1929 + 42.16 X 2208
  Y s t a r c h = 108.18 6.52 X 802 + 99.72 X 1612 174.22 X 1724 + 8.45 X 1873

3.3. Adulteration Analysis of Multiple Adulterants
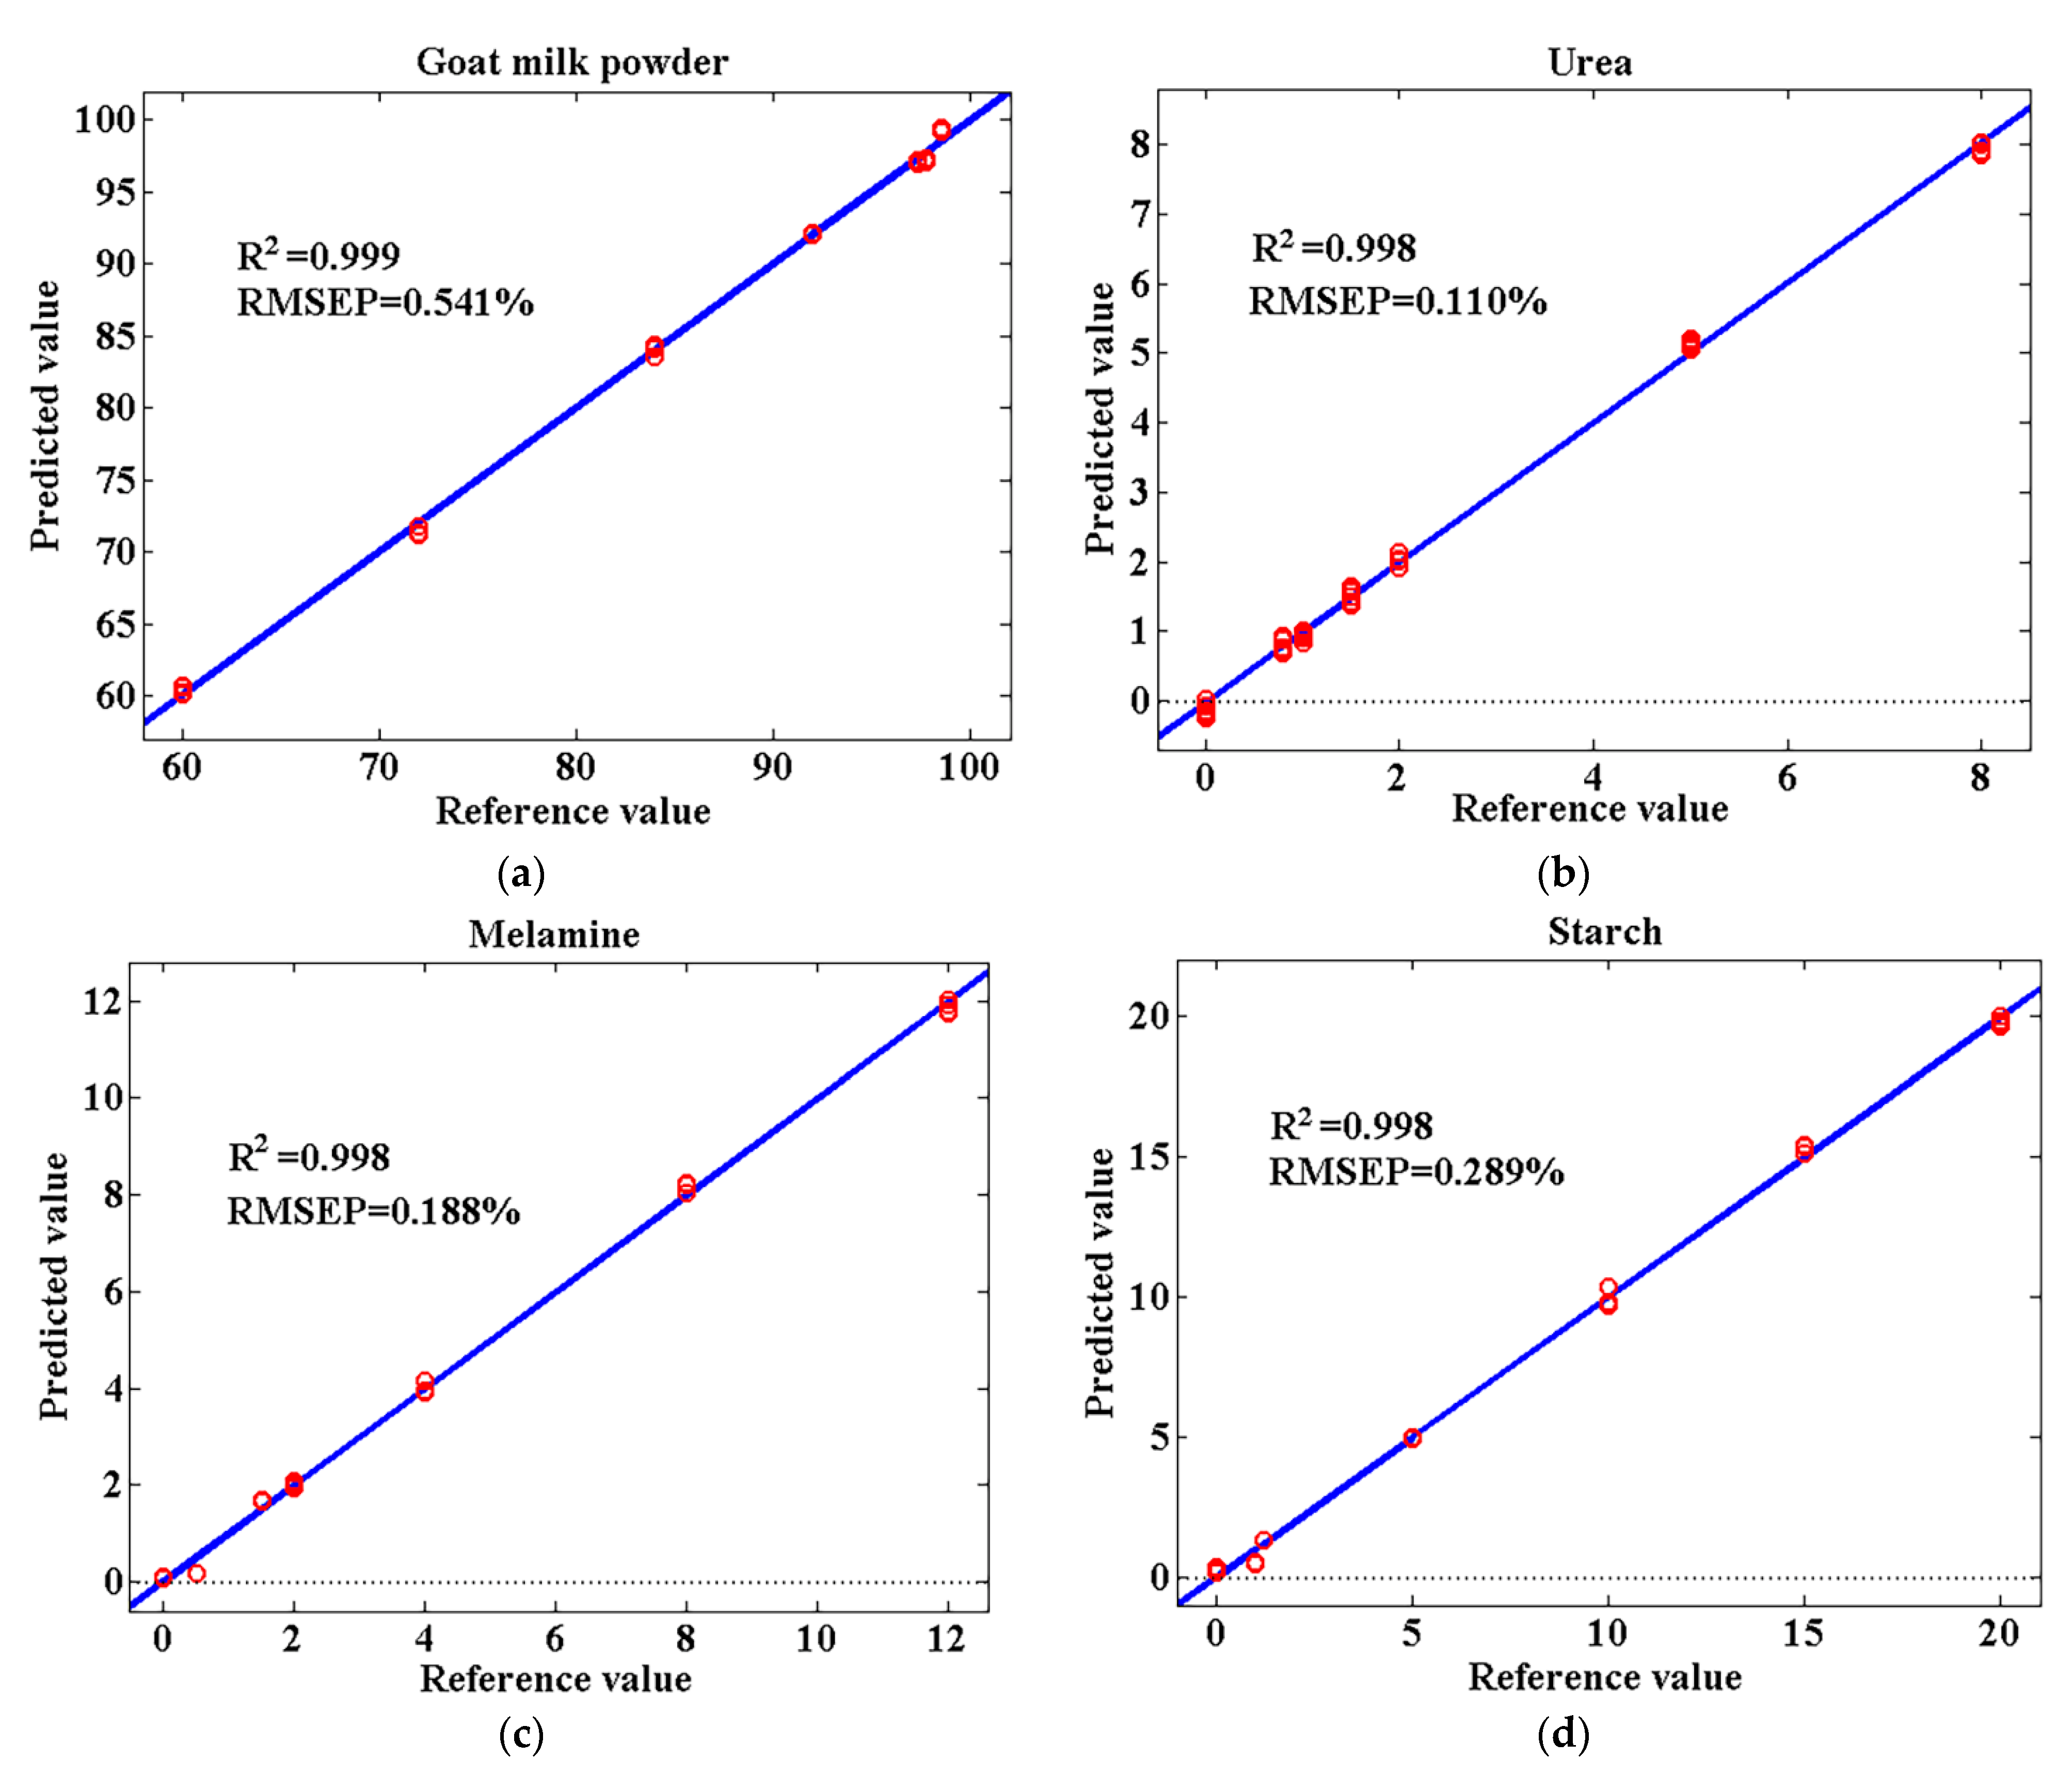
3.3.1. PLS2 Models

Table 5 shows the PLS2 models that presented the best predictive abilities within each of the three pretreatments. In addition to spectra without pretreatment, the spectral data only after NOR and MAS pretreatment were taken into consideration because these outperformed other pretreated spectra in PLS1 modeling. As can be seen in Table 5, all the models exhibited good predictive ability for every analyte (goat milk powder, urea, melamine, and starch) in the multiple-adulterants samples. The results did not show statistically significant differences between the use of raw spectral data (NON) and the other two methods for preprocessing. To illustrate the good fit of the model with NON pretreatment for each analyte determination, predicted vs. reference plots for prediction sets are shown in Figure 7. Although the PLS2 models demonstrated good predictive ability, there was still an intrinsic limitation due to the need for enough previously known reference information for modeling. This would result in losing effective prediction when considering the adulteration with new and unknown substitutes, which often occurs in practical applications.

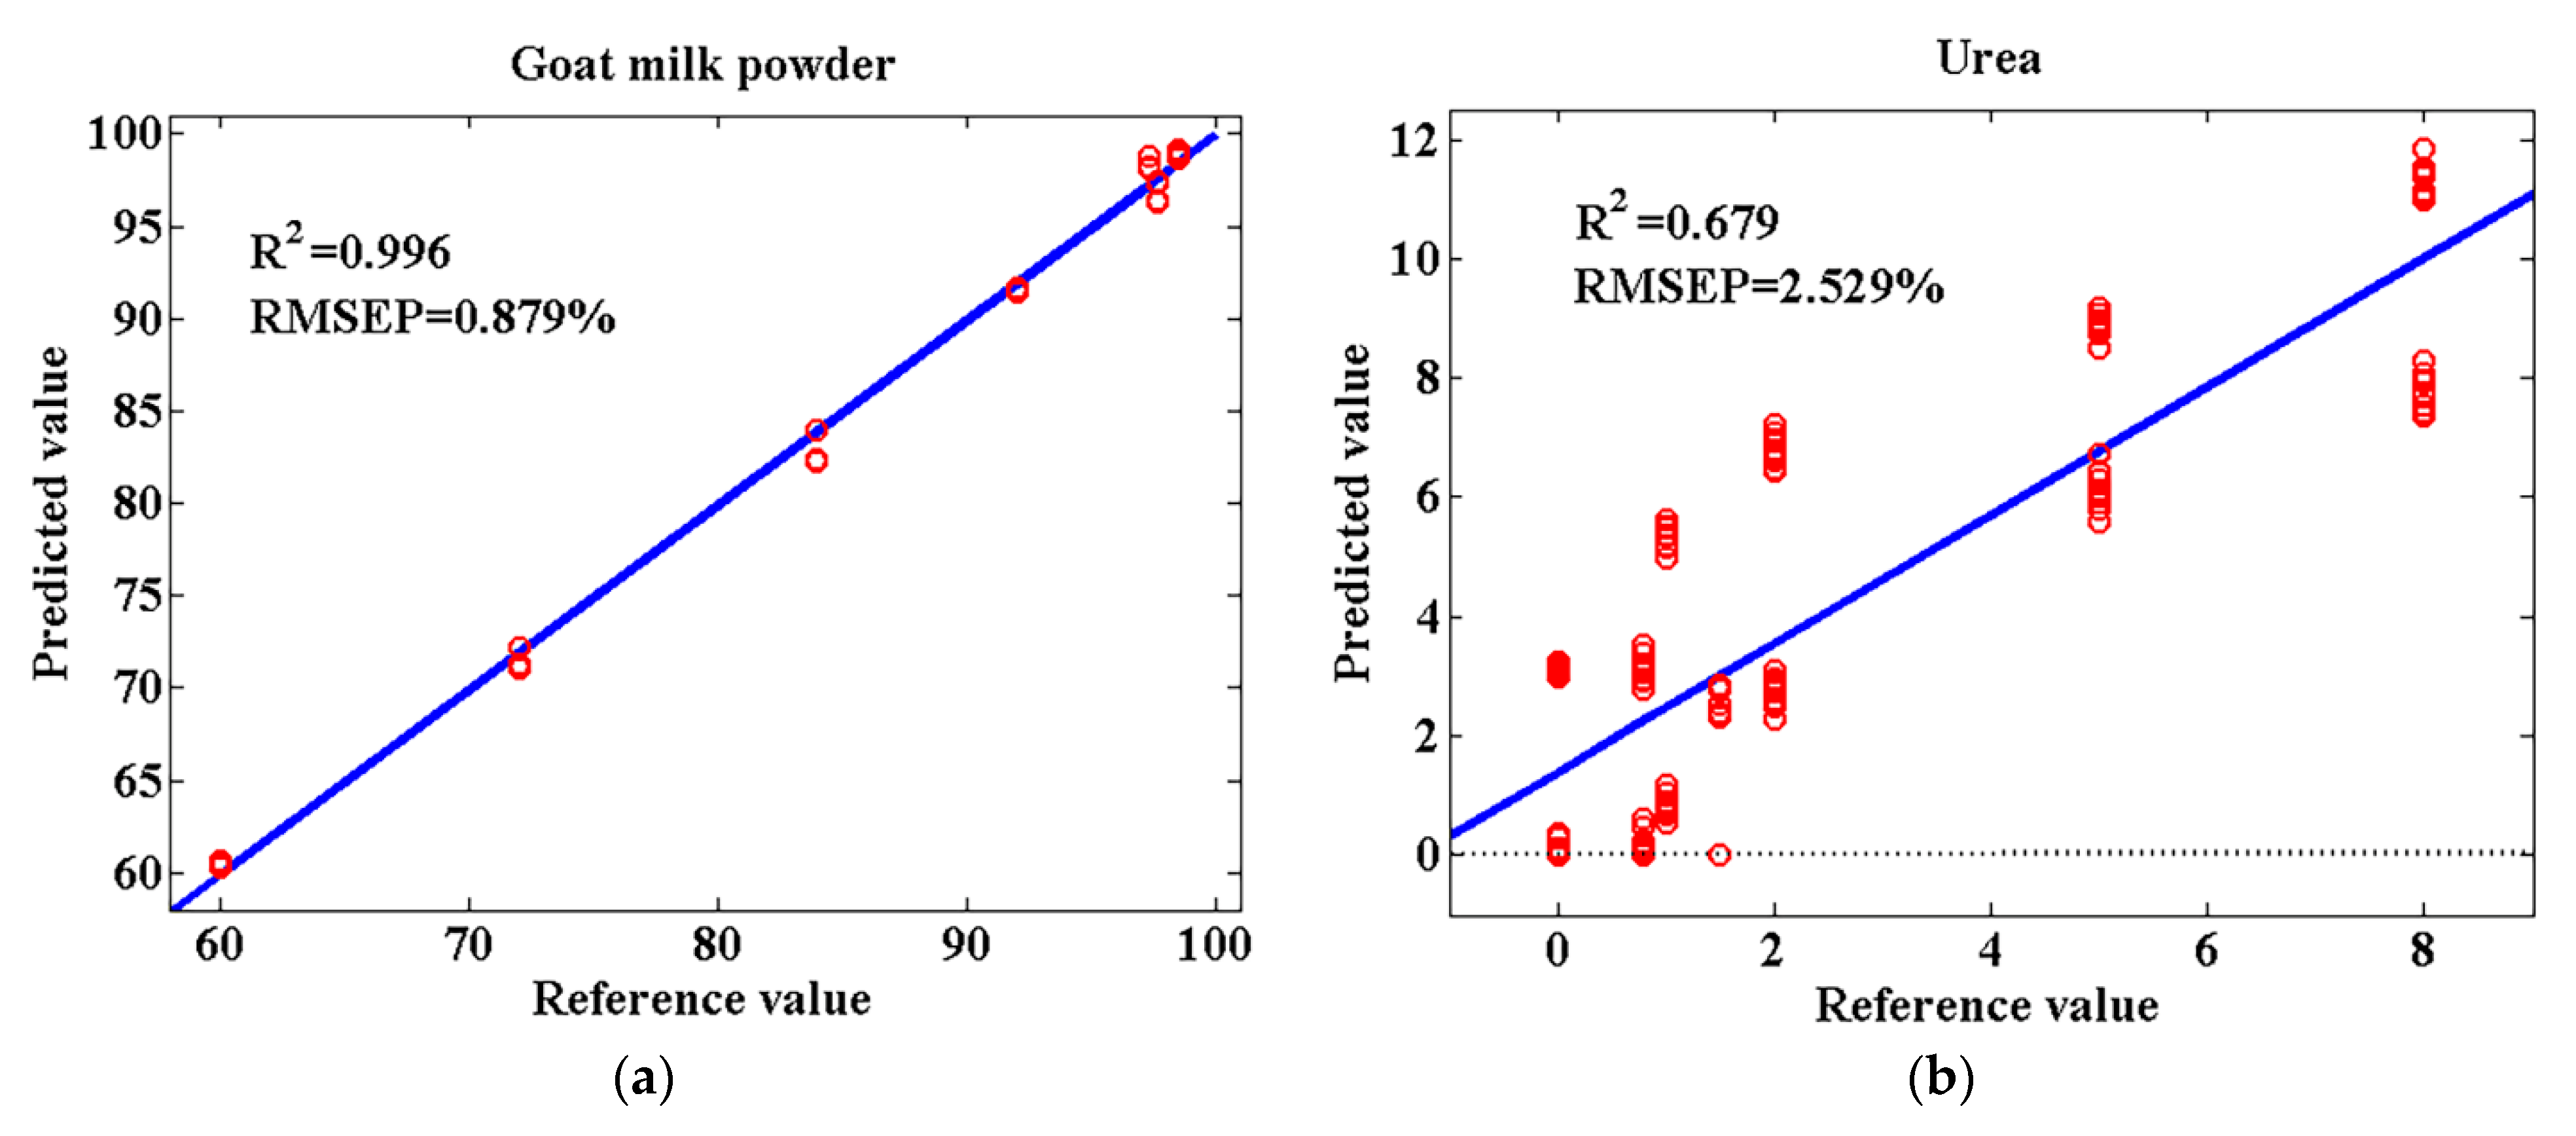
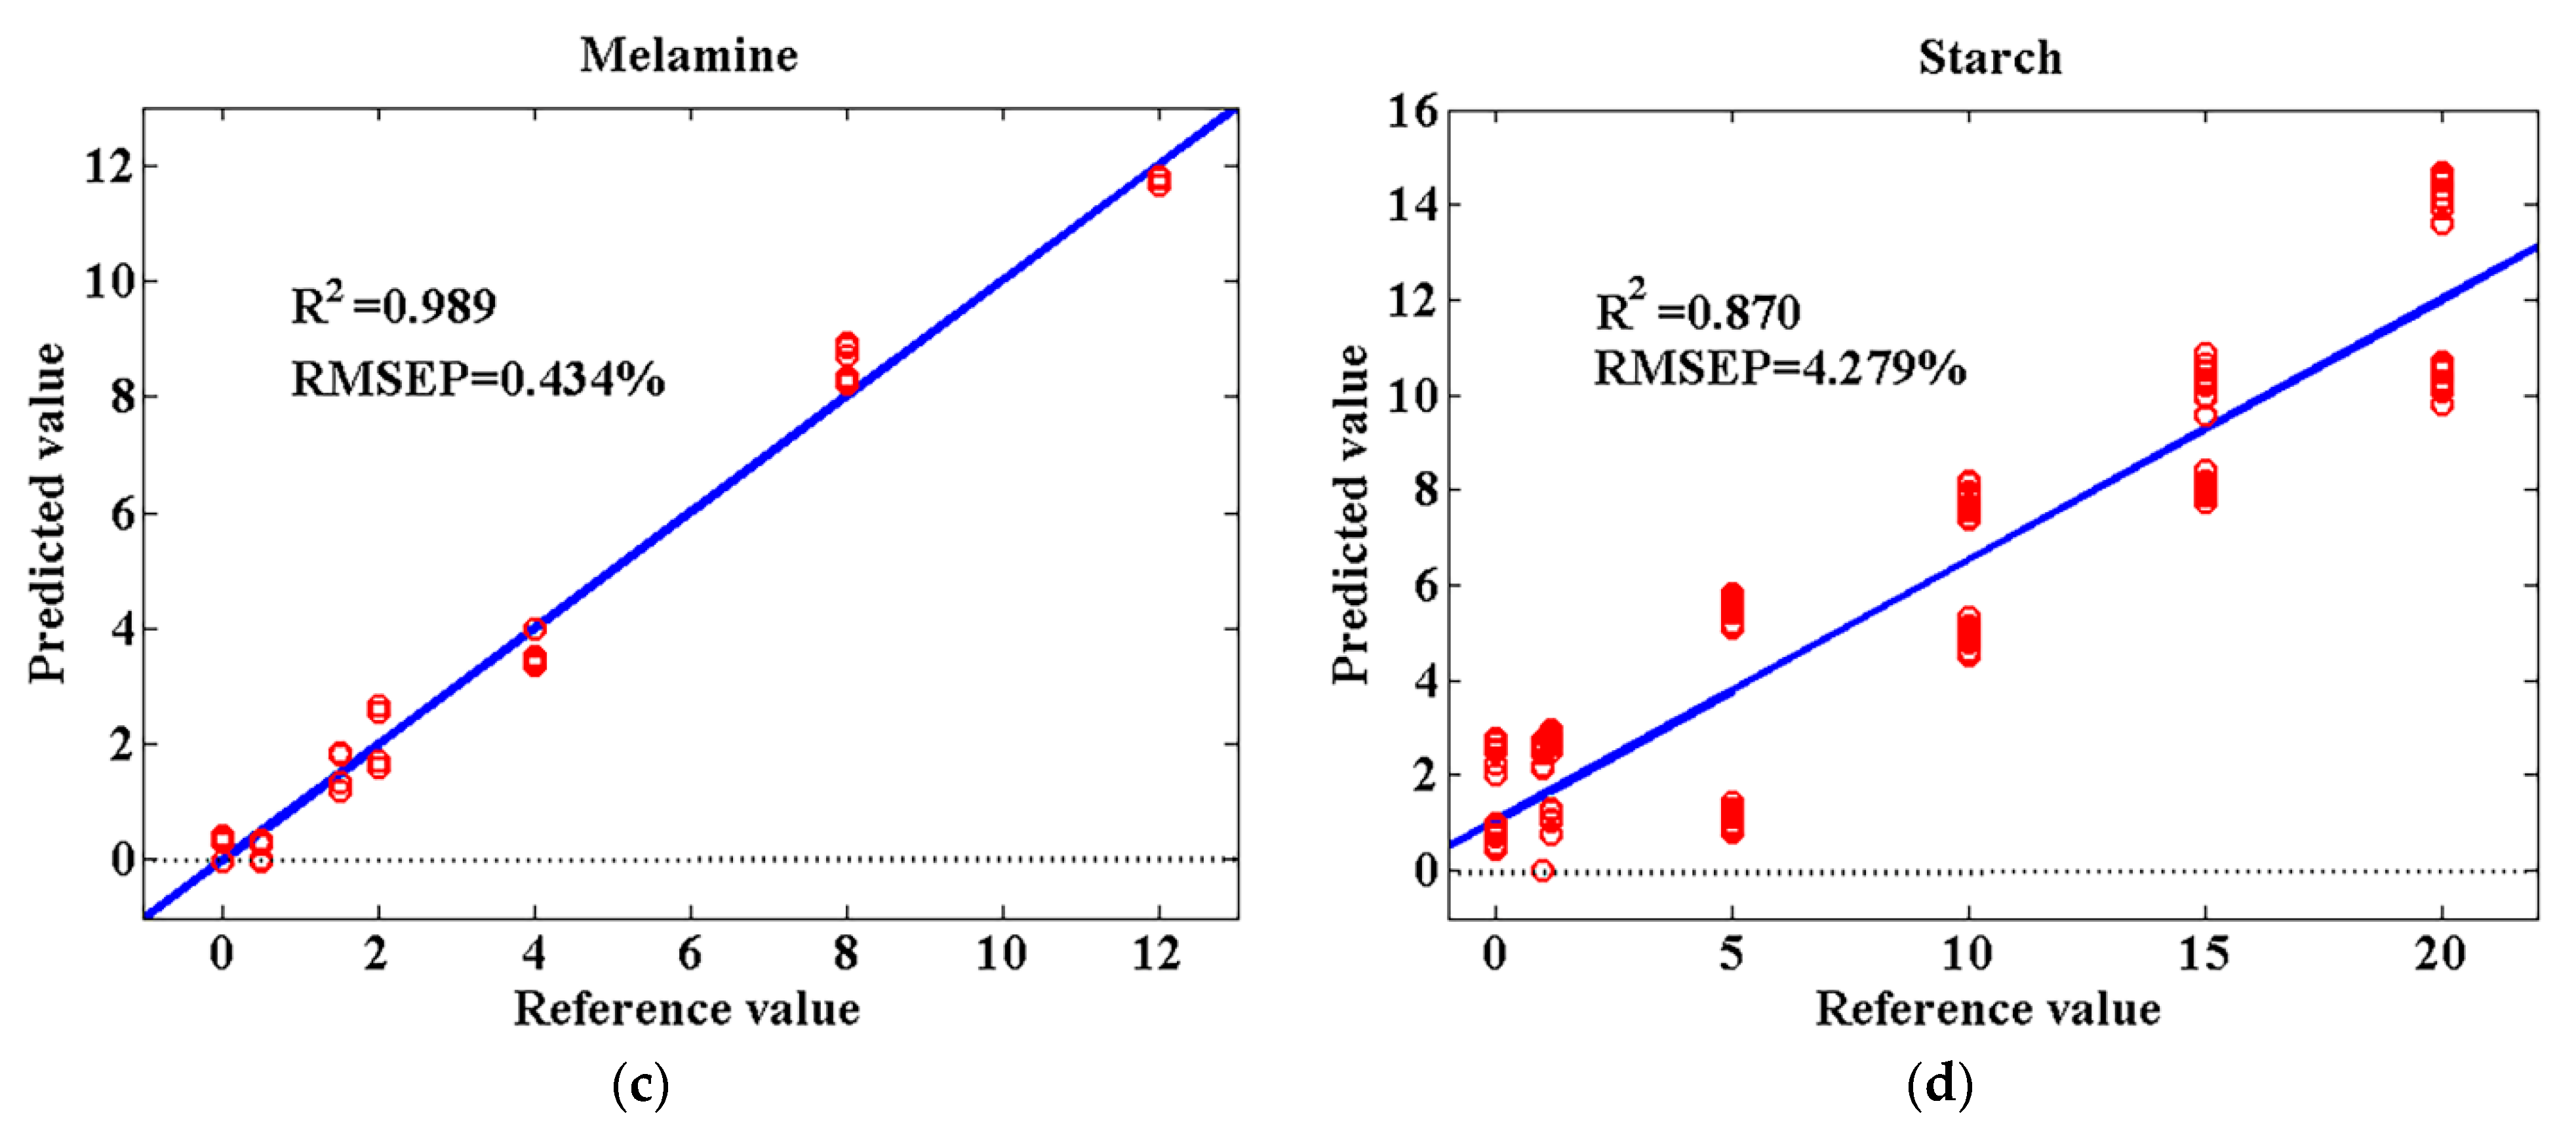
3.3.2. MCR-ALS Models

Table 6 shows the performance statistics of the MCR-ALS models for the simultaneous quantification of the adulteration levels of the three adulterants for multiple-adulterants samples by using the full-range NIR spectra pretreated with different methods. Similarly, the results did not show statistically significant differences between the use of raw spectral data (NON) and other two methods for preprocessing. The predictions for goat milk and melamine were accurate, with an R p 2 ≥ 0.987. However, the results for urea and starch were poor, with an R p 2 ≥ 0.867 for starch and ≥0.679 for urea. The predicted concentrations of urea and starch were calculated only based on the resolved pure spectra of the components by MCR-ALS, which differed in the situations with goat milk and melamine. MCR-ALS allowed modeling with less previously known reference information, which is significant for practical applications. However, the performance was poor compared to the PLS calibrations. Additionally, MCR-ALS needed more computing and analyst interaction than PLS. For a clearer illustration of the fit of the MCR-ALS model with NON pretreatment for each analyte determination, predicted vs. reference plots for prediction set are shown in Figure 8.

4. Conclusions

The obtained results demonstrated the potential of NIR spectroscopy combined with chemometrics (SPA, PLS1, PLS2, and MCR-ALS) for the quantitative determination of goat milk powder adulteration through adding common adulterants (urea, melamine and starch) at various concentrations both individually and simultaneously. For single-adulterant samples, the multispectral PLS models obtained by using SPA (three wavelengths for urea, three wavelengths for melamine, and four wavelengths for starch) presented good predictive ability with an R p 2 above 0.987 and RMSEP below 0.403%. For multiple-adulterants samples, PLS2 outperformed MCR-ALS and provided good predictive models to quantify the adulteration levels of the three adulterants. PLS2 needed enough previously known reference information for modeling, while MCR-ALS allowed the development of models without the need for a large data set, even with existence of new and unknown substitutes. On the contrary, MCR-ALS required more computing and analyst interaction than PLS. Overall, the proposed methodology will contribute to the decisions made by the regulatory agencies to identify and prevent this kind of fraud in the local market in the future.

Supplementary Materials

The following are available online at https://www.mdpi.com/article/10.3390/agriculture12030434/s1, Figure S1: The optimal number of LVs determination in full spectral models with the best pretreatment for urea (a), melamine (b) and starch (c), Table S1: The performance of the PLSR models for single-adulterant samples using different pretreatment methods based on the full spectral range.

Author Contributions

Conceptualization, X.Z.; methodology, Y.W.; software, X.L.; validation, H.J., Z.Z. and X.N.; formal analysis, C.L. and B.P.; investigation, Y.L.; resources, Y.W.; data curation, Y.W.; writing—original draft preparation, X.Z.; writing—review and editing, Z.Z. and X.N.; visualization, X.L.; supervision, X.Z.; project administration, X.Z.; funding acquisition, X.Z., Z.Z. and X.N. All authors have read and agreed to the published version of the manuscript.

Funding

This research was funded by the Foundation of President of Hebei University, grant number XZJJ201912; Advanced Talents Incubation Program of the Hebei University, grant number 521000981357; Nation Natural Science Foundation of China, grant number 31872907; S&T Program of HeBei, grant number 21344801D; and the Key Research and Development Program of Hebei Province, grant number 21327108D.

Institutional Review Board Statement

Not applicable.

Informed Consent Statement

Not applicable.

Data Availability Statement

The data presented in this study are available on request from the corresponding author.

Acknowledgments

The authors would like to thank the organizations or individuals who contributed to this manuscript.

Conflicts of Interest

The authors declare no conflict of interest.

References

  1. Hodgkinson, A.J.; Wallace, O.A.; Boggs, I.; Broadhurst, M.; Prosser, C.G. Gastric digestion of cow and goat milk: Impact of infant and young child in vitro digestion conditions. Food Chem. 2018, 245, 275–281. [Google Scholar] [CrossRef] [PubMed]
  2. Verruck, S.; Dantas, A.; Prudencio, E.S. Functionality of the components from goat’s milk, recent advances for functional dairy products development and its implications on human health. J. Funct. Foods 2019, 52, 243–257. [Google Scholar] [CrossRef]
  3. Nuñez, M.; de Renobales, M. IDF international symposium on sheep, goat and other non-cow milk. Int. Dairy J. 2016, 100, 1. [Google Scholar] [CrossRef]
  4. Ranadheera, C.S.; Evans, C.A.; Baines, S.K.; Balthazar, C.F.; Cruz, A.G.; Esmerino, E.A.; Freitas, M.Q.; Pimentel, T.C.; Wittwer, A.E.; Naumovski, N.; et al. Probiotics in goat milk products: Delivery capacity and ability to improve sensory attributes. Compr. Rev. Food Sci. Food Saf. 2019, 18, 867–882. [Google Scholar] [CrossRef] [Green Version]
  5. Pulina, G.; Milán, M.J.; Lavín, M.P.; Theodoridis, A.; Morin, E.; Capote, J.; Thomas, D.L.; Francesconi, A.H.D.; Caja, G. Invited review: Current production trends, farm structures, and economics of the dairy sheep and goat sectors. J. Dairy Sci. 2018, 101, 6715–6729. [Google Scholar] [CrossRef] [Green Version]
  6. Cattaneo, T.M.; Holroyd, S.E. The use of near infrared spectroscopy for determination of adulteration and contamination in milk and milk powder: Updating knowledge. J. Near Infrared Spectrosc. 2013, 21, 341–349. [Google Scholar] [CrossRef]
  7. Da Paixao Teixeira, J.L.; dos Santos Carames, E.T.; Baptista, D.P.; Gigante, M.L.; Pallone, J.A.L. Vibrational spectroscopy and chemometrics tools for authenticity and improvement the safety control in goat milk. Food Control 2020, 112, 107105. [Google Scholar] [CrossRef]
  8. Ke, X.; Zhang, J.; Lai, S.; Chen, Q.; Zhang, Y.; Jiang, Y.; Mo, W.; Ren, Y. Quantitative analysis of cow whole milk and whey powder adulteration percentage in goat and sheep milk products by isotopic dilution-ultra-high performance liquid chromatography-tandem mass spectrometry. Anal. Bioanal. Chem. 2017, 409, 213–224. [Google Scholar] [CrossRef]
  9. Núñez, O. The Role of Capillary Electrophoresis in Food Integrity and Authenticity. In Chromatographic and Related Separation Techniques in Food Integrity and Authenticity. Volume A: Advances in Chromatographic Techniques; World Scientific Publishing Co Pte Ltd.: Singapore, 2021; pp. 71–104. [Google Scholar]
  10. Galan-Malo, P.; Mendiara, I.; Razquin, P.; Mata, L. Validation of a rapid lateral flow method for the detection of cows’ milk in water buffalo, sheep or goat milk. Food Addit. Contam. Part A 2018, 35, 609–614. [Google Scholar] [CrossRef]
  11. Di Pinto, A.; Terio, V.; Marchetti, P.; Bottaro, M.; Mottola, A.; Bozzo, G.; Bonerba, E.; Ceci, E.; Tantillo, G. DNA-based approach for species identification of goat-milk products. Food Chem. 2017, 229, 93–97. [Google Scholar] [CrossRef]
  12. De Brito, A.A.; Campos, F.; dos Reis Nascimento, A.; Damiani, C.; da Silva, F.A.; de Almeida Teixeira, G.H.; Júnior, L.C.C. Non-destructive determination of color, titratable acidity, and dry matter in intact tomatoes using a portable Vis-NIR spectrometer. J. Food Compos. Anal. 2021, 107, 104288. [Google Scholar] [CrossRef]
  13. Wang, J.; Zareef, M.; He, P.; Sun, H.; Chen, Q.; Li, H.; Ouyang, Q.; Guo, Z.; Zhang, Z.; Xu, D. Evaluation of matcha tea quality index using portable NIR spectroscopy coupled with chemometric algorithms. J. Sci. Food Agric. 2019, 99, 5019–5027. [Google Scholar] [CrossRef] [PubMed]
  14. Hwang, S.W.; Hwang, U.T.; Jo, K.; Lee, T.; Park, J.; Kim, J.C.; Kwak, H.W.; Choi, I.; Yeo, H. NIR-chemometric approaches for evaluating carbonization characteristics of hydrothermally carbonized lignin. Sci. Rep. 2021, 11, 1–8. [Google Scholar] [CrossRef]
  15. Deidda, R.; Sacre, P.Y.; Clavaud, M.; Coïc, L.; Avohou, H.; Hubert, P.; Ziemons, E. Vibrational spectroscopy in analysis of pharmaceuticals: Critical review of innovative portable and handheld NIR and Raman spectrophotometers. TrAC Trends Anal. Chem. 2019, 114, 251–259. [Google Scholar] [CrossRef]
  16. Li, X.; Zhang, L.; Zhang, Y.; Wang, D.; Wang, X.; Yu, L.; Zhang, W.; Li, P. Review of NIR spectroscopy methods for nondestructive quality analysis of oilseeds and edible oils. Trends Food Sci. Technol. 2020, 101, 172–181. [Google Scholar] [CrossRef]
  17. Karunathilaka, S.R.; Yakes, B.J.; He, K.; Chung, J.K.; Mossoba, M. Non-targeted NIR spectroscopy and SIMCA classification for commercial milk powder authentication: A study using eleven potential adulterants. Heliyon 2018, 4, e00806. [Google Scholar] [CrossRef] [PubMed] [Green Version]
  18. Da Silva Dias, L.; da Silva Junior, J.C.; Felício, A.L.D.S.M.; de França, J.A. A NIR photometer prototype with integrating sphere for the detection of added water in raw milk. IEEE Trans. Instrum. Meas. 2018, 67, 2812–2819. [Google Scholar] [CrossRef]
  19. Windarsih, A.; Rohman, A.; Irnawati; Riyanto, S. The Combination of Vibrational Spectroscopy and Chemometrics for Analysis of Milk Products Adulteration. Int. J. Food Sci. 2021, 2021, 8853358. [Google Scholar] [CrossRef]
  20. Da Paixao Teixeira, J.L.; dos Santos Carames, E.T.; Baptista, D.P.; Gigante, M.L.; Pallone, J.A.L. Rapid adulteration detection of yogurt and cheese made from goat milk by vibrational spectroscopy and chemometric tools. J. Food Compos. Anal. 2021, 96, 103712. [Google Scholar] [CrossRef]
  21. Dos Santos Pereira, E.V.; de Sousa Fernandes, D.D.; de Araújo, M.C.U.; Diniz, P.H.G.D.; Maciel, M.I.S. Simultaneous determination of goat milk adulteration with cow milk and their fat and protein contents using NIR spectroscopy and PLS algorithms. LWT 2020, 127, 109427. [Google Scholar] [CrossRef]
  22. Teixeira, J.L.D.P.; Caramês, E.T.D.S.; Baptista, D.P.; Gigante, M.L.; Pallone, J.A.L. Adulteration Detection in Goat Dairy Beverage Through NIR Spectroscopy and DD-SIMCA. Food Anal. Methods 2021, 15, 783–791. [Google Scholar] [CrossRef]
  23. Barnes, R.J.; Dhanoa, M.S.; Lister, S.J. Standard normal variate transformation and de-trending of near-infrared diffuse reflectance spectra. Appl. Spectrosc. 1989, 43, 772–777. [Google Scholar] [CrossRef]
  24. Lu, B.; Wang, X.; Liu, N.; He, K.; Wu, K.; Li, H.; Tang, X. Feasibility of NIR spectroscopy detection of moisture content in coco-peat substrate based on the optimization characteristic variables. Spectrochim. Acta Part A 2020, 239, 118455. [Google Scholar] [CrossRef] [PubMed]
  25. Stocchero, M. Iterative deflation algorithm, eigenvalue equations, and PLS2. J. Chemom. 2019, 33, e3144. [Google Scholar] [CrossRef]
  26. Galtier, O.; Abbas, O.; Le Dréau, Y.; Rebufa, C.; Kister, J.; Artaud, J.; Dupuy, N. Comparison of PLS1-DA, PLS2-DA and SIMCA for classification by origin of crude petroleum oils by MIR and virgin olive oils by NIR for different spectral regions. Vib. Spectrosc. 2011, 55, 132–140. [Google Scholar] [CrossRef]
  27. Pedro, A.M.; Ferreira, M.M. Simultaneously calibrating solids, sugars and acidity of tomato products using PLS2 and NIR spectroscopy. Anal. Chim. Acta 2007, 595, 221–227. [Google Scholar] [CrossRef]
  28. De Oliveira Neves, A.C.; Zougagh, M.; Ríos, Á.; Tauler, R.; Wakamatsu, K.; Galván, I. Pheomelanin subunit non-destructive quantification by Raman spectroscopy and multivariate curve resolution-alternating least squares (MCR-ALS). Chemom. Intell. Lab. Syst. 2021, 217, 104406. [Google Scholar] [CrossRef]
  29. Stella, A.; Bonnier, F.; Tfayli, A.; Yvergnaux, F.; Byrne, H.J.; Chourpa, I.; Munnier, E.; Tauber, C. Raman mapping coupled to self-modelling MCR-ALS analysis to estimate active cosmetic ingredient penetration profile in skin. J. Biophotonics 2020, 13, e202000136. [Google Scholar] [CrossRef]
  30. Mazivila, S.J.; Lombardi, J.M.; Páscoa, R.N.; Bortolato, S.A.; Leitão, J.M.; da Silva, J.C.E. Three-way calibration using PARAFAC and MCR-ALS with previous synchronization of second-order chromatographic data through a new functional alignment of pure vectors for the quantification in the presence of retention time shifts in peak position and shape. Anal. Chim. Acta 2021, 1146, 98–108. [Google Scholar] [CrossRef]
  31. Alcaráz, M.R.; Schenone, A.V.; Culzoni, M.J.; Goicoechea, H.C. Modeling of second-order spectrophotometric data generated by a pH-gradient flow injection technique for the determination of doxorubicin in human plasma. Microchem. J. 2014, 112, 25–33. [Google Scholar] [CrossRef]
  32. Kaur, P.; Imteaz, M.A.; Sillanpää, M.; Sangal, V.K.; Kushwaha, J.P. Parametric optimization and MCR-ALS kinetic modeling of electro oxidation process for the treatment of textile wastewater. Chemom. Intell. Lab. Syst. 2020, 203, 104027. [Google Scholar] [CrossRef]
  33. De Meutter, J.; Goormaghtigh, E. Protein Structural Denaturation Evaluated by MCR-ALS of Protein Microarray FTIR Spectra. Anal. Chem. 2021, 93, 13441–13449. [Google Scholar] [CrossRef] [PubMed]
  34. Benavente, F.; Pero-Gascon, R.; Pont, L.; Jaumot, J.; Barbosa, J.; Sanz-Nebot, V. Identification of antihypertensive peptides in nutraceuticals by capillary electrophoresis-mass spectrometry. J. Chromatogr. A 2018, 1579, 129–137. [Google Scholar] [CrossRef]
  35. Zhang, Y.; Zhang, G.; Zhou, X.; Li, Y. Determination of acetamiprid partial-intercalative binding to DNA by use of spectroscopic, chemometrics, and molecular docking techniques. Anal. Bioanal. Chem. 2013, 405, 8871–8883. [Google Scholar] [CrossRef]
  36. Azzouz, T.; Tauler, R. Application of multivariate curve resolution alternating least squares (MCR-ALS) to the quantitative analysis of pharmaceutical and agricultural samples. Talanta 2008, 74, 1201–1210. [Google Scholar] [CrossRef] [PubMed]
  37. Castro, R.C.; Ribeiro, D.S.; Santos, J.L.; Páscoa, R.N. Near infrared spectroscopy coupled to MCR-ALS for the identification and quantification of saffron adulterants: Application to complex mixtures. Food Control 2021, 123, 107776. [Google Scholar] [CrossRef]
  38. Colares, C.J.; Pastore, T.C.; Coradin, V.T.; Marques, L.F.; Moreira, A.C.; Alexandrino, G.L.; Poppi, R.J.; Braga, J.W. Near infrared hyperspectral imaging and MCR-ALS applied for mapping chemical composition of the wood specie Swietenia Macrophylla King (Mahogany) at microscopic level. Microchem. J. 2016, 124, 356–363. [Google Scholar] [CrossRef]
  39. González-Sáiz, J.M.; Esteban-Díez, I.; Rodríguez-Tecedor, S.; Pizarro, C. Valorization of onion waste and by-products: MCR-ALS applied to reveal the compositional profiles of alcoholic fermentations of onion juice monitored by near-infrared spectroscopy. Biotechnol. Bioeng. 2008, 101, 776–787. [Google Scholar] [CrossRef]
  40. Jaumot, J.; de Juan, A.; Tauler, R. MCR-ALS GUI 2.0: New features and applications. Chemom. Intell. Lab. Syst. 2015, 140, 1–12. [Google Scholar] [CrossRef]
  41. Dos Santos Pereira, E.V.; de Sousa Fernandes, D.D.; de Araújo, M.C.U.; Diniz, P.H.G.D.; Maciel, M.I.S. In-situ authentication of goat milk in terms of its adulteration with cow milk using a low-cost portable NIR spectrophotometer. Microchem. J. 2021, 163, 105885. [Google Scholar] [CrossRef]
  42. Yun, Y.H.; Li, H.D.; Deng, B.C.; Cao, D.S. An overview of variable selection methods in multivariate analysis of near-infrared spectra. TrAC Trends Anal. Chem. 2019, 113, 102–115. [Google Scholar] [CrossRef]
  43. Masemola, C.; Cho, M.A. Estimating leaf nitrogen concentration from similarities in fresh and dry leaf spectral bands using a model population analysis framework. Int. J. Remote Sens. 2019, 40, 6841–6860. [Google Scholar] [CrossRef]
  44. Qiu, G.; Lü, E.; Wang, N.; Lu, H.; Wang, F.; Zeng, F. Cultivar classification of single sweet corn seed using fourier transform near-infrared spectroscopy combined with discriminant analysis. Appl. Sci. 2019, 9, 1530. [Google Scholar] [CrossRef] [Green Version]
  45. Lee, J.C.; Yoon, Y.H.; Kim, S.M.; Pyo, B.S.; Hsieh, F.H.; Kim, H.J.; Eun, J.B. Rapid prediction of amylose content of polished rice by Fourier transform near-infrared spectroscopy. Food Sci. Biotechnol. 2007, 16, 477–481. [Google Scholar]
Figure 1. Flowchart of steps of the resolution process in the MCR-ALS method.
Agriculture 12 00434 g001
Figure 2. Average spectra of pure urea, melamine, starch, and goat milk powder with shaded error bands.
Agriculture 12 00434 g002
Figure 3. The molecular structures of urea (a), melamine (b), and starch (c).
Agriculture 12 00434 g003
Figure 4. Predicted vs. reference plots for prediction sets of the three best full spectral PLS1 models for urea determination (a), melamine determination (b) with an enlarged view in the range of 0–0.1% (c), and starch determination (d).
Agriculture 12 00434 g004
Figure 5. Average spectra of goat milk powder and the three adulterants (urea (a), melamine (b), and starch (c)) after the application of optimal pretreatments with the flagged characteristic wave-lengths.
Agriculture 12 00434 g005aAgriculture 12 00434 g005b
Figure 6. Predicted vs. reference plots for the prediction sets of the three multispectral PLS1 models for urea determination (a), melamine determination (b) with an enlarged view in range of 0–0.1% (c), and starch determination (d).
Agriculture 12 00434 g006
Figure 7. Predicted vs. reference plots for prediction set of the PLS2 model for goat milk powder determination (a), urea determination (b), melamine determination (c), and starch determination (d), based on the NON pretreated spectra.
Agriculture 12 00434 g007
Figure 8. Predicted vs. reference plots for prediction set of the MCR-ALS model for goat milk powder determination (a), urea determination (b), melamine determination (c), and starch determination (d) based on the spectra without pretreatment.
Agriculture 12 00434 g008aAgriculture 12 00434 g008b
Table 1. The proportioning of goat milk powder with multiple adulterants.
NumberGoat Milk PowderUreaMelamineStarch
198.5%0%0.5%1%
297.7%0.8%1.5%0%
397.3%1.5%0%1.2%
492%1%2%5%
584%2%4%10%
672%5%8%15%
760%8%12%20%
Table 2. Results of each adulterant in the prediction set based on the corresponding best models.
Actual Value (%)Predicted Value (%)Absolute error (%)
UreaMelamineStarchUreaMelamineStarchUreaMelamineStarch
0.00.000.00.0−0.01−0.10.00.010.1
0.50.011.00.3−0.001.10.20.010.1
0.80.055.00.90.044.90.10.010.1
1.00.1010.01.40.139.90.40.030.1
2.00.5015.02.20.4715.20.20.030.2
5.01.0020.05.31.0220.10.30.020.1
8.05.0025.07.75.0525.00.30.050.0
10.010.0030.010.09.9829.90.00.020.1
Table 3. Characteristic wavelengths selected by SPA.
AdulterantWavelength (nm)
urea993, 1037, 1219
melamine1027, 1929, 2208
starch802, 1612, 1724, 1873
Table 4. Performance of the multispectral PLSR models for quantification of each of the three adulterants based on the characteristic wavelengths.
AdulterantLVsCalibrationCross-ValidationPrediction
R c 2 RMSEC (%) R c v 2 RMSECV (%) R p 2 RMSEP (%)
urea30.9900.3610.9890.3690.9870.403
melamine30.9990.1290.9990.1290.9990.133
starch41.0000.2101.0000.2131.0000.220
Table 5. Performance of the PLS2 models for multiple-adulterants samples using different pretreatment methods based on the full spectral range.
PretreatmentComponentLVsCalibrationCross-ValidationPrediction
R c 2 RMSEC (%) R c v 2 RMSECV (%) R p 2 RMSEP (%)
NONgoat milk60.9990.4890.9990.4990.9990.541
urea60.9990.0990.9980.1060.9980.110
melamine60.9980.1800.9980.1820.9980.188
starch60.9990.2710.9990.2750.9980.289
NORgoat milk60.9990.4880.9990.4990.9990.538
urea60.9990.0960.9990.1020.9980.111
melamine60.9980.1780.9980.1810.9980.189
starch60.9990.2680.9990.2730.9980.292
MASgoat milk60.9990.4900.9990.5040.9990.537
urea60.9980.1110.9980.1150.9980.126
melamine60.9980.1810.9980.1840.9980.189
starch60.9990.2670.9990.2740.9980.293
Table 6. Performance of the MCR-ALS models for multiple adulterants samples using different pretreatment methods based on the full spectral range.
PretreatmentComponentNumber of Calibration/Prediction LOF % EV % σ CalibrationPrediction
R c 2 RMSEC (%) R p 2 RMSEP (%)
NONgoat milk98/420.76899.990.0020.9960.8380.9960.879
urea0/140/0.6792.529
melamine98/420.9900.4040.9890.434
starch0/140/0.8704.279
NORgoat milk98/420.77499.990.0020.9960.8340.9960.903
urea0/140/0.6812.368
melamine98/420.9900.4100.9890.436
starch0/140/0.8674.524
MASgoat milk98/420.77199.990.0020.9960.8350.9960.873
urea0/140/0.6862.604
melamine98/420.9910.3830.9870.470
starch0/140/0.8734.254
Publisher’s Note: MDPI stays neutral with regard to jurisdictional claims in published maps and institutional affiliations.

