Article

Online Detection and Classification of Moldy Core Apples by Vis-NIR Transmittance Spectroscopy

1
College of Engineering, China Agricultural University, Beijing 100083, China
2
College of Mechanical and Electronic Engineering, Nanjing Forestry University, Nanjing 210037, China
*
Author to whom correspondence should be addressed.
Agriculture 2022, 12(4), 489; https://doi.org/10.3390/agriculture12040489
Submission received: 1 March 2022 / Revised: 20 March 2022 / Accepted: 28 March 2022 / Published: 30 March 2022
(This article belongs to the Special Issue Sensors Applied to Agricultural Products)

Abstract

:
Apple moldy core disease is a common internal fungal disease. The online detection and classification of apple moldy core plays a vital role in apple postharvest processing. In this paper, an online non-destructive detection system for apple moldy core disease was developed using near-infrared transmittance spectroscopy in spectral range of 600–1100 nm. A total of 120 apple samples were selected and randomly divided into a training set and a test set based on the ratio of 2:1. First, basic parameters for detection of apples with moldy core were determined through detection experiments of samples in a stationary state. Due to the random distribution of the diseased tissue inside diseased apples, stationary detection cannot accurately identify the diseased tissue. To solve this problem, the spectra of apples in motion state transmitted forward by the transmission line were acquired. Three placement orientations of the apple in the carrying fruit cup were tested to explore the influence of fruit orientation on spectral characteristics and prediction. According to the performance of the model, the optimal preprocessing method and modeling method were determined (fixed orientation model and arbitrary orientation model). SPA was used to select the characteristic wavelengths to further improve the online detection speed. The overall results showed that the multi-spectra model using mean spectra of three orientations was the best. The prediction accuracies of multi-spectra model using SPA for three orientations were 96.7%, 97.5% and 97.5% respectively. As a conclusion, the arbitrary orientation model was beneficial to improve the online detection of apple moldy core disease.

1. Introduction

Apples are favored by people in daily life owing to their rich vitamins, minerals, and good taste [1]. With the continuous improvement of people’s living standards, consumers’ focus on food quality is growing [2]. However, apples are prone to various defects such as mechanical damage, rotting, and mildew infections before, during, and after harvesting. In order to improve the quality of apples, it is very important to detect these defects after harvest and before sale [3].
Apple moldy core disease is a common internal disease caused by several (up to seven) fungal pathogens [4]. Regardless of the degree of internal moldy core and carpel region, it would seriously affect the fruit quality and customer satisfaction. Generally, the moldy core infects apples at its early developmental stage. There are no apparent symptoms or external features on the exterior visually, and the conventional quality-control methods performed by the machine visualization of the apple-processing industry cannot detect a case where the internal moldy core exists [5]. Even if the myocardial infection is started in the field, the number of affected fruits after storage is higher in the cold room [6]. In addition, if apples with moldy core disease enter further processing for apple juice production and wine brewing, the diseased tissues will enter the apple juice, cider, and other by-products. This can cause spoilage of these apple products and byproducts, and the mycotoxin level also exceeds the predetermined threshold value of food regulatory agencies [7,8]. Therefore, a non-destructive detection method is critical to detect apples with moldy core disease early at post-harvest so as to improve fruit quality and reduce or eliminate food safety hazards caused by the moldy core disease.
There are already a number of techniques available for non-destructive detection of apples’ internal defects, including X-ray imaging, magnetic resonance imaging, and thermal imaging. Using a method combining X-ray radiography with 3D shape recognition and modeling, van Dael et al. [9] periodically collected X-ray computed tomography images of 26 apples with internal browning over a period of 9 months. The final model accurately detected internal browning and assessed the amount of storage disorder present in a sample with an R2 value of 0.83. Clark et al. [10] used proton magnetic resonance imaging to study the spatial distribution of affected tissues in apples with watercore disease in different seasons and found that the proportion of affected tissues decreased linearly with time and the spatial distribution of tissues was season dependent. Thermal imaging technology creates a bit map called a thermogram by detecting infrared radiation emitted by objects. J. Varith et al. [11] used this technology to detect bruising of apples during heating by discriminating the surface temperature of bruised and normal tissues. However, these methods are not suitable for online detection because of their limitations in practical commercial applications due to long detection time, expensive equipment, and even radiation residue.
Visible-near infrared (Vis/NIR) spectroscopy is a fast and non-destructive testing technique, which is commonly used in combination with multivariate mathematical techniques and chemometric methods [12]. This technique has been widely applied in nondestructive detection of various internal composition indicators of apples, such as moisture, firmness, acidity, starch content, and soluble solids content. In addition, Vis/NIR is also used in the detection of apple internal diseases [13,14,15,16]. Mogoll’on et al. [17] correctly predicted bitter pit in ‘Fuji’ apples during storage using the PLS classification model based on NIR reflectance spectra. The detection accuracy and sensitivity of apples with severe bitter pit reached 80–90% effectiveness. Clark et al. [18] studied the effects of light source, fruit orientation, and detector arrangement on the detection of internal browning of ‘Braeburn’ apples by near-infrared transmission spectroscopy. For all different geometries affected by internal browning, the correlation coefficients of the developed calibration models applied to the independent validation set were between 0.69 and 0.91. Huang et al. [19] used a non-contact multi-channel spectroscopic system to detect apples’ internal defects in a semi-transmission mode. The effects of three fruit orientations on the detection were investigated, and the results showed that the model based on the average spectrum had better classification results. From the perspective of optical information acquisition, there are mainly two modes, i.e., reflection mode and transmission mode. In reflection mode, the optical fiber and light sources are located on the same side of the sample. In this case, reflection spectra within the detectable spectral range are obtained (about 1–2 cm thickness) from a surface area of the fruit [20]. Therefore, the diffuse reflection mode mainly detects defects and ingredients on the surface of the fruit. While in the transmission mode, the optical fiber and the light sources are located on opposite side of the sample under test. Thus, the spectrometer can directly obtain the transmitted light of the tested sample and detect the internal characteristics of the fruit. Fu et al. [21] found that the transmission mode can detect the brown heart of a pear better than the reflection mode. Guo et al. [22] used visible near-infrared transmission spectroscopy to quantitatively analyze the internal quality and diseases of apples and obtained good detection results. Shenderey et al. [23] evaluated the level of visible near-infrared micro-spectrometer online detection of apple moldy core disease, which provided a theoretical foundation for applying online detection in commercial post-harvest fruit inspection and processing. These studies suggested that the transmission mode was more suitable for detecting internal defects of fruits with homogeneous internal tissues, such as apples.
The above studies mainly focused on stationary detection in the laboratory or motion detection on a simple prototype, and the application level mostly stayed in the laboratory stage without realizing online detection application. In addition, the orientation of the samples when collecting spectra is also an important factor that affects the quality of the spectra in the online detection process [21,24]. Han et al. [25] compared the effects of three fruit-placement methods (T1: stem-calyx was horizontal; T2: fruit stem was facing down; T3: fruit stem was facing down) on the detection of soluble solid content in apples, and the results showed that the T1 direction model had the best performance among the three directions. During the actual commercial fruit online detection process, after the automatic loading of a large number of fruits, the orientation of fruits on the detection line is random. For the detection of relatively homogeneous indicators such as sugar content and acidity, online detection of these indicators has been realized by many researchers. However, for the detection indicator of moldy core disease, the affected tissue inside the diseased fruit is unevenly distributed. Motion detection is more effective than stationary detection, but it is still greatly affected by the placement orientation of the fruit on the test line. Therefore, it is of great significance to study the influence of fruit detection orientation relative to light source and optical fiber to improve the accuracy of online detection. To date, Vis/NIR technology has made certain research progress in the orientation of fruit internal quality inspection, but few reports have examined the influence of fruit detection orientation on spectral information to ensure accuracy of online detection.
Taking ‘Fuji’ apples as samples, the overall goal of this study was to realize the effectiveness of the online detection of moldy core disease in transmission mode. In the research process, the stationary and motion spectra were acquired and the spectra of healthy and diseased apples were compared to explore the differences. The influence of apple placement orientation on spectral online detection was explored. Based on the single-orientation spectrum and the multi-orientation averaged spectrum, the performance of the single-orientation and multi-orientation full-spectrum models was compared. Finally, the multi-spectral model was established using the feature wavelength extraction method, which improved the detection speed and was more suitable for online detection.

2. Materials and Methods

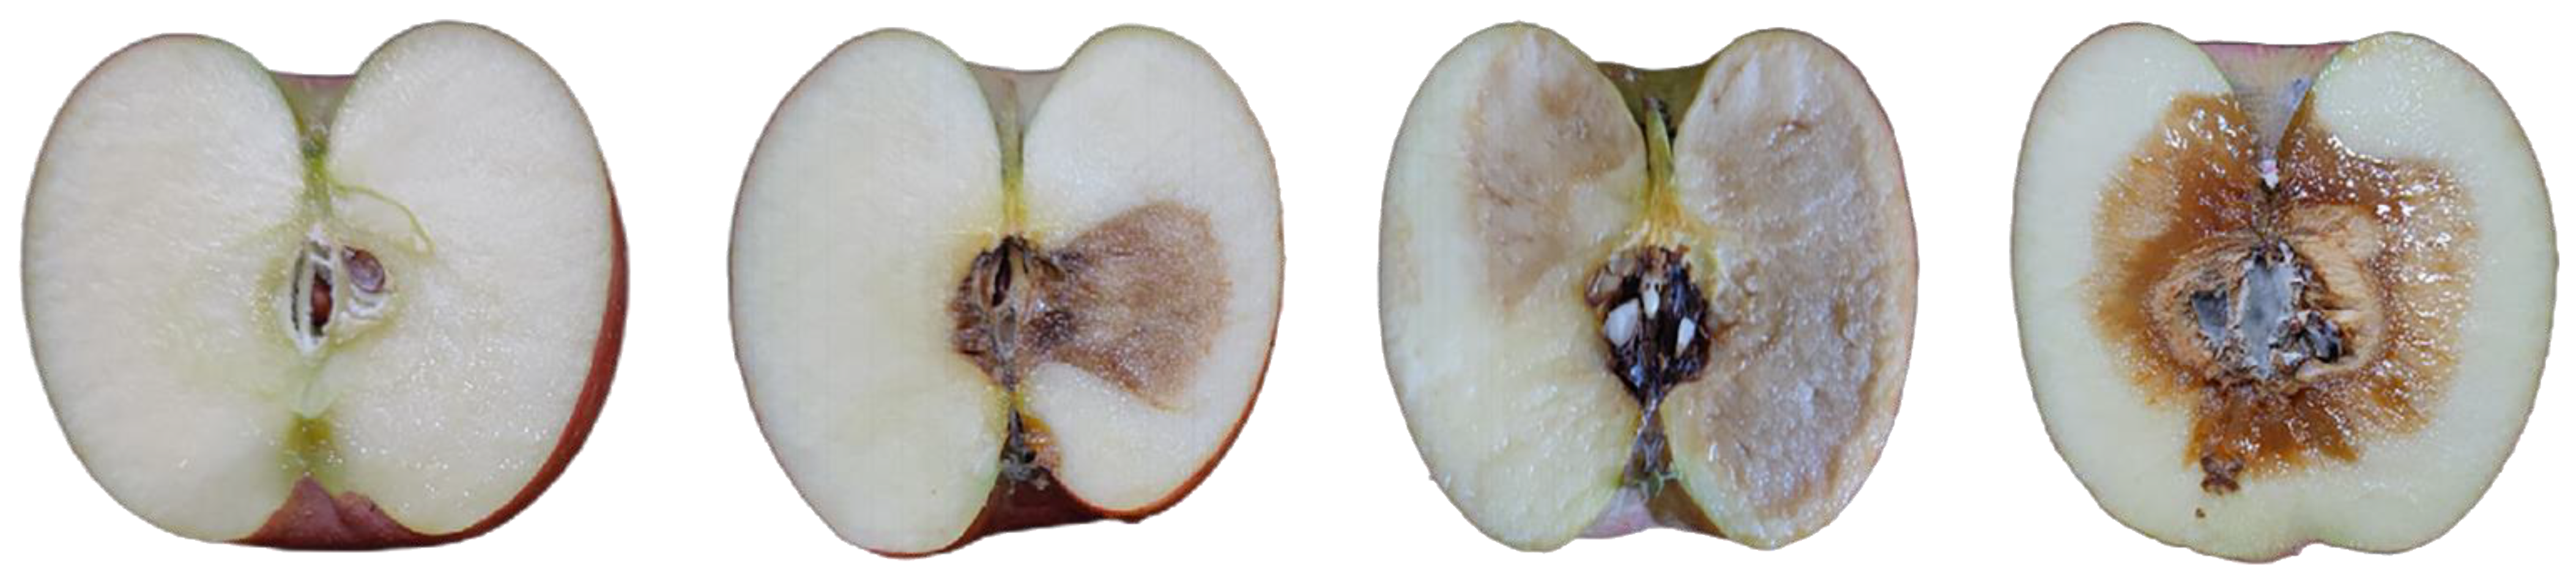
2.1. Sample Preparation

The apple samples used in the study were ‘Fuji’ apples freshly picked from an apple orchard in Luoyang, China. The diameters of the apple samples were between 80 and 90 mm, and there were no mechanical damages on the surface. The apples with moldy core disease used in this study were obtained after harvest at maturity. The number of samples was 120. The apples were kept in a laboratory environment for 24 h at temperature of 20 °C and relative humidity of 25–35%.
Prior to this study, research on the online detection of sugar content of fruits such as apples, peaches, and kiwifruit had been carried out and experiments were performed on up to 1000 samples in total. Taking peach as an example, we collected stationary and motion spectra of peach samples. The Brix value of each sample was measured using a Brix meter. Various preprocessing methods and modeling methods were tried and the final model performance was compared. The above experiments were more to explore the relationship between the visible near-infrared spectrum of fruit and the chemical measurements of internal substances. This provided a certain research basis for the study of apple moldy core disease in this study. The study in this paper was based on the above-mentioned large-scale online detection of fruits’ sugar content. According to previous experimental experience, the spectral data of more than 100 samples could obtain a model with better performance by dividing the training set and the validation set. A sample size of 120 was sufficient for exploring the online detection and sorting of moldy core disease.

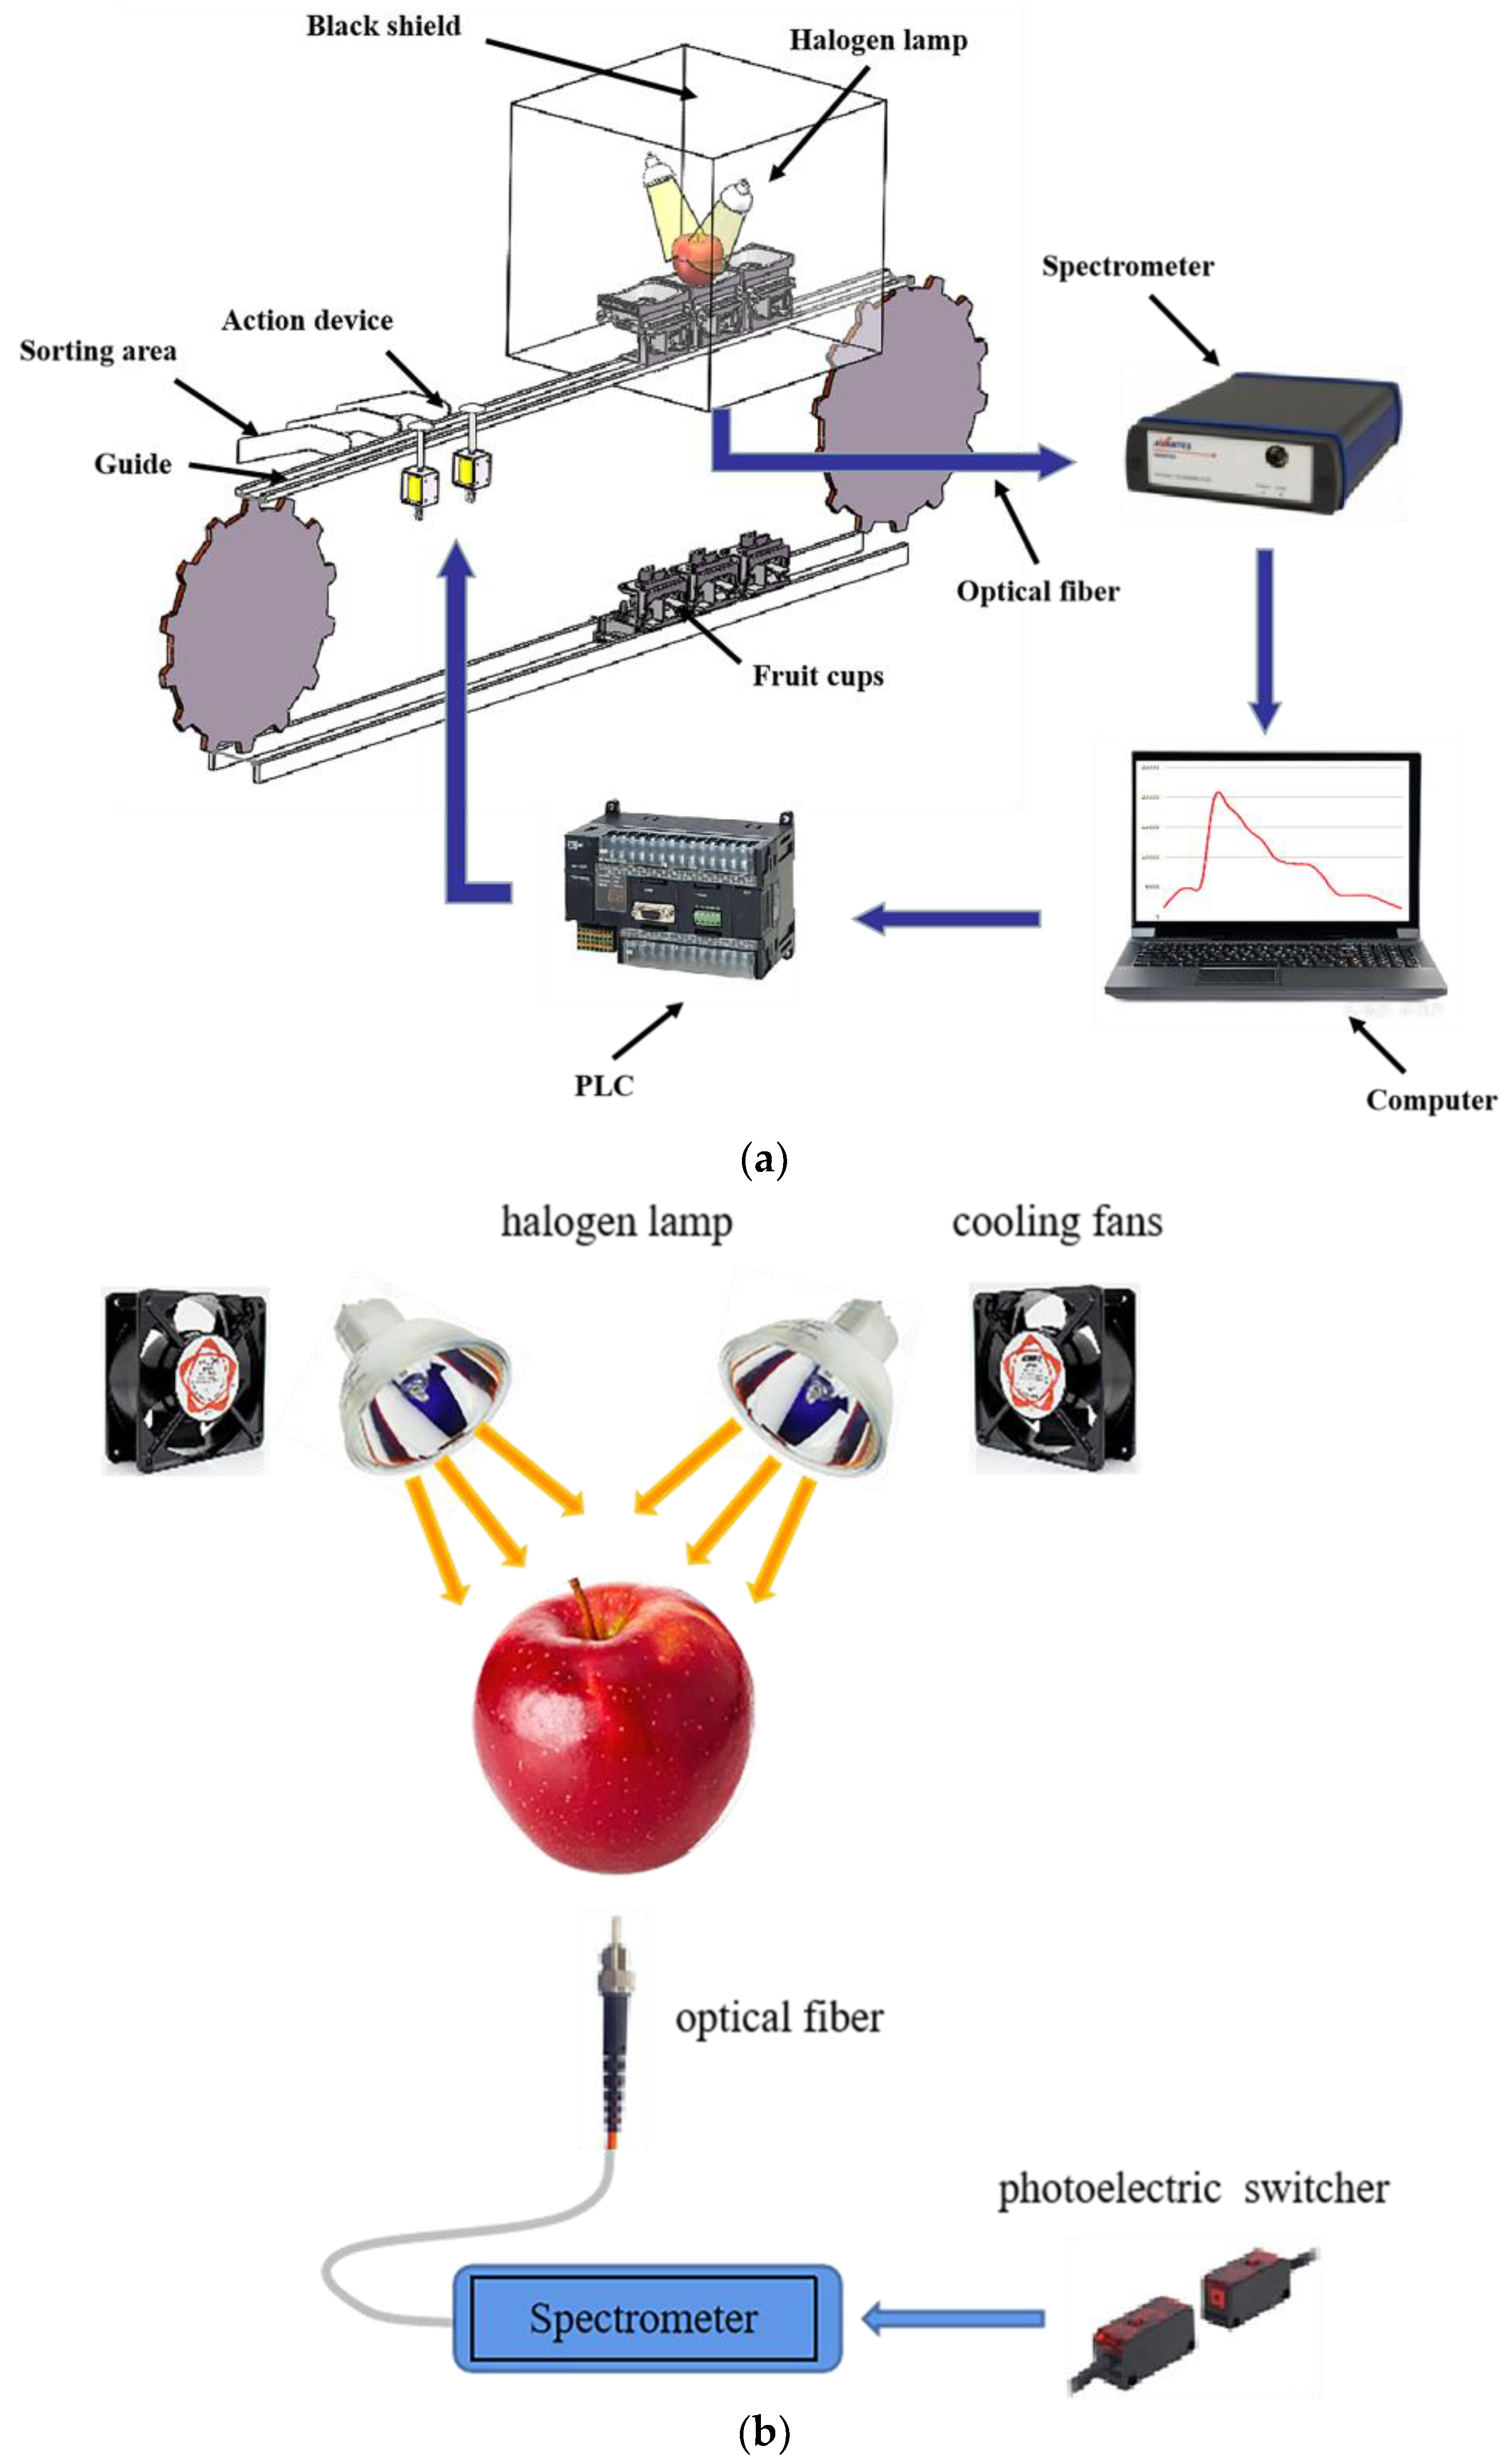
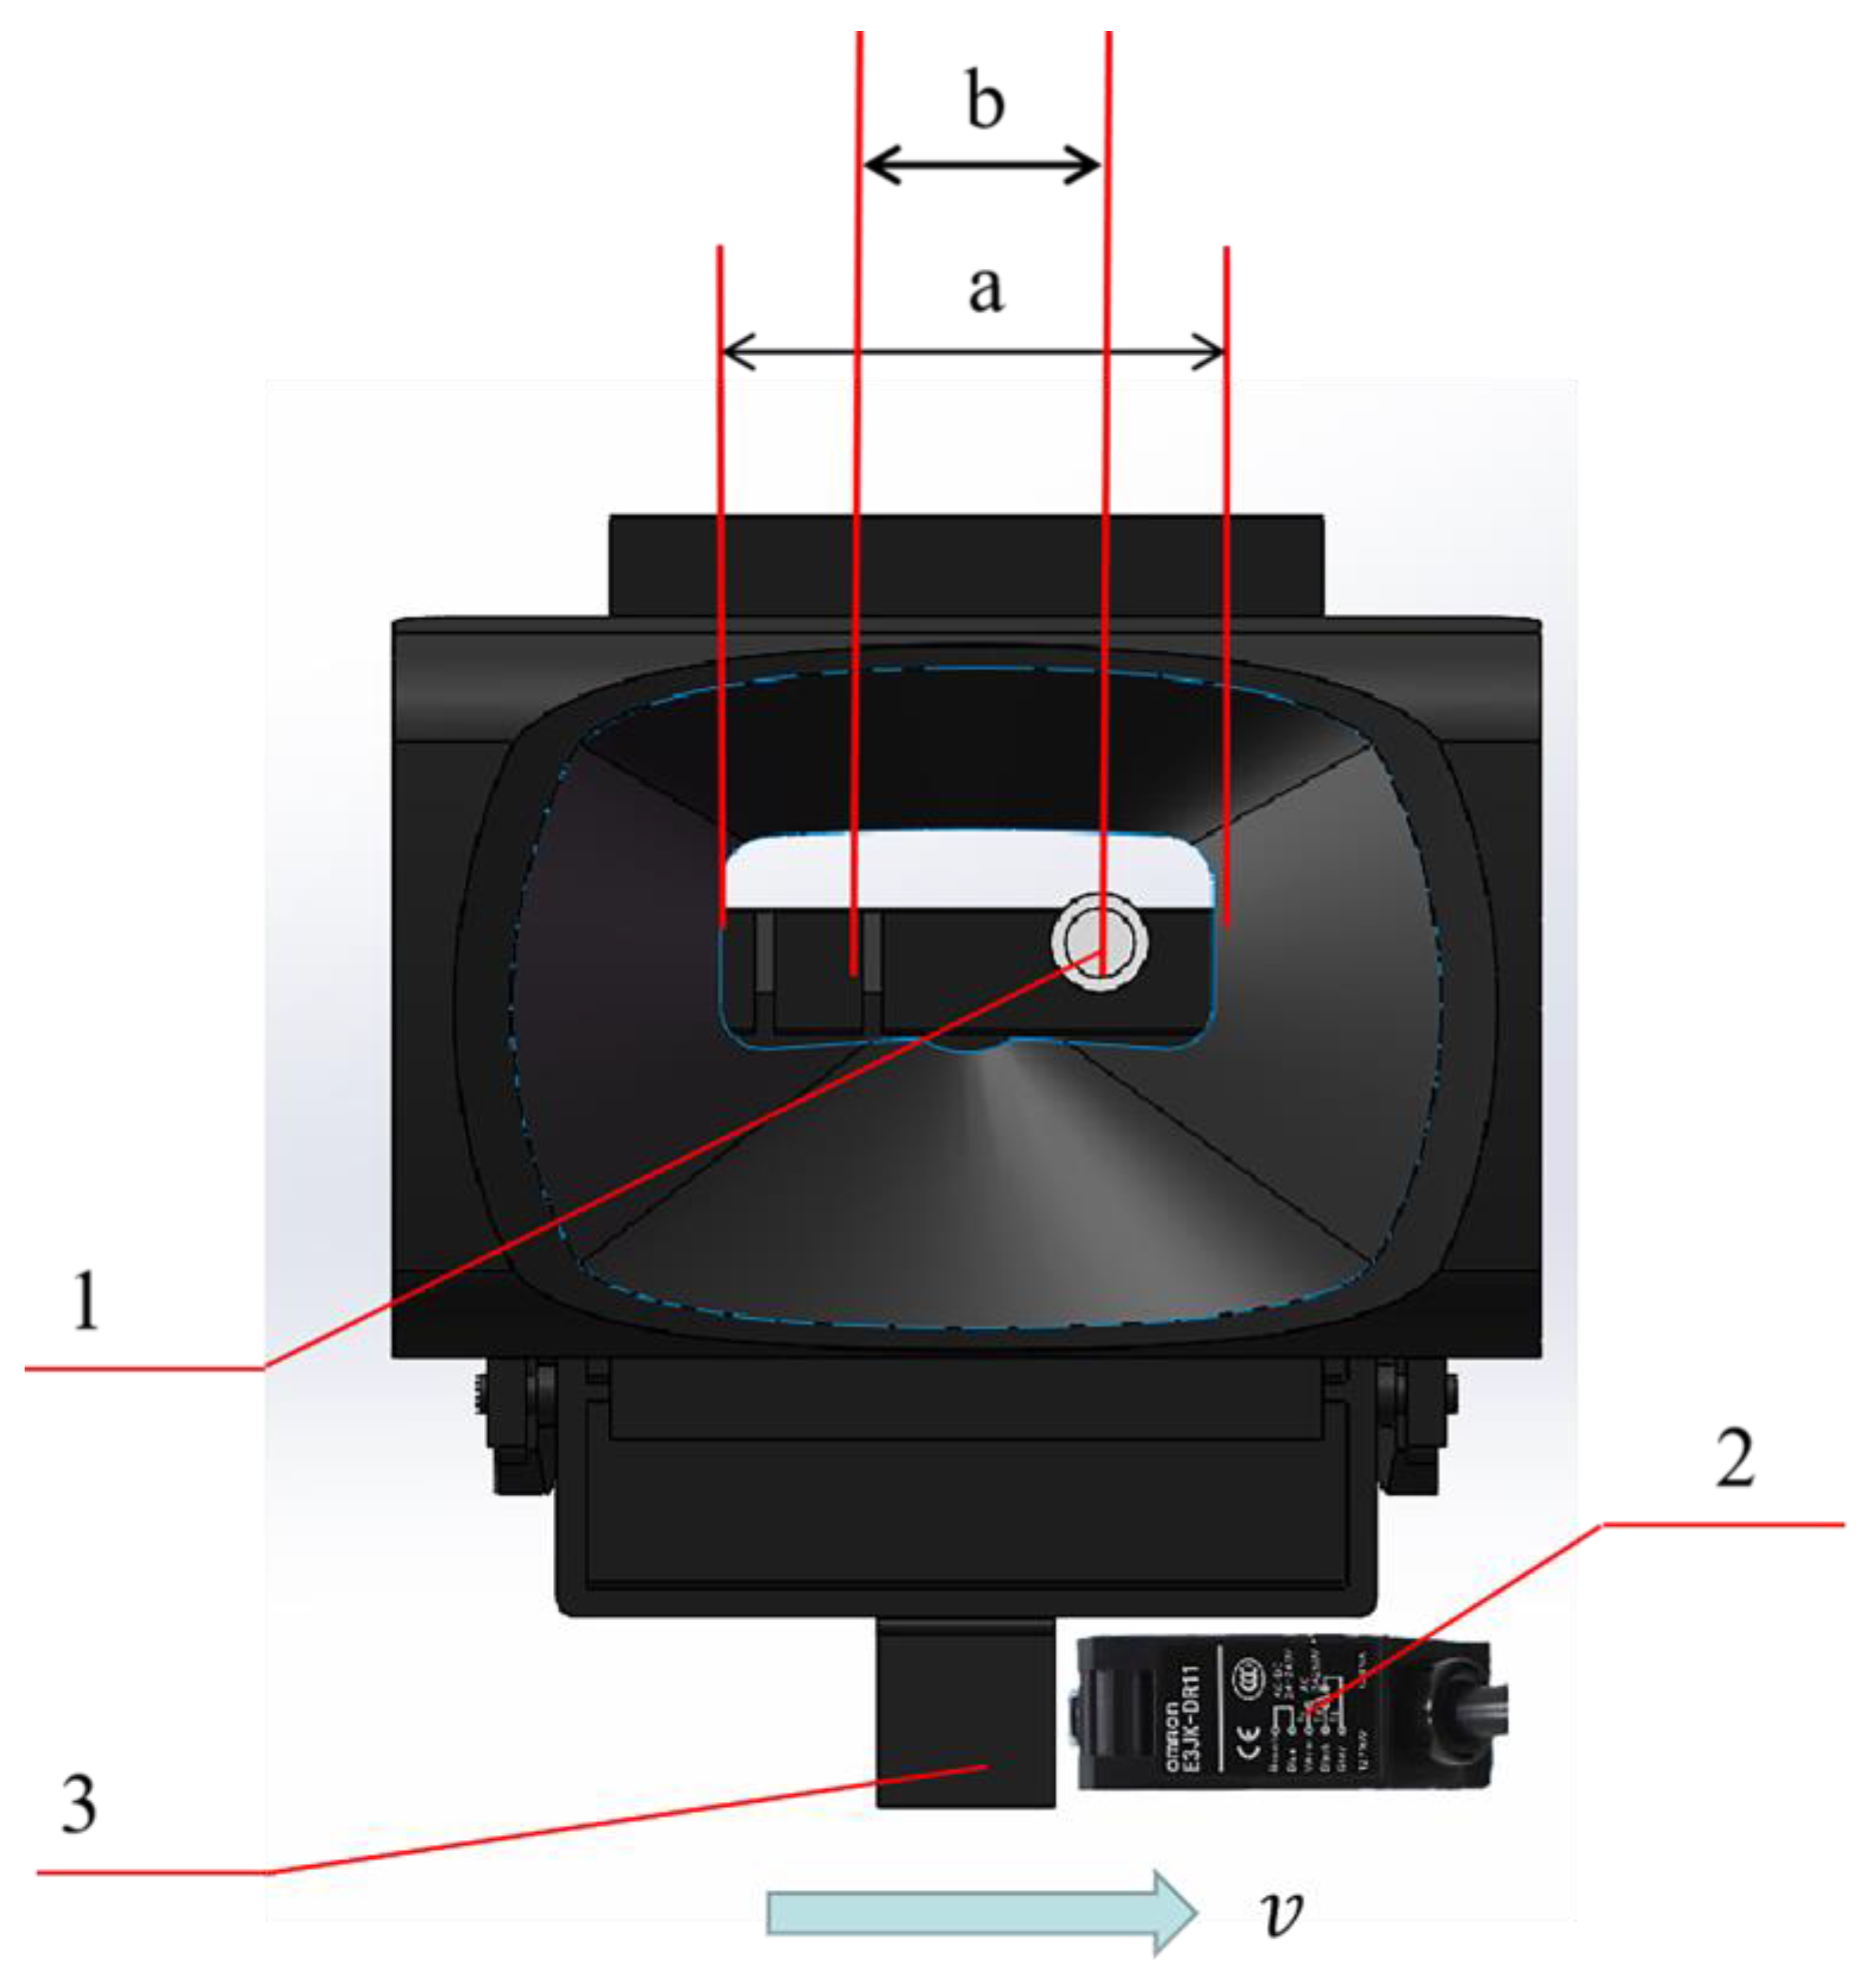
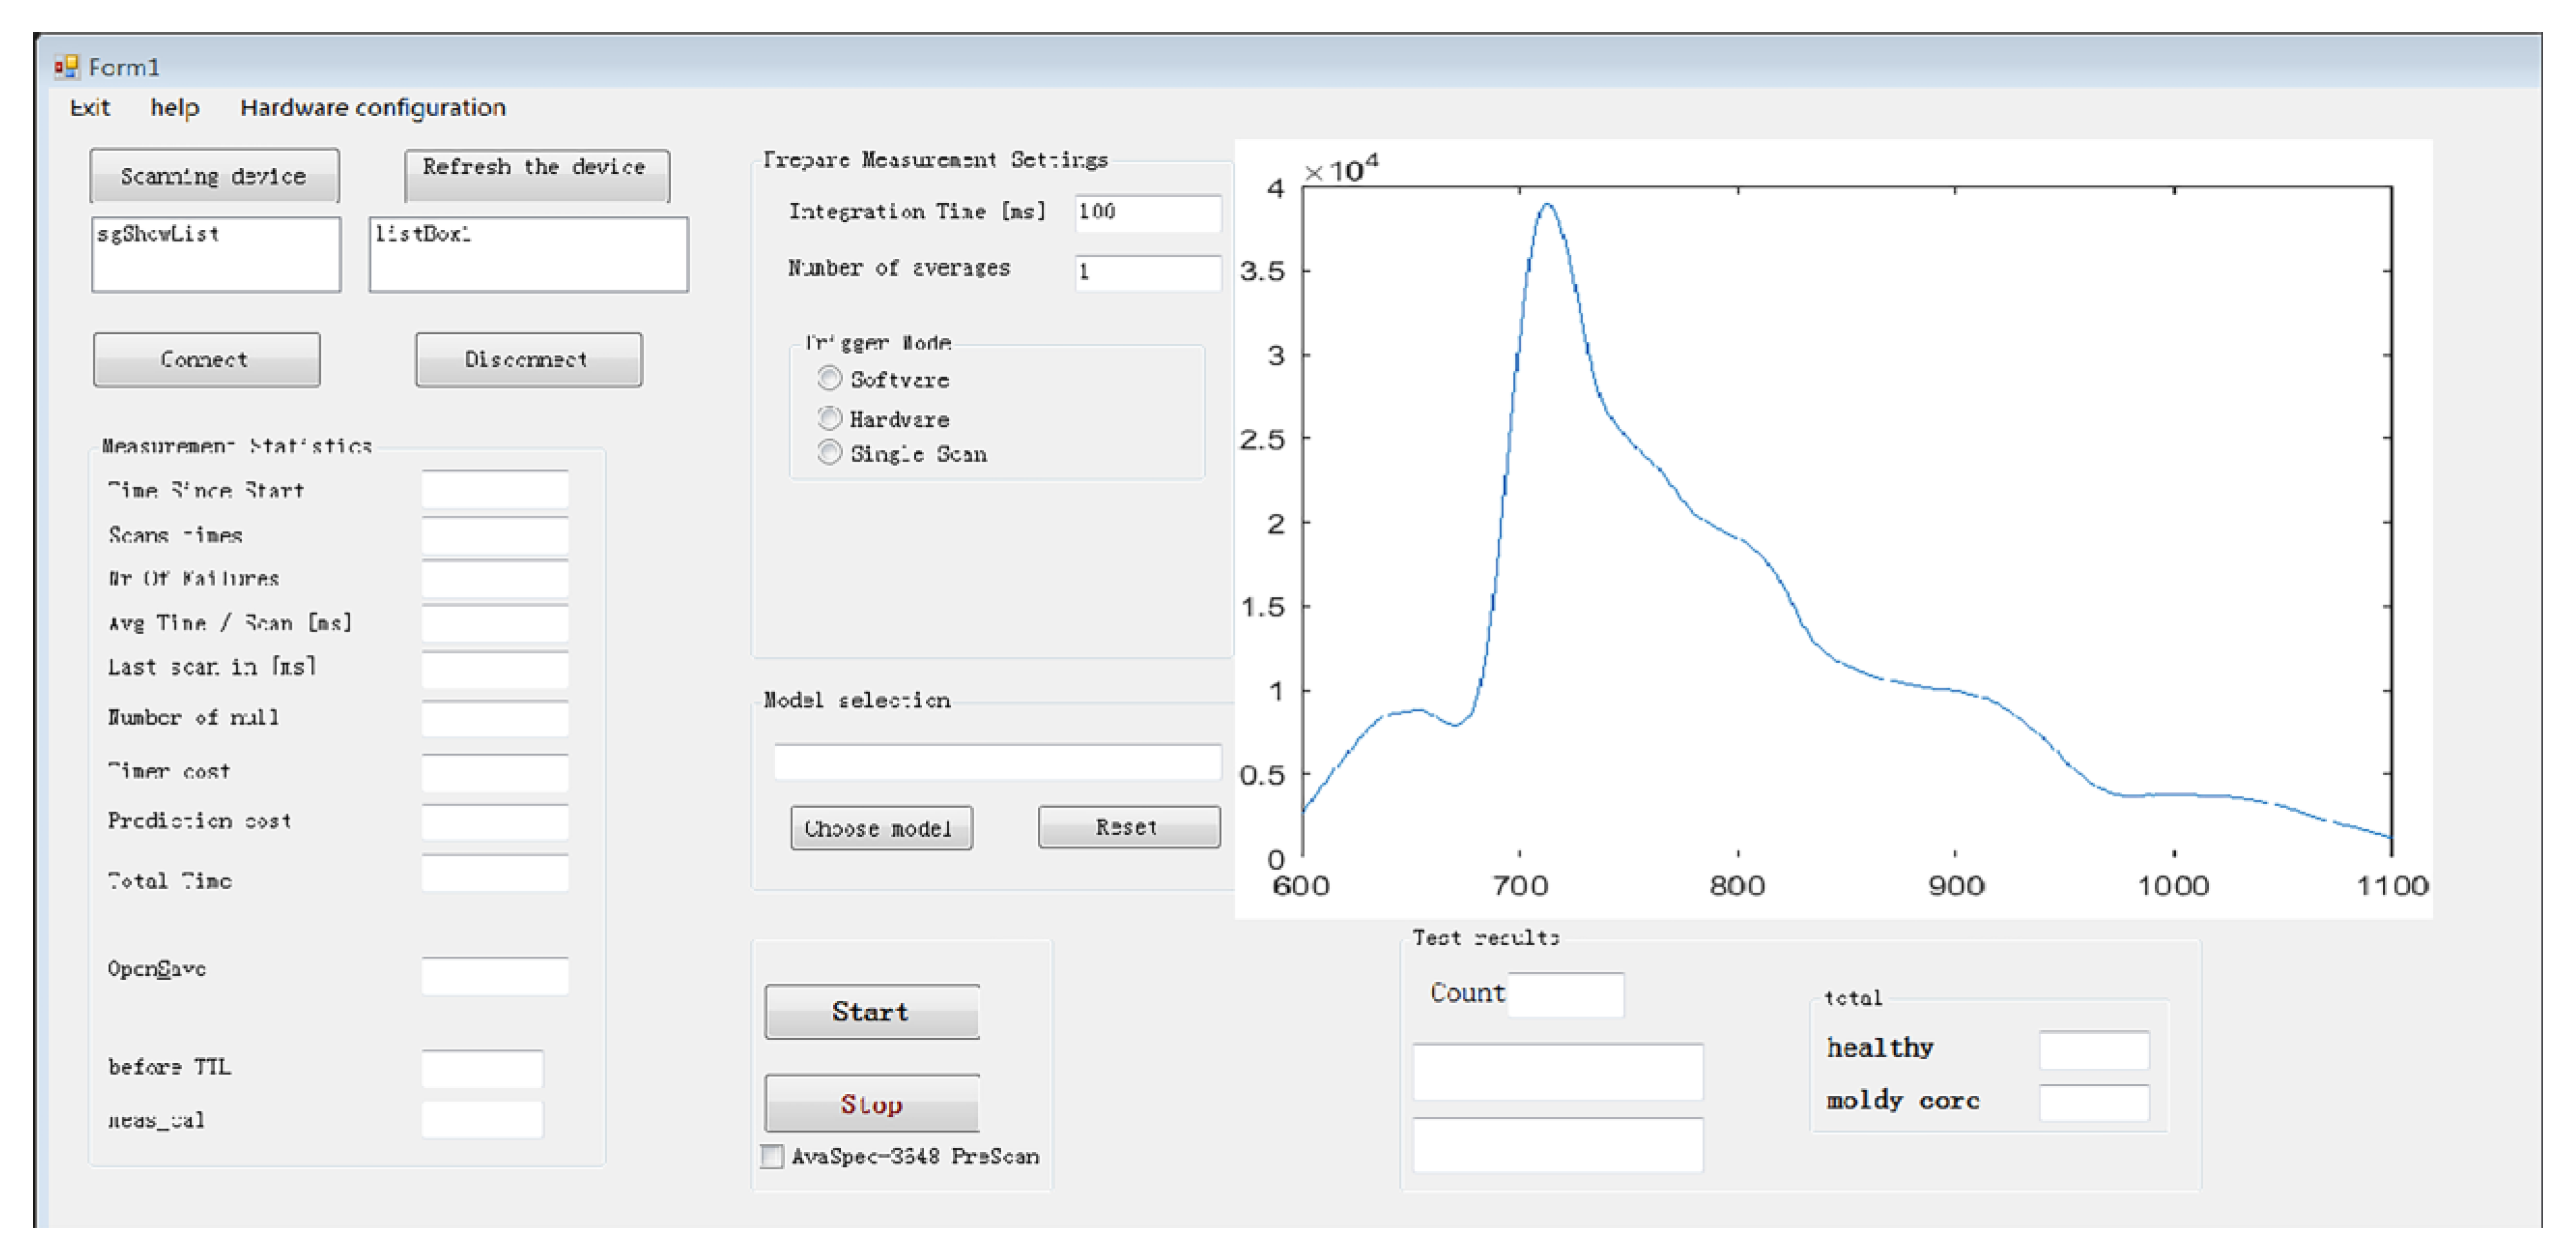
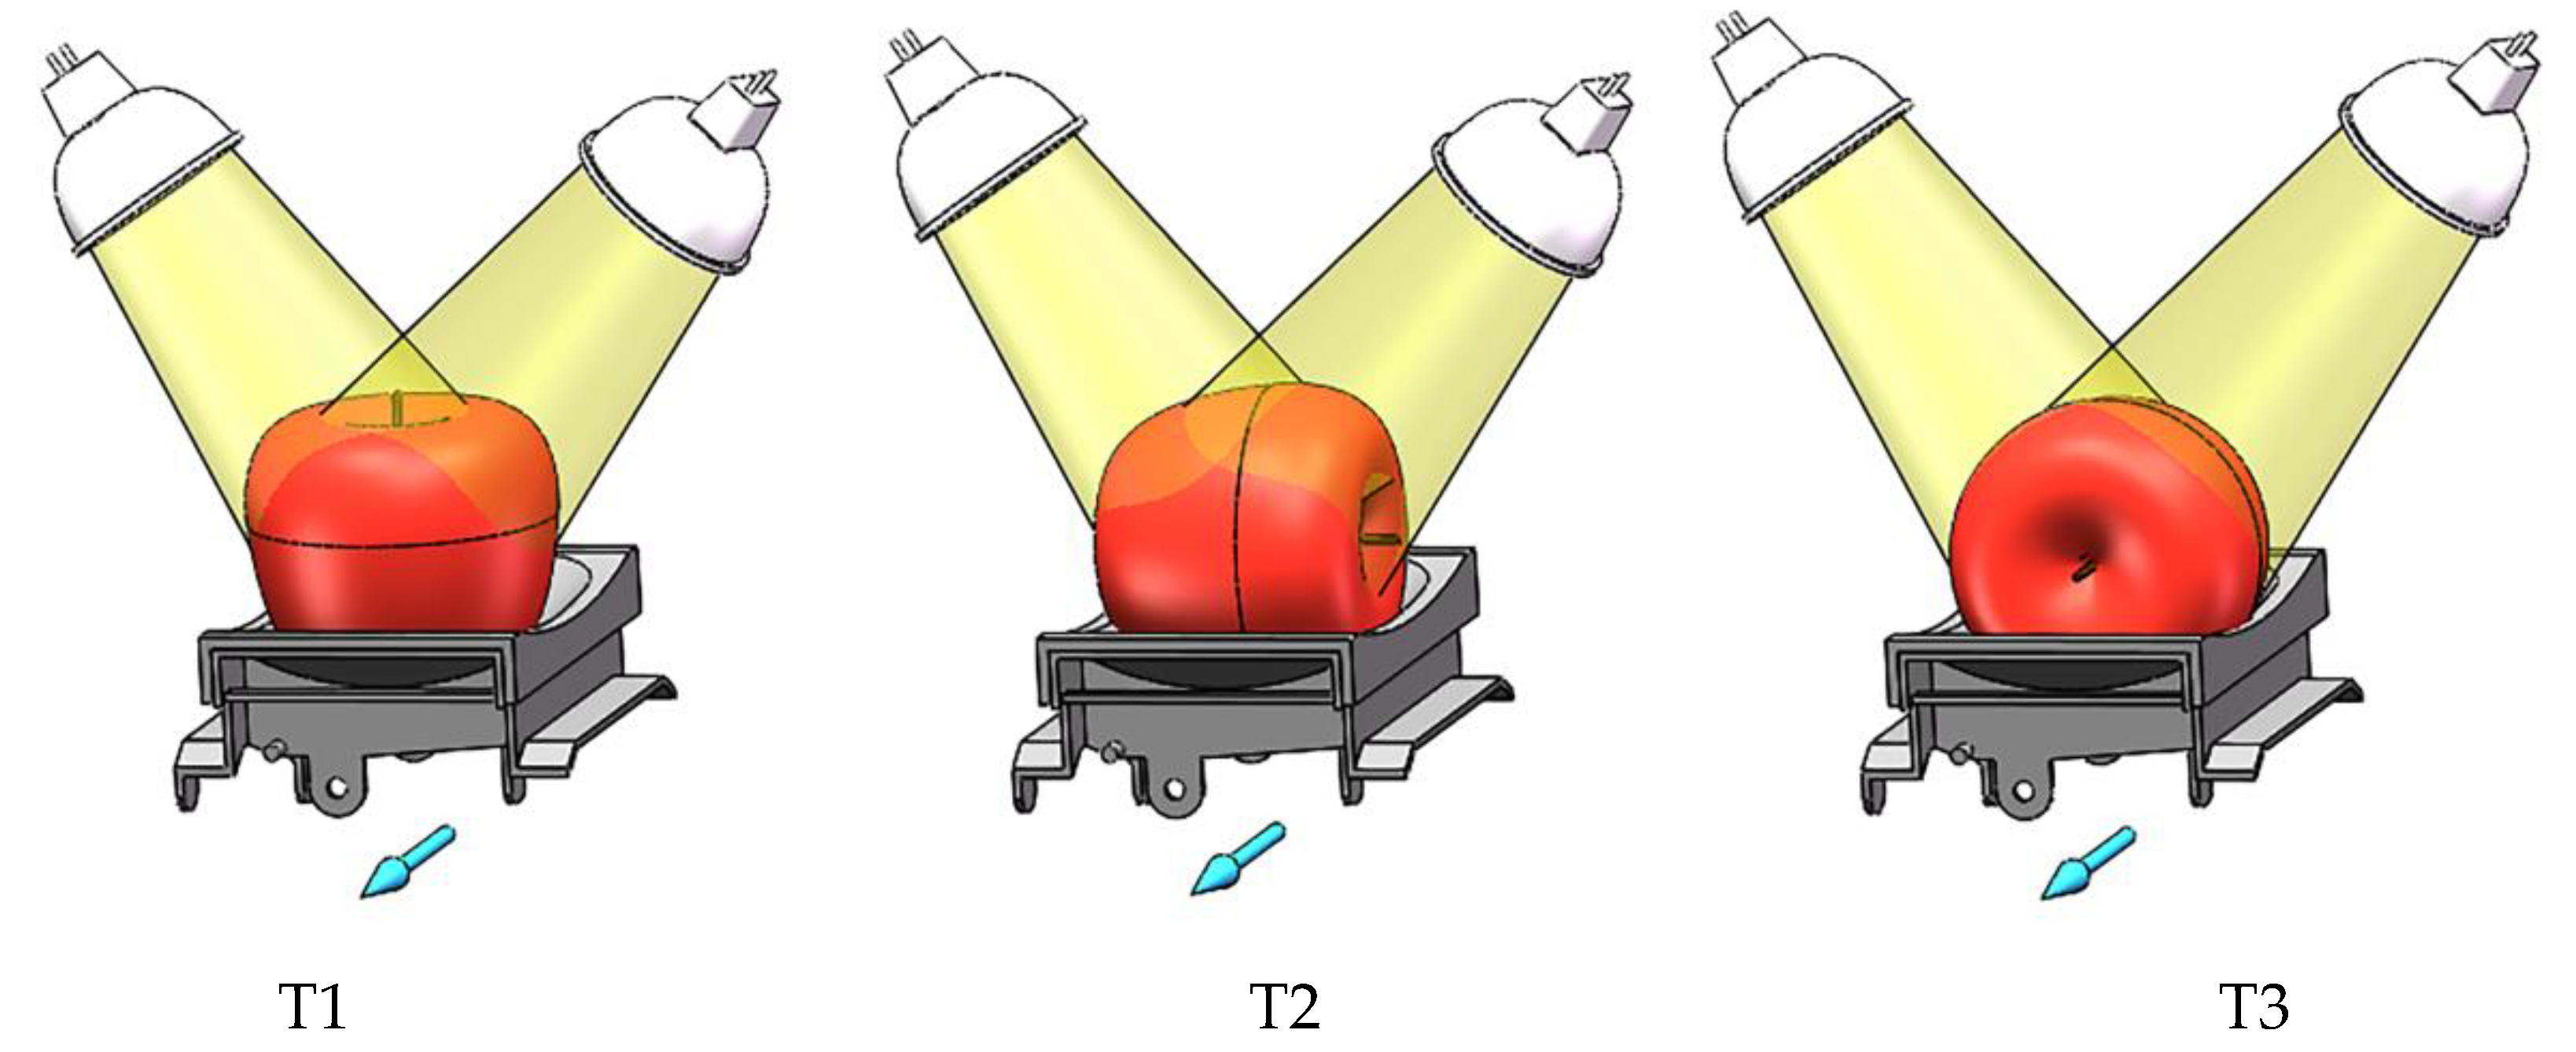
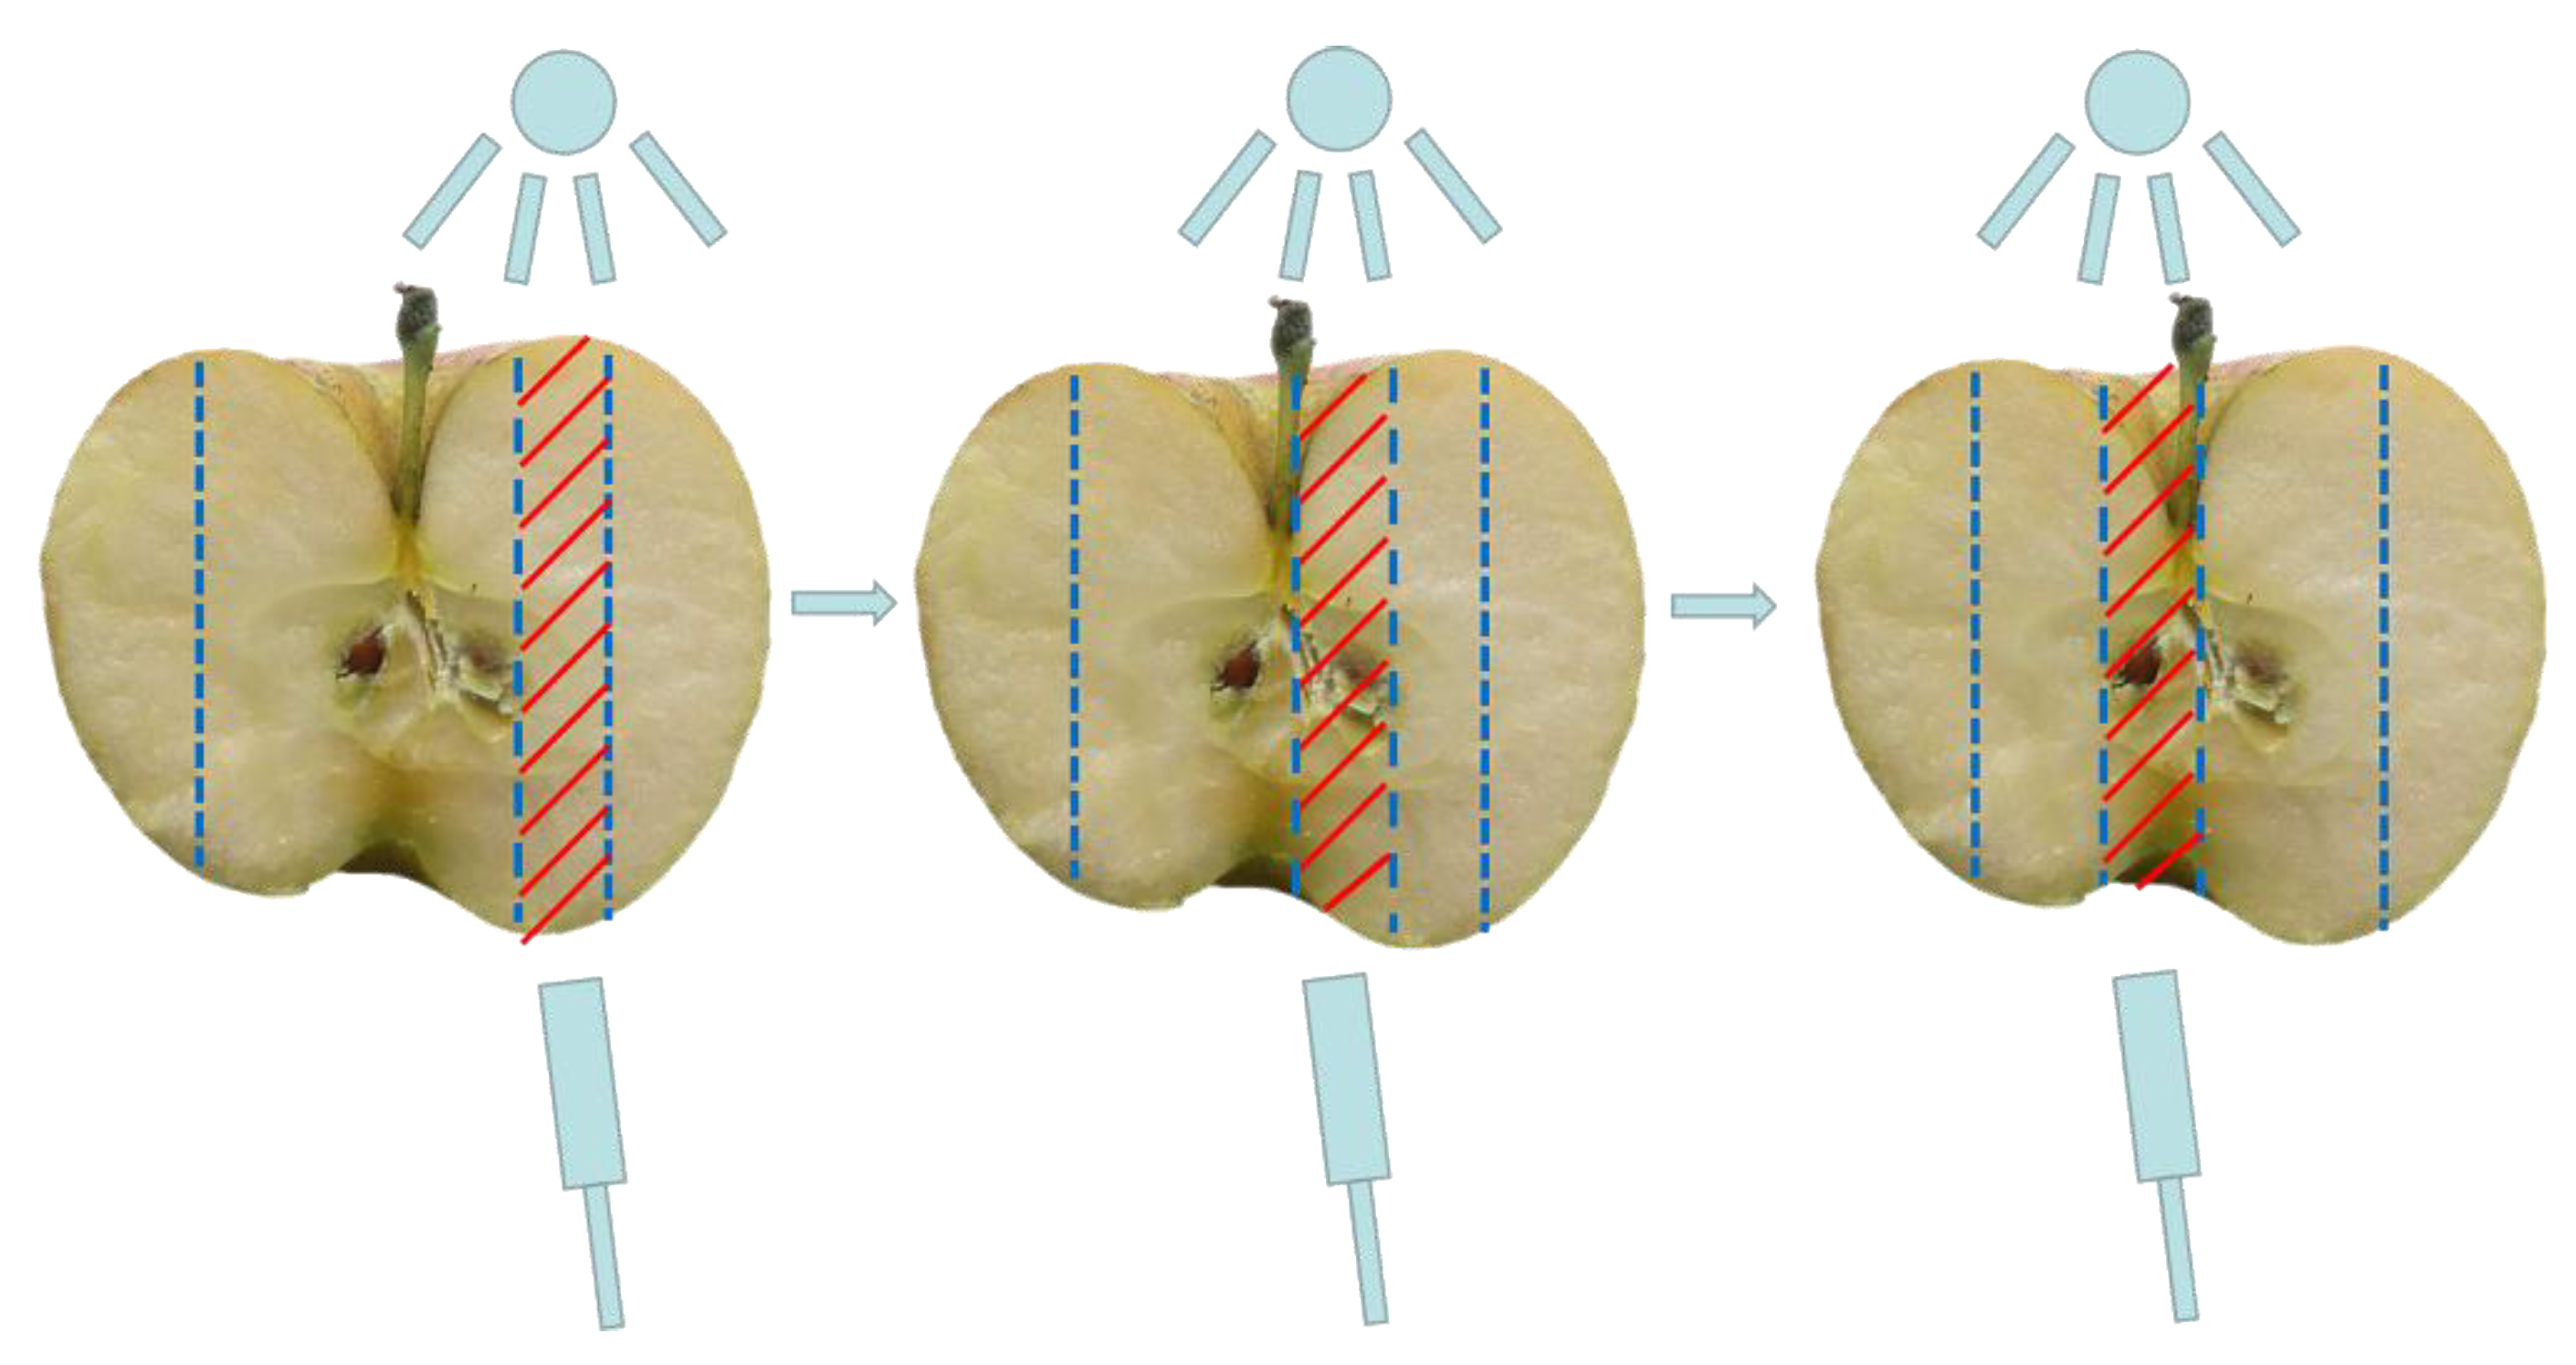
2.2. The Apple Online Detection Equipment and the Spectrum Acquisition Unit

All spectral data acquisition was performed on the apple online detection equipment specially designed for apple online quality inspection and sorting in our laboratory. The equipment consisted of a near-infrared spectroscopy detection unit, an apple transfer and classification unit, and a whole machine control unit, as shown in Figure 1.
As the core device of online detection equipment, the near-infrared spectroscopy detection device consisted of a light source, a spectrometer with the wavelength range of 600–1100 nm (AvaSpec-ULS2048XL-EVO, Avantes, Apeldoorn, The Netherlands), a light receiving fiber, and a photoelectric switch (E3Z-T81, OMRON, Kyoto, Japan). The light source used two 250 W halogen lamps (Model #64653, OSRAM, Munich, Germany), where the heat was continuously dissipated by two cooling fans.
The detection equipment had 48 fruit cups in total, which carried one apple per cup to move forward. The top-down view of the layout of the fiber, the photoelectric switch, and fruit cups is shown in Figure 2. The fiber was fixed under the fruit cups using a specially designed optical fiber bracket. As shown in Figure 2, a 50 mm long slit was carved into the bottom of the fruit cup to facilitate the collection optical fiber to obtain the transmitted light of the apple placed on the fruit cup. When performing the motion detection, the position of the optical fiber was placed 10 mm away from the beginning side of the slit in order to make the collected spectrum contain more useful information about the source of moldy core disease, i.e., the apple heart. Thus, during the moving of apples, the optical fiber captured signal from central areas of the apples around the stem–calyx axis. Taking into account the size range of all the samples, the center area of each apple occupied approximately from 2/3 to 3/4 of the area of the apple to be tested. The spectrometer was triggered to start collecting the stationary spectra by the host computer program. After manually placing the sample, stationary spectra were acquired by clicking the program start acquisition button. The program interface diagram is shown in Figure 3. When collecting the motion spectra, the fiber position was as shown in Figure 2 when the photoelectric switch was exactly about to be triggered by the elastic part of fruit cups. Then the trigger signal was transmitted to the spectrometer to start collecting spectrum.
Although the randomness of the placement of the apple on the fruit cup was normal during the actual inspection, we investigated three extreme placement orientations to represent all possible different placements for comparison (Figure 4). These were:
T1:
Stem–calyx was perpendicular to the plane of fruit cups and the fruit stem was facing up.
T2:
Stem–calyx was perpendicular to the direction of movement and parallel to the plane of fruit cups.
T3:
Stem–calyx was parallel to the plane of fruit cups and the fruit stem was facing the direction of movement.
Figure 4. Schematic diagram of apple orientation (The arrow is the direction of movement and the black line is the equatorial plane of apples).
Agriculture 12 00489 g004
According to the placement position of the optical fiber and the slit size of the fruit cup during the above-mentioned motion detection, the running speed of the fruit cup could be calculated as Equation (1):
v = b t
where v was the running speed, b was the motion detection effective distance and t was the integration time. In order to make the collected spectrum have sufficient intensity and meet the speed requirement of motion detection, the integration time was set as 50 ms. The limited distance of motion collection was 30 mm. Therefore, v was 0.6 m/s. The response time of the photoelectric switch was less than 1 ms, which was much less than the integration time and did not much affect the spectrum collection.

2.3. Transmittance Spectrum Acquisition

Apples were placed on the fruit cup by hand and illuminated by the light source above. Note that the fiber optic probe was as close as possible to the fruit cup and could not affect the normal forward movement of the fruit cup. Specific to each of the three placement orientations of T1, T2, T3, the spectrum data were recorded four times by rotating 90° along the equator direction of the apple each time. The average spectrum of the four spectra was used as the original spectral data for each sample. After collecting the spectrum data, each sample was immediately cut in half and photographed for fungal infection in the core with a digital camera. Regardless of the severity of moldy core, apples with moldy core disease were not edible. Therefore, in this study, the samples were divided into only two categories, i.e., healthy and diseased apples. As long as the area of the inner diseased tissue (the minimum area is about 1 cm2) was visible to the naked eye after halving, we considered it as a diseased apple. We utilized a binary scale to record healthy apples as 0 and diseased apples as 1. There were 80 healthy apples and 40 diseased apples.

2.4. Preprocessing of Spectral Data

Preprocessing of spectral data plays a very important role for removing noise, linear offset, and environmental stray light in the original spectrum, and thus for obtaining a pure spectrum. In this study, three preprocessing methods including Savitzky–Golay (S–G) smoothing, normalization, and first derivative were adapted before modeling, and results were compared.

2.5. Full-Spectrum and Multi-Spectrum Classification Model Establishment

This study used two classification models, the partial least squares discriminant analysis (PLS-DA) linear model and the support vector machine (SVM) nonlinear model, and compared their model performance. Based on PLS regression, the PLS-DA judges how to classify the research objects according to the measured values of several variables. The smallest number of latent variables (LVs) is selected according to the minimum value of Root Mean Squared Error (RMSE) [26]. The SVM represents the samples as points in the space, and finds a segmentation hyperplane that can correctly classify these points with the largest distance. This study used the network-optimization algorithm to identify the optimal parameters (penalty factor c and kernel function parameter g) to obtain the optimized SVM model [27]. The overall modeling process is shown in the Figure 5.
In this study, the successive projection algorithm (SPA) was used for characteristic wavelength extraction. The basic idea was to use the projection analysis of the vector to find the variable group containing the minimum redundant information, and to achieve the minimum collinearity between the variables [28].
The correct recognition rate of healthy apples and diseased apples was used to evaluate the accuracy of the classification model. At the same time, the sensitivity and specificity were used to ensure the quality of the model [29]. In this experiment, the healthy apples that served as the experimental control were defined as true positive (TP) if they were correctly identified or as false negative (FN) if they were misidentified. Similarly, the diseased apples were referred to as false positive (FP) if they were misidentified or true negative (TN) if they were correctly identified. Sensitivity was defined as the fraction of samples belonging to the modeled class, which was correctly accepted by the respective model as Equation (2):
sensitivity = TP TP + FN
Conversely, specificity was that fraction of samples not belonging to the modeled class that was correctly rejected by the model as Equation (3):
specificity = TN TN + FP

3. Results and Discussion

3.1. Spectral Characteristics

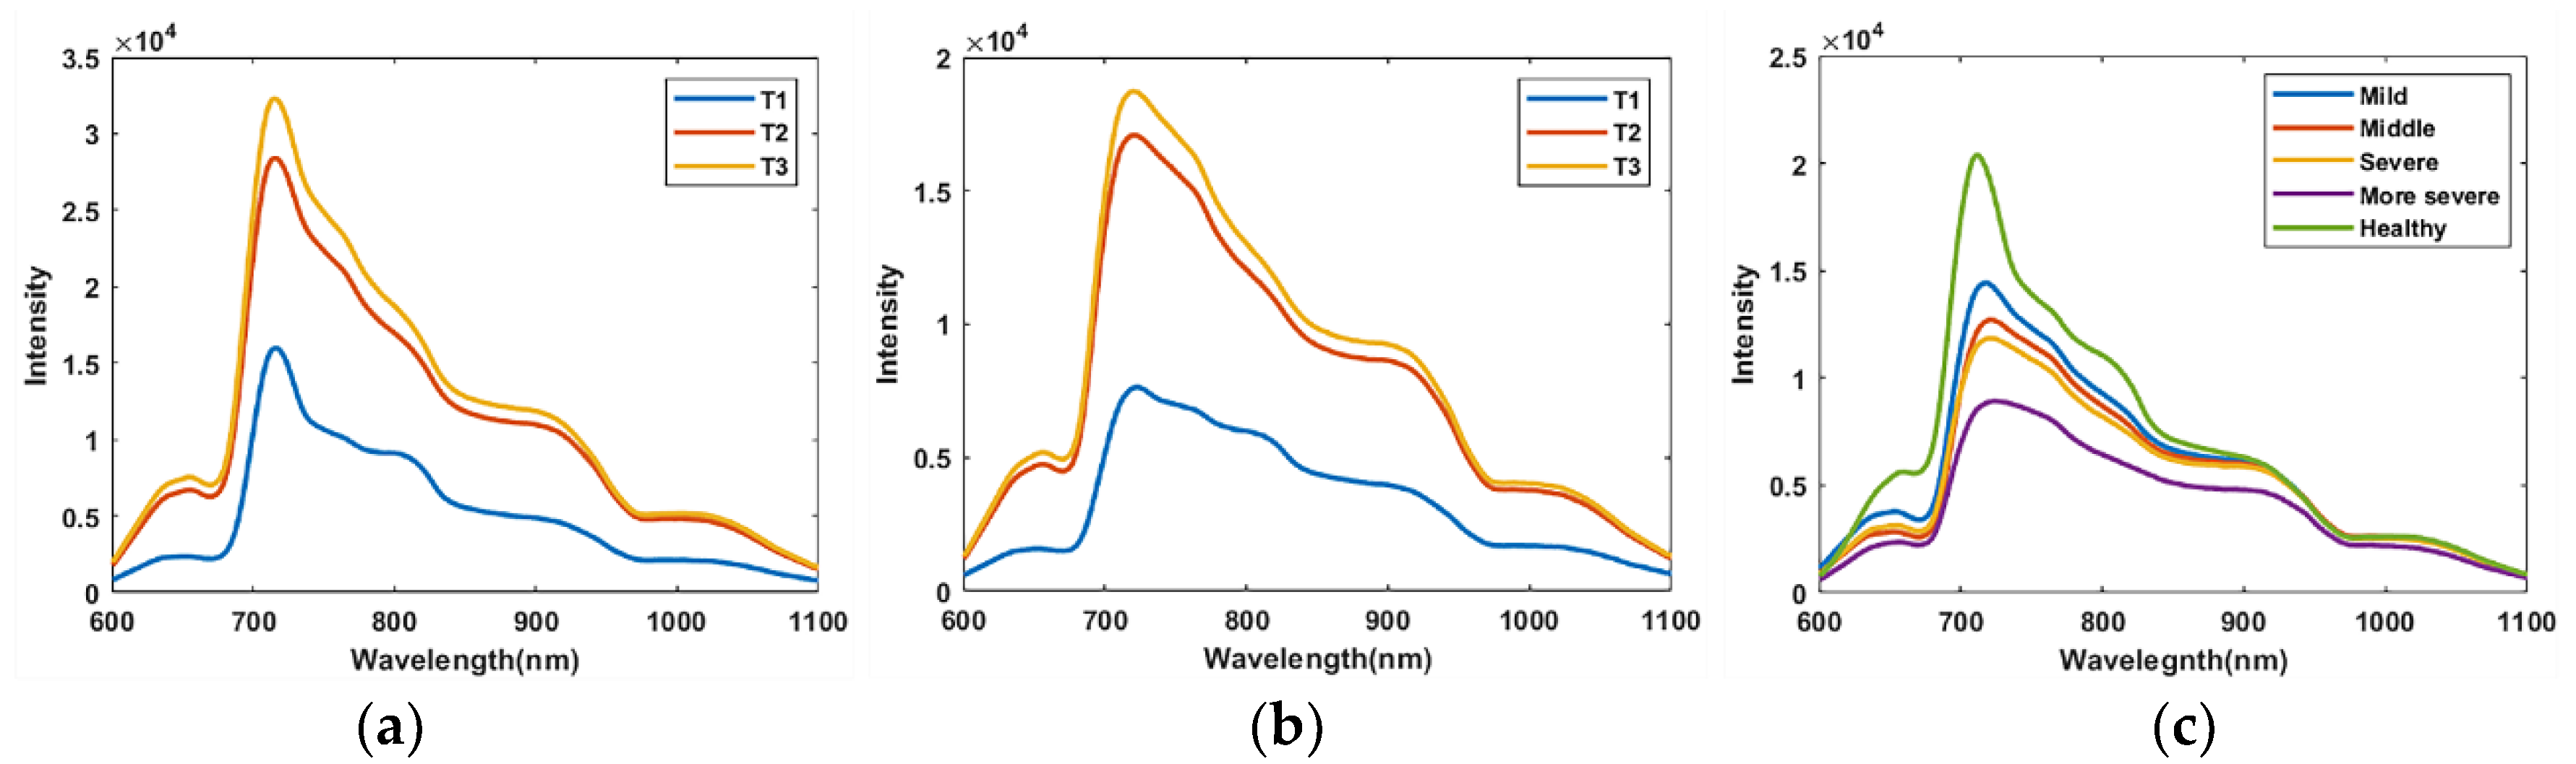
3.1.1. Stationary Spectrum Analysis

Figure 6 illustrates the raw energy spectrum of healthy apples and diseased apples collected in a stationary state. Figure 6a shows the average spectra of all three orientations of healthy apples, and Figure 6b shows the average spectra of all three orientations of diseased apples. Comparing Figure 6a and Figure 6b, the NIR spectra of apples mainly had three relatively obvious absorbances, which appeared in the form of troughs in the transmission spectrum curve. There was a strong chlorophyll absorption peak near 670 nm, and the absorption peaks at 840 nm and 970 nm were generally related to water or O-H functional groups [30]. Compared with diseased apples the spectrum curve trend of healthy apples of three orientations was more consistent, which could be because the internal organization of healthy apples was more uniform than that of diseased apples. The difference in spectral intensity might be due to the influence of the calyx and the size of the apple on the light transmission, which meant that the orientation of the apple relative to the light source had a significant influence on the intensity of the transmittance spectrum.
In order to further observe the spectral difference between healthy apples and diseased apples and the spectral differences of apples with different disease levels, according to the photos of apples cut in half, four diseased apples with different degrees of internal browning and one healthy apple were selected to comparing the spectra difference, as shown in Figure 6c. It was observed that the difference in the spectrum was related to the severity of the apple infected with moldy core disease. As the degree of infection increased, there was a stronger absorption capacity in the 650–840 nm range. The absorbance above 840 nm of diseased apples was not significantly different from that of healthy apples. We speculated that this difference may be due to the increased absorbance in the red area of spectrum because of the browned flesh.
According to the results of the stationary spectrum test, we found the obtained full-transmittance spectra were greatly affected by the placement of an apple on the fruit cup, which was determined by the relative position of detection system components including the light source, the fiber and the fruit cup.
Meanwhile, the stationary spectra of healthy apples and diseased apples were obviously different, and with the change in disease degree, the spectral curve also showed a certain regular change, which also provided a basis for us to further study the motion spectrum.

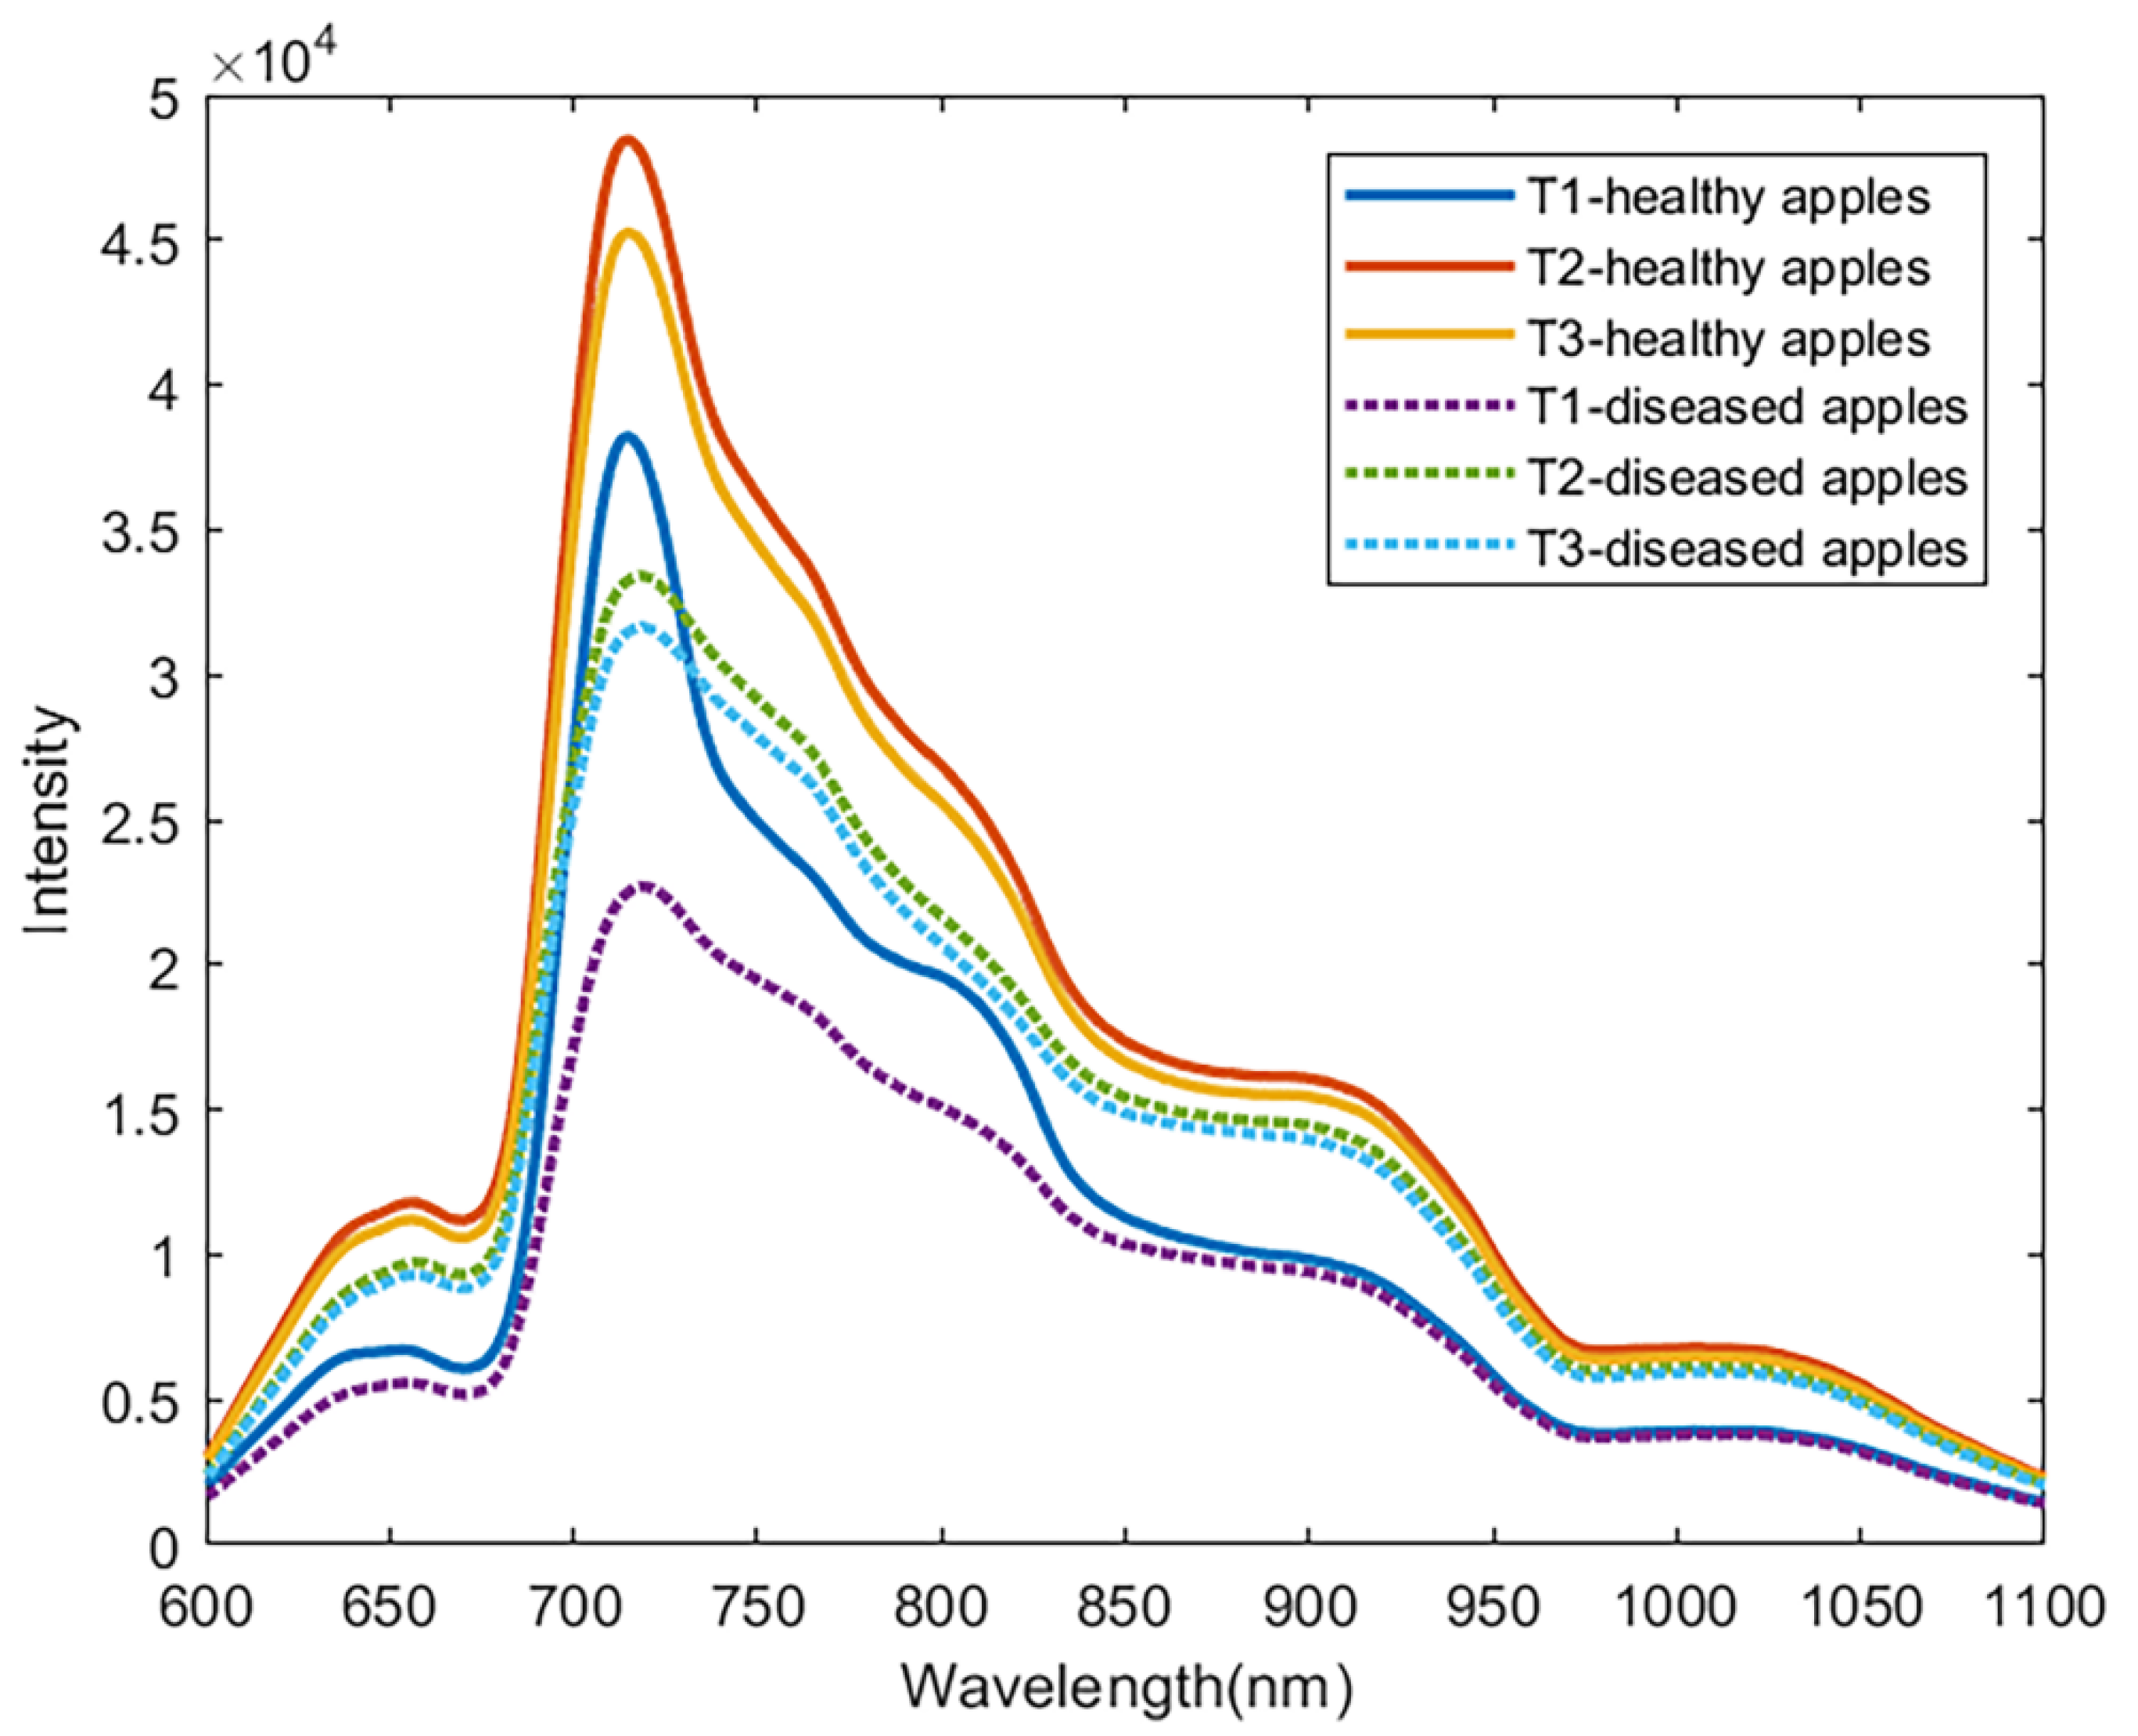
3.1.2. Motion Spectrum Analysis

Taking the T1 orientation as an example, the entire motion detection process could be regarded as a series of continuous stationary detection during the integration time from the beginning of the spectrum collection to the end, and an average spectrum of the entire process was finally output, as shown in Figure 7. The position of the light source and the fiber was fixed, and the apple moved forward. The area between the two dashed lines in Figure 7 was the range of motion collection, in which the red slash area represented the main area of the spectrum collected when the apple moved to the current position. Motion detection could better solve the problem of uneven distribution of internal infected tissue, which was difficult to detect with stationary detection.
Figure 8 illustrates the mean motion spectrum of healthy apples and diseased apples in three orientations. Overall, the trend of the motion spectral curve was similar to that of the stationary spectrum. For one orientation, the spectral intensity of healthy apples was significantly higher than that of diseased apples. The internal tissue of the diseased fruit changed to become more light absorbable than healthy tissue, resulting in differences in intensity. The most obvious difference between the spectral curves of healthy apples and diseased apples was that the intensity difference was the largest at the peak of 716 nm, and from 716–737 nm, the slope of the curve of healthy apples was significantly greater than that of diseased apples. At 806 nm, there was a small peak in the spectra curve of healthy apples, while the diseased apples’ spectrum curve had almost none (Figure 8). Of course, it was impossible to distinguish healthy and diseased apples solely by spectral curve characteristics, and thus, further analysis was performed.

3.2. Classification Models for Moldy Core Disease with Full Spectrum

SVM and PLS-DA were used to build classification models to distinguish healthy apples and diseased apples, which were processed by a variety of preprocessing methods to further compare the performance of the models. The model classification performance of stationary spectrum is shown in Table 1. The results showed that the model performance of the SVM model using the combination of S–G smoothing and normalization preprocessing method was the best. The discrimination accuracy rates of the validation set for T1, T2, and T3 orientation were 92.5%, 95%, and 97.5%, respectively, which meant the SVM model had a better classification effect than the PLS-DA for the classification of apple moldy core disease.
When identifying diseased apples the model performance of T1 was slightly lower than that of T2 and T3, which indicated that the stalk and calyx of the apple fruits would affect the light transmission, thereby affecting the component information carried by the transmission spectrum. This might be because the irregular structure of the fruit stalk and calyx increased the complexity of the spectral information.
The model classification performance of stationary spectrum is shown in Table 2. Consistent with the modeling results of static spectral components, the model performance of the SVM model using the combination of S–G smoothing and normalization preprocessing method was the best. The discrimination accuracy rates of the validation set for T1, T2, and T3 orientation were 97.5%, 100%, and 92.5%, respectively.
In the actual online inspection process, fruits would not be placed on the conveyor line in a fixed orientation (relative to the relative position of the light source and optical fiber). In order to verify the stability of the model established in a single orientation, the classification performance of the single-orientation model on the spectrum collected in the other two orientations was compared, as shown in the Table 3. The results showed that the single-orientation model had a significant drop in the prediction performance of spectrum in other two orientations, which meant that the single-orientation model was not stable. This was consistent with the fact that the defect areas were randomly distributed inside a single apple, and it also showed that the use of a single-orientation model for online detection of apples with moldy core disease was not reliable. Therefore, the generalized model was established by using the mean spectrum of all three orientations and the results were shown in Table 3. The results showed that the generalized model was more tolerant of orientations, and the classification accuracy rates of three orientations were 99.2%, 100% and 98.3%, respectively. These results implied that the mean spectrum of all orientations was more effective for improving the detection of apples with moldy core disease.

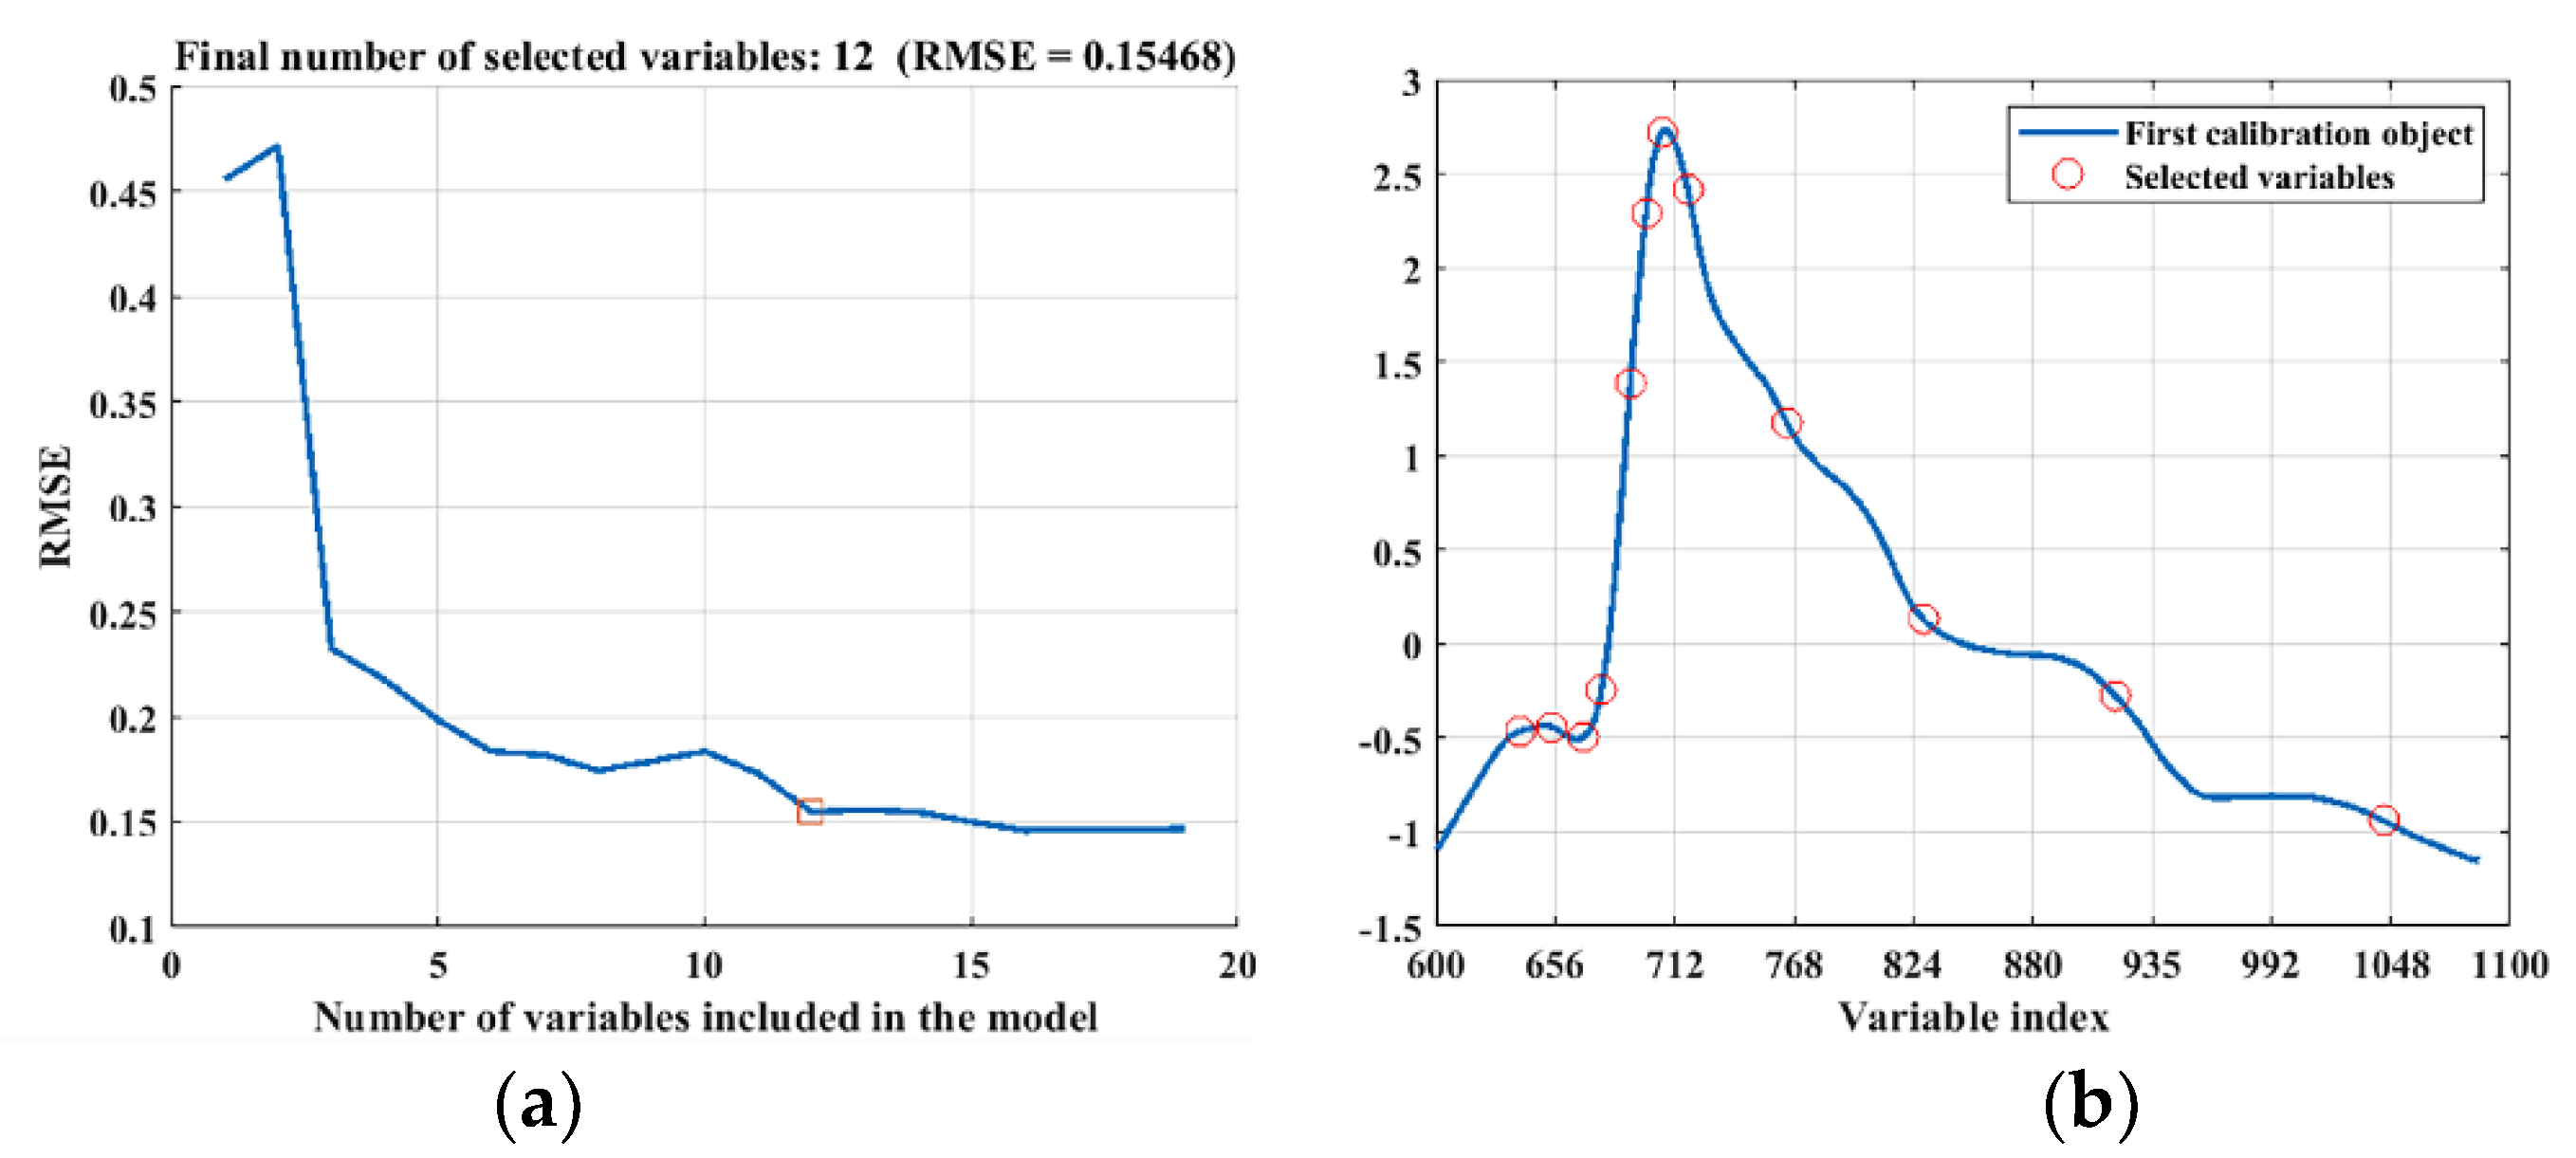
3.3. Establishment of a Simplified Model for Online Detection Using SPA

In order to increase the speed of apple online detection, it was necessary to reduce the number of variables of the spectral data under the premise of the accuracy of the classification of diseased apples. The number of variables of the generalized model established by using the mean spectrum of overall three orientations was 874. In order to further remove the redundant information of the spectra data and reduce the number of variables, the SPA was used to extract the characteristic wavelength.
As shown in Figure 9a, when the number of variables selected by the SPA generalized model was 12, the RMSE was the lowest, and the RMSE hardly decreased as the variables were further increased. The position distribution of the selected variable on the spectral curve is shown in Figure 9b. The model performance of the SVM model after the final screening of the characteristic wavelengths are shown in Table 4. Compared with the full-wavelength model, the number of multi-spectrum model variables was 12, which was a reduction of 98.6%. The classification accuracy of T1, T2, and T3 were 96.7%, 97.5%, and 97.5%, respectively. The results showed that the SVM model extracted using characteristic wavelengths could meet both speed and accuracy requirements of online detection and classification of fruits. It provided a theoretic basis with details for further realization of massive online detection and classification of fruits at post-harvest both before and after storage, prior to entering the fruit market or juice-processing facilities.
The near-infrared spectra data of apples are sensitive to its internal components and changes that are related to the corresponding C-H and O-H chemical bonds. Spectral scattering depends on the internal cell structure of the fruit tissue and the extracellular and intracellular matrix, while light absorption is affected by the chemical composition. Among the extracted characteristic wavelengths, 641.9 nm and 704.8 nm are mainly related to the pigment absorption in the apple flesh composition. The wavelength of 682.9 nm may be related to the absorption of chlorophyll and anthocyanin, while 773.9 nm may be related to the fourth overtones of stretching vibrations of CH [30]. Most other wavelengths are at the peak and trough positions (725.4, 839.8, 931.4, 1056.5).

3.4. Simplified Model Performance Verification

The result verification was carried out on the apple online detection equipment designed by our laboratory. The power system of the equipment was driven by a frequency converter to drive a three-phased motor, and the motor drove the sprocket chain to rotate. The equipment was equipped with guide rails, and the fruit cup could travel in the guide rails. The spectrometer collected the spectral data and transmitted it to the upper computer. After the upper computer analyzed and obtained the grading result, the result was transmitted to the PLC to control the grading action device to decide the action of overturning the fruit cup, thereby making the grading decisions.
The generalized orientation model established by SVM using SPA characteristic wavelengths was evaluated from another 40 apples (20 healthy apples and 20 diseased apples). Only one healthy apple was misidentified as a diseased apple. The classification accuracy was 97.5%, 95%, and 100% for total, healthy and diseased apples, respectively. There is an increased tolerance to misidentify healthy fruit rather than to misidentify moldy core fruit for the apple industry. Therefore, a low false-positive rate can be accepted for healthy apples. In practical applications, the detection rate of moldy core apples is very important. Although apples with a low degree of internal fungal infections can be consumed, there are still potential food safety risks for the subsequent processing of by-products of apples. The apples with moldy cores used in this verification had a relatively serious degree of moldy cores and a relatively large area of moldy cores, which were relatively easier to detect. However, when the number of samples becomes larger, there must be apples with light infection, which could be prone to misjudgment. The current study merits further research on a large scale for classification of apples with high-precision detection and removal of apples with moldy core diseases.

3.5. Discussion

Apple moldy core is also called heart rot. The disease is caused by a mixed infection of a variety of fungi. The pathogenic microorganisms live through the winter in the form of spores or mycelium attached to plant debris, buds, branches, and orchard soil. When the temperature rises above 5 °C in the next growing season, the spores begin to germinate and form hyphae. The hyphae enter from the opening of the calyx and invade the ventricle through the tube of the calyx, causing disease in the fruit. The infection is latent, so that the fruit surface is normal at the initial stage of infection. It will break out when the environmental conditions are suitable during the storage period at post-harvest.
Moldy core disease has two symptoms: moldy heart and heart rot. Between them, the symptom of moldy heart disease is that the fruit core is moldy, which produces gray-green, gray-white, and gray-black mold in the ventricle, but the flesh does not rot. The symptoms of heart rot are mold not only in the fruit core, but also rot beyond the core. The diseased flesh with discoloration has a bitter taste. Regardless of the symptoms, the fruit disease affects the core of the fruit, so it is feasible and necessary to non-constructively detect and sort the fungal infections on the core of the apple fruits online. Figure 10 shows halves of a healthy apple and diseased apples with varying severity of moldy core disease.
As the severity of moldy core increased, the diseased fruit gradually spread and rotted from the ventricle. From an optical point of view, the diseased area was black or gray-brown, and had a strong light absorption capacity. Compared with healthy fruits, less light was transmitted in the diseased fruits due to the internal composition changes. From the analysis of internal composition changes, the hydrogen bond functional groups in the diseased apple, such as C-H, O-H, N-H, and free H related organic compound molecules, would be significantly different from the organic compounds in the healthy pulp. This change resulted in a significant difference in the absorption band of the near-infrared spectrum data. Therefore, it provided a theoretical basis for the application of semi-transmission spectroscopy to distinguish apples with moldy core disease.
This study showed that the results of moldy core disease detection were affected by the orientation of the fruit relative to the light source and optical fiber, because browning tissue was randomly distributed in diseased apples, which could be discrete or isolated. The internal organization of the apples with severe moldy core was relatively uniform, but for the apples with mild browning, the light scattering inside the apples with different fruit orientations was also different. It is likely that the transmitted light carried little browning information, which affected detection results. Meanwhile, evaluating the degree of moldy core disease by cutting in half could only be a rough guide, and it was difficult to know the specific browning tissue distribution. Overall, the classification results of the T3 orientation model were slightly better than those of the other two orientations. This may be due to the fact that the T1 and T2 orientations were more affected by the fruit stem and calyx, of which the irregular shape increased the uncertainty of the light path. The T3 orientation light source illuminated more of the main fresh part, which could carry more internal organization information. Regardless of the orientation of the fruit, the generalized model established by using the mean spectrum of the three orientations had better classification results for each orientation. Therefore, in the online detection of apple moldy core disease, the orientation of the fruit needed to be considered when collecting the spectral data used to build the model. The generalized model had a better classification effect than the single-orientation model.
Due to the wide spectral range and high resolution of the spectrometer used in this study, the collected spectral data contained more than 800 variables. Since the final objective of this study was to perform online apple fruit detection and sorting, too many variables would increase the computation time, thereby reducing the detection efficiency, which would be detrimental to the online detection and sorting of apples with moldy core disease. Therefore, using SPA characteristic wavelength extraction could reduce the dimensionality of the data and reduce the number of variables so as to achieve the purpose of improving the speed of massive online detection and sorting of apple fruits.
The size of the samples used in this study was relatively consistent, between 80–90 mm, so the effect of fruit size on the spectrum was not explored. Kawano et al. [31] divided each second derivative spectrum value by the second derivative value 844 nm, which was highly correlated with the fruit diameter, and normalized it, reducing the influence of fruit size on the prediction results of the model. Tian et al. [32] verified that the rate of light extinction in apple flesh varied log-linearly with thickness and error back propagation artificial neural networks and support vector machine models were established based on corrected versus original spectra. The accuracy of the validation set was 90.2%, and the results showed that the method could correct the influence of fruit size on the transmission spectrum. Further research can be conducted to reduce the effect of fruit size by using the above-mentioned correction method.
Tian et al. [3] studied the influence of three orientations of apples on online apple moldy core disease detection, and finally found that the model of T2 direction was best. Similarly, Tian et al. [33] studied the light path propagation on the surface and interior of apples of three orientations, and finally found that the global model was optimal. On the basis of the above, one of the three orientations studied in this paper was different, and the whole was more extreme. In addition, a simplified model with fewer spectral variables was established in this paper, which was suitable for the case where the fruit placement orientation was random in the actual commercial online detection and classification process. Combined with the actual laboratory-made online detection equipment, this study truly realized the online detection and classification of apple moldy core disease.
During the study, it was found that most of the internal browning tissues in the diseased apples used were dry and hollow, and very few were moist. Under normal circumstances, due to the increase in the amount of air in the dry tissue, the light is more dispersed, increasing the absorbance. Contrary to the principle, moist tissue reduces absorbance. However, whether it is dry or moist, the spectrum of diseased apples is significantly different from that of healthy apples so the classification of healthy and diseased fruits can be achieved. Further studies of the spectral difference between dry and moist tissues should be developed for the classification of the degree of diseased apples (percentage of browning area).

4. Conclusions

In this study, a new Vis/NIR online detection system for apple moldy core disease was developed using transmittance spectra in the spectral range of 600–1100 nm. The generalized model established by using the mean spectrum of all three orientations improved the detection of internal defects in apples. Experiments on ‘Fuji’ apples showed that there were significant differences in the spectral characteristics of healthy fruits and diseased fruits, which were affected by the orientation of the fruit relative to the light source and optical fiber. Through comparing SVM and PLS-DA models, it was found that the single-orientation SVM classification model was unstable for the spectrum prediction in other orientations with the maximum difference of classification accuracy between 3.3% and 15%. The generalized model established by the mean spectrum had good consistency in each orientation, which improved the prediction accuracy. Meanwhile, the method of using SPA to extract characteristic wavelengths greatly reduced the number of variables and improved the speed of online detection. Unfortunately, because we only distinguished healthy apples from diseased apples, we did not classify the degree of disease. Future studies will focus on Support Vector Regression (SVR) models to predict different degrees of disease.

Author Contributions

K.Z., Z.Z., H.Z. and S.G. performed the experiment; K.Z. performed the data analysis; K.Z. and Y.Y. finished writing the program; K.Z. prepared the original draft; W.W. and H.J. reviewed and edited the paper. All authors have read and agreed to the published version of the manuscript.

Funding

This research was funded by the National Key Research and Development Program of China, grant number 2018YFC1603500, and the National Natural Science Foundation of China, grant number 31772062.

Institutional Review Board Statement

Not applicable.

Informed Consent Statement

Not applicable.

Data Availability Statement

All the necessary data were contained in the paper.

Conflicts of Interest

The authors declare no conflict of interest.

References

  1. Lu, Y.; Lu, R. Non-Destructive Defect Detection of Apples by Spectroscopic and Imaging Technologies: A Review. Trans. ASABE 2017, 60, 1765–1790. [Google Scholar] [CrossRef]
  2. Roger, H.; Anne, G.; Sara, R.J. The case for fruit quality: An interpretive review of consumer attitudes, and preferences for apples. Postharvest. Biol. Technol. 2003, 28, 333–347. [Google Scholar] [CrossRef]
  3. Tian, S.; Zhang, M.; Li, B.; Zhang, Z.; Zhao, J.; Zhang, Z.; Zhang, H.; Hu, J. Measurement orientation compensation and comparison of transmission spectroscopy for online detection of moldy apple core. Infrared Phys. Technol. 2020, 111, 103510. [Google Scholar] [CrossRef]
  4. Ali, S.; Abbasi, P.; Rehman, S.; Ellouze, W. First Report of Moldy Core of Sweet Tango Apples from New Zealand Caused by Alternaria arborescens. Plant Dis. 2021, 105. [Google Scholar] [CrossRef]
  5. Maria, A.P.; Marthe, D.B.; Arnau, V.; Facundo, I.; Hannes, M.; Benedikt, W.; Doris, M.; Sarah, D.S.; Andrea, P. Fate of free and modified Alternaria mycotoxins during the production of apple concentrates. Food Control 2020, 118, 107388. [Google Scholar] [CrossRef]
  6. Maria, A.P.; Paola, C.; Graciela, N.P.; Virginia, F.P.; Andrea, P. From field to process: How storage selects toxigenic Alternaria spp. causing mouldy core in Red Delicious apples. Int J. Food Microbiol. 2020, 322, 108575. [Google Scholar] [CrossRef]
  7. Huang, H.; Liu, L.; Michael, O.N. Recent Developments in Hyperspectral Imaging for Assessment of Food Quality and Safety. Sensors 2014, 14, 7248–7276. [Google Scholar] [CrossRef] [Green Version]
  8. Andrea, P. Fungi and mycotoxin problems in the apple industry. Curr. Opin. Food Sci. 2019, 29, 42–47. [Google Scholar] [CrossRef]
  9. van Dael, M.; Verboven, P.; Zanella, A.; Sijbers, J.; Nicolai, B. Combination of shape and X-ray inspection for apple internal quality control: In silico analysis of the methodology based on X-ray computed tomography. Postharvest. Biol. Technol. 2018, 148, 218–227. [Google Scholar] [CrossRef]
  10. Clark, C.J.; MacFall, J.S.; Bieleski, R.L. Loss of watercore from ‘fuji’ apple observed by magnetic resonance imaging. Sci. Hortic. 1998, 73, 213–227. [Google Scholar] [CrossRef]
  11. Varith, J.; Hyde, G.M.; Baritelle, A.L.; Fellman, J.K.; Sattabongkot, T. Non-contact bruise detection in apples by thermal imaging. Innov. Food Sci. Emerg. Technol. 2003, 4, 211–218. [Google Scholar] [CrossRef]
  12. Abbott, J.A. Quality measurement of fruits and vegetables. Postharvest. Biol. Technol. 1999, 15, 207–225. [Google Scholar] [CrossRef]
  13. Pourdarbani, R.; Sabzi, S.; Arribas, J.I. Nondestructive estimation of three apple fruit properties at various ripening levels with optimal Vis-NIR spectral wavelength regression data. Heliyon 2021, 7, e07942. [Google Scholar] [CrossRef] [PubMed]
  14. Malvandi, A.; Hao, F.; Kamruzzaman, M. Application of NIR spectroscopy and multivariate analysis for Non-destructive evaluation of apple moisture content during ultrasonic drying. Spectrochim. Acta A Mol. Biomol. Spectrosc. 2021, 269, 120733. [Google Scholar] [CrossRef] [PubMed]
  15. Fan, S.; Wang, Q.; Tian, X.; Yang, G.; Xia, Y.; Li, J.; Huang, W. Non-destructive evaluation of soluble solids content of apples using a developed portable Vis/NIR device. Biosyst. Eng. 2020, 193, 138–148. [Google Scholar] [CrossRef]
  16. Ma, T.; Xia, Y.; Inagake, T.; Tsuchikawa, S. Rapid and nondestructive evaluation of soluble solids content (SSC) and firmness in apple using Vis–NIR spatially resolved spectroscopy. Postharvest. Biol. Technol. 2021, 173, 111417. [Google Scholar] [CrossRef]
  17. Mogollón, M.R.; Contreras, C.; de Freitas, S.T.; Zoffoli, J.P. NIR spectral models for early detection of bitter pit in asymptomatic ‘Fuji’ apples. Sci. Hortic. 2021, 280, 109945. [Google Scholar] [CrossRef]
  18. Clark, C.J.; Mcglone, V.A.; Jordan, R.B. Detection of Brownheart in ‘Braeburn’ apple by transmission NIR spectroscopy. Postharvest. Biol. Technol. 2003, 28, 87–96. [Google Scholar] [CrossRef]
  19. Huang, Y.; Lu, R.; Chen, K. Detection of internal defect of apples by a multichannel Vis/NIR spectroscopic system. Postharvest. Biol. Technol. 2020, 161, 111065. [Google Scholar] [CrossRef]
  20. Fan, G.; Zha, J.; Du, R.; Gao, L. Determination of soluble solids and firmness of apples by Vis/NIR transmittance. J. Food Eng. 2009, 93, 416–420. [Google Scholar] [CrossRef]
  21. Fu, X.; Ying, Y.; Lu, H.; Xu, H. Comparison of diffuse reflectance and transmission mode of visible-near infrared spectroscopy for detecting brown heart of pear. J. Food Eng. 2007, 83, 317–323. [Google Scholar] [CrossRef]
  22. Guo, Z.; Wang, M.; Akwasi, A.A.; Wu, J.; Chen, Q.; Zuo, M.; Hesham, R.E.; Tao, F.; Shi, J.; Ouyang, Q.; et al. Quantitative detection of apple watercore and soluble solids content by near infrared transmittance spectroscopy. J. Food Eng. 2020, 279, 109955. [Google Scholar] [CrossRef]
  23. Clara, S.; Itzhak, S.; Victor, A.; Haim, E.; Aharon, H.; Viacheslav, O.; Susan, L.; Ruth, B.A.; Zéev, S. NIRS Detection of Moldy Core in Apples. Food Bioproc Tech. 2010, 3, 79–86. [Google Scholar] [CrossRef] [Green Version]
  24. Fan, S.; Zhang, B.; Li, J.; Huang, W.; Wang, C. Effect of spectrum measurement position variation on the robustness of NIR spectroscopy models for soluble solids content of apple. Biosyst Eng. 2016, 143, 9–19. [Google Scholar] [CrossRef]
  25. Han, D.; Zhou, E.; Qi, S. Stray light reduction research on on-line detection of sugar content of apples. Trans Chin. Soc. Agricult. Mach. 2015, 46, 260–265. [Google Scholar] [CrossRef]
  26. Alyssa, A.; Mary, R.W.; Michael, E.S. Application of likelihood ratios and optimal decision thresholds in fire debris analysis based on a partial least squares discriminant analysis (PLS-DA) model. Forensic Chem. 2019, 16, 100188. [Google Scholar] [CrossRef]
  27. Vapnik, V.N. The Nature of Statistical Learning Theory; Springer: Berlin/Heidelberg, Germany, 1995. [Google Scholar]
  28. Mário, C.U.A.; Teresa, C.B.S.; Roberto, K.H.G.; Takashi, Y.; Henrique, C.C.; Valeria, V. The successive projections algorithm for variable selection in spectroscopic multicomponent analysis. Chemometr. Intell. Lab. Syst. 2001, 57, 65–73. [Google Scholar] [CrossRef]
  29. Paolo, O. Multivariate class modeling for the verification of food-authenticity claims. Trends Analyt. Chem. 2012, 35, 74–86. [Google Scholar] [CrossRef]
  30. Slaughter, D.C. Nondestructive determination of internal quality in peaches and nectarines. Trans. ASABE 1995, 38, 617–623. [Google Scholar] [CrossRef]
  31. Kawano, S.; Fujiwara, T.; Iwamoto, M. Nondestructive determination of sugar content in satsuma mandarin using near infrared (nir) transmittance. Engei Gakkai Zasshi. 1993, 62, 465–470. [Google Scholar] [CrossRef]
  32. Tian, S.; Zhang, J.; Zhang, Z.; Zhao, J.; Zhang, Z.; Zhang, H. Effective modification through transmission Vis/NIR spectra affected by fruit size to improve the prediction of moldy apple core. Infrared Phys. Technol. 2019, 100, 117–124. [Google Scholar] [CrossRef]
  33. Tian, X.; Wang, Q.; Huang, W.; Fan, S.; Li, J. Online detection of apples with moldy core using the vis/nir full-transmittance spectra. Postharvest. Biol. Technol. 2020, 168, 111269. [Google Scholar] [CrossRef]
Figure 1. The apple online detection equipment. (a) Components of the whole machine system; (b) spectral detection unit.
Agriculture 12 00489 g001
Figure 2. Schematic diagram of fiber position (The arrow is the direction of movement). a: Slit length; b: motion detection effective distance; 1: the optical fiber; 2: photoelectric switch triggering position on fruit cup; 3: photoelectric switch.
Agriculture 12 00489 g002
Figure 3. The program interface diagram.
Agriculture 12 00489 g003
Figure 5. Experimental scheme of single-orientation models and all three orientation models.
Agriculture 12 00489 g005
Figure 6. The raw energy stationary spectrum. (a) The average spectrum in three orientations of healthy apples; (b) the average spectrum in three orientations of diseased apples; (c) the spectrum of diseased apples with internal browning of varying degrees and a healthy apple.
Agriculture 12 00489 g006
Figure 7. Motion detection diagram.
Agriculture 12 00489 g007
Figure 8. Mean spectrum data of healthy and diseased apples in three orientations.
Agriculture 12 00489 g008
Figure 9. (a) Final number of selected variables; (b) the position distribution of the variables selected by SPA using the spectrum data.
Agriculture 12 00489 g009
Figure 10. Varying degrees of moldy core in apple halves (the one on the far left is the healthy apple and the rest are diseased apples).
Agriculture 12 00489 g010
Table 1. The classification performance of the SVM model and the PLS-DA model obtained by using different preprocessing methods in the T1, T2, and T3 orientations (stationary spectrum).
Detection OrientationModeling MethodPreprocessed MethodAccuracy of Calibration Set (%)Accuracy of Validation Set (%)SensitivitySpecificity
T1SVMS–G67.56510
PLS-DA96.25850.8240.869
SVMS–G + Normalization10092.50.9750.975
PLS-DA98.7592.50.8890.955
SVMS–G + First derivative71.2557.510
PLS-DA98.7592.50.9170.929
T2SVMS–G68.7562.510
PLS-DA95900.8670.92
SVMS–G + Normalization100950.9751
PLS-DA98.7592.50.8890.955
SVMS–G + First derivative706010
PLS-DA96.25950.9090.966
T3SVMS–G71.2557.510
PLS-DA97.592.50.8670.92
SVMS–G + Normalization97.597.50.9750.975
PLS-DA10092.50.8890.955
SVMS–G + First derivative68.7562.510
PLS-DA96.2592.50.9290.923
Table 2. The classification performance of the SVM model and the PLS-DA model obtained by using different preprocessing methods in the T1, T2, and T3 orientations (motion spectrum).
Detection OrientationModeling MethodPre-Processed MethodAccuracy of Calibration Set (%)Accuracy of Validation Set (%)SensitivitySpecificity
T1SVMS–G71.2557.510
PLS-DA96.25950.97530.9265
SVMS–G + Normalization98.7597.510.9524
PLS-DA97.597.50.97530.9744
SVMS–G + First derivative67.56510
PLS-DA96.2592.50.95120.9474
T2SVMS–G71.2557.510
PLS-DA9592.50.93830.8974
SVMS–G + Normalization10010011
PLS-DA97.597.50.97530.9744
SVMS–G + First derivative72.55510
PLS-DA100900.9750.95
T3SVMS–G68.7562.510
PLS-DA97.592.50.96290.9487
SVMS–G + Normalization10092.50.97530.9744
PLS-DA95900.96391
SVMS–G + First derivative706010
PLS-DA97.5950.96290.9487
Table 3. Prediction results of single-orientation model and generalized model (S–G + Normalization).
ModelClassification Accuracy (%)
T1T2T3
Single-orientation model_T198.393.382.5
Single-orientation model_T293.310099.2
Single-orientation model_T389.296.797.5
Generalized model99.210098.3
Table 4. Prediction results of SVM model based on SPA feature wavelength extraction (S–G + Normalization).
ModelSelected Wavelength (nm)Number of VariablesClassification Accuracy (%)
T1T2T3
Generalized model641.9, 658.0, 673.4, 682.9, 697.1, 704.8, 713.0, 725.4, 773.9, 839.8, 931.4, 1056.51296.797.597.5
Publisher’s Note: MDPI stays neutral with regard to jurisdictional claims in published maps and institutional affiliations.

