Article

Green Banana Maturity Classification and Quality Evaluation Using Hyperspectral Imaging

1
College of Mechanical and Electrical Engineering, Zhongkai University of Agriculture and Engineering, Guangzhou 510225, China
2
College of Engineering, South China Agricultural University, Guangzhou 510642, China
3
College of Mechanical and Electronic Engineering, Nanjing Forestry University, Nanjing 210037, China
*
Author to whom correspondence should be addressed.
Agriculture 2022, 12(4), 530; https://doi.org/10.3390/agriculture12040530
Submission received: 18 February 2022 / Revised: 28 March 2022 / Accepted: 6 April 2022 / Published: 8 April 2022
(This article belongs to the Special Issue Sensors Applied to Agricultural Products)

Abstract

:
Physiological maturity of bananas is of vital importance in determination of their quality and marketability. This study assessed, with the use of a Vis/NIR hyperspectral imaging (400–1000 nm), the feasibility in differentiating six maturity levels (maturity level 2, 4, and 6 to 9) of green dwarf banana and characterizing their quality changes during maturation. Spectra were extracted from three zones (pedicel, middle and apex zone) of each banana finger, respectively. Based on spectra of each zone, maturity identification models with high accuracy (all over 91.53% in validation set) were established by partial least squares discrimination analysis (PLSDA) method with raw spectra. A further generic PLSDA model with an accuracy of 94.35% for validation was created by the three zones’ spectra pooled to omit the effect of spectra acquisition position. Additionally, a spectral interval was selected to simplify the generic PLSDA model, and an interval PLSDA model was built with an accuracy of 85.31% in the validation set. For characterizing some main quality parameters (soluble solid content, SSC; total acid content, TA; chlorophyll content and total chromatism, ΔE*) of banana, full-spectra partial least squares (PLS) models and interval PLS models were, respectively, developed to correlate those parameters with spectral data. In full-spectra PLS models, high coefficients of determination (R2) were 0.74 for SSC, 0.68 for TA, and fair of 0.42 as well as 0.44 for chlorophyll and ΔE*. The performance of interval PLS models was slightly inferior to that of the full-spectra PLS models. Results suggested that models for SSC and TA had an acceptable predictive ability (R2 = 0.64 and 0.59); and models for chlorophyll and ΔE* (R2 = 0.34 and 0.30) could just be used for sample screening. Visualization maps of those quality parameters were also created by applying the interval PLS models on each pixel of the hyperspectral image, the distribution of quality parameters in which were basically consistent with the actual measurement. This study proved that the hyperspectral imaging is a useful tool to assess the maturity level and quality of dwarf bananas.

1. Introduction

The banana is a globally consumed fruit with the highest production over 127 million tons, and the fourth most important food crop in terms of agricultural commodity value (63.6 billion US$) along with rice, wheat and corn [1,2]. It could provide high quantities of potassium, serotonin and iron content, as well as vitamins [3,4]. As a typical climacteric fruit, banana was usually harvested at a light green mature stage (physiological maturity stage) and ripened artificially. Physiological maturity of banana bunch dictates its quality and marketability [5], which indicates that the harvesting could be neither under-mature (immature) nor over-mature [6]. Thus, determining the proper physiological maturity stage is crucial in scheduling harvesting and marketing operations efficiently [7].
Generally, maturity of bananas is assessed by the producers’ experience based on the appearance of the fingers. However, the difference in appearance between different harvestable maturities might not be apparent, resulting in difficulties in controlling quality consistency. A simple, objective and cost-effective measuring method is urgently required. Image processing and visible/near-infrared (NIR) spectroscopy, which are treated as new objective and non-destructive techniques, are being developed.
Nowadays, studies on assessing the maturity of fruit and vegetables such as mango, plum, blueberries, apple, and tomato using computer vision systems are reported widely [8,9,10,11,12,13,14,15]. For banana, the changes in angularity, diameter, length, and color are usually treated as analysis indices. Zhuang et al. [16] utilized peel color, textural and shape information to predict the banana ripeness. Mazen et al. [17] employed color, development of brown spots, and Tamura statistical texture features to classify and grade banana fruit ripeness stages. A similar study conducted by Saranya et al. [3] indicated that a convolutional neural network (CNN) successfully differentiated four different ripeness stages of banana. The above studies mainly focused on the assessment of ripening stages of banana in the climacteric phase. For green banana detection, Piedad et al. [18] classified tiers of postharvest green banana in different commercial qualities by color in RGB coordinates and random forest classifiers. Prabha and Kumar [5] constructed a mean color intensity algorithm for differentiating banana physiological maturity stages (under-mature, mature, and over-mature) with a high accuracy of 99.1%. Due to the inapparent appearance in different harvestable stages, discriminating bananas in such similar maturity levels by computer vision may be limited.
In addition to appearance parameters, chemical parameters including soluble solids content, titratable acidity and carbohydrate (starch) content will also change during growth of banana [19,20]. As NIR spectroscopy is mainly generated from double and combination frequency absorption of molecular vibration as well as Fermi resonance, it is suitable for the measurement of organic matter with hydrogen groups such as soluble sugar and organic acids [21]. Numerous studies using NIR spectroscopy have been revealed that those chemical parameters are highly correlated to banana ripeness stages [22,23,24,25,26]. These cases proved the feasibility of NIR spectroscopy in discriminating banana maturity levels. However, due to uneven distribution of external structure and internal tissue of fruit, only using a single-point of NIR spectra may affect the accuracy and robustness of the detection model. It also cannot visually demonstrate the distribution and change of chemical parameters in bananas.
Hyperspectral imaging (HSI) technology is a combination of spectroscopy and digital imaging technology. Gray-scale images of hundreds of contiguous wavebands show the appearance of an object, and each pixel also embodies the spectrum of the object. It is allowed for analysis on particular areas of an image and visualizing biochemical constituents of a sample [27]. It has been demonstrated that hyperspectral imaging has a great potential in assessment of maturity/ripeness of fruit such as persimmon, tomato, kiwifruit and many other kinds of fruit [28,29,30,31,32,33,34]. For banana fruit, many investigations have been reported on quality evolution during ripening process [25,35,36,37]. Rajkumar et al. (2012) [38] determined banana ripeness stages with selected wavelengths and achieved good performance (R2 > 0.85) for prediction of some quality parameters (moisture content, total soluble solids, and firmness). Similarly, Xie et al. [39] determined color (L*, a* and b*) and firmness of bananas based on the wavelengths selected from hyperspectral data, and accurately predicted ripe and unripe bananas using those properties. Wang et al. [40] combined image features extracted from an image of PC4 and the average spectra to predict bananas’ shelf-life in terms of different browning levels. Diezma et al. [41] differentiated bananas in seven ripeness classes by scores of PC1, and generated virtual images. The majority of the above studies were also focused on post-harvesting bananas. For harvestable green bananas before, studies on classification of maturity stage or flavor detection based on hyperspectral imaging has not yet been found.
This study proved the feasibility of assessing maturity stages of green banana by Vis/NIR hyperspectral imaging technique and characterizing its quality by a low number of spectral variables. Specific objectives included (1) identifying maturity levels of green banana fingers; (2) characterizing quality parameters that associated with banana maturity level; and (3) visualizing the spatial distribution of those quality parameters in banana fingers.

2. Materials and Methods

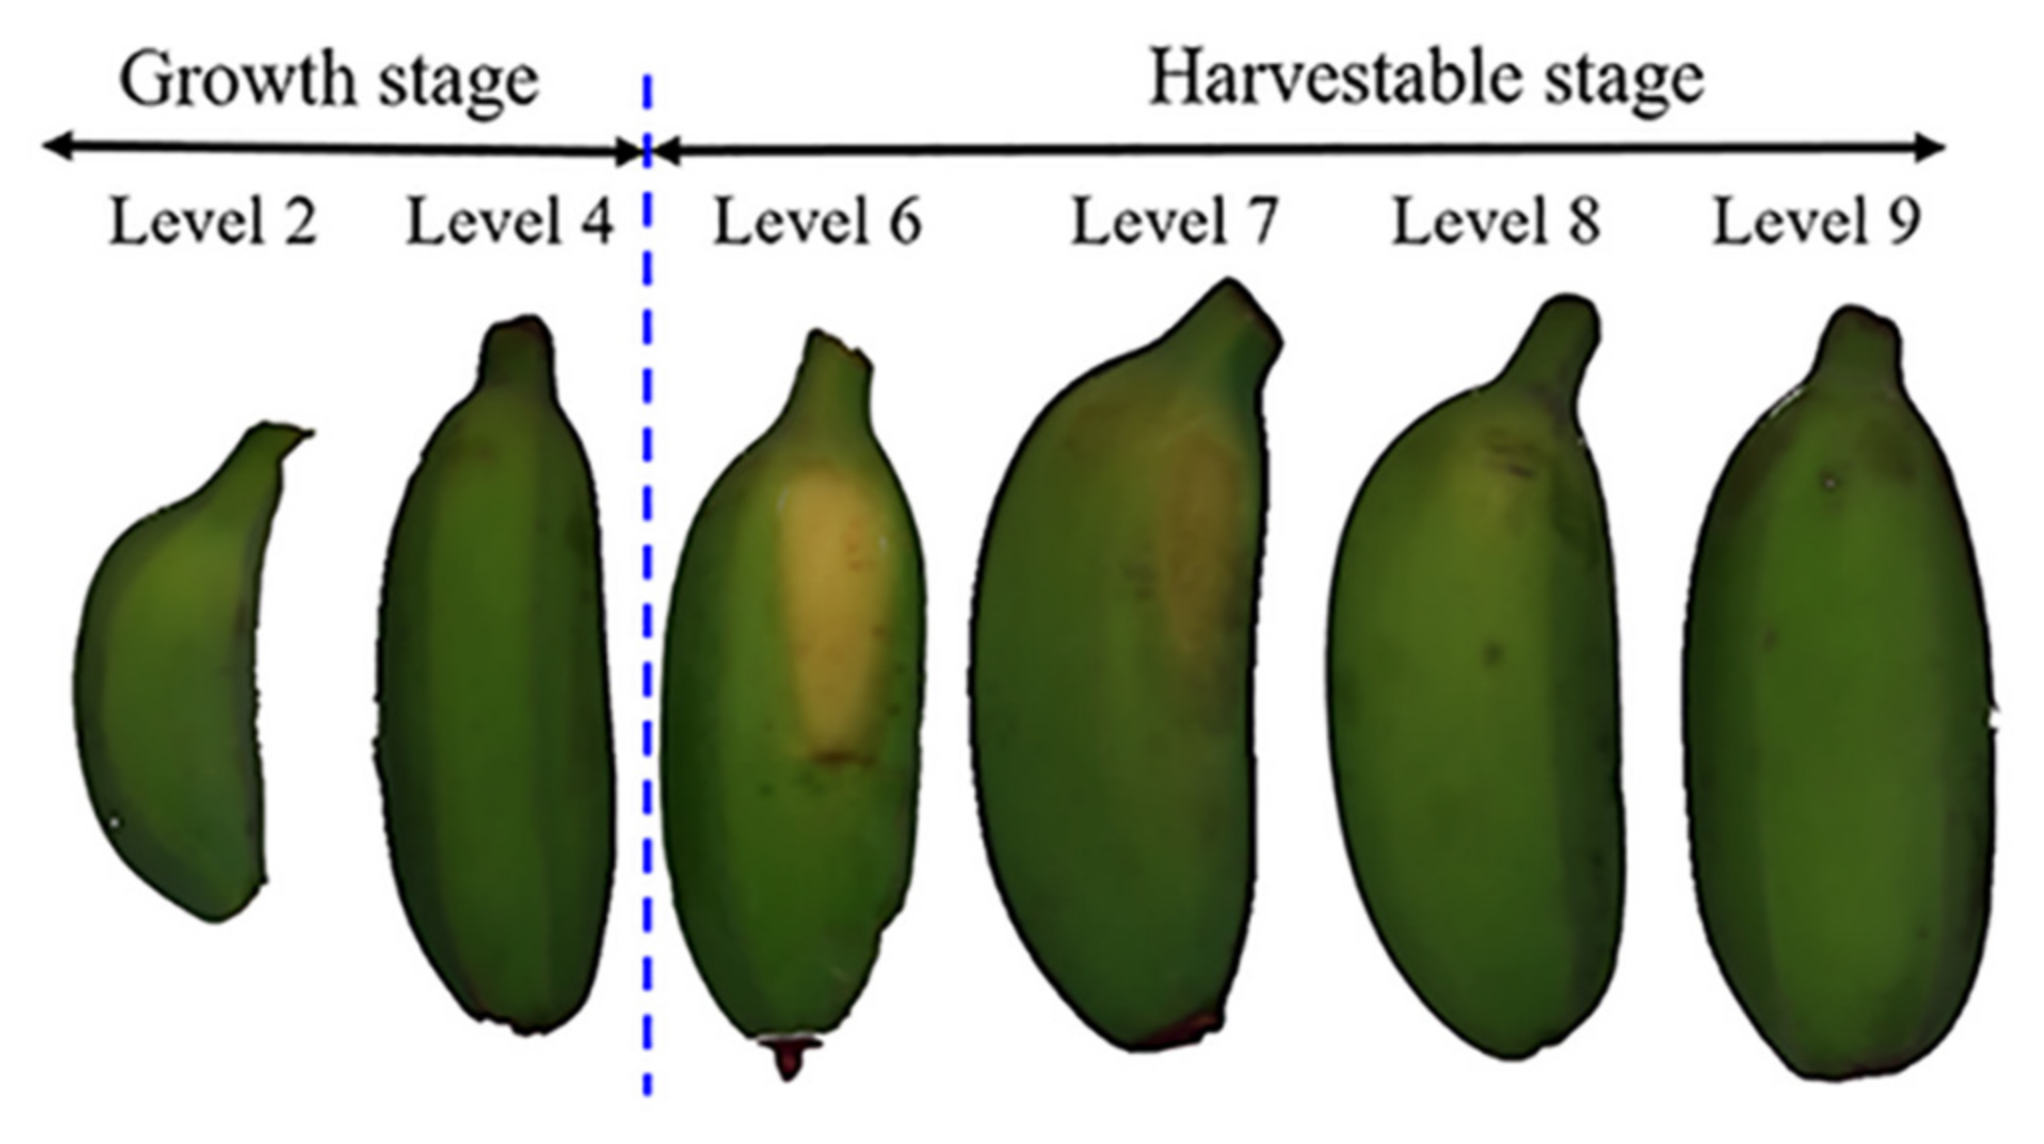
2.1. Sample Preparation

A local well-known dwarf banana cultivar “Fenjiao No.1” was used in this study, which was grown in a commercial orchard (Dongguan city, Guangdong Province, China). A total of 6 banana bunches corresponding to 6 maturity levels (Level 2, 4, 6, 7, 8 and 9) were harvested in August 2019 according to the growth time after flowering and the experience of local growers. Those banana bunches were immediately transported to the lab for crown-cutting without treatment of ripening. For each maturity level, 30 non-defective banana fingers with uniform size on middle tiers were selected as samples. However, due to three fingers that were discarded in level 2 for the damage caused during transportation, a total of 177 banana fingers remained.

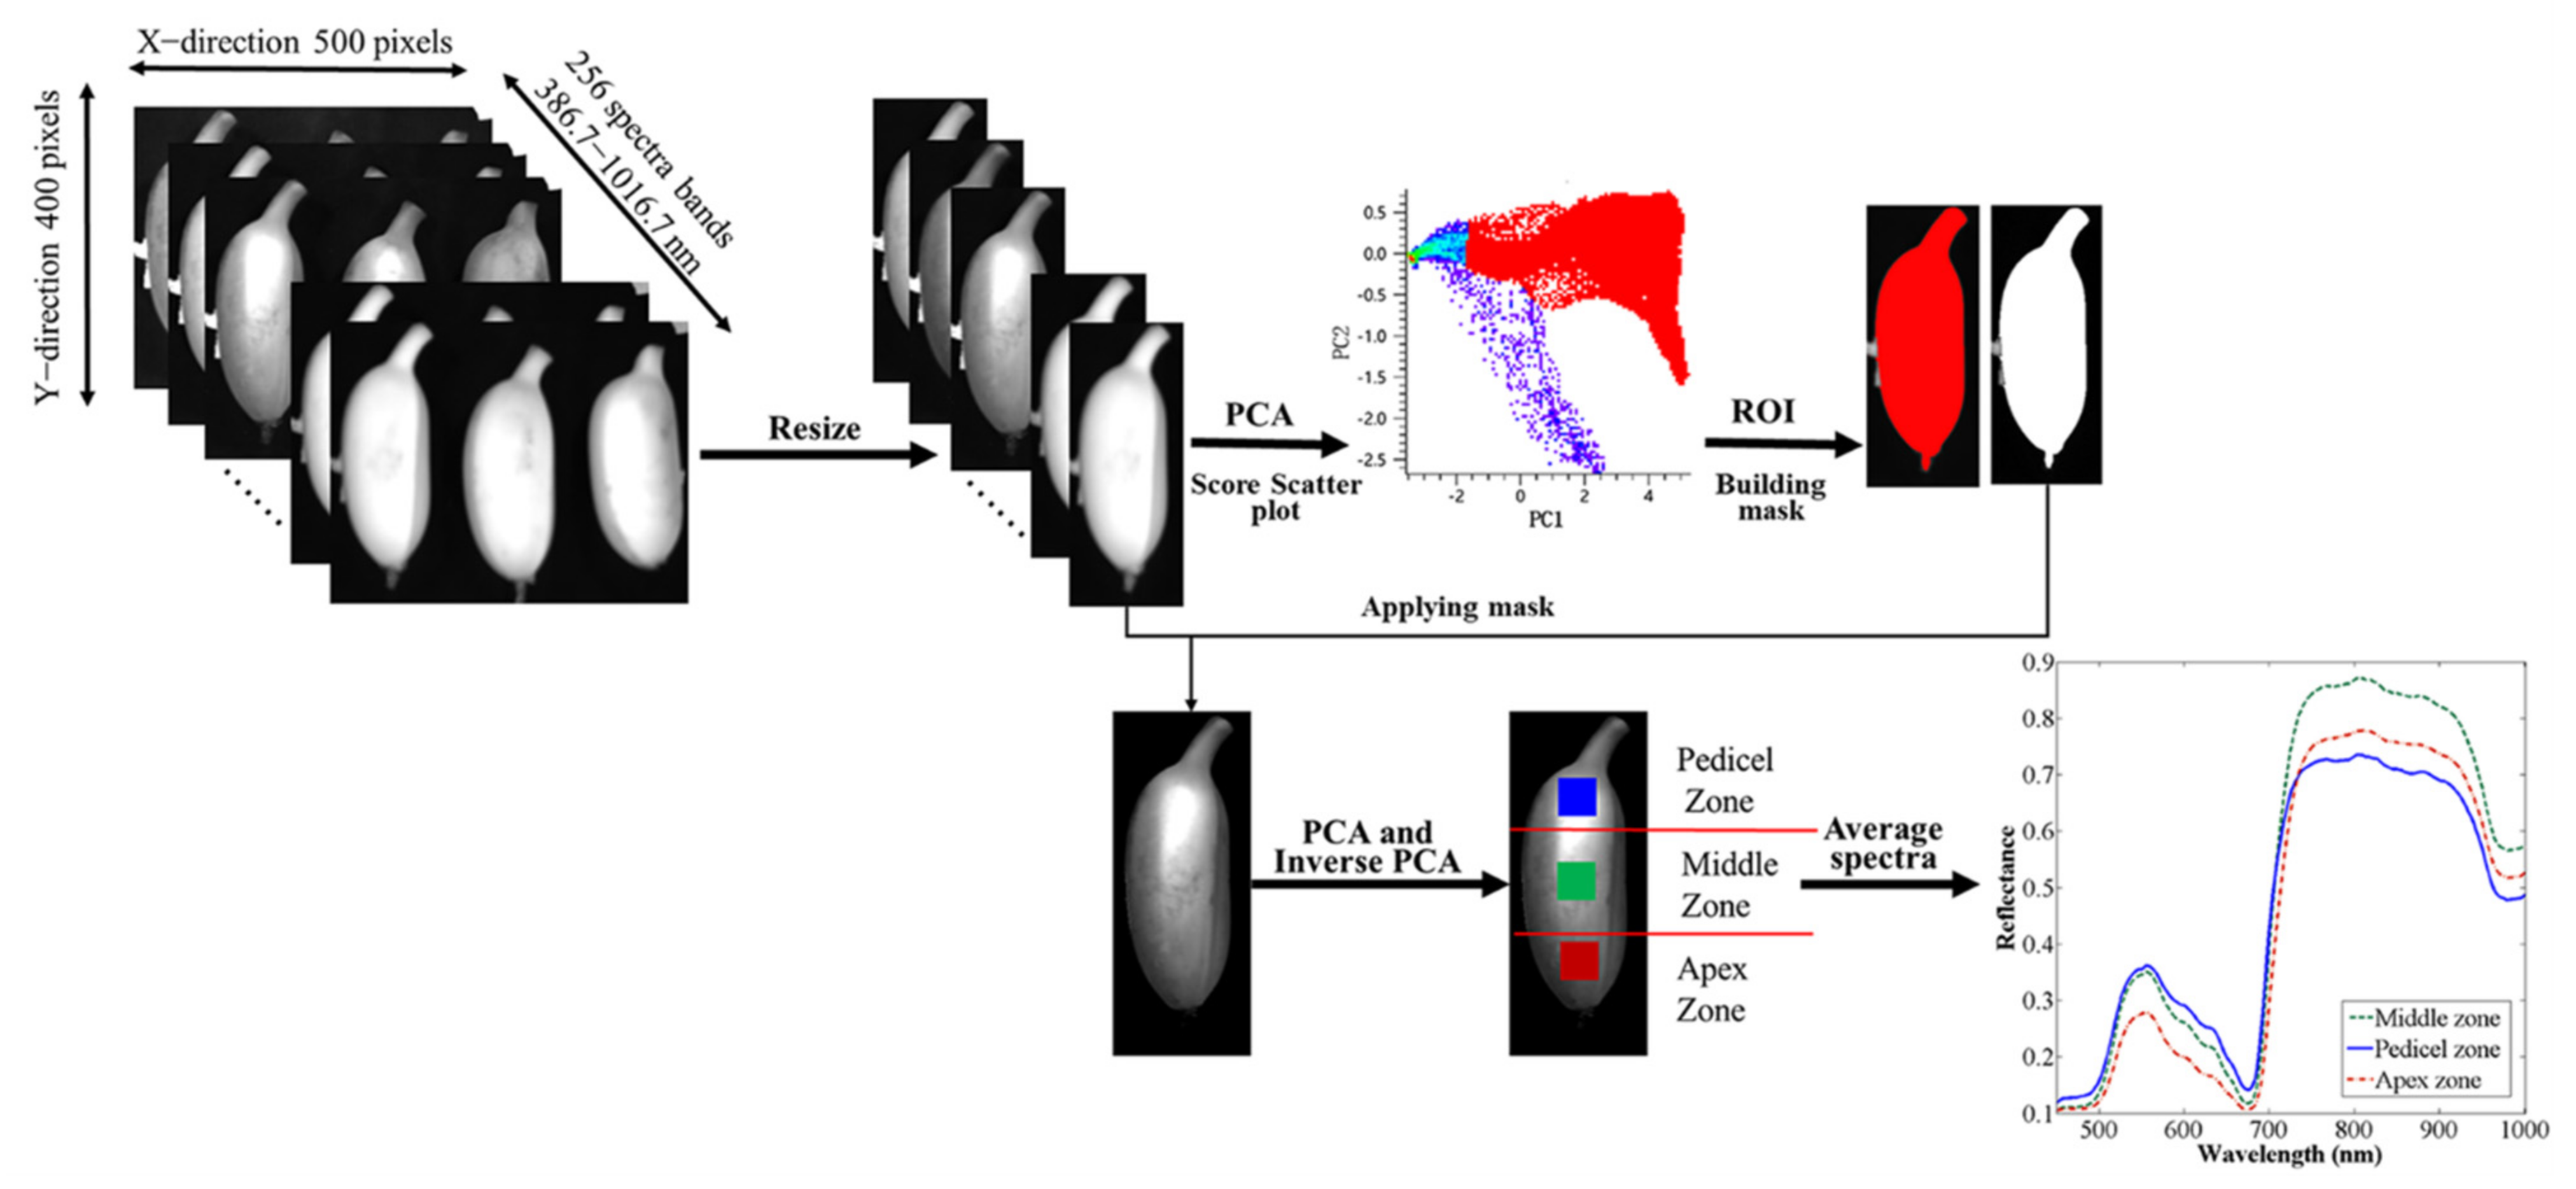
2.2. Hyperspectral Image Acquisition

Hyperspectral images of those banana samples were acquired by using a laboratory reflectance hyperspectral imaging system working at 386–1016 nm wavelength region. The average wavelength gap was 3.5 nm, and the spatial binning was 696 × 700 pixels. This system contain the image acquisition software. The four lamps were positioned at approximately 45° of an infrared hyperspectral camera (GaiaField-mini, Dualix, Sichuan, China), a camera obscura coupled with a custom lifting platform, four 50 W Tungsten–Halogen lamps and a computer 40 cm above and lateral to the platform. The platform was used to keep a distance of 50 cm between banana samples and the hyperspectral camera.
During hyperspectral image acquisition, the exposure time were adjusted to 9.98 ms and push-broom forward speed was set to 0.8 mm/s. Each banana sample was horizontally placed on the platform with its bending in the same orientation. The acquired hyperspectral image was firstly calibrated by dark and white reference images to reduce noises caused by dark current of the CCD detectors and uneven intensity of light source. The white reference image (W) was acquired by capturing the image of a PETT white board (HSIA-CT-250 × 280, Dualix, Sichuan, China) with nearly 100% reflectance. The dark reference image (B) was acquired by taking the image with all lighting sources off and camera lens completely being covered. The raw sample images (R) were calibrated by Equation (1):
I = R B W B × 100 % ,
where I is the calibrated image; R is the raw image; B is the dark reference image; and W is the white reference image.

2.3. Reference Measurement of Quality Parameters

After imaging, two appearance parameters (diameter and total chromatism, ΔE*) and three internal quality parameters (soluble solid content, SSC; total acid content, TA; and chlorophyll content) of each sample were determined in the study. Diameter was measured using a vernier caliper (Range: 0.15 m, GERMANY AIRAJ TOOLS CO., LIMITED, Hong Kong, China) for the middle zone of banana fingers. In the determination of total chromatism, the L*, a* and b* values of banana peel were measured using a colorimeter (NR60CP, 3nh, Shenzhen, China). Then, total chromatism (ΔE*) were calculated by Equation (2):
Δ E * = L * 2 + a * 2 + b * 2 ,
SSC and TA analysis was carried out by a handheld refractometer (Atago, ATAGO PAL-BX|ACID3 Model PR-101, Japan) following a method described by Zhu et al. [42] Firstly, 1 g of banana flesh was diluted with 24 mL of distilled water and blended. Then, a drop of supernatant was extracted into the refractometer, and readings were recorded. For each measurement, the refractometer was totally cleaned using distilled water and paper towels. Chlorophyll measurement was conducted by a spectrophotometric method used by Zhang et al. [43]. Some key steps were as follows: (1) crushing 0.3 g of banana peel tissue homogeneously in a mortar with a small amount of quartz sand, calcium carbonate and 2 mL of 95% absolute ethanol; (2) adding 10 mL of ethanol for further grounding until the tissue slurry becomes white; (3) filtering the tissue slurry into a 25 mL brown volumetric flask; (4) once filtering solution produced by rinsing the mortar and tissue residue using ethanol into the brown volumetric flask until there was no green in the residue; (5) adjusting the volume of sample solution to 25 mL by adding ethanol into the brown volumetric flask; and (6) measuring their absorbance by an UV-Vis spectrophotometer (UV-1800, SHIMADZU, Shimadzu (Suzhou) Co., Ltd., Suzhou, China) calibrated by using a blank solution (95% of absolute ethanol) at 649 nm and 665 nm. Based on those absorbances, total chlorophyll content in the peel was calculated.

2.4. Primary Chemometrics Methods

Both qualitative and quantitative analysis were carried out to assess the maturity of banana fingers and evaluate their quality parameters during maturation. The spectral variables were employed directly as inputs of PLSDA algorithms in order to discriminate bananas in different maturity levels. Then, regression models between quality parameters (SSC, TA, chlorophyll and ΔE*) and spectral data were generated by partial least squares regression (PLSR) and interval PLS methods. Finally, visualized distribution maps of those quality parameters were constructed based on the regression models.
Among those chemometric methods, PLSR is one of the most commonly adopted strategies in establishment of linear regression models. It seeks the fundamental relationships between spectra (X variables) and targeted reference values (Y variable) based on extraction of orthogonal predictors (also named latent variables, LVs) that were obtained from the original spectral projection [44]. The optimum number of latent variables was determined by the first minimum value resulted from the predicted residual sum of the squares [45].
PLSDA converts the regression problem into the classification one based on PLSR algorithm [46]. In PLSDA, class-belonging is encoded by a binary “Dummy matrix” Y. PLSR is used to develop a model predicting the class number for each sample. The predicted value obtained by PLSR will not be binarized, but it will contain real continuous values. In order to use the predicted value to classify the samples, a threshold was established. During modelling, the best number of LVs was chosen on a basis of the lowest root mean square error in cross-validation set (RMSECV) resulted from random subsets cross validation [47].

3. Results and Discussion

A pseudo-color image (Figure 1) was represented with three single-band synthesized images at 566.2, 614.3 and 818.2 nm selected from the hyperspectral images. The image indicates apparent differences in the appearance of banana fingers between growth stage and harvestable stage. However, the difference among fingers in harvestable stage is not obvious. In maturity levels of 2 and 4, the fingers do not reach a harvestable stage and hence have clearly angular and much shorter lengths than others. In maturity levels of 6 and 7 or a stage known as “full three-quarters”, they could be harvested and shipped for distant markets though the fingers are still angular. As the maturity level increases, the fingers lose angularity and become more and more full in shape. The fruit in maturity levels of 8 and 9 are in a cylindrical shape and usually harvested for local markets.

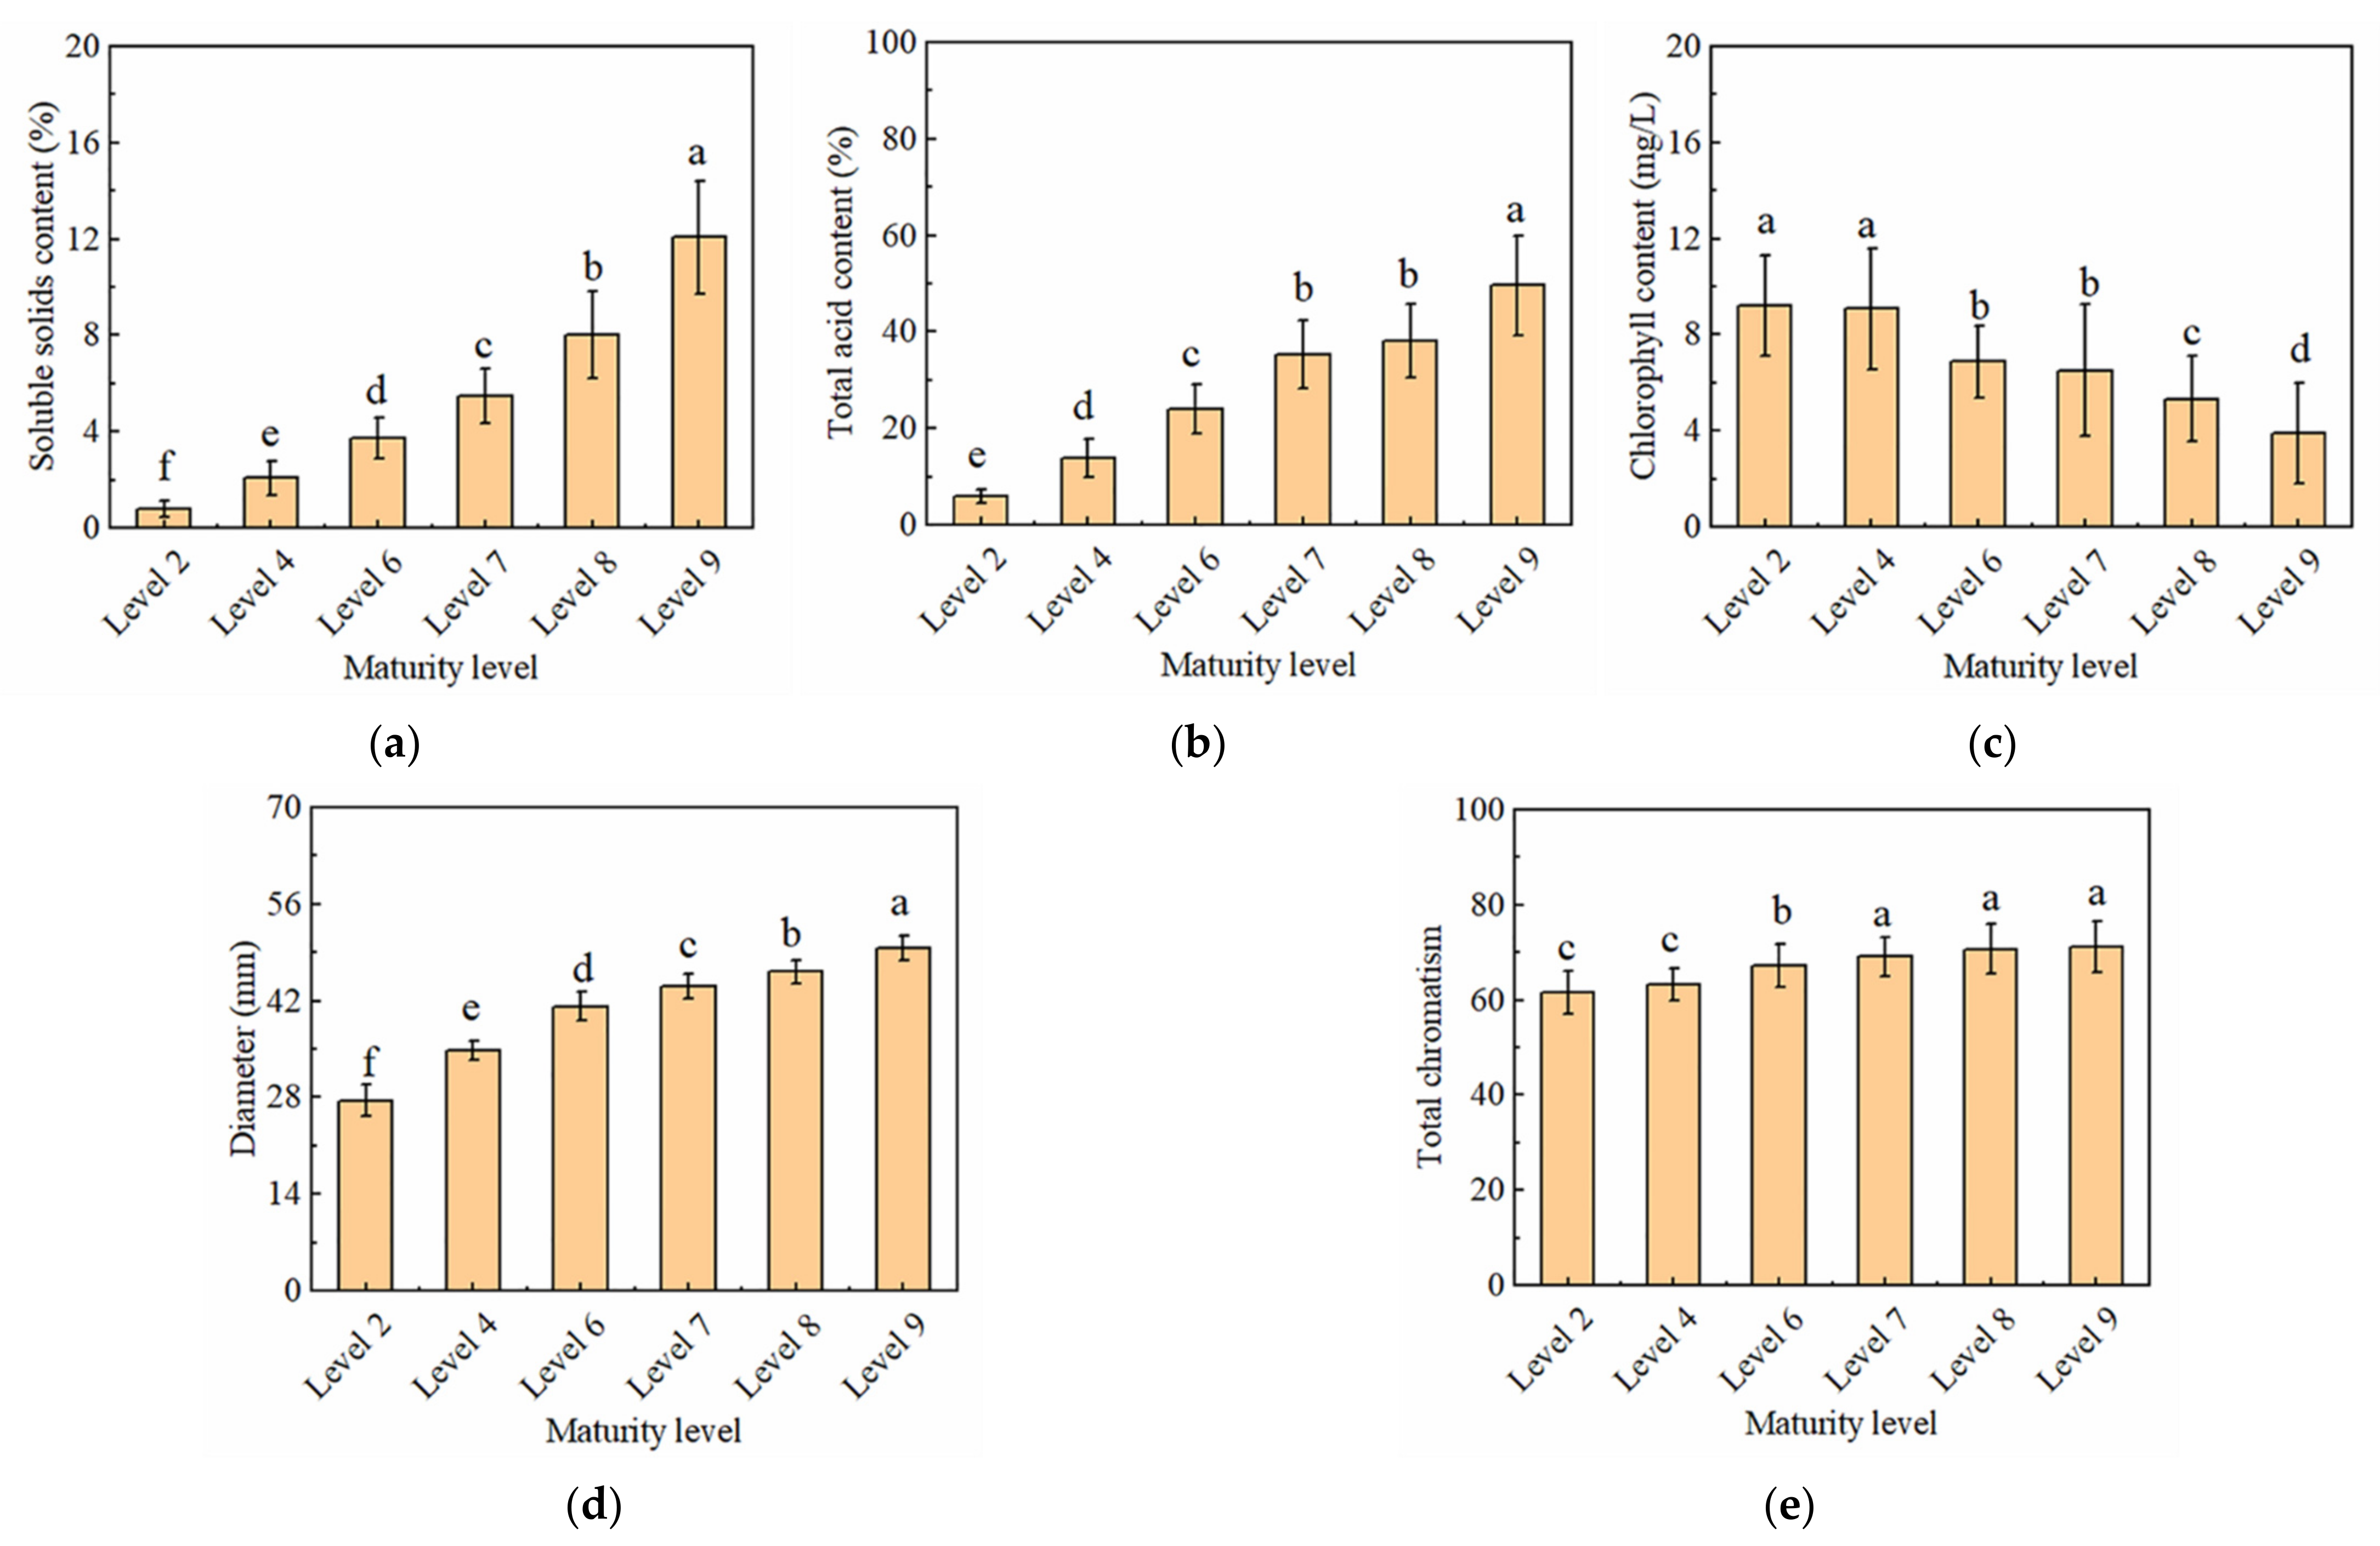
3.1. Statistical Analysis of Quality Parameters

During growth of banana, the color of fruit finger changes from dark green to green and finally to yellow green, and their shape changes from the angular to the full. Meanwhile, the pulp and nutraceutical components content also accumulated. The specific results of descriptive statistics of the appearance and internal quality parameters are shown in Table 1. The correlation coefficient between maturity level and those quality parameters were also obtained. At a significance level of 0.01, the diameter, TA, SSC, chlorophyll and ΔE* were significantly and positively related to the maturity level, and the chlorophyll was significantly and negatively related to maturity level. The correlation coefficient between maturity level and diameter, TA and SSC were higher than those between maturity level and chlorophyll as well as ΔE*.
Furthermore, one-way analysis of variance (ANOVA) with Duncan’s multiple range test was carried out to compare the difference in values/content of quality parameters between different maturity levels. The results were shown in Figure 2. It could be seen that maturity level has remarkable effect on some quality parameters. Generally, the content of both SSC and TA significantly increased with increasing maturity level. The increase of SSC could be primarily attribute to the photosynthesis and/or hydrolysis of starch by amylase [30]. Contrary to SSC and TA, chlorophyll content had a tendency to decrease with increasing maturity level. The chlorophyll content in maturity levels 6 and 7 were significantly lower than those in maturity levels 2 and 4. In terms of external parameters, the diameter and total chromatism also significantly rise, while differences in diameter between maturity levels were more apparent than those in total chromaticity. Bananas in maturity levels of 2 and 4 were still in growth stage, and maturity level 7, 8 and 9 had already reached the harvestable standard. The color appearance of bananas in the growth stage was very difficult to identify, which may result in the insignificant difference in total chromatism between maturity levels 2 and 4. The similar explanation may also be applied to the differences in total chromatism between maturity levels 7, 8 and 9.

3.2. Differentiating Green Bananas in Different Maturity Levels

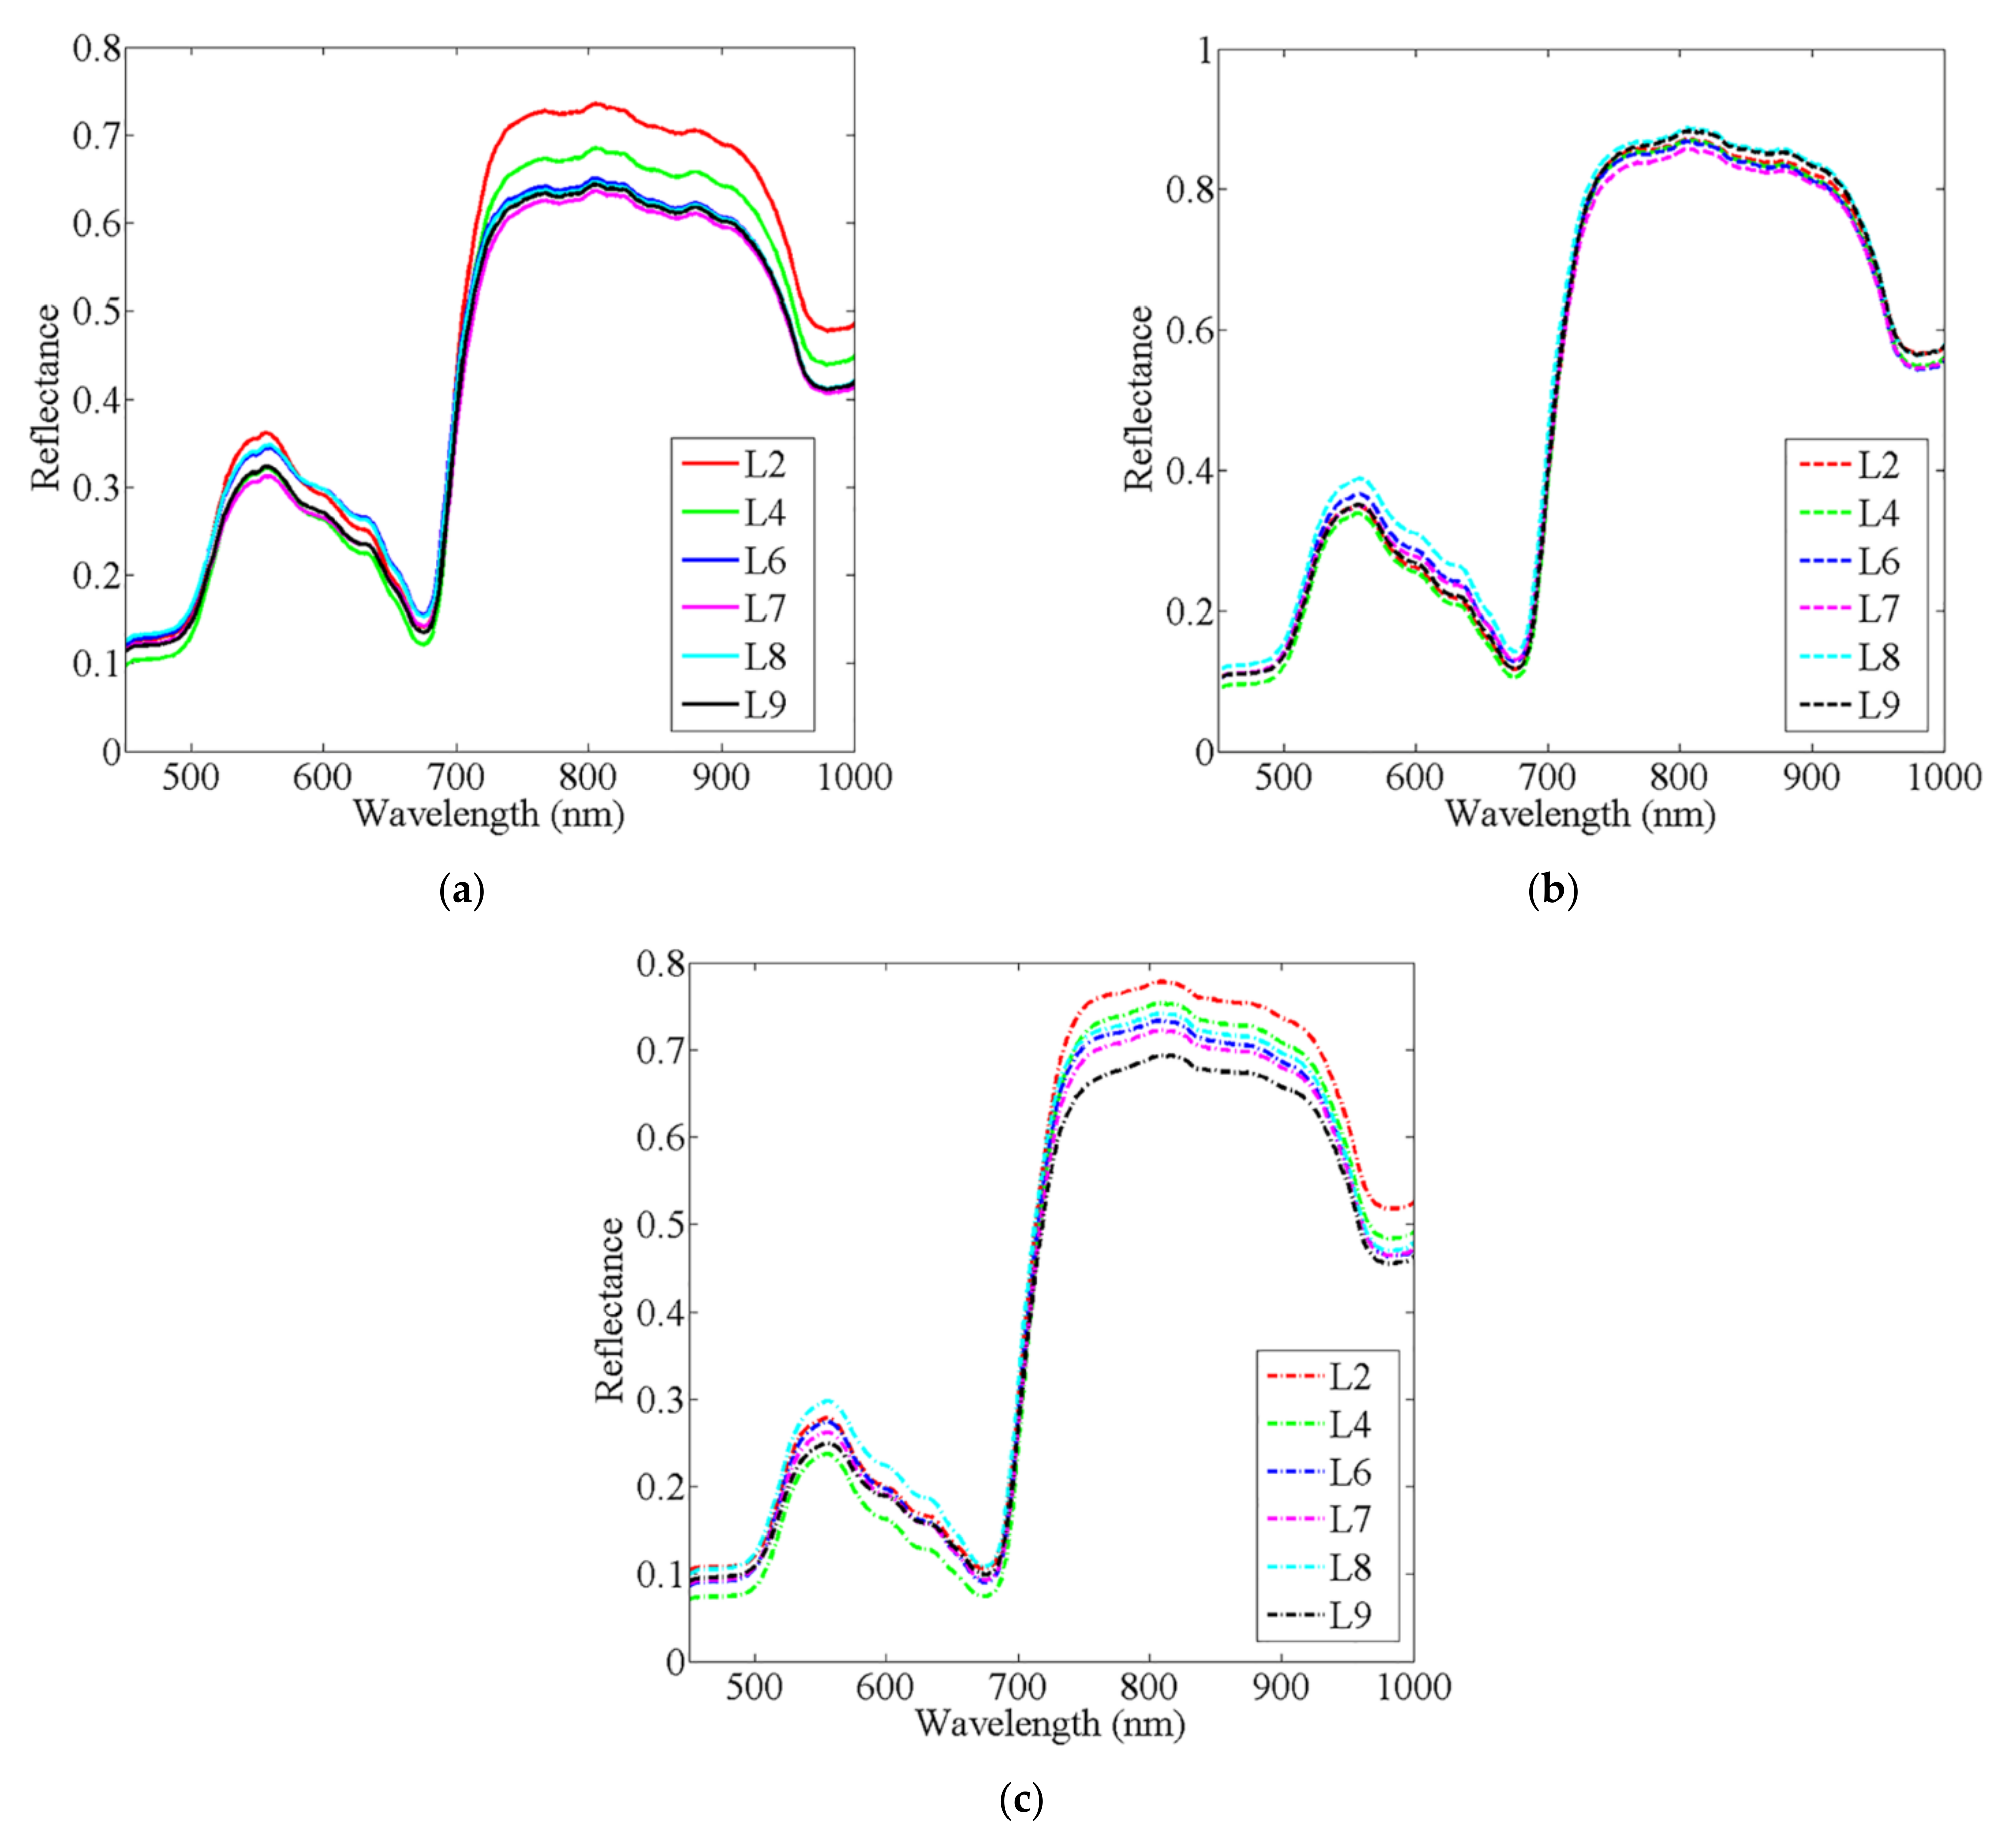
3.2.1. Spectral Profiles of Banana at Different Maturity Levels

The spectra of banana samples were extracted from the hyperspectral image cubes. In order to remove backgrounds and noise, the calibrated hyperspectral images were firstly trimmed into new smaller hypercubes with a wavelength range of 450.9–1000.7 nm. Subsequently, the first 6 pcs were used in the inverse principal component analysis (PCA) to reduce pixel random noise. Then, the regions of interest (ROIs) with a 11 × 11 pixels’ area were selected manually from three zones, i.e., pedicel zone, middle zone and apex zone on a banana finger (Figure 3) in ENVI software (exelis visual information solutions, boulder, co., Boulder, CO, USA). Finally, a total of 521 averaged spectra (177 samples × 3 zones) were obtained from the ROIs.
The average spectra of each zone of a finger sample were also represented in Figure 3. The pattern of each zone’s spectral curve was similar, but the reflectance was different at the same wavelength. The differences in profile, i.e., plumpness or angularity between the three zones may be accounted for by the variance. Moreover, the uneven distribution of chemical composition on a finger may also contribute to the reflectance difference of spectra. An obvious peak at around 550 nm could reflect the content of chlorophyll. The sharp increase of reflectance from 680 to 780 nm was caused by the red edge. The spectral band from 800–960 nm mainly showed the water content of fruit [38].
The average spectra of each zone in the six maturity levels are shown in Figure 4. It is observed that the spectra of middle zone in each maturity level are overlapped. For the pedicel zone, the reflectance in the wavelength region of 780–1000 nm presents a general decrease with increasing maturity level. Spectral curve in maturity levels 2 and 4 are obviously different from those in other four levels, while the spectra in maturity levels 6–9 show a great similarity since those levels reach harvestable stage. For the apex zone, the reflectance spectra in the whole NIR region (from 700 to 1000 nm) present a gradient decrease from maturity level 2 to 9, which is in accordance with the finding of Diezma et al. [41]. As revealed by prior study, the similar patterns but different reflectance intensity in the spectra curves indicated the same internal substance but different content in different levels of maturity [48]. Saputro et al. [49] also pointed out that the overall difference in reflection characteristics of bananas is attributable to changes of physical and chemical parameters, such as color, soluble solid content, chlorophyll and moisture content. On the spectral curves, the peaks or valleys around 500, 680, 840, and 960 nm were exactly associated with anthocyanins, chlorophylls, sugars, and moisture contents in fruit [50]. On the basis of those features, chemometric techniques were further utilized to differentiate bananas in different maturity levels, and highlight their discrepancies in chemical composition.

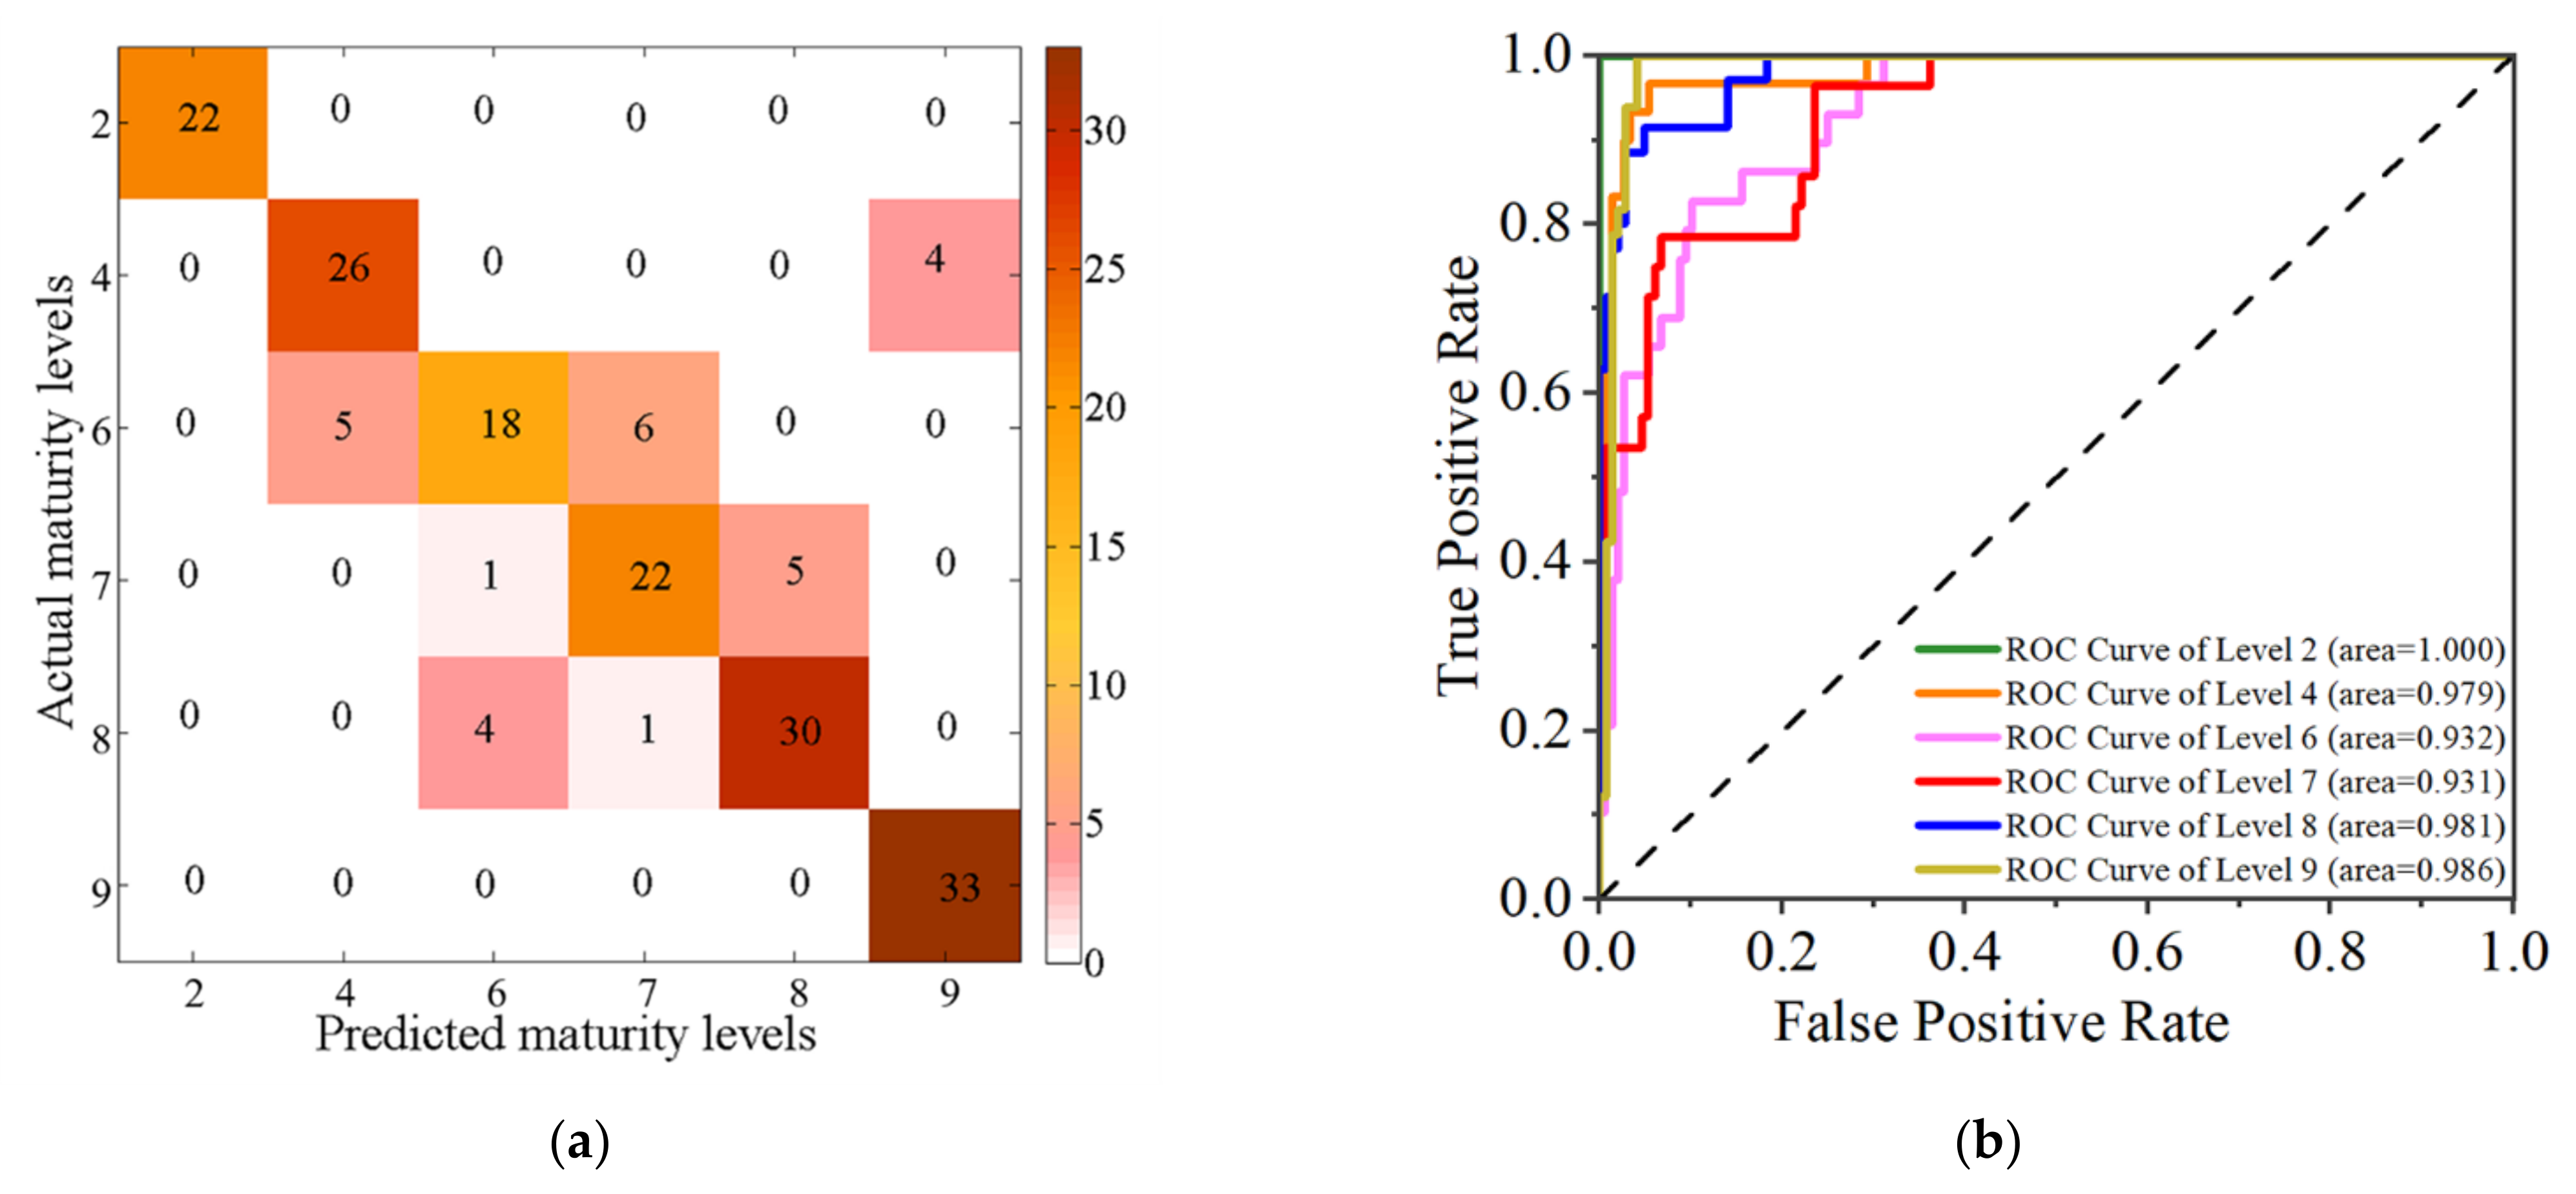
3.2.2. Identification Models of Maturity Levels of Banana Fingers

In order to identify maturity levels of bananas, identification models were first built based on the spectral data of each zone, respectively. Before modelling, pre-treatments (Baseline Offset, Normalize, standard normal variate (SNV), detrending (DET) and first-order derivatives) were performed to reduce unwanted information, i.e., light scattering, shifts in baseline, non-linearities and random noise. Each of the 177 spectra of each zone was pretreated by above methods, and PLSDA discrimination models based on both raw spectra and preprocessed data were, respectively, built for identifying maturity level. Two-thirds of the spectra were treated as calibration set and the rest were used for validation. Cross-validation was also applied to evaluate the model performance, and the model obtained by cross-validation using the calibration set was applied to the validation set [51]. In this study, PLSDA with the option of five-fold cross-validation were performed. All the identification results were listed in Table 2.
As shown in Table 2, all the PLSDA models with different pre-processing methods achieve favorable results with calibration accuracies of over 94.92% and validation accuracies of over 86.44%. These results indicate the feasibility of classifying maturity levels of banana using NIR spectroscopy combined with PLSDA method. For each of the three zones, the models based on raw spectra and pre-treated spectra showed similar performance, which indicated that the raw spectra were sufficiently effective and the preprocessing could be elided. It can also be seen that all the classifiers for middle and apex zones have higher accuracies than those for pedicel zone. A possible explanation was that the compounds varied spatially across different portions of a banana finger. A similar result was also reported in the research of Wei et al. [28], who analyzed the ripeness of astringent persimmon and indicated that the models for stem-calyx end side had better performance.
In actual detection, it would be more efficient to distinguish maturity level regardless of spectra acquisition position. Thus, a new generic PLSDA model was built with a total of 531 spectra of three zones pooled. Similar to the modelling for each zone, the ratio of the number of calibration and validation sets was 2:1. In the new generic PLSDA model, seventeen LVs was selected through cross-validation. The classification accuracy for calibration, cross-validation and validation set was 97.18%, 96.33% and 94.35%, respectively. For each group, the classification accuracy was over 81.81% in validation set. Extreme classes showed better results with classification accuracy of 100 %, 94.12%, 100% and 94.74% for maturity level 2, 4, 8 and 9, respectively. Results suggested that banana fingers with different maturity levels could be classified with high accuracy using the full region of raw NIR spectra.
In order to simplify the models and hasten the processing, selecting a wavelength range instead of the full range of spectra was an effective method. It can not only reduce spectral variables, but also avoid the curse of dimensionality. In this study, the spectra were equally divided into four regions, and each region had at least one peak or one shoulder. Identification models were established based on the four intervals, respectively, by PLSDA method, and results were summarized in Table 3.
As interval 2 had the maximum classification accuracy, it was chosen as the optimal interval for the subsequent model construction. The confusion matrix (Figure 5a) and ROC curves (Figure 5b) of the PLSDA model based on interval 2 represent good performance in identifying maturity levels. Similar to models based on the full spectra, it also showed better results in the extreme classes (maturity levels 2 and 9). The misclassified mainly occurred at intermediate classes (maturity levels 6 and 7). It was especially noteworthy that the lowest classification accuracy occurs in the identification of maturity level 6. About 21% of samples in maturity level 6 were assigned to maturity level 7 by the model; 18% of samples in maturity level 7 were assigned to maturity level 8. The similar appearance and internal composition may contribute to the misclassification, since the three levels were at harvestable stage.

3.3. Characterization of Quality Parameters of Banana in Different Maturity Levels

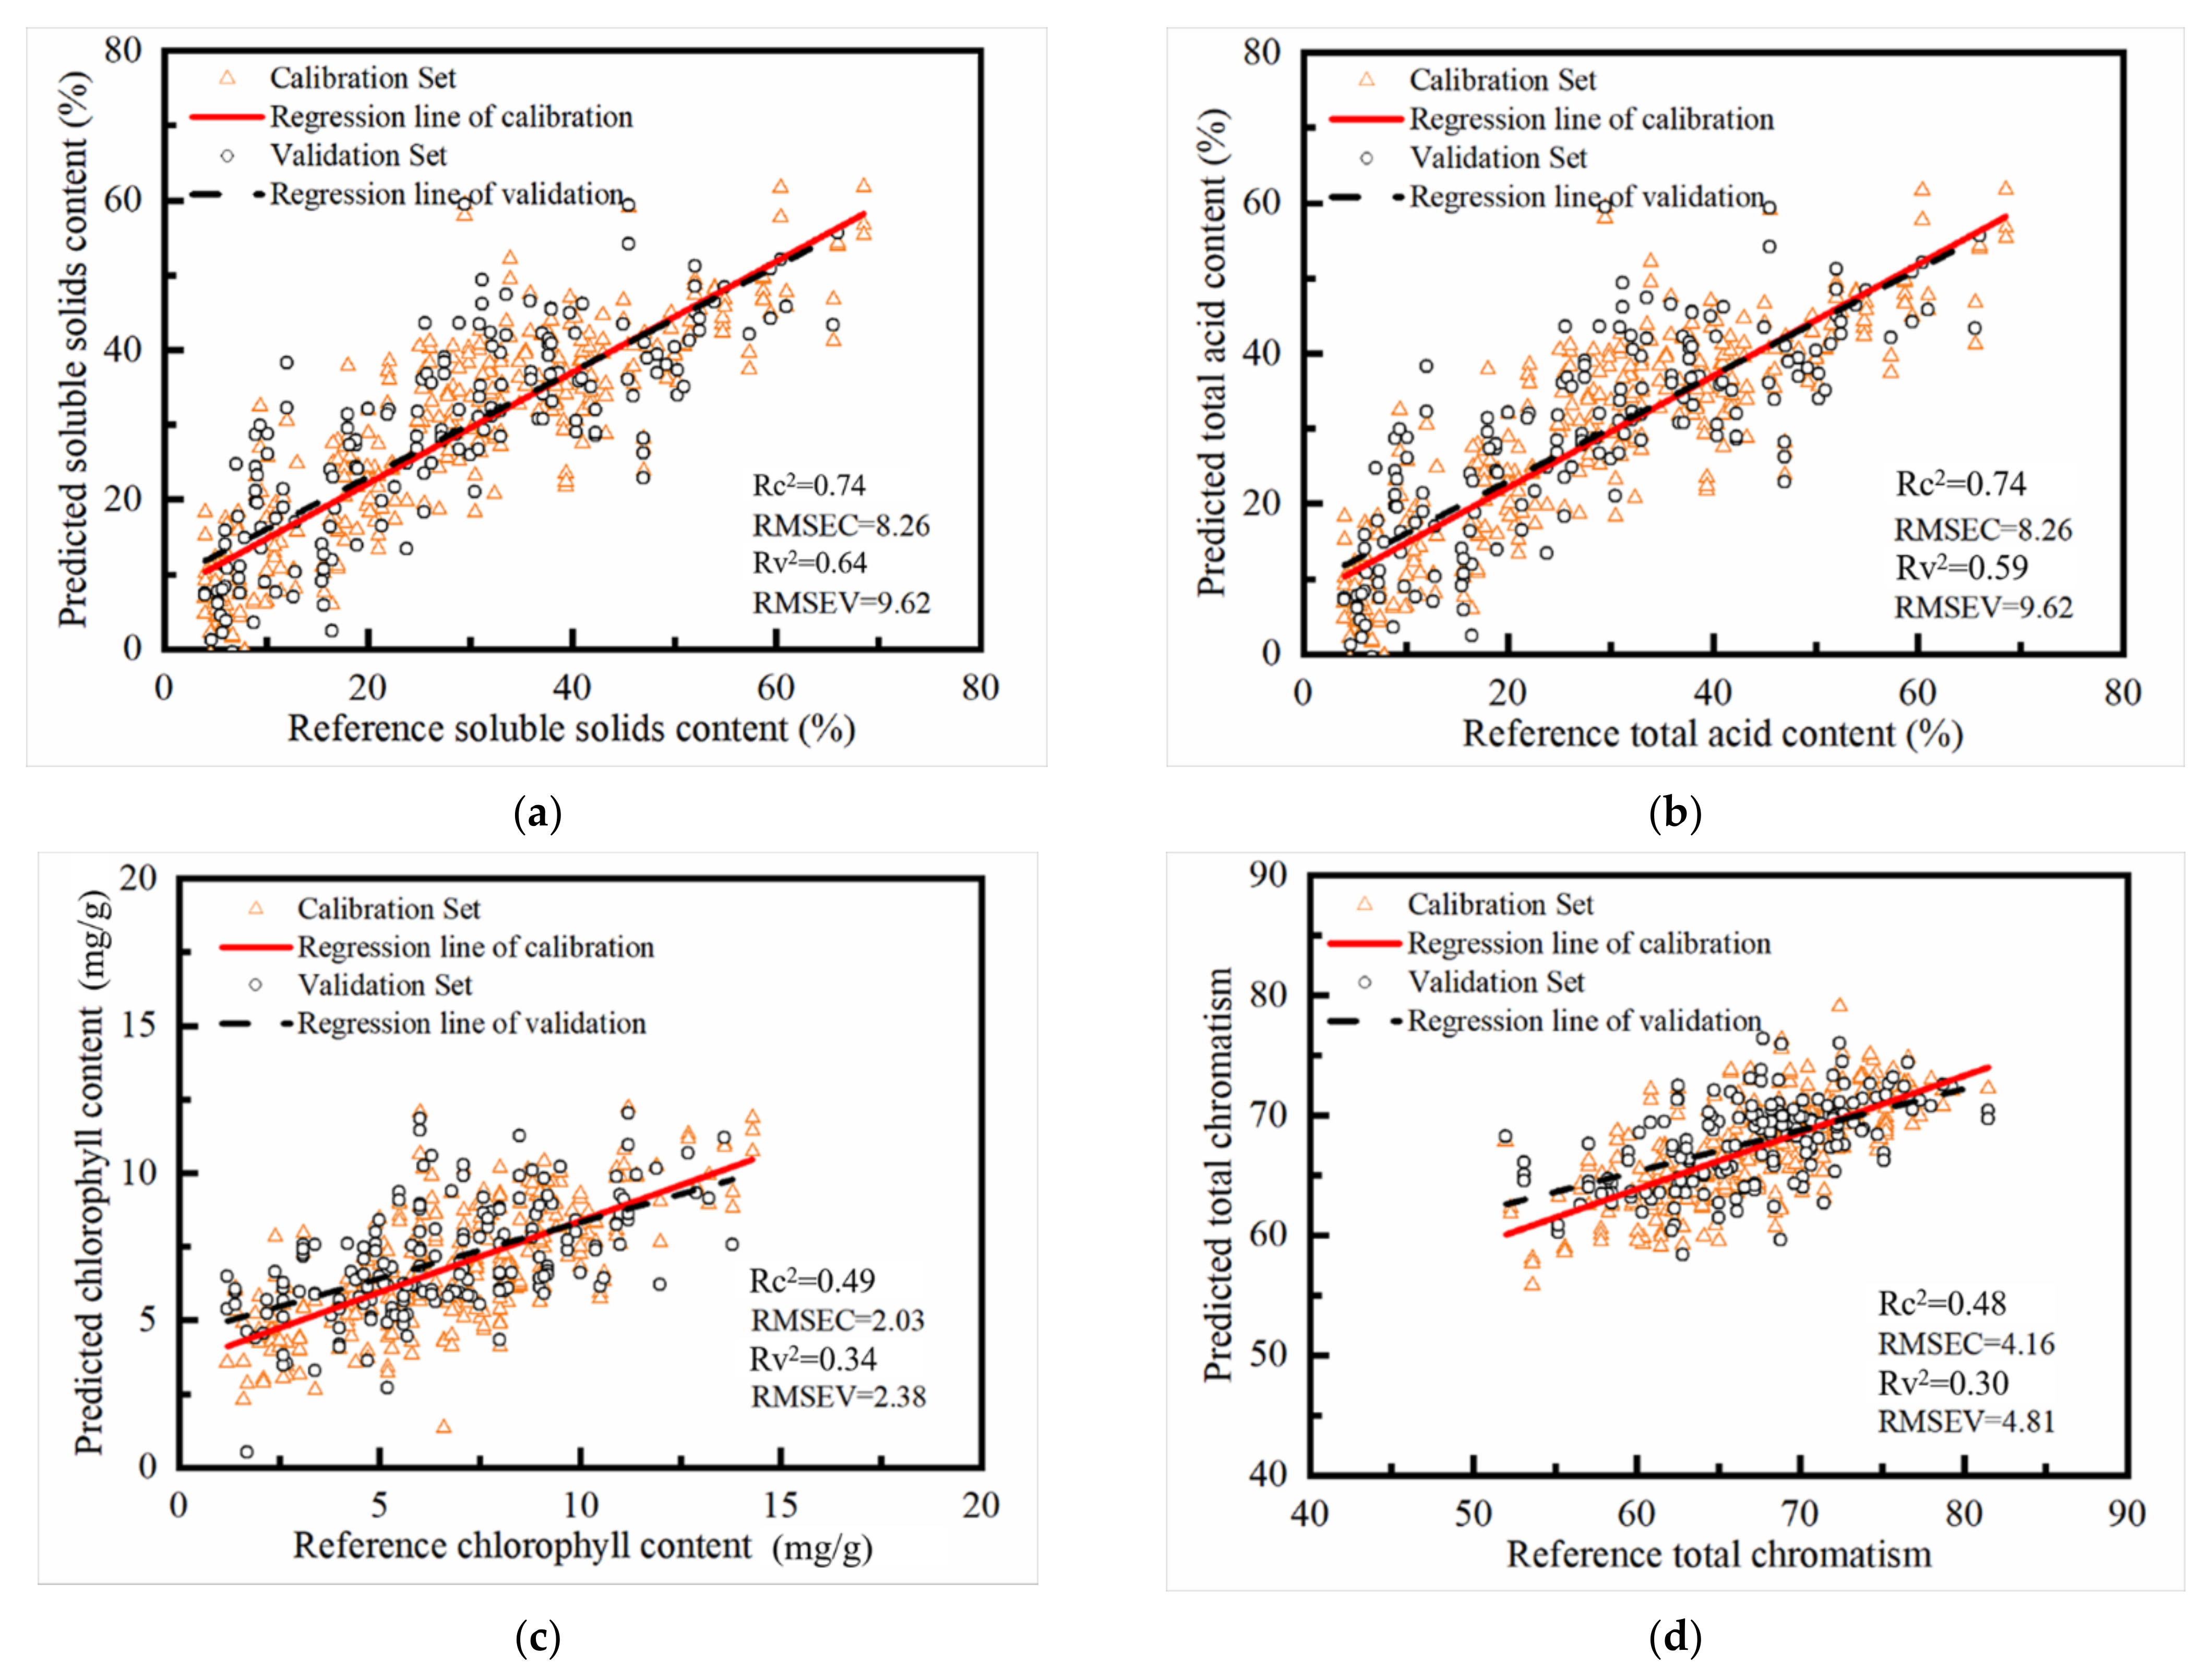
3.3.1. Full-Spectrum PLS Models

As mentioned before, chemical and physical properties of banana would change during maturation. Analyzing quality parameters, i.e., SSC, TA, chlorophyll and ΔE*, would be beneficial for identifying maturity level. Thus, the dependent variables (SSC, TA, chlorophyll and ΔE*) and the independent variables (full region of spectral data) from all the banana fingers were assigned to develop calibration models for the prediction of these parameters. In order to obtain the optimal performance of model, PLS methods were performed on the raw spectral data and preprocessed spectra, respectively. During modelling, a total of 531 spectra were randomly divided into calibration and validation sets with a ratio of 2:1, and the optimal number of LVs in each model was also selected by five-fold cross-validation. The performance of the acquired models was evaluated by considering coefficient of determination (R2) and root mean square error (RMSE) in calibration, validation and cross-validation set (R2c, R2v, R2cv, RMSEC, RMSEV and RMSECV). Generally, higher values of R2c, R2v, R2cv but lower values of RMSEC, RMSECV, and RMSEP indicate good performance of model [52]. Results of the established models for quality parameters were represented in Table 4.
For those four parameters, the models developed using raw and pretreated spectra provided acceptable results. In models for SSC and TA, applying methods of baseline offset, normalize, SNV and SNV+DET achieved a higher performance. The best result with R2v of 0.79, 0.75 and 0.46, respectively, for SSC, TA and ΔE* were obtained by applying SNV. For chlorophyll, the best model with R2v of 0.42 were obtained by applying normalize per-processing method. However, applying those pre-processing methods to raw spectra did not significantly improve the performance of PLS models. Thus, the following PLS models were developed based on raw spectra without pretreatment. The models achieved better results for SSC and TA. In validation set, R2v and RMSEV were 0.74 and 1.98% for SSC, and 0.68 and 8.59% for TA, respectively. The values of R2v in SSC and TA indicated a good performance of model [53]. Comparing with previous studies, the predictive results for the SSC were slightly inferior. For example, the R2v and RMSEV were 0.85 and 1.98, respectively, in a study performed by Masithoh et al. [54], who utilized baseline offset method and PLS method to predict SSC of banana by Vis/NIR spectroscopy (350–1000 nm) in reflectance mode. In another study conducted by Ali et al. [24], the values of R2v and RMSEV were 0.81 and 3.90 in a PLS model that was constructed based on original absorbance spectra in a range of 1000–2500 nm for prediction of SSC in banana. The situation could be explained by the following reasons. The predictive ability of spectral data is associated with their acquisition mode and wavelength range. The variations in composition between ripened and green bananas would also affect the performance of models. Moreover, the predictive results of chlorophyll and ΔE* are similar with R2v of 0.42 and 0.44, and RMSEV of 2.20 mg/g and 4.28, respectively. The close correlation between color change and chlorophyll degradation during maturation of banana may cause the similarity [55]. Compared to those for SSC and TA, the predictive results for chlorophyll and ΔE* were inferior. This may be attributed to the larger variance in SSC and TA, as the difference between the six maturity levels was greater than that in chlorophyll and ΔE* (Figure 2).

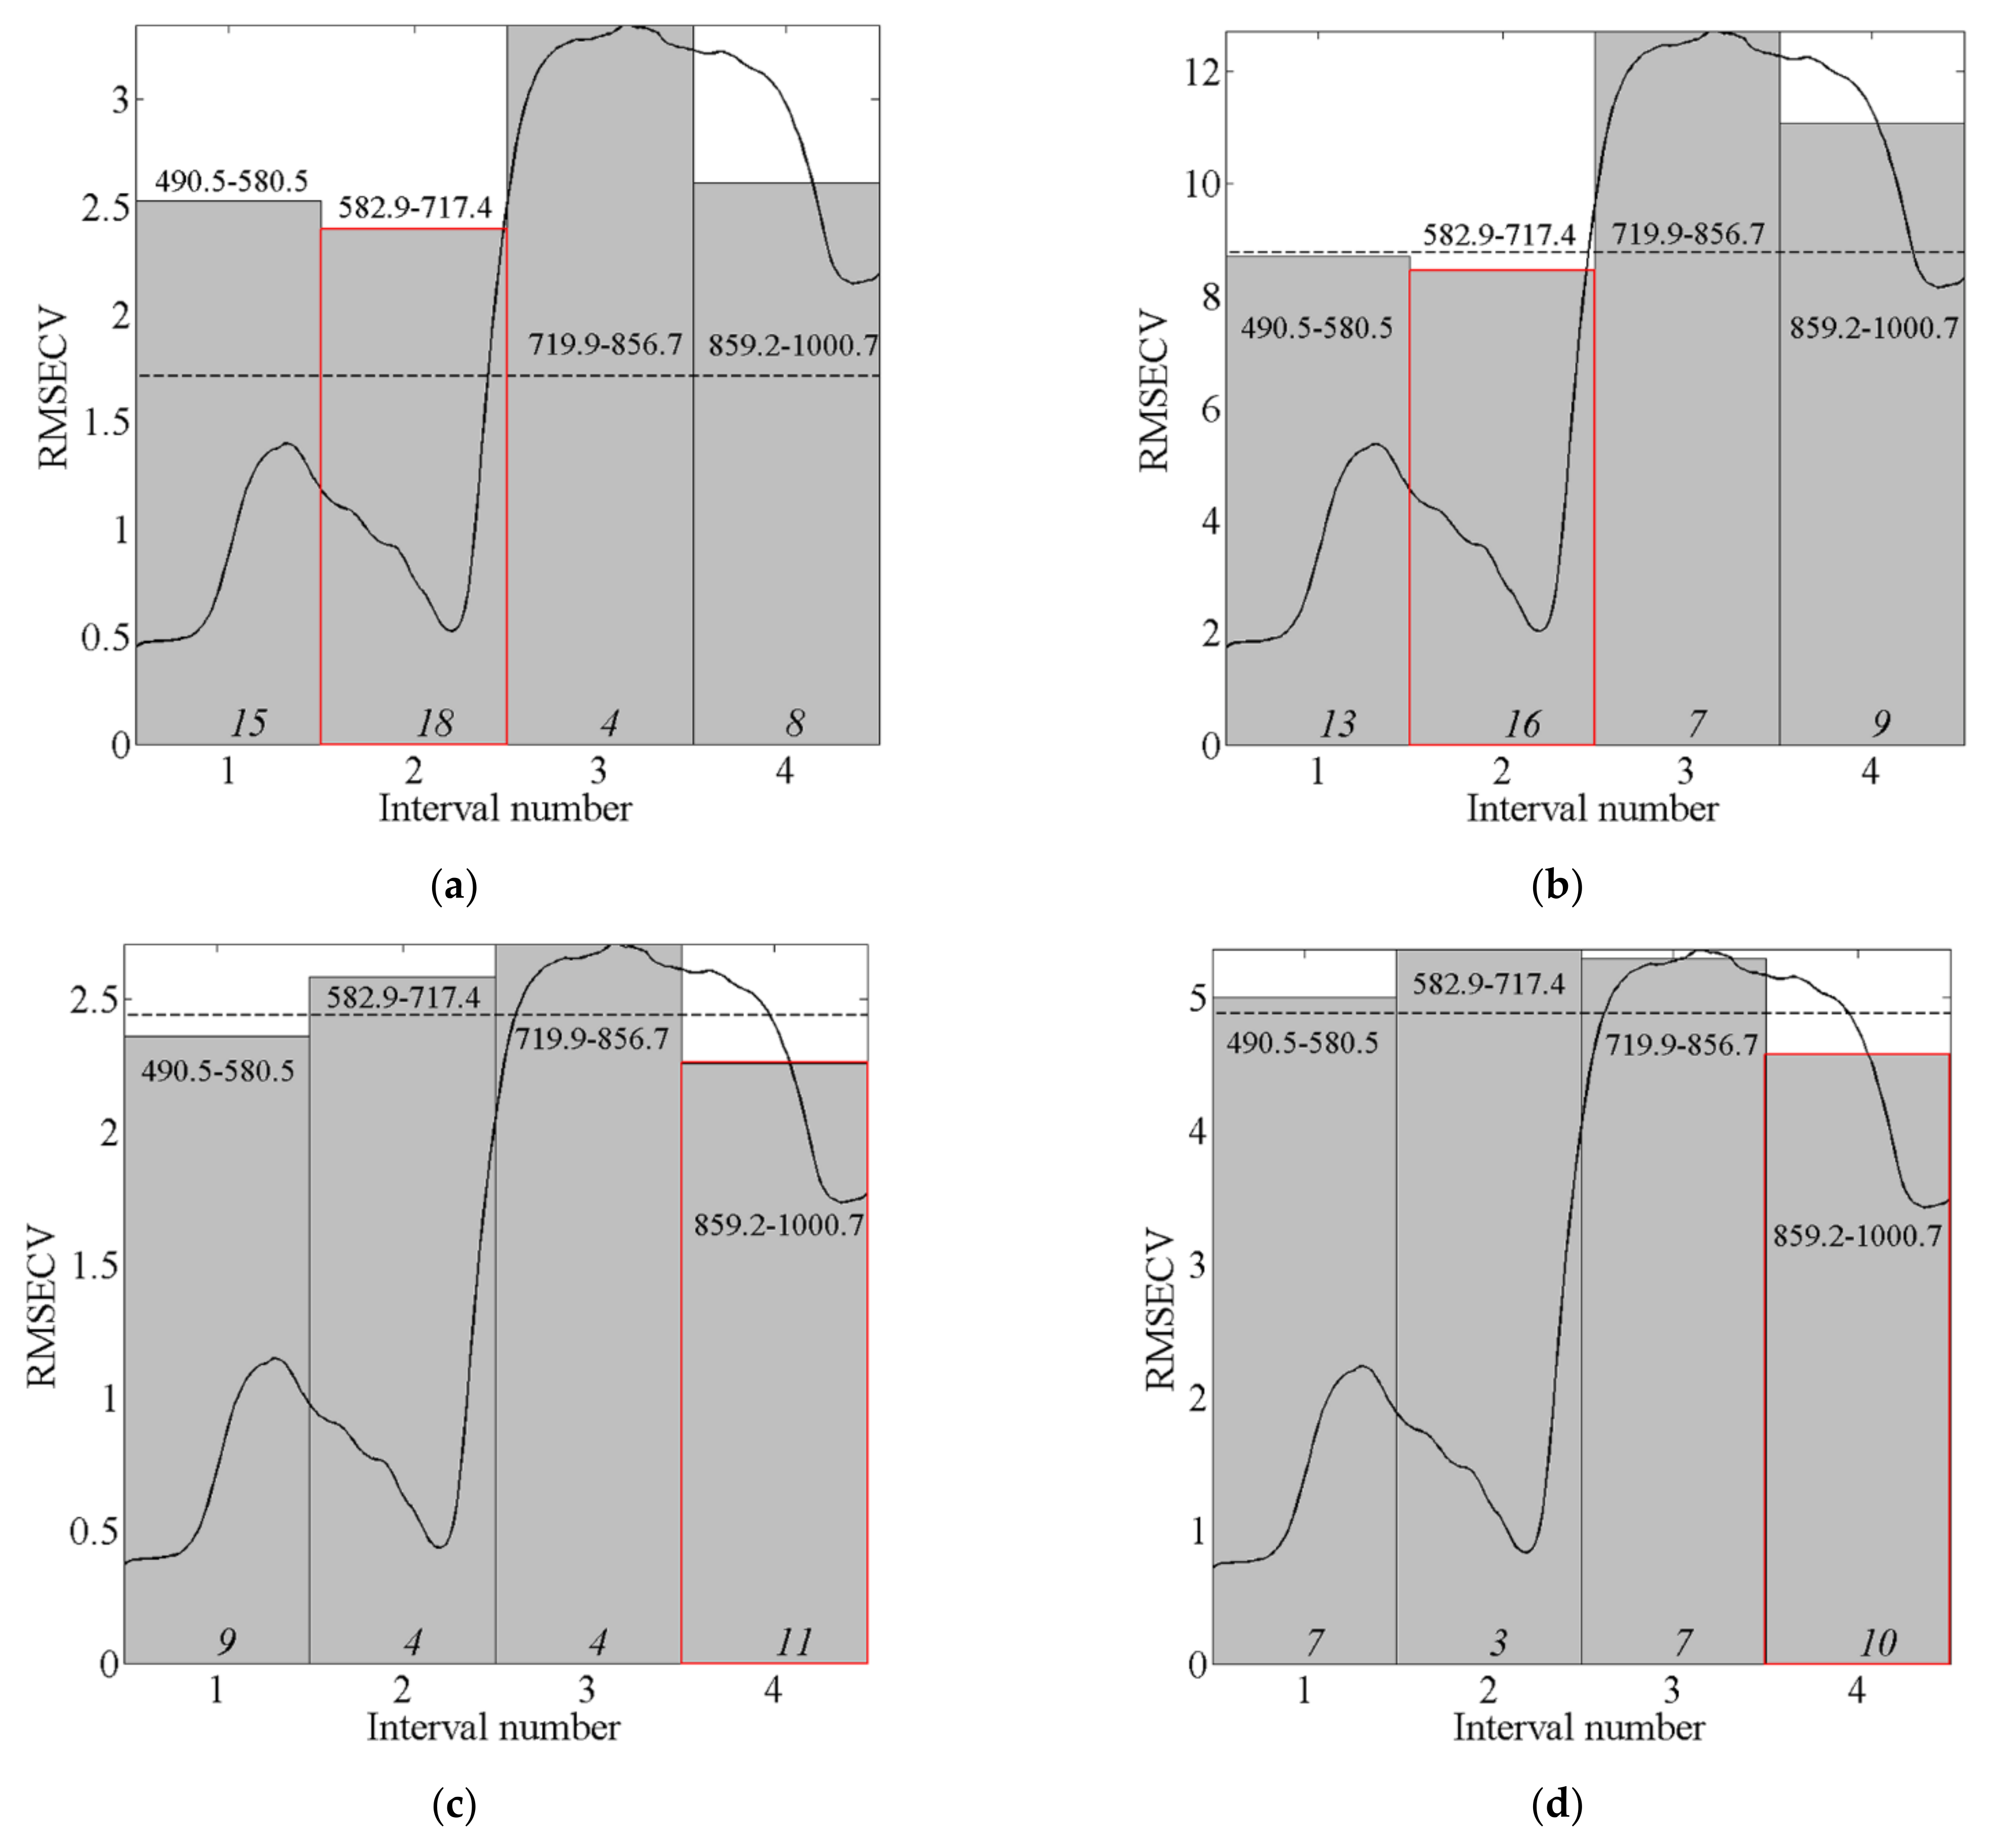
3.3.2. Interval PLS Models

In order to simplify the models and hasten the processing, a wavelength range was selected instead of the full range. Following the process presented in Section 3.2.2, for each quality parameter, prediction models were established by PLS method based on the four intervals, respectively, and the interval corresponding to the minimum RMSECV was selected as the optimal. Figure 6 represents the optimal intervals selected for modelling for predicting different quality parameters. The dotted line represents the RMSECV of the model with the full spectral range. It can be found that interval 2 with a range of 582.0–717.4 nm performed better in prediction of SSC and TA. Additionally, for chlorophyll and ΔE*, interval 4 with a range of 859.2–1000.7 nm was selected. The optimal interval for each quality parameter was marked with red rectangle (Figure 6).
For each quality parameter, Table 5 presents the values of R2 and RMSE in calibration and validation sets, as well as the number of LVs employed in the interval PLS models. Similar to PLS models by the full spectra, the performance of the interval PLS models in prediction of SSC and TA was better than that for predicting chlorophyll and ΔE*. The R2 for SSC and TA in validation set were around 0.60, which indicated a good prediction of the model [53]. In the prediction of ΔE* and chlorophyll, the values of R2 were around 0.35. This means that the model can be used just as screening methodology to distinguish low and high values [56]. Compared with the results of the full spectral PLS models shown in Table 4, the R2 was slightly reduced and the RMSE was slightly increased in the interval PLS model. The reduction of the spectral variables may cause the change. In conclusion, these results suggested that the selected variables were still suitable in developing simplified models in estimation of some parameters of banana.
Figure 7 shows the relationships between the actual and the predicted values obtained by the interval PLS models based on the selected spectral interval for SSC, TA, ΔE* and chlorophyll content. It could be seen that the points for reference and predicted were around the regression lines, and the regression lines for calibration and validation sets were almost overlapped. These indicated that the gap between calibration and validation is tiny.
Distribution maps of SSC, TA, chlorophyll and ΔE* in a banana finger were created by applying the interval PLS models to each pixel of the hyperspectral image (Figure 8). On the color bar, the number represents the values of SSC, TA, ΔE* and chlorophyll. These values increased with varying color from blue or cyan to red. Since the content of SSC and TA increased with maturation of banana, blue and cyan decreased while red increased from maturity level 2 to 9. In addition, the changes in color of whole banana clearly indicated the difference of SSC and TA between different maturity levels. Figure 8c,d also indicated the increase of ΔE* and decrease of chlorophyll content, respectively. However, the evolution of the two parameters was not clear among maturity levels 7 to 9. Figure 8 also shows the nonuniformity of distribution of the four quality parameters in each banana finger. The result is consistent with that reported by Magwaza et al. [57]. Therefore, the visual distribution map could be a useful tool representing the changes of SSC, TA, ΔE* and chlorophyll content during maturation of banana.

4. Conclusions

This study examined the feasibility of hyperspectral imaging in identifying maturity level of green banana and characterizing quality parameters (SSC, TA, ΔE* and chlorophyll content) of banana during maturation. The major findings and conclusions are as follows:
(1)
VIS-NIR hyperspectral imaging was feasible to assess the maturity level of green banana. PLSDA models based on different spectral subsets (spectra of pedicel zone, spectra of middle zone, spectra of apex zone, and spectra of the three zones) for identifying green banana in different maturity levels achieved an average classification accuracy of over 91.53%. For the generic PLSDA model based on spectra of the three zones pooled, better results were obtained with classification accuracies of 97.18%, 96.33% and 94.35% in calibration, cross-validation and validation set boulder image could be used to characterize quality parameters (SSC, TA, chlorophyll and ΔE*) in individual banana fingers. The full-spectra PLS models were built for prediction of those quality parameters, respectively. For SSC and TA, models were usable for quality assurance applications, and the R2v and RMSEV values were [0.74, 1.98] and [0.68, 8.59], respectively. The models for chlorophyll and ΔE* could just be used for sample screening with lower values of R2v and RMSEV of [0.42, 2.20] and [0.44, 4.28], respectively.
(2)
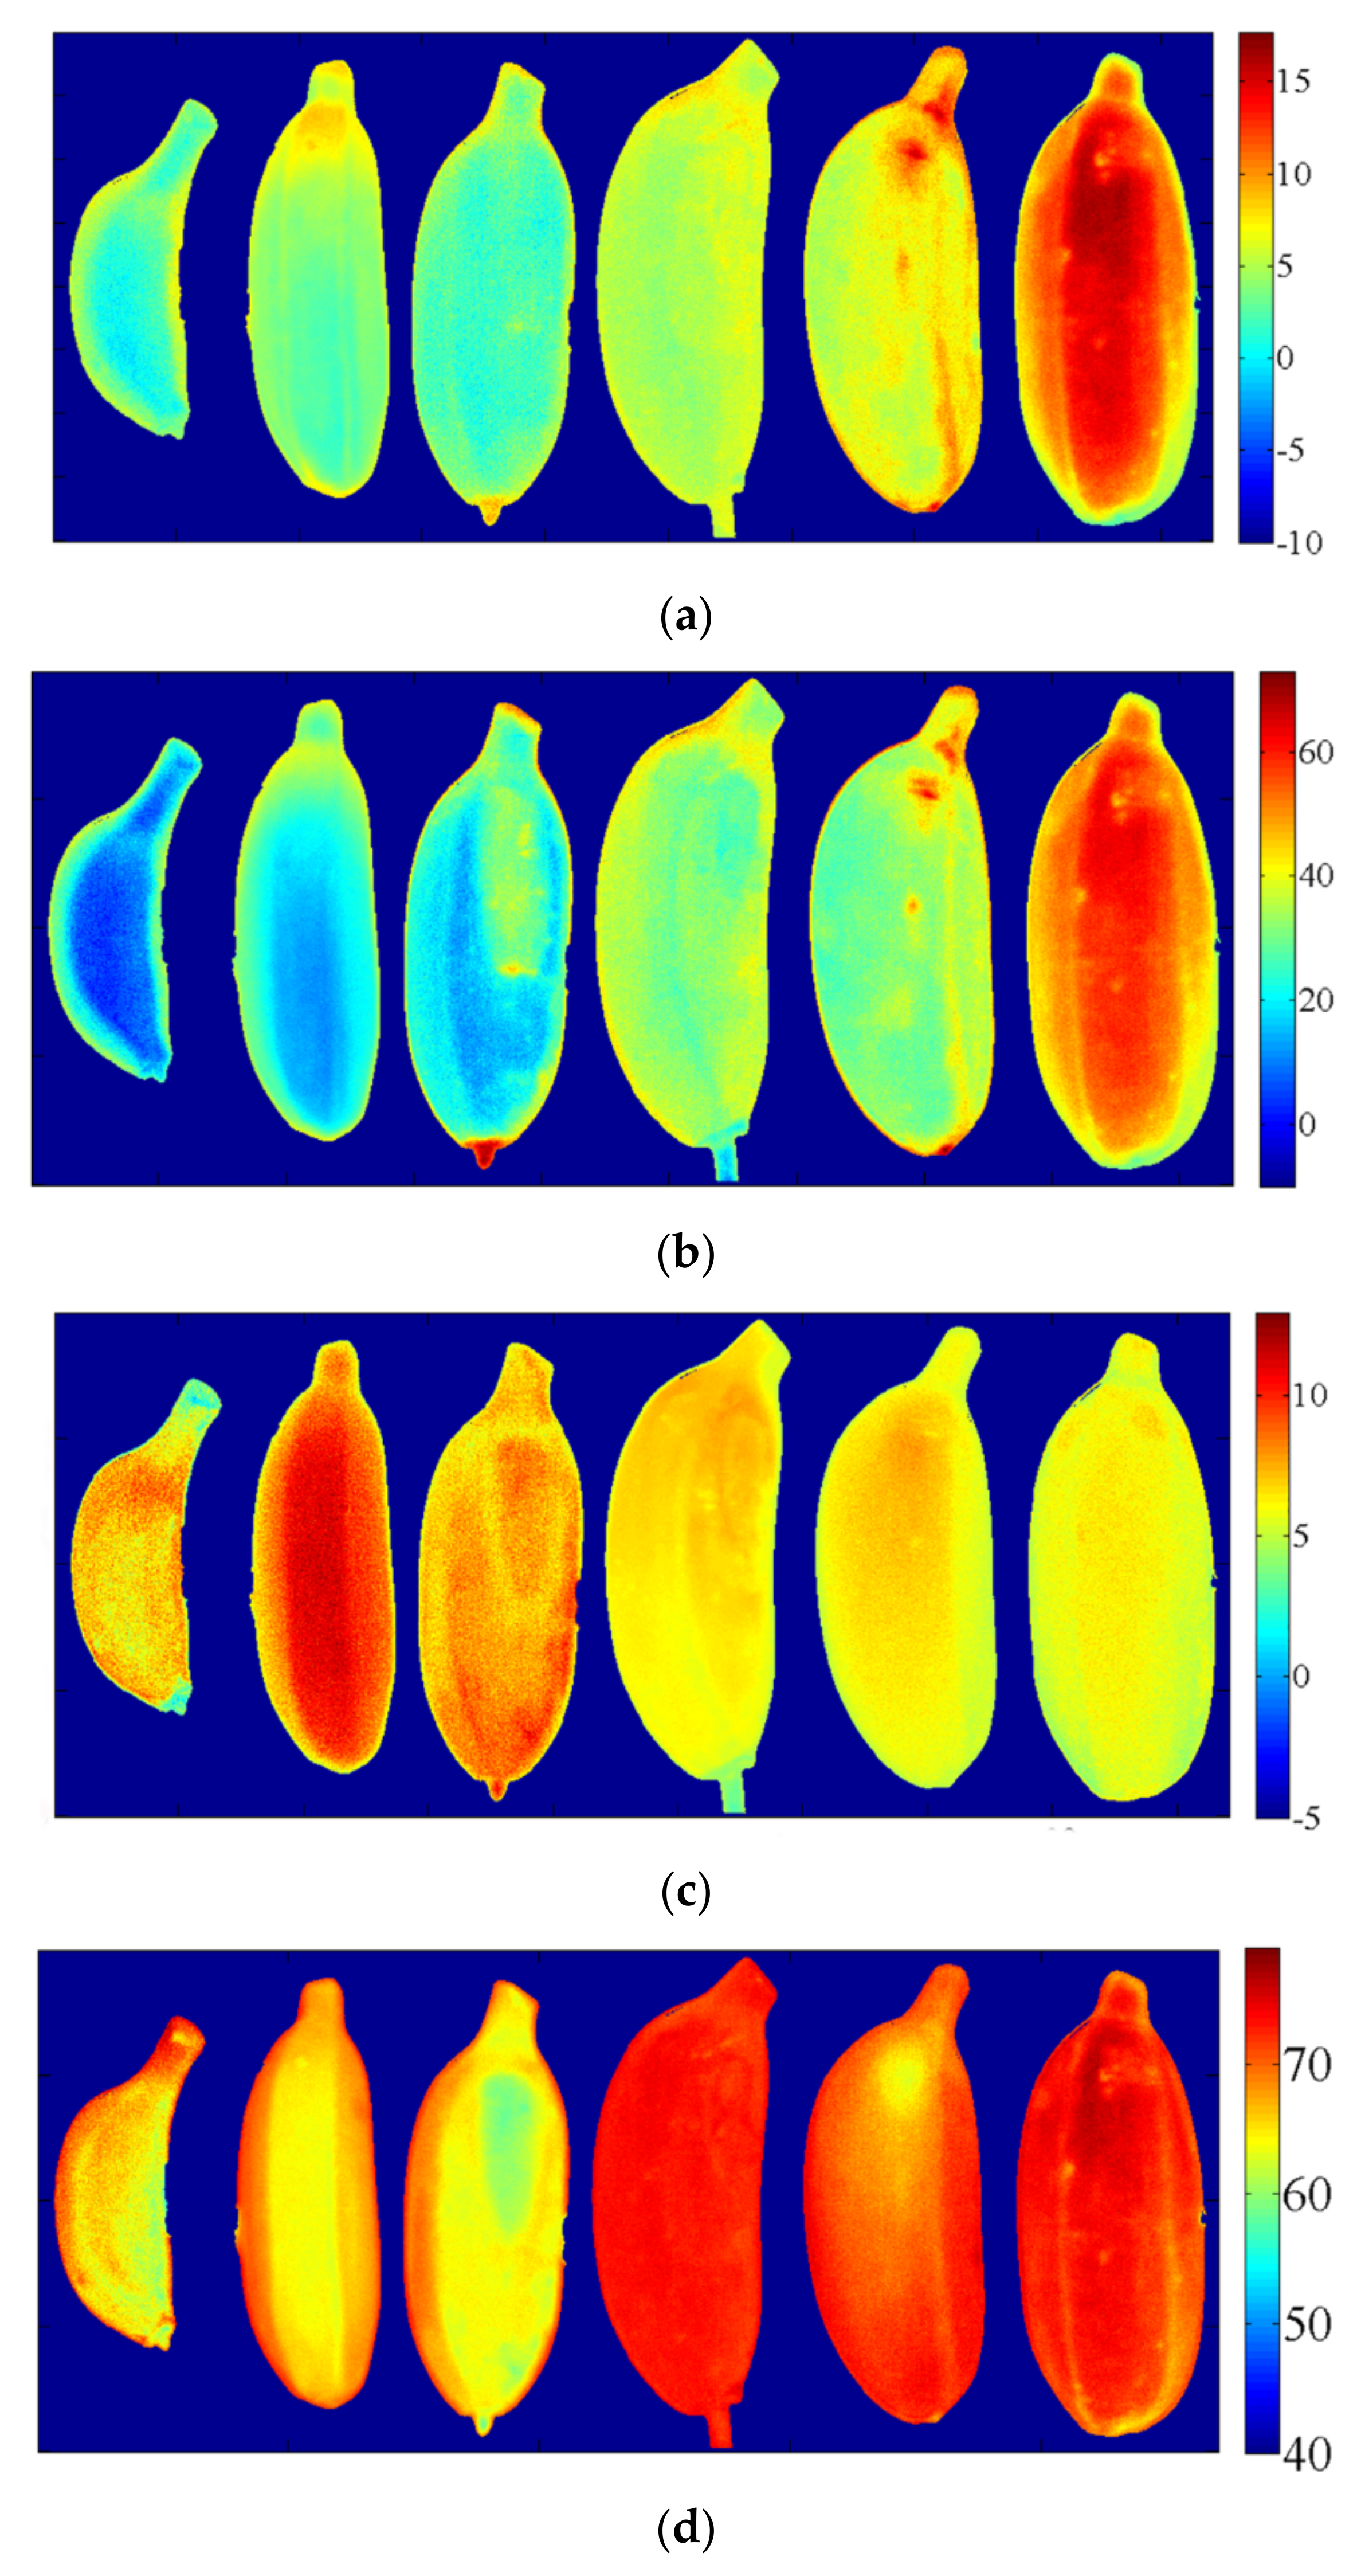
The interval PLS models based on the characteristic spectral regions (582.0–717.4 nm for SSC and TA, and 859.2–1000.7 nm for chlorophyll and ΔE*) could be used for creating distribution maps of quality parameters. The results of interval PLS models were R2v = 0.64 and RMSEV = 9.62 % for SSC, R2v = 0.59 and RMSEV = 2.44 % for TA, R2v = 0.34 and RMSEV = 2.38 mg/g for chlorophyll, and R2v = 0.30 and RMSEV = 4.81 for ΔE*. The possible distribution maps based on the interval PLS models indicated that the distribution of quality parameters was basically consistent with the actual situation, which also indicated that the hyperspectral image is a useful tool to assess the quality of banana.
It should be noted that this study has only involved a cultivar of “Fenjiao No.1”. In order to improve the performance and applicability of the models, more samples and different cultivars of banana will be included gradually. Besides, this study primarily focused on the spectral analysis while the combinative analysis of image and spectra will be considered in the future.

Author Contributions

Conceptualization, Z.M., H.F. and H.J.; methodology, H.F. and H.L.; software, K.Z., P.M. and H.J.; validation, H.L. and H.F.; formal analysis, X.C., K.Z. and P.M.; investigation, P.M.; resources, Z.M.; data curation, H.L. and H.J.; writing—original draft preparation, X.C. and H.W.; writing—review and editing, X.C., H.W. and H.F.; visualization, X.C. and H.J.; supervision, H.W.; project administration, Z.M.; funding acquisition, X.C. All authors have read and agreed to the published version of the manuscript.

Funding

This research was funded by National Natural Science Foundation of China, grant number 32102087; Natural Science Foundation of Guangdong Province, grant number 2020A151501795; Youth Innovative Talent Projects in Universities of Guangdong Province, grant number 2019KQNCX049 and Innovative Projects of Department of Education in Universities of Guangdong Province, grant number KA190578823.

Institutional Review Board Statement

Not applicable.

Informed Consent Statement

Not applicable.

Data Availability Statement

The data presented in this study are available on request from the corresponding author.

Conflicts of Interest

The authors declare no conflict of interest.

References

  1. Panigrahi, N.; Thompson, A.J.; Zubelzu, S.; Knox, J.W. Identifying opportunities to improve management of water stress in banana production. Sci. Hortic. 2021, 276, 109735. [Google Scholar] [CrossRef]
  2. Ploetz, R.C.; Kema, G.H.; Ma, L.-J. Impact of diseases on export and smallholder production of banana. Annu. Rev. Phytopathol. 2015, 53, 269–288. [Google Scholar] [CrossRef] [PubMed]
  3. Saranya, N.; Srinivasan, K.; Kumar, S.K.P. Banana ripeness stage identification: A deep learning approach. J. Amb. Intell. Hum. Comput. 2021, 1–7. [Google Scholar] [CrossRef]
  4. Charoensiri, R.; Kongkachuichai, R.; Suknicom, S.; Sungpuag, P. Beta-carotene, lycopene, and alpha-tocopherol contents of selected Thai fruits. Food Chem. 2009, 113, 202–207. [Google Scholar] [CrossRef]
  5. Prabha, D.S.; Kumar, J.S. Assessment of banana fruit maturity by image processing technique. J. Food Sci. Technol. 2015, 52, 1316–1327. [Google Scholar] [CrossRef] [Green Version]
  6. Siddiq, M.; Ahmed, J.; Lobo, M.G. (Eds.) Handbook of Banana Production, Postharvest Science, Processing Technology, and Nutrition; John Wiley & Sons: Hoboken, NJ, USA, 2020. [Google Scholar]
  7. Dadzie, B.K.; Orchard, J.E. Routine Postharvest Screening of Banana/Plantain Hybrids: Criteria and Methods; Bioversity International: Rome, Italy, 1997. [Google Scholar]
  8. Vélez-Rivera, N.; Blasco, J.; Chanona-Pérez, J.; Calderón-Domínguez, G.; Perea, M.D.J.; Arzate-Vázquez, I.; Cubero, S.; Farrera-Rebollo, R. Computer vision system applied to classification of “Manila” mangoes during ripening process. Food Bioprocess Technol. 2014, 7, 1183–1194. [Google Scholar] [CrossRef]
  9. Kaur, H.; Sawhney, B.K.; Jawandha, S.K. Evaluation of plum fruit maturity by image processing techniques. J. Food Sci. Technol. 2018, 55, 3008–3015. [Google Scholar] [CrossRef]
  10. Tan, K.; Lee, W.S.; Gan, H.; Wang, S. Recognising blueberry fruit of different maturity using histogram oriented gradients and colour features in outdoor scenes. Bioprocess Eng. 2018, 176, 59–72. [Google Scholar] [CrossRef]
  11. Pérez, J.J.C.; Chanona-Pérez, J.; Mendez, J.V.M.; Calderón-Domínguez, G.; López-Santiago, R.; Perea, M.D.J.; Arzate-Vázquez, I. Evaluation of the ripening stages of apple (Golden Delicious) by means of computer vision system. Bioprocess Eng. 2017, 159, 46–58. [Google Scholar] [CrossRef]
  12. Wan, P.; Toudeshki, A.; Tan, H.; Ehsani, R. A methodology for fresh tomato maturity detection using computer vision. Comput. Electron. Agric. 2018, 146, 43–50. [Google Scholar] [CrossRef]
  13. Munera, S.; Hernández, F.; Aleixos, N.; Cubero, S.; Blasco, J. Maturity monitoring of intact fruit and arils of pomegranate cv. ‘Mollar de Elche’ using machine vision and chemometrics. Postharvest Biol. Technol. 2019, 156, 110936. [Google Scholar] [CrossRef]
  14. Guzmán, E.; Baeten, V.; Pierna, J.A.F.; García-Mesa, J.A. Determination of the olive maturity index of intact fruits using image analysis. J. Food Sci. Technol. 2015, 52, 1462–1470. [Google Scholar] [CrossRef] [Green Version]
  15. Septiarini, A.; Sunyoto, A.; Hamdani, H.; Kasim, A.A.; Utaminingrum, F.; Hatta, H.R. Machine vision for the maturity classification of oil palm fresh fruit bunches based on color and texture features. Sci. Hortic. 2021, 286, 110245. [Google Scholar] [CrossRef]
  16. Zhuang, J.; Hou, C.; Tang, Y.; He, Y.; Guo, Q.; Miao, A.; Zhong, Z.; Luo, S. Assessment of external properties for identifying banana fruit maturity stages using optical imaging techniques. Sensors 2019, 19, 2910. [Google Scholar] [CrossRef] [Green Version]
  17. Mazen, F.M.A.; Nashat, A.A. Ripeness classification of bananas using an artificial neural network. Arab. J. Sci. Eng. 2019, 44, 6901–6910. [Google Scholar] [CrossRef]
  18. Piedad, E.J.; Larada, J.I.; Pojas, G.J.; Ferrer, L.V.V. Postharvest classification of banana (Musa acuminata) using tier-based machine learning. Postharvest Biol. Technol. 2018, 145, 93–100. [Google Scholar] [CrossRef]
  19. Sun, Y.; Singh, Z.; Tokala, V.Y.; Heather, B. Harvest maturity stage and cold storage period influence lemon fruit quality. Sci. Hortic. 2019, 249, 322–328. [Google Scholar] [CrossRef]
  20. Marriott, J.; Robinson, M.; Karikari, S.K. Starch and sugar transformation during the ripening of plantains and bananas. J. Sci. Food Agric. 1981, 32, 1021–1026. [Google Scholar] [CrossRef]
  21. Cen, H.; He, Y. Theory and application of near infrared reflectance spectroscopy in determination of food quality. Trends Food Sci. Technol. 2007, 18, 72–83. [Google Scholar] [CrossRef]
  22. Liew, C.Y.; Lau, C.Y. Determination of quality parameters in Cavendish banana during ripening by NIR spectroscopy. Int. Food Res. J. 2012, 19, 751758. [Google Scholar]
  23. Zude, M. Non-destructive prediction of banana fruit quality using VIS/NIR spectroscopy. Fruits 2003, 58, 135–142. [Google Scholar] [CrossRef] [Green Version]
  24. Ali, M.M.; Janius, R.B.; Nawi, N.M.; Hashim, N. Prediction of total soluble solids and pH in banana using near infrared spectroscopy. J. Eng. Sci. Technol. 2018, 13, 254. [Google Scholar]
  25. Pu, Y.-Y.; Sun, D.-W.; Buccheri, M.; Grassi, M.; Cattaneo, T.M.; Gowen, A. Ripeness classification of bananito fruit (Musa acuminata, AA): A comparison study of visible spectroscopy and hyperspectral imaging. Food Anal. Methods 2019, 12, 1693–1704. [Google Scholar] [CrossRef]
  26. Intaravanne, Y.; Sumriddetchkajorn, S.; Nukeaw, J. Cell phone-based two-dimensional spectral analysis for banana ripeness estimation. Sens. Actuators B Chem. 2012, 168, 390–394. [Google Scholar] [CrossRef]
  27. Gowen, A.; O’Donnell, C.; Cullen, P.; Downey, G.; Frias, J. Hyperspectral imaging-an emerging process analytical tool for food quality and safety control. Trends Food Sci. Technol. 2007, 18, 590–598. [Google Scholar] [CrossRef]
  28. Wei, X.; Liu, F.; Qiu, Z.; Shao, Y.; He, Y. Ripeness classification of astringent persimmon using hyperspectral imaging technique. Food Bioprocess Technol. 2014, 7, 1371–1380. [Google Scholar] [CrossRef]
  29. Jiang, Y.; Chen, S.; Bian, B.; Li, Y.; Sun, Y.; Wang, X. Discrimination of tomato maturity using hyperspectral imaging combined with graph-based semi-supervised method considering class probability information. Food Anal. Methods 2021, 14, 968–983. [Google Scholar] [CrossRef]
  30. Benelli, A.; Cevoli, C.; Fabbri, A.; Ragni, L. Ripeness evaluation of kiwifruit by hyperspectral imaging. Biosyst. Eng. 2021, in press. [Google Scholar] [CrossRef]
  31. Neto, J.P.D.S.; de Assis, M.W.D.; Casagrande, I.P.; Junior, L.C.C.; Teixeira, G. Determination of “Palmer” mango maturity indices using portable near infrared (VIS-NIR) spectrometer. Postharvest Biol. Technol. 2017, 130, 75–80. [Google Scholar] [CrossRef] [Green Version]
  32. Shao, Y.; Wang, Y.; Xuan, G.; Gao, Z.; Hu, Z.; Gao, C.; Wang, K. Assessment of strawberry ripeness using hyperspectral imaging. Anal. Lett. 2020, 54, 1547–1560. [Google Scholar] [CrossRef]
  33. Lleó, L.; Roger, J.; Herrero-Langreo, A.; Diezma-Iglesias, B.; Barreiro, P. Comparison of multispectral indexes extracted from hyperspectral images for the assessment of fruit ripening. J. Food Eng. 2011, 104, 612–620. [Google Scholar] [CrossRef] [Green Version]
  34. Teerachaichayut, S.; Ho, H.T. Non-destructive prediction of total soluble solids, titratable acidity and maturity index of limes by near infrared hyperspectral imaging. Postharvest Biol. Technol. 2017, 133, 20–25. [Google Scholar] [CrossRef]
  35. Thumala, S.M.; Uma, R.; Mahalakshmi, G.; Swathi, S.; Saikumar, S. Quality detection system for bananas. Int. J. Res. Anal. Rev. 2019, 6, 131–133. [Google Scholar]
  36. Mesa, A.; Chiang, J. Multi-input deep learning model with RGB and hyperspectral imaging for banana grading. Agriculture 2021, 11, 687. [Google Scholar] [CrossRef]
  37. Zhao, W.; Yang, Z.; Chen, Z.; Liu, J.; Wang, W.C.; Zheng, W.Y. Hyperspectral surface analysis for ripeness estimation and quick UV-C surface treatments for preservation of bananas. J. Appl. Spectrosc. 2016, 83, 254–260. [Google Scholar] [CrossRef]
  38. Rajkumar, P.; Wang, N.; Eimasry, G.; Raghavan, G.; Gariepy, Y. Studies on banana fruit quality and maturity stages using hyperspectral imaging. J. Food Eng. 2012, 108, 194–200. [Google Scholar] [CrossRef]
  39. Xie, C.; Chu, B.; He, Y. Prediction of banana color and firmness using a novel wavelengths selection method of hyperspectral imaging. Food Chem. 2018, 245, 132–140. [Google Scholar] [CrossRef]
  40. Wang, N.-N.; Yang, Y.-C.; Sun, D.-W.; Pu, H.; Zhu, Z. Shelf-life prediction of ‘Gros Michel’ bananas with different browning levels using hyperspectral reflectance imaging. Food Anal. Methods 2015, 8, 1173–1184. [Google Scholar] [CrossRef]
  41. Diezma, B.; Franco, S.; Lleó, L.; Presečki, T.; Roger, J. Grading banana by VNIR hyperspectral imaging spectroscopy. In VIII international postharvest symposium: Enhancing supply chain and consumer benefits-ethical and technological. Acta Hortic. 2018, 1194, 1283–1290. [Google Scholar] [CrossRef]
  42. Zhu, S.; Ma, L.; Liu, S. Effets of different bagging treatment on main quality indices and storability of banana fruit. Trans. CSAE 2009, 25, 304–307. [Google Scholar]
  43. Zhang, Z.; Chen, Z. Experimental Techniques of Plant Physiology; Jilin University Press: Changchun, China, 2008. [Google Scholar]
  44. Das, B.; Sahoo, R.N.; Pargal, S.; Krishna, G.; Verma, R.; Chinnusamy, V.; Sehgal, V.; Gupta, V.K.; Dash, S.K.; Swain, P. Quantitative monitoring of sucrose, reducing sugar and total sugar dynamics for phenotyping of water-deficit stress tolerance in rice through spectroscopy and chemometrics. Spectrochim. Acta Part A 2018, 192, 41–51. [Google Scholar] [CrossRef]
  45. Menesatti, P.; Zanella, A.; D’Andrea, S.; Costa, C.; Paglia, G.; Pallottino, F. Supervised multivariate analysis of Hyper-spectral NIR images to evaluate the starch index of apples. Food Bioprocess Technol. 2009, 2, 308–314. [Google Scholar] [CrossRef]
  46. Ivorra, E.; Girón, J.; Sánchez, A.J.; Verdú, S.; Barat, J.M.; Grau, R. Detection of expired vacuum-packed smoked salmon based on PLS-DA method using hyperspectral images. J. Food Eng. 2013, 117, 342–349. [Google Scholar] [CrossRef] [Green Version]
  47. Luna, A.S.; da Silva, A.P.; Pinho, J.S.; Ferré, J.; Boqué, R. Rapid characterization of transgenic and non-transgenic soybean oils by chemometric methods using NIR spectroscopy. Spectrochim. Acta Part A 2013, 100, 115–119. [Google Scholar] [CrossRef] [PubMed]
  48. Li, X.; Wei, Y.; Xu, J.; Feng, X.; Wu, F.; Zhou, R.; Jin, J.; Xu, K.; Yu, X.; He, Y. SSC and pH for sweet assessment and maturity classification of harvested cherry fruit based on NIR hyperspectral imaging technology. Postharvest Biol. Technol. 2018, 143, 112–118. [Google Scholar] [CrossRef]
  49. Saputro, A.; Handayani, W. Wavelength Selection in hyperspectral imaging for predicting banana fruit quality. In Proceedings of the International Conference on Electrical Engineering and Informatics (ICELTICs 2017), Banda Aceh, Indonesia, 18–20 October 2017. [Google Scholar] [CrossRef]
  50. Barbin, D.F.; ElMasry, G.; Sun, D.-W.; Allen, P.; Morsy, N. Non-destructive assessment of microbial contamination in porcine meat using NIR hyperspectral imaging. Innov. Food Sci. Emerg. Technol. 2013, 17, 180–191. [Google Scholar] [CrossRef]
  51. Sun, Y.; Wang, Y.; Xiao, H.; Gu, X.; Pan, L.; Tu, K. Hyperspectral imaging detection of decayed honey peaches based on their chlorophyll content. Food Chem. 2017, 235, 194–202. [Google Scholar] [CrossRef]
  52. ElMasry, G.; Wang, N.; El-Sayed, A.; Ngadi, M. Hyperspectral imaging for nondestructive determination of some quality attributes for strawberry. J. Food Eng. 2007, 81, 98–107. [Google Scholar] [CrossRef]
  53. Alhamdan, A.M.; Atia, A. Non-destructive method to predict Barhi dates quality at different stages of maturity utilising near-infrared (NIR) spectroscopy. Int. J. Food Prop. 2017, 20, S2950–S2959. [Google Scholar] [CrossRef]
  54. Masithoh, R.E.; Pahlawan, M.F.R.; Wati, R.K. Non-destructive determination of SSC and pH of banana using a modular Vis/NIR spectroscopy: Comparison of Partial Least Square (PLS) and Principle Component Regression (PCR). IOP Conf. Ser. Earth Environ. Sci. 2021, 752, 012047. [Google Scholar] [CrossRef]
  55. Adebayo, S.E.; Hashim, N.; Abdan, K.; Hanafi, M.; Mollazade, K. Prediction of quality attributes and ripeness classification of bananas using optical properties. Sci. Hortic. 2016, 212, 171–182. [Google Scholar] [CrossRef]
  56. Kovalenko, I.V.; Rippke, G.R.; Hurburgh, C.R. Measurement of soybean fatty acids by near-infrared spectroscopy: Linear and nonlinear calibration methods. J. Am. Oil Chem. Soc. 2006, 83, 421–427. [Google Scholar] [CrossRef]
  57. Magwaza, L.S.; Opara, U.L.; Nieuwoudt, H.; Cronje, P.J.R.; Saeys, W.; Nicolaï, B. NIR spectroscopy applications for internal and external quality analysis of citrus fruit—A review. Food Bioprocess Technol. 2012, 5, 425–444. [Google Scholar] [CrossRef]
Figure 1. Pseudo-color image of banana fingers in the six maturity levels.
Agriculture 12 00530 g001
Figure 2. Means with standard deviation of (a) SSC; (b) TA; (c) chlorophyll; (d) diameter; and (e) total chromatism in banana. Different lowercase letters (a–e) marked on the bars indicate significant differences between different maturity levels at a 0.05 level.
Agriculture 12 00530 g002
Figure 3. An illustration of spectra extraction from banana samples.
Agriculture 12 00530 g003
Figure 4. The average spectra of (a) pedicel zone; (b) middle zone and (c) apex zone in the six maturity levels.
Agriculture 12 00530 g004
Figure 5. Performance of the interval PLSDA model represented by (a) confusion matrix; and (b) ROC curves.
Agriculture 12 00530 g005
Figure 6. Selection of the optimal intervals for: (a) SSC; (b) TA; (c) chlorophyll and (d) ΔE*.
Agriculture 12 00530 g006
Figure 7. Scatter plots of the actual and predicted values for (a) SSC; (b) TA; (c) chlorophyll and (d) ΔE*. The triangular data points and solid regression lines were measured for calibration sets; the triangular data points and long dashed regression lines were measured for validation sets.
Agriculture 12 00530 g007
Figure 8. Distribution maps visualizing different quality parameters: (a) SSC; (b) TA; (c) chlorophyll and (d) ΔE*. The number on the color bar represents the concentration values of SSC, TA, *E* and chlorophyll. The color from blue or cyan to red indicates an increase of value/content.
Agriculture 12 00530 g008
Table 1. Descriptive statistics of some quality parameters.
Quality
Parameter
Observation CountMaximumMinimumMeanStandard DeviationCorrelation Coefficient with Maturity Level
Diameter (mm)17754.0022.0040.807.500.97 ***
TA (%)17768.5928.2128.2116.140.90 ***
SSC (%)17715.870.435.454.020.87 ***
Chlorophyll (mg/g)17714.301.206.782.84−0.64 ***
ΔE*17781.4751.9767.295.740.61 ***
*** indicates significant relation at 0.01 level.
Table 2. Classification results of PLSDA models built with raw and pretreated spectra.
ROI PositionPre-Treatment MethodLVsClassification Accuracy (%)
Calibration SetCross-Validation SetValidation Set
Pedicel zoneNon1594.9292.3791.53
Baseline offset1696.6193.2289.83
Normalize1796.6190.6889.83
SNV1898.3191.5388.14
SNV+DET1594.9291.5388.14
1st derivative1695.7692.3786.44
SNV+1st derivative1496.6191.5386.44
Middle zoneNon1699.1594.9293.22
Baseline offset1597.4694.0793.22
Normalize1697.4694.9293.22
SNV1497.4693.2291.53
SNV+DET1698.3195.7693.22
1st derivative1799.1593.2291.53
SNV+1st derivative1799.1594.9293.22
Apex zoneNon1599.1598.3196.61
Baseline offset1799.1593.2294.92
Normalize1710098.3198.31
SNV1598.3195.7694.92
SNV+DET1799.1597.4696.61
1st derivative1697.4694.0793.22
SNV+1st derivative1698.3195.7691.53
Table 3. Results of PLSDA model based on each interval.
Interval NumberWavelength Range (nm)LVsClassification Accuracy (%)
Calibration SetCross-Validation SetValidation Set
[1]490.5–580.51387.0183.6281.36
[2]582.9–717.41588.7085.5985.31
[3]719.9–856.71684.4677.4076.27
[4]859.2–1000.71690.1183.6283.05
Table 4. Predictive results of the quality parameters.
Quality ParameterPre-Treatment MethodNumber of LVsCalibration SetCross-Validation SetValidation Set
R2cRMSECR2cvRMSECVR2vRMSEV
SSCNon190.851.60 (%)0.811.85 (%)0.741.98 (%)
Baseline offset190.841.63 (%)0.771.91 (%)0.771.94 (%)
Normalize190.861.51 (%)0.811.76 (%)0.801.79 (%)
SNV190.871.52 (%)0.811.80 (%)0.791.82 (%)
SNV+DET190.791.81 (%)0.811.79 (%)0.791.82 (%)
1st dervative180.791.87 (%)0.732.13 (%)0.722.10 (%)
SNV+1st dervative190.811.75 (%)0.771.94 (%)0.771.92 (%)
TANon180.817.02 (%)0.768.09 (%)0.688.59 (%)
Baseline offset180.807.38 (%)0.728.71 (%)0.718.60 (%)
Normalize170.816.92 (%)0.758.00 (%)0.748.37 (%)
SNV180.817.02 (%)0.768.14 (%)0.757.36 (%)
SNV+DET170.816.82 (%)0.768.03 (%)0.748.12 (%)
1st dervative190.797.46 (%)0.738.60 (%)0.689.17 (%)
SNV+1st dervative180.787.57 (%)0.728.60 (%)0.708.74 (%)
ChlorophyllNon180.561.88 (mg/g)0.442.15 (mg/g)0.422.20 (mg/g)
Baseline offset190.581.85 (mg/g)0.422.19 (mg/g)0.412.23 (mg/g)
Normalize180.581.94 (mg/g)0.442.25 (mg/g)0.422.00 (mg/g)
SNV180.571.80 (mg/g)0.432.11 (mg/g)0.372.39 (mg/g)
SNV+DET180.581.77 (mg/g)0.392.20 (mg/g)0.362.42 (mg/g)
1st dervative170.492.04 (mg/g)0.402.22 (mg/g)0.382.21 (mg/g)
SNV+1st dervative140.472.09 (mg/g)0.332.35 (mg/g)0.292.38 (mg/g)
ΔE*Non190.593.720.454.340.444.28
Baseline offset180.563.750.414.410.404.54
Normalize180.593.740.494.210.404.28
SNV180.593.680.464.250.464.22
SNV+DET180.593.570.464.120.424.58
1st dervative180.494.140.384.610.374.49
SNV+1st dervative100.444.280.334.680.294.96
Table 5. Results of the models with the optimal intervals for different quality parameters.
Quality
Parameter
Selected IntervalLVsCalibration SetCross-Validation SetValidation Set
R2cRMSECR2cvRMSECVR2vRMSEV
SSC[2]160.748.26 (%)0.728.46 (%)0.649.62 (%)
TA[2]180.742.15 (%)0.672.39 (%)0.592.44 (%)
Chlorophyll[4]110.492.03 (mg/g)0.372.260.342.38
ΔE*[4]100.484.160.364.580.34.81
Publisher’s Note: MDPI stays neutral with regard to jurisdictional claims in published maps and institutional affiliations.

