Article

Evaluating the Waterlogging Tolerance of Wheat Cultivars during the Early Growth Stage Using the Comprehensive Evaluation Value and Digital Image Analysis

1
Jiangsu Key Laboratory of Crop Genetics and Physiology, Jiangsu Key Laboratory of Crop Cultivation and Physiology, Agricultural College of Yangzhou University, Yangzhou 225009, China
2
Co-Innovation Center for Modern Production Technology of Grain Crops, Yangzhou University, Yangzhou 225009, China
3
Planting Technology Extension Center of Jintan District, Changzhou 213200, China
*
Author to whom correspondence should be addressed.
Agriculture 2022, 12(3), 384; https://doi.org/10.3390/agriculture12030384
Submission received: 15 January 2022 / Revised: 26 February 2022 / Accepted: 4 March 2022 / Published: 9 March 2022
(This article belongs to the Special Issue Sensors Applied to Agricultural Products)

Abstract

:
The accurate and efficient screening of waterlogging-tolerant cultivars is an effective way to mitigate waterlogging damages. An experiment was conducted to evaluate the performance of 28 wheat varieties mainly planted in the middle and lower reaches of the Yangtze River, China, under control and waterlogging conditions. When the 15-day waterlogging that was initiated at the third-leaf stage was completed, the aboveground dry weight, plant height, leaf number on main stem, culm number, leaf area, and SPAD readings of wheat seedlings were significantly decreased by 14%, 11%, 6%, 13%, 14%, and 15% compared with the control treatment (maintaining approximately 80% of field capacity), respectively. The results showed that the percentage reductions in the dry weight and leaf area under stress accurately represented the influence of the majority of the measured agronomic traits and were significantly negatively correlated with the respective dry weight and leaf area of different cultivars under waterlogging. This suggests that dry weight and leaf area can be used as agronomic traits for screening waterlogging-tolerant cultivars. The comprehensive evaluation value of waterlogging tolerance (CEVW) was closely related to the percentage reduction in dry weight, plant height, culm number, leaf area, and SPAD reading. The range of CEVW was 0.187–0.819, indicating a wide variation in the waterlogging tolerance of the wheat cultivars. Comparing the top-view images, the phenotypic texture parameters (dissimilarity, homogeneity, and angular second moment (ASM)) extracted from the side-view images better reflected the dry weight, plant height, and leaf area under different water treatments. The percentage reduction in ASM had the strongest correlation with CEVW (root mean square error = 0.109); thus, the ASM is recommended as a suitable phenotypic parameter to evaluate waterlogging tolerance. The present results provide references for the rapid and intelligent screening of waterlogging-tolerant wheat cultivars, but future studies need to consider the stress evaluation of the adult plants.

1. Introduction

Soil waterlogging, an abiotic stress, has been the critical constraint to crop production world-wide, especially in the high rainfall zones, which affected 16% of the soils in United States, 10% of the agricultural lands of Russia, and irrigated crop production areas of India, Pakistan, Bangladesh, and China [1,2,3]. Globally, waterlogging affects 10–15 million hectares of wheat annually, causing 20–50% yield losses [4]. With an increase in extreme weather patterns brought about by climate change, waterlogging events have become more frequent, severe, and unpredictable [5]. In the middle and lower reaches of the Yangtze River, China, an irregular spatial and temporal distribution of precipitation occurs, which frequently results in high soil moisture, causing a waterlogging threat at various growth stages of wheat [2].
Waterlogging negatively affects the growth and development of wheat seedlings by inhibiting root length, decreasing leaf nitrogen concentrations, and reducing tiller number, causing spike number and yield losses [6,7,8,9]. This water stress also inhibits photosynthesis and respiration of leaves, inducing crop senescence and decreasing photosynthetic matter accumulation, especially when implemented during the medium and late growth phase [4,10,11,12,13]. Previous studies have reported that waterlogging during the period of stem elongation and post-anthesis reduces the number of kernels per spike and the kernel weight to different degrees, leading to decreased spike weight [7,11,14,15,16]. To mitigate waterlogging damage caused to crops, engineering measures controlling soil water and crop management practices have been adopted [4,17], and the breeding and release of waterlogging-tolerant cultivars are considered the most common and effective approaches [18,19].
The characteristics of waterlogging-tolerant wheat cultivars have been largely explored, including abundant aerenchyma in secondary roots, low reductions in leaf weight and the photosynthetic rate, high content of soluble sugar, strong antioxidant capacity, and small spike yield losses [16,20]. However, the yield composition characteristics of waterlogging-tolerant varieties vary among different regions [21,22], and the critical traits associated with the alleviation of stress damage were not the same at various growth stages [2]. Therefore, evaluation of the waterlogging tolerance of local cultivars in different ecological areas and the stages that are most susceptible to waterlogging appears necessary. Arguello et al. [16] evaluated the waterlogging tolerance of 28 soft red wheat varieties grown in the southern USA by using agronomic parameters related to grain yield when the stress was implemented at the tillering stage. Singh et al. [23] planted 149 elite Indian and Australian germplasm lines and estimated their waterlogging tolerance during four critical growth periods using agronomic traits. However, the responses of various agronomic traits to stress were not the same, leading to the limited use of a single evaluation trait. In the reports of Arguello et al. [16] and Singh et al. [23], comprehensive indexes, including the normalized difference vegetative index and multivariate parameters, were adopted to estimate performance under waterlogging. The waterlogging tolerance of the cultivars widely grown by farmers in the middle and lower reaches of the Yangtze River, China, is not defined and evaluated.
Digital image analysis based on machine vision technology has rapidly developed, with non-destructive, cheap, and convenient monitoring, as well as the robustness of the application results [24,25]. Image analysis has been widely used to identify and evaluate the crop growth status in modern agriculture. Ma et al. [26] obtained digital images of the wheat canopy under different planting densities and constructed an aboveground biomass model using image parameters. Tavakoli et al. [27] extracted color parameters from integrated digital and hyperspectral images to establish linear models that could evaluate the nitrogen concentration and water content of wheat plants under different nitrogen and water treatments. Liu et al. [28] proposed an estimation method for the density of wheat seedlings in the field by separating the overlapping leaves using digital images. The application of image analysis to waterlogging tolerance of wheat needs to be studied.
The previous studies screened the waterlogging-tolerant cultivars mostly by evaluating the performances of agronomic traits. However, this method requires destructive sampling and has high costs of working time and labor. Therefore, we hypothesized that image analysis, as a rapid and low-cost evaluation method, could be used to identify waterlogging-tolerant wheat cultivars. In the present study, 28 wheat varieties planted in the middle and lower reaches of the Yangtze River were waterlogged for 15 days beginning at the three-leaf stage (Zadoks growth stage, GS13) to (1) quantify the stress damage caused to the seedlings, (2) propose critical agronomic traits to identify stress tolerance, (3) establish a comprehensive evaluation value of stress tolerance, and (4) construct a non-destructive evaluation method by analyzing the phenotypic features extracted from the digital images. The expected results can provide references for rapid and intelligent screening of waterlogging-tolerant wheat cultivars.

2. Materials and Methods

2.1. Growth Conditions

The experiment was conducted in 2018 at the Agricultural Experiment Station located at the Agricultural College of Yangzhou University, China. All the tests used a PVC pot with a top diameter of 16 cm, a bottom diameter of 12.8 cm, and a depth of 17.5 cm. There were six drainage holes at the base. The upper 0–20 cm of topsoil was excavated from a local field, dried naturally, and sieved through a 5 mm mesh. The sieved soil was weighed to 2.7 kg and mixed with 2.46 g of a pre-prepared compound fertilizer (containing 15% N, 15% P2O5, and 15% K2O). The pots were filled with the soil mixture, watered with 2 L of water, and left for 2–3 days for the soil to settle and water to drain. On November 5, 2018, eight seeds were uniformly sown at a soil depth of 2 cm. Five seedlings with similar sizes were retained at the two-leaf stage (GS12). Except for the basal fertilizers, no topdressing was applied. Pests and diseases were not found, and weeds were removed by hand to prevent biotic stress. The soil was a loamy clay and contained 8.78 g kg−1 organic C, 75.05 mg kg−1 available N, 35.02 mg kg−1 available P, and 90.52 mg kg−1 available K.

2.2. Experimental Design

This experiment used a split-plot design with the soil water treatments as the main plot and winter wheat cultivars (Triticum aestivum L.) as the subplot. There were four pots (replicates) per treatment combination. In total, 28 wheat cultivars, which are mainly planted in the middle and lower reaches of the Yangtze River, were tested. Soil water treatments included the water drainage condition maintaining 15–20% volumetric soil moisture (approximately 80% of field capacity) as the control treatment, and waterlogging was conducted for 15 days beginning at the three-leaf stage (GS13).
All of the pots were placed inside a rainproof greenhouse. Tanks (61 cm × 42 cm × 20 cm) were used for the waterlogging. Once the pots used for the waterlogging treatment were moved into the tanks, a 0.1–0.5 cm layer of water was maintained above the soil surface for the entirety of the waterlogging phase. Pots in the water drainage scenario (from sowing to harvest) and the waterlogged pots (before and after the treatments) were irrigated as necessary to maintain 15–20% volumetric soil moisture (approximately 80% of field capacity). The volumetric soil moisture was measured using a moisture meter (TZS-1, TOP, Hangzhou, China).

2.3. Measurements of Agronomic Traits

On the second day after the waterlogging treatment was terminated, the 20 seedlings in four pots of each treatment were harvested and cleaned. The height of the seedlings was measured from the tiller node to the tip of the extended leaf by a measuring scale. The number of complete leaves on the main stem and the proportion of the length of the upper incomplete leaf to the upper complete leaf was determined, and their sum was the leaf number on main stem. The leaf number on main stem can reflect the difference in the development process. The number of culms, including main stem and tillers, was counted for each plant. A tiller with a first leaf length >2 cm was counted as one tiller. The leaf area was measured using a portable area meter (LI-3000C, LI-COR Inc., Lincoln, NE, USA). The chlorophyll content (SPAD readings) of the leaves was rapidly measured using a chlorophyll meter (SPAD-502Plus, KONICA MINOLTA, Osaka, Japan). The plant samples were dried at 70 °C to a constant weight, and then the dry weight was measured.

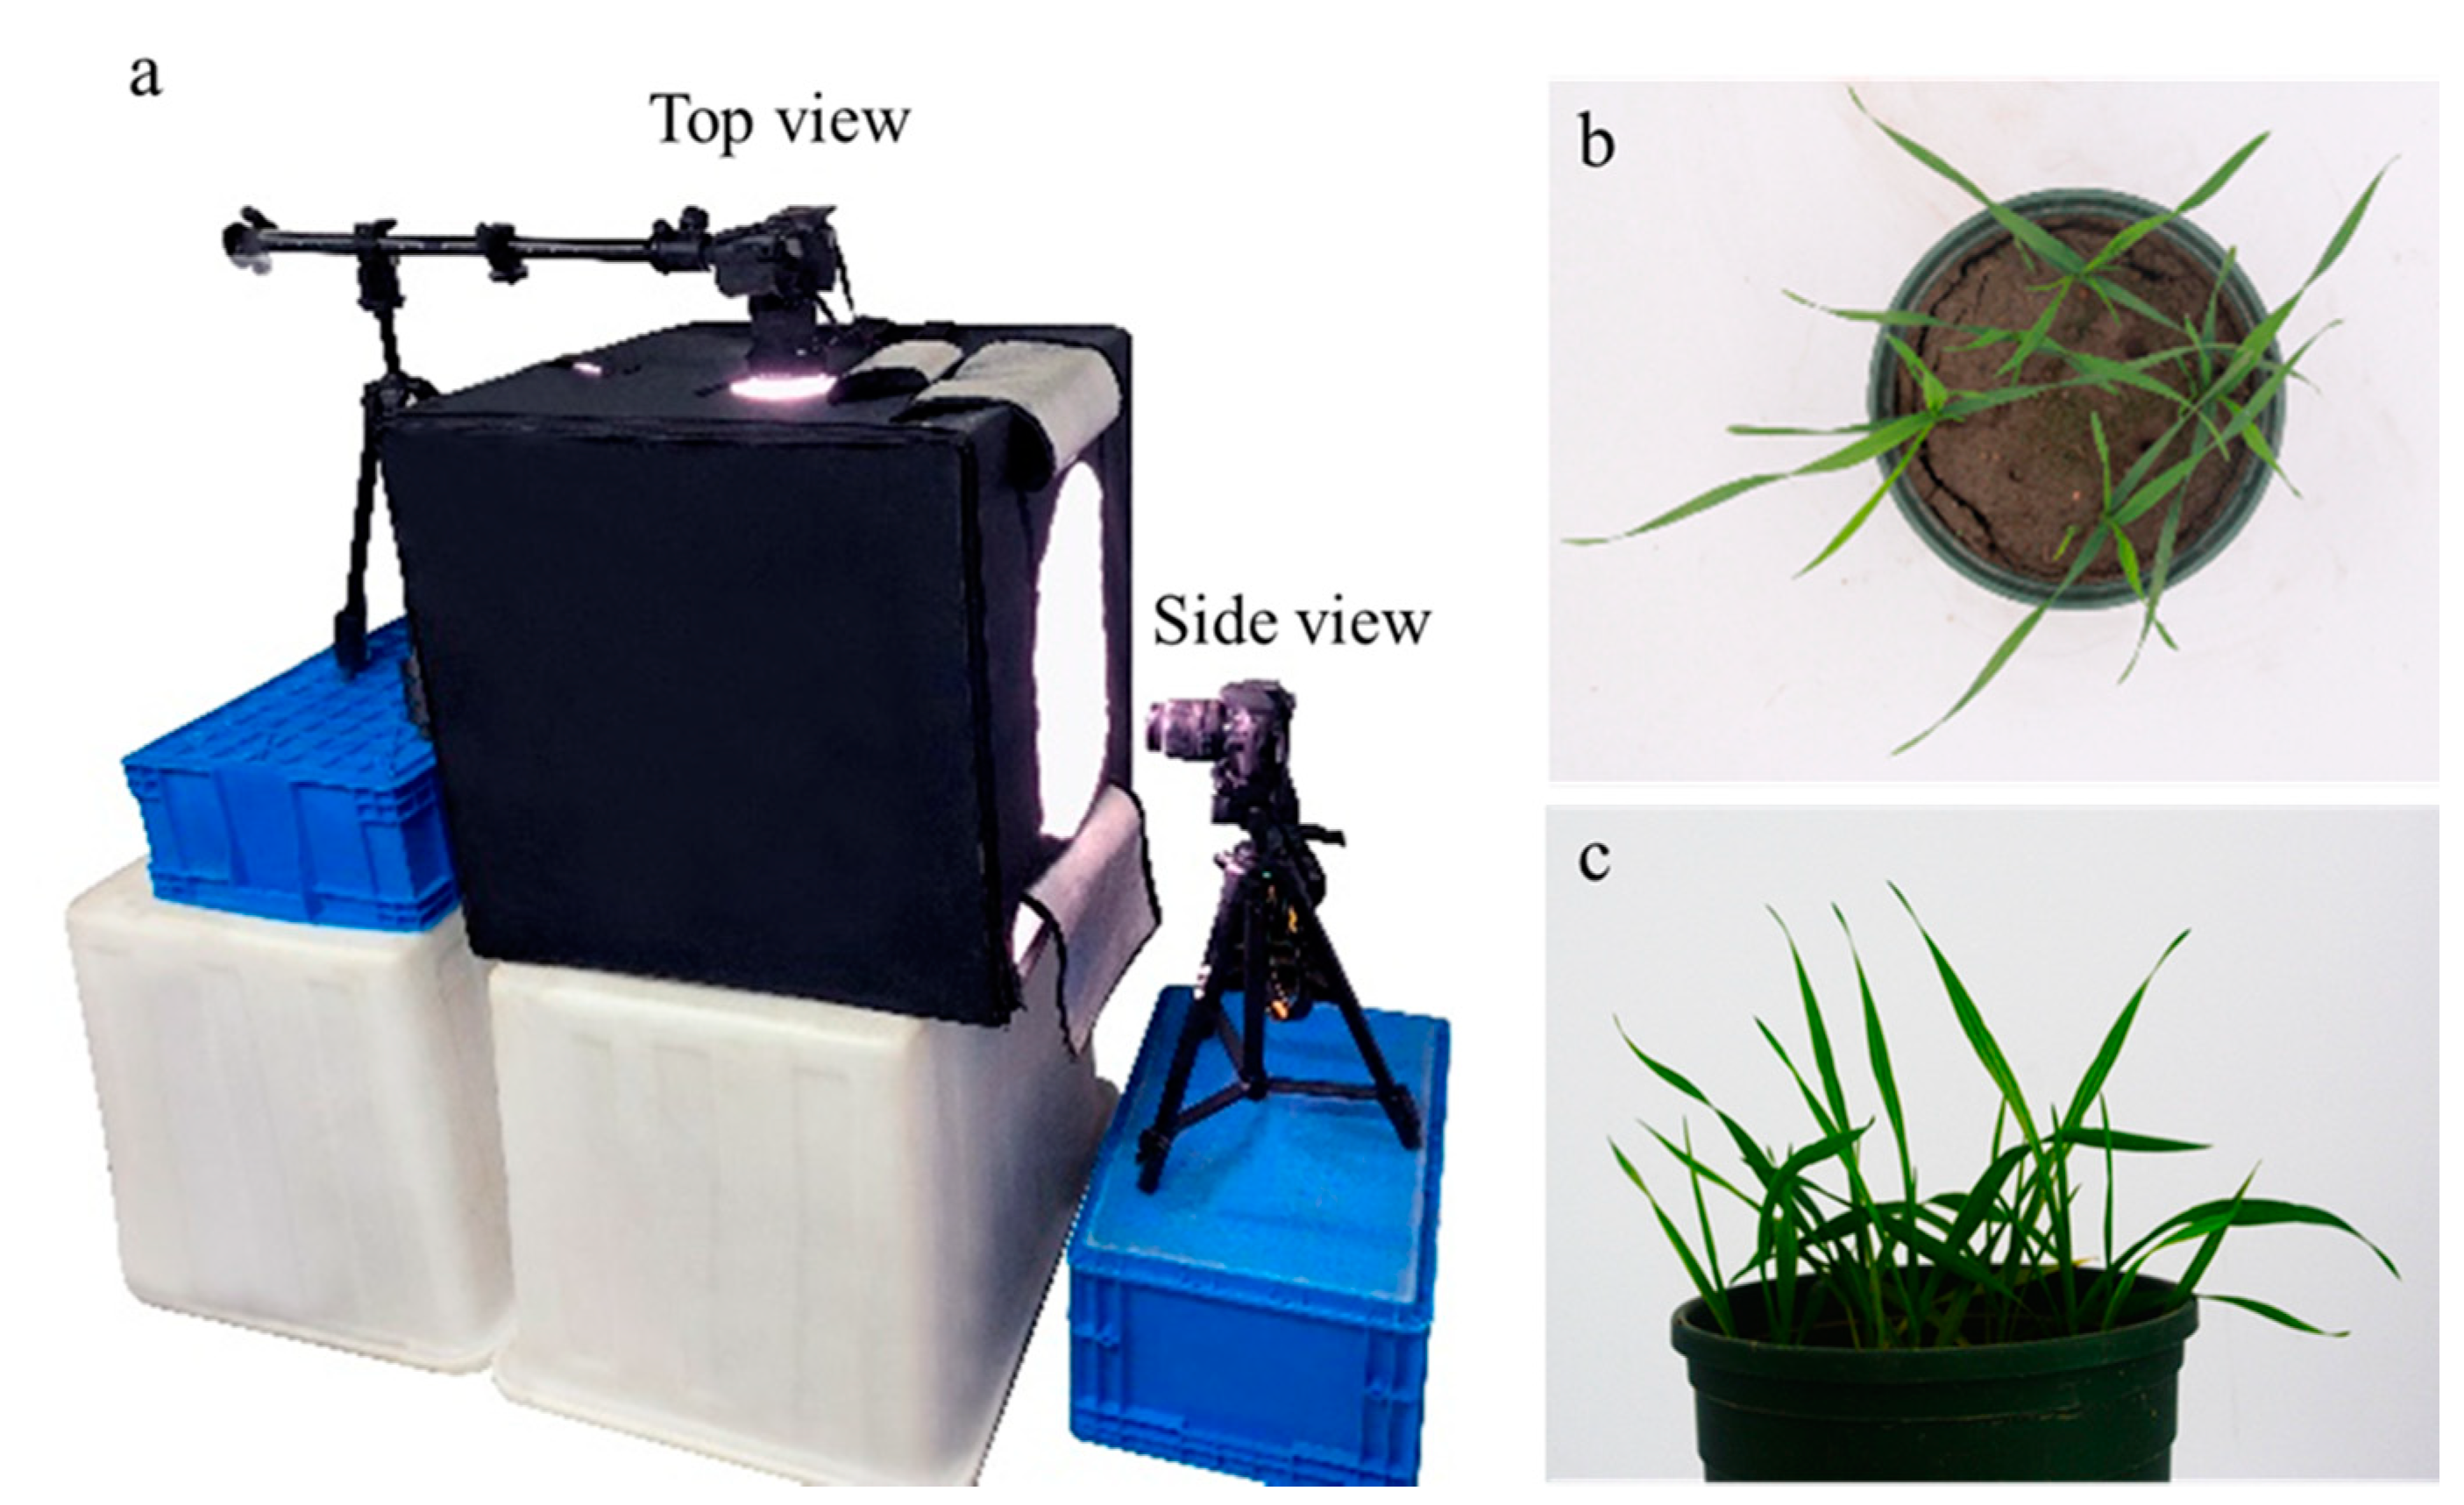
2.4. Image Acquisition and Analysis

Before the measurement of the agronomic traits, images of each pot with plants were obtained using a self-made photography device (Figure 1a). This device consisted of a photo studio with an adjustable light source mounted on top of the box and two cameras (EOS 600, Canon, Tokyo, Japan) placed on the upward side and lateral side. The illumination of the light source was controlled at 5000 lux. The two cameras obtained the digital images of the top view and side view of the plants (Figure 1b,c). The aperture and exposure time of the camera were set to F9 and 0.03 s, respectively, throughout the experiment. The size of the images was 6000 × 4000 pixels, and the images were stored in an uncompressed PNG format to avoid color artifacts due to compression algorithms. The pots were placed in a fixed position in the photo studio for each photographing event, and after the images were obtained, the pots were rotated 90°, and images were captured again. The eight images per pot were used for phenotypic analysis.
The images analysis referred to the method of Xiong et al. [29] and was conducted by the same company as that used in Xiong et al.’s study, Nanjing AgriBrain Big Data Technology Co., Ltd. (Nanjing, China). The image processing and phenotypic feature extraction are documented in detail in the report by Xiong et al. [29]. The extraction of the color features involved the transformation of RGB (red, green, blue), LAB (L is luminosity, A is the range from magenta to green, and B is the range from yellow to blue), and HSV (hue, saturation, value) color spaces. The texture attributes were extracted based on the grey co-occurrence matrix algorithm. The equations used were described in detail in the studies by Hendrawan et al. [30] and Xiong et al. [29]. Although 29 phenotypic features were extracted from the images, including color, texture, and geometry, only six phenotypic features strongly related to agronomic traits were selected for further analysis. Table 1 shows the category, name, and description of the six phenotypic features.

2.5. Calculation of the Comprehensive Evaluation Value of Waterlogging Tolerance (CEVW)

The percent reduction in agronomic traits and phenotypic features (%R) was calculated as
% R ij = P ijC P ijw P ijC × 100
where %Rij is the percentage reduction in the trait (j) for the cultivar (i); PijC and Pijw are the value of the trait (j) for the cultivar (i) measured under control and waterlogging conditions, respectively.
According to the method of Liu et al. [31] and Duan et al. [32], the percent reduction involving multiple traits was evaluated by the comprehensive evaluation value of waterlogging tolerance (CEVW). This methodology allows a comprehensive assessment by using the membership functions based on the theory of fuzzy mathematics [33].
The membership function value (MFVD) was calculated using the following the equation:
u ( X ik ) = X ik X min X max X min
where u(Xik) is the MFVD of the comprehensive parameter (k) for the cultivar (i) for percentage reduction; and Xmax and Xmin are the respective maximum value and minimum value of the percentage reduction for the comprehensive parameter (k) of all cultivars.
The weight of each comprehensive index was calculated as
w k = p k k = 1 n p k
where wk is the weight of the comprehensive index (k); pk is the contribution rate of the comprehensive index (k).
The CEVW for the cultivar (i) was estimated:
C E V W i = k = 1 n [ u ( X ik ) × w k ]
Principal component analysis for percentage reduction in all of the agronomic traits of the different wheat cultivars was conducted to acquire the comprehensive parameters, i.e., components.

2.6. Statistical Analyses

All statistical analyses were conducted using the Data Processing System (v7.05) (DPS, Shanghai, China). Analysis of variance (ANOVA) based on a split-plot model was used to determine the significance of the main effects and the interactions of treatments on the agronomic traits. The degree of correlation between different variables was determined using linear regression models with the coefficient of correlation (r), coefficient of determination (R2), root mean square error (RMSE), and normalized root mean square error (NRMSE) as evaluation indices.
The anthesis and maturity dates of each cultivar were recorded. The anthesis date was the date on which 50% of wheat ears were flowering in a plot. The maturity date was the date on which grain could not be dented by thumbnail.

3. Results

3.1. Effects of Waterlogging on Agronomic Traits

A 15-day waterlogging treatment that began at the third-leaf stage significantly decreased the aboveground dry weight, plant height, leaf number on main stem, culm number, leaf area, and SPAD reading (Table 2 and Table 3). These agronomic traits showed great differences among cultivars. Except for the culm number, the other agronomic traits showed obvious inconsistency under different water treatments. These results indicated great differences in seedling growth among the selected cultivars.

3.2. Relationships among Agronomic Traits

As shown in Figure 2, the dry weight, leaf number on main stem, culm number, and leaf area of different cultivars under waterlogging treatment were significantly negatively related to their percentage reduction caused by waterlogging. The SPAD reading was significantly positively related to its percentage reduction. The results suggested that some plant growth traits could reflect the waterlogging tolerance of cultivars. Further analyses showed that the percentage reduction in dry weight was significantly correlated only with the percentage reduction in plant height, culm number, leaf area, and SPAD reading (Table 4). There were significant correlations of the percentage reduction in leaf area with the percentage reductions in plant height and leaf number on main stem. A strong correlation was also found between the percentage reductions in the culm number and the SPAD reading. These results suggested overlapping information reflected by the percentage reductions in some agronomic traits, and some traits had information independence.

3.3. Identification of Waterlogging Tolerance among Cultivars Using CEVW

Principal component analysis (Table 5) was conducted on the percentage reduction in the agronomic traits of the different cultivars, and the results showed that the cumulative contribution rate of the first two principal components exceeded 73%. Component X1 reflected the changes in plant morphology caused by waterlogging, and X2 reflected the reduction in the culm number and SPAD reading.
According to the function model of CEVW, the CEVW values of different cultivars were calculated by assigning a component score and contribution rate of the components to calculate the subordinative function value of the comprehensive index and the weight of the components (Table 6). The range of CEVW was 0.187–0.819, indicating a wide variation in the waterlogging tolerance of the wheat cultivars. Among the selected cultivars, Huaimai 6 had the lowest CEVW, and Yangmai25 had the highest CEVW.

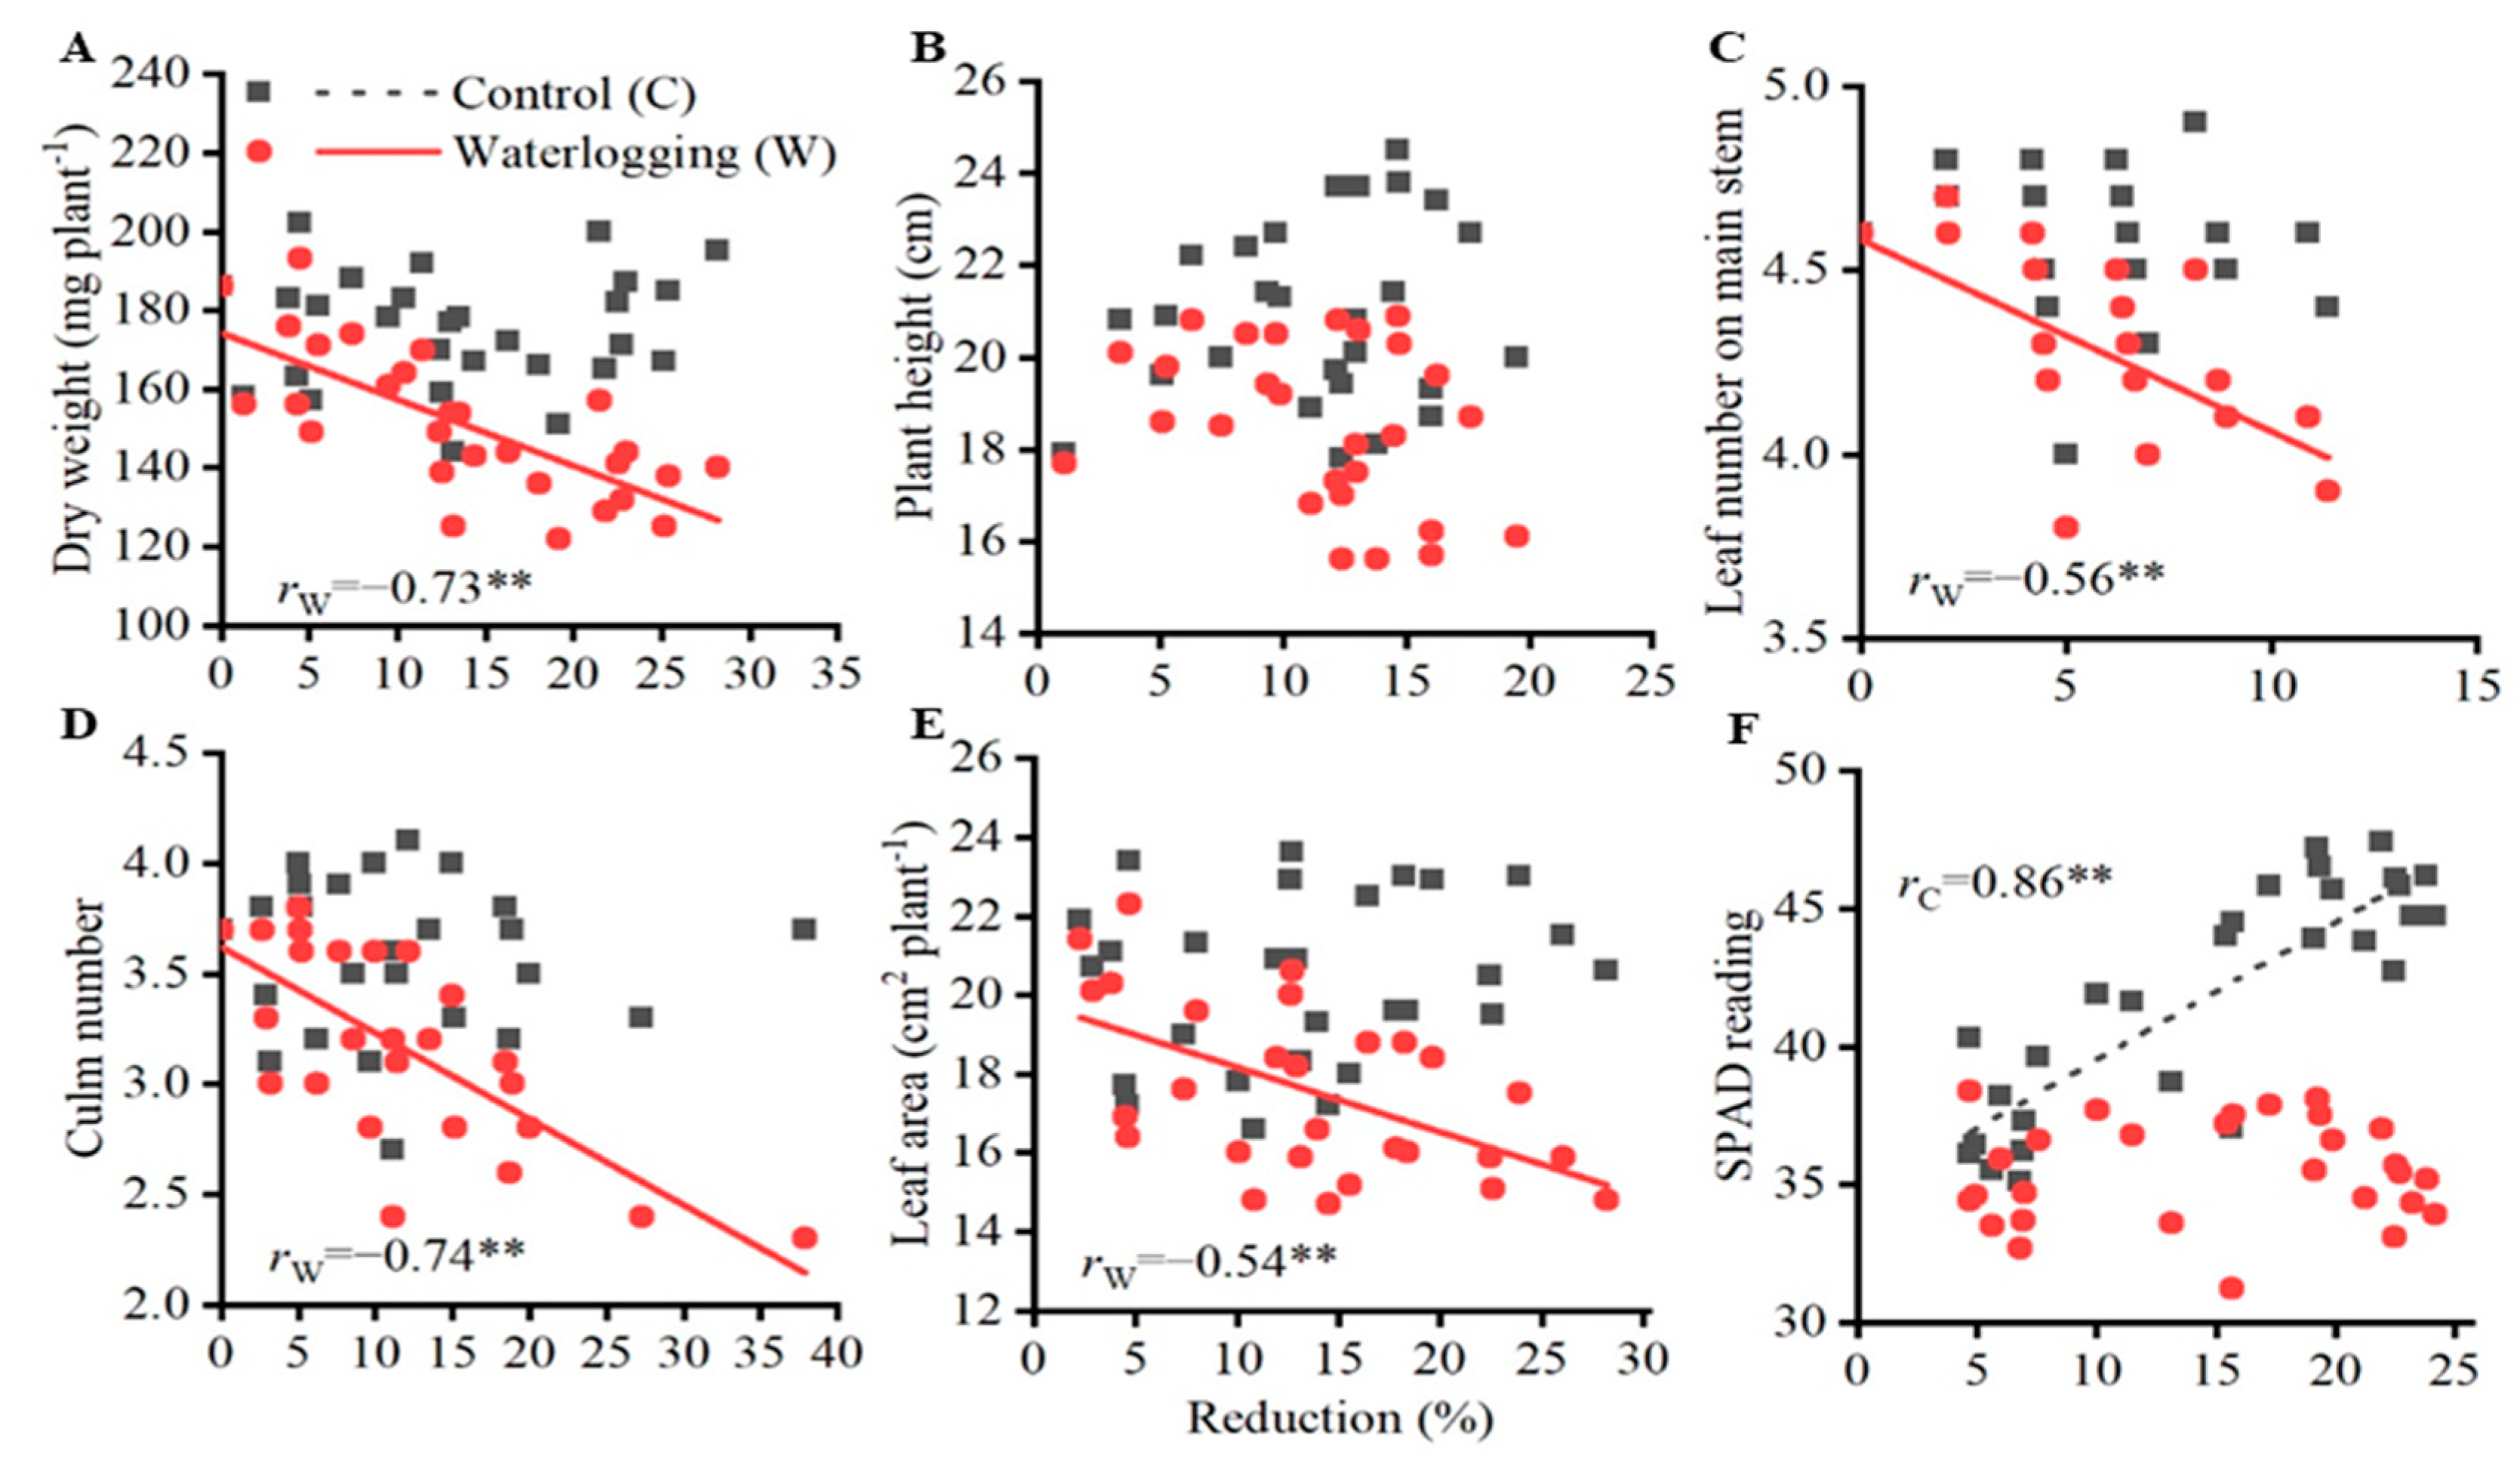
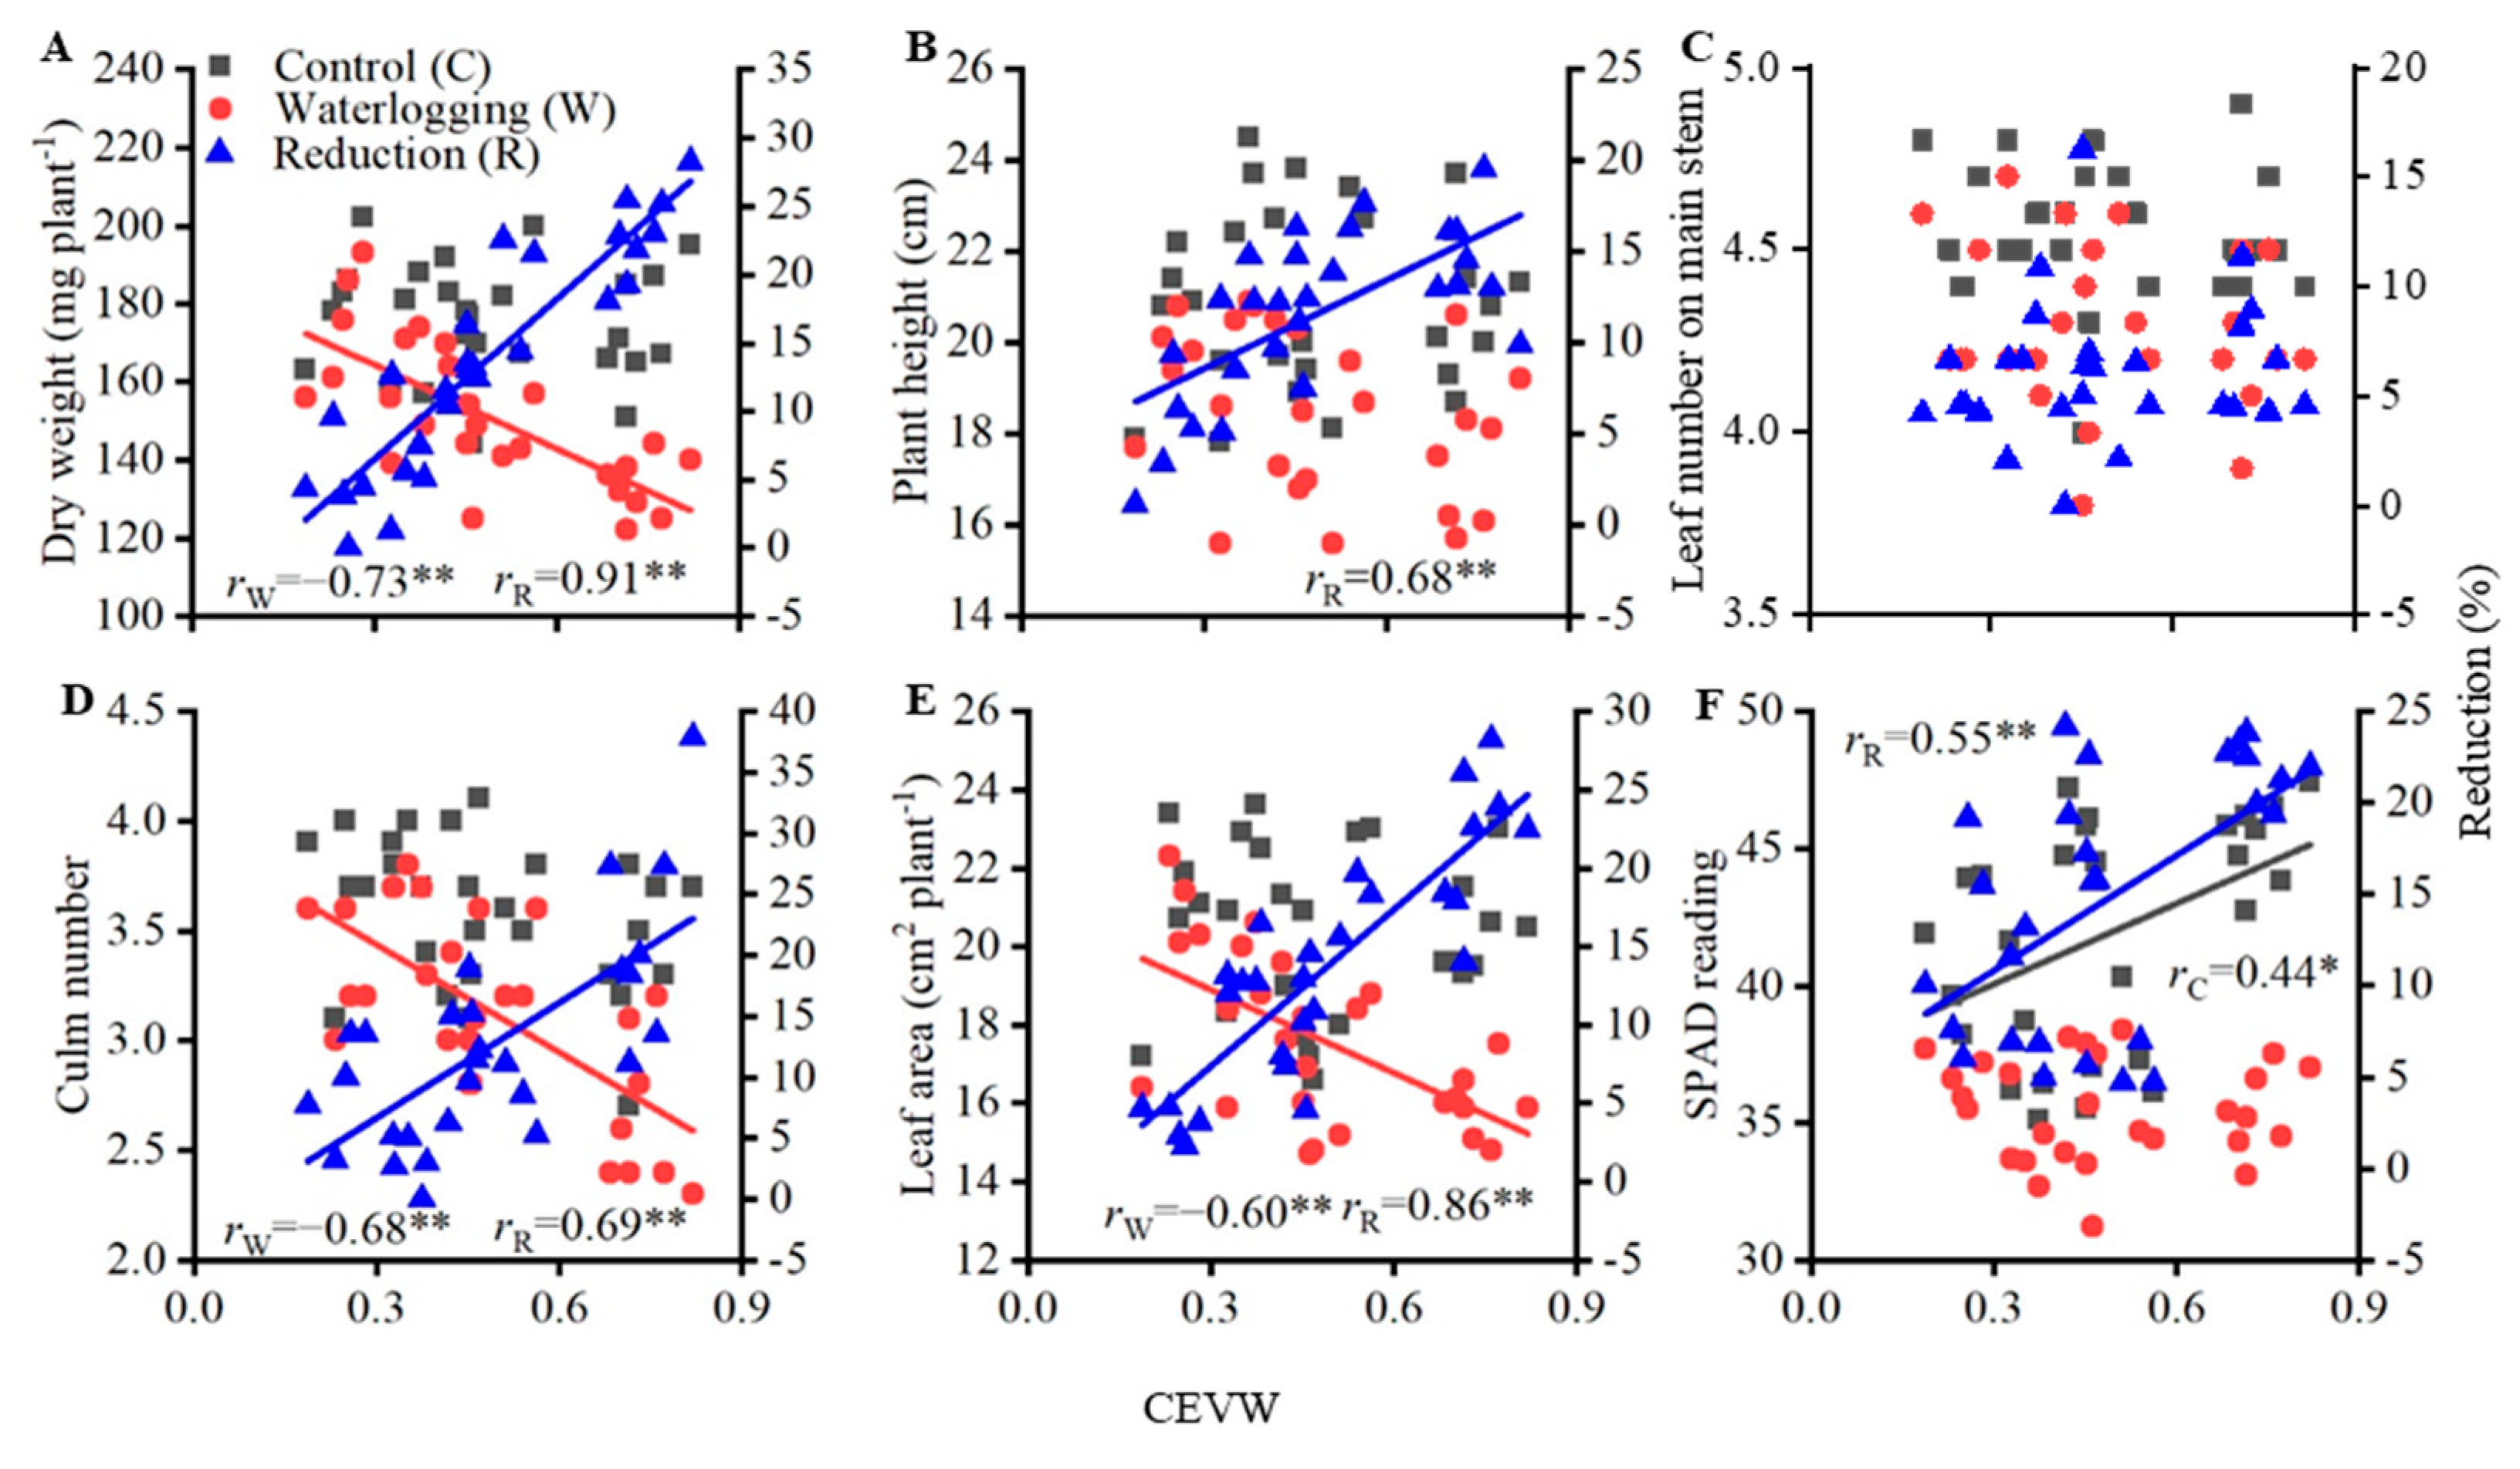
3.4. Relationships of Agronomic Traits and Their Reductions with CEVW

Except for the percentage reduction in the leaf number on main stem, the percentage reduction in the other agronomic traits, i.e., the dry weight, plant height, culm number, leaf area, and SPAD reading, was significantly positively related to the CEVW value (Figure 3). This indicated that the CEVW value could comprehensively reflect waterlogging tolerance with a high value, i.e., a low tolerance. The results also showed that the dry weight, culm number, and leaf area under waterlogging treatment were strongly negatively related to CEVW, implying the possibility of using the growth performance of a plant under waterlogging to reflect stress tolerance.

3.5. Correlations of Selected Phenotypic Features with Agronomic Traits

In order to detect the possibility using the phenotypic features to reflect the agronomic traits, the correlations of selected phenotypic features with agronomic traits were analyzed. The phenotypic features that were closely correlated with the agronomic traits included H, b, 2G-R-B, dissimilarity, homogeneity, and ASM. However, the degree of the correlations depended on the water treatment and the imaging angle. Under the control and waterlogging treatments, the H, b, and 2G-R-B extracted from the top-view images were significantly related to the SPAD reading, with a positive relationship only between H and the SPAD reading (Table 7). H was significantly negatively correlated with the plant weight and leaf area, and b and 2G-R-B were significantly negatively correlated with the leaf number on main stem. However, there were no close correlations between the agronomic traits and the H, b, and 2G-R-B extracted from the side-view images (Table 8). These results indicate that the phenotypic color parameters (H, b, and 2G-R-B) extracted from the top-view images reflected the chlorophyll content of the leaves well but were affected by the plant morphological characteristics.
The dissimilarity, homogeneity, and ASM extracted from the images of the top view were correlated with the dry weight, leaf number on main stem, and culm number under the waterlogging treatment, but the relationships were not strong under the control condition (Table 7). Under the control and waterlogging treatments, the dissimilarity, homogeneity, and ASM extracted from images of the side view were significantly correlated with the dry weight, plant height, and leaf area; however, there was an insignificant relationship between dissimilarity and leaf area in the control (Table 8). Under the waterlogging treatment, there were strong relationships between these phenotypic texture parameters and the culm number. These results suggest that the phenotypic texture parameters (dissimilarity, homogeneity, and ASM) can be used to reflect the morphological characteristics of wheat seedlings and to evaluate the waterlogging tolerance of cultivars; the results were better under the waterlogging condition compared with the control condition.

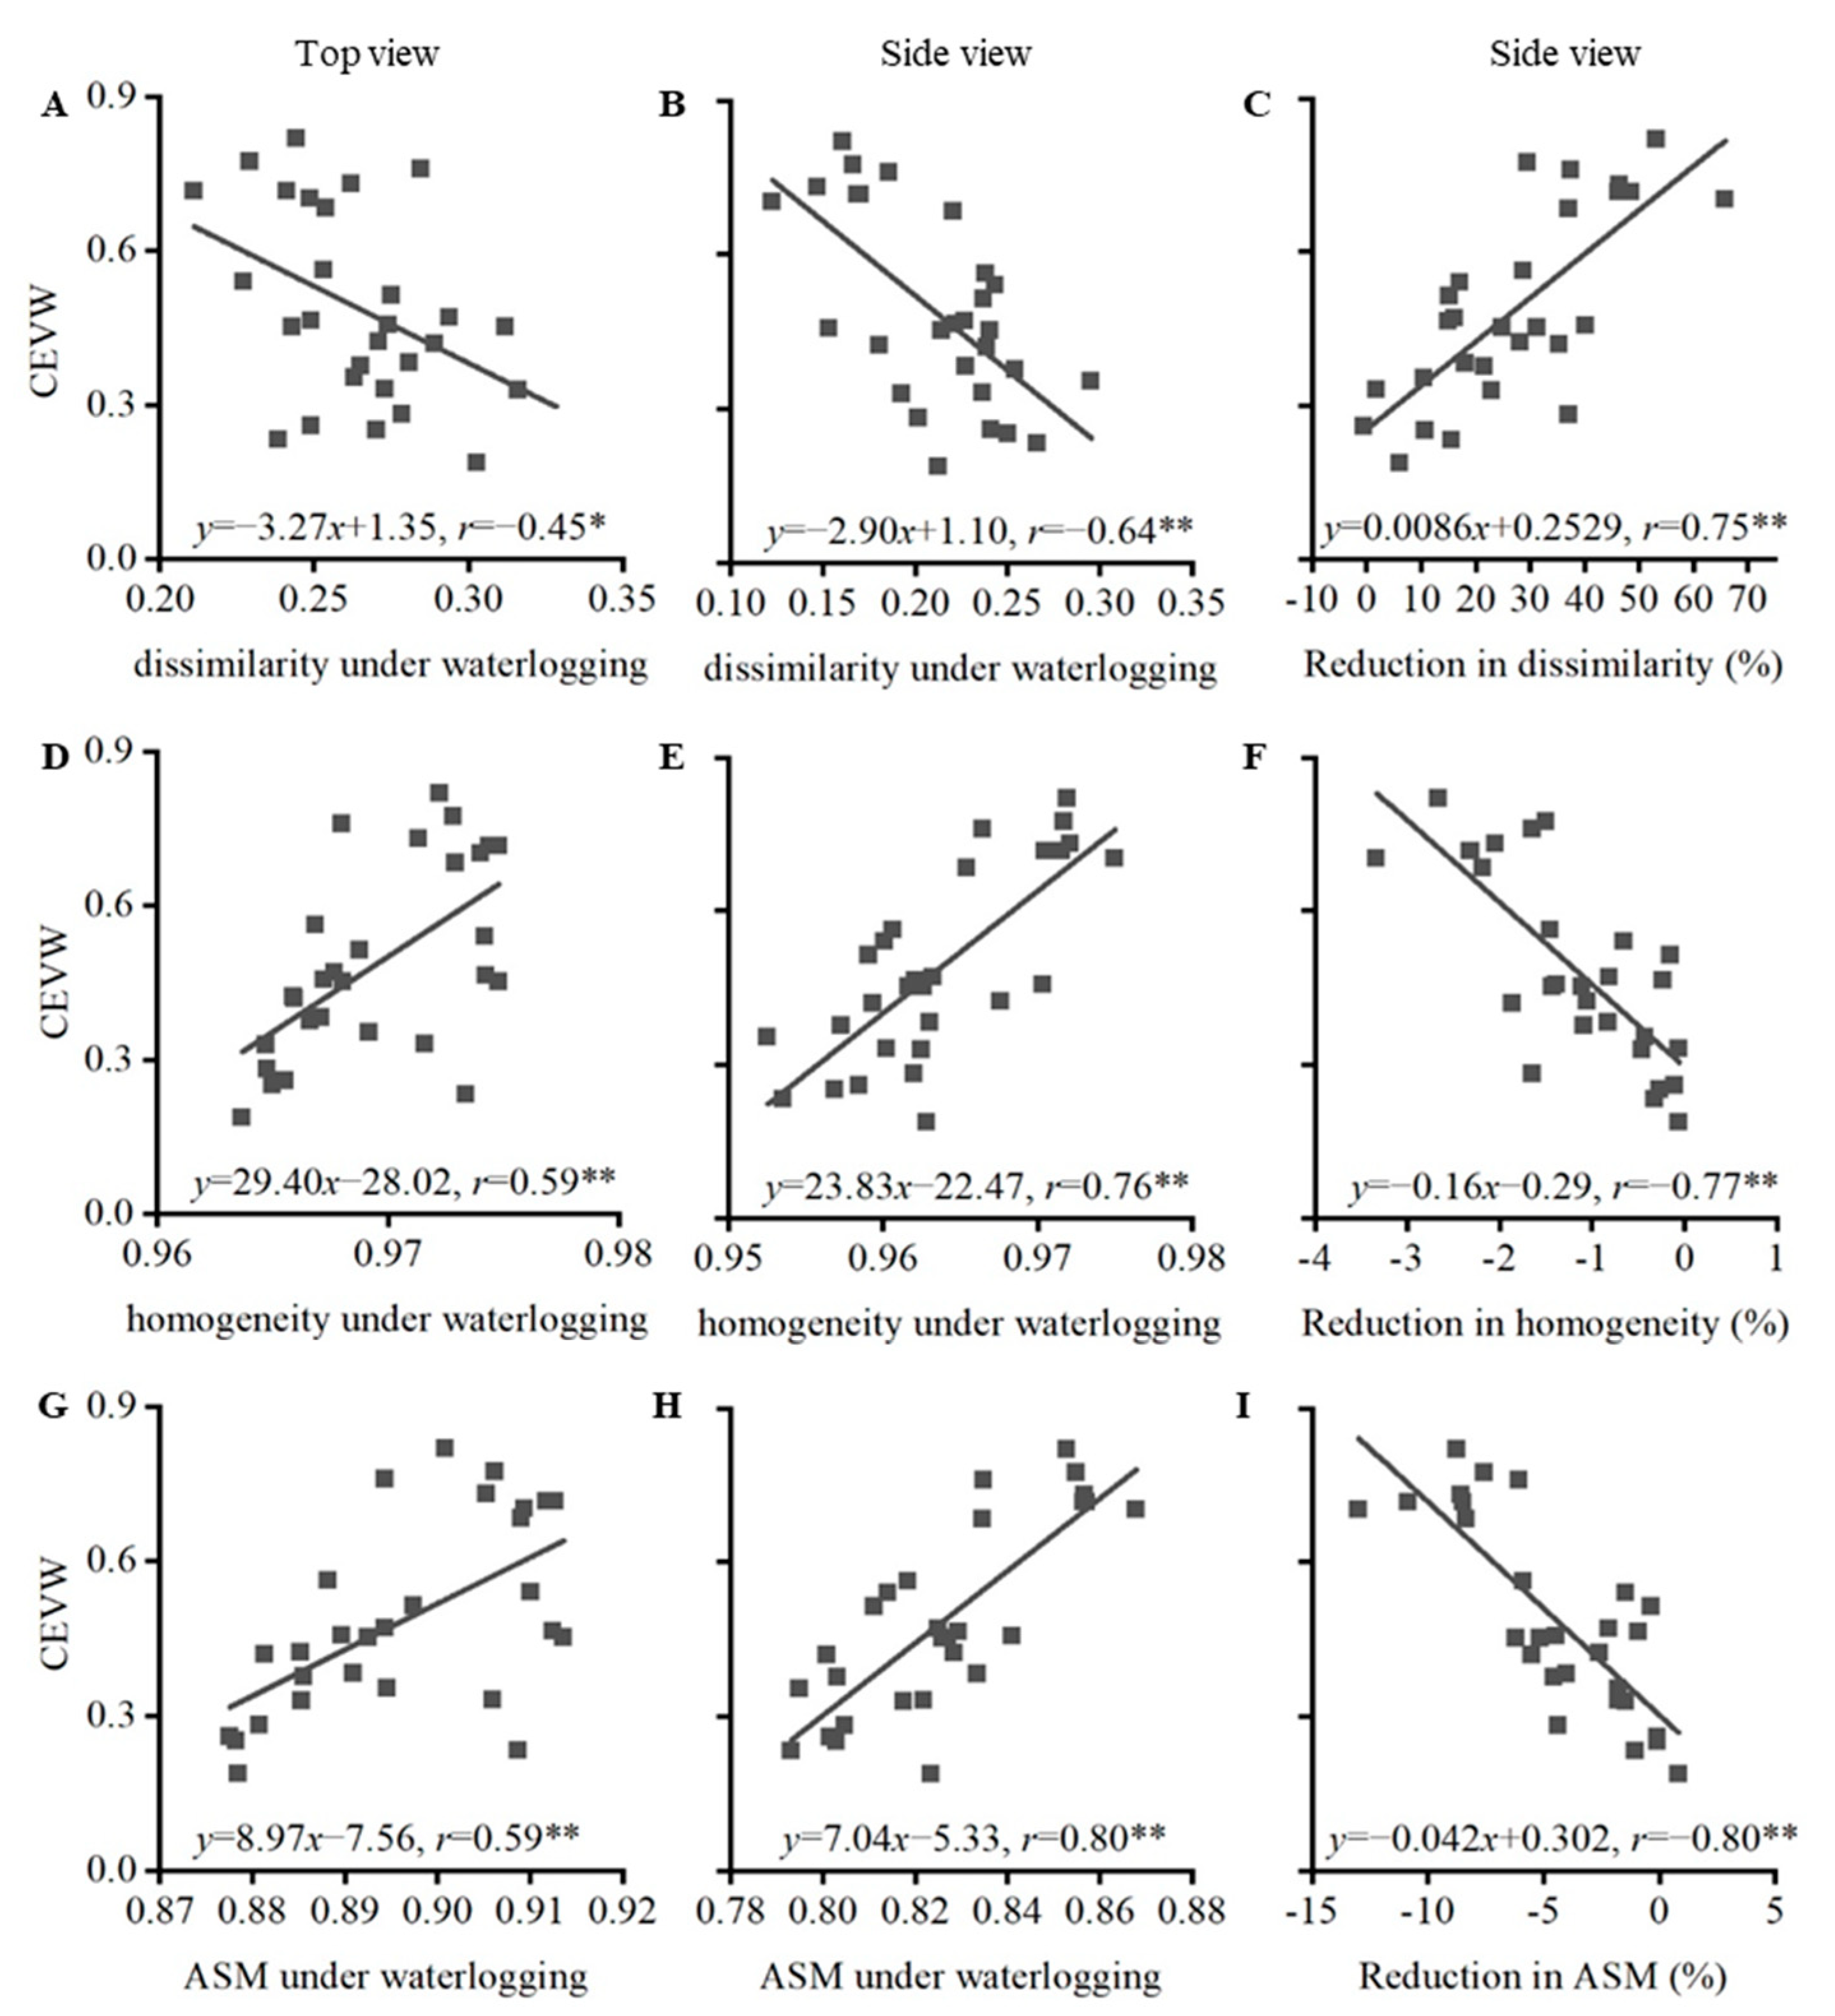
3.6. Evaluation of Waterlogging Tolerance Using Selected Phenotypic Features and Their Percentage Reduction

Although the dissimilarity, homogeneity, and ASM extracted from the images of the top view and side view under waterlogging were significantly correlated with CEVW, the R2 was relatively higher and RMSE and NRMSE were relatively lower when evaluating CEVW using these phenotypic features extracted from images of the side view (Figure 4 and Table 9). Because these top-view phenotypic features reflected the morphological characteristics under control and waterlogging conditions, the relationships between CEVW and the percentage reductions in these phenotypic features caused by waterlogging were further analyzed, showing close correlations. The R2, RMSE, and NRMSE were similar when evaluating CEVW using dissimilarity, homogeneity, and ASM extracted from images of the side view and their percentage reductions, with relatively higher R2 and lower RMSE and NRMSE using ASM and its percentage reduction. In general, the ASM obtained from the images of the side view under the waterlogging treatment can be recommended as a suitable phenotypic parameter to evaluate the waterlogging tolerance of wheat cultivars.

4. Discussions

Waterlogging imposed at the seedling stage can reduce the wheat root and tiller number, green leaf area and chlorophyll concentration, and photosynthetic accumulation, restricting subsequent plant growth and yield formation [9,10,34,35]. The present experiment showed a similar result, indicating that the 15-day waterlogging beginning at the 3rd leaf stage greatly inhibited seedling growth, including the development, biomass, leaf area, relative chlorophyll concentration, and tiller number. Although seedling physiological activity, i.e., photosynthetic rate and transpiration, partially recovered through a drainage treatment, seedling growth could not recover completely due to delayed leaf and tiller growth [10,33,36]. Grain yield losses depend on plant recovery, which is contingent on varietal characteristics, environmental conditions, and agronomic management [37,38,39].
The root features of waterlogging-tolerant wheat showed aerenchyma formation in secondary roots, a shallow root system, a high root length density, and vigorous root activity [16,40,41,42]. Compared to the root system, aboveground characteristics have received more attention due to easier observation for selecting waterlogging-tolerant cultivars and many morphological and physiological parameters have been proposed, including the leaf biomass, specific leaf dry weight, leaf photosynthetic level, and plant nitrogen and carbohydrate contents [4,16,43]. However, the effects of waterlogging stress on wheat differ owing to the soil, climate, genotype, and the waterlogging period/duration [19,44]. The present results indicated that the percentage reductions in the shoot dry weight and leaf area were closely related to the majority of the measured agronomic traits and also to the shoot dry weight and leaf area under waterlogging. This suggests that the shoot dry weight and leaf area can be used as agronomic traits to screen waterlogging-tolerant cultivars in areas vulnerable to waterlogging during the seedling period.
Because the shoot dry weight and leaf area did not accurately reflect the leaf chlorophyll content, leaf number, and culm number, we used the CEVW parameter, a comprehensive assessment of the membership functions based on the theory of fuzzy mathematics, to comprehensively evaluate the seedling performance after waterlogging. The building of evaluation indexes by adopting multivariate statistical methods to estimate stress tolerance has been widely realized successfully, including the drought resistance of wheat evaluated by the membership function value [30], salinity tolerance of wheat evaluated and classified by principal component analysis and cluster analysis [45], and drought tolerance of sweet potato identified using the comprehensive evaluation index [46]. The present results showed that the constructed CEVE parameter based on the measured agronomic indexes reflected the percentage reductions in the dry weight, plant height, culm number, leaf area, and SPAD value, indicating that this parameter can comprehensively evaluate the waterlogging tolerance of wheat seedlings.
The color features extracted from the digital images have been successfully used to monitor the leaf chlorophyll content or relative index of crops or trees [29,47,48]. These phenotypic features can also reflect the morphological characteristics of plants, i.e., leaf area index and shoot dry weight of rice [49] and aboveground biomass of wheat [25]. The present results showed that the color parameters (H, b, and 2G-R-B) extracted from the top-view images reflected the chlorophyll content of the leaves, in contrast to the images obtained from the side view. Although there were significant relationships of H with plant weight and leaf area and of b and 2G-R-B with the leaf number on main stem when the images were taken from the top view, the color parameters did not reflect the morphological characteristics in general, especially from the side view. Previous studies pointed out that the shooting angles of images caused differences in reflected and refracted light, affecting the value of the acquired parameters, and the color parameters extracted from images from the top vertical view had better correlations with leaf color and the morphological index compared with images from other views [25,48].
Texture parameters have been adopted to estimate crop emergence and seedling number [24,28], monitor aboveground biomass and nitrogen status [26,29], and identify disease [50]. Our results indicated that the phenotypic texture parameters (dissimilarity, homogeneity, and ASM) can be used to reflect the morphological characteristics of wheat seedlings, including the dry weight, leaf number on main stem, culm number, and leaf area, but the degree of the correlation depended on the shooting angle of the images and the water treatments. The results were best under the waterlogging condition using images extracted from the side view compared with other conditions. The possible reasons are that the wheat seedlings under natural growing conditions had more leaves, leading to an overlapped texture with darker color compared with the waterlogging condition.
According to the above analysis, the leaf color (SPAD reading) and the color features could not comprehensively reflect seedling growth. In contrast, the shoot dry weight and leaf area well represented the growing status of plants after waterlogging stress, and the texture features were closely related to the dry weight and leaf area, especially under stress treatment. Further analysis showed that evaluation of CEVW using ASM extracted from images of the side view and its percentage reductions had a higher degree of correlation and accuracy compared with dissimilarity and homogeneity. This indicated that the ASM obtained from the images of the side view in the waterlogging treatment can be recommended as a suitable phenotypic parameter to evaluate the waterlogging tolerance of wheat cultivars. The present results provide a rapid and non-destructive method to evaluate the waterlogging tolerance of wheat cultivars at the seedling stage, but the possible limits need to be studied, including development progress, plant morphology, and nutrition.

5. Conclusions

A 15-day waterlogging event that began at the third-leaf stage greatly inhibited the growth of wheat seedlings. The differences in the agronomic performances of the wheat cultivars after waterlogging were evaluated using the shoot dry weight and leaf area but with a lack of comprehensiveness. Therefore, the comprehensive evaluation value of waterlogging tolerance (CEVW), a comprehensive assessment of the membership functions based on the theory of fuzzy mathematics, was established and verified as a reliable index. The phenotypic features extracted from the digital images effectively reflected seedling growth but depended on the growing condition (waterlogging and control treatments), the shooting angles of the images (top and side views), and the specific phenotypic features. The present results suggest that the ASM extracted from the side-view images is a suitable parameter to evaluate the waterlogging tolerance of wheat cultivars at the seedling stage, providing a rapid and nondestructive screening tool. Further studies need to extend the application scenarios including evaluating wheat crops in field conditions using the sensors carried by an unmanned aerial vehicle.

Author Contributions

Methodology, J.D.; formal analysis, X.J., D.M. and J.D.; investigation, X.J., D.M., M.Z. and X.W.; resources, C.L.; writing—original draft preparation, X.J. and D.M.; writing—review and editing, M.Z. and X.Z.; supervision, W.G. and J.D.; project administration, J.D. All authors have read and agreed to the published version of the manuscript.

Funding

This work was supported by the National Natural Science Foundation of China (32071953); Jiangsu Modern Agricultural (Wheat) Industry Technology System; the Priority Academic Program Development of Jiangsu Higher Education Institutions; and Innovation and Entrepreneurship Training Program for College Students in Jiangsu Province (202111117034Z).

Institutional Review Board Statement

Not applicable.

Informed Consent Statement

Not applicable.

Conflicts of Interest

The authors declare no conflict of interest.

References

  1. Food and Agriculture Organization [FAO]. Food and Agriculture Organization of the United Nations. 2015. Available online: https://www.fao.org/3/i5056e/i5056e.pdf (accessed on 15 October 2016).
  2. Ding, J.; Liang, P.; Wu, P.; Zhu, M.; Li, C.; Zhu, X.; Gao, D.; Chen, Y.; Guo, W. Effects of waterlogging on grain yield and associated traits of historic wheat cultivars in the middle and lower reaches of the Yangtze River, China. Field Crops Res. 2020, 246, 107695. [Google Scholar] [CrossRef]
  3. Yaduvanshi, N.P.S.; Setter, T.L.; Sharma, S.K.; Singh, K.N.; Kulshreshtha, N. Influence of waterlogging on yield of wheat (Triticum aestivum), redox potentials, and concentrations of microelements in different soils in India and Australia. Soil Res. 2012, 50, 489–499. [Google Scholar] [CrossRef]
  4. Hossain, A.; Araki, H.; Takahashi, T. Poor grain filling induced by waterlogging is similar to that in abnormal early ripening in wheat in Western Japan. Field Crops Res. 2011, 123, 100–108. [Google Scholar] [CrossRef]
  5. Liu, C.; Allan, R. Observed and simulated precipitation responses in wet and dry regions 1850–2100. Environ. Res. Lett. 2013, 8, 034002. [Google Scholar] [CrossRef]
  6. De San Celedonio, R.P.; Abeledo, L.G.; Brihet, J.M.; Miralles, D.J. Waterlogging affects leaf and tillering dynamics in wheat and barley. J. Agron. Crop Sci. 2016, 202, 409–420. [Google Scholar] [CrossRef]
  7. De San Celedonio, R.P.; Abeledo, L.G.; Miralles, D.J. Physiological traits associated with reductions in grain number in wheat and barley under waterlogging. Plant Soil 2018, 429, 469–481. [Google Scholar] [CrossRef]
  8. Pampana, S.; Masoni, A.; Arduini, I. Grain yield of durum wheat as affected by waterlogging at tillering. Cereal Res. Commun. 2016, 44, 706–716. [Google Scholar] [CrossRef] [Green Version]
  9. Malik, A.I.; Colmer, T.D.; Lambers, H.; Setter, T.L.; Schortemeyer, M. Short-term waterlogging has long-term effects on the growth and physiology of wheat. New Phytol. 2002, 153, 225–236. [Google Scholar] [CrossRef]
  10. Shao, G.C.; Lan, J.J.; Yu, S.E.; Liu, N.; Guo, R.Q.; She, D.L. Photosynthesis and growth of winter wheat in response to waterlogging at different growth stages. Photosynthetica 2013, 51, 429–437. [Google Scholar] [CrossRef]
  11. Araki, H.; Hamada, A.; Hossain, M.A.; Takahashi, T. Waterlogging at jointing and/or after anthesis in wheat induces early leaf senescence and impairs grain filling. Field Crops Res. 2012, 137, 27–36. [Google Scholar] [CrossRef]
  12. Tan, W.; Liu, J.; Dai, T.; Jing, Q.; Cao, W.; Jiang, D. Alterations in photosynthesis and antioxidant enzyme activity in winter wheat subjected to post-anthesis water-logging. Photosynthetica 2008, 46, 21–27. [Google Scholar] [CrossRef]
  13. Li, H.; Cai, J.; Liu, F.; Jiang, D.; Dai, T.; Cao, W. Generation and scavenging of reactive oxygen species in wheat flag leaves under combined shading and waterlogging stress. Funct. Plant Biol. 2012, 39, 71–81. [Google Scholar] [CrossRef] [PubMed]
  14. Ding, J.; Huang, Z.; Zhu, M.; Li, C.; Zhu, X.; Guo, W. Does cyclic water stress damage wheat yield more than a single stress? PLoS ONE 2018, 13, e0195535. [Google Scholar] [CrossRef] [Green Version]
  15. Brisson, N.; Rebière, B.; Zimmer, D.; Renault, P. Response of the root system of a winter wheat crop to waterlogging. Plant Soil 2002, 243, 43–55. [Google Scholar] [CrossRef]
  16. Arguello, M.N.; Mason, R.E.; Roberts, T.L.; Subramanian, N.; Acuña, A.; Addison, C.K.; Lozada, D.N.; Miller, R.G.; Gbur, E. Performance of soft red winter wheat subjected to field soil waterlogging: Grain yield and yield components. Field Crops Res. 2016, 194, 57–64. [Google Scholar] [CrossRef] [Green Version]
  17. Manik, S.M.N.; Pengilley, G.; Dean, G.; Field, B.; Shabala, S.; Zhou, M. Soil and crop management practices to minimize the impact of waterlogging on crop productivity. Front. Plant Sci. 2019, 10, 140. [Google Scholar] [CrossRef] [Green Version]
  18. Herzog, M.; Striker, G.G.; Colmer, T.D.; Pedersen, O. Mechanisms of waterlogging tolerance in wheat—A review of root and shoot physiology. Plant Cell Environ. 2016, 39, 1068–1086. [Google Scholar] [CrossRef]
  19. Setter, T.L.; Waters, I.; Sharma, S.K.; Singh, K.N.; Kulshreshtha, N.; Yaduvanshi, N.P.S.; Ram, P.C.; Singh, B.N.; Rane, J.; Khabaz-Saberi, G.M.H.; et al. Review of wheat improvement for waterlogging tolerance in Australia and India: The importance of anaerobiosis and element toxicities associated with different soils. Ann. Bot. 2008, 103, 221–235. [Google Scholar] [CrossRef] [Green Version]
  20. Hossain, M.A.; Uddin, S.N. Mechanisms of waterlogging tolerance in wheat: Morphological and metabolic adaptations under hypoxia or anoxia. Aust. J. Crop Sci. 2011, 5, 1094. [Google Scholar] [CrossRef]
  21. Condon, A.G.; Giunta, F. Yield response of restricted-tillering wheat to transient waterlogging on duplex soils. Aust. J. Agric. Res. 2003, 54, 957–967. [Google Scholar] [CrossRef]
  22. Zhang, H.; Turner, N.C.; Poole, M.L.; Asseng, S. High ear number is key to achieving high wheat yields in the high-rainfall zone of south-western Australia. Aust. J. Agric. Res. 2007, 58, 21–27. [Google Scholar] [CrossRef]
  23. Singh, G.; Kumar, P.; Gupta, V.; Tyagi, B.S.; Singh, C.; Sharma, A.K.; Singh, G.P. Multivariate approach to identify and characterize bread wheat (Triticum aestivum) germplasm for waterlogging tolerance in India. Field Crops Res. 2018, 221, 81–89. [Google Scholar] [CrossRef]
  24. Li, B.; Xu, X.; Han, J.; Zhang, L.; Bian, C.; Jin, L.; Liu, J. The estimation of crop emergence in potatoes by UAV RGB imagery. Plant Methods 2019, 15, 15. [Google Scholar] [CrossRef] [Green Version]
  25. Lu, N.; Zhou, J.; Han, Z.; Li, D.; Cao, Q.; Yao, X.; Tian, Y.; Zhu, Y.; Cao, W.; Cheng, T. Improved estimation of aboveground biomass in wheat from RGB imagery and point cloud data acquired with a low-cost unmanned aerial vehicle system. Plant Methods 2019, 15, 17. [Google Scholar] [CrossRef] [Green Version]
  26. Ma, J.; Li, Y.; Chen, Y.; Du, K.; Zheng, F.; Zhang, L.; Sun, Z. Estimating above ground biomass of winter wheat at early growth stages using digital images and deep convolutional neural network. Eur. J. Agron. 2019, 103, 117–129. [Google Scholar] [CrossRef]
  27. Tavakoli, H.; Gebbers, R. Assessing nitrogen and water status of winter wheat using a digital camera. Comput. Electron. Agric. 2019, 157, 558–567. [Google Scholar] [CrossRef]
  28. Liu, T.; Wu, W.; Chen, W.; Sun, C.; Zhu, X.; Guo, W. Automated image-processing for counting seedlings in a wheat field. Precis. Agric. 2015, 17, 392–406. [Google Scholar] [CrossRef]
  29. Xiong, X.; Zhang, J.; Guo, D.; Chang, L.; Huang, D. Non-invasive sensing of nitrogen in plant using digital images and machine learning for Brassica Campestris ssp. Chinensis L. Sensors 2019, 19, 2448. [Google Scholar] [CrossRef] [Green Version]
  30. Hendrawan, Y.; Murase, H. Neural-Intelligent Water Drops algorithm to select relevant textural features for developing precision irrigation system using machine vision. Comput. Electron. Agric. 2011, 77, 214–228. [Google Scholar] [CrossRef]
  31. Liu, C.; Yang, Z.; Hu, Y.-G. Drought resistance of wheat alien chromosome addition lines evaluated by membership function value based on multiple traits and drought resistance index of grain yield. Field Crops Res. 2015, 179, 103–112. [Google Scholar] [CrossRef]
  32. Duan, W.X.; Zhang, H.Y.; Xie, B.T.; Wang, B.Q.; Zhang, L.M. Identification of salt tolerance and screening for its indicators in sweet potato varieties during seedling stage. Acta Crops Sin. 2018, 44, 1237–1247, (In Chinese with English Abstract). [Google Scholar] [CrossRef]
  33. Zadeh, L.A. Fuzzy sets. Inform. Control 1965, 8, 338–353. [Google Scholar] [CrossRef] [Green Version]
  34. Robertson, D.; Zhang, H.; Palta, J.A.; Colmer, T.; Turner, N. Waterlogging affects the growth, development of tillers, and yield of wheat through a severe, but transient, N deficiency. Crop Pasture Sci. 2009, 60, 578–586. [Google Scholar] [CrossRef]
  35. Haque, E.; Oyanagi, A.; Kawaguchi, K. Aerenchyma formation in the seminal roots of japanese wheat cultivars in relation to growth under waterlogged conditions. Plant Prod. Sci. 2012, 15, 164–173. [Google Scholar] [CrossRef] [Green Version]
  36. Malik, A.I.; Colmer, T.D.; Lambers, H.; Schortemeyer, M. Changes in physiological and morphological traits of roots and shoots of wheat in response to different depths of waterlogging. Aust. J. Plant Biol. 2001, 28, 1121–1131. [Google Scholar] [CrossRef]
  37. Dickin, E.; Bennett, S.; Wright, D. Growth and yield responses of UK wheat cultivars to winter waterlogging. J. Agric. Sci. 2009, 147, 127–140. [Google Scholar] [CrossRef]
  38. Wu, X.; Tang, Y.; Li, C.; Wu, C.; Huang, G. Chlorophyll fluorescence and yield responses of winter wheat to waterlogging at different growth stages. Plant Prod. Sci. 2015, 18, 284–294. [Google Scholar] [CrossRef] [Green Version]
  39. Ding, J.; Liang, P.; Wu, P.; Zhu, M.; Li, C.; Zhu, X.; Guo, W. Identifying the critical stage near anthesis for waterlogging on wheat yield and its components in the Yangtze River Basin, China. Agronomy 2020, 10, 130. [Google Scholar] [CrossRef] [Green Version]
  40. Hayashi, T.; Yoshida, T.; Fujii, K.; Mitsuya, S.; Tsuji, T.; Okada, Y.; Hayashi, E.; Yamauchi, A. Maintained root length density contributes to the waterlogging tolerance in common wheat (Triticum aestivum L.). Field Crops Res. 2013, 152, 27–35. [Google Scholar] [CrossRef]
  41. Ebrahimi-Mollabashi, E.; Huth, N.I.; Holzwoth, D.P.; Ordóñez, R.A.; Hatfield, J.L.; Huber, I.; Castellano, M.J.; Archontoulis, S.V. Enhancing APSIM to simulate excessive moisture effects on root growth. Field Crops Res. 2019, 236, 58–67. [Google Scholar] [CrossRef]
  42. Hodgkinson, L.; Dodd, I.C.; Binley, A.; Ashton, R.; White, R.; Watts, C.; Whalley, W. Root growth in field-grown winter wheat: Some effects of soil conditions, season and genotype. Eur. J. Agron. 2017, 91, 74–83. [Google Scholar] [CrossRef] [PubMed]
  43. Chakraborty, D.; Nagarajan, S.; Aggarwal, P.; Gupta, V.K.; Tomar, R.K.; Garg, R.N.; Sahoo, R.N.; Sarkar, A.; Chopra, U.K.; Sundara Sarma, K.S.; et al. Effect of mulching on soil and plant water status, and the growth and yield of wheat (Triticum aestivum L.) in a semi-arid environment. Agric. Water Manag. 2008, 95, 1323–1334. [Google Scholar] [CrossRef]
  44. Setter, T.L.; Waters, I. Review of prospects for germplasm improvement for waterlogging tolerance in wheat, barley and oats. Plant Soil 2003, 253, 1–34. [Google Scholar] [CrossRef]
  45. Peng, Z.; Li, L.; Liu, Y.P.; Liu, H.; Jing, R.L. Evaluation of salinity tolerance in wheat (Triticum aestium) genotypes at germination and seedling stages. J. Plant Gene Res. 2017, 18, 638–645, (In Chinese with English Abstract). [Google Scholar]
  46. Zhang, H.-Y.; Xie, B.-T.; Wang, B.-Q.; Dong, S.-X.; Duan, W.-X.; Zhang, L.-M. Evaluation of drought tolerance and screening for drought-tolerant indicators in sweetpotato cultivars. Acta Agron. Sin. 2019, 45, 419–430, (In Chinese with English Abstract). [Google Scholar] [CrossRef]
  47. Do Amaral, E.S.; Silva, D.V.; Dos Anjos, L.; Schilling, A.C.; Dalmolin, Â.C.; Mielke, M.S. Relationships between reflectance and absorbance chlorophyll indices with RGB (red, green, blue) image components in seedlings of tropical tree species at nursery stage. New For. 2019, 50, 377–388. [Google Scholar] [CrossRef]
  48. Baresel, J.P.; Rischbeck, P.; Hu, Y.; Kipp, S.; Barmeier, G.; Mistele, B.; Schmidhalter, U. Use of a digital camera as alternative method for non-destructive detection of the leaf chlorophyll content and the nitrogen nutrition status in wheat. Comput. Electron. Agric. 2017, 140, 25–33. [Google Scholar] [CrossRef]
  49. Lee, K.-J.; Lee, B.-W. Estimation of rice growth and nitrogen nutrition status using color digital camera image analysis. Eur. J. Agron. 2013, 48, 57–65. [Google Scholar] [CrossRef]
  50. Pydipati, R.; Burks, T.; Lee, W. Identification of citrus disease using color texture features and discriminant analysis. Comput. Electron. Agric. 2006, 52, 49–59. [Google Scholar] [CrossRef]
Figure 1. Self-made photography device (a) to obtain the digital images of the top view (b) and side view (c).
Agriculture 12 00384 g001
Figure 2. Relationships of dry weight (A), plant height (B), leaf number on main stem (C), culm number (D), leaf area (E), and SPAD reading (F) of different cultivars under the control condition and waterlogging treatment with their percentage reduction caused by waterlogging treatment. ** indicates significance at the 0.01 probability level.
Agriculture 12 00384 g002
Figure 3. Relationships of the dry weight (A), plant height (B), leaf number on main stem (C), culm number (D), leaf area (E), and SPAD reading (F) of different cultivars under the control and waterlogging conditions and their percentage reduction caused by waterlogging relative to CEVW. * and ** indicate significance at the 0.05 and 0.01 probability levels, respectively.
Agriculture 12 00384 g003
Figure 4. Relationships of CEVW with dissimilarity, homogeneity, and ASM extracted from images of the top view (A,D,G) and side view (B,E,H) under waterlogging and their percentage reductions (C,F,I). * and ** indicate significance at the 0.05 and 0.01 probability levels, respectively.
Agriculture 12 00384 g004
Table 1. Descriptions of the selected phenotypic features extracted from images.
CategoryTrait NameDescription
Color featuresHHue value in HSV (hue, saturation, value) color space
bb value of B channel in LAB (luminosity, the range from magenta to green, and the range from yellow to blue) color spaces
2G-R-B2G-R-B value in the RGB (red, green, blue) color space
Texture featuresdissimilarityThe difference in the grey scale
homogeneityThe local changes in the image texture
ASMAngular second moment
Table 2. ANOVA results (p-value) of the effect of cultivar and water treatment on agronomic traits.
SourceDry WeightPlant
Height
Leaf Number
on Main Stem
Culm NumberLeaf
Area
SPAD
Reading
Water treatment (T)<0.001<0.001<0.001<0.001<0.001<0.001
Cultivar (C)<0.001<0.001<0.001<0.001<0.001<0.001
T × C0.0070.0060.0370.470<0.001<0.001
Table 3. Mean and range of agronomic traits of different cultivars under the control and waterlogging conditions and their percentage reduction caused by waterlogging.
TreatmentDry Weight
(mg Plant−1)
Plant
Height (cm)
Leaf Number
on Main Stem
Culm
Number
Leaf Area
(cm2 Plant−1)
SPAD
Reading
Control175 ± 15
(144–202)
20.9 ± 1.9
(17.8–24.5)
4.6 ± 0.2
(4.0–4.9)
3.6 ± 0.3
(2.7–4.1)
20.4 ± 2.1
(16.6–23.6)
41.9 ± 4.1
(35.1–47.4)
Waterlogging151 ± 18
(122–193)
18.5 ± 1.8
(15.6–20.9)
4.3 ± 0.2
(3.8–4.7)
3.1 ± 0.4
(2.3–3.8)
17.6 ± 2.2
(14.7–22.3)
35.5 ± 1.9
(31.2–38.4)
Reduction (%)13.8 ± 8.0
(0.0–28.0)
11.0 ± 4.7
(1.1–19.5)
5.7 ± 2.5
(0.0–11.4)
12.5 ± 8.5
(0.0–37.8)
13.6 ± 7.3
(2.3–28.2)
14.8 ± 7.1
(4.7–24.2)
Data in the table represent the mean value ± standard deviation. The data in parentheses are the range of each agronomic trait of different cultivars.
Table 4. Correlation coefficients between percentage reductions in different agronomic traits.
Percentage ReductionPercentage Reduction
PHLNCNLASPAD Reading
Dry weight0.54 **0.190.62 **0.74 **0.39 *
Plant height (PH) 0.160.130.66 **0.08
Leaf number on main stem (LN) −0.190.41 *−0.08
Culm number (CN) 0.360.67 **
Leaf area (LA) 0.21
* and ** indicate significance at the 0.05 and 0.01 probability levels, respectively.
Table 5. Component matrix of the percentage reduction in agronomic traits and the contribution rate and weight of the components based on principal component analysis.
ParametersPercentage ReductionComponent
X1X2
Component MatrixDry weight0.7080.572
Plant height0.7780.099
Leaf number on main stem0.628−0.377
Culm number0.1440.919
Leaf area0.8980.250
SPAD reading0.0290.837
Contribution rate38.83834.780
Weight0.5280.472
Table 6. Comprehensive evaluation value of the waterlogging tolerance (CEVW) of different cultivars and their calculations.
CultivarComponent
Score
MFVDCEVWCultivarComponent
Score
MFVDCEVW
X1X2u(X1)u(X2)X1X2u(X1)u(X2)
Huaimai6−1.691−0.4660.0530.3360.187Sumai11−0.7330.6510.3160.6120.456
Yangmai15−0.923−1.0310.2640.1970.232Yangmai28−0.026−0.1670.5100.4100.463
Yangmai24−0.980−0.8120.2480.2510.249Ningmai9−0.099−0.0260.4900.4450.469
Ningmai22−1.8840.3810.0000.5450.258Yangfumai40.295−0.1470.5990.4150.512
Yangmai13−1.5450.1610.0930.4910.281Yangmai201.176−1.0060.8410.2030.539
Ningmai13−0.626−0.5830.3460.3070.328Yangfumai21.279−0.9370.8690.2200.562
Ningmai16−0.125−1.1850.4830.1590.330zhengmai110.1561.5000.5610.8220.684
Yangfumai5−0.303−0.7700.4340.2610.353Yangfumai20540.5951.1080.6810.7250.702
Yangmai160.569−1.6650.6740.0400.374Yangmai221.756−0.2221.0000.3960.715
Yangmai230.751−1.8270.7240.0000.382Yangfumai10250.9740.7530.7850.6370.715
Ningmai23−0.7710.3680.3060.5420.417Yangmai211.2110.5850.8500.5960.730
Ningmai26−1.1800.9210.1930.6790.423Huaimai71.3390.6800.8860.6190.760
Zhenmai90.335−0.7150.6090.2750.451Ningmai210.7861.4790.7340.8170.773
shengxuan6−0.8420.7510.2860.6370.452Yangmai250.5052.2220.6561.0000.819
Table 7. Correlation coefficients of selected phenotypic features extracted from images of the top view with agronomic traits under control and waterlogging conditions.
Water
Treatment
Phenotypic
Feature
Dry
Weight
Plant
Height
Leaf Number
on Main Stem
Culm NumberLeaf
Area
SPAD
Reading
ControlH−0.11−0.43 *0.330.02−0.52 **0.78 **
b−0.150.42 *−0.63 **−0.38*0.37−0.65 **
2G-R-B−0.070.43 *−0.47 *−0.240.35−0.72 **
Dissimilarity0.24−0.070.030.170.04−0.07
Homogeneity−0.35−0.10−0.11−0.34−0.320.33
ASM−0.33−0.21−0.01−0.27−0.41 *0.44 *
WaterloggingH−0.48 **−0.42 *0.21−0.34−0.68 **0.42 *
b−0.040.37−0.50 **−0.190.29−0.57 **
2G-R-B−0.250.30−0.44 *−0.320.07−0.50 **
Dissimilarity0.33−0.310.64 **0.54 **−0.170.50 **
Homogeneity−0.71 **−0.01−0.58 **−0.61 **−0.25−0.44 *
ASM−0.78 **−0.13−0.50 **−0.55 **−0.35−0.37
* and ** indicate significance at the 0.05 and 0.01 probability levels, respectively.
Table 8. Correlation coefficients of selected phenotypic features extracted from images of the side view with agronomic traits under control and waterlogging conditions.
Water
Treatment
Phenotypic
Feature
Dry
Weight
Plant
Height
Leaf Number
on Main Stem
Culm NumberLeaf
Area
SPAD
Reading
ControlH−0.060.36−0.29−0.42 *0.130.32
b0.320.42 *−0.140.120.35−0.45 *
2G-R-B0.280.160.04−0.11−0.020.32
Dissimilarity0.42 *0.40 *−0.24−0.360.330.06
Homogeneity−0.51 **−0.40 *0.160.30−0.38 *−0.19
ASM−0.55 **−0.38 *0.130.28−0.45 *−0.18
WaterloggingH−0.26−0.260.22−0.01−0.380.34
b0.310.28−0.06−0.090.36−0.08
2G-R-B0.230.33−0.19−0.150.34−0.19
Dissimilarity0.51 **0.52 **−0.180.59 **0.59 **−0.20
Homogeneity−0.62 **−0.46 *0.03−0.66 **−0.64 **0.10
ASM−0.77 **−0.43 *−0.13−0.64 **−0.68 **−0.04
* and ** indicate significance at the 0.05 and 0.01 probability levels, respectively.
Table 9. Comparisons of CEVW evaluation using selected phenotypic features extracted from top- and side-view images under waterlogging and their percentage reduction.
Phenotypic FeaturesR2p ValueRMSENRMSE (%)
Top ViewDissimilarity0.2020.0170.16333.63
Homogeneity0.3450.0010.14830.59
ASM0.3460.0010.14830.71
Side viewDissimilarity0.408<0.0010.14128.87
Homogeneity0.573<0.0010.12024.28
ASM0.632<0.0010.11122.78
Percentage reductionDissimilarity0.558<0.0010.12125.00
Homogeneity0.585<0.0010.11824.22
ASM0.643<0.0010.10922.45
Publisher’s Note: MDPI stays neutral with regard to jurisdictional claims in published maps and institutional affiliations.

