Article

Measuring Method of Slip Ratio for Tractor Driving Wheels Based on Machine Vision

1
College of Engineering, China Agricultural University, Beijing 100083, China
2
State Key Laboratory of Power System of Tractor, Luoyang 471039, China
*
Author to whom correspondence should be addressed.
Agriculture 2022, 12(2), 292; https://doi.org/10.3390/agriculture12020292
Submission received: 31 December 2021 / Revised: 6 February 2022 / Accepted: 16 February 2022 / Published: 17 February 2022
(This article belongs to the Special Issue Sensors Applied to Agricultural Products)

Abstract

:
Tractors are prone to large slips when they are in field operation. The degree of slip plays a vital role in traction efficiency and fuel efficiency. This paper presents a method for measuring the slip ratio of tractors in field operation based on machine vision. The accurate measurement of slip ratio needs to obtain actual velocity and theoretical velocity separately. For obtaining the actual velocity, a monocular camera mounted on the tractor vertically faces down at the ground to collect images. Then, the feature points of inter-frame ground images are matched by the ORB (Oriented FAST and Rotated BRIEF) algorithm for calculating the translational displacement. Next, a homography matrix based on camera calibration is proposed to complete the transformation of a point from the pixel coordinate system to the world coordinate system. Aiming to acquire the theoretical velocity, a method that takes the variations in tire radius into account is proposed, and the tire radii of the driving wheels are indirectly determined by the tire inflation pressure in real-time. The proposed measurement method was verified with an experimental tractor. The results show that the mean absolute errors of the tractor driving wheels’ slip ratio measured by the machine vision method are less than 0.75%, and the maximum of the absolute errors is not more than 2.22%, which shows good performance.

1. Introduction

Agriculture plays a fundamental role in China’s national economy [1]. As one of the most critical types of machinery in the agricultural field, tractors have become essential for modern agriculture [2]. With the frequent appearance of tractors in different agricultural fields, the improvement of tractor traction efficiency and fuel efficiency can significantly reduce fuel consumption [3]. Zoz [4] found that each soil condition corresponds to an optimal slip range with the best traction efficiency and fuel efficiency. Affected by the complex soil environment and large load fluctuations, wheeled tractors in field operation are prone to excessive driving wheels’ slip, seriously reducing the field operation’s quality, efficiency, and safety. Only when working within the optimal slip ratio range can the tractor fully play to its driving ability and ensure the high working efficiency. Therefore, it is necessary to measure the slip ratio for the tractor driving wheels accurately.
Calculating the slip ratio requires measuring tractor driving wheels’ actual and theoretical velocity. In the past few decades, many researchers have researched the measurement of wheel slip. A microcontroller-based wheel slip sensor was developed for a 2WD tractor [5,6]. Furthermore, the tractor’s actual and theoretical velocity was calculated by measuring the front and rear wheels’ revolutions per minute (RPM), respectively. Performances of the fifth wheel, front wheel speed sensor, and radar speed sensors were evaluated on an agricultural tractor in [7], and radar usually produced more accurate indications of ground speeds than sensors with ground-contacting wheels. References [8,9] showed how GPS can determine the slip ratio. However, expensive differential GPS receivers were required to obtain accurate GPS data at high sampling frequencies. In addition, the tire radius was not directly measured. In [10], GPS information, inertial measurement unit (IMU), and wheel angle encoders were used to estimate the slip ratio. This method requires signal fusion processing for multiple sensors. Reference [11] proposed a method for slip detection through machine learning, correlating the slip with four features at rover-body level, which are provided by two sensors (an IMU and motor current). The importance of this approach is that it relies on proprioceptive sensor signals. The observed features form an input vector to the machine learning classification algorithms. The proposed method demonstrates a high accuracy (>96%), a reasonable computation time (<8 s in the worst case), and low storage requirements (<5 kb in the case of the SOM method). The vision-based vehicle motion measurement method is an efficient alternative [12,13]. Its main idea is to use the identifiable visual features extracted from the environment to reconstruct the vehicle’s motion. The visual information is generally acquired by the image acquisition system mounted on the vehicle. The vehicle’s motion is correspondingly renewed as the visual information is updated. Since the vision sensors are not in contact with the soil, they are particularly capable of estimating the state of motion when slippage occurs. In [13], a camera was utilized for trajectory estimation and navigation. Prominent features of the image were extracted by the Harris corner algorithm and matched to the inter-frame images by the normalized correlation method. Ding et al. [14] proposed and verified the slip ratio estimation methods based on visual information with high-precision analysis of the lug traces marked on the terrain. This method helps determine the slip ratio of the experimental rover in the laboratory by directly measuring the distance between the lug traces. However, it is not feasible for situations where the slip ratio is too high to produce neat lug traces, or the rover has complex motions that destroy the lug traces. Reference [15] employed the camera to shoot the terrain surface downwards and selected tracking features based on the optical flow method to restore the vehicle’s motion. At the same time, a sliding mode observer based on the slip-driven vehicle’s kinematics model was designed to realize the synchronous estimation of the slip and velocity of the unmanned vehicle. However, the speed of the mobile robot in the experiment is very low, and the path over rough sand is short. In [16], a downward-looking camera was mounted with a unique tilted angle to observe the wheel rotary and translational motion relative to the soil. An optical flow algorithm was developed to track the salient features of the soil surface and tire surface to estimate the wheel angular velocity and the wheel translational velocity. Similarly, this method has only been tested on a linear test rig and not on mining vehicles. Reference [17] presented a method to determine the slip ratio. The key points of the contact interface between the tire and the road were tracked by Digital Image Correlation (DIC) techniques. A clustering methodology was utilized to differentiate points between the tire and the road and remove outliers. Thus, the tire radius was effectively measured. Reference [18] was based on the principle of monocular vision, and the real-time tire slip ratio was obtained by collecting the lateral coordinates of the tractor-trailer train tires’ markers and combining the tire rotation angle. The template matching algorithm was used to locate the markers, and the position of the concentric circle marker was obtained by Blob analysis, then the matching template was established. The markers were identified through a contour-based template matching algorithm. An elevator traction wheel slippage detection method was proposed based on machine vision in [19]. A white mark was made on the edge of the traction wheel and in the same position on the wire rope, and the original image was acquired by a CCD camera. After the non-linear geometric transformation of the image, the image was preprocessed to construct a connected region, and the distance between the two centroids of the connected region was calculated.
Summarizing the technical developments and current trends for solving the slip ratio of tractor driving wheels exposes the following problems.
  • While the vision-based method has increasingly shown good performance in the measurement of slip ratio, the vision-based method has not been widely used in the field of tractors.
  • The previous slip ratio measurement methods often neglect the real-time measurement for tire radius, which will cause the theoretical velocity measurement not to be updated in real-time, and the accuracy is decreased.
In order to meet the accurate measurement of slip ratio for tractor driving wheels, this paper presents a measuring method of the slip ratio for tractor driving wheels based on machine vision. The accurate measurement of slip ratio needs to obtain actual velocity and theoretical velocity, respectively. For measuring the actual velocity, a monocular camera shot the terrain surface vertically downwards to measure the motion of the tractor by matching ground feature points. A homography matrix based on camera calibration was proposed, then the actual velocity of the tractor was obtained in the world coordinate system. For measuring the theoretical velocity, the tire radius of the tractor driving wheels was determined in real-time by calibrating the tire inflation pressure and tire radius in advance, then combined the angular velocity acquired by encoders to improve the accuracy of theoretical velocity measurement. The proposed measuring method of the slip ratio for tractor driving wheels was verified with an experimental tractor, showing good performance. This measurement technology can be used as an independent system to measure the slip ratio of tractors in field operation.

2. Materials and Methods

2.1. Materials

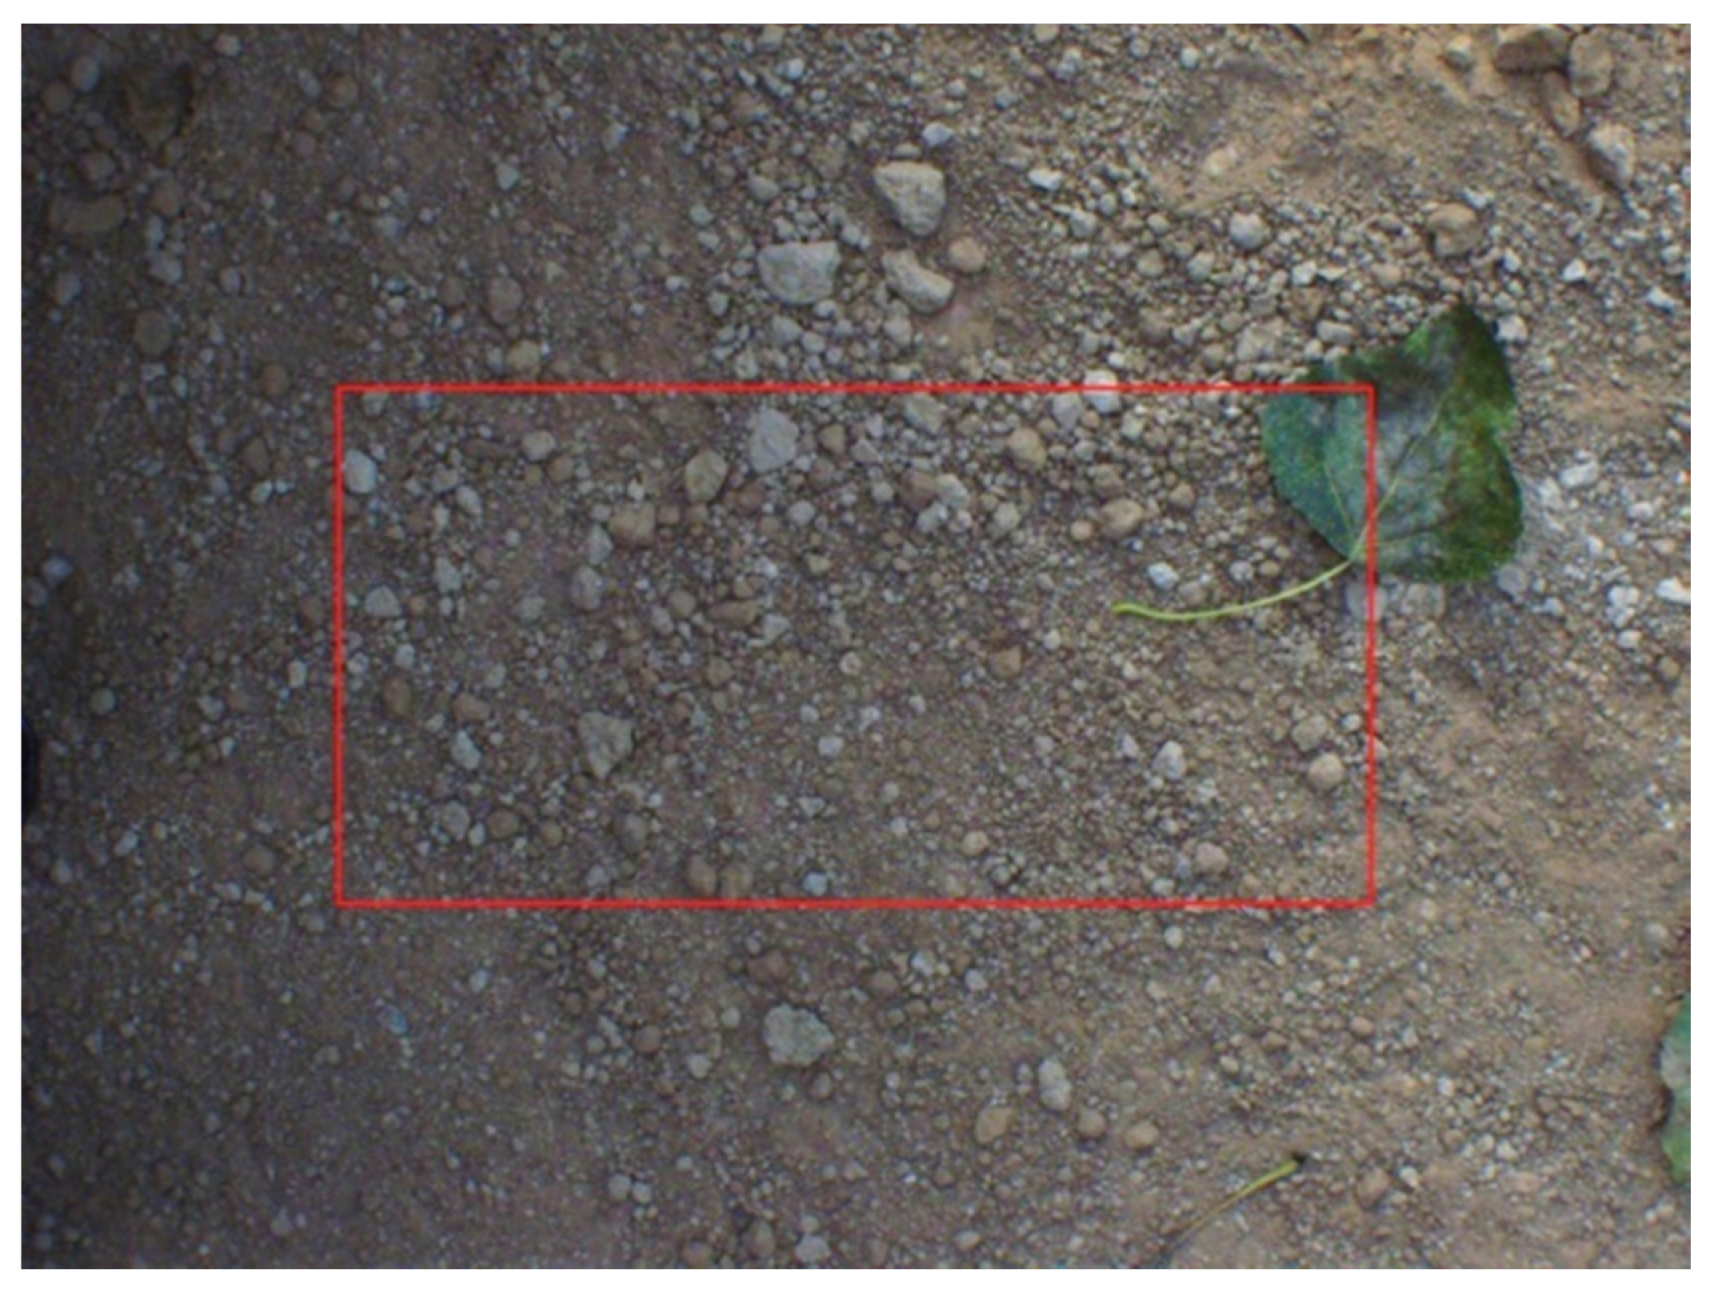
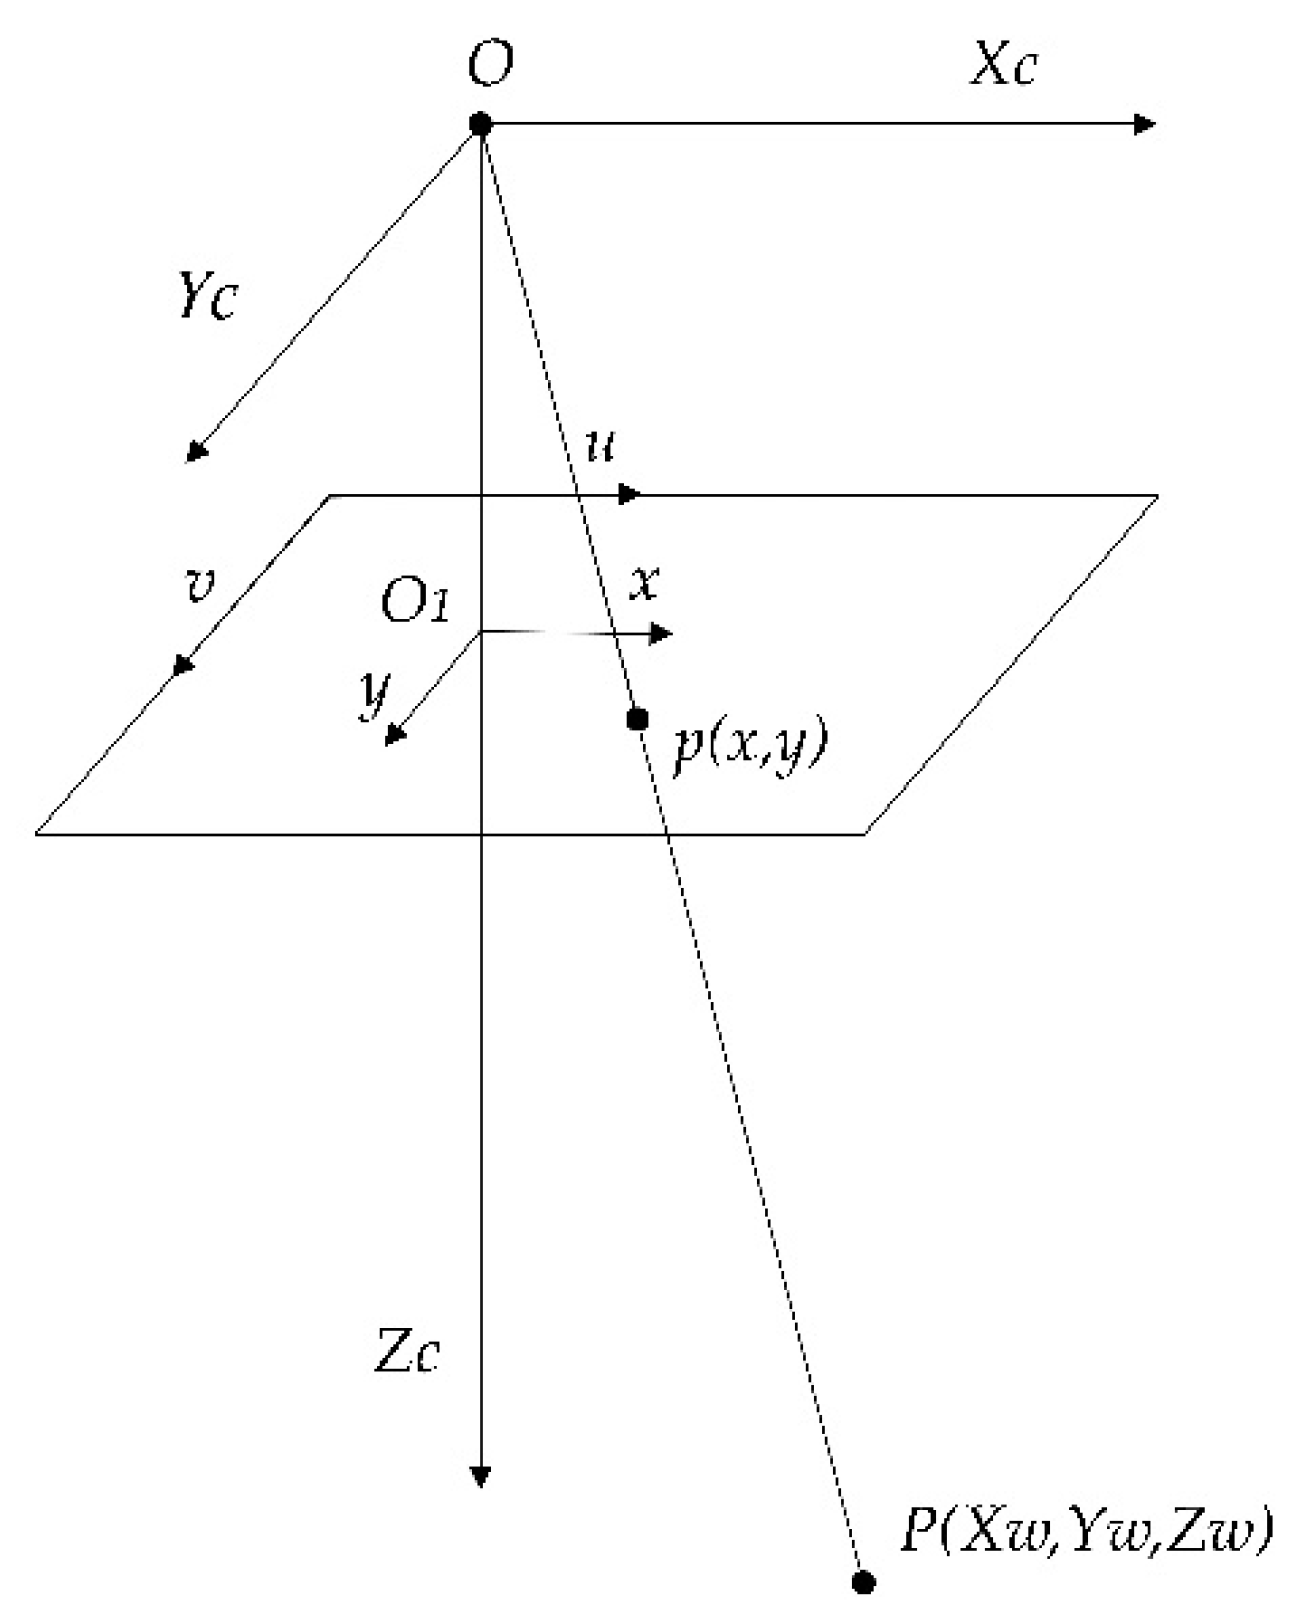
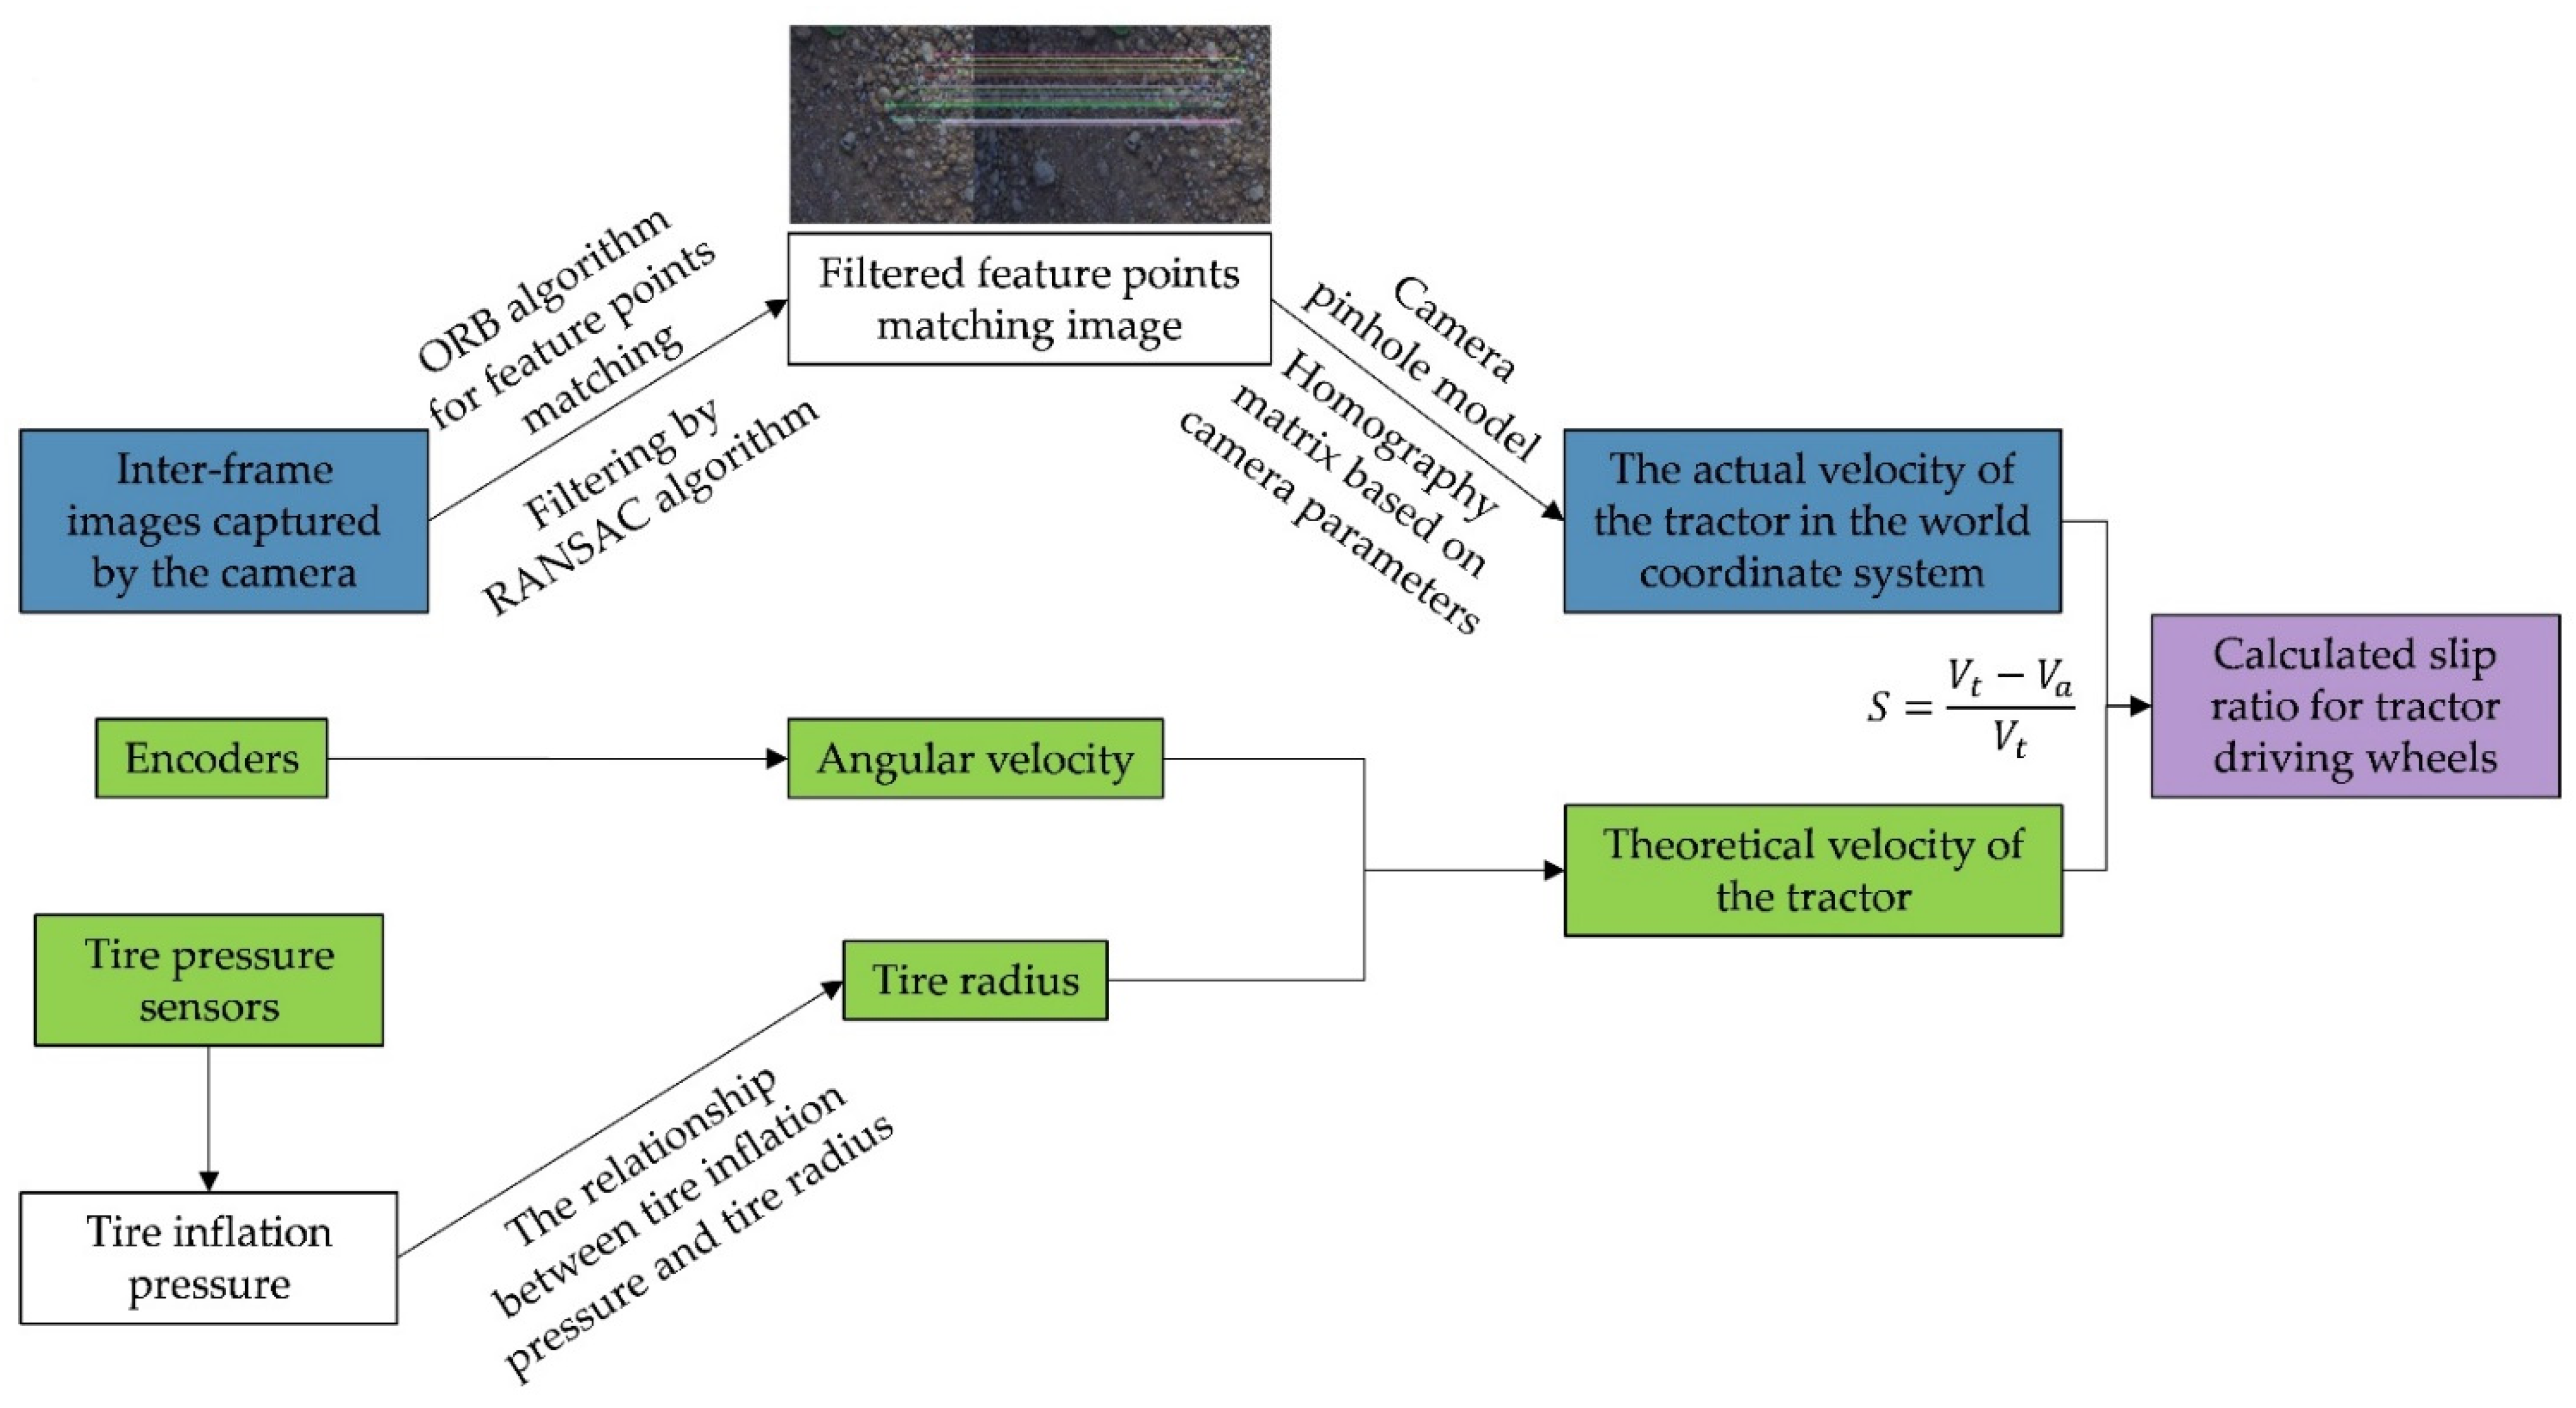
2.1.1. Acquisition of the Wheel’s Actual Velocity

MER-125-30UC (sensor is Sony ICX445 CCD) and Computar M0814-MP2 (Daheng Imaging, Beijing, China) are selected as the camera and lens, respectively. With a height of about 65 cm from the ground, the monocular camera is mounted on an experimental tractor, vertically facing the ground to capture the ground images. Manual focusing makes the ground image clearly visible. The relevant parameters of the camera are shown in Table 1.
This research uses the XW-GI5651 (StarNeto, Beijing, China) high-precision differential GPS-DGPS system to measure the wheel’s actual velocity at the same time to validate the accuracy and credibility of the method for measuring slip ratio by machine vision. The GPS antenna receivers, which are placed on an experimental tractor, provide velocity measurements as well as Code-Phase DGPS position measurements at 20 Hz.

2.1.2. Acquisition of the Wheel’s Theoretical Velocity

The prerequisite for obtaining the wheel’s theoretical velocity is accurately measuring the driving wheels’ tire radius. For measuring the change of the tire radius in real-time, tire pressure sensors (Tainiu, Shenzhen, China) monitor the tire inflation pressure. The tire pressure sensors are installed at the valves of the tires, and the tire inflation pressures are monitored by the pressure sensors. Then, the corresponding relationship between tire inflation pressure and the tire radius is obtained by calibrating in advance to determine the tire radius in real-time. The installation method of tire pressure monitoring sensors is external. Two E6B2-CWZ6C rotary encoders (Omron, Shanghai, China) are selected as the wheel angular velocity acquisition sensors, and the encoders are combined with the tire pressure monitoring sensors as the theoretical velocity acquisition system. The encoder has three phases of A, B and Z. The phase difference between A and B outputs is 90°. The encoders are rigidly connected to the center of the two rear driving wheels’ hubs, keeping coaxial with the drive shaft. The encoder body is connected to the tractor with a fixing frame, and the angular velocity of the driving wheels is collected in real-time. The encoder generates 1000 pulses per revolution, and the input of the pulse to the single-chip microcomputer is combined with the tire radius to calculate the theoretical velocity.

2.2. Methods of Slip Ratio Theory

The longitudinal forces that generate acceleration on ground vehicles with pneumatic tires arise due to deformation and sliding in the tire contact patch. While the actual motions in the contact patch are complex, it is usually to describe the generation of force with sufficient accuracy in wheel slip. It is noted that the slip angle is not considered. The slip of a single wheel can be quantified by longitudinal slip. When driving torque is applied, the longitudinal slip ratio S of a single wheel is defined as Equation (1) [20]:
S = V t - V a V t = ( 1 - V a V t ) × 100 %
where V t is the theoretical velocity of the wheel, V a is the actual velocity of the wheel. The theoretical velocity is determined as Equation (2):
V t = ω R
where ω is the angular velocity of the wheel, and R is the tire radius of the wheel. For the wheel’s actual velocity V a , it is defined by Equation (3):
V a = Δ L Δ t
where ΔL is the displacement of the inter-frame ground images in the world coordinate system, also called the wheel forward displacement. The displacement of the ground pixels in the pixel coordinate system is defined as Δ L p . A method is developed to convert the displacement of pixels into the ground image displacement and then calculate the wheel forward displacement in the world coordinate system. From the inter-frame time difference Δ t   ( Δ t = t 2   -   t 1 ) , the actual velocity of the wheel can be calculated. The encoders and tire pressure monitoring system mentioned above are combined to measure the wheel’s theoretical velocity, and then the real-time measurement results of the driving wheels’ slip ratio can be obtained.

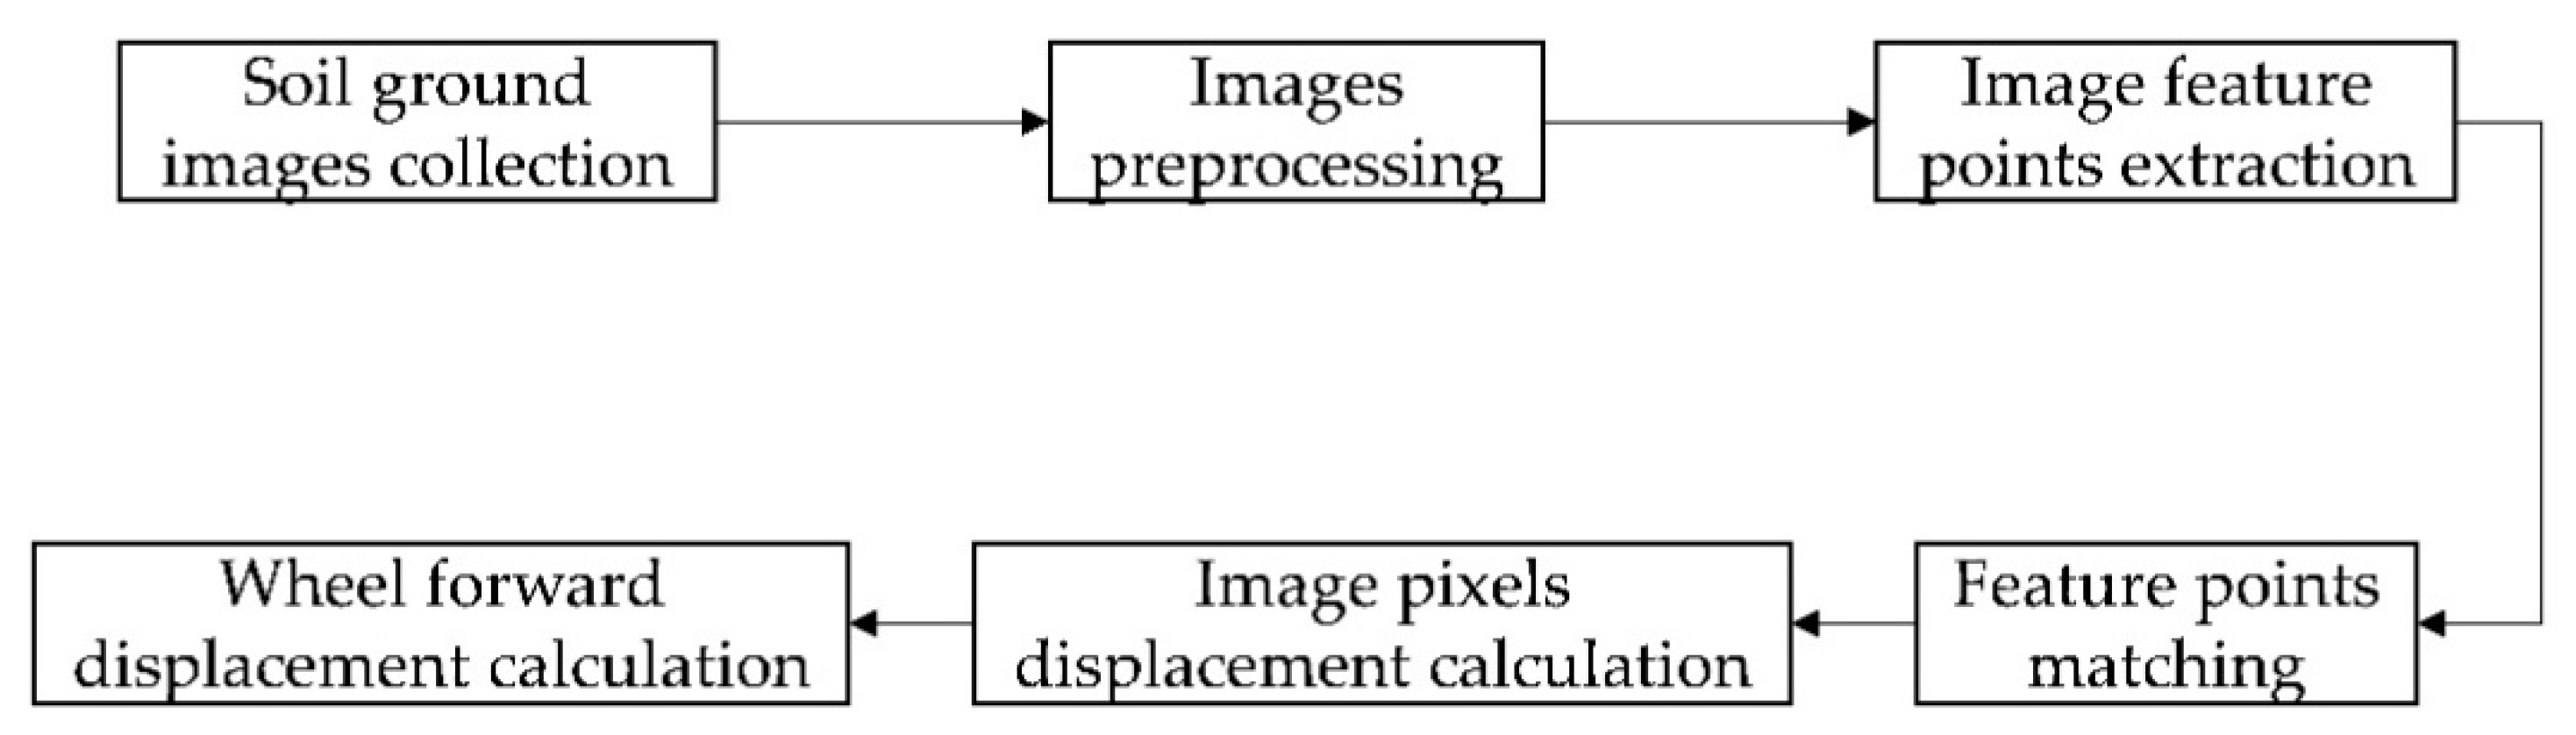
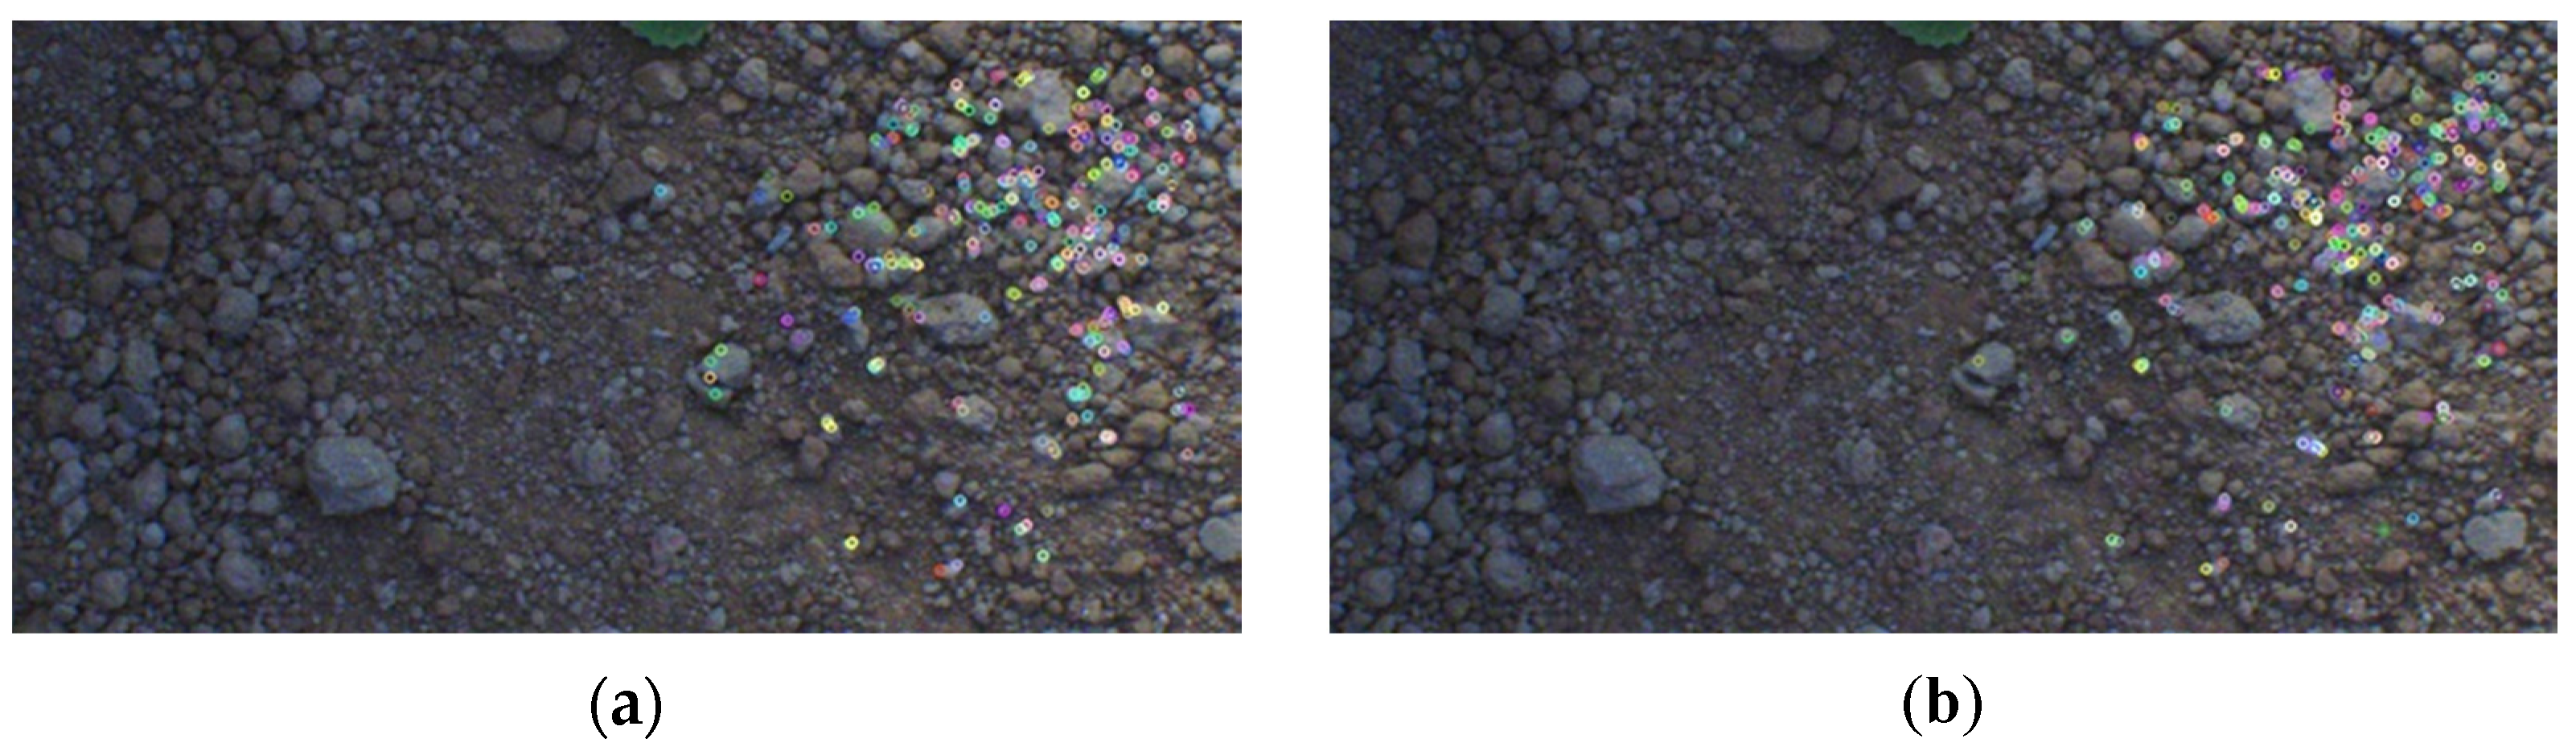
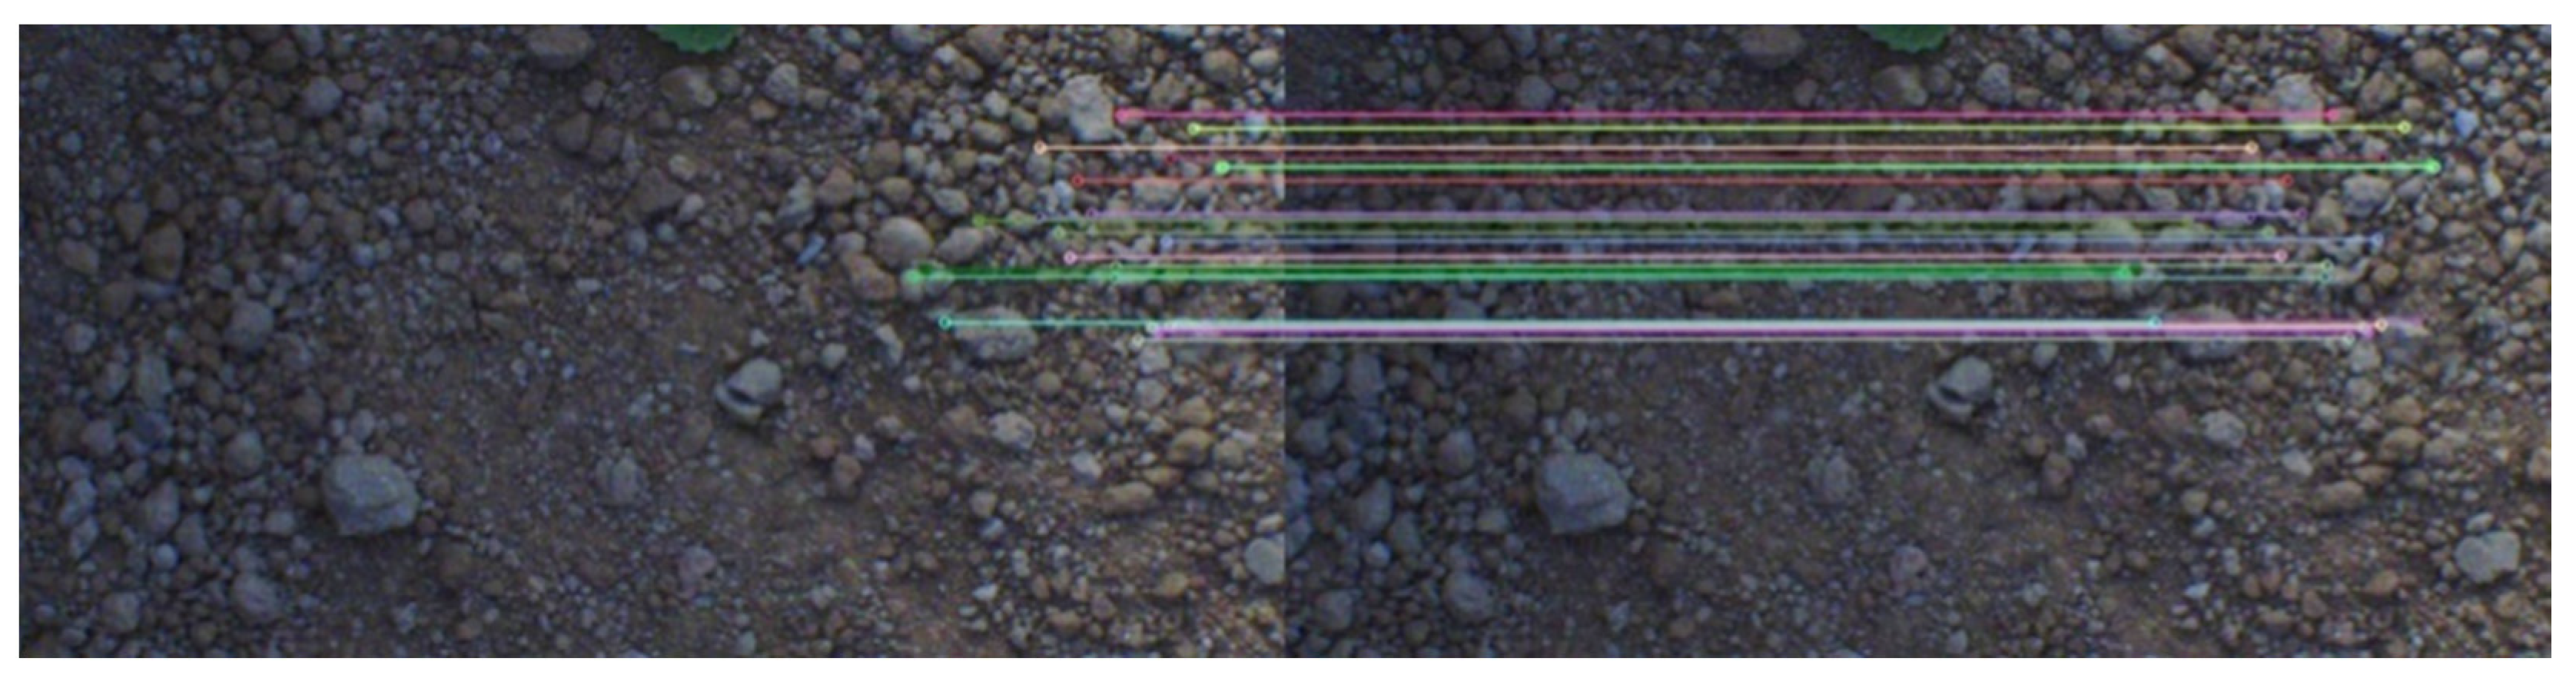
2.3. Estimation of Wheel Forward Displacement by Machine Vision

The calculation process of the wheel forward displacement is shown in Figure 1.
The monocular camera mounted on the tractor captures ground images with the motion of the tractor. Furthermore, these images form a time series of images I t [ t = 0 , 1 , , n ] with a constant interval time. The first step is to preprocess the collected images. While the ground image contains a wealth of information, the calculation of the wheel’s actual velocity does not require much information. Therefore, ROI (region of interest) is set in the image, with the center of the original image. Moreover, the image is cropped with a size of 800 × 400 pixel2, as shown in Figure 2. The subsequent image processing algorithms are implemented in the ROI. Gaussian filtering algorithm is performed on the ROI image area for smoothing to reduce image noise.
After Gaussian filtering and smoothing, natural and distinctive feature points are selected in the ground image for detection. Due to high computational efficiency and excellent reliability, ORB [21] (Oriented FAST and Rotated BRIEF) feature extraction algorithm is adopted to select two adjacent ground images for feature points extraction. ORB includes two parts: Oriented FAST and Rotated BRIEF. The feature points detection of the first part is quickly calculated by the FAST algorithm, but it cannot reflect the scale invariance and rotation invariance of a good feature point. Therefore, Oriented FAST optimizes FAST by constructing an image pyramid and extracting FAST corner points in each layer separately, and it can be detected that FAST corner points are scale-invariant in multi-layer images. Oriented FAST only retains FAST corner points with scale invariance. For rotation invariance, further calculation steps are as follows:
(1)
The rectangular area is selected with the FAST corner point as the center, the moments of the rectangular area are defined by Equation (4):
m p q = x , y x p y q I ( x , y ) , p , q = { 0 , 1 }
(2)
The centroid of the rectangular area is found with these moments:
C = ( m 10 m 00 , m 01 m 00 )
(3)
The FAST corner point and the center of mass are connected to obtain the direction vector, the direction of the direction vector is calculated by the following Equation (6):
θ = arctan ( m 01 m 10 )
In the second part, the BRIEF descriptor, which describes the detected feature points, is a binary coded descriptor. Rotated BRIEF, based on BRIEF, solves the problem of indistinguishability between rotation characteristics and feature points by introducing the rotation angle of Oriented FAST and machine learning to realize the marking and matching of feature points.
The ORB algorithm is adopted to extract the feature points in the ROI area, which is smaller than the original image. There is still a wealth of feature information in the image. For meeting the rate and simplicity requirements, a definite upper limit is set when detecting the feature points by the ORB algorithm to obtain an appropriate amount of reliable feature points. The effect of the ORB algorithm on detecting ground image feature points is shown in Figure 3.
It is clearly seen that the number of feature points in Figure 3 is still numerous. In the next stage of feature matching, mismatches are easy to occur. In fact, it does not require too many matching feature points to obtain the displacement of the pixel points at two adjacent moments. Therefore, the RANSAC algorithm [22] filters the matching points and extracts the feature points with high matching accuracy.
The RANSAC algorithm aims to find an optimal homography matrix L (matrix size is 3 × 3) to filter out mismatched pairs. The number of data points that satisfy the matrix is maximized by searching for the optimal parameter matrix, and L 33 = 1 is usually used to normalize the matrix. Since the homography matrix has 8 unknown parameters, at least 8 linear equations need to be solved. Corresponding to the point position information, a set of point pairs can list two equations, so at least 4 sets of matching point pairs are included, which is shown in Equation (7):
s x y 1 = l 11   l 12   l 13 l 21   l 22   l 23 l 31   l 32   l 33 x y 1
where ( x ,   y ) represents the position of the corner point of the target image, x , y is the position of the corner point of the scene image, and s is the scale parameter.
The RANSAC algorithm randomly selects 4 samples from the matching data set and ensures that the 4 samples are not collinear, thereby calculating the homography matrix. Then, this model is used to test all the data and calculate the number of data points that satisfy the model and the projection error (that is, the cost function). If this model is optimal, the corresponding cost function is the smallest, which is shown in Equation (8):
i = 0 n ( x i l 11 x i + l 12 y i + l 13 l 31 x i + l 32 y i + l 33 ) 2 + ( y i l 21 x i + l 22 y i + l 23 l 31 x i + l 32 y i + l 33 ) 2
The matching results of the inter-frame images filtered by the RANSAC algorithm are shown in Figure 4.
Figure 4 shows the matching of the inter-frame ground image feature points. The figure shows the high accuracy of the matching points, and there is no over-matching. According to the pixel coordinates of the matching feature points of the inter-frame images, the displacement of the pixel points of the ground images can be calculated. After that, the image displacement of the inter-frame matching feature points in the world coordinate system can be obtained by the method of this paper.
The geometric relationship and correspondence between the feature points of the ground image are used to calculate the actual velocity of the tractor. A pinhole camera model is adopted, as shown in Figure 5 (assuming that the camera distortion is zero), to establish the scene connection between the two-dimensional pixel coordinate system and the three-dimensional world coordinate system. P is a point in the world coordinate system of the three-dimensional space, and p is the two-dimensional projection point of the corresponding pixel coordinate system.
The camera model mentioned above is used to convert a point from the pixel coordinate system to the world coordinate system, which is defined by Equation (9):
Z c [ u v 1 ] = [ f x 0 u 0 0 0 f y v 0 0 0 0 1 0 ] [ R T 0 1 ] [ X w Y w Z w 1 ]
where Z c is the scale factor, which represents the depth information; u ,   v are the pixel coordinates; f x ,   f y are the unit length of a pixel in the x and y directions of the pixel coordinate system, mm; u 0 , v 0 are the horizontal and vertical pixel numbers of the difference between the center pixel coordinate of the image and the pixel coordinate of the image origin, respectively; R and T are the rotation matrix and translation vector of the camera coordinate system relative to the world coordinate system; X w , Y w and Z w represent the coordinates of the world coordinate system, define Z w = 0.
In Equation (9), [ f x 0 u 0 0 0 f y v 0 0 0 0 1 0 ] is the camera internal parameter matrix and [ R T 0 1 ] is the camera external parameter matrix.
Equation (10), as shown below, is rewritten from Equation (9):
[ u v 1 ] = H [ X w Y w 0 1 ]
where H is the homography matrix, H = 1 Z c [ f x 0 u 0 0 0 f y v 0 0 0 0 1 0 ] [ R T 0 1 ] .
According to Equation (10), Zhang Zhengyou’s calibration method [23,24] is utilized to calibrate the monocular camera with the MATLAB toolbox. Since the distance between the camera and the ground is a fixed value, the calibration board is placed horizontally on the ground to obtain the camera internal parameter matrix and external parameter matrix. Then, a point is transformed from the pixel coordinate system into the world coordinate system. In this way, the displacement of the inter-frame images in the world coordinate system can be calculated. The wheel’s actual velocity is calculated by combining the time difference of the inter-frame images. It should be noted that the method proposed in this work assumes that the ground is flat.

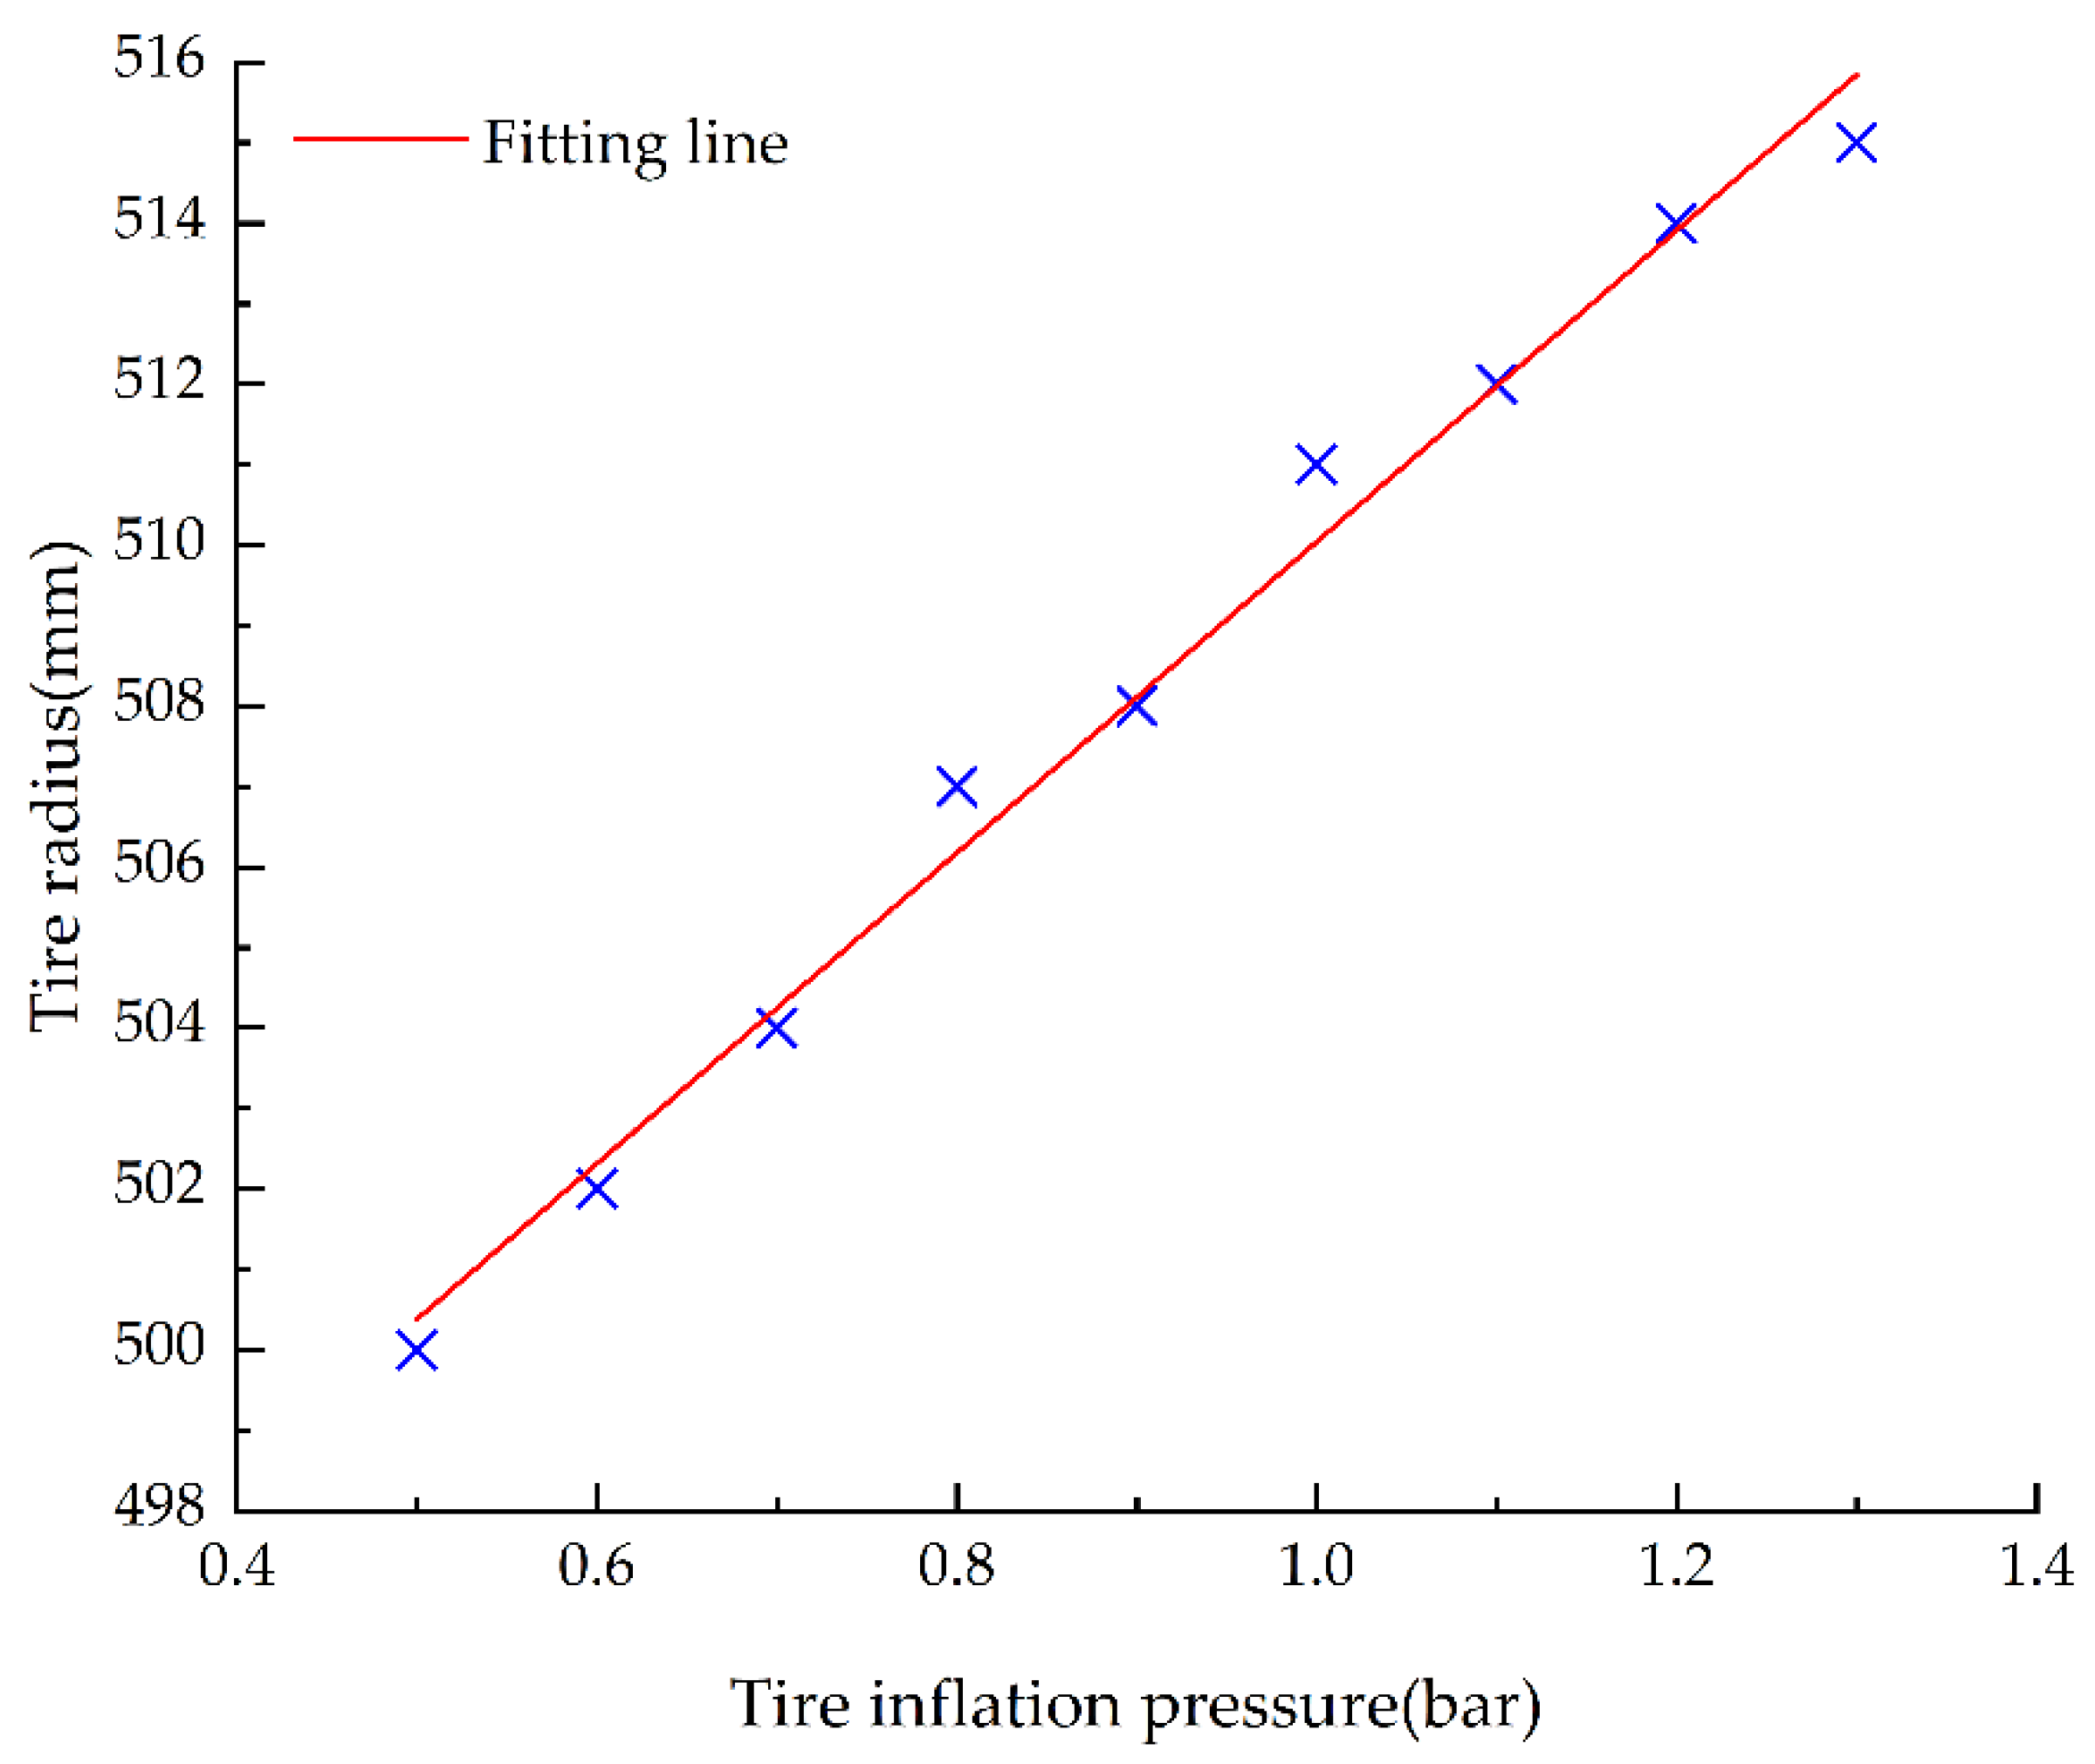
2.4. Estimation of the Tire Radius Based on Tire Inflation Pressure

Due to the change of tires’ load capacity and ambient temperature, the tire inflation pressure of the tractor will change, and the tires’ radii will change accordingly. For measuring the tire radius in real-time, the tire inflation pressure is monitored by tire pressure sensors. By inflating or deflating the tires, increasing or decreasing the load, the tire inflation pressure was varied from 0.5 bar to 1.4 bar, with the corresponding tire radius measured every 0.1 bar. Then, 9 corresponding tire radii are obtained, and the relationship between the tire inflation pressure and the tire radius is calibrated to obtain the accurate tire radius. The relationship between tire inflation pressure and tire radius is shown in Figure 6. It is evident that tire inflation pressure and tire radius seem to be linear in nature within a specific range. Therefore, the least squares method is used to fit these discrete points, and the regression line equation as shown in Equation (11) is obtained:
R = 19.33 × P + 490.71 ,   P { 0.4 , 1.4 }
where P is the tire inflation pressure, bar; R is the tire radius, mm.
With this tire inflation pressure and tire radius model, the tire radius can be measured indirectly. The two rotary encoders installed in the center of the wheel hubs can be used as sensors, then the wheel’s theoretical velocity is calculated by the stm32 microcontroller. Furthermore, the velocity messages are sent to the PC through the Bluetooth serial port for real-time acquisition. Correspondingly, the wheel’s actual velocity measured by GPS is displayed in the host computer through the serial port.
According to the above analysis, the comprehensive system diagram of the slip ratio measurement method in this paper is shown in Figure 7. The inter-frame images collected by the camera are performed through the ORB algorithm for feature points matching, and the RANSAC algorithm filters the matched feature points to obtain more accurate and stable feature points matching images. Then, the displacement of the inter-frame images in the world coordinate system is obtained through the homography matrix calibrated based on the camera, and the actual velocity of the tractor is obtained by the time difference between the inter-frame images. The tire inflation pressures are monitored by the tire pressure sensors, then the tire radii are obtained, and the theoretical velocity of the tractor is calculated in combination with the angular velocity measured by the encoders. Finally, the slip ratio of the tractor driving wheels is calculated by Equation (1).

2.5. Experimental Setup

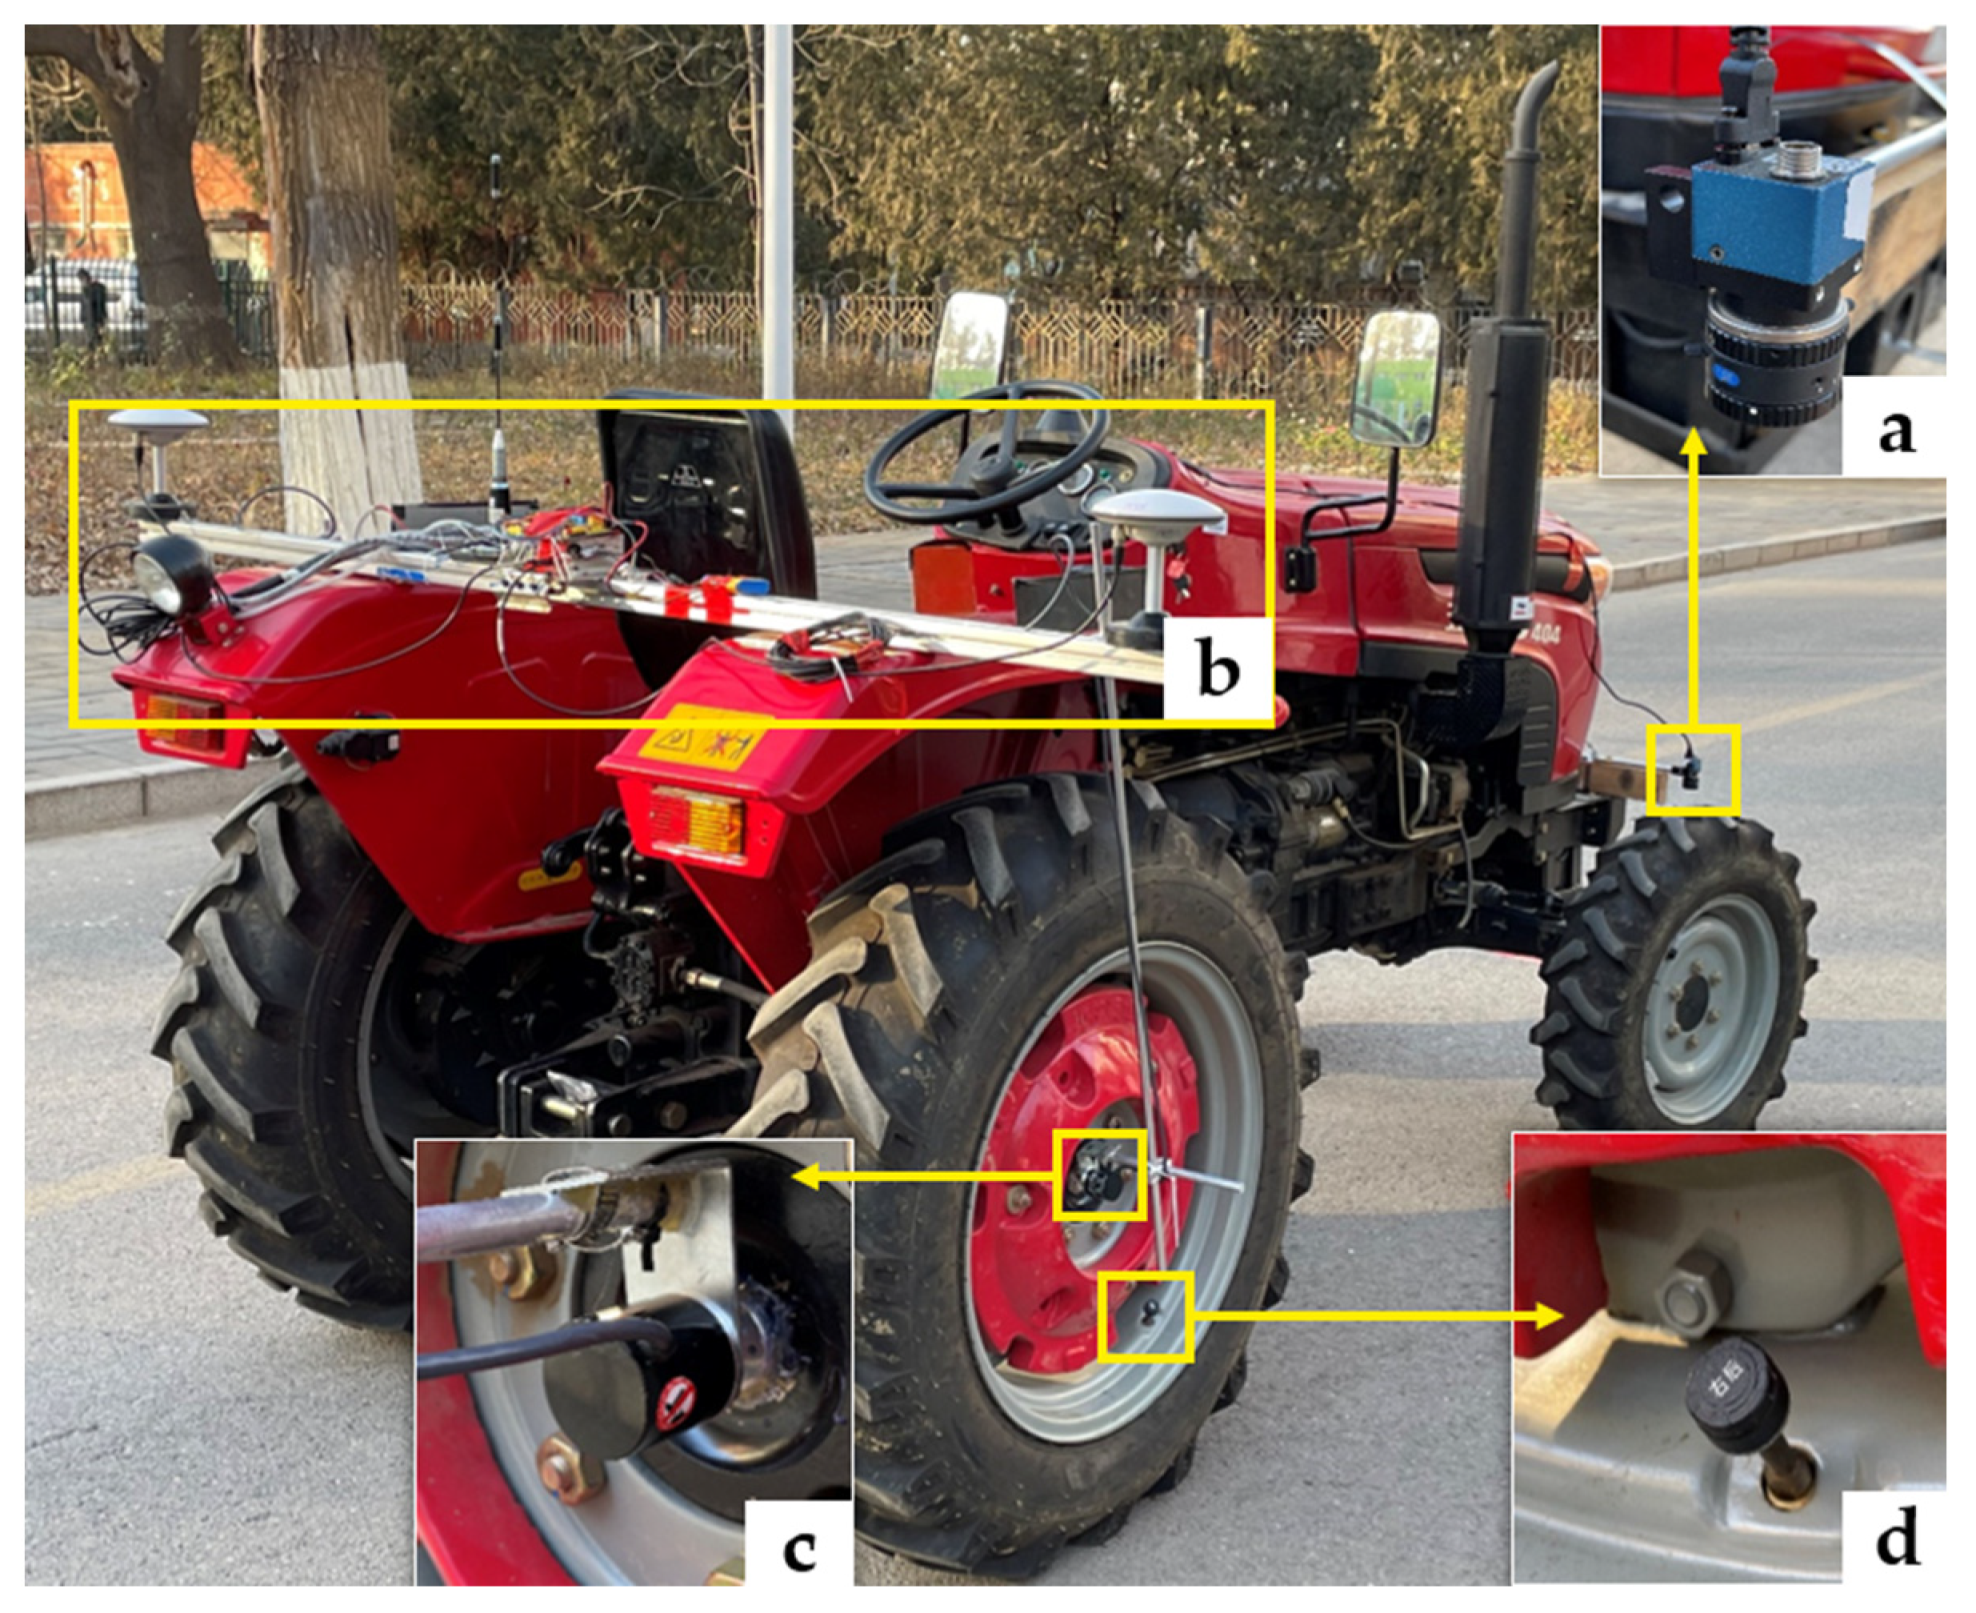
2.5.1. Platform of the Experimental Tractor

The experimental research was carried out on a tractor with the model of TS404 (WUZHENG, Rizhao, China), where the slip ratio can be measured accurately. The specifications of the experimental tractor are listed in Table 2.
The experimental tractor, shown in Figure 8, is equipped with the monocular camera, GPS antenna receivers, tire pressure sensors and rotary encoders. The two rear driving wheels are equipped with incremental rotary encoders, and the sampling frequency of the incremental rotary encoder is 20 Hz. The accurate tire radius is obtained by the pre-calibrated tire inflation pressure-tire radius model, and then the wheel’s theoretical velocity is measured. The average of the measured theoretical velocity by the two encoders is regarded as the final measured theoretical velocity of the tractor driving wheels. The tire inflation pressure is maintained at 0.6 bar or 1.0 bar during the experiment. The monocular camera is fixed on the experimental tractor as a vision sensor, with a sampling frequency of 30 fps to capture ground images. The GPS antenna receivers, which are placed at the tractor, provide velocity measurements to validate the reliability for measuring the actual velocity based on machine vision, then are combined with the data obtained by the theoretical velocity acquisition system to calculate the slip ratio for tractor driving wheels.

2.5.2. Experimental Environment

The sensors used in the experimental procedure are installed in the appropriate positions of the tractor to obtain useful sensor information. Image processing is performed by a portable computer, and the computer’s main configurations are Intel Core i5-7300HQ CPU, RAM 8 GB, GTX 1050 Ti graphics card, 4 GB video memory, Windows 10. Image acquisition and processing are developed in the Visual Studio 2019 environment using C + + language. This experiment was carried out on the campus of China Agricultural University. The ground types are the asphalt ground and the soft soil ground, respectively. Soil properties of the experimental soft soil ground are shown in Table 3. The distance of the experimental ground sections (both of the asphalt ground and the soft soil ground) are about 15 m. The tractor is driven under eight experimental conditions for slip ratio measurements.

2.5.3. Experimental Schemes

The slip ratio is measured under eight experimental schemes to fully validate the effectiveness of the measuring method proposed in this work. The eight experimental schemes are shown in Table 4. In the experiments, two different grounds are first determined, and then the slip ratio is measured at two different tractor speeds and tire inflation pressures. The driver ensures that the velocity of the tractor is basically constant, and the target path is close to a straight line in each test.

3. Results and Discussions

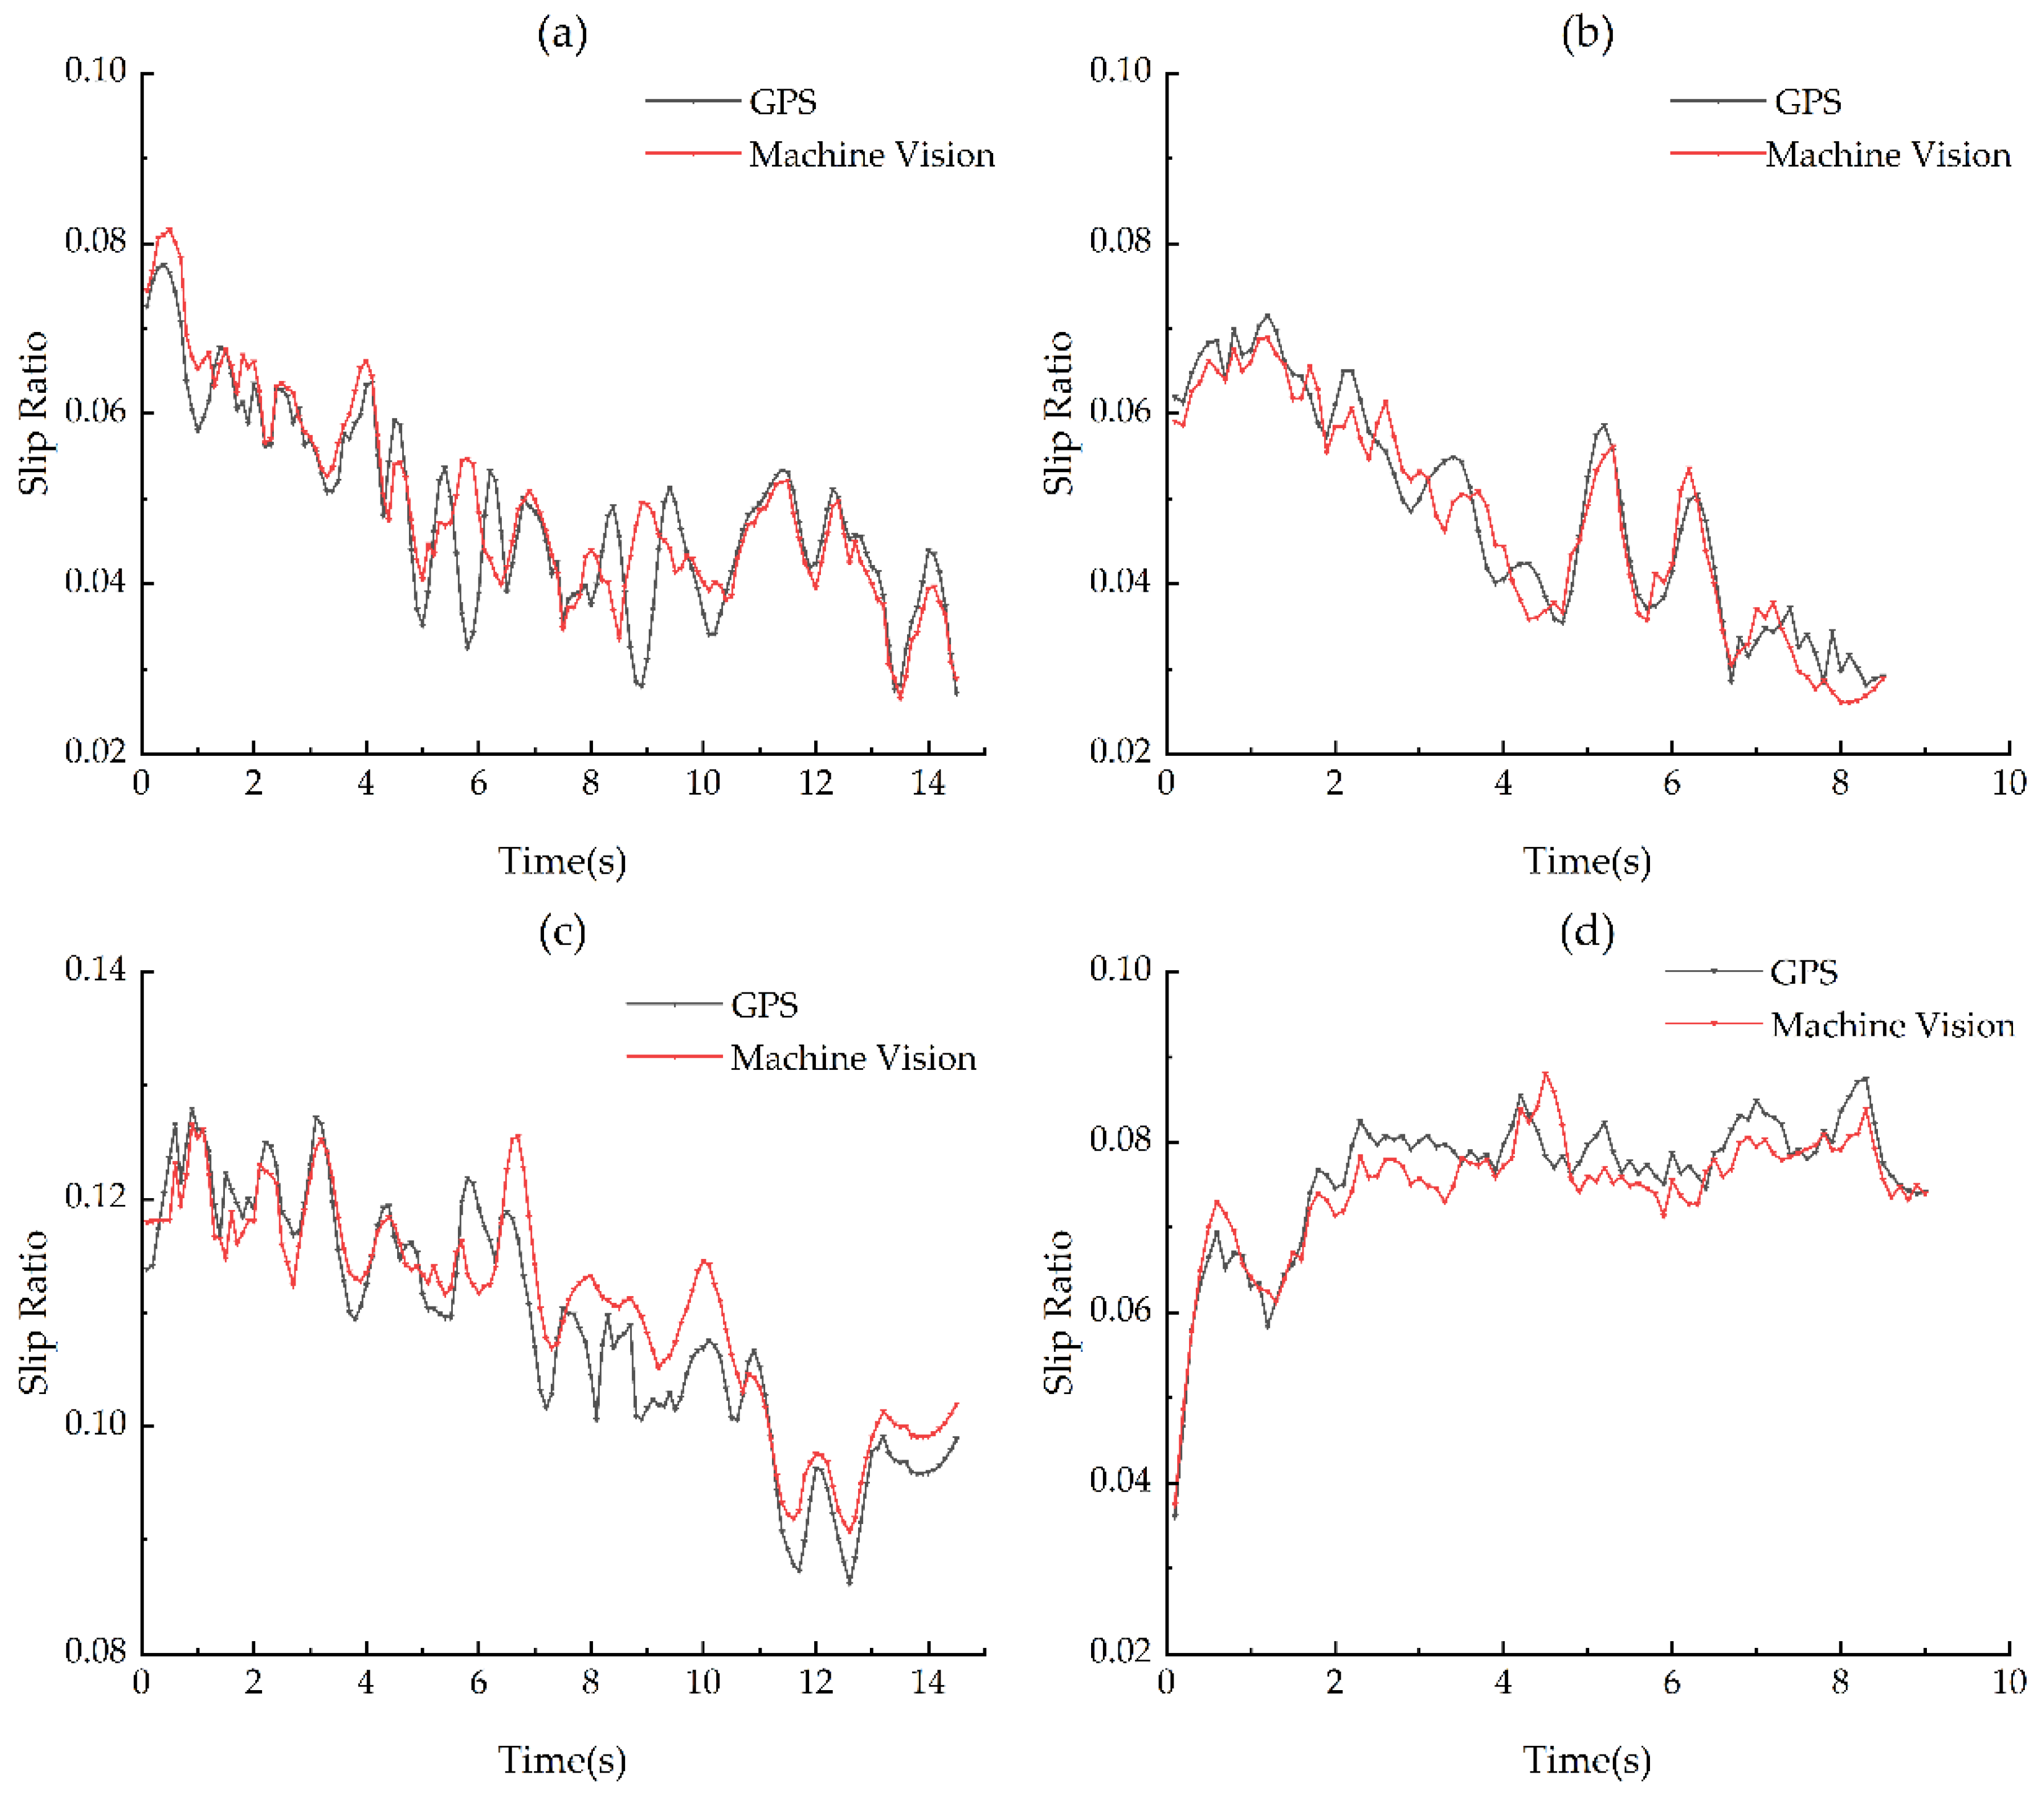
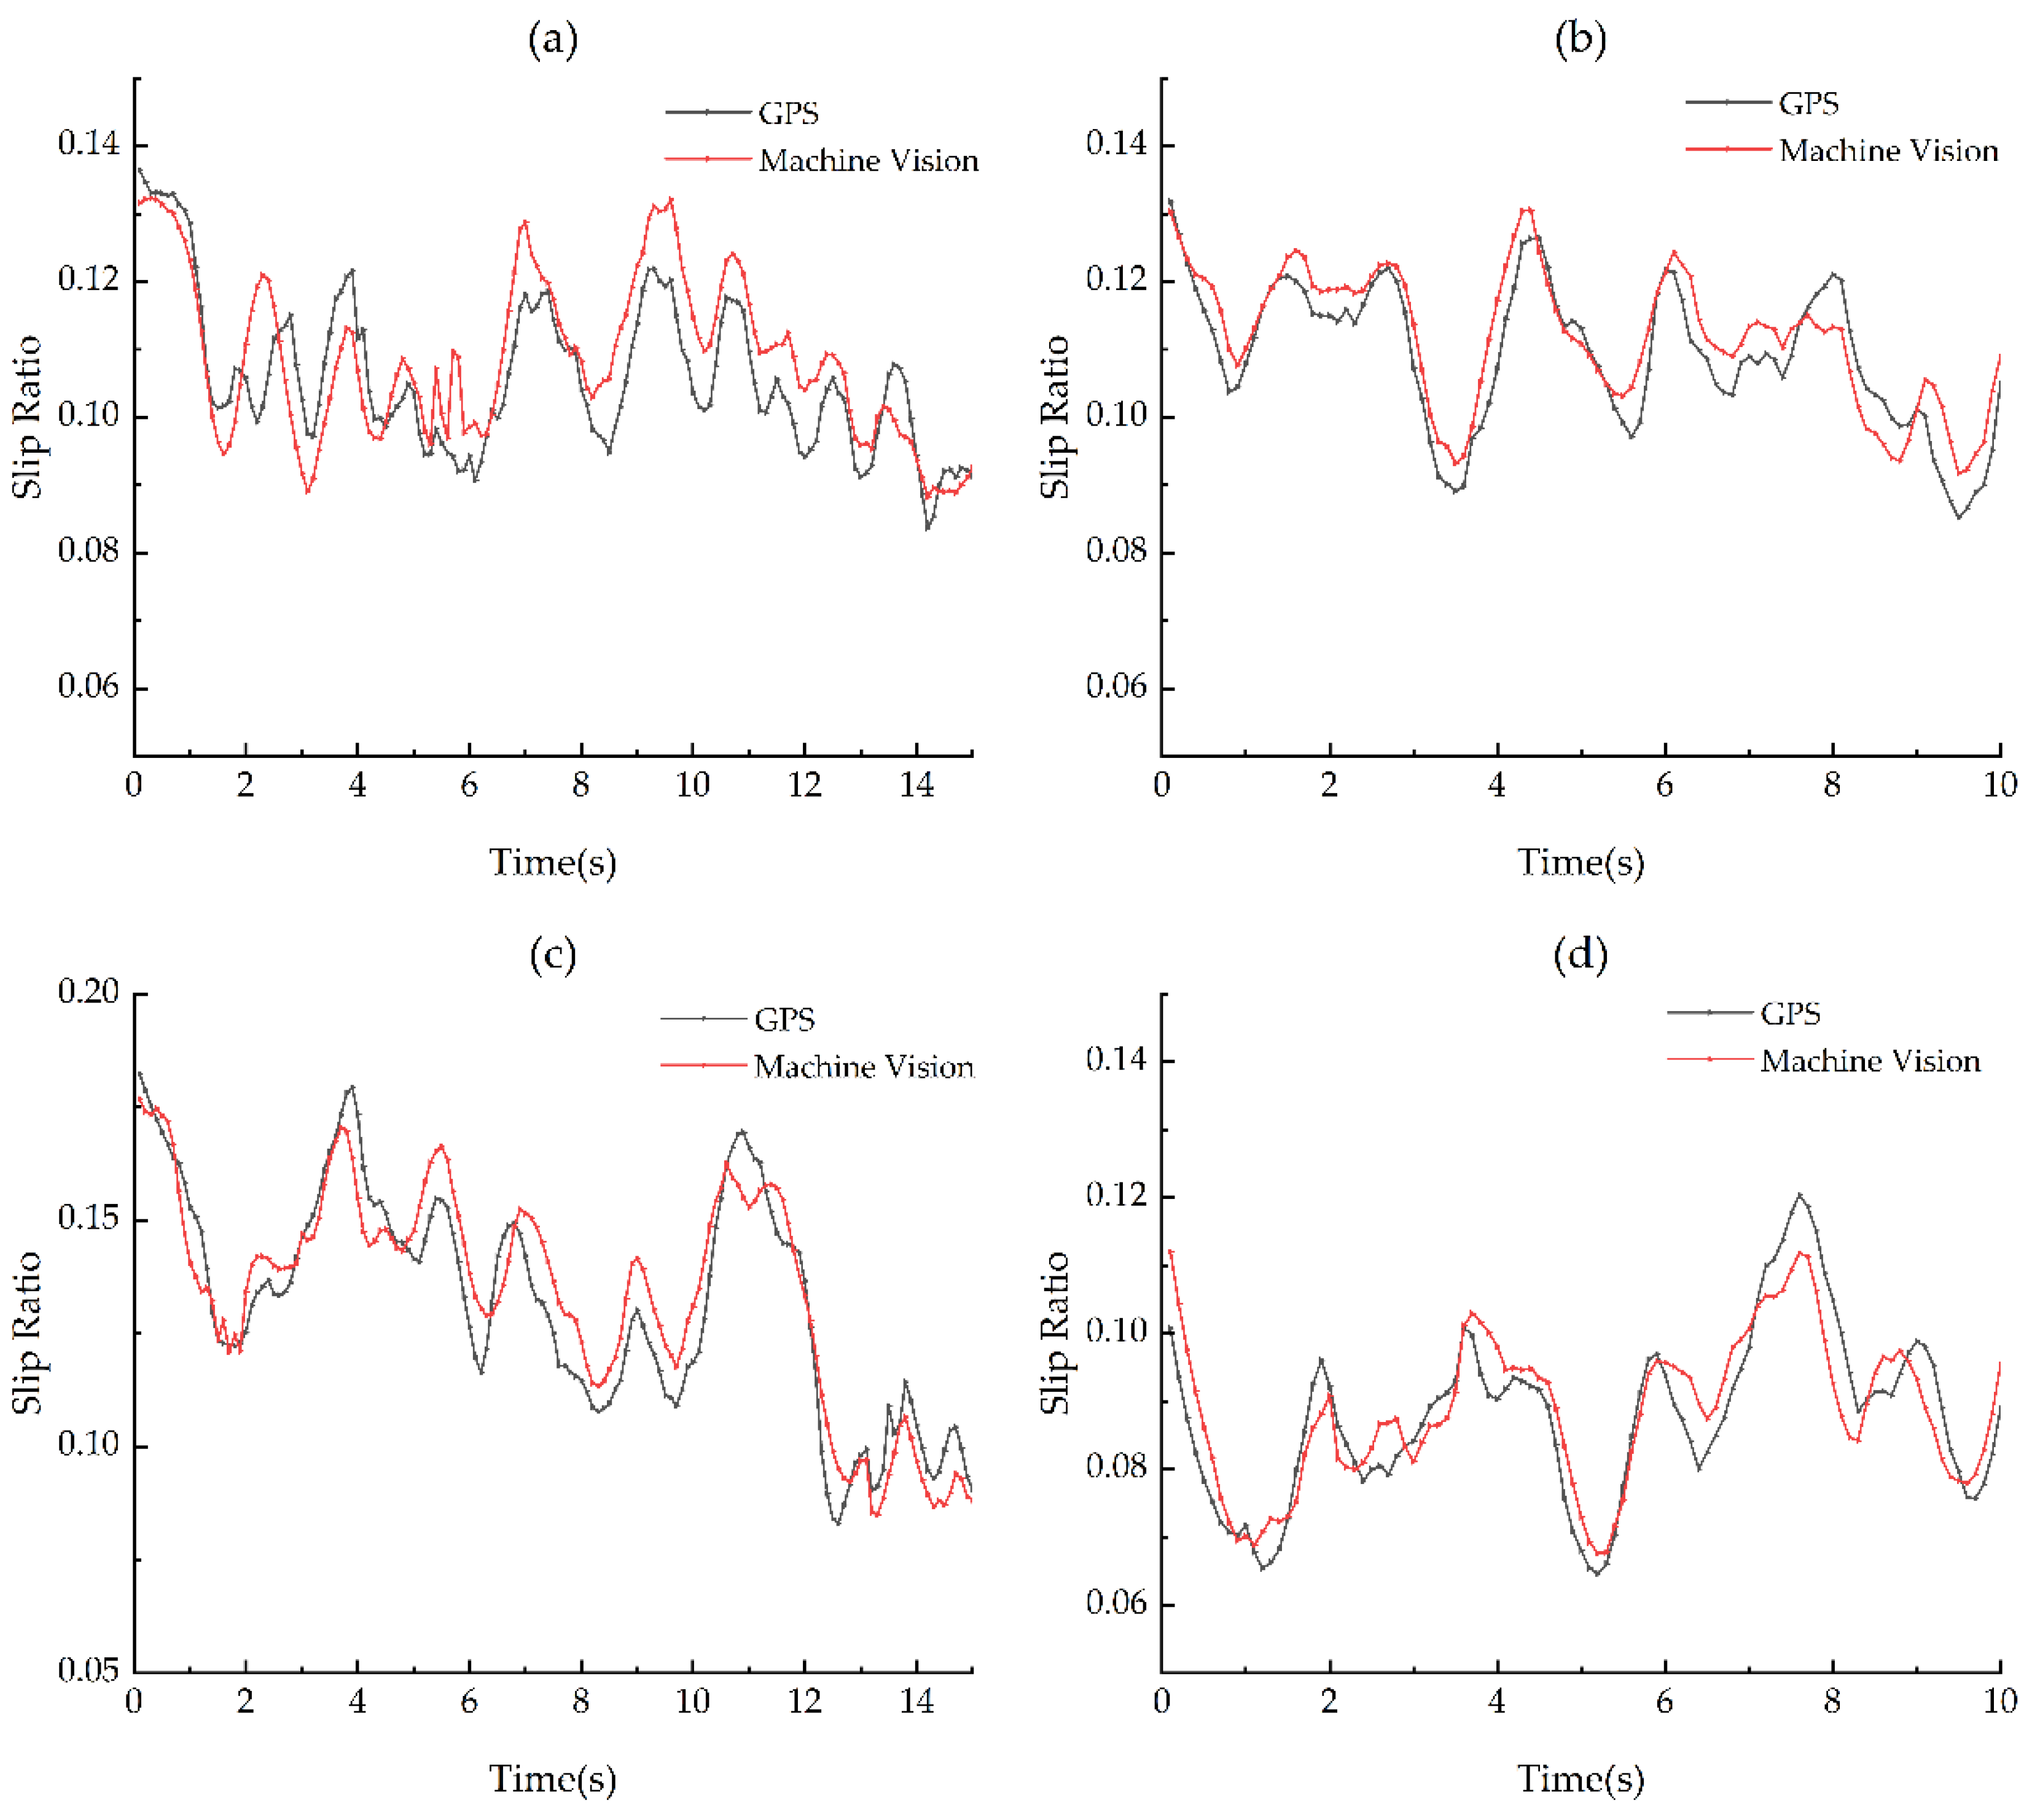
3.1. Experimental Results of Measuring the Slip Ratio for Tractor Driving Wheels

Figure 9 and Figure 10 show the measurement results of the slip ratio for tractor driving wheels on the asphalt ground and the soft soil ground, respectively. In the results, the machine vision method and the GPS method are used to obtain the slip ratio for tractor driving wheels under four different experimental schemes, which are low velocity and low tire inflation pressure, high velocity and low tire inflation pressure, low velocity and high tire inflation pressure, and high velocity and high tire inflation pressure.
In Figure 9, slippage occurs during when the experimental tractor was driven on the asphalt ground. In Figure 9a–d, the mean absolute errors of the slip ratio measured by the machine vision method relative to that by the GPS method are 0.39%, 0.30%, 0.34% and 0.28%, respectively. It is clearly seen that the mean absolute error of the machine vision method relative to the GPS method measured slip ratio is miniscule. The slip ratio measured by the machine vision method and the GPS method is basically the same under the four different working conditions. The absolute error of the slip ratio measured by the two methods in detail is shown in Table 5. It can be found that the standard deviations of the slip ratio’s absolute errors obtained by the two methods are less than 0.0042.
Figure 10 shows the measurement results of the slip ratio for tractor driving wheels on the soft soil ground. In Figure 10a–d, the mean absolute errors of the slip ratio measured by the machine vision method relative to that by the GPS method are 0.64%, 0.43%, 0.75% and 0.49%, respectively. Different from the working condition of the asphalt ground, the slip ratio for tractor driving wheels on the soft soil ground is larger. however, the slip ratio for tractor driving wheels measured by the machine vision method matches well with that by the GPS method. In addition, in Table 6, it can be found that the standard deviations of the slip ratio’s absolute errors obtained by the two methods are less than 0.0044. The standard deviations of the slip ratio’s absolute errors are relatively small, indicating that the absolute errors in the distribution near the mean absolute error are more concentrated.

3.2. Discussions

The camera can be applied at a lower price compared to the GPS measurement method, which is an application advantage. At the same time, since the camera is not in direct contact with the ground, the interference of the external environment to the camera is less, so that the working performance of the camera is more stable. The machine vision measurement method can measure the slip ratio on the asphalt ground and soft soil ground, which means that the machine vision measurement method is not limited to a specific ground. As long as significant feature points can be extracted from the ground scene, slip ratio can be measured. This paper assumed that the terrain surface was mainly flat, and the distance from the camera’s center to the ground was assumed to be a constant value. Since height was a sensitive parameter in camera calibration, uneven terrain and changes in height would cause motion measurement errors. This is a limitation of the measurement method in this paper. In future work, we will measure the change of the working height of the camera, then correct the velocity measurement errors caused by uneven ground or pits, and the accuracy of the machine vision method for measuring the slip ratio will be further improved.

4. Conclusions

This paper presented a measuring method of the slip ratio for tractor driving wheels based on machine vision. A monocular camera was attached to the tractor, vertically shooting the terrain for capturing ground images. Furthermore, the ORB algorithm was utilized to match the feature points of the inter-frame ground images. A homography matrix transformation based on camera calibration was developed to transform a point from the pixel coordinate system into the world coordinate system. Thus, the actual velocity of the tractor was accurately measured. In addition, this paper proposed a method to determine the tire radius of the driving wheels by calibrating the relationship between tire radius and tire inflation pressure in advance. Then, the tire radius was combined with the angular velocity acquired by encoders to improve the accuracy of the theoretical velocity measurement. The proposed slip ratio measurement method was validated on the experimental tractor under eight working conditions. Experiments showed that the mean absolute errors in measuring slip ratio under various experimental conditions by the machine vision method were less than 0.75%, and the maximum of the absolute errors was not more than 2.22%. The method for measuring the slip ratio proposed in this paper can be applied to different types of ground, and can accurately measure the slip ratio of tractors in various working scenarios.
However, the image processing method needs further study to improve its adaptability to the environment. When the brightness of the light source is insufficient, the overall brightness of the image can be improved by means of image enhancement, such as histogram specification.

Author Contributions

Conceptualization, S.Z. and Z.Z.; methodology, S.Z.; software, S.Z., L.W., and Y.C.; validation, S.Z., Y.L. and X.D.; formal analysis, Z.Z.; investigation, S.Z. and L.W.; resources, Z.Z. and E.M.; data curation, S.Z., Y.L. and X.D.; writing—original draft preparation, S.Z.; writing—review and editing, S.Z. and Z.Z.; visualization, S.Z.; supervision, S.Z.; project administration, Z.Z. and E.M.; funding acquisition, Z.Z. and E.M. All authors have read and agreed to the published version of the manuscript.

Funding

This research was funded by the National Natural Science Foundation of China (NSFC), grant number 52072407.

Institutional Review Board Statement

Not applicable.

Informed Consent Statement

Not applicable.

Data Availability Statement

The data presented in this study are available on request from the corresponding author.

Acknowledgments

We thank the anonymous reviewers for their hard work and critical comments, allowing us to improve the quality of this manuscript.

Conflicts of Interest

The authors declare no conflict of interest.

References

  1. Zhang, B.; Jin, P.; Qiao, H.; Hayat, T.; Alsaedi, A.; Ahmad, B. Exergy analysis of Chinese agriculture. Ecol. Indic. 2019, 105, 279–291. [Google Scholar] [CrossRef]
  2. Goering, C.E. A century of tractor development: 1907–2007. Trans. ASABE 2008, 51, 379–383. [Google Scholar] [CrossRef]
  3. Żebrowski, J. Traction efficiency of a wheeled tractor in construction operations. Autom. Constr. 2010, 19, 100–108. [Google Scholar] [CrossRef]
  4. Zoz, F.M. Predicting tractor field performance. Trans. ASAE 1972, 15, 0249–0255. [Google Scholar] [CrossRef]
  5. Pranav, P.K.; Pandey, K.P.; Tewari, V.K. Digital wheel slipmeter for agricultural 2WD tractors. Comput. Electron. Agric. 2010, 73, 188–193. [Google Scholar] [CrossRef]
  6. Raheman, H.; Jha, S.K. Wheel slip measurement in 2WD tractor. J. Terramech. 2007, 44, 89–94. [Google Scholar] [CrossRef]
  7. Tompkins, F.D.; Hart, W.E.; Freeland, R.S.; Wilkerson, J.B.; Wilhelm, L.R. Comparison of tractor ground speed measurement techniques. Trans. ASAE 1988, 31, 0369–0374. [Google Scholar] [CrossRef]
  8. Miller, S.L.; Youngberg, B.; Millie, A.; Schweizer, P.; Gerdes, J.C. Calculating longitudinal wheel slip and tire parameters using GPS velocity. In Proceedings of the 2001 American Control Conference, Arlington, VA, USA, 25–27 June 2001. [Google Scholar]
  9. Bevly, D.M.; Gerdes, J.C.; Wilson, C.; Zhang, G. The use of GPS based velocity measurements for improved vehicle state estimation. In Proceedings of the 2000 American Control Conference, Chicago, IL, USA, 28–30 June 2000. [Google Scholar]
  10. Ward, C.C.; Iagnemma, K. A dynamic-model-based wheel slip detector for mobile robots on outdoor terrain. IEEE Trans. Robot. 2008, 24, 821–831. [Google Scholar] [CrossRef]
  11. Gonzalez, R.; Apostolopoulos, D.; Iagnemma, K. Slippage and immobilization detection for planetary exploration rovers via machine learning and proprioceptive sensing. J. Field Robot. 2018, 35, 231–247. [Google Scholar] [CrossRef]
  12. Helmick, D.M.; Yang, C.; Clouse, D.S.; Bajracharya, M.; Matthies, L.H.; Roumeliotis, S.I. Slip compensation for a Mars rover. In Proceedings of the 2005 IEEE/RSJ International Conference on Intelligent Robots and Systems, Edmonton, AB, Canada, 2–6 August 2005. [Google Scholar]
  13. Nister, D.; Naroditsky, O.; Bergen, J. Visual odometry. In Proceedings of the 2004 IEEE Computer Society Conference on Computer Vision and Pattern Recognition, Washington, DC, USA, 27 June–2 July 2004. [Google Scholar]
  14. Ding, L.; Gao, H.; Deng, Z.; Yoshida, K.; Nagatani, K. Slip ratio for lugged wheel of planetary rover in deformable soil: Definition and estimation. In Proceedings of the 2009 IEEE/RSJ International Conference on Intelligent Robots and Systems, St. Louis, MO, USA, 11–15 October 2009. [Google Scholar]
  15. Song, X.; Song, Z.; Seneviratne, L.D.; Althoefer, K. Optical flow-based slip and velocity estimation technique for unmanned skid-steered vehicles. In Proceedings of the 2008 IEEE/RSJ International Conference on Intelligent Robots and Systems, IROS, Nice, France, 22–26 September 2008. [Google Scholar]
  16. Song, X.; Seneviratne, L.; Althoefer, K. A vision based wheel slip estimation technique for mining vehicles. IFAC Proc. Vol. 2009, 42, 179–184. [Google Scholar] [CrossRef]
  17. Botha, T.R.; Schalk Els, P. Digital image correlation techniques for measuring tyre–road interface parameters: Part 2—Longitudinal tyre slip ratio measurement. J. Terramechanics 2015, 61, 101–112. [Google Scholar] [CrossRef] [Green Version]
  18. Zhang, L.; Feng, S.; Shan, H.; Wang, G. Tractor-trailer-train braking time sequence detection based on monocular vision. Adv. Mech. Eng. 2021, 13, 1–13. [Google Scholar] [CrossRef]
  19. Chen, J.; Jing, L.; Hong, T.; Liu, H.; Glowacz, A. Research on a Sliding Detection Method for an Elevator Traction Wheel Based on Machine Vision. Symmetry 2020, 12, 1158. [Google Scholar] [CrossRef]
  20. Wong, J.Y. Theory of Ground Vehicles, 4th ed.; John Wiley & Sons: Hoboken, NJ, USA, 2008. [Google Scholar]
  21. Rublee, E.; Rabaud, V.; Konolige, K.; Bradski, G. ORB: An efficient alternative to SIFT or SURF. In Proceedings of the 2011 International Conference on Computer Vision, Barcelona, Spain, 6–13 November 2011. [Google Scholar]
  22. Fischler, M.A.; Bolles, R.C. Random sample consensus: A paradigm for model fitting with applications to image analysis and automated cartography. Commun. ACM 1981, 24, 381–395. [Google Scholar] [CrossRef]
  23. Zhang, Z. Flexible camera calibration by viewing a plane from unknown orientations. In Proceedings of the Seventh IEEE International Conference on Computer Vision, Kerkyra, Greece, 20–27 September 1999. [Google Scholar]
  24. Zhang, Z. A flexible new technique for camera calibration. IEEE Trans. Pattern Anal. Mach. Intell. 2000, 22, 1330–1334. [Google Scholar] [CrossRef] [Green Version]
Figure 1. The calculation process of the wheel forward displacement.
Agriculture 12 00292 g001
Figure 2. ROI (inside the red rectangle) area cropped in the original image.
Agriculture 12 00292 g002
Figure 3. Feature points were detected in the inter-frame images. (a) Image feature points of the previous frame. (b) Image feature points of the next frame.
Agriculture 12 00292 g003
Figure 4. Matching results of the inter-frame ground images.
Agriculture 12 00292 g004
Figure 5. Monocular camera pinhole model.
Agriculture 12 00292 g005
Figure 6. The relationship between tire inflation pressure and tire radius within a specific range of tire inflation pressure, a tire radius is calibrated every 0.1 bar. Then a linear model (Redline) of tire inflation pressure and tire radius is fitting.
Agriculture 12 00292 g006
Figure 7. System diagram of measuring slip ratio for tractor drive wheels.
Agriculture 12 00292 g007
Figure 8. The experimental tractor is equipped with sensors. In this figure, (a) is a monocular camera, (b) are GPS antenna receivers, (c) is a rotary encoder, and (d) is a tire pressure monitor.
Agriculture 12 00292 g008
Figure 9. The results of the slip ratio for tractor driving wheels on the asphalt ground, where (a) is under the working condition of low velocity and low tire inflation pressure, (b) is under the working condition of high velocity and low tire inflation pressure, (c) is under the working condition of low velocity and high tire inflation pressure, (d) is under the working condition of high velocity and high tire inflation pressure.
Agriculture 12 00292 g009
Figure 10. The results of the slip ratio for tractor driving wheels on the soft soil ground, where (a) is under the working condition of low velocity and low tire inflation pressure, (b) is under the working condition of high velocity and low tire inflation pressure, (c) is under the working condition of low velocity and high tire inflation pressure, (d) is under the working condition of high velocity and high tire inflation pressure.
Agriculture 12 00292 g010
Table 1. Parameters of the monocular camera used.
ParametersValue
Resolution (pixel × pixel)1292 × 964
Focal length (mm)8
SpectrumColorful
Exposure (ms)2
Frame rate (f·s−1)30
Pixel size ( μ m   ×   μ m )3.75 × 3.75
Table 2. The specifications of the tractor used in the experiment.
ParametersValue
Tractor modelTS404
Dimensions (length × width × height)/mm3410 × 1500 × 2120
Wheelbase/mm1948
Minimum ground clearance/mm350
Wheel travel system7.5–16/11.2–28
Minimum turning radius/m3.3
Rated power/kW29.4
Table 3. Soil properties of the experimental soft soil ground.
Soil TextureMoisture ContentCone Index (kPa)Shear Strength (kPa)
Loam13.85%161 67
Table 4. Experiments of measuring the slip ratio for tractor driving wheels under multiple working conditions.
Type of GroundVelocity RangeTire Inflation Pressure
Asphalt groundLow velocity
(0.5~1 m/s)
Low tire inflation pressure (0.6 bar)
Soft soil groundHigh velocity
(1.5~2 m/s)
High tire inflation pressure (1.0 bar)
Table 5. In various working conditions of the asphalt ground, the absolute errors of the slip ratio for the tractor driving wheels were obtained by comparing the machine vision method with the GPS method.
Working ConditionsMean Absolute ErrorMaximum of
Absolute Error
Minimum of
Absolute Error
Standard Deviation of Absolute Error
Low velocity and low tire inflation pressure0.00390.022200.0042
High velocity and low tire inflation pressure0.00300.008100.0018
Low velocity and high tire inflation pressure0.00340.011700.0023
High velocity and high tire inflation pressure0.00280.00970.00020.0020
Table 6. In various working conditions of the soft soil ground, the absolute errors of the slip ratio for the tractor driving wheels were obtained by comparing the machine vision method with the GPS method.
Working ConditionsMean Absolute ErrorMaximum of
Absolute Error
Minimum of
Absolute Error
Standard Deviation of Absolute Error
Low velocity and low tire inflation pressure0.00640.01990.00020.0040
High velocity and low tire inflation pressure0.00430.010900.0027
Low velocity and high tire inflation pressure0.00750.018500.0044
High velocity and high tire inflation pressure0.00490.01230.00020.0030
Publisher’s Note: MDPI stays neutral with regard to jurisdictional claims in published maps and institutional affiliations.

