
Optimizing Irrigation Strategies to Improve Water Use Efficiency of Cotton in Northwest China Using RZWQM2

 , , and
Abstract
:1. Introduction
2. Materials and Methods
2.1. Decision Support System for Irrigation Scheduling (DSSIS)
2.2. Field Experiments
2.3. Field Measurements
2.4. RZWQM2 Description and Simulations
2.5. Irrigation Scenario and Economic Analysis
2.6. Model Performance Evaluation
3. Results
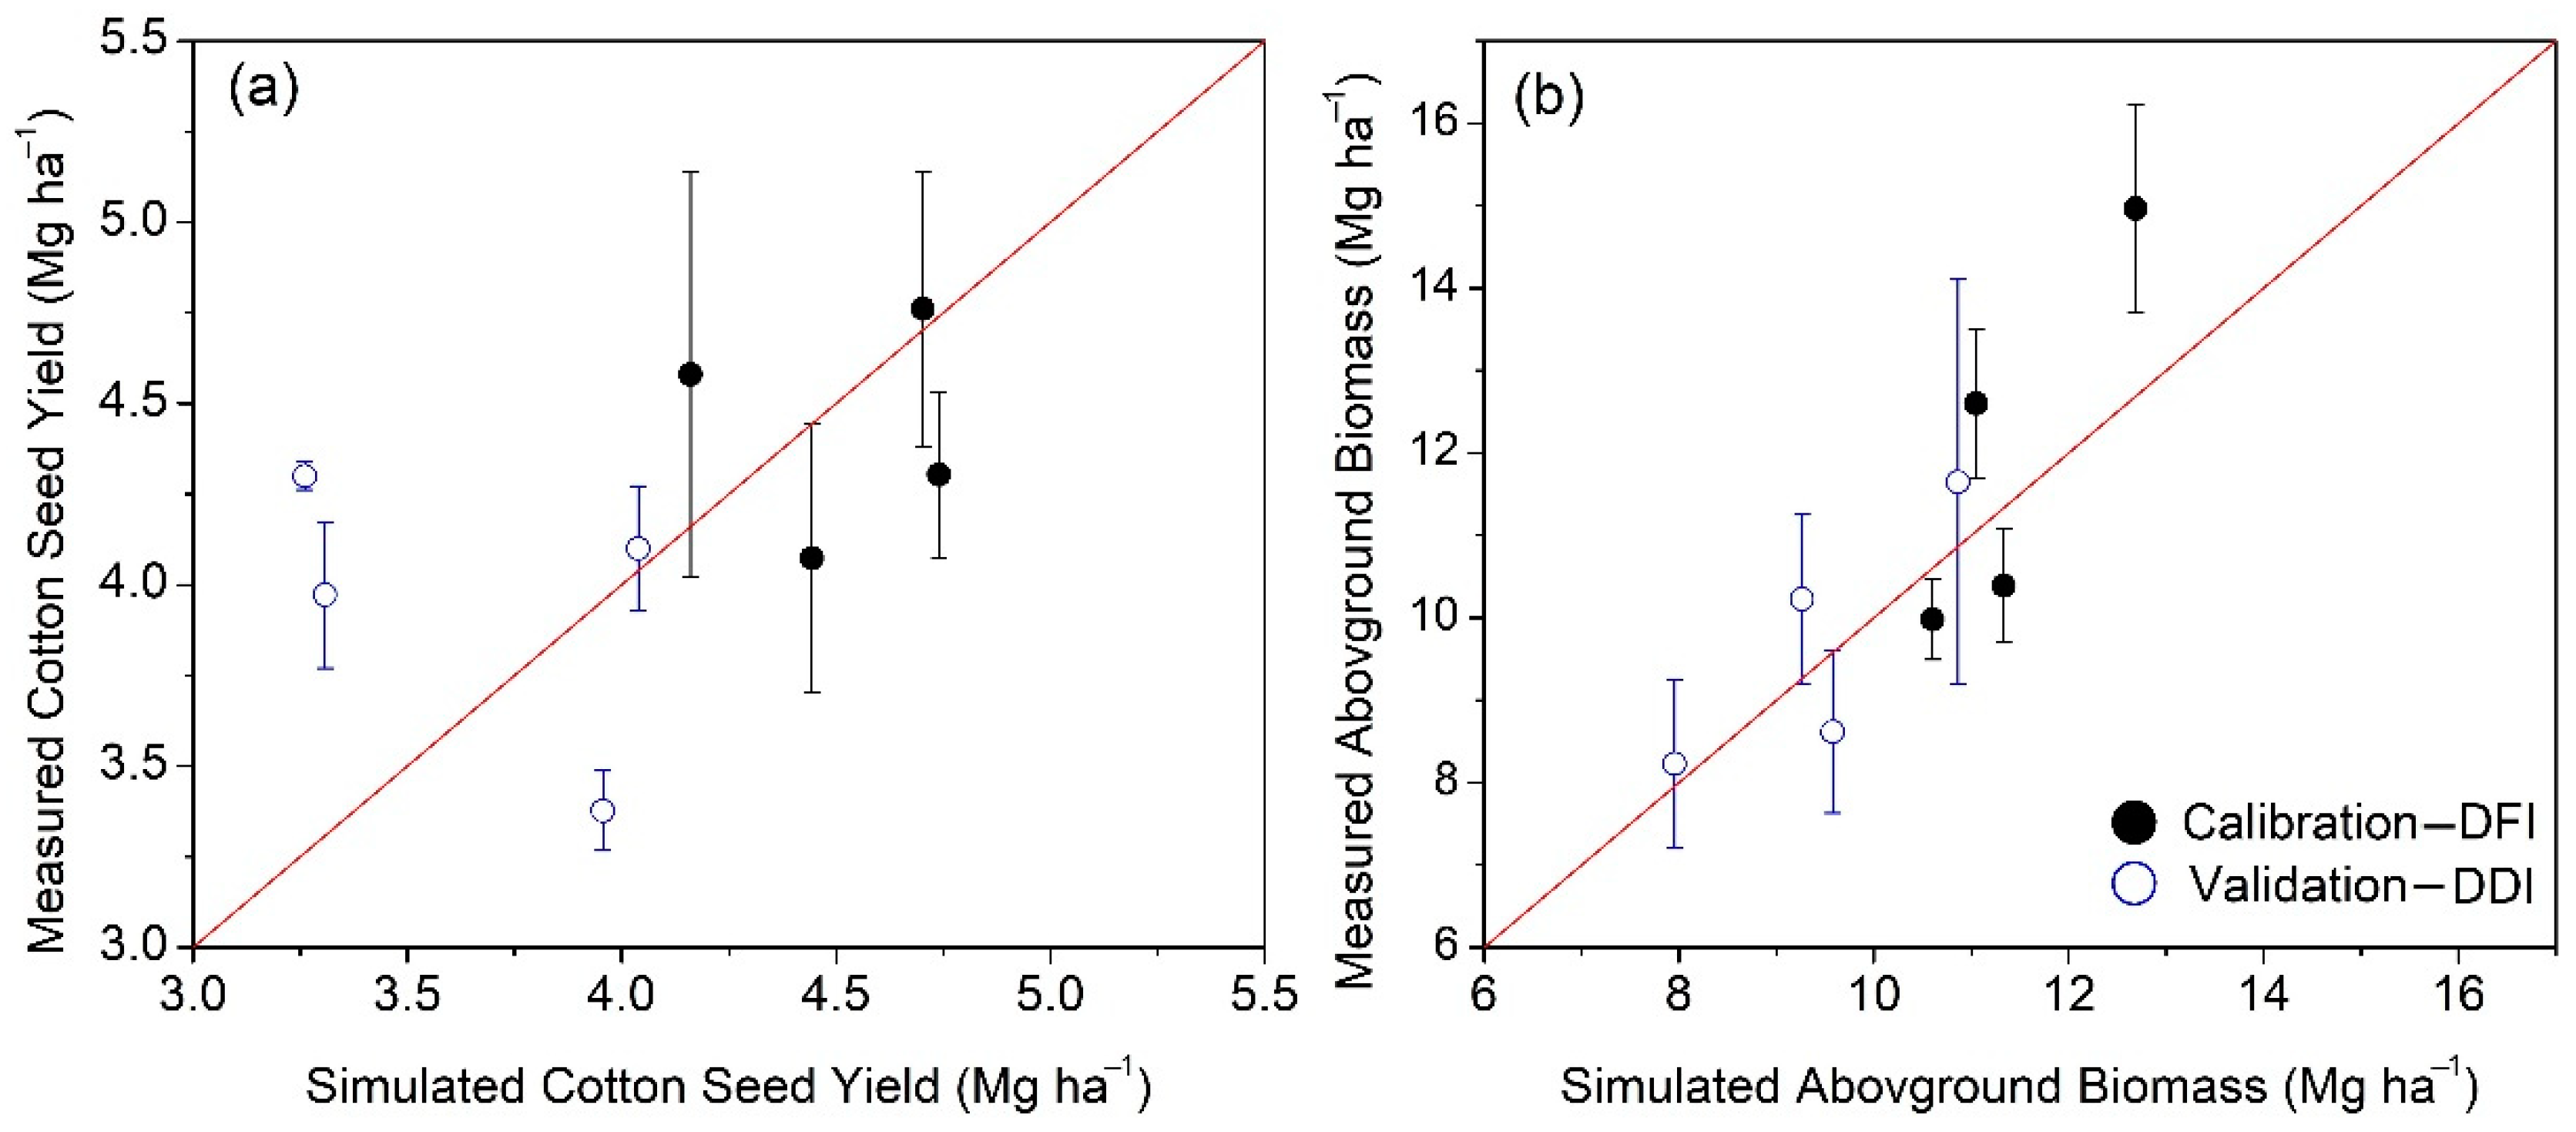
3.1. Model Calibration for Full Irrigation
3.2. Model Evaluations for Deficit Irrigation
3.3. Soil Temperature Simulations
3.4. Cotton M vs. S T
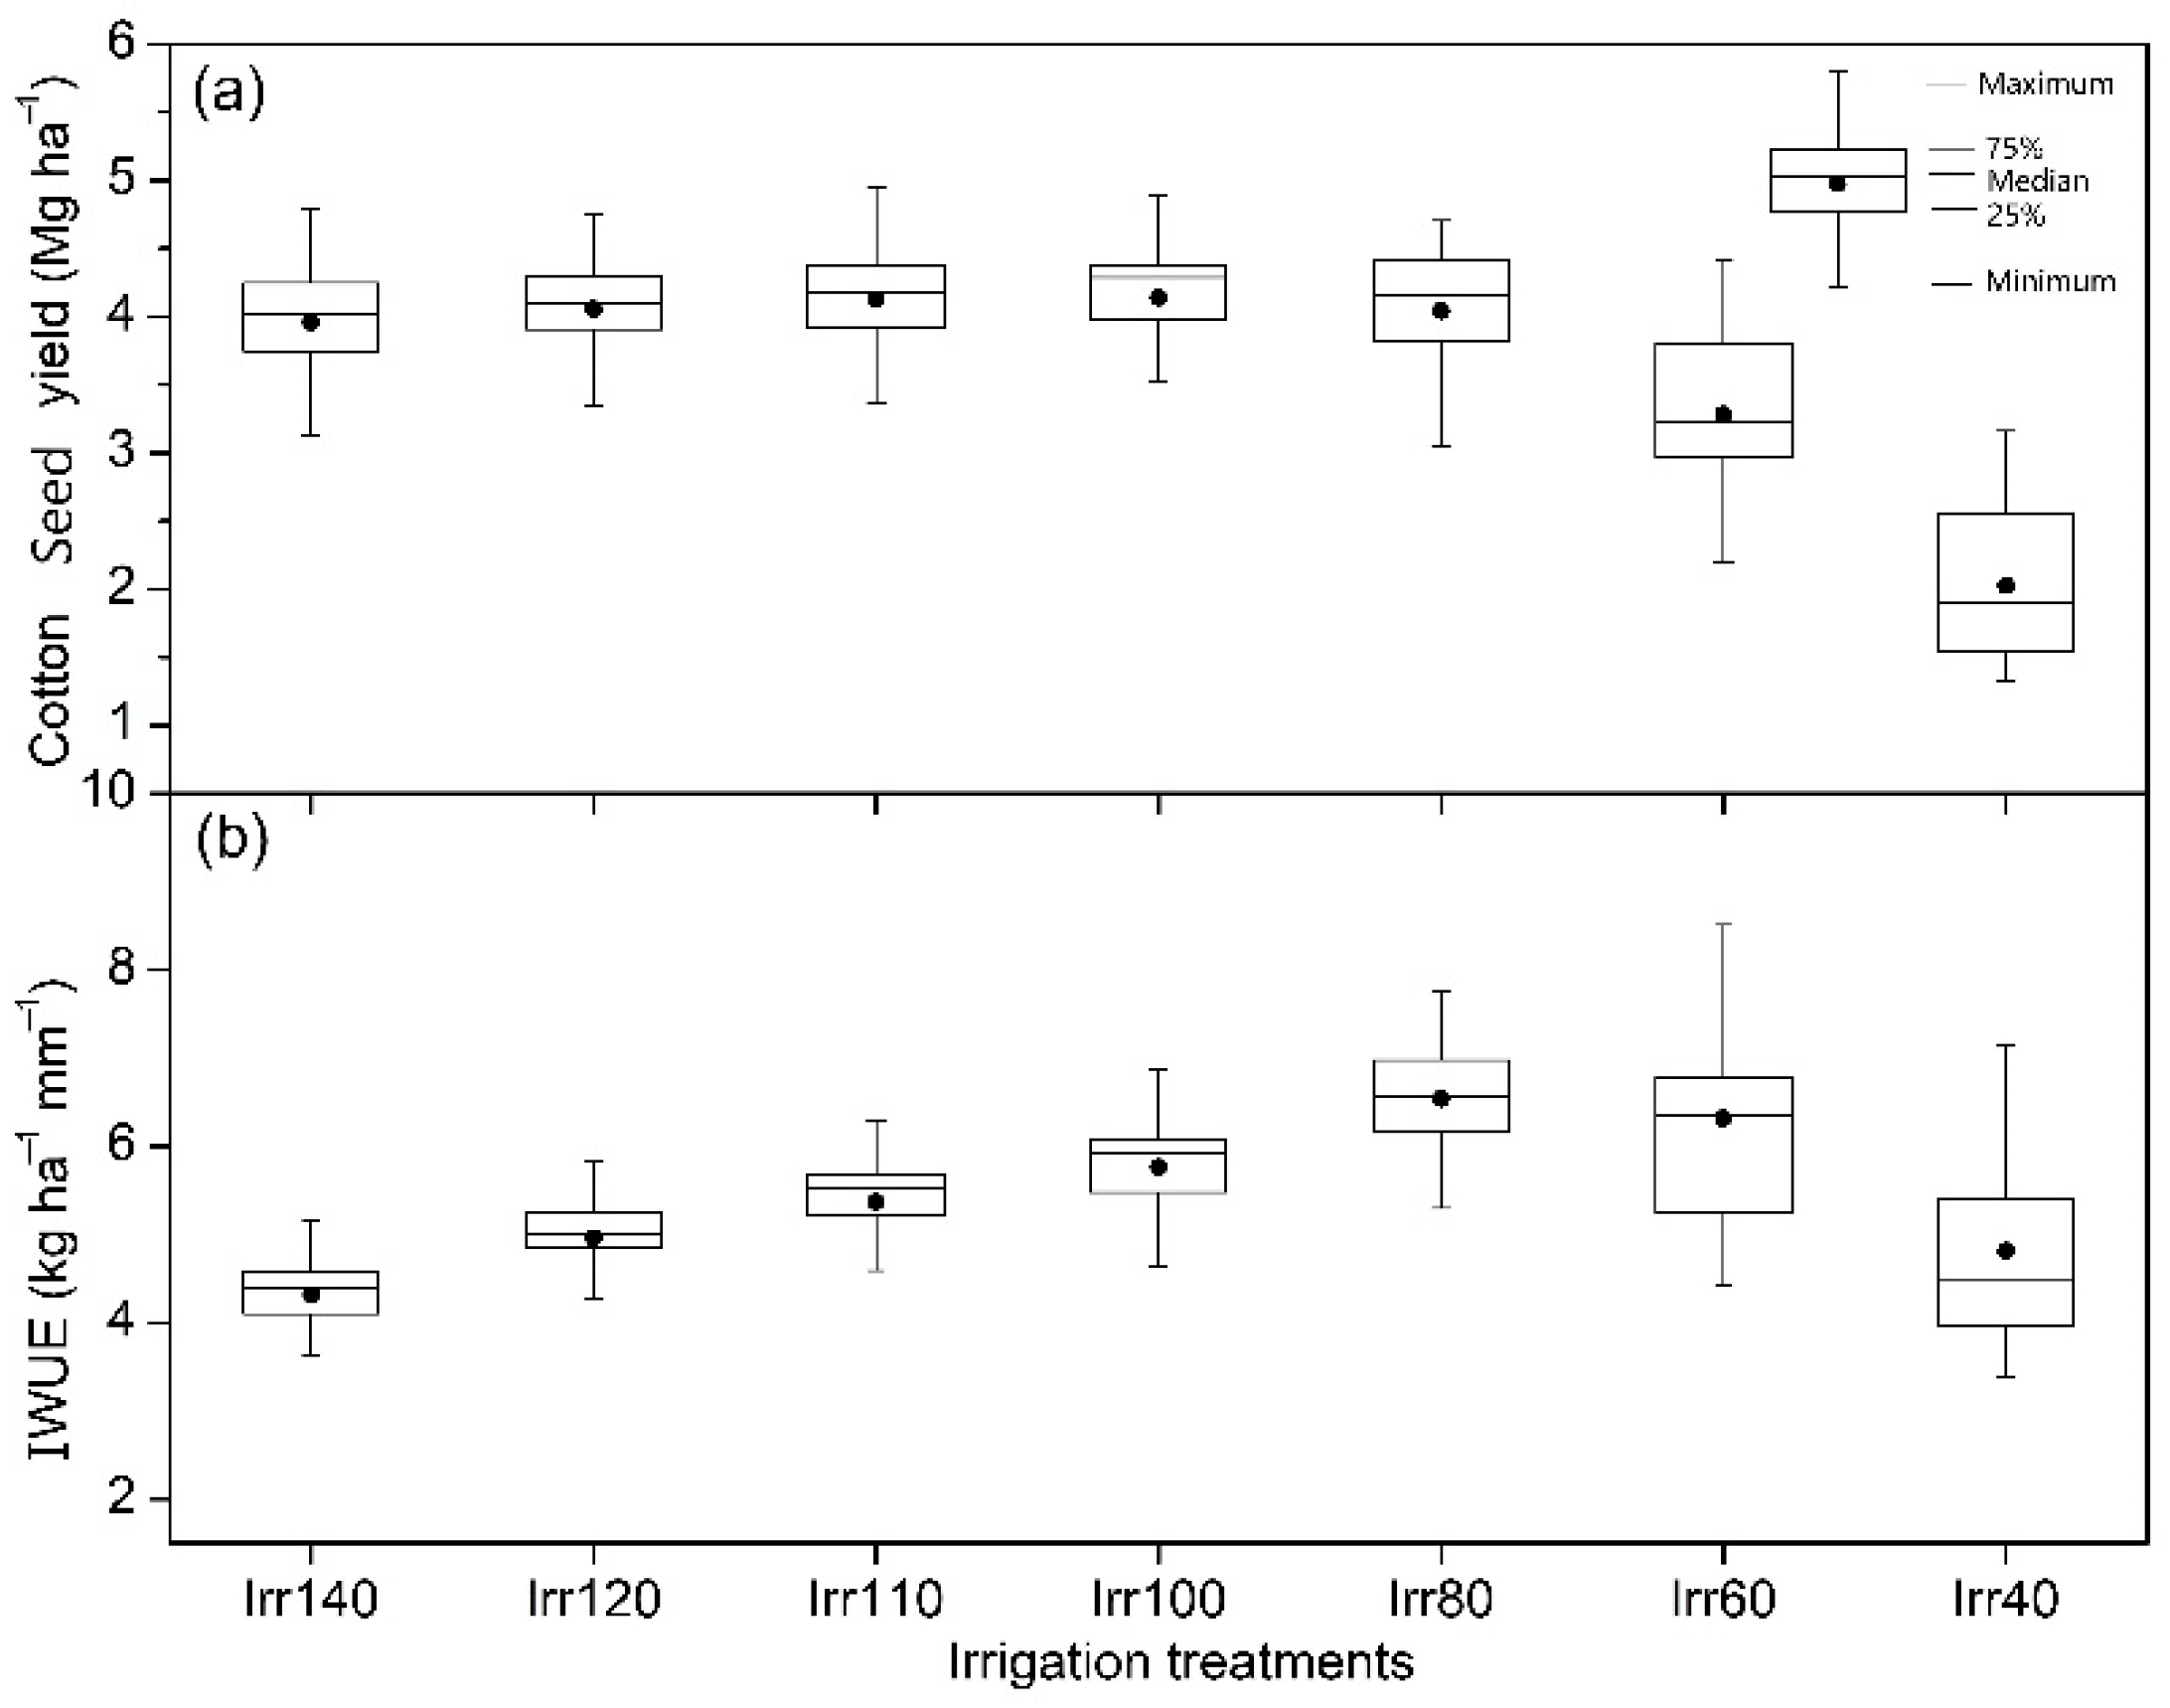
3.5. Irrigation Scheduling Optimization (1990–2019)
4. Discussion
5. Conclusions
Author Contributions
Funding
Institutional Review Board Statement
Informed Consent Statement
Data Availability Statement
Conflicts of Interest
References
- Chen, Y.; Hao, X.; Chen, Y.; Zhu, C. Study on water system connectivity and ecological protection countermeasures for the Tarim River Basin in Xinjiang. Bull. Chin. Acad. Sci. 2019, 34, 1156–1164. [Google Scholar] [CrossRef]
- Liu, C.; Qi, Z.; Gu, Z.; Gui, D.; Zeng, F. Optimizing irrigation rates for cotton production in an extremely arid area using RZEWM2-simulated water stress. Trans. ASABE 2017, 60, 2041–2052. [Google Scholar] [CrossRef] [Green Version]
- Ale, S.; Omani, N.; Himanshu, S.K.; Bordovsky, J.P.; Thorp, K.R.; Barnes, E.M. Determining Optimum Irrigation Termination Periods for Cotton Production in the Texas High Plains. Trans. ASABE 2020, 63, 105–115. [Google Scholar] [CrossRef]
- Thorp, K.R.; Hunsaker, D.J.; Bronson, K.F.; Andrade–Sanchez, P.; Barnes, E.M. Cotton irrigation scheduling using a crop growth model and FAO–56 methods: Field and simulation studies. Trans. ASABE 2017, 60, 2023–2039. [Google Scholar] [CrossRef] [Green Version]
- McCarthy, A.C.; Hancock, N.H.; Raine, S. Simulation of irrigation control strategies for cotton using Model Predictive Control within the VARIwise simulation framework. Comput. Electron. Agric. 2014, 101, 135–147. [Google Scholar] [CrossRef] [Green Version]
- Shareef, M.; Gui, D.; Zeng, F.; Waqas, M.; Zhang, B.; Iqbal, H. Water productivity, growth, and physiological assessment of deficit irrigated cotton on hyperarid desert-oases in northwest China. Agric. Water Manag. 2018, 206, 1–10. [Google Scholar] [CrossRef]
- Pabuayon, I.L.B.; Singh, S.; Lewis, K.L.; Ritchie, G.L. Water Extraction and Productivity of Cotton, Sorghum, and Sesame under Deficit Irrigation. Crop Sci. 2019, 59, 1692–1700. [Google Scholar] [CrossRef]
- Cardenas-Lailhacar, B.; Dukes, M.D.; Miller, G.L. Sensor-Based Automation of Irrigation on Bermudagrass during Dry Weather Conditions. J. Irrig. Drain. Eng. 2010, 136, 184–193. [Google Scholar] [CrossRef] [Green Version]
- Miller, G.; Farahani, H.; Hassell, R.; Khalilian, A.; Adelberg, J.; Wells, C. Field evaluation and performance of capacitance probes for automated drip irrigation of watermelons. Agric. Water Manag. 2014, 131, 124–134. [Google Scholar] [CrossRef]
- Gao, F.; Yu, L.; Zhang, W.; Xu, Q.; Jiang, Q. Preliminary study on precision irrigation system based on wireless sensor networks of acoustic emission for crop water stress. Trans. CSAE 2008, 24, 60–65. [Google Scholar]
- Carroll, D.A.; Hansen, N.C.; Hopkins, B.G.; Dejonge, K.C. Leaf temperature of maize and Crop Water Stress Index with variable irrigation and nitrogen supply. Irrig. Sci. 2017, 35, 549–560. [Google Scholar] [CrossRef]
- Dang, T.; Pedroso, R.; Laux, P.; Kunstmann, H. Development of an integrated hydrological-irrigation optimization modeling system for a typical rice irrigation scheme in Central Vietnam. Agric. Water Manag. 2018, 208, 193–203. [Google Scholar] [CrossRef]
- Tan, S.; Wang, Q.; Zhang, J.; Chen, Y.; Shan, Y.; Xu, D. Performance of AquaCrop model for cotton growth simulation under film-mulched drip irrigation in southern Xinjiang, China. Agric. Water Manag. 2018, 196, 99–113. [Google Scholar] [CrossRef]
- O’Shaughnessy, S.A.; Evett, S.R.; Colaizzi, P.D. Dynamic prescription maps for site-specific variable rate irrigation of cotton. Agric. Water Manag. 2015, 159, 123–138. [Google Scholar] [CrossRef]
- Wang, R.; Wan, S.; Sun, J.; Xiao, H. Soil salinity, sodicity and cotton yield parameters under different drip irrigation regimes during saline wasteland reclamation. Agric. Water Manag. 2018, 209, 20–31. [Google Scholar] [CrossRef]
- He, W.; Yang, J.Y.; Drury, C.F.; Smith, W.N.; Grant, B.B.; He, P.; Qian, B.; Zhou, W.; Hoogenboom, G. Estimating the impacts of climate change on crop yields and N2O emissions for conventional and no-tillage in Southwestern Ontario, Canada. Agric. Syst. 2018, 159, 187–198. [Google Scholar] [CrossRef]
- Jeong, J.; Zhang, X. Model Application for Sustainable Agricultural Water Use. Agronomy 2020, 10, 396. [Google Scholar] [CrossRef] [Green Version]
- Soufizadeh, S.; Munaro, E.; McLean, G.; Massignam, A.; van Oosterom, E.; Chapman, S.; Messina, C.; Cooper, M.; Hammer, G. Modelling the nitrogen dynamics of maize crops—Enhancing the APSIM maize model. Eur. J. Agron. 2018, 100, 118–131. [Google Scholar] [CrossRef]
- Puntel, L.A.; Sawyer, J.E.; Barker, D.W.; Dietzel, R.; Poffenbarger, H.; Castellano, M.; Moore, K.J.; Thorburn, P.; Archontoulis, S.V. Modeling Long-Term Corn Yield Response to Nitrogen Rate and Crop Rotation. Front. Plant Sci. 2016, 7, 1630. [Google Scholar] [CrossRef]
- Zhao, J.; Zhang, X.; Yang, Y.; Zang, H.; Yan, P.; Meki, M.N.; Doro, L.; Sui, P.; Jeong, J.; Zeng, Z. Alternative cropping systems for groundwater irrigation sustainability in the North China Plain. Agric. Water Manag. 2021, 250, 106867. [Google Scholar] [CrossRef]
- Li, F.; Yu, N.; Zhao, Y. Irrigation Scheduling Optimization for Cotton Based on the AquaCrop Model. Water Resour. Manag. 2018, 33, 39–55. [Google Scholar] [CrossRef]
- Lu, Y.; Wang, E.; Zhao, Z.; Liu, X.; Tian, A.; Zhang, X. Optimizing irrigation to reduce N leaching and maintain high crop productivity through the manipulation of soil water storage under summer monsoon climate. Field Crop. Res. 2021, 265, 108110. [Google Scholar] [CrossRef]
- Kothari, K.; Ale, S.; Bordovsky, J.P.; Thorp, K.; Porter, D.O.; Munster, C.L. Simulation of efficient irrigation management strategies for grain sorghum production over different climate variability classes. Agric. Syst. 2019, 170, 49–62. [Google Scholar] [CrossRef]
- Marek, G.W.; Gowda, P.H.; Marek, T.H.; Porter, D.O.; Baumhardt, R.; Brauer, D.K. Modeling long-term water use of irrigated cropping rotations in the Texas High Plains using SWAT. Irrig. Sci. 2016, 35, 111–123. [Google Scholar] [CrossRef]
- Masasi, B.; Taghvaeian, S.; Gowda, P.H.; Marek, G.; Boman, R. Validation and application of AquaCrop for irrigated cotton in the Southern Great Plains of US. Irrig. Sci. 2020, 38, 593–607. [Google Scholar] [CrossRef]
- Mompremier, R.; Her, Y.; Hoogenboom, G.; Migliaccio, K.; Muñoz-Carpena, R.; Brym, Z.; Colbert, R.; Jeune, W. Modeling the response of dry bean yield to irrigation water availability controlled by watershed hydrology. Agric. Water Manag. 2020, 243, 106429. [Google Scholar] [CrossRef]
- Attia, A.; El-Hendawy, S.; Al-Suhaibani, N.; Alotaibi, M.; Tahir, M.U.; Kamal, K.Y. Evaluating deficit irrigation scheduling strategies to improve yield and water productivity of maize in arid environment using simulation. Agric. Water Manag. 2021, 249, 106812. [Google Scholar] [CrossRef]
- Spivey, T.A.; Wilkerson, G.G.; Buol, G.S.; Edmisten, K.L.; Barnes, E.M. Use of CSM-CROPGRO-Cotton to Determine the Agronomic and Economic Value of Irrigation to Upland Cotton Production in North and South Carolina. Trans. ASABE 2018, 61, 1627–1638. [Google Scholar] [CrossRef]
- Sima, N.Q.; Harmel, R.D.; Fang, Q.X.; Ma, L.; Andales, A.A. A modified F-test for evaluating model performance by including both experimental and simulation uncertainties. Environ. Model. Softw. 2018, 104, 236–248. [Google Scholar] [CrossRef] [Green Version]
- Jeong, H.; Pittelkow, C.; Bhattarai, R. Simulated responses of tile-drained agricultural systems to recent changes in ambient atmospheric gradients. Agric. Syst. 2018, 168, 48–55. [Google Scholar] [CrossRef]
- Ding, J.; Hu, W.; Wu, J.; Yang, Y.; Feng, H. Simulating the effects of conventional versus conservation tillage on soil water, nitrogen dynamics, and yield of winter wheat with RZWQM2. Agric. Water Manag. 2019, 230, 105956. [Google Scholar] [CrossRef]
- Ma, L.; Trout, T.J.; Ahuja, L.R.; Bausch, W.C.; Saseendran, S.; Malone, R.W.; Nielsen, D.C. Calibrating RZWQM2 model for maize responses to deficit irrigation. Agric. Water Manag. 2012, 103, 140–149. [Google Scholar] [CrossRef]
- El-Sadek, A.N.; Salem, E. Simulation of wheat yield using the RZWQM as affected by supplemental irrigation in the North Western coast of Egypt. Egypt J. Agric. 2016, 38, 279–292. [Google Scholar]
- Qi, Z.; Ma, L.; Bausch, W.C.; Trout, T.; Ahuja, L.R.; Flerchinger, G.N.; Fang, Q. Simulating Maize Production, Water and Surface Energy Balance, Canopy Temperature, and Water Stress under Full and Deficit Irrigation. Trans. ASABE 2016, 59, 623–633. [Google Scholar] [CrossRef] [Green Version]
- Sima, M.W.; Fang, Q.X.; Qi, Z.; Yu, Q. Direct assimilation of measured soil water content in Root Zone Water Quality Model calibration for deficit-irrigated maize. Agron. J. 2019, 112, 844–860. [Google Scholar] [CrossRef]
- Li, M.; Du, Y.; Zhang, F.; Fan, J.; Ning, Y.; Cheng, H.; Xiao, C. Modification of CSM-CROPGRO-Cotton model for simulating cotton growth and yield under various deficit irrigation strategies. Comput. Electron. Agric. 2020, 179, 105843. [Google Scholar] [CrossRef]
- Fang, Q.; Ma, L.; Ahuja, L.R.; Trout, T.J.; Malone, R.W.; Zhang, H.; Gui, D.; Yu, Q. Long-term simulation of growth stage-based irrigation scheduling in maize under various water constraints in Colorado, USA. Front. Agr. Sci. Eng. 2017, 4, 172–184. [Google Scholar] [CrossRef]
- Liu, H.; Liu, Y.; Zhang, L.; Zhang, Z.; Gao, Z. Quantifying extreme climatic conditions for maize production using RZWQM in Siping, Northeast China. Int. J. Agric. Biol. Eng. 2019, 12, 111–122. [Google Scholar] [CrossRef]
- Cheng, H.; Shu, K.; Qi, Z.; Ma, L.; Jin, V.L.; Li, Y.; Schmer, M.R.; Wienhold, B.J.; Feng, S. Effects of residue removal and tillage on greenhouse gas emissions in continuous corn systems as simulated with RZWQM2. J. Environ. Manag. 2021, 285, 112097. [Google Scholar] [CrossRef]
- Chen, X.; Qi, Z.; Gui, D.; Gu, Z.; Ma, L.; Zeng, F.; Li, L.; Sima, M.W. A Model-Based Real-Time Decision Support System for Irrigation Scheduling to Improve Water Productivity. Agronomy 2019, 9, 686. [Google Scholar] [CrossRef] [Green Version]
- Chen, X.; Qi, Z.; Gui, D.; Sima, M.W.; Zeng, F.; Li, L.; Li, X.; Gu, Z. Evaluation of a new irrigation decision support system in improving cotton yield and water productivity in an arid climate. Agric. Water Manag. 2020, 234, 106139. [Google Scholar] [CrossRef]
- Gu, Z.; Qi, Z.; Ma, L.; Gui, D.; Xu, J.; Fang, Q.; Yuan, S.; Feng, G. Development of an irrigation scheduling software based on model predicted crop water stress. Comput. Electron. Agric. 2017, 143, 208–221. [Google Scholar] [CrossRef]
- Ham, J.M.; Heilman, J.; Lascano, R. Determination of soil water evaporation and transpiration from energy balance and stem flow measurements. Agric. For. Meteorol. 1990, 52, 287–301. [Google Scholar] [CrossRef]
- Ahuja, L.R.; Rojas, K.W.; Hanson, J.D.; Shaffer, M.J.; Ma, L. Root Zone Water Quality Model: Modelling Management Effects on Water Quality and Crop Production; Water Resources Publications: Littleton, CO, USA, 2000; p. 384. [Google Scholar]
- Hanson, J.D.; Rojas, K.W.; Shaffer, M.J. Calibrating the Root Zone Water Quality Model. Agron. J. 1999, 91, 171–177. [Google Scholar] [CrossRef]
- Ma, L.; Ahuja, L.R.; Nolan, B.; Malone, R.W.; Trout, T.; Qi, Z. Root Zone Water Quality Model (RZWQM2): Model Use, Calibration, and Validation. Trans. ASABE 2012, 55, 1425–1446. [Google Scholar] [CrossRef]
- Thorp, K.R.; Hunsaker, D.J.; French, A.N.; Bautista, E.; Bronson, K.F. Integrating geospatial data and cropping system simulation within a geographic information system to analyze spatial seed cotton yield, water use, and irrigation requirements. Precis. Agric. 2015, 16, 532–557. [Google Scholar] [CrossRef]
- Anapalli, S.S.; Pettigrew, W.T.; Reddy, K.N.; Ma, L.; Fisher, D.K.; Sui, R. Climate-Optimized Planting Windows for Cotton in the Lower Mississippi Delta Region. Agronomy 2016, 6, 46. [Google Scholar] [CrossRef] [Green Version]
- Ma, L.; Nielsen, D.C.; Ahuja, L.R.; Malone, R.W.; Saseendran, S.S.; Rojas, K.W.; Hanson, J.D.; Benjamin, J.G. Evaluation of RZWQM under varying irrigation levels in eastern Colorado. Trans. ASAE 2003, 46, 39–49. [Google Scholar] [CrossRef]
- Fang, Q.; Yu, Q.; Wang, J. Simulating Soil Water Dynamics and Its Effects on Crop Yield Using RZWQM-CERES in the North China Plain: Simulating Soil Water Dynamics and Its Effects on Crop Yield Using RZWQM-CERES in the North China Plain. Acta Agronmica Sin. 2009, 35, 1122–1130. [Google Scholar] [CrossRef] [Green Version]
- Jiang, Q.; Qi, Z.; Madramootoo, C.A.; Crézé, C. Mitigating greenhouse gas emissions in subsurface-drained field using RZWQM2. Sci. Total Environ. 2018, 646, 377–389. [Google Scholar] [CrossRef]
- Gillette, K.; Ma, L.; Malone, R.W.; Fang, Q.; Halvorson, A.D.; Hatfield, J.L.; Ahuja, L. Simulating N2O emissions under different tillage systems of irrigated corn using RZ-SHAW model. Soil Tillage Res. 2017, 165, 268–278. [Google Scholar] [CrossRef]
- Ding, J.; Wu, J.; Yang, Y.; Hu, W.; Feng, H. Simulation of effects of tillage pattern transformation on soil water conservation with RZWQM model. Trans. CSAM 2016, 47, 136–145. [Google Scholar] [CrossRef]
- Wang, M.; Yang, Q.; Zheng, J.; Liu, Z. Spatial and temporal distribution of water requirement of cotton in Xinjiang from 1963 to 2012. Acta Ecol. Sin. 2016, 36, 4122–4130. [Google Scholar] [CrossRef]
- Zhao, A. Mulched drip irrigation cotton yield potential estimation based on large-scale water-nitrogen coupling model in Xinjiang, China with limits of water resources. Trans. CSAE 2019, 35, 111–118. [Google Scholar] [CrossRef]
- Xing, X.; Yao, B.; Sun, S. Effects of different irrigation regimes on cotton growth and yield with drip irrigation under plastic film in oasis region of South Xinjiang. Acta Agric. Borealic-Occident. Sinia 2016, 25, 227–236. [Google Scholar]
- He, H.; Wang, Z.; Zheng, X.; Zhang, J.; Li, W.; Wu, Q. Effects of water-nitrogen coupling on growth and yield of cotton under mulch drip irrigation. Xinjiang Agric. Sci. 2017, 54, 1983–1989. [Google Scholar]


| Soil Depth (m) | ρ (Mg m−3) | Soil Texture | ksat (mm h−1) | pb (mm) | Soil Moisture Content at Different Matric Potentials | ||||||
|---|---|---|---|---|---|---|---|---|---|---|---|
| Sand (%) | Silt (%) | Clay (%) | θsat Ψm = 0 | θfc* Ψm = −10 kPa | θfc Ψm = −33 kPa | θpwp Ψm = −1500 kPa | θr Ψm = −∞ | ||||
| 0–0.15 | 1.40 | 66.1 | 25 | 8.9 | 52.3 | −136.5 | 0.45 | 0.20 | 0.13 | 0.05 | 0.03 |
| 0.15–0.30 | 1.45 | 65.4 | 27.7 | 6.9 | 23.4 | −136.5 | 0.45 | 0.20 | 0.13 | 0.05 | 0.05 |
| 0.30–0.60 | 1.45 | 64.8 | 25.6 | 9.6 | 49.8 | −136.5 | 0.45 | 0.20 | 0.13 | 0.05 | 0.04 |
| 0.60–0.90 | 1.48 | 67.6 | 24.5 | 7.9 | 47.0 | −136.5 | 0.45 | 0.20 | 0.13 | 0.05 | 0.05 |
| 0.90–1.20 | 1.43 | 65.8 | 24.1 | 0.1 | 55.0 | −136.5 | 0.45 | 0.20 | 0.13 | 0.05 | 0.05 |
| 1.20–1.50 | 1.43 | 65.8 | 24.1 | 0.1 | 52.5 | −136.5 | 0.45 | 0.19 | 0.13 | 0.05 | 0.05 |
| 1.50–1.78 | 1.43 | 65.8 | 24.1 | 0.1 | 52.2 | −136.5 | 0.45 | 0.19 | 0.13 | 0.05 | 0.05 |
| Parameter | Description | Value |
|---|---|---|
| EM–FL | Time between plant emergence and flower appearance (days) | 35 |
| FL–SH | Time between first flower and first pod (days) | 11 |
| FL–SD | Time between first flower and first seed (days) | 17 |
| SD–PM | Time between first seed and physiological maturity (days) | 25 |
| FL–LF | Time between first flower and end of leaf expansion (days) | 51 |
| LFMAX | Maximum leaf photosynthesis rate at 30 °C, 350 vpm CO2, and highlight (mg CO2 m−2 s−1) | 1.1 |
| SLAVR | Specific leaf area of cultivar under standard growth conditions (cm2 g−1) | 180 |
| SIZLF | Maximum size of full leaf (cm2) | 200 |
| XFRT | Maximum fraction of daily growth that is partitioned to seed + shell | 0.85 |
| WTPSD | Maximum weight per seed (g) | 0.2 |
| SFDUR | Seed filling duration for pod cohort at standard growth conditions (days) | 18 |
| SDPDV | Average seeds per pod under standard growing conditions (seeds pod−1) | 22 |
| PODUR | Time required for cultivar to reach final pod load under optimal conditions (days) | 8 |
| Plant Parameters and Soil Parameters by Depth a | Calibration (Full Irrigation) b | Validation (Deficit Irrigation) | |||||||||||
|---|---|---|---|---|---|---|---|---|---|---|---|---|---|
| M | S | RMSE | RRMSE | PBIAS | IOA | M | S | RMSE | RRMSE | PBIAS | IOA | ||
| Plant parameters | Cotton yield (Mg ha−1) | 4.43 | 4.51 | 0.36 | 8% | 2.5% | 0.62 | 3.38 | 3.64 | 0.68 | 20% | −10.3% | 0.21 |
| Aboveground biomass (Mg ha−1) | 11.98 | 11.42 | 1.49 | 12% | −5.9% | 0.98 | 9.68 | 9.42 | 0.79 | 8% | −3.5% | 0.99 | |
| Maximum LAI | 3.81 | 3.83 | 0.61 | 28% | 7.5% | 0.98 | 3.39 | 3.09 | 0.49 | 27% | 0.7% | 0.98 | |
| Max. plant height (cm) | 83 | 94 | 7.2 | 11% | 4.4% | 0.99 | 77 | 82 | 5.99 | 10% | 3% | 0.99 | |
| Mean T (mm d−1) | 4.2 | 3.4 | 1.1 | 27% | −18% | 0.97 | 3.2 | 2.7 | 1.3 | 41% | 14% | 0.95 | |
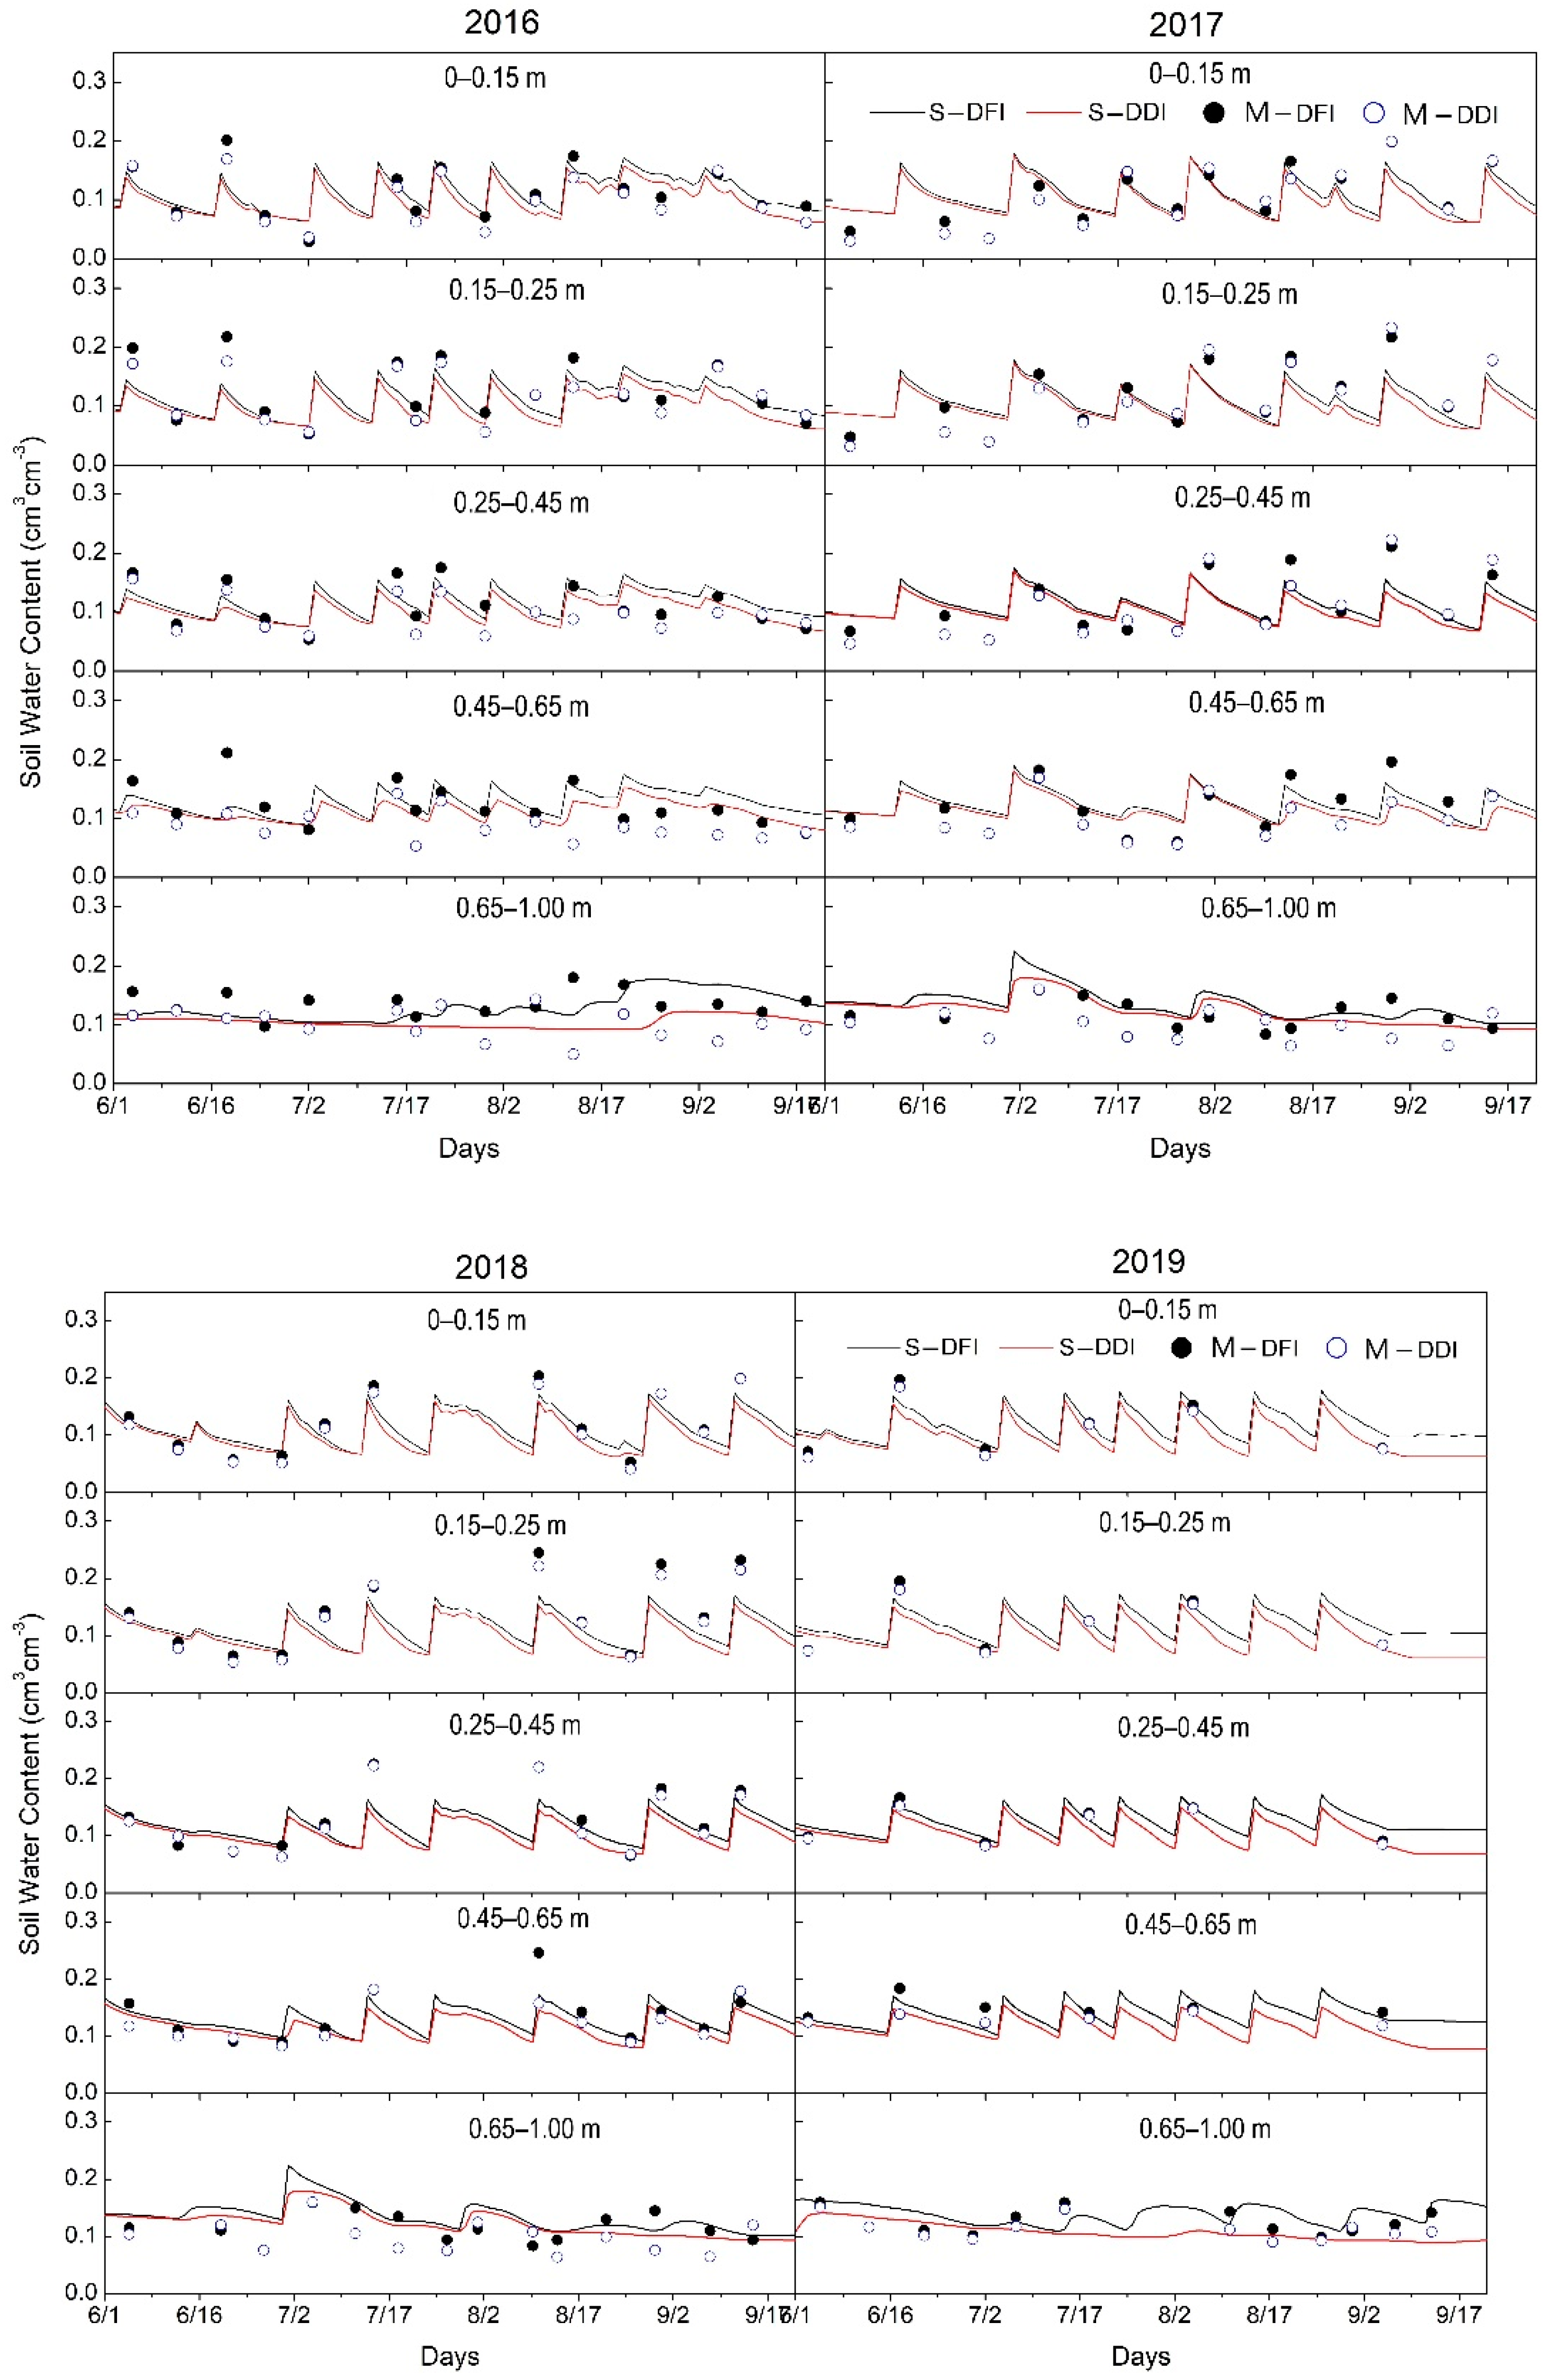
| Soil water content, θ | θ (0–0.15 m) | 0.111 | 0.114 | 0.032 | 29% | 2.7% | 0.82 | 0.106 | 0.099 | 0.035 | 30% | −6.3% | 0.76 |
| θ (0.15–0.25 m) | 0.128 | 0.112 | 0.042 | 30% | −12.3% | 0.71 | 0.119 | 0.100 | 0.044 | 37% | −16.1% | 0.65 | |
| θ (0.25–0.45 m) | 0.119 | 0.116 | 0.034 | 29% | −2.4% | 0.73 | 0.109 | 0.104 | 0.038 | 35% | −5.0% | 0.66 | |
| θ (0.45–0.65 m) | 0.129 | 0.128 | 0.034 | 26% | −1.3% | 0.65 | 0.104 | 0.113 | 0.029 | 28% | 8.8% | 0.67 | |
| θ (0.65–1.00 m) | 0.127 | 0.136 | 0.030 | 23% | 7.0% | 0.53 | 0.105 | 0.111 | 0.027 | 25% | 5.1% | 0.55 | |
| Soil temperature, | 0–0.15 m | 25.01 | 23.88 | 2.07 | 8% | −4.8% | 0.91 | 25.00 | 23.27 | 2.78 | 11% | −7.5% | 0.8 |
| 0.15–0.25 m) | 24.85 | 23.64 | 1.63 | 7% | −5.2% | 0.92 | 24.96 | 24.14 | 2.57 | 10% | −3.5% | 0.84 | |
| (0.25–0.45 m) | 24.76 | 23.42 | 1.70 | 7% | −5.8% | 0.9 | 24.81 | 23.78 | 2.37 | 10% | −4.5% | 0.83 | |
| 0.45–0.65 m) | 24.34 | 22.96 | 1.60 | 7% | −6.1% | 0.88 | 24.26 | 23.4 | 2.26 | 9% | −3.9% | 0.8 | |
| 0.65–1.00 m) | 23.45 | 22.16 | 1.45 | 6% | −6% | 0.8 | 23.35 | 22.68 | 2.05 | 9% | −3.1% | 0.74 | |
| Treatments | Yield Mg ha−1 | Irrigation m3 ha−1 | Cotton Price $ kg−1 | Water Price $ m−3 | Gross Income $ ha−1 | Water Cost $ ha−1 | Basic Cost $ ha−1 | Net Income $ ha−1 | Nwp $ m−3 |
|---|---|---|---|---|---|---|---|---|---|
| Irr850 | 3.96 | 5100 | 0.04 | 1.3 | 5144 | 204 | 2000 | 2940 | 0.58 |
| Irr750 | 4.05 | 4500 | 0.04 | 1.3 | 5271 | 180 | 2000 | 3091 | 0.69 |
| Irr700 | 4.12 | 4200 | 0.04 | 1.3 | 5359 | 168 | 2000 | 3191 | 0.76 |
| Irr650 | 4.14 | 3900 | 0.04 | 1.3 | 5380 | 156 | 2000 | 3224 | 0.83 |
| Irr550 | 4.04 | 3300 | 0.04 | 1.3 | 5255 | 132 | 2000 | 3123 | 0.95 |
| Irr450 | 3.28 | 2700 | 0.04 | 1.3 | 4267 | 108 | 2000 | 2159 | 0.80 |
| Irr350 | 2.03 | 2100 | 0.04 | 1.3 | 2634 | 84 | 2000 | 550 | 0.26 |
Publisher’s Note: MDPI stays neutral with regard to jurisdictional claims in published maps and institutional affiliations. |
© 2022 by the authors. Licensee MDPI, Basel, Switzerland. This article is an open access article distributed under the terms and conditions of the Creative Commons Attribution (CC BY) license (https://creativecommons.org/licenses/by/4.0/).
Share and Cite
Chen, X.; Feng, S.; Qi, Z.; Sima, M.W.; Zeng, F.; Li, L.; Cheng, H.; Wu, H. Optimizing Irrigation Strategies to Improve Water Use Efficiency of Cotton in Northwest China Using RZWQM2. Agriculture 2022, 12, 383. https://doi.org/10.3390/agriculture12030383
Chen X, Feng S, Qi Z, Sima MW, Zeng F, Li L, Cheng H, Wu H. Optimizing Irrigation Strategies to Improve Water Use Efficiency of Cotton in Northwest China Using RZWQM2. Agriculture. 2022; 12(3):383. https://doi.org/10.3390/agriculture12030383
Chicago/Turabian StyleChen, Xiaoping, Shaoyuan Feng, Zhiming Qi, Matthew W. Sima, Fanjiang Zeng, Lanhai Li, Haomiao Cheng, and Hao Wu. 2022. "Optimizing Irrigation Strategies to Improve Water Use Efficiency of Cotton in Northwest China Using RZWQM2" Agriculture 12, no. 3: 383. https://doi.org/10.3390/agriculture12030383