Article

Insect Detection in Sticky Trap Images of Tomato Crops Using Machine Learning

1
Instituto Universitário de Lisboa (ISCTE-IUL), ISTAR-IUL, 1649-026 Lisbon, Portugal
2
INOV-INESC Inovação—Instituto de Novas Tecnologias, 1000-029 Lisbon, Portugal
*
Author to whom correspondence should be addressed.
Agriculture 2022, 12(11), 1967; https://doi.org/10.3390/agriculture12111967
Submission received: 29 September 2022 / Revised: 5 November 2022 / Accepted: 17 November 2022 / Published: 21 November 2022
(This article belongs to the Special Issue The Application of Machine Learning in Agriculture)

Abstract

:
As climate change, biodiversity loss, and biological invaders are all on the rise, the significance of conservation and pest management initiatives cannot be stressed. Insect traps are frequently used in projects to discover and monitor insect populations, assign management and conservation strategies, and assess the effectiveness of treatment. This paper assesses the application of YOLOv5 for detecting insects in yellow sticky traps using images collected from insect traps in Portuguese tomato plantations, acquired under open field conditions. Furthermore, a sliding window approach was used to minimize insect detection duplicates in a non-complex way. This article also contributes to event forecasting in agriculture fields, such as diseases and pests outbreak, by obtaining insect-related metrics that can be further analyzed and combined with other data extracted from the crop fields, contributing to smart farming and precision agriculture. The proposed method achieved good results when compared to related works, reaching 94.4% for mAP_0.5, with a precision and recall of 88% and 91%, respectively, using YOLOv5x.

1. Introduction

The world population has increased and is expected to continue to grow [1]. In recent decades, this growth has driven the demand for agricultural goods, resulting in an increase in crop areas [2]. However, traditional agricultural production is not economically or environmentally sustainable; hence, it is critical to make optimal use of resources to enable high-yield crops [2].
Furthermore, crop productivity is constantly threatened by insect pests. It is predicted that worldwide food supplements are declining by 40% on average every year owing to plant diseases and insect outbreaks [3]. Each year invasive insects cost the global economy around USD 70 billion [4].
Temperature influences the rate of population expansion in several insect species. In addition, the rise in global temperature caused by climate change influences insect damage and development. The metabolic rates of insects increase when the temperature rises, causing them to consume more food and inflict more harm. Crop losses due to insect pests are expected to increase by 10% to 25% for every degree of average global warming of the Earth’s surface [5].
Tomato is a fruit–vegetable that has great potential to be cultivated since it is a source of vitamins and minerals. In terms of improving yields and fruit quality, tomatoes rank among the horticultural commodities with high economic value that still require careful handling [6]. It is critical to preserve these kinds of plantations against diseases and pests, in order to improve the quality and quantity of the crop [7]. According to data from the Food and Agriculture Organization of the United Nations, tomato production in Western Europe has increased considerably from at least 2000 to 2019 [8].
Numerous fungal, bacterial, and viral diseases have severely afflicted this plant, with symptoms appearing in various areas of the plant, such as the leaf, stem, fruit, etc. Wilt, rot, stains on fruits, browning of foliage, and stunted development are some of the symptoms [9].
The advancements in information technology have allowed for the development of more precise farm management systems that overcome these invaders. Insect traps (ITs) are essential for keeping track of insect activity and are frequently used in pest detection and control programs, such as in [10], where trapping techniques for emerald ash borer and its introduced parasitoids were addressed. In [11], the authors address trapping, detection, control, and regulation of tephritid fruit flies, lures, area-wide programs, and trade implications associated with them. In [12], the authors address the use of pheromone traps to monitor the distribution and population trends of the gypsy moth; for further references, please also see [13,14,15]. ITs are also used to assess biodiversity, plan conservation [16,17,18], and evaluate pest activity and research initiatives, such as in [19], where over a two-year period, the association between female mating success and background male moth densities along the gypsy moth western front in northern Wisconsin, USA, was measured. In [20], the authors describe the usage of automated pheromone-baited traps, utilizing recording sensors and data loggers to collect male unique date–time stamps when they entered the trap; for further references, please also see [21,22,23].
As a result of the use of IT, a lot of research has been conducted to determine the effectiveness of traps, such as reference [24], where attraction and trapping capabilities of bucket- and delta-style traps with different pheromone emission rates for gypsy moths were compared. In [25], the performances of pheromone-baited traps to monitor the seasonal abundance of tortrix moths in chestnut groves were analyzed. In [26], the authors evaluated gravid traps for the collection of culex quinquefasciatus; for further references, please also see [27,28,29,30]. The research was also carried out to estimate the range of attraction, such as in reference [31], where the authors presented a novel method for estimating a pheromone trap attraction range to the pine sawyer beetle monochamus galloprovincialis. In [32], the range of attraction of pheromone traps to agriotes lineatus and agriotes obscurus was assessed. In [33], the authors assessed the attraction range of sex pheromone traps to agriotes male click beetles in South-Eastern Europe. In [34], the authors addressed the space of pheromone plume and its relationship with the effective attraction radius in applied models; for further references, please also see [35,36,37,38]. Work is also being conducted around the probabilities associated with insects, such as in [39,40]. Regarding the work in [39], the probability of detecting Caribbean fruit flies was addressed. Concerning the work in [40], the regional gypsy population trends (in an expanding population using a pheromone trap catch and spatial analysis) were predicted. This work on the probabilities associated with insects was conducted to better understand trap catches and to relate them to the absolute population density [41,42,43,44,45,46,47]. Regarding reference [41], the gypsy moth was used as the simulation model to interpret the capture of moths in pheromone-baited traps used for the surveillance of invasive species. Regarding the work in [44], the European pine sawfly was monitored with pheromone traps in maturing Scots pine stands. As for the work in [45], the autumn gum moth was monitored regarding relationships between pheromone and light trap catches and oviposition in eucalypt plantations.
For several insect trap systems, a relationship was found between trap catches and subsequent egg mass [44,45,48,49] and larval density [50,51,52]. However, translating trap catches into absolute population density and, in particular, interpreting zero catches, remains challenging at the quantitative level [12,24,41,53].
By gathering data on the target pest’s existence, abundance, and dispersion, insect pest monitoring is often carried out in agriculture and forestry to evaluate the pest status in specific sites (such as a greenhouse, field, orchard/vineyard, or forest). The ultimate objective of insect pest monitoring within integrated pest management programs in agriculture is to give growers a useful decision-making tool. For instance, the intervention thresholds are crucial for optimizing the control method and grower inputs for a given insect pest infestation in a particular field at the ideal time. Insect population outbreaks can be predicted using monitoring data to develop prediction phenological models, providing extra knowledge to enhance control methods and maximize the use of insecticides [54]. Similarly, forestry relies heavily on the detection and monitoring of both native insect pests and invasive species to set up effective management programs. This is because forest insect species can have a serious negative influence on the biodiversity, ecology, and economy of the afflicted area [55].
The impetus for this work stemmed from the necessity to monitor insects that invade crops. The monitoring of insect populations potentiates an increased crop yield as the use of pesticides can be more efficient. Therefore, this work can contribute to precision agriculture [56]. On the other hand, the proposed technique for the detection and subsequent counting of insects, which corresponds to the number of bounding boxes retrieved, contributes to smart farming. To this end, use was made of YOLOv5 and a tiled image-splitting technique in order to optimize the model’s performance.
Images from insect traps acquired in the open fields are subject to a wide variety of illumination conditions due to weather conditions, day-cycle light, landscape elements that cast shadows (e.g., trees, buildings, mountains), etc. The camera trap setup is also subject to oscillations due to the wind, which may result in lesser image quality due to motion blur. Trap imagery acquired in the open fields may also contain objects other than insects, such as leaves that stick to the traps. Machine learning models that use images acquired under these conditions tend to achieve worse results since they need to deal with such variability. On the other hand, images acquired in the laboratory are usually captured under fully controlled conditions (constant illumination, no wind, etc.), while images captured in greenhouses may also be subject to some uncontrolled environmental conditions (e.g., illumination variability), but not as adverse as on images captured in the fields.
This paper considers the much less controlled scenario of images acquired on the tomato crop fields, aiming to evaluate the applicability of YOLOv5 for the detection of insects in yellow sticky traps.

2. State-of-the-Art

Insect populations that exceed the economic threshold can cause significant harm to plants and, hence, diminish yields. The quantity of pests at an observed location is frequently determined by visually inspecting sticky surfaces in IT and counting the captured insects and this is a time-consuming job [57]. To overcome this problem, there has been much development of Internet of Things (IoT) systems with the support of machine learning for monitoring IT. This paper was developed in this direction, using images of IT captured by an IoT system to detect the number of insects present in the traps in the agricultural field through machine learning. This section will discuss some of the work that has been done in this area.
Deep learning was used to detect, identify, and count specific pest species in ITs in [58]. To reduce the impact of illumination variations on detection performance, a color correction variation [59] of the “gray-world” technique [60] was adopted. The authors suggested a sliding window-based detection pipeline that applies a convolutional neural network (CNN) to image patches at various locations to calculate the probability that they contain certain pests. Their work was inspired by algorithms proposed for pedestrian detection, analyzed in [61]. The final detections were produced via non-maximum suppression (NMS) [62] and thresholding of image patches based on their positions and related confidences. To evaluate the precision of the bounding boxes, the intersection-over-minimum (IoM) was computed. It was concluded that many of the errors occurred because the same moth could have various wing positions, occlusion levels, lighting circumstances, and decay patterns throughout time, indicating that the algorithm would improve in well-managed sites.
In [63], the authors’ main objective was to create a model that detects whiteflies and thrips from sticky trap images in greenhouse settings. They developed a model based on faster region-based convolutional neural network (R-CNN), the “TPest-RCNN”, and trained it using transfer learning with a public data set in the first phase. They utilized their data set with the weights from the first phase to the second phase. The model was proven to be accurate in detecting microscopic pests in images with varied pest concentrations and light reflections. It was also concluded that for recognizing insect species from images captured in sticky yellow traps, the best results were achieved by the proposed model, beating the faster R-CNN architecture and techniques employing manual feature extraction (color, shape, texture).
The research in [64] focuses on a four-layer deep neural network based on light traps with a search and rescue optimization strategy for identifying leaf folders and yellow stemborers. The search and rescue optimization approach was employed in the deep neural network to find the ideal weights to enhance the convergence rate, reduce the complexity of learning, and increase detection accuracy. The proposed method achieved 98.29% pest detection accuracy.
The proposed work in [65] studies the monitoring of spotted wing drosophila IT using image-based object detection with deep learning. The authors trained the ResNet-18 deep CNNs to detect and count the insect in question. From an image captured from a static position, an area under the precision–recall curve (AUC) of 0.506 was obtained for the female and 0.603 for the male. From the observed results, it was concluded that it is possible to use deep learning and object detection to monitor the insects.
In [66], the authors performed automatic insect detection where they first used a spectral residual model; different color features were then extracted. In the end, whiteflies and thrips were identified using a support vector machine classifier. The classification accuracies for the whiteflies and thrips were 93.9% and 89.8%, respectively. As for the detection of the trap, a precision of 93.3% was obtained.
To identify whiteflies and thrips, researchers in [67] presented an image-processing approach that included object segmentation and morphological processing of color features combined with classical neural networks. The images were acquired under controlled conditions, in a laboratory environment, from sticky traps moved from greenhouses. The proposed algorithms achieved 96% and 92% precision, respectively.
In [68], a pheromone-trapping device was developed. In this work, the original image was cropped into several sub-images with 30% overlap. These sub-images were then used to train the tested models, which were the images reconstructed with the detections performed. The results showed a mean average precision (mAP) of 94.7%.
Using IoT and deep learning frameworks, the work in [69] provided a real-time remote IT monitoring system and insect identification algorithm. The authors used the faster R-CNN ResNet 50 and an average accuracy (using different databases) of 94% was obtained.
The study in [70] used machine vision and deep learning to detect and count Aphis glycines automatically. To detect the insect, the authors used a sliding windows approach with a size of 400 × 400 pixels to slide over the acquired images with a stride of 400 pixels. Each image framed by the sliding windows in each step was fed into the faster R-CNN developed by the authors. The results demonstrate the high potential of the method proposed.
In [71], the authors proposed using low-cost cameras to capture and upload images of insect traps to the cloud. The authors used R-CNN and YOLO models to detect the insects, whitefly in this case, in yellow sticky traps. They used a public data set [72] for training the models. However, the images used for training were acquired under controlled illumination conditions. The authors do not explicitly state whether the images were split or used as a whole. The model with the best mAP was YOLOv5x, with a mAP of 89.70%.
The technique proposed in [73] combines high-tech deep learning with low-tech sticky insect traps. The authors propose a high-throughput cost-effective approach for monitoring flying insects as an enabling step towards “big data” entomology. In this work, the traps were captured a few days after being composed of a high number of insects, and images of them were only obtained after that capture, under laboratory and field conditions. The images were split into segments of 500 × 500 pixels. The authors concluded that the model was more likely to miss important images than it was to incorporate irrelevant ones.
Regarding the work in [74], the authors used yellow insect traps for the detection of Trioza erytreae and Scaphoideus Titanus Ball using image-processing techniques and the FASTER R-CNN and YOLOv4 models. In order to promote the robustness of the models, images of the traps were taken by a 12-megapixel camera under different light conditions, backgrounds, and distortions. The authors did not perform splits on the images in order to train the models with tiles of the images instead of the images as wholes. The authors concluded that the models performed poorly with and without image processing.
Considering the methodologies stated, open-source solutions may be employed to aid in the detection process’s implementation. In [75], this approach is followed, using the Computer Vision Annotation Tool (CVAT) (https://github.com/openvinotoolkit/cvat, accessed on 9 December 2021), which contains a feature for automatic annotation/labeling. This software can also be powered by Nuclio (https://nuclio.io/, accessed on 9 December 2021), a serverless technology that allows deploying trained models to CVAT. This tool was analyzed and it was concluded that it could be interesting to use it given the infrastructure of the project, as CVAT allows to create and carry out annotation tasks and, with Nuclio, deploy trained models [76].
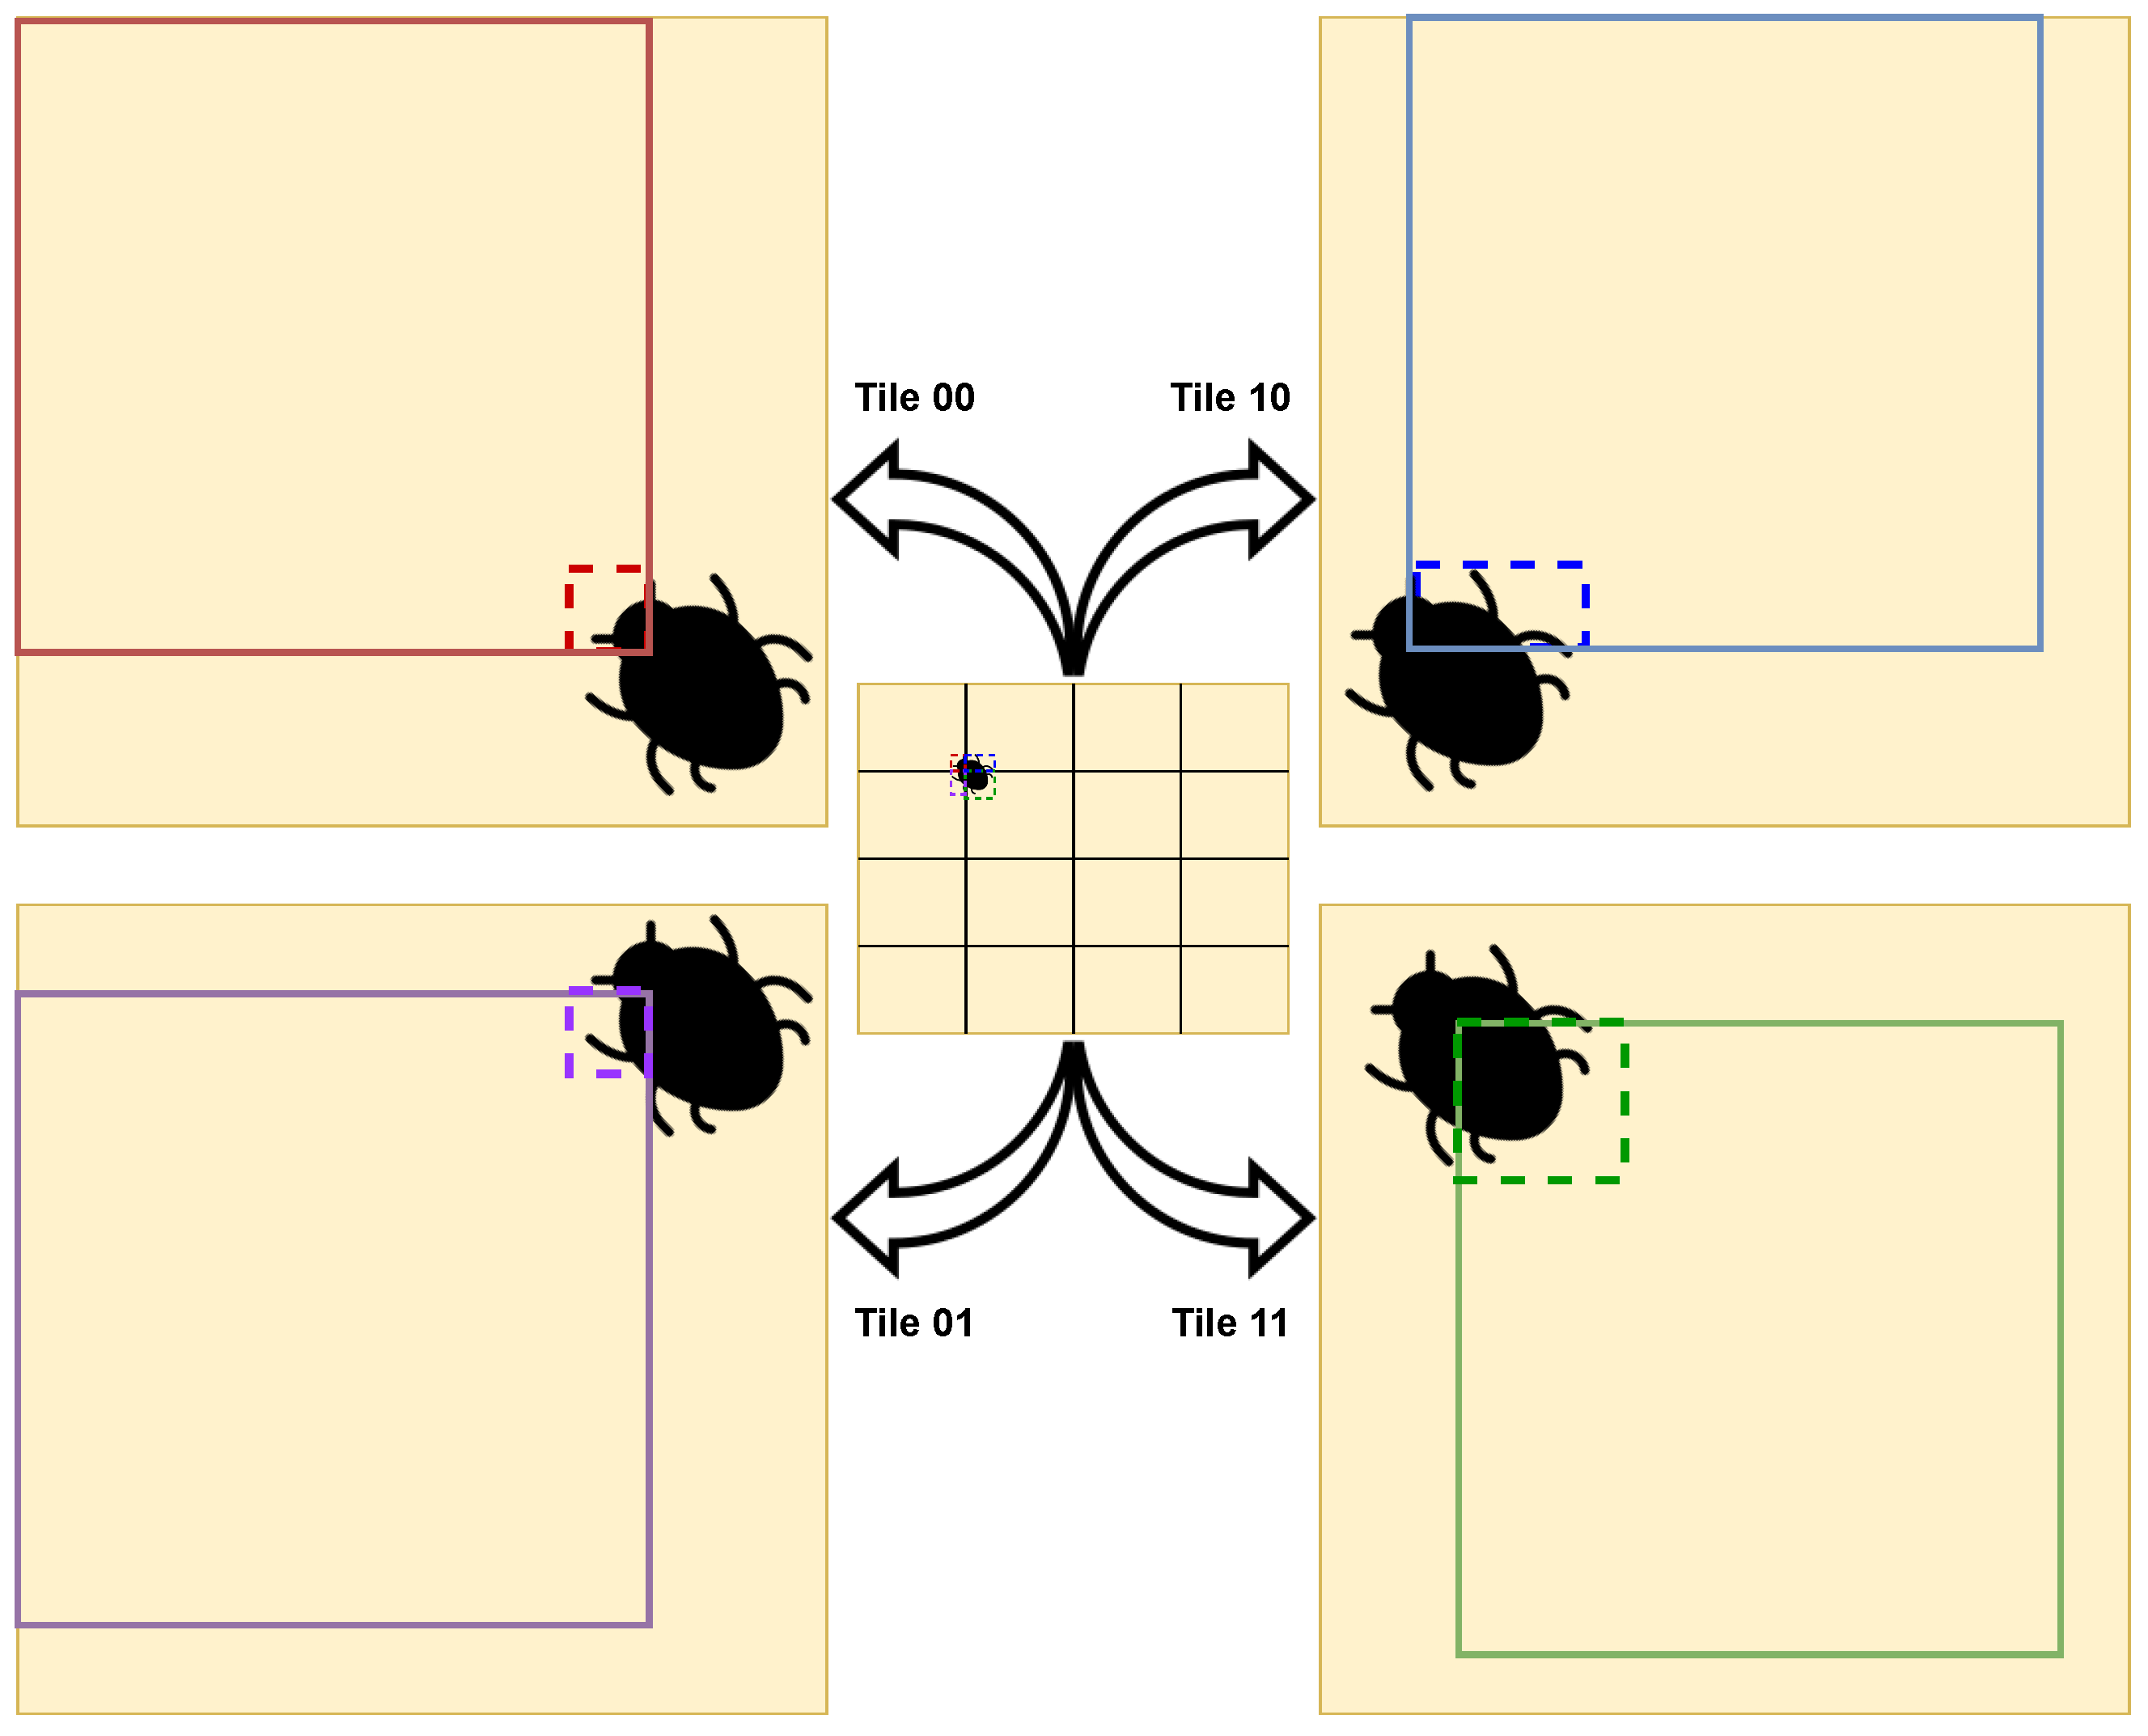
From the state-of-the-art, it is not always clear that the approach used to split the image into tiles will feed the trained model. This is important, because in the case of splitting the image, in order to optimize the model performance, duplicated detections can arise. This problem is addressed in this paper and an approach to solve it is demonstrated. Furthermore, the main contribution of this paper was to test the application of YOLOv5 in detecting insects in traps (tomato plantations in this case). From the reviewed works, using YOLOv5, images acquired under controlled conditions (laboratory or greenhouses) were usually used. Thus, this paper contributes to the future developments of insect detection in images that are split using YOLOv5 and an approach that optimizes the performance of the trained model and the non-appearance of duplicate detections. Furthermore, this paper contributes to the monitoring and detection of insects in crop traps and, consequently, to the prediction of events in the agricultural field, by providing a new metric to be analyzed and correlated with other data from the crop.

3. Materials and Methods

In this article, a method was developed to detect insects in IT, yellow sticky cards, placed in agricultural fields. The work carried out in this article arose in the context of AI for new devices and technologies at the edge (ANDANTE) [77] project and, consequently, the data used in this work were provided by project partners. To carry out this work, first, the image was prepared to feed the artificial intelligence (AI) model, then the model was trained, and the results were evaluated and analyzed. This section presents the data set used and the pipeline of the method developed.
Given that there was no manual annotation on the images provided, the first stage of development was to manually annotate some yellow sticky cards and insects in the images. The open-source software CVAT, its application programming interface (API), and Nuclio (open source and managed serverless) were used in the developments described, making model training, manual and automatic detection, data management, and selection easier.
CVAT and its API allowed the creation of a website where all images were available and could be annotated manually and automatically. It was through CVAT that the bounding boxes of the yellow sticky cards and insects were manually created in the first phase. Through its API, it was possible to select images and access those same bounding boxes in the desired formats. With this access, everything was ready to start the development and training of the models with manual annotations. After the training, Nuclio was used to put the developed models into practice in CVAT, i.e., it became possible on the website to select a set of images in CVAT and apply the developed models to them with the immediate output of the results, in this case, the automatic bounding boxes of the yellow sticky cards and insects. This is because Nuclio allowed incorporating the developed models with the extra processing done, such as the splitting of the images into tiles and their consequent reconstruction, already with the respective automatic bounding boxes resulting from the annotations made by the model, thus providing CVAT with the coordinates of the bounding boxes to be placed on the image concerned. From CVAT API, it is thus possible to obtain the bounding boxes presented in each image and, consequently, the number of insects on the image in question.

3.1. Data Set

The data set used was related to Portuguese tomato plantations in the Ribatejo region, namely Valada, Castanheira, and Lezria, where ANDANTE Portuguese partners collected the data. Information about the tomato crop fields can be found in Table 1.
The tomato cultivation fields where data were collected were fully mechanized, from planting to harvesting. The crop consists of natural tomato varieties, obtained from cross-pollination, without any kind of genetic modification. Sowing was in a greenhouse, starting at the end of January. Seedling production lasted about one-and-a-half to two months. The crop was staggered with a cycle of about 120 days, depending on the tomato varieties, and the start of planting took place between the end of March and the beginning of June. Planting was in 1.52 m wide ridges. Planting density was about 33,000 plants per hectare with drip irrigation.
The data set used contains 5646 images of IT captured by cameras placed in front of the traps. These were webcams with 12 megapixels. The traps were composed of chromotropic cards, yellow cards in this case, with glue, yellow in order to attract insects, such as bemisia tabaci. In addition, pheromones were placed in delta-type traps in order to attract the male insects so that they did not create offspring, such as helicoverpa armigera. The chromotropic leaves and pheromones were used in the biotechnical fight. In the whole data set, only 4637 images were considered legitimate since several did not correspond to IT or were not adequate to improve the model’s performance. These images were considered invalid. This filtering is shown in Table 2.
The images were captured every day, between the dates shown in Table 2. Furthermore, the acquisition was mostly done between 11 a.m. and 8 p.m. at different times of the day (11 a.m., 11.30 a.m., 12 midday, 4 p.m., 4.30 p.m., 5 p.m., 7 p.m., 7.30 p.m., and 8 p.m.), usually nine images were captured per day. The ANDANTE partners defined this configuration based on their understanding of the insect’s behavior.
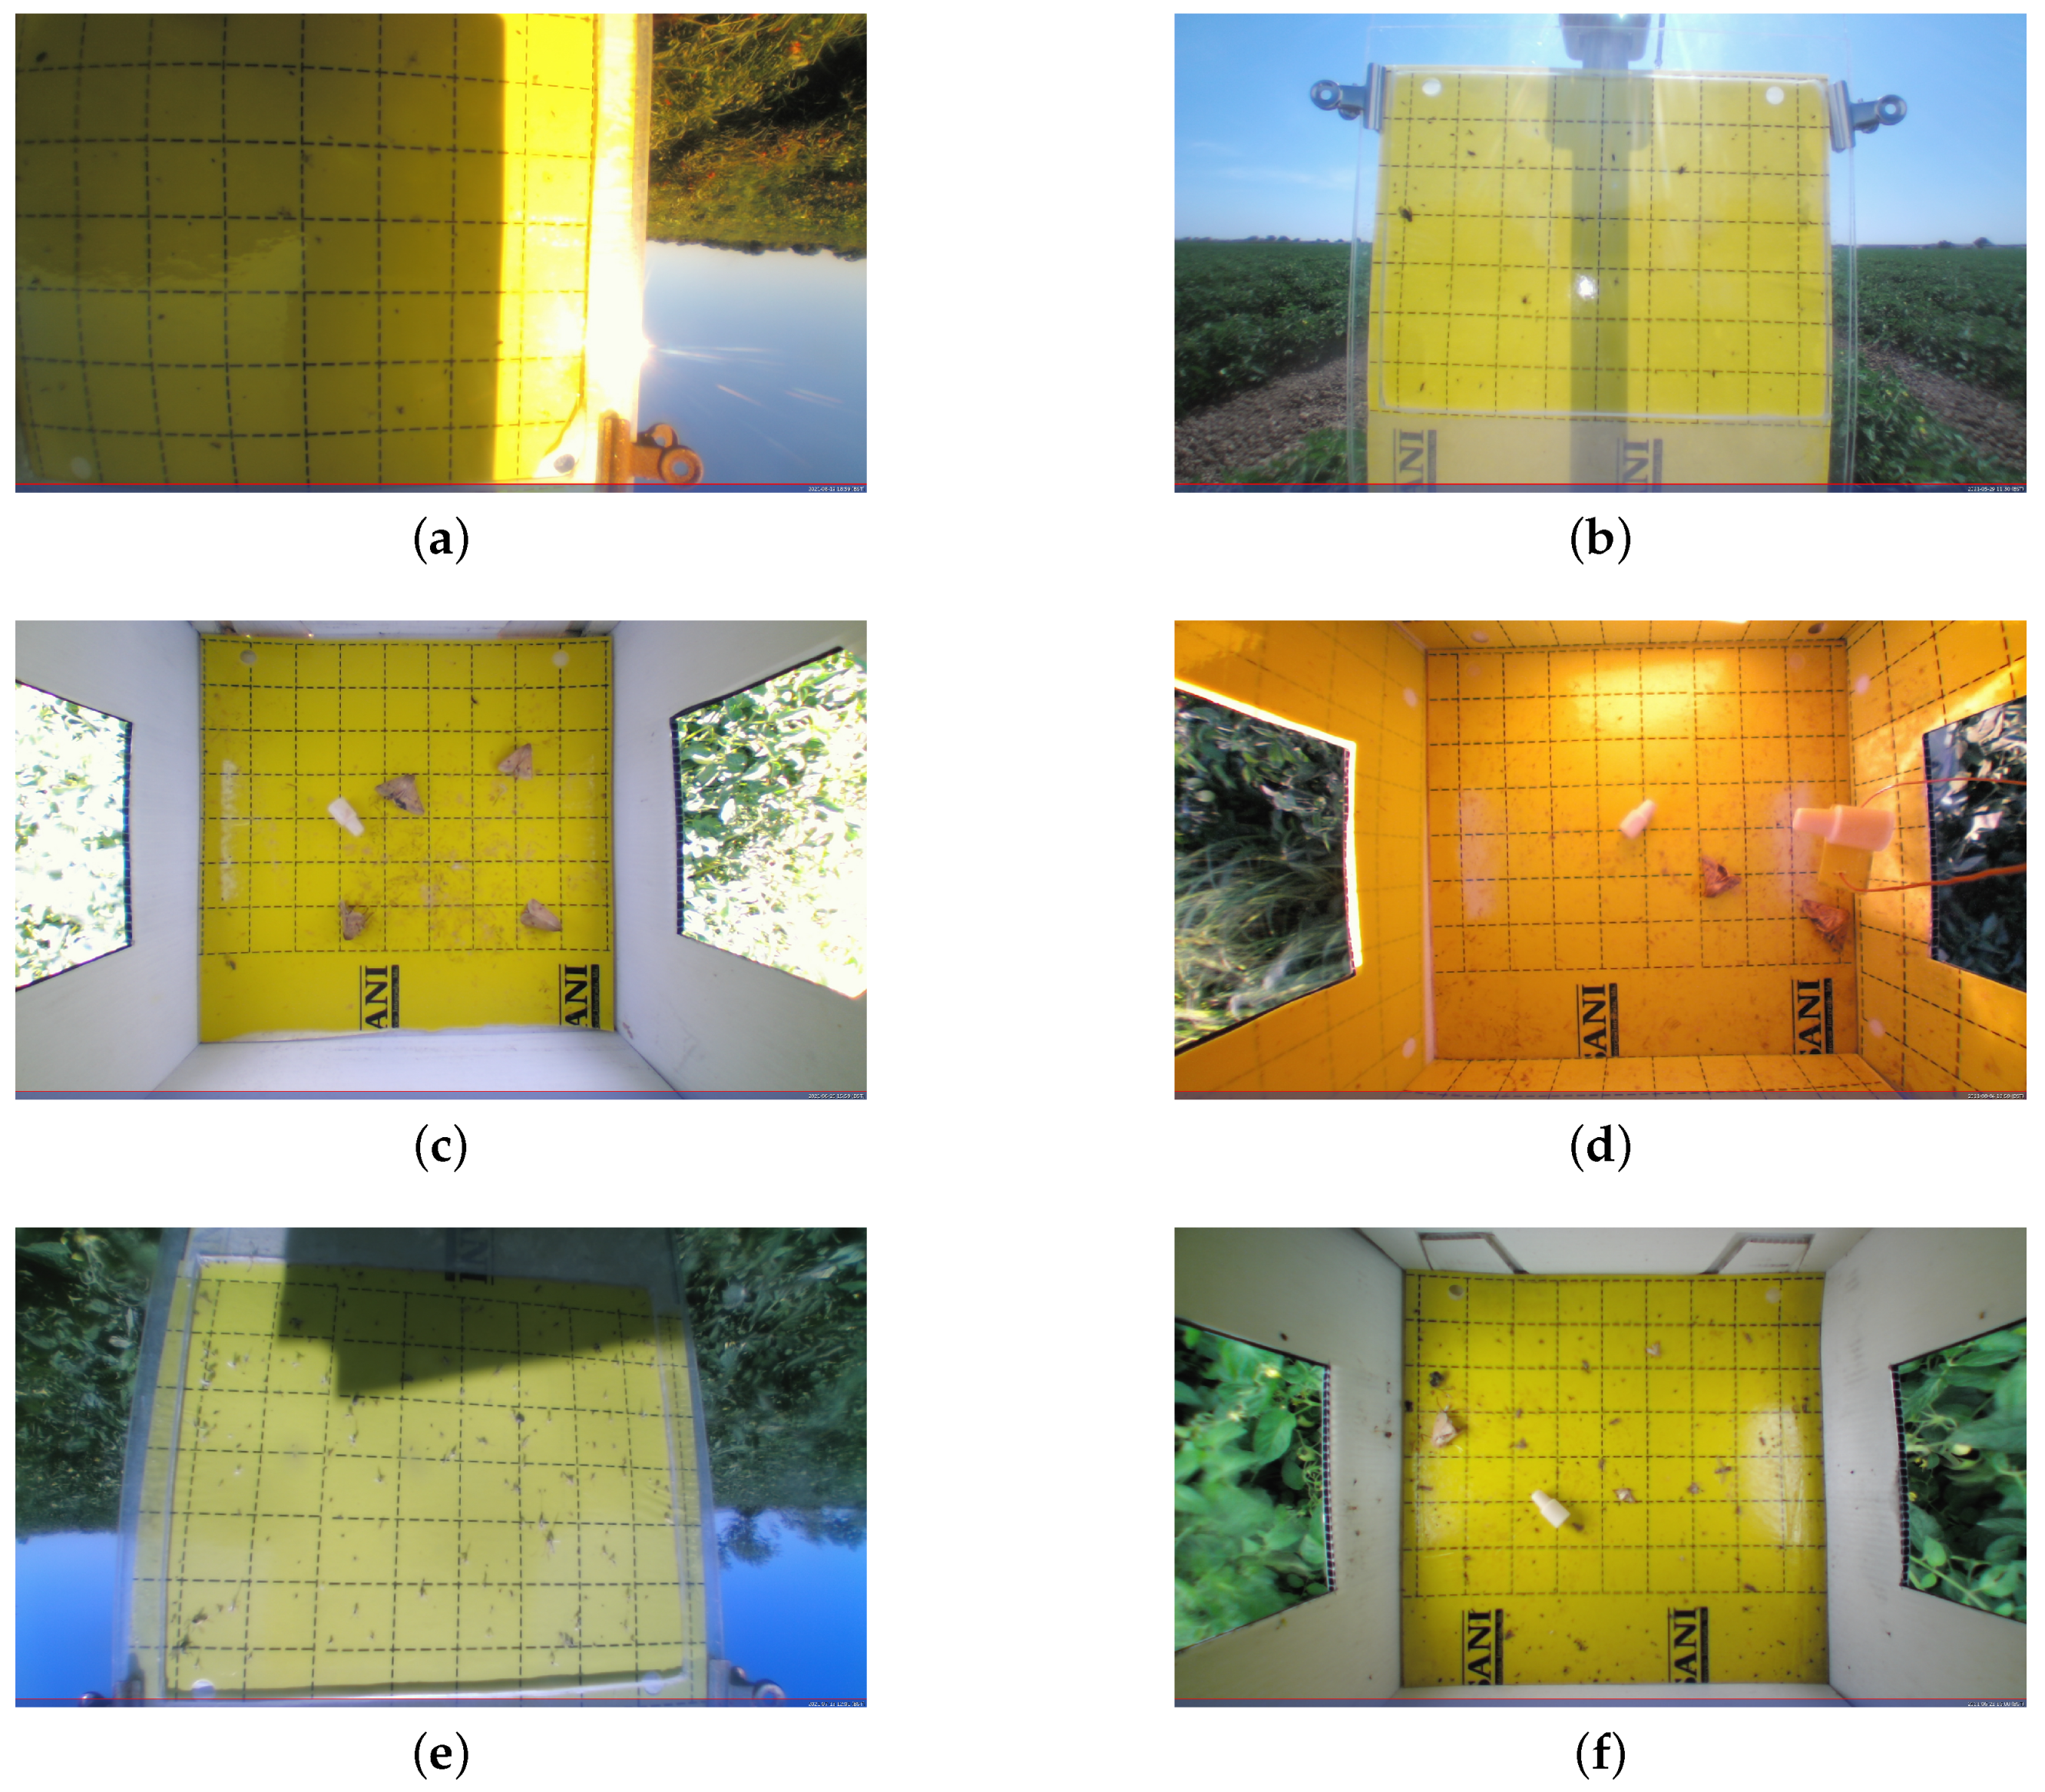
Figure 1 presents an example image for each of the six traps utilized.

3.2. Method Pipeline

An analysis of the images from the data set was carried out; a method was chosen in which the trap was first detected and then the insects presented in that trap through the bounding box resulting from the detection of the trap, the yellow sticky card.
Since ITs differ physically and are sensitive to varied lighting circumstances during image acquisition, we exclusively employed AI models for object detection, abandoning the usage of manual image-processing processes for insect detection. In addition, because the colors of the insects were generally the same as the colors of the lines on the yellow sticky cards, only AI models were used. Taking this into account, and the literature review [63,78,79,80,81,82,83], it was observed that AI models were increasingly being used, performing better and replacing more traditional methods that involved manual image processing; the manual image processing was discarded despite being considered at an early stage. Regarding the work in [79], it was verified that a YOLO model could perform better than the model used in the research for segmenting blueberries from an input image. In [63], the authors concluded that the faster R-CNN proposed had better results than techniques employing manual feature extraction for detecting whiteflies and thrips from sticky trap images in greenhouse conditions.
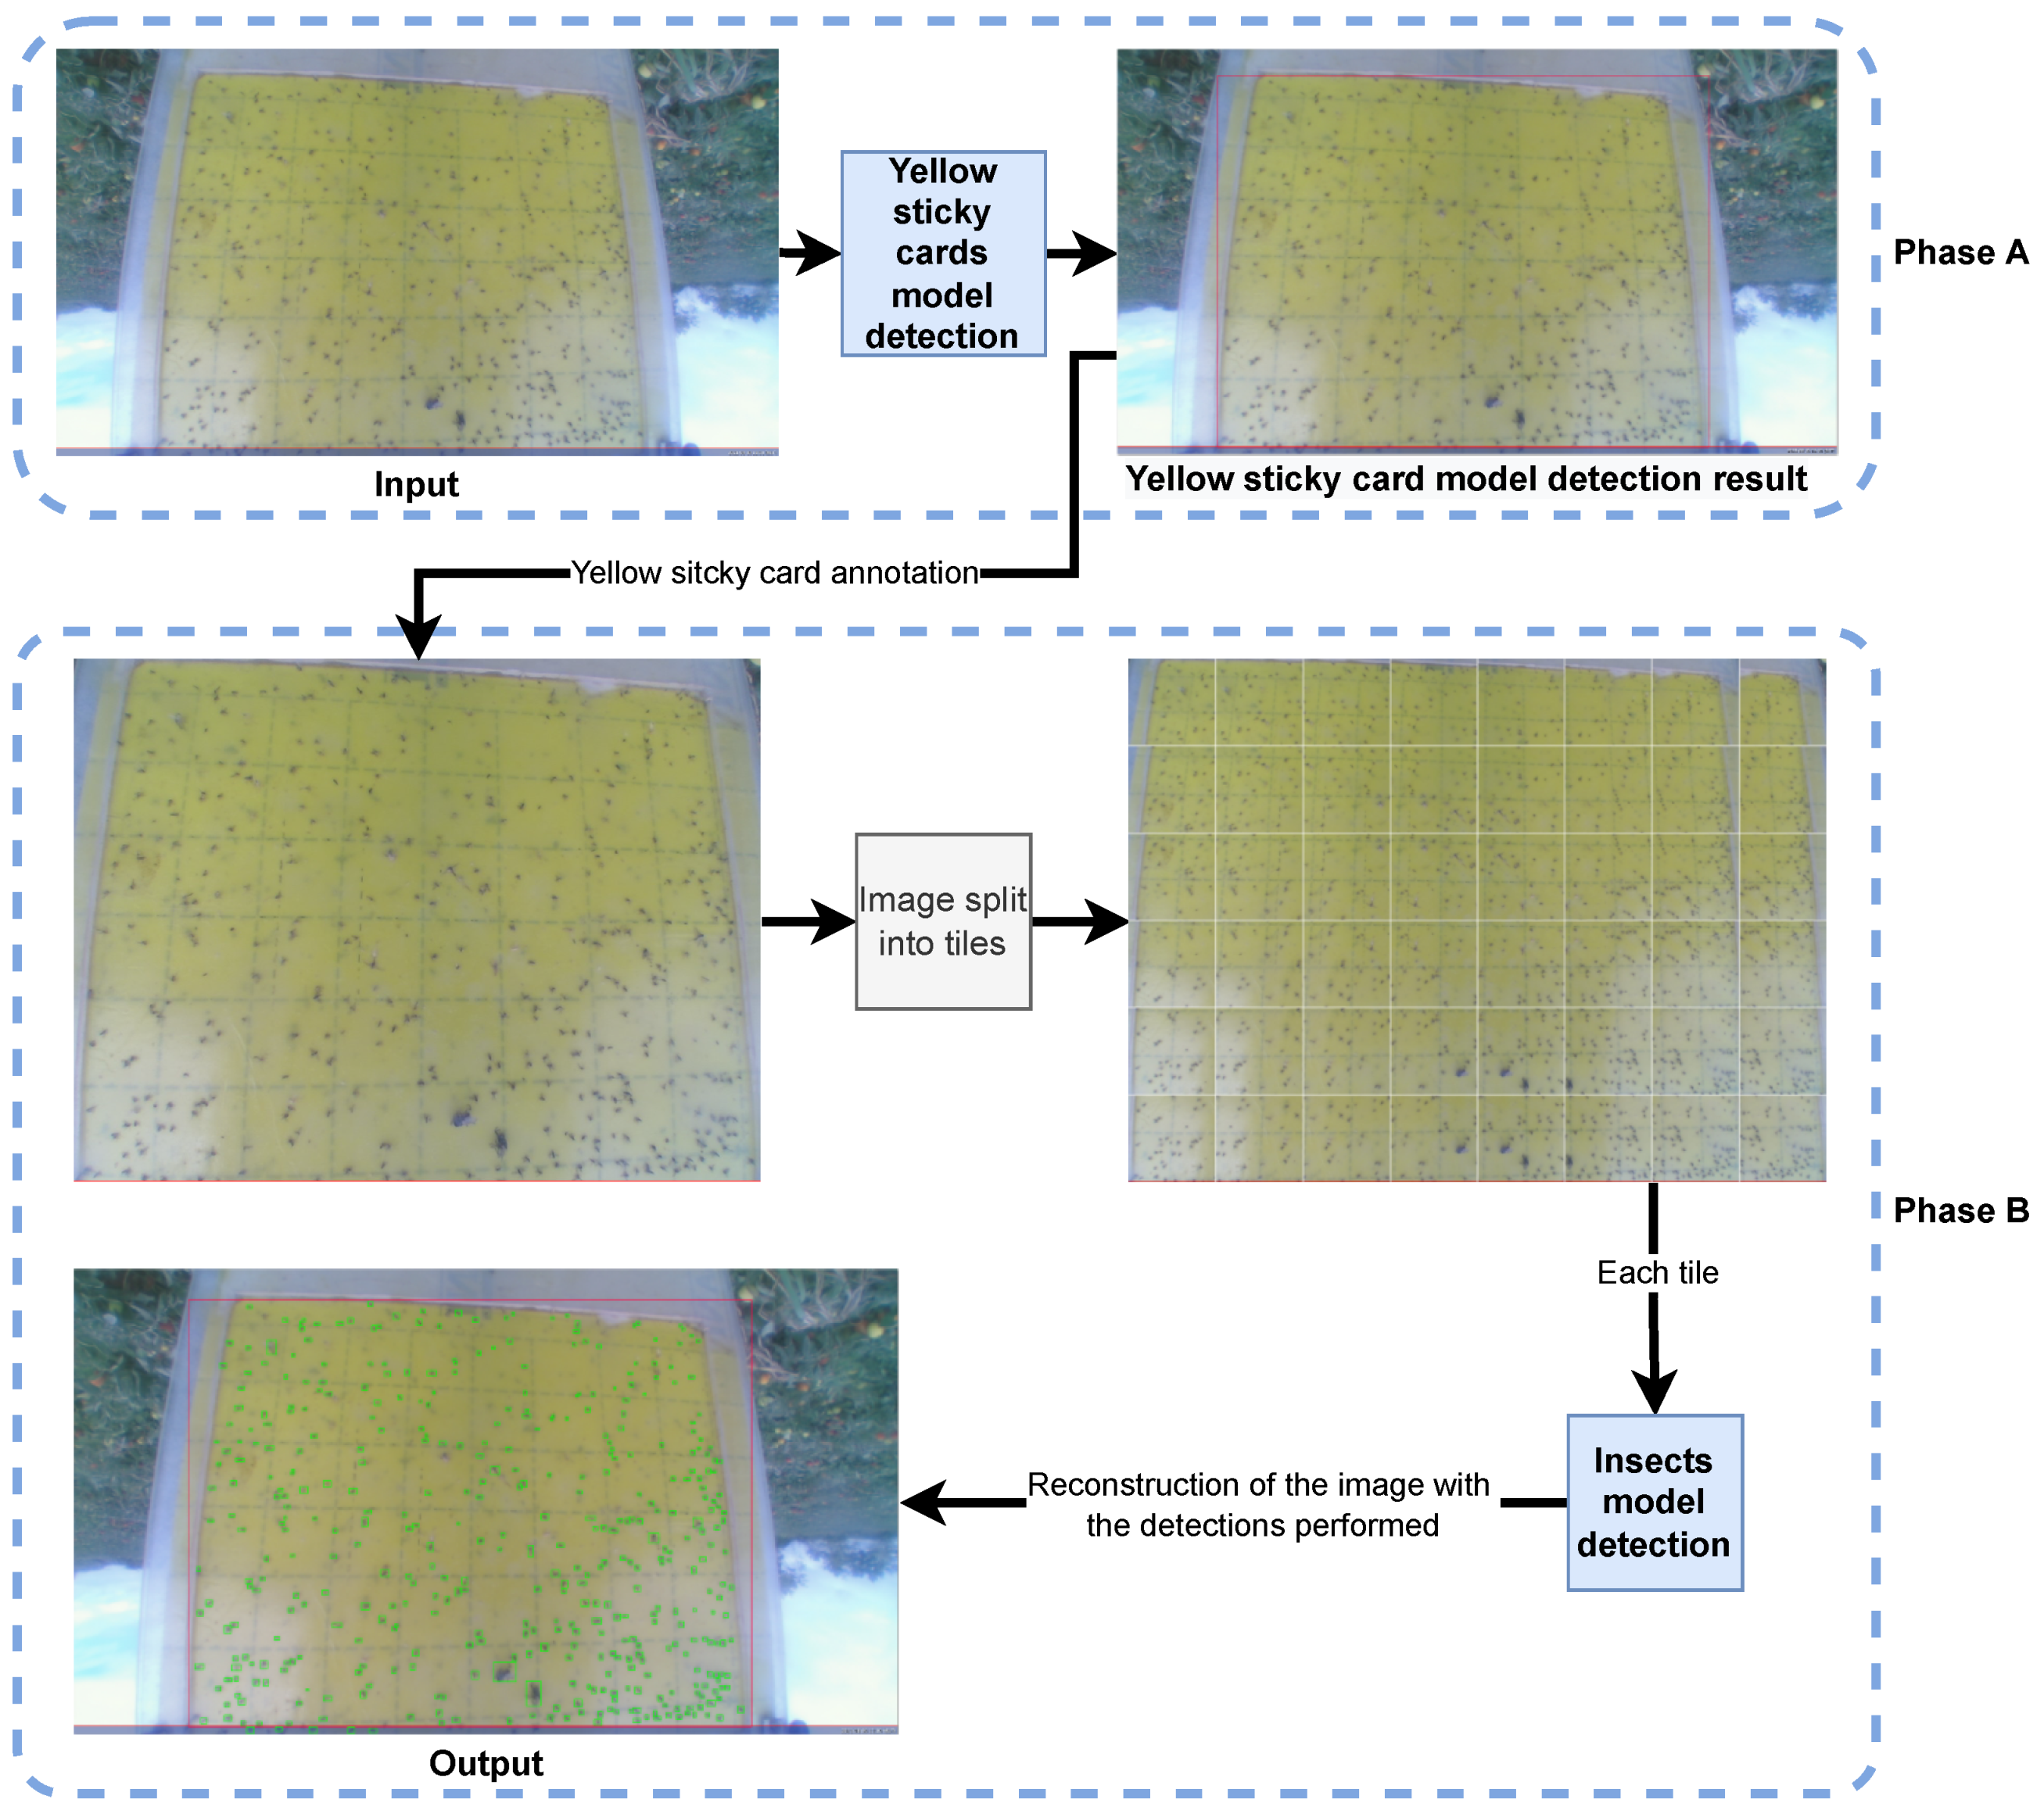
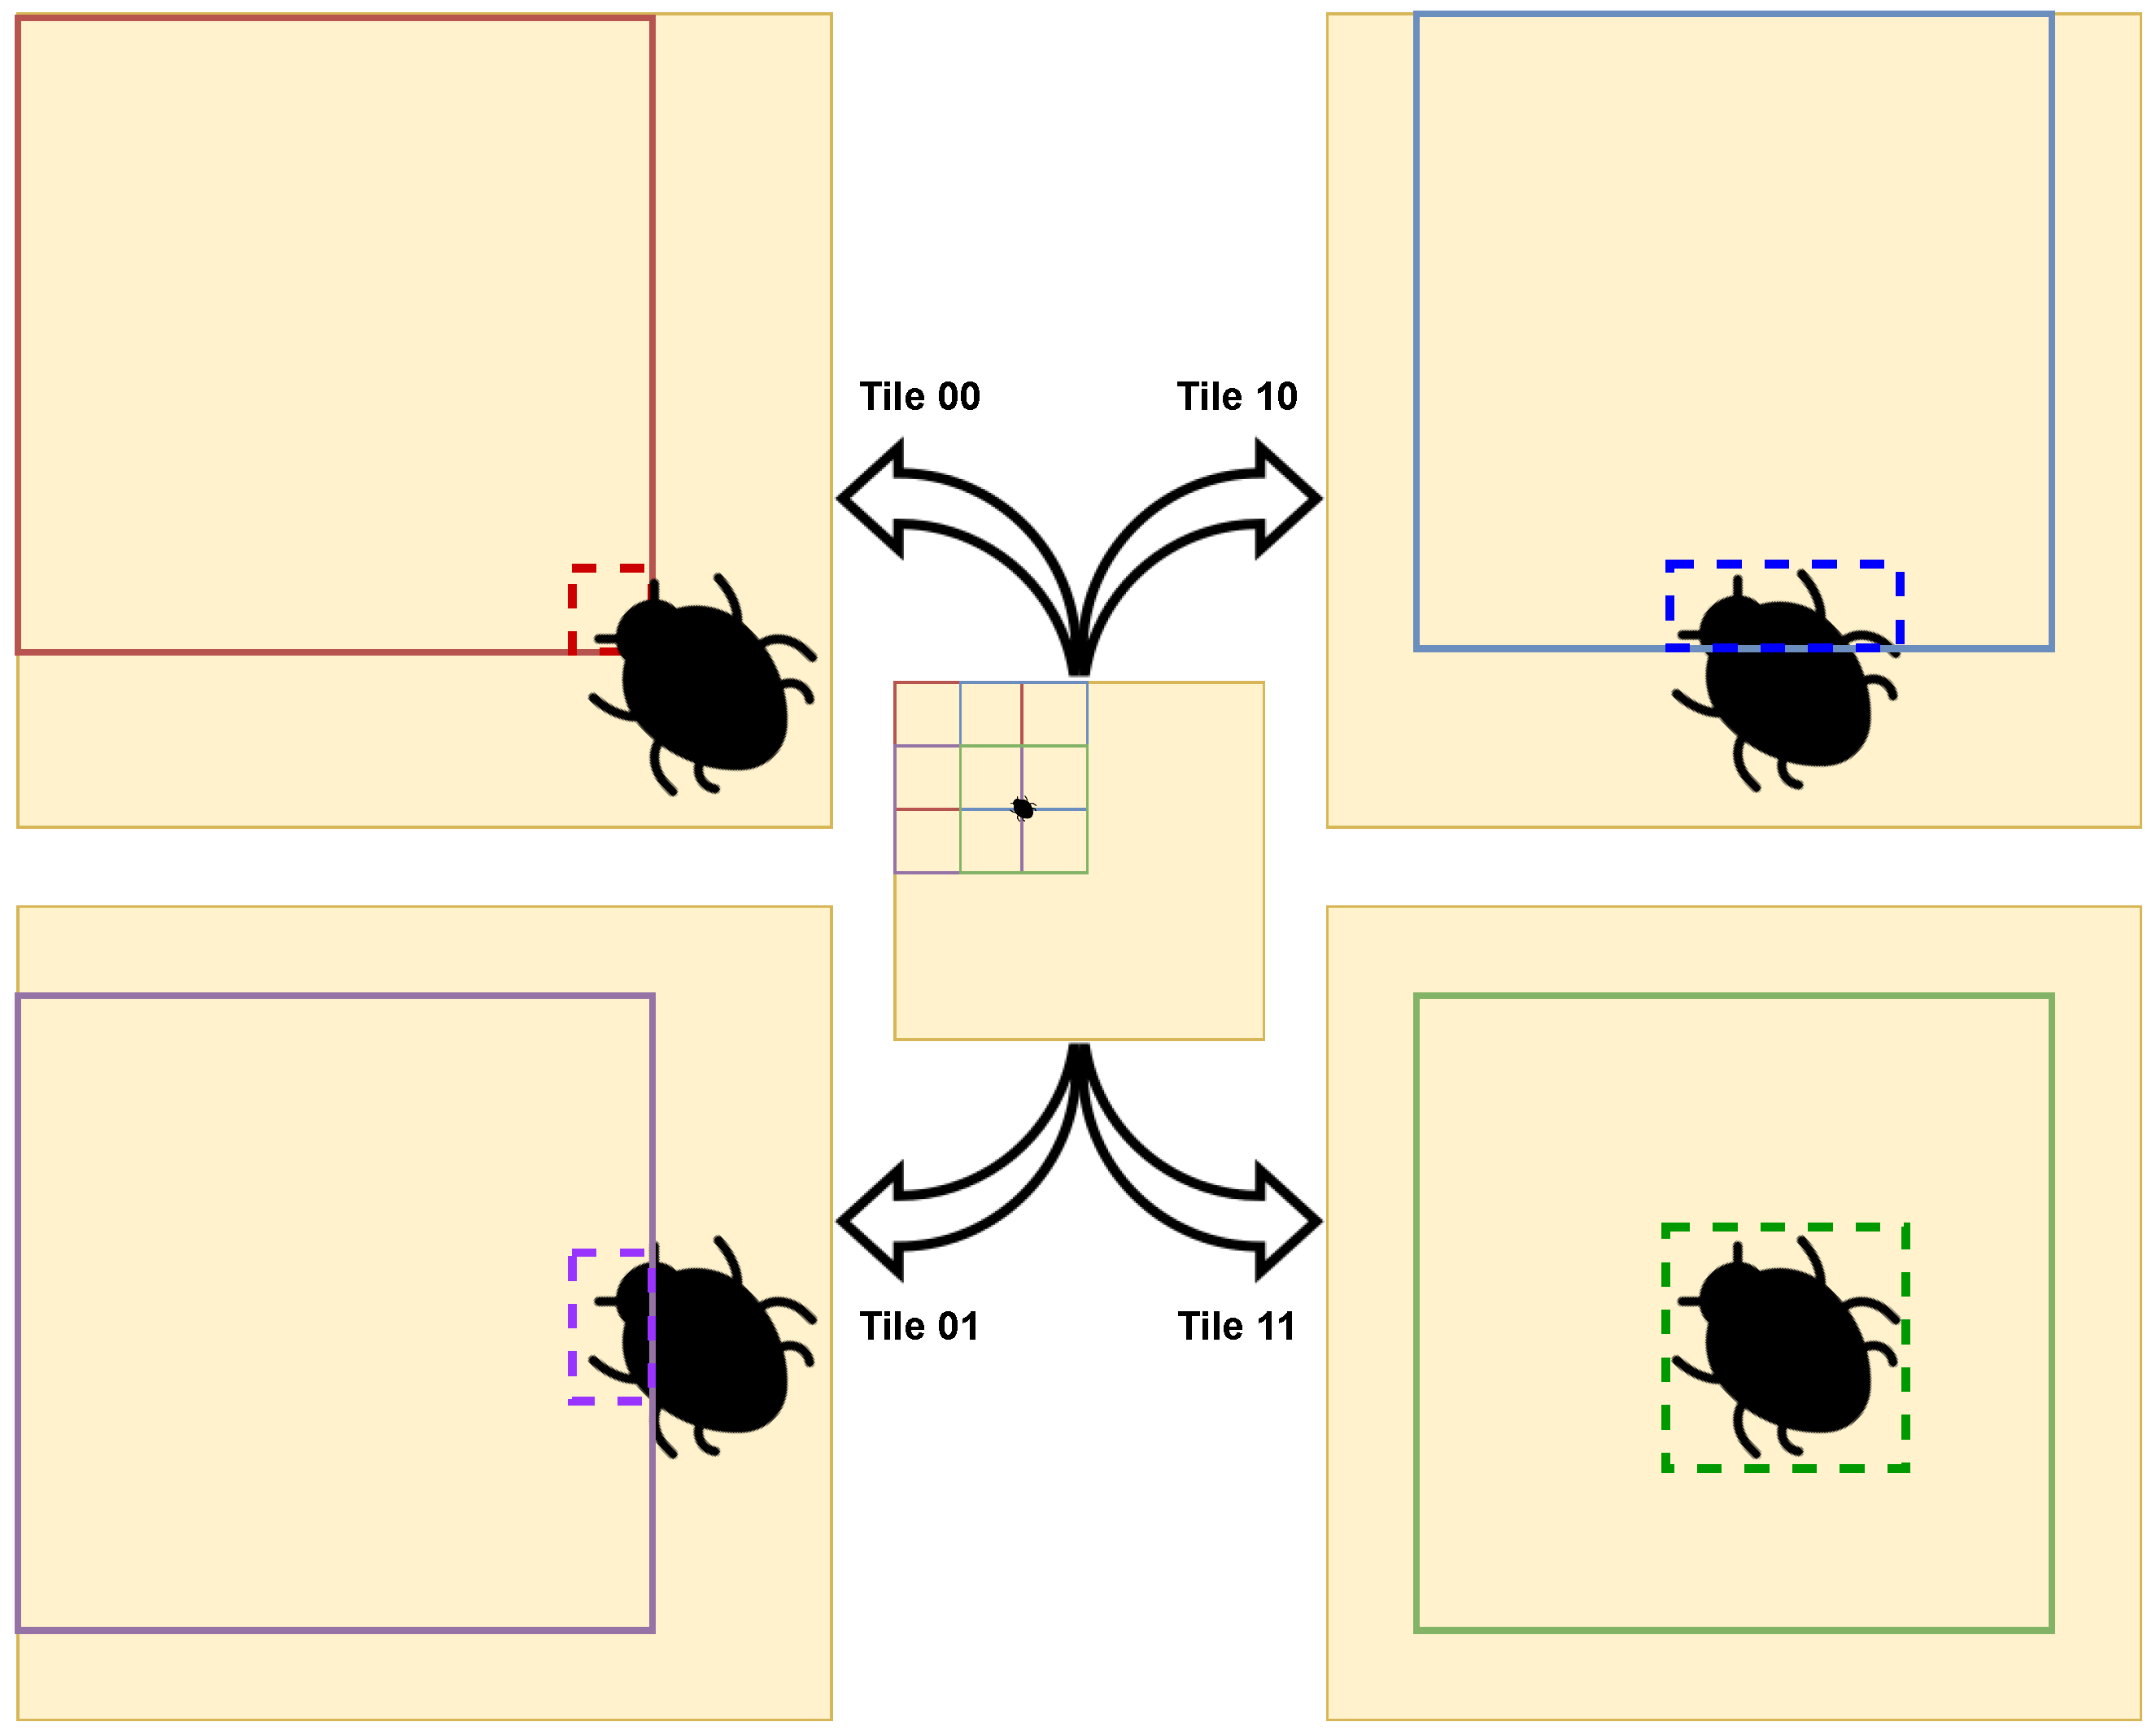
The insect detection process went as follows: the yellow sticky card in the original image was detected; the resultant bounding box was divided into tiles; the insects on each tile was detected; the original image was rebuilt with all bounding boxes. For the sake of improving the performance and results, cropping techniques were adopted [84]; the bounding box corresponding to the yellow sticky card, i.e. the result of the yellow sticky card detection model was split into tiles, and these tiles were used to train the insect models tested. From the performed detection, the number of insects presenting in each image can be directly inferred. Figure 2 depicts this pipeline split into two phases, A and B.
The YOLOv5 object detection model was used to perform the insect detection task. This choice is justified since YOLO is a widely used model that has been proposed for numerous object detection-based tasks and, its most recent version, the one used in this work, is showing an increasing usage trend [81]. Considering this trend and other works already mentioned in Section 2, it was decided to use YOLOv5 due to its potential performance in object detection tasks. Transfer learning was applied to train the model for insects and yellow sticky card detection.
The YOLOv5 model has different versions (YOLOv5s with a small size, YOLOv5m with a medium size, YOLOv5l with a large size, and YOLOv5x with an extra large size) and the basic structures of all these versions are the same. Their differences rely on the size of the model, with a multiplier that influences the width and the length (deepness) of the network. Generally, the larger the model, the better the performance at the expense of more processing time and required memory [85].
The parameters presented in Table 3 were used in all developments involving the use of YOLOv5.
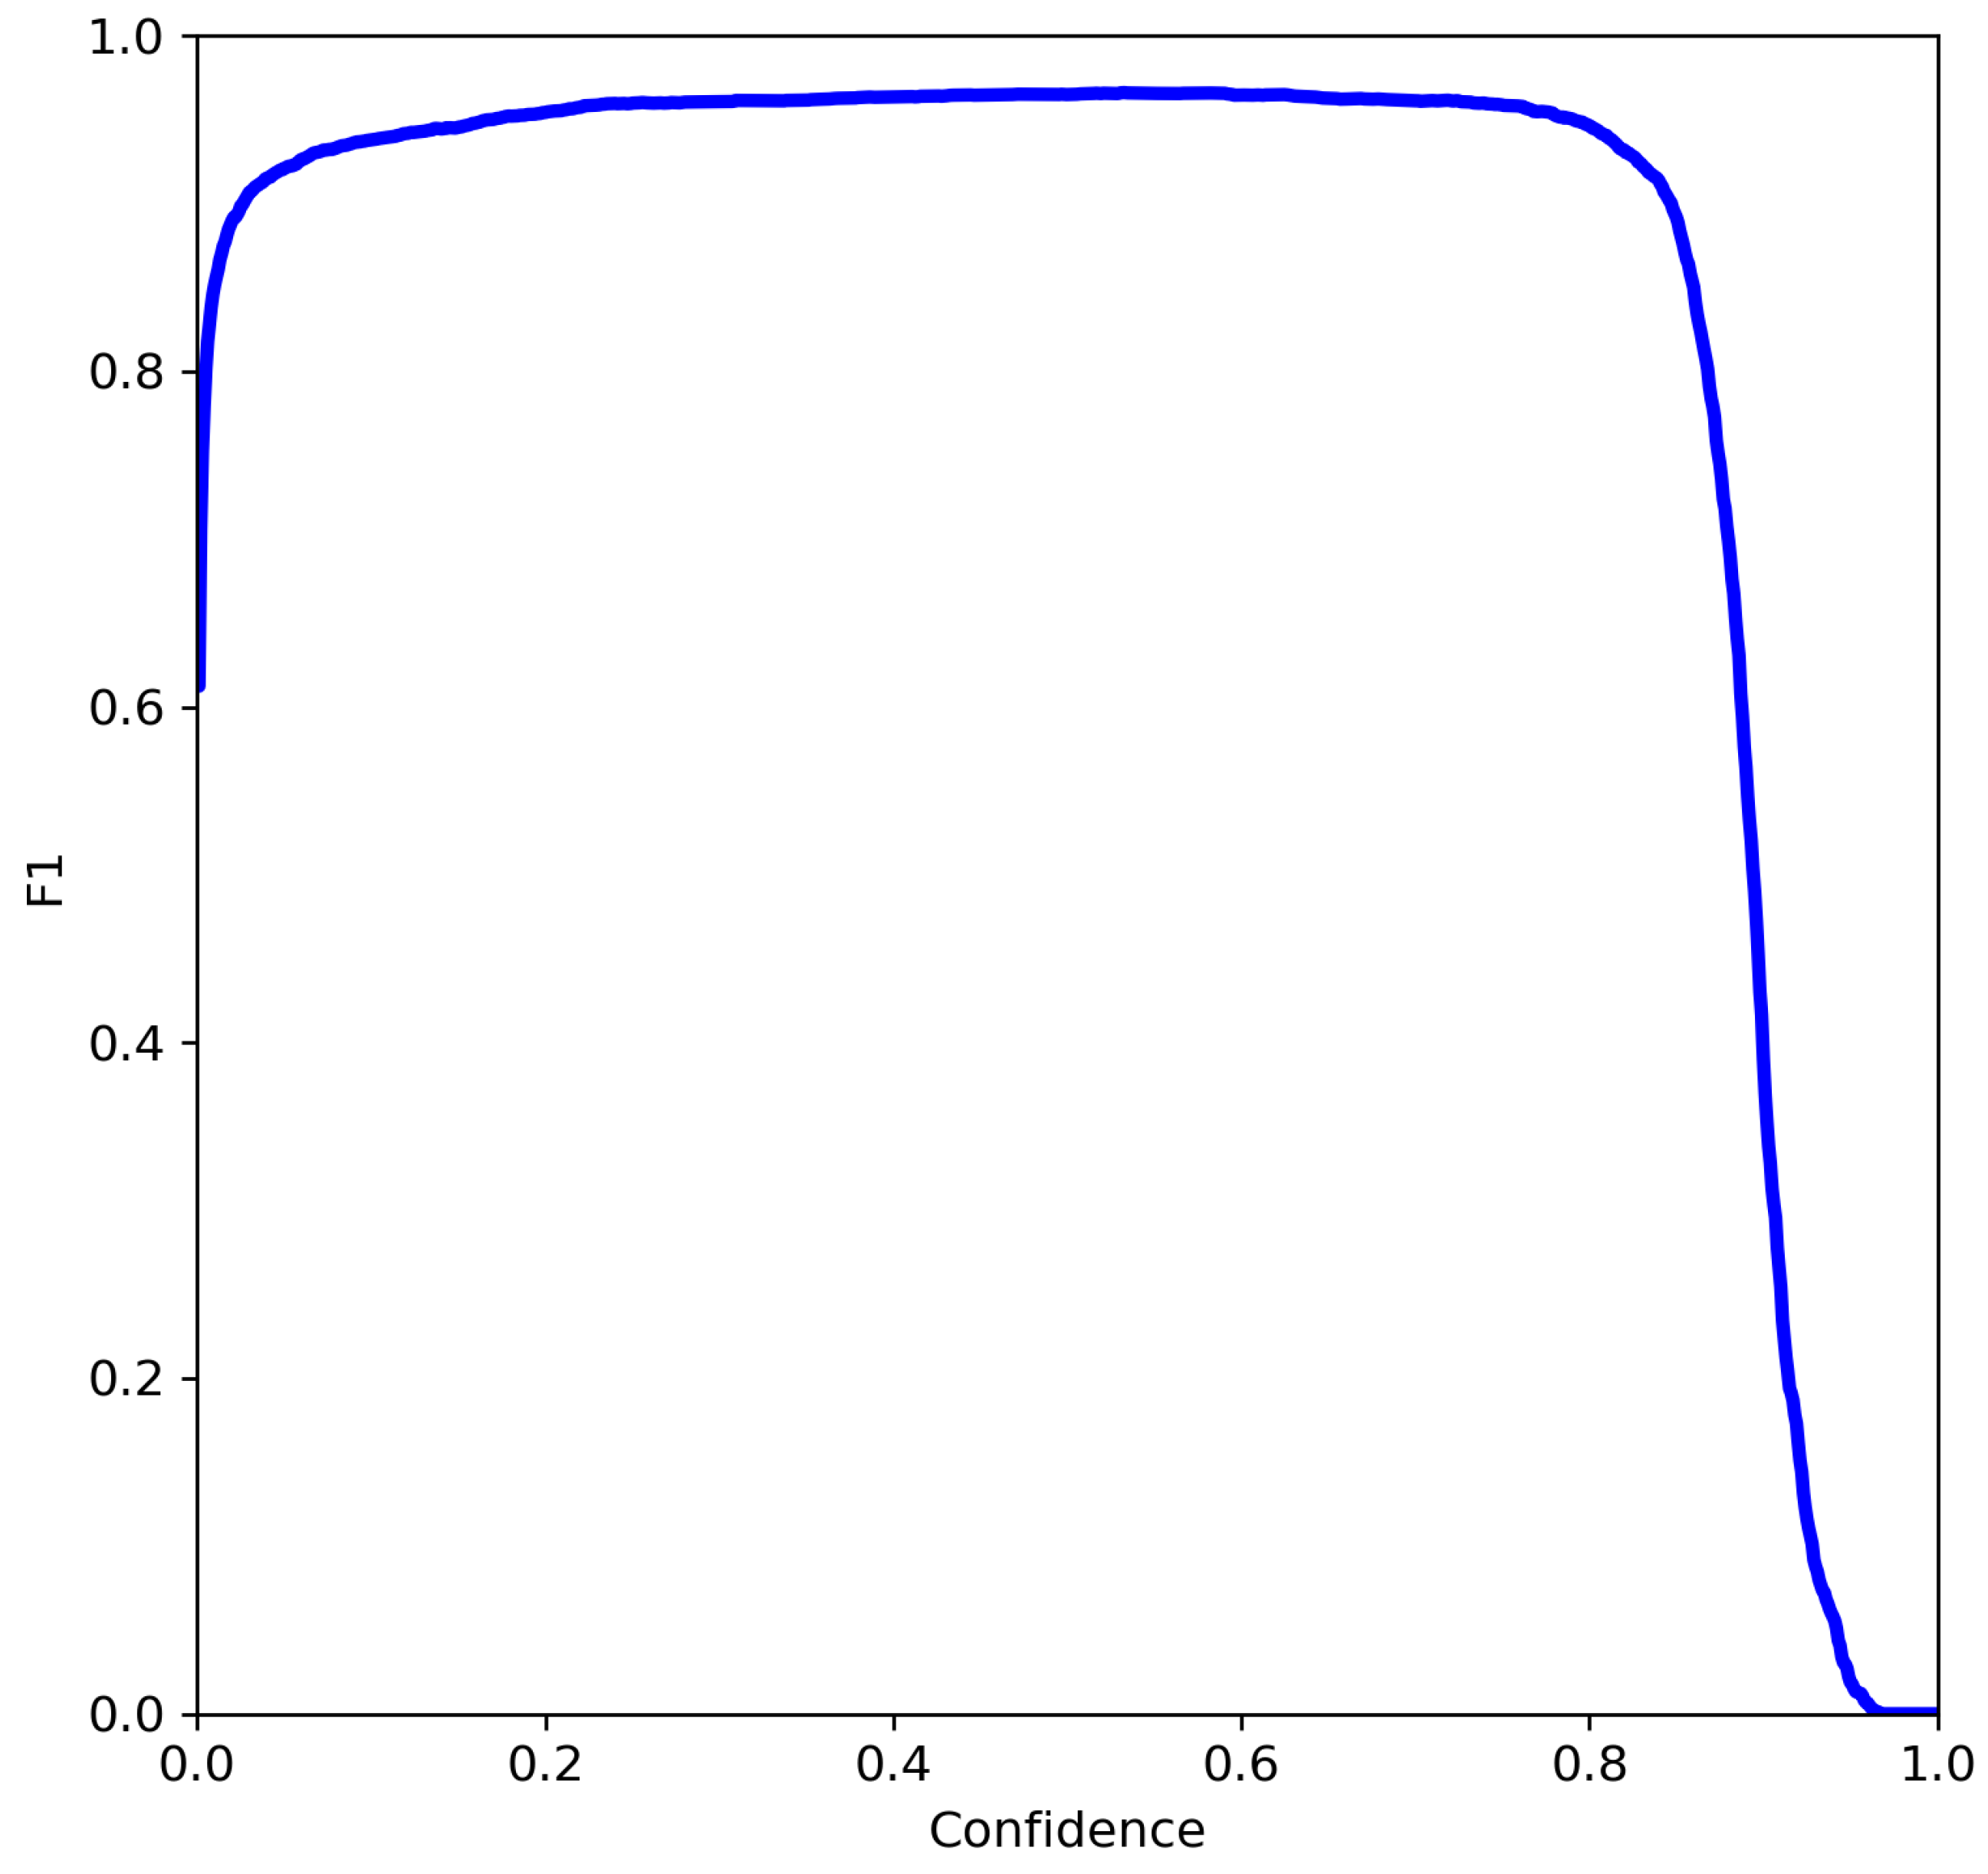
The results of YOLOv5 were obtained and analyzed through MLflow [86] integration. This integration made it possible to visualize the mAP_0.5, mAP_0.5–0.95, precision, recall, and loss during each training epoch. At the end of the training process, it was also possible to observe the F1 curve, as well as precision/recall curves. Of all the metrics obtained, due to the nature of the problem, the evaluation of the results was based on the mAP_0.5, mAP_0.5–0.95, precision, recall, F1 score, and F1 score curve.
The mAP, corresponds to the mean over classes, of the interpolated average of precision ( A P ), of each class (out of N classes), given by the area under the precision/recall curve [87], and is calculated as follows:
m A P = 1 N i = 1 N A P i
The precision measures the model’s accuracy in classifying a sample as positive. It is calculated as the ratio between the number of positive samples correctly classified to the total number of samples classified as positive:
P r e c i s i o n = T r u e P o s i t i v e s T r u e P o s i t i v e s + F a l s e P o s i t i v e s
The recall of the model assesses its ability to recognize positive samples. The more positive samples identified, the larger the recall. The recall is computed as the ratio of positive samples that are properly categorized as positive to the total number of positive samples:
R e c a l l = T r u e P o s i t i v e s T r u e P o s i t i v e s + F a l s e N e g a t i v e s
The F1 score combines the precision and recall of a classifier into a single metric by taking their harmonic mean. The F1 score formula is shown here:
F 1 - S c o r e = 2 P r e c i s i o n R e c a l l P r e c i s i o n + R e c a l l

4. Results

4.1. Yellow Sticky Card Model Detection

Phase A of the detection pipeline (see Figure 2), concerning yellow sticky card detection, was developed to use detection data to later detect the insects contained in the sticky cards.
From the valid images, explained in Section 3.1, 1272 insect trap images were manually annotated, which were the images of the data set used in this phase; 80% of the data set was used for training, 10% for validation, and the remaining 10% for testing. The images were resized to 640 by 640 pixels in the training process.
The lightweight YOLO model, YOLOv5s, was enough to achieve near-perfect results, as shown in Table 4, with the mAPs, precision, and recall reaching the maximum possible values or very close to them. With the developed trap detection model achieving good results, all of the images that had not been manually annotated were passed through the developed model and the correct detection was verified by the model.

4.2. Insect Model Detection

The insect detection model was developed considering only the bounding box corresponding to the detection of the yellow sticky card. The YOLO model was again used, but in this case, more powerful versions of YOLOv5 were tested.
Initially, the tiles were obtained with increments of the base tile sizes; in cases where these increments were not divisive of the widths and/or lengths of the images, the tiles in the margins (right and/or bottom) were smaller than the remaining tiles (Figure 3c); this approach was termed the pure split (PS). In the second phase, in order to keep all tiles with the same dimensions, black/yellow/white borders were added to the tiles with smaller dimensions (Figure 3d); this approach was termed pure split with border (PSB). However, these approaches were discarded since it was possible for an insect to be split between tiles in these approaches. This could lead to two detections representing the same object—one corresponding to the part of the object that was in a certain tile and the other to the part of the object that was in a tile in the vicinity of the previous one. This situation is illustrated in Figure 4.
This situation would complicate the process of reconstructing the bounding boxes in the original image as the creation of the new bounding boxes (based on the original ones) would become complex and there would be a wide variety of possibilities when verifying which bounding boxes belong to the same object.
Due to this potential problem, the development focused on two new alternative approaches, namely:
  • Overlapping with the different size(s) (ODS): Tiles with different dimensions depend on the positions of the tiles relative to the image and overlapping occurs (Figure 3a);
  • Overlapping with the same size(s) (OSS): The tiles are the same dimensions (320 × 320 px). Zones may have more overlapping areas than others (Figure 3b).
For all the tests performed, the number of images used was the same—248 insect trap images. However, due to the different approaches to performing the splitting, the tile numbers used to train the models were different for each approach. For ODS and OSS 11,375 and 5092 tiles were used when training and testing the models, respectively. In all approaches, 80% of the data set was used for train, 10% for validation, and the remaining 10% for the test.
The overlapping of tiles was done with caution making sure that the overlapping zone occupied an area of 160 × 160 px (Figure 5). By analyzing the images and the insects presenting in them, and questioning experts in the area, it was discovered that the maximum area that a bounding box could occupy is below these values. In this way, the problem that arose was solved. If an insect is split between tiles it will be partially detected in some tiles but will always be fully detected on a neighboring tile; this type of situation is illustrated in Figure 5. Thus, when reconstructing the image, it became only necessary to understand which detections overlapped, by checking and comparing each bounding box position, which ones had the largest area and confidence, and removing the duplicated ones. This way, only the bounding boxes detecting the whole object would remain.
From the tests carried out, a few incorrect detections or missing detections were observed, but they were in the minority when compared to the accurate ones. These flaws can be suppressed when the values obtained in each image are associated with groups, for example, between 0 and 20—few insects, between 20 and 100—some insects, etc. This association is important when analyzing the data and verifying the respective correlations with additional crop data (e.g., for performing event forecasting). These types of failures are reflected in the mAP_0.5–0.95 metric, which is significantly lower than the mAP_0.5 metric in all tests performed (these results are depicted in Table 5 and Table 6). This can be expected since the mAP_0.5–0.95 is computed over different intersection over union (IoU) [88] thresholds, from 0.5 to 0.95 with a step of 0.05, while mAP_0.5 uses a fixed threshold at 0.5.
From the tables, it can be observed that the results achieved across all the tested models do not vary significantly. This means that, in cases where computational resources are limited, the lighter models can be used and still achieve good performance. By analyzing the precision, recall, and F1 score of all models, this situation becomes quite clear.
Table 5 and Table 6 also reflect that ODS and OSS approaches achieve similar results with the YOLOv5x model, reaching the best results in both cases. However, due to the uniformity that OSS provides to the dimensions of the tiles without the need for resizing, the OSS approach was considered for the development of the remaining work.
An analysis of the applicability of this development and communication with the end users of ANDANTE led to the conclusion that it was preferable to have a balance between false positives and false negatives. If too many false detections (false positives) occur, it would mean a possible acquisition by end users of products, in vain, or a constant check in the field of values reflected by the detection. On the other hand, if too many false negatives occur, it would mean the possible appearance of pests without the perception of the end user. Furthermore, this balance will always be the best situation to ensure that the correlations performed with other data (acquired to make predictions regarding crop events) are not biased. Therefore, the F1 score was analyzed since it is adequate when both types of errors (false positives and false negatives) are not desired. Figure 6 depicts the graph of the F1 score curve.
By analyzing the plot of Figure 6, it is possible to have a significantly high confidence value that optimizes the F1 score at the same time; this value is between 0.7 and 0.8. Furthermore, mAP_0.5 is a metric that is mostly used in object detection [89], and good results are obtained from it. Therefore, the analyses of the F1 score curve and mAP_0.5 reflect the good performance of the model.
Although a comparison with other works cannot be directly performed, due to the use of different data sets and differences in the tasks performed by the object detection models, the results reported in the related work presented in Section 2 are summarized in Table 7.
Using a faster R-CNN object detection model, the work in [63] achieved a mean F1 score of 94.4% and an accuracy of 95.2% in the detection of whiteflies and thrips as well as insect trap images acquired in greenhouses. In the approach followed in [66], automatic insect detection was conducted using a spectral residual model followed by the extraction of color features that were sent to a SVM classifier. The goal was to identify whiteflies and thrips; accuracies of 93.9% and 89.8% were achieved, respectively. As for the detection of the trap, a precision of 93.3% was obtained, which is less than the one achieved by the model proposed in this paper (100%). By comparing the results in both works, the approach using a deep learning-based object detection model in [63] seems to lead to better results than the approach in [66], which relies on image-processing techniques and classical machine learning models. As for [67], the images used for training and testing the system were acquired under controlled laboratory conditions, from sticky traps that were collected from greenhouses. They achieved precision rates of 96% and 92% for the detection of whiteflies and thrips. These results seem aligned with the ones achieved in [63]; however, since the images were acquired in a less adverse environment, the results may be biased when compared with those resulting from images acquired directly in the greenhouse. In [68], different object detection models were tested for detecting black pine bast scale pests Among the tested models, YOLOv5 achieved the best results, reaching an F1 score of 0.90 and mAP of 94.7%. The setup used for the image acquisition process (besides being used for a different task) was much more sophisticated than our own.
From Table 7, it can be seen that the approach presented in this paper is aligned with other works. It shows the potential of using the proposed image splitting approach together with YOLOv5 for detecting insects in sticky traps whose images are acquired in more adverse image acquisition conditions.

5. Conclusions

This paper presents the use and performance of YOLOv5 object detection models for insect detection in yellow sticky traps, using images acquired on tomato crop fields. The insect detection process uses a sliding window approach that minimizes the appearance of duplicate detections in yellow sticky card IT images. The presented YOLOv5 model demonstrated robustness and resilience for performing well under various illumination and adverse element exposure conditions. This work contributes to raising the bar for insect detection and monitoring. Furthermore, by creating another metric related to crop fields, this paper contributes to the development associated with forecasts of events regarding the agriculture field, such as the forecasting of disease and pest appearances.
There were limitations due to the absence of manual annotations of insects, which made it impossible to develop models for the detection and classification of insects trained with all available images.
The detection associated with the yellow sticky card and the subsequent training of AI models was performed in the first phase. In this phase, optimal results were obtained using YOLOv5s, and it was possible to perform the detection of yellow stick cards in all data sets.
The second phase was dependent on the first, as it was supposed to use the bounding box associated with the detection performed of the yellow sticky card in order to improve the accuracy of the detections of the insects in the traps. At this stage, a problem that this paper contributed to solving was faced: how does one perform the splits on the yellow sticky card bounding box image in a way that maximizes the quality of the model while not causing insects to be lost during the process of splitting and reconstructing the bounding boxes on the original image? The approach that ended up generally having the best results was OSS, where the tiles were the same sizes and overlapped, with 94.2% of precision in the test set with the YOLOv5x model. It can be concluded that the presented approach and the YOLOv5 models have potential in the detection of insects in insect traps scattered in an agricultural field.
It is possible to develop an insect detection model with the need for human supervision at times since the number and location of bounding boxes may be inaccurate. However, these errors are never in substantial quantities and can end up mostly suppressed when associating the number of detections performed in an image to a group. This association has advantages at the time of the data treatment and analysis.

6. Future Work

The annotation of all currently available images will be a part of future work, in order to build larger training and test sets. This annotation can either be manual or semi-automatic, assisted by the models presented in this paper. Larger data sets are expected to lead to more robust and accurate machine learning models.
Another topic for future work is the identification of specific insect species among those detected in the yellow sticky cards. For such a task, a larger number of images need to be acquired since greater diversities of data are required for covering the various species of insects to be identified.
It may also be valuable to evaluate the applications of other popular object detection networks, (e.g., faster R-CNN or single shot detector (SSD)) using the image splitting method proposed in this paper.
Future work will also involve testing the counting of insects themselves (in addition to their detection). Since the count is directly associated with the number of detections, and the detection model achieves high accuracy, we expect that the accuracies of insect counting will achieve results similar to the detection process. Nevertheless, this experiment will be put to the test and allow researchers to conclude its effectiveness in terms of considering the sliding window approach presented in this paper.

Author Contributions

T.D.: methodology, data curation, conceptualization, research, and writing; T.B.: conceptualization and supervision; R.R.: project administration, conceptualization and supervision; J.C.F.: conceptualization and supervision. All authors have read and agreed to the published version of the manuscript.

Funding

Part of this work was supported by Fundação para a Ciência e a Tecnologia (FCT), Portugal, under the Information Sciences, Technologies, and Architecture Research Center (ISTAR) projects UIDB/04466/2020 and UIDP/04466/2020.

Institutional Review Board Statement

Not applicable.

Informed Consent Statement

Written informed consent was obtained from the patient(s) to publish this paper.

Data Availability Statement

Not applicable.

Acknowledgments

We thank Inov-Inesc Innovation for the conditions it provided for this article. We are also grateful to TerraPro Technologies for building the traps and acquiring the images. Finally, we would like to thank Italagro—Indústria de Transformação de Produtos Alimentares, S. A., for providing the fields to place the traps. This project received funding from the ECSEL Joint Undertaking (JU) under grant agreement no. 876925. This JU received support from the European Union’s Horizon 2020 research and innovation programme, and France, Belgium, Germany, Netherlands, Portugal, Spain, and Switzerland.

Conflicts of Interest

The authors declare no conflict of interest.

Abbreviations

The following abbreviations are used in this manuscript:
AIartificial intelligence
ANDANTEAI for new devices and technologies at the edge
APIapplication programming interface
AUCarea under the precision–recall curve
CVATcomputer vision annotation tool
CNNconvolutional neural network
FCTFundação para a Ciência e a Tecnologia
ISTARInformation Sciences, Technologies, and Architecture Research Center
IoTInternet of Things
ITinsect traps
mAPmean average precision
NMSnon-maximum suppression
ODSoverlapping with different size
OSSoverlapping with same size
PSpure split
PSBpure split with borders
R-CNNregion-based convolutional neural network
SGDstochastic gradient descent
SSDsingle shot detector

References

  1. Roser, M. Future Population Growth. 2013. Our World in Data. Available online: https://ourworldindata.org/future-population-growth (accessed on 9 December 2021).
  2. Fróna, D.; Szenderák, J.; Harangi-Rákos, M. The challenge of feeding the world. Sustainability 2019, 11, 5816. [Google Scholar] [CrossRef] [Green Version]
  3. Thangaraj, R.; Anandamurugan, S.; Pandiyan, P.; Kaliappan, V.K. Artificial intelligence in tomato leaf disease detection: A comprehensive review and discussion. J. Plant Dis. Prot. 2021, 129, 469–488. [Google Scholar] [CrossRef]
  4. FAO. The Future of Food and Agriculture: Trends and Challenges; FAO: Rome, Italy, 2017. [Google Scholar]
  5. Deutsch, C.A.; Tewksbury, J.J.; Tigchelaar, M.; Battisti, D.S.; Merrill, S.C.; Huey, R.B.; Naylor, R.L. Increase in crop losses to insect pests in a warming climate. Science 2018, 361, 916–919. [Google Scholar] [CrossRef] [PubMed] [Green Version]
  6. Anton, A.; Rustad, S.; Shidik, G.F.; Syukur, A. Classification of Tomato Plant Diseases Through Leaf Using Gray-Level Co-occurrence Matrix and Color Moment with Convolutional Neural Network Methods. In Smart Trends in Computing and Communications: Proceedings of SmartCom 2020; Springer: Berlin/Heidelberg, Germany, 2021; pp. 291–299. [Google Scholar]
  7. Brahimi, M.; Boukhalfa, K.; Moussaoui, A. Deep learning for tomato diseases: Classification and symptoms visualization. Appl. Artif. Intell. 2017, 31, 299–315. [Google Scholar] [CrossRef]
  8. FAO. FAOSTAT: FAO Statistical Databases; FAO: Rome, Italy, 2021. [Google Scholar]
  9. Verma, S.; Chug, A.; Singh, A.P. Prediction models for identification and diagnosis of tomato plant diseases. In Proceedings of the 2018 IEEE International Conference on Advances in Computing, Communications and Informatics (ICACCI), Bangalore, India, 19–22 September 2018; pp. 1557–1563. [Google Scholar]
  10. Abell, K.; Poland, T.M.; Cossé, A.; Bauer, L.S. Trapping techniques for emerald ash borer and its introduced parasitoids. In Biology and Control of Emerald Ash Borer; Van Driesche, R.G., Reardon, R.C., Eds.; FHTET-2014-09; US Department of Agriculture, Forest Service, Forest Health Technology Enterprise Team: Morgantown, WV, USA, 2015; Chapter 7; pp. 113–127. [Google Scholar]
  11. Shelly, T.; Epsky, N.; Jang, E.B.; Reyes-Flores, J.; Vargas, R. Trapping and the Detection, Control, and Regulation of Tephritid Fruit Flies: Lures, Area-Wide Programs, and Trade Implications; Springer: Berlin/Heidelberg, Germany, 2014. [Google Scholar]
  12. Elkinton, J.S.; Cardé, R.T. The use of pheromone traps to monitor distribution and population trends of the gypsy moth. In Management of Insect Pests with Semiochemicals; Springer: Berlin/Heidelberg, Germany, 1981; pp. 41–55. [Google Scholar]
  13. Kuno, E. Verifying zero-infestation in pest control: A simple sequential test based on the succession of zero-samples. Res. Popul. Ecol. 1991, 33, 29–32. [Google Scholar] [CrossRef]
  14. Tobin, P.C.; Onufrieva, K.S.; Thorpe, K.W. The relationship between male moth density and female mating success in invading populations of L ymantria dispar. Entomol. Exp. Appl. 2013, 146, 103–111. [Google Scholar] [CrossRef]
  15. Tobin, P.C.; Sharov, A.A.; Liebhold, A.A.; Leonard, D.S.; Roberts, E.A.; Learn, M.R. Management of the gypsy moth through a decision algorithm under the STS project. Am. Entomol. 2004, 50, 200–209. [Google Scholar] [CrossRef]
  16. Bossart, J.L.; Carlton, C.E. Insect Conservation in America: Status and Perspectives. Am. Entomol. 2002, 48, 82–92. [Google Scholar] [CrossRef] [Green Version]
  17. Larsson, M.C. Pheromones and other semiochemicals for monitoring rare and endangered species. J. Chem. Ecol. 2016, 42, 853–868. [Google Scholar] [CrossRef] [Green Version]
  18. New, T. Taxonomic focus and quality control in insect surveys for biodiversity conservation. Aust. J. Entomol. 1996, 35, 97–106. [Google Scholar] [CrossRef]
  19. Contarini, M.; Onufrieva, K.S.; Thorpe, K.W.; Raffa, K.F.; Tobin, P.C. Mate-finding failure as an important cause of Allee effects along the leading edge of an invading insect population. Entomol. Exp. Appl. 2009, 133, 307–314. [Google Scholar] [CrossRef]
  20. Tobin, P.C.; Klein, K.T.; Leonard, D.S. Gypsy moth (Lepidoptera: Lymantriidae) flight behavior and phenology based on field-deployed automated pheromone-baited traps. Environ. Entomol. 2009, 38, 1555–1562. [Google Scholar] [CrossRef] [PubMed] [Green Version]
  21. Casado, D.; Cave, F.; Welter, S. Puffer®-CM Dispensers for mating disruption of codling moth: Area of influence and impacts on trap finding success by males. IOBC Bull. 2014, 99, 25–31. [Google Scholar]
  22. Elkinton, J.; Cardé, R. Distribution, dispersal, and apparent survival of male gypsy moths as determined by capture in pheromone-baited traps. Environ. Entomol. 1980, 9, 729–737. [Google Scholar] [CrossRef]
  23. Tcheslavskaia, K.; Brewster, C.C.; Sharov, A.A. Mating success of gypsy moth (Lepidoptera: Lymantriidae) females in southern Wisconsin. Great Lakes Entomol. 2002, 35, 1. [Google Scholar]
  24. Cardé, R.T.; Bau, J.; Elkinton, J.S. Comparison of attraction and trapping capabilities of bucket-and delta-style traps with different pheromone emission rates for gypsy moths (Lepidoptera: Erebidae): Implications for understanding range of attraction and utility in surveillance. Environ. Entomol. 2018, 47, 107–113. [Google Scholar] [CrossRef]
  25. Ferracini, C.; Pogolotti, C.; Lentini, G.; Saitta, V.; Busato, E.; Rama, F.; Alma, A. Performance of pheromone-baited traps to monitor the seasonal abundance of tortrix moths in chestnut groves. Insects 2020, 11, 807. [Google Scholar] [CrossRef]
  26. Irish, S.R.; Moore, S.J.; Derua, Y.A.; Bruce, J.; Cameron, M.M. Evaluation of gravid traps for the collection of Culex quinquefasciatus, a vector of lymphatic filariasis in Tanzania. Trans. R. Soc. Trop. Med. Hyg. 2013, 107, 15–22. [Google Scholar] [CrossRef]
  27. Elkinton, J.S.; Childs, R.D. Efficiency of two gypsy moth (Lepidoptera: Lymantriidae) pheromone-baited traps. Environ. Entomol. 1983, 12, 1519–1525. [Google Scholar] [CrossRef]
  28. Hartstack, A., Jr.; Hollingsworth, J.; Ridgway, R.; Hunt, H. Determination of trap spacings required to control an insect population. J. Econ. Entomol. 1971, 64, 1090–1100. [Google Scholar] [CrossRef]
  29. Hartstack, A.W., Jr.; Hollingsworth, J.; Lindquist, D. A technique for measuring trapping efficiency of electric insect traps. J. Econ. Entomol. 1968, 61, 546–552. [Google Scholar] [CrossRef]
  30. Williams, C.B. Comparing the efficiency of insect traps. Bull. Entomol. Res. 1951, 42, 513–517. [Google Scholar] [CrossRef]
  31. Jactel, H.; Bonifacio, L.; Van Halder, I.; Vétillard, F.; Robinet, C.; David, G. A novel, easy method for estimating pheromone trap attraction range: Application to the pine sawyer beetle Monochamus galloprovincialis. Agric. For. Entomol. 2019, 21, 8–14. [Google Scholar] [CrossRef] [Green Version]
  32. Sufyan, M.; Neuhoff, D.; Furlan, L. Assessment of the range of attraction of pheromone traps to Agriotes lineatus and Agriotes obscurus. Agric. For. Entomol. 2011, 13, 313–319. [Google Scholar] [CrossRef]
  33. Furlan, L.; Contiero, B.; Tóth, M. Assessment of the attraction range of sex pheromone traps to Agriotes (Coleoptera, Elateridae) male click beetles in South-Eastern Europe. Insects 2021, 12, 733. [Google Scholar] [CrossRef]
  34. Byers, J.A. Active space of pheromone plume and its relationship to effective attraction radius in applied models. J. Chem. Ecol. 2008, 34, 1134–1145. [Google Scholar] [CrossRef]
  35. Wall, C.; Perry, J. Range of action of moth sex-attractant sources. Entomol. Exp. Appl. 1987, 44, 5–14. [Google Scholar] [CrossRef]
  36. Byers, J.A.; Anderbrant, O.; Löqvist, J. Effective attraction radius. J. Chem. Ecol. 1989, 15, 749–765. [Google Scholar] [CrossRef]
  37. Dufourd, C.; Weldon, C.; Anguelov, R.; Dumont, Y. Parameter identification in population models for insects using trap data. BioMath 2013, 2, 1312061. [Google Scholar] [CrossRef] [Green Version]
  38. Schlyter, F. Sampling range, attraction range, and effective attraction radius: Estimates of trap efficiency and communication distance in coleopteran pheromone and host attractant systems 1. J. Appl. Entomol. 1992, 114, 439–454. [Google Scholar] [CrossRef]
  39. Calkins, C.; Schroeder, W.; Chambers, D. Probability of detecting Caribbean fruit fly, Anastrepha suspensa (Loew)(Diptera: Tephritidae), populations with McPhail traps. J. Econ. Entomol. 1984, 77, 198–201. [Google Scholar] [CrossRef]
  40. Gage, S.H.; Wirth, T.M.; Simmons, G.A. Predicting regional gypsy moth (Lymantriidae) population trends in an expanding population using pheromone trap catch and spatial analysis. Environ. Entomol. 1990, 19, 370–377. [Google Scholar] [CrossRef]
  41. Bau, J.; Cardé, R.T. Simulation modeling to interpret the captures of moths in pheromone-baited traps used for surveillance of invasive species: The gypsy moth as a model case. J. Chem. Ecol. 2016, 42, 877–887. [Google Scholar] [CrossRef]
  42. Kirkpatrick, D.M.; Acebes-Doria, A.L.; Rice, K.B.; Short, B.D.; Adams, C.G.; Gut, L.J.; Leskey, T.C. Estimating monitoring trap plume reach and trapping area for nymphal and adult Halyomorpha halys (Hemiptera: Pentatomidae) in crop and non-crop habitats. Environ. Entomol. 2019, 48, 1104–1112. [Google Scholar] [CrossRef] [PubMed] [Green Version]
  43. Kirkpatrick, D.M.; Gut, L.J.; Miller, J.R. Estimating monitoring trap plume reach and trapping area for Drosophila suzukii (Diptera: Drosophilidae) in Michigan tart cherry. J. Econ. Entomol. 2018, 111, 1285–1289. [Google Scholar] [CrossRef] [PubMed]
  44. Lyytikäinen-Saarenmaa, P.; Varama, M.; Anderbrant, O.; Kukkola, M.; Kokkonen, A.M.; Hedenström, E.; Högberg, H.E. Monitoring the European pine sawfly with pheromone traps in maturing Scots pine stands. Agric. For. Entomol. 2006, 8, 7–15. [Google Scholar] [CrossRef]
  45. Östrand, F.; Elek, J.A.; Steinbauer, M.J. Monitoring autumn gum moth (Mnesampela privata): Relationships between pheromone and light trap catches and oviposition in eucalypt plantations. Aust. For. 2007, 70, 185–191. [Google Scholar] [CrossRef]
  46. Turchin, P.; Odendaal, F.J. Measuring the effective sampling area of a pheromone trap for monitoring population density of southern pine beetle (Coleoptera: Scolytidae). Environ. Entomol. 1996, 25, 582–588. [Google Scholar] [CrossRef]
  47. Miller, J.R. Sharpening the precision of pest management decisions: Assessing variability inherent in catch number and absolute density estimates derived from pheromone-baited traps monitoring insects moving randomly. J. Econ. Entomol. 2020, 113, 2052–2060. [Google Scholar] [CrossRef]
  48. Thorpe, K.W.; Ridgway, R.L.; Leonhardt, B.A. Relationship Between Gypsy Moth (Lepidoptera: Lymantriidae) Pheromone Trap Catch and Population Density: Comparison of Traps Baited with 1 and 500 < g (+)-Disparlure Lures. J. Econ. Entomol. 1993, 86, 86–92. [Google Scholar]
  49. Evenden, M.; Borden, J.; Van Sickle, G. Predictive capabilities of a pheromone-based monitoring system for western hemlock looper (Lepidoptera: Geometridae). Environ. Entomol. 1995, 24, 933–943. [Google Scholar] [CrossRef]
  50. Allen, D.; Abrahamson, L.; Eggen, D.; Lanier, G.; Swier, S.; Kelley, R.; Auger, M. Monitoring spruce budworm (Lepidoptera: Tortricidae) populations with pheromone-baited traps. Environ. Entomol. 1986, 15, 152–165. [Google Scholar] [CrossRef]
  51. Sanders, C. Monitoring spruce budworm population density with sex pheromone TRAPS1. Can. Entomol. 1988, 120, 175–183. [Google Scholar] [CrossRef]
  52. Sanders, C. Pheromone Traps for Detecting Incipient Outbreaks of the Spruce Budworm, Choristoneura fumiferana (Clem.); NFP Technical Report TR-32; NODA: Peterborough, UK, 1996. [Google Scholar]
  53. Östrand, F.; Anderbrant, O. From where are insects recruited? A new model to interpret catches of attractive traps. Agric. For. Entomol. 2003, 5, 163–171. [Google Scholar] [CrossRef]
  54. Dent, D. Sampling, monitoring and forecasting. In Insect Pest Management; Springer: Berlin/Heidelberg, Germany, 2000; pp. 14–47. [Google Scholar]
  55. Brockerhoff, E.G.; Liebhold, A.M.; Jactel, H. The ecology of forest insect invasions and advances in their management. Can. J. For. Res. 2006, 36, 263–268. [Google Scholar] [CrossRef] [Green Version]
  56. Precision Agriculture. An International Journal on Advances in Precision Agriculture. Available online: https://www.springer.com/journal/11119 (accessed on 9 December 2021).
  57. Marković, D.; Vujičić, D.; Tanasković, S.; Đorđević, B.; Ranđić, S.; Stamenković, Z. Prediction of pest insect appearance using sensors and machine learning. Sensors 2021, 21, 4846. [Google Scholar] [CrossRef]
  58. Ding, W.; Taylor, G. Automatic moth detection from trap images for pest management. Comput. Electron. Agric. 2016, 123, 17–28. [Google Scholar] [CrossRef] [Green Version]
  59. Nikitenko, D.; Wirth, M.; Trudel, K. Applicability Of White-Balancing Algorithms to Restoring Faded Colour Slides: An Empirical Evaluation. J. Multimed. 2008, 3, 9–18. [Google Scholar] [CrossRef]
  60. Buchsbaum, G. A spatial processor model for object colour perception. J. Frankl. Inst. 1980, 310, 1–26. [Google Scholar] [CrossRef]
  61. Dollar, P.; Wojek, C.; Schiele, B.; Perona, P. Pedestrian detection: An evaluation of the state of the art. IEEE Trans. Pattern Anal. Mach. Intell. 2011, 34, 743–761. [Google Scholar] [CrossRef]
  62. Hosang, J.; Benenson, R.; Schiele, B. Learning non-maximum suppression. In Proceedings of the IEEE Conference on Computer Vision and Pattern Recognition, Honolulu, HI, USA, 21–26 July 2017; pp. 4507–4515. [Google Scholar]
  63. Li, W.; Wang, D.; Li, M.; Gao, Y.; Wu, J.; Yang, X. Field detection of tiny pests from sticky trap images using deep learning in agricultural greenhouse. Comput. Electron. Agric. 2021, 183, 106048. [Google Scholar] [CrossRef]
  64. Muppala, C.; Guruviah, V. Detection of leaf folder and yellow stemborer moths in the paddy field using deep neural network with search and rescue optimization. Inf. Process. Agric. 2021, 8, 350–358. [Google Scholar] [CrossRef]
  65. Roosjen, P.P.; Kellenberger, B.; Kooistra, L.; Green, D.R.; Fahrentrapp, J. Deep learning for automated detection of Drosophila suzukii: Potential for UAV-based monitoring. Pest Manag. Sci. 2020, 76, 2994–3002. [Google Scholar] [CrossRef] [PubMed]
  66. Li, W.; Yang, Z.; Lv, J.; Zheng, T.; Li, M.; Sun, C. Detection of Small-Sized Insects in Sticky Trapping Images Using Spectral Residual Model and Machine Learning. Front. Plant Sci. 2022, 13, 915543. [Google Scholar] [CrossRef]
  67. Espinoza, K.; Valera, D.L.; Torres, J.A.; López, A.; Molina-Aiz, F.D. Combination of image processing and artificial neural networks as a novel approach for the identification of Bemisia tabaci and Frankliniella occidentalis on sticky traps in greenhouse agriculture. Comput. Electron. Agric. 2016, 127, 495–505. [Google Scholar] [CrossRef]
  68. Yun, W.; Kumar, J.P.; Lee, S.; Kim, D.S.; Cho, B.K. Deep learning-based system development for black pine bast scale detection. Sci. Rep. 2022, 12, 606. [Google Scholar] [CrossRef]
  69. Ramalingam, B.; Mohan, R.E.; Pookkuttath, S.; Gómez, B.F.; Sairam Borusu, C.S.C.; Wee Teng, T.; Tamilselvam, Y.K. Remote insects trap monitoring system using deep learning framework and IoT. Sensors 2020, 20, 5280. [Google Scholar] [CrossRef]
  70. Hsieh, K.Y.; Kuo, Y.F.; Kuo, C.K. Detecting and Counting Soybean Aphids Using Convolutional Neural Network. In Proceedings of the 2018 ASABE Annual International Meeting. American Society of Agricultural and Biological Engineers, Detroit, MI, USA, 29 July–1 August 2018; p. 1. [Google Scholar]
  71. Cardoso, B.; Silva, C.; Costa, J.; Ribeiro, B. Internet of Things Meets Computer Vision to Make an Intelligent Pest Monitoring Network. Appl. Sci. 2022, 12, 9397. [Google Scholar] [CrossRef]
  72. Nieuwenhuizen, A.; Hemming, J.; Suh, H. Detection and classification of insects on stick-traps in a tomato crop using Faster R-CNN. In Proceedings of the The Netherlands Conference on Computer Vision, Eindhoven, The Netherlands, 26–27 September 2018. [Google Scholar]
  73. Gerovichev, A.; Sadeh, A.; Winter, V.; Bar-Massada, A.; Keasar, T.; Keasar, C. High throughput data acquisition and deep learning for insect ecoinformatics. Front. Ecol. Evol. 2021, 9, 600931. [Google Scholar] [CrossRef]
  74. da Silva Pinto Bessa, B.L. Automatic Processing of Images of Chromotropic Traps for Identification and Quantification of Trioza erytreae and Scaphoideus titanus. 2021. Available online: https://repositorio-aberto.up.pt/handle/10216/139335 (accessed on 9 December 2021).
  75. Günther, C.; Jansson, N.; Liwicki, M.; Simistira-Liwicki, F. Towards a machine learning framework for drill core analysis. In Proceedings of the 2021 IEEE Swedish Artificial Intelligence Society Workshop (SAIS), Umea, Sweden, 14–15 June 2021; pp. 1–6. [Google Scholar]
  76. Guillermo, M.; Billones, R.K.; Bandala, A.; Vicerra, R.R.; Sybingco, E.; Dadios, E.P.; Fillone, A. Implementation of Automated Annotation through Mask RCNN Object Detection model in CVAT using AWS EC2 Instance. In Proceedings of the 2020 IEEE Region 10 Conference (TENCON), Osaka, Japan, 16–19 November 2020; pp. 708–713. [Google Scholar]
  77. Andante Use Case 2.2: Tomato Pests and Diseases Forecast. Available online: https://www.andante-ai.eu/project/use-case-2-2-tomato-pests-and-diseases-forecast/ (accessed on 9 December 2021).
  78. Hu, C.; Liu, X.; Pan, Z.; Li, P. Automatic detection of single ripe tomato on plant combining faster R-CNN and intuitionistic fuzzy set. IEEE Access 2019, 7, 154683–154696. [Google Scholar] [CrossRef]
  79. Ni, X.; Li, C.; Jiang, H.; Takeda, F. Three-dimensional photogrammetry with deep learning instance segmentation to extract berry fruit harvestability traits. ISPRS J. Photogramm. Remote. Sens. 2021, 171, 297–309. [Google Scholar] [CrossRef]
  80. Lin, S.; Jiang, Y.; Chen, X.; Biswas, A.; Li, S.; Yuan, Z.; Wang, H.; Qi, L. Automatic Detection of Plant Rows for a Transplanter in Paddy Field Using Faster R-CNN. IEEE Access 2020, 8, 147231–147240. [Google Scholar] [CrossRef]
  81. Jiang, P.; Ergu, D.; Liu, F.; Cai, Y.; Ma, B. A Review of Yolo algorithm developments. Procedia Comput. Sci. 2022, 199, 1066–1073. [Google Scholar] [CrossRef]
  82. Liu, G.; Nouaze, J.C.; Touko Mbouembe, P.L.; Kim, J.H. YOLO-tomato: A robust algorithm for tomato detection based on YOLOv3. Sensors 2020, 20, 2145. [Google Scholar] [CrossRef] [PubMed] [Green Version]
  83. Mu, Y.; Chen, T.S.; Ninomiya, S.; Guo, W. Intact detection of highly occluded immature tomatoes on plants using deep learning techniques. Sensors 2020, 20, 2984. [Google Scholar] [CrossRef] [PubMed]
  84. Domingues, T.; Brandão, T.; Ferreira, J.C. Machine Learning for Detection and Prediction of Crop Diseases and Pests: A Comprehensive Survey. Agriculture 2022, 12, 1350. [Google Scholar] [CrossRef]
  85. Dlužnevskij, D.; Stefanovic, P.; Ramanauskaite, S. Investigation of YOLOv5 Efficiency in iPhone Supported Systems. Balt. J. Mod. Comput. 2021, 9, 333–344. [Google Scholar] [CrossRef]
  86. MLflow. A Plataform for the Machine Learning Lifestyle. Available online: https://mlflow.org/ (accessed on 9 December 2021).
  87. Henderson, P.; Ferrari, V. End-to-end training of object class detectors for mean average precision. In Proceedings of the Asian Conference on Computer Vision, Perth, WA, Australia, 2–6 December 2016; Springer: Berlin/Heidelberg, Germany, 2016; pp. 198–213. [Google Scholar]
  88. Rezatofighi, H.; Tsoi, N.; Gwak, J.; Sadeghian, A.; Reid, I.; Savarese, S. Generalized intersection over union: A metric and a loss for bounding box regression. In Proceedings of the IEEE/CVF Conference on Computer Vision and Pattern Recognition, Long Beach, CA, USA, 15–20 June 2019; pp. 658–666. [Google Scholar]
  89. Everingham, M.; Van Gool, L.; Williams, C.K.; Winn, J.; Zisserman, A. The pascal visual object classes (voc) challenge. Int. J. Comput. Vis. 2010, 88, 303–338. [Google Scholar] [CrossRef]
Figure 1. Examples of the data set. (a) Insect Trap 001. (b) Insect Trap 002. (c) Insect Trap 003. (d) Insect Trap 004. (e) Insect Trap 005. (f) Insect Trap 006.
Agriculture 12 01967 g001
Figure 2. Pipeline for insect detection.
Agriculture 12 01967 g002
Figure 3. Yellow sticky card splitting approaches. (a) ODS approach. (b) OSS approach. (c) PS approach. (d) PSB approach. (e) Original image.
Agriculture 12 01967 g003
Figure 4. Illustration of splits without overlapping the split insects.
Agriculture 12 01967 g004
Figure 5. Illustration of overlapping tiles that split insects.
Agriculture 12 01967 g005
Figure 6. F1 score curve for the YOLOv5x model using the OSS approach.
Agriculture 12 01967 g006
Table 1. Information on the tomato crop fields where data were acquired.
LocationArea (ha)Planting DateCentral GPS Point
Castanheira2319 April 202138.982300, −8.954110
Lezíria2727 April 2021 and 10 May 202139.006537, −8.881018
Valada207 May 202139.067730, −8.772214
Table 2. Data on the insect trap images where data were acquired.
Trap 001Trap 002Trap 003Trap 004Trap 005Trap 006
FieldValadaCastanheiraValadaLezíriaLezíriaCastanheira
Period of operation27 May 2021 to 3 September 202126 May 2021 to 8 September 202127 May 2021 to 8 September 202127 May 2021 to 23 September 202127 May 2021 to 24 September 202126 May 2021 to 6 September 2021
Total images8489489019451071933
Valid Images733756784763845756
Table 3. YOLOv5 insect trap image parameters.
EpochsBatch SizeOptimizerPatience
30016Stochastic Gradient Descent (SGD)100
Table 4. YOLOv5s yellow sticky card model results.
PhasemAP_0.5mAP_0.5–0.95PrecisionRecall
Training0.9950.99511
Testing0.9950.99511
Table 5. YOLOv5 insect model results for ODS.
ModelPhasemAP_0.5mAP_0.5–0.95PrecisionRecallF1 Score
YOLOv5sTraining0.9730.6780.9820.9350.958
Testing0.9450.5390.9370.890.913
YOLOv5mTraining0.9750.70.9760.940.958
Testing0.9330.5540.9080.880.894
YOLOv5lTraining0.9790.7240.9860.9470.966
Testing0.9520.5670.9380.9060.922
YOLOv5xTraining0.980.7330.9820.9510.966
Testing0.9520.5730.9350.90.917
Table 6. YOLOv5 Insect Model results for OSS.
ModelPhasemAP_0.5mAP_0.5–0.95PrecisionRecallF1 Score
YOLOv5sTraining0.9640.6320.9630.9400.951
Testing0.9230.4970.9120.8530.882
YOLOv5mTraining0.9750.6910.9820.9460.964
Testing0.9460.5420.9460.8740.909
YOLOv5lTraining0.9730.6940.9810.9390.960
Testing0.9370.5430.9510.8620.904
YOLOv5xTraining0.9760.7130.9830.950.966
Testing0.9440.5590.9420.880.910
Table 7. Comparison with other insect detection works.
ReferenceImage AcquisitionPerformanceMetricYear
ProposedField, no controlled conditions94.4% | 94.2%mAP_0.5 | Precision2022
[63]Greenhouse95.2%Accuracy2021
[66]Greenhouse93.9% (whitefly) 89.8% (thrips)Precision2022
[67]Laboratory96% (whitefly) and 92% (thrips)Precision2016
[68]Field, controlled conditions94.7% (black pine bast scale)mAP_0.52022
Publisher’s Note: MDPI stays neutral with regard to jurisdictional claims in published maps and institutional affiliations.

