Article

Model and Method of Fault Signal Diagnosis for Blockage and Slippage of Rice Threshing Drum

1
School of Agricultural Engineering, Jiangsu University, Zhenjiang 212013, China
2
Key Laboratory of Crop Harvesting Equipment Technology of Zhejiang Province, Jinhua 321017, China
*
Authors to whom correspondence should be addressed.
Agriculture 2022, 12(11), 1968; https://doi.org/10.3390/agriculture12111968
Submission received: 17 October 2022 / Revised: 11 November 2022 / Accepted: 14 November 2022 / Published: 21 November 2022
(This article belongs to the Section Agricultural Technology)

Abstract

:
Rice threshing drum of combine harvester is difficult to monitor and repair the abnormal state in time. When slippage or blockage occurs in the threshing drum, the working efficiency of the threshing drum will reduce seriously, such as the threshing efficiency will decline seriously, and then cleaning performance of combine harvester will decline. In order to reveal the vibration characteristics of rice threshing drum under different working conditions and the vibration response state of the drum bearing undergoing different faults occur, the vibration system model of the threshing drum is established in this paper. With the help of the vibration test bench of the multi-stage threshing drum, the vibration signal test of the slippage and blockage of the threshing drum under the belt drive mode is carried out. The results show that the Z direction signal has a vibration peak at the low frequency (25 Hz) when the threshing drum is blocked, the maximum vibration displacement is about 0.55 mm; the Z direction signal signal peak is concentrated at 50 Hz when a slip fault occurs, and the maximum vibration displacement is about 0.184 mm, the fitting effect between frequency and mathematical model is good. The results of this paper reveal the vibration characteristics of the threshing drum under different abnormal working conditions, at the same time provide a theoretical basis for the fault diagnosis of the threshing drum of the combine harvester.

1. Introduction

At present, rice mainly uses a combine harvester for harvesting, which is an agricultural machine that integrates harvesting, conveying, threshing and cleaning [1,2]. Factors such as the structure and working parameters of the decide -granular device will directly affect the decarning performance of the threshing drum [3,4]. But the threshing drum of the combine harvester may produce complex vibration problems under different working conditions [5,6]. A series of problems such as blockage of the threshing system and slippage of the transmission end of the threshing system occurred [7]. However, because the working environment of the threshing drum is sealed and difficult to observe, its abnormal work is often difficult to detect in time [8]. Therefore, establishing the vibration signal prediction model under different disturbances to monitor the signal with the help of various sensors can greatly ensure the punctuality efficiency, which will greatly improve the efficiency of combining harvesters [9,10,11].
When the threshing drum is blocked, it is mostly due to its too slow rotation speed or too large growth density of grains [12], which makes the operating parameters do not match or the fed grains cannot be threshed. As a result, the entanglement of the grain and the threshing system and then seriously affects the harvesting efficiency of grain [13]. Shin et al. divided the common failures of combine harvesters into header failures, threshing system failures and re-trippers failures, then proposed relevant measures to prevent and reduce failures [14]. Pavlyuk et al. analyzed the main system performance parameters of the combine harvester, pointed out that the failure parts of the combine harvester are mainly concentrated in the harvesting part and the threshing part [15]. Wang et al. collected the vibration signal of the shaft end of the threshing drum by a wireless vibration sensor, and the Hilbert-Huang transform analysis method was used to analyze and process the signal to obtain the blockage process of the threshing drum. The time-spectral characteristics of the combined harvester predict its blocking trend, so as to adjust the combine harvester’s travel speed to avoid blocking [16]. Kumar et al. used vibration sensors to collect vibration signals of rotating machinery, and analyzed the spectrum of the obtained signals through signal processing technology to determine the severity of component vibration to propose failure prediction methods [17,18].
Based on TCP/IP protocol, Si et al. realized abnormal signal monitoring and alarm of threshing drum for data communication [19,20]. With the development of communication technology, many scholars have developed a fault monitoring and diagnosis platform for combine harvesters [21]; Abdeen et al. used resistance sensors to design stress monitoring system of the top cover of the threshing drum is implemented and the real-time monitoring of the feeding amount of the threshing drum and the early warning function [22]; such monitoring systems usually include monitoring platforms such as rotational speed and torque, monitoring platforms such as clearance, fuel consumption and feed rate [23].
To sum up, the fault diagnosis of combine harvesters is to collect the signals such as the rotational speed, vibration and temperature of the components under test, then analyze and process the signals to determine the operation status of the components. For the fault diagnosis of combine harvesters, the dynamic modeling of threshing system has not been deeply studied. Based on the modeling of the vibration system of the threshing drum, this paper reveals the vibration response of the threshing system under different load input states. At the same time, the relevant vibration signal tests are carried out on the multi-stage parallel threshing drum test bench to analyze the actual conditions under different working conditions. The vibration signal is used to verify the accuracy of the vibration fault condition monitoring model of the threshing drum of the combine harvester.

2. Materials and Methods

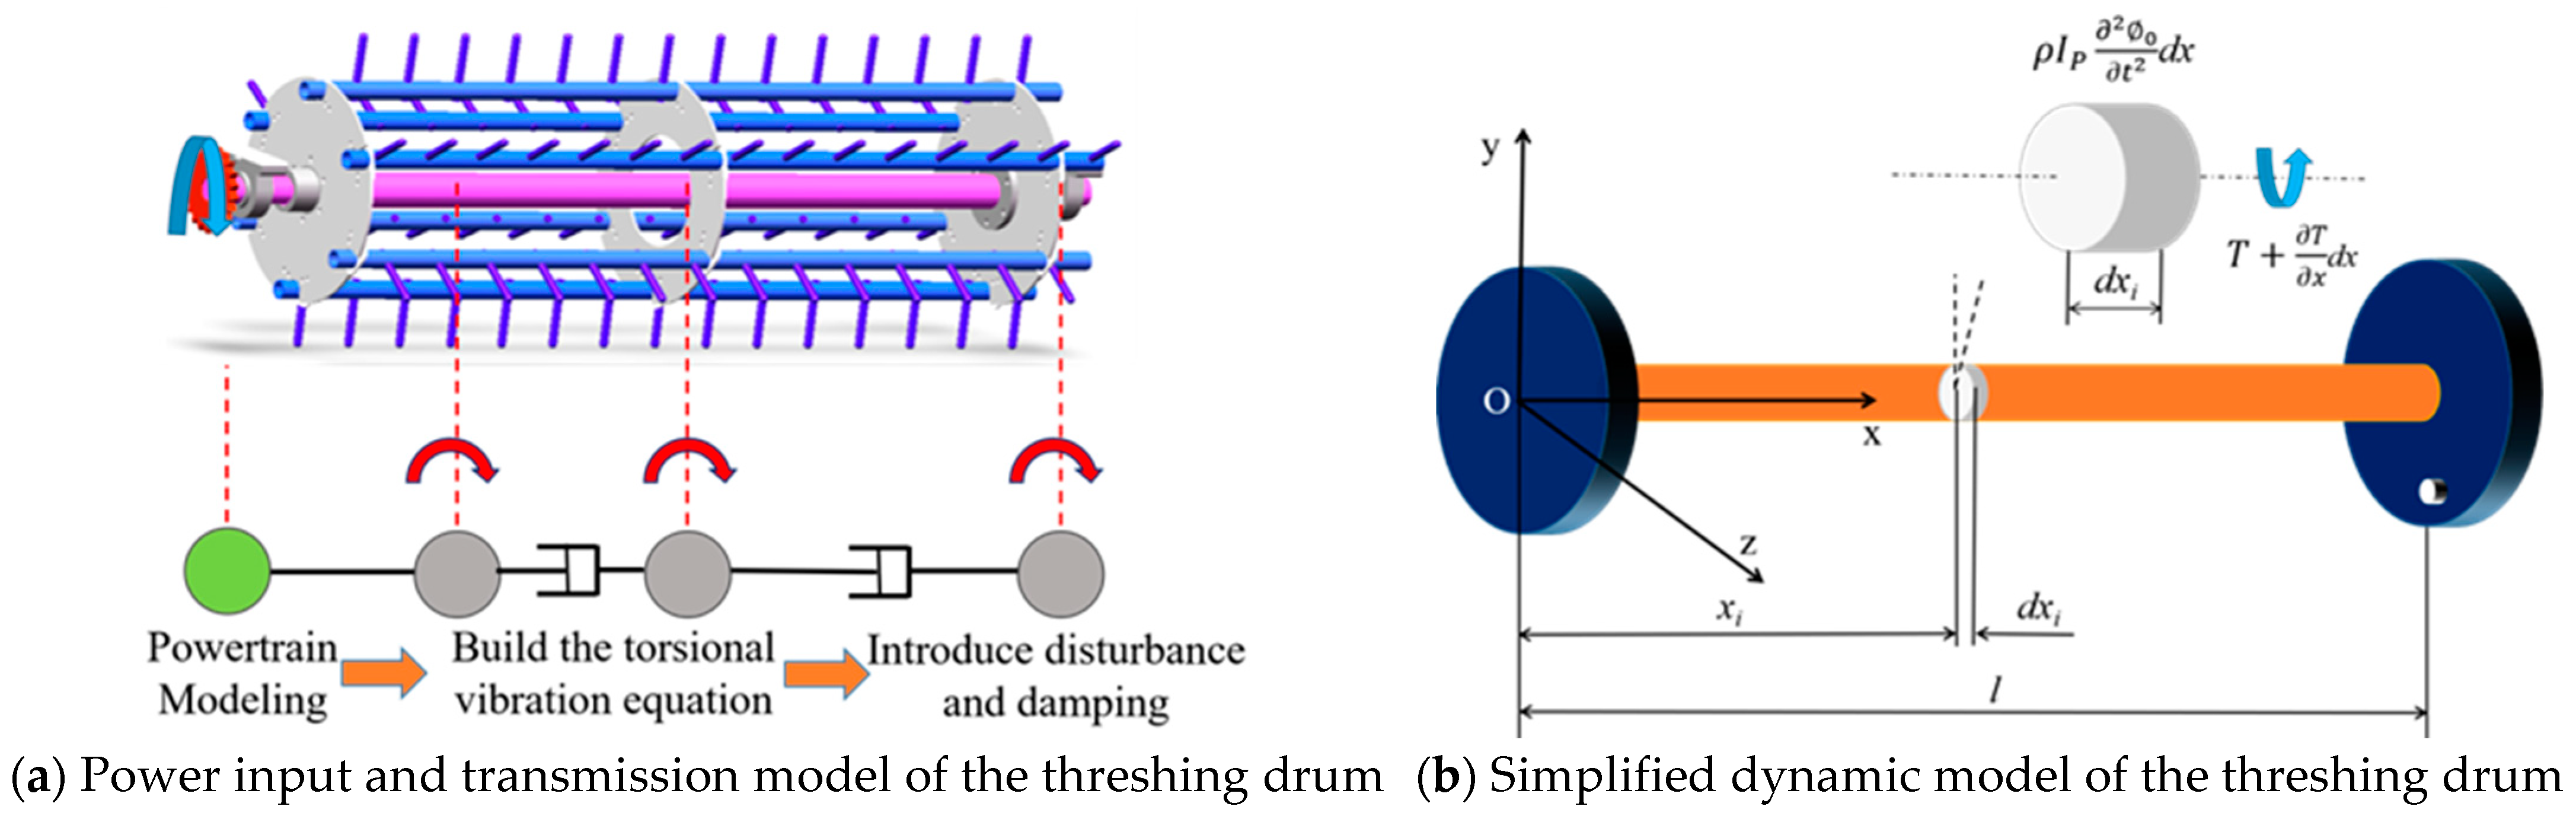
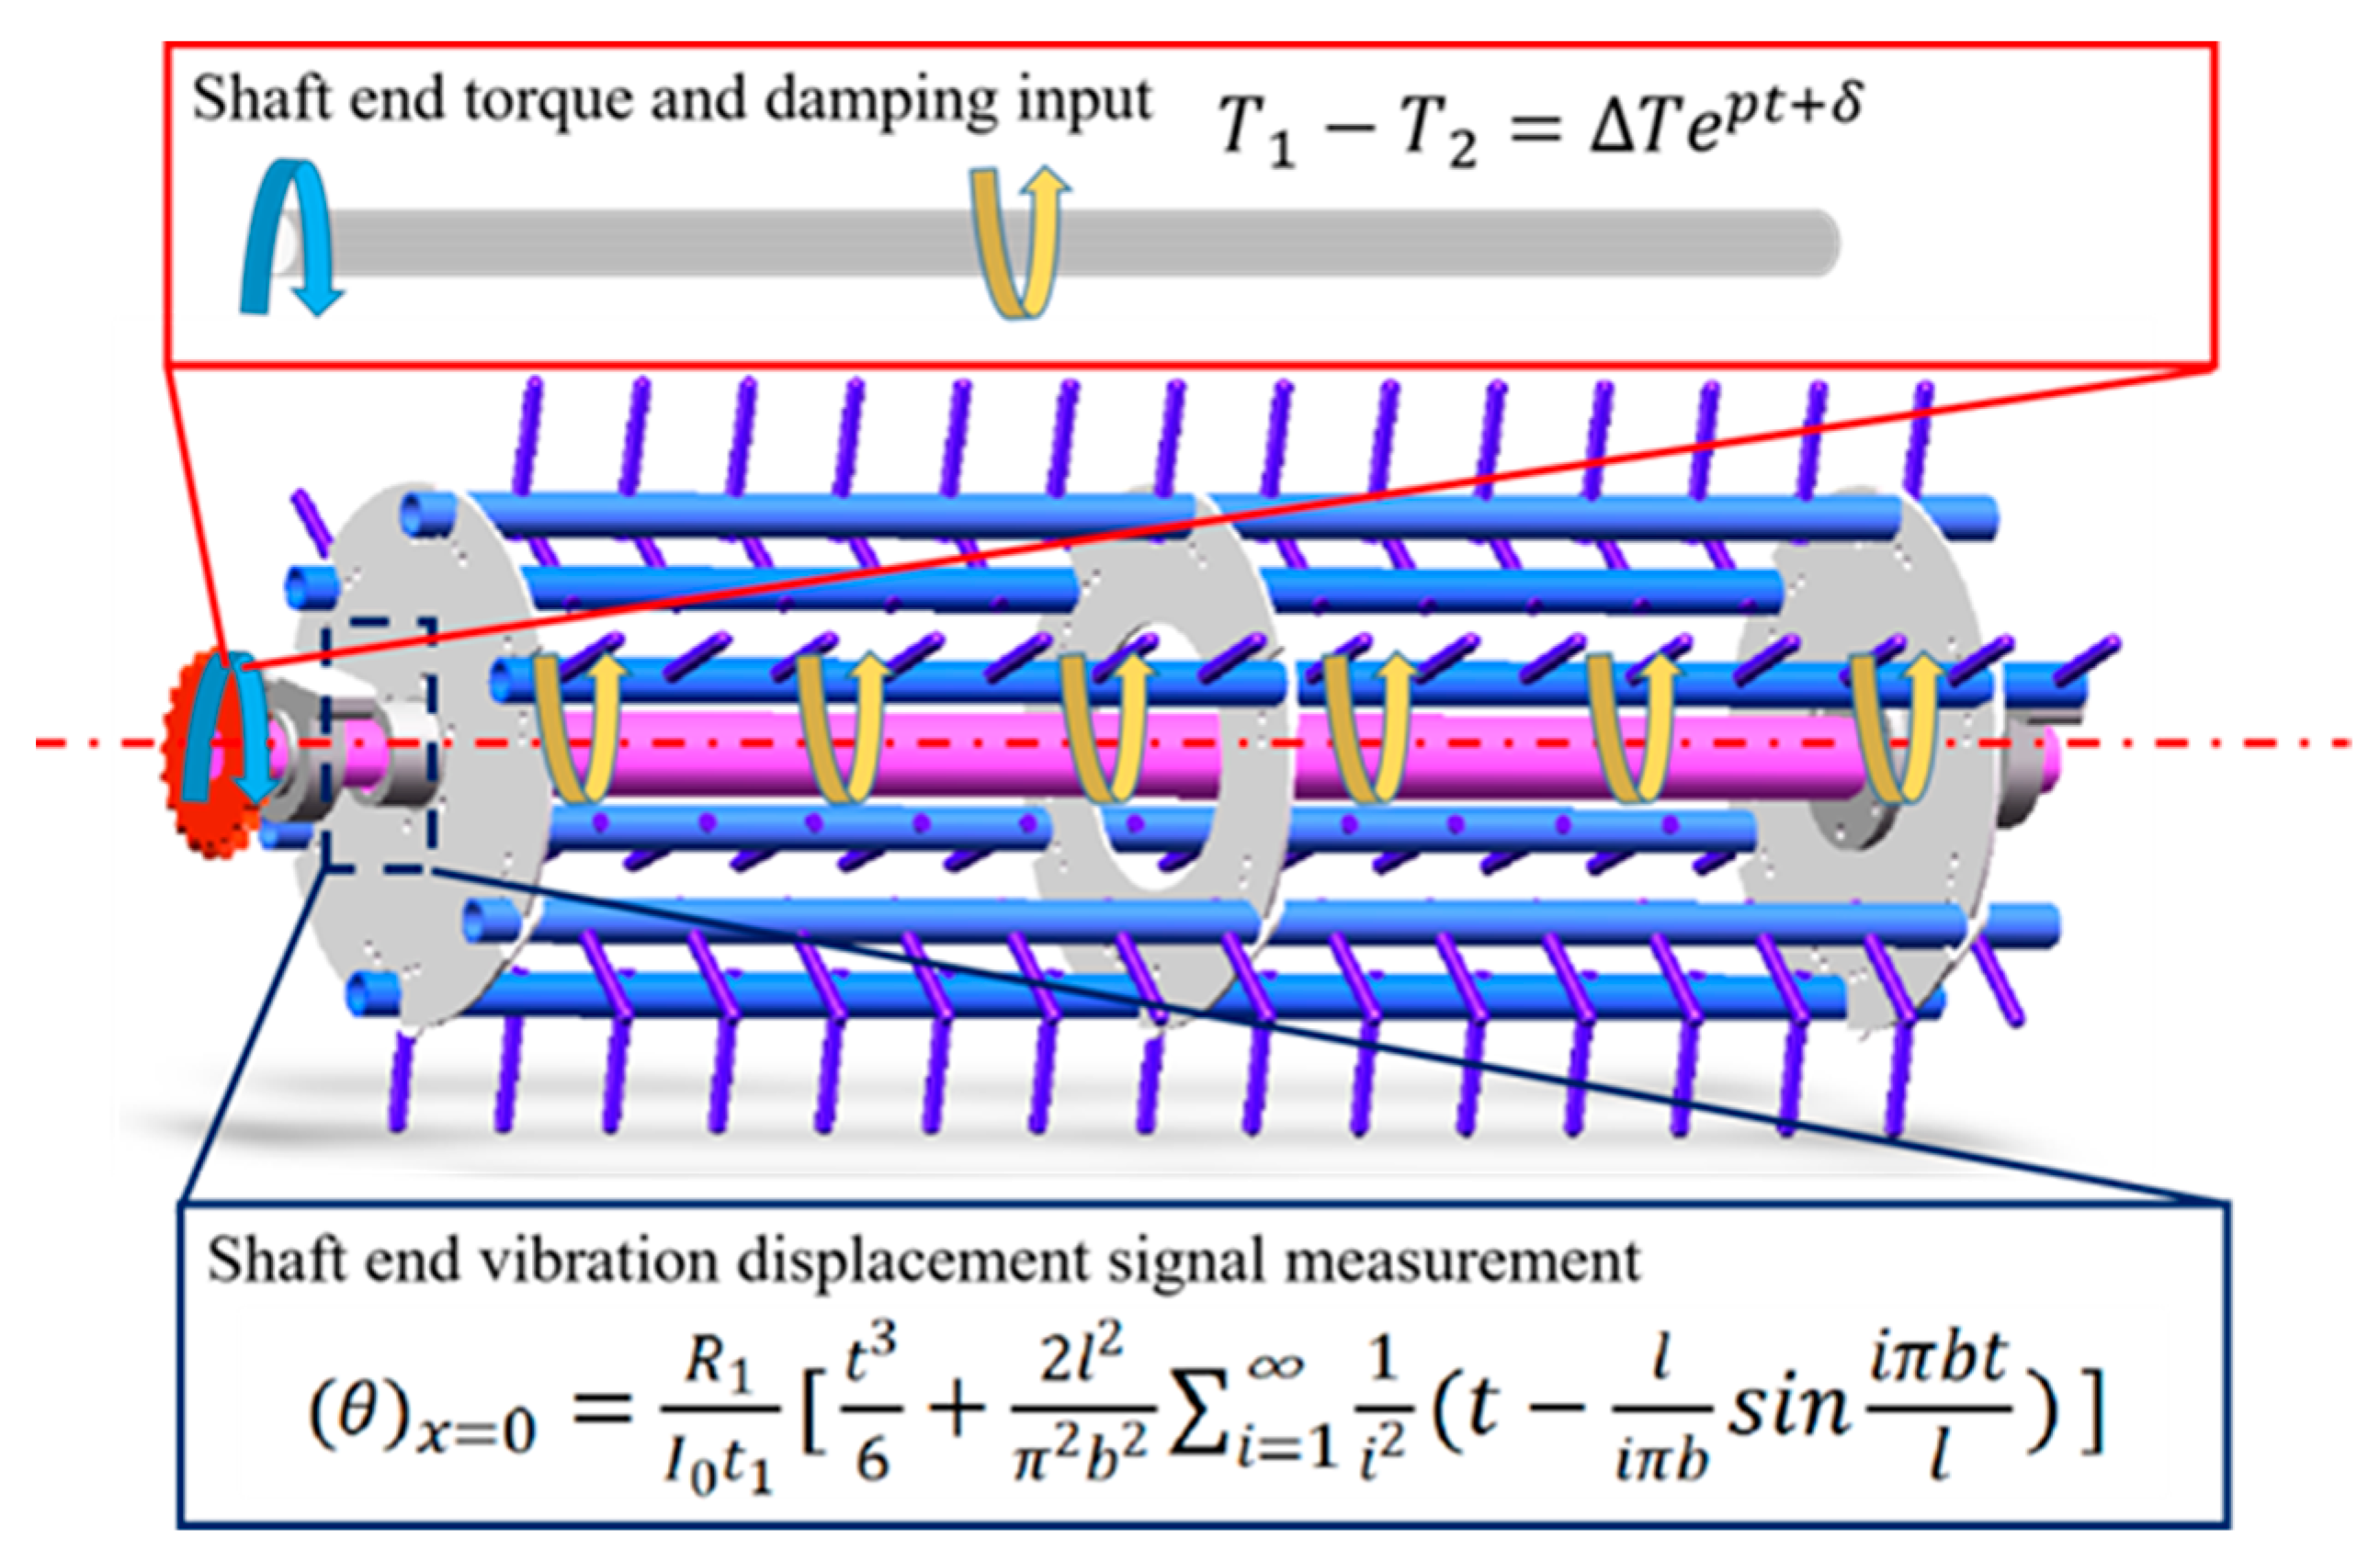
2.1. Modeling of Threshing Drum Drive System

(1) Vibration response of threshing drum with normal conditions
The threshing drum adopts different rotational speeds when facing grains in different growth states, which may cause a certain difference in the vibration signal exhibited by the threshing drum bearing. In order to reveal the vibration characteristics of the threshing drum under different working conditions, this paper establishes a dynamic model of the threshing drum, then solves the vibration equation of the model propose a signal characterization and fault prediction method for the threshing drum under different working conditions.
In order to reveal the system vibration model of the threshing drum, the torsional vibration equation of the single-pole threshing drum with a single degree of freedom is first established under the action of constant excitation. The drum is driven to rotate, and the drum is evenly distributed with spikes in the circumferential direction to complete the grain threshing work. The three-dimensional model of its structure is shown in Figure 1. The specific process is as follows, first, explore the vibration signals in the time domain, including vibration acceleration, vibration displacement, etc., and then perform FFT transformation to analyze the energy part of the vibration and reveal its vibration characteristics; then, different dampings are introduced into the vibration system of the threshing drum, the vibration response state of the threshing drum under braking is analyzed, and a preliminary prediction method for abnormal conditions such as slippage and blockage of the threshing drum is proposed.
In this paper, dynamic model are carried out based on the working characteristics of the threshing drum. Figure 2 shows the simplified model of the threshing drum transmission. For this purpose, when the length of the threshing drum is l, let the symbol 0 denote the amount of rotation (about the axis of the shaft) of any cross-section located at a distance from the left end. When the shaft vibrates in a torsional manner, the elastic and inertial torques on a typical segment can be calculated linearly according to D’Alembert’s theorem [24,25].
T + T x d x i T ρ I P d x i 2 0 t 2 = 0
In Equation (1), the torque on the central axis of the section at xi is T (N·m), and its positive direction is shown in Figure 2b, the polar moment of inertia of the cross-section is represented by Ip (mm4). Then the mass of the segment is ρ I P d x i , and the acceleration is 2 0 t 2 . Equation (2) can be obtained from this.
T = G I P 0 x
where, G is the shear modulus of elasticity (MPa). Substituting Equation (2) into Equation (1) and rearranging the above equation, Equation (3) can be obtained.
2 0 x 2 = 1 b 2 2 0 t 2
In Equation (3), b is the propagation velocity of the torsional wave, which has the form of a one-dimensional wave equation, and the propagation velocity of the torsional wave is shown in Equation (4).
b = G ρ
The free vibration solution of this equation can be obtained as shown in Equation (5).
0 = i = 1 c o s i π x l ( A i c o s i π b t l + B i s i n i π b t l )
Considering that both ends of the threshing drum are restrained ends, the boundary conditions can be established accordingly, and the boundary conditions formed by the acting inertial torque are shown in Equation (6).
{ G I P ( 0 ) x = 0 = I 1 ( 0 ¨ ) x = 0 G I P ( 0 ) x = l = I 2 ( 0 ¨ ) x = l
The first-order frequency equation of the threshing drum under constant excitation is obtained as shown in Equation (7).
G I P p i b ( s i n p i l b + I 1 b p i G I P c o s p i l b ) = I 2 p i 2 ( c o s p i l b I 1 b p i G I P s i n p i l b )
In Equation (7), the vibration frequency of the pi system, in order to determine the mode shape frequency of the system, let:
{ ξ i = p i l b η i = ρ I P l I 1 = I 0 I 1 η s = I 0 I 2
In Equation (8), I 0 = ρ I P l is the rotational inertia moment of the shaft around its own axis, so Equation (7) can be modified to Equation (9).
( t a n ξ i + ξ i η 1 ) = ξ i η 2 ( 1 ξ i η 1 t a n ξ i )
The normal analytical solution of the equation can be obtained as shown in Equation (10).
X i = C i ( c o s ξ i x l ξ i η i s i n ξ i x l )
The above Equation is simplified, and the Equation (9) is simplified into Equations (10) and (11) considering the mass moment of inertia of the shaft end disc.
ξ i 2 = η 1 η 2 + η 1 + η 2
p i l b = I 0 ( I 0 + I 1 + I 2 ) I 1 I 2
Therefore, it can be obtained that the natural vibration frequency and vibration period of this dynamic system are shown in Equation (13).
p i = G I p ( I 0 + I 1 + I 2 ) l   I 1 I 2
τ = 2 π p i
where, τ is the vibration period of the threshing system. The threshing drum is subjected to multiple torque in static equilibrium when operating at steady state speed. The drive torque is generated from a separate prime mover and transmitted through the coupling. The drive torque is balanced by the load torque acting on the system. These loads result from the damping of the threshing drum itself and the interaction between the threshing drum and the harvested grain. As long as the drive torque is equal and opposite to the load torque, the rotor speed will remain constant and the shaft will deform at a constant angle, twisting slightly. The amount of torsion for each section will be determined by the local torque and equation requirements for each shaft section. However, due to the different growth conditions of the grain, the threshing drum may generate torsional vibration under the action of impact load. Therefore, the torsion equation of this system can be expressed as Equation (15).
I Δ θ ¨ + 2 D r Δ θ ˙ + 2 K T Δ θ = Δ T e j ( p t + δ )
In Equation (15), the torque at the left and right ends can be approximately equal to I, the torsional stiffness is KT, and the torsional damping is Dr. The solution to this equation is shown in Equation (16).
θ e j α = Δ T e j δ 2 K T I p 2 + j 2 D r p
So far, the natural vibration frequency of the power system and its vibration characteristics can be obtained during the normal operation of the threshing drum. In order to simulate the vibration response of the shaft end of the threshing drum during slippage and blockage, it is necessary to use different disturbances for numerical simulation.
(2) Vibration response of threshing drum with slips or jams
When the threshing drum slips, its rotational speed will be significantly reduced. And in this model, the torque on the left end will decrease. The calculation of the torque at both ends can be carried out by Equations (1) to (3). The system is initially in a static state, and a certain initial torque is applied to the left end of the shaft as the power input, as shown in Figure 3. When the combine harvester works, the rotation speed per unit time is constant, the grain has a relatively average growth trend and small spatial variability can be ignored [26]. Therefore, to simplify the calculation, in this state, the threshing drum is subjected to a constant grain load as the system damping input.
It can be obtained from Equations (4) to (10), in this state, when a signal inputs a signal of the threshing drum, it will generate a reversal vibration, which will be superimposed with the vibration of the threshing drum when the load is not loaded. The Z direction signal response function of the left end of the threshing drum is shown in Equation (17).
θ 1 = T 1 i = 1 l X i 0 l ( x l ) X i d x l 2 ( X i 0 X i l ) c o s ( ξ i b t l )
Therefore, the characteristics exhibited by the vibration signal of the shaft end of the threshing drum can be solved by changing different torques with the help of Equation (17). By adjusting different torque inputs, the vibration signal exhibited when the drive pulley slips to different degrees can be explored.
In order to simulate vibration of the threshing drum, the disturbance signal is used to solve the response state of the vibration system to this signal. Considering the loading law when the grain is fed, this model introduces a ramp function for loading, as shown in Equation (18). Regarding this vibration system, the vibration equation of rigid body rotation includes two parts, one is the vibration of the system, the other is the vibration state exhibited by the action of the grain. Excited by the sawtooth pulse function, the resulting vibration equation is shown in Equation (19).
R ( t ) = M ( t [ a t ] )
0 = R t 3 6 ρ I P l t 1 = R t 3 6 I 0 t 1
In the above Equation, R is the impact load of the grain at time t (N·m), according to this, the vibration equation inherent in the rotation of the vibration system can be obtained as shown in Equation (20).
θ 2 = 2 l 2 R 1 π 2 b 2 I 0 t 1 i = 1 1 i 2 c o s i π x l ( t l i π b s i n i π b t l )
The total motion equation of the shaft can be solved by Equations (19) and (20), and the total rotation of the torque acting end is obtained as Equation (21).
( θ ) x = 0 = R 1 I 0 t 1 [ t 3 6 + 2 l 2 π 2 b 2 i = 1 1 i 2 ( t l i π b s i n i π b t l ) ]
The vibration signals of the threshing drum during slippage and blockage can be solved with the help of Equations (17)–(21). During the test, the control variable test scheme was adopted, and the blockage condition was simulated by adjusting the feed load. After entering the structural parameters of the threshing drum and the input pulse load torque parameters, the vibration output signal of the vibration system can be obtained. After the time domain signal of the vibration system is obtained, it is subjected to FFT transformation and analysis. its distribution in the frequency domain.

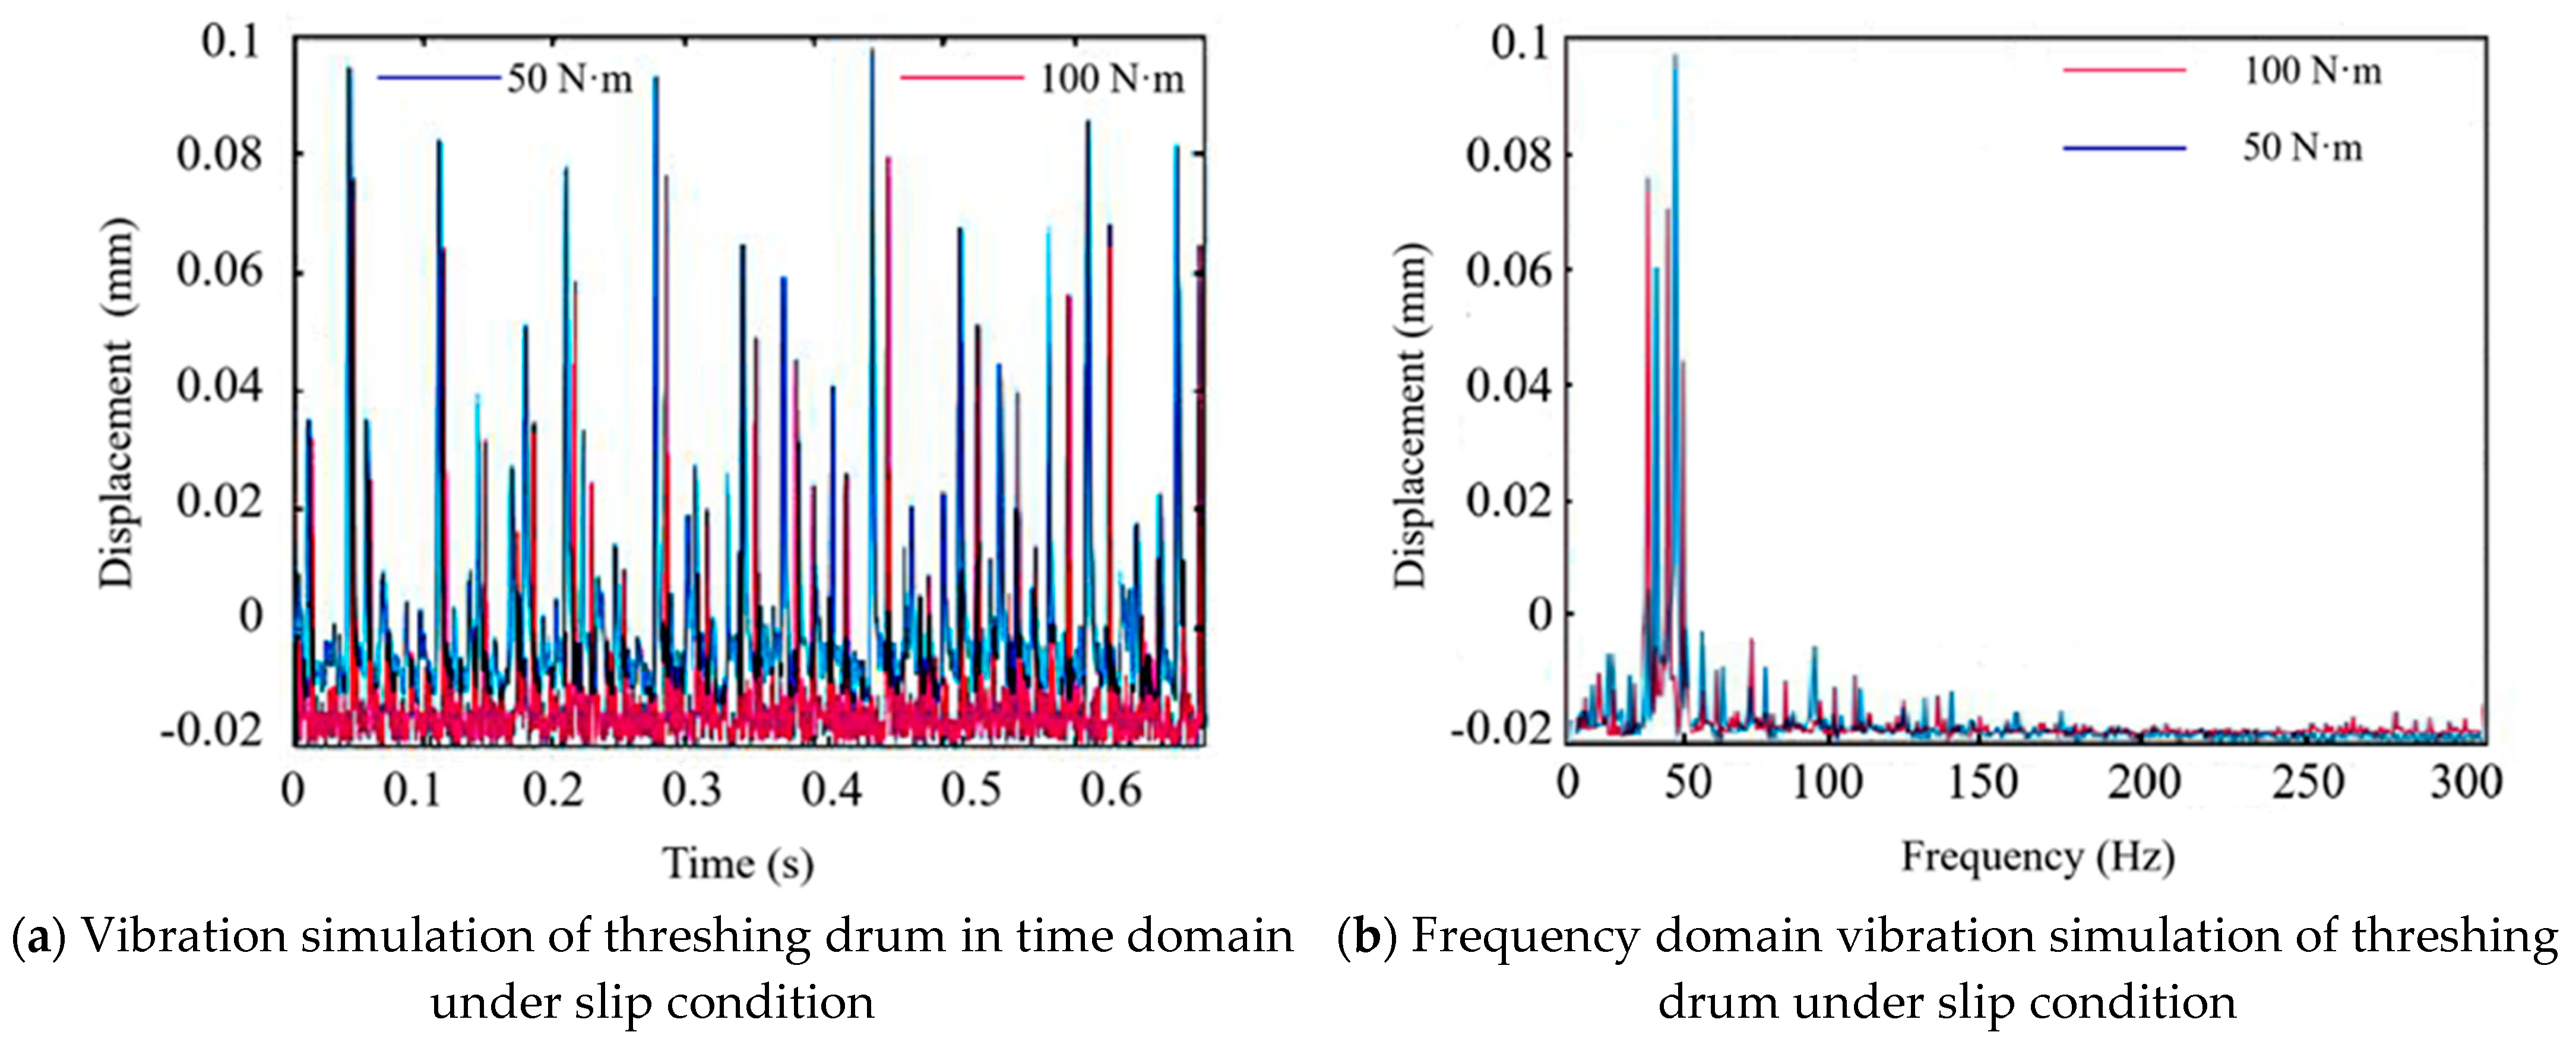
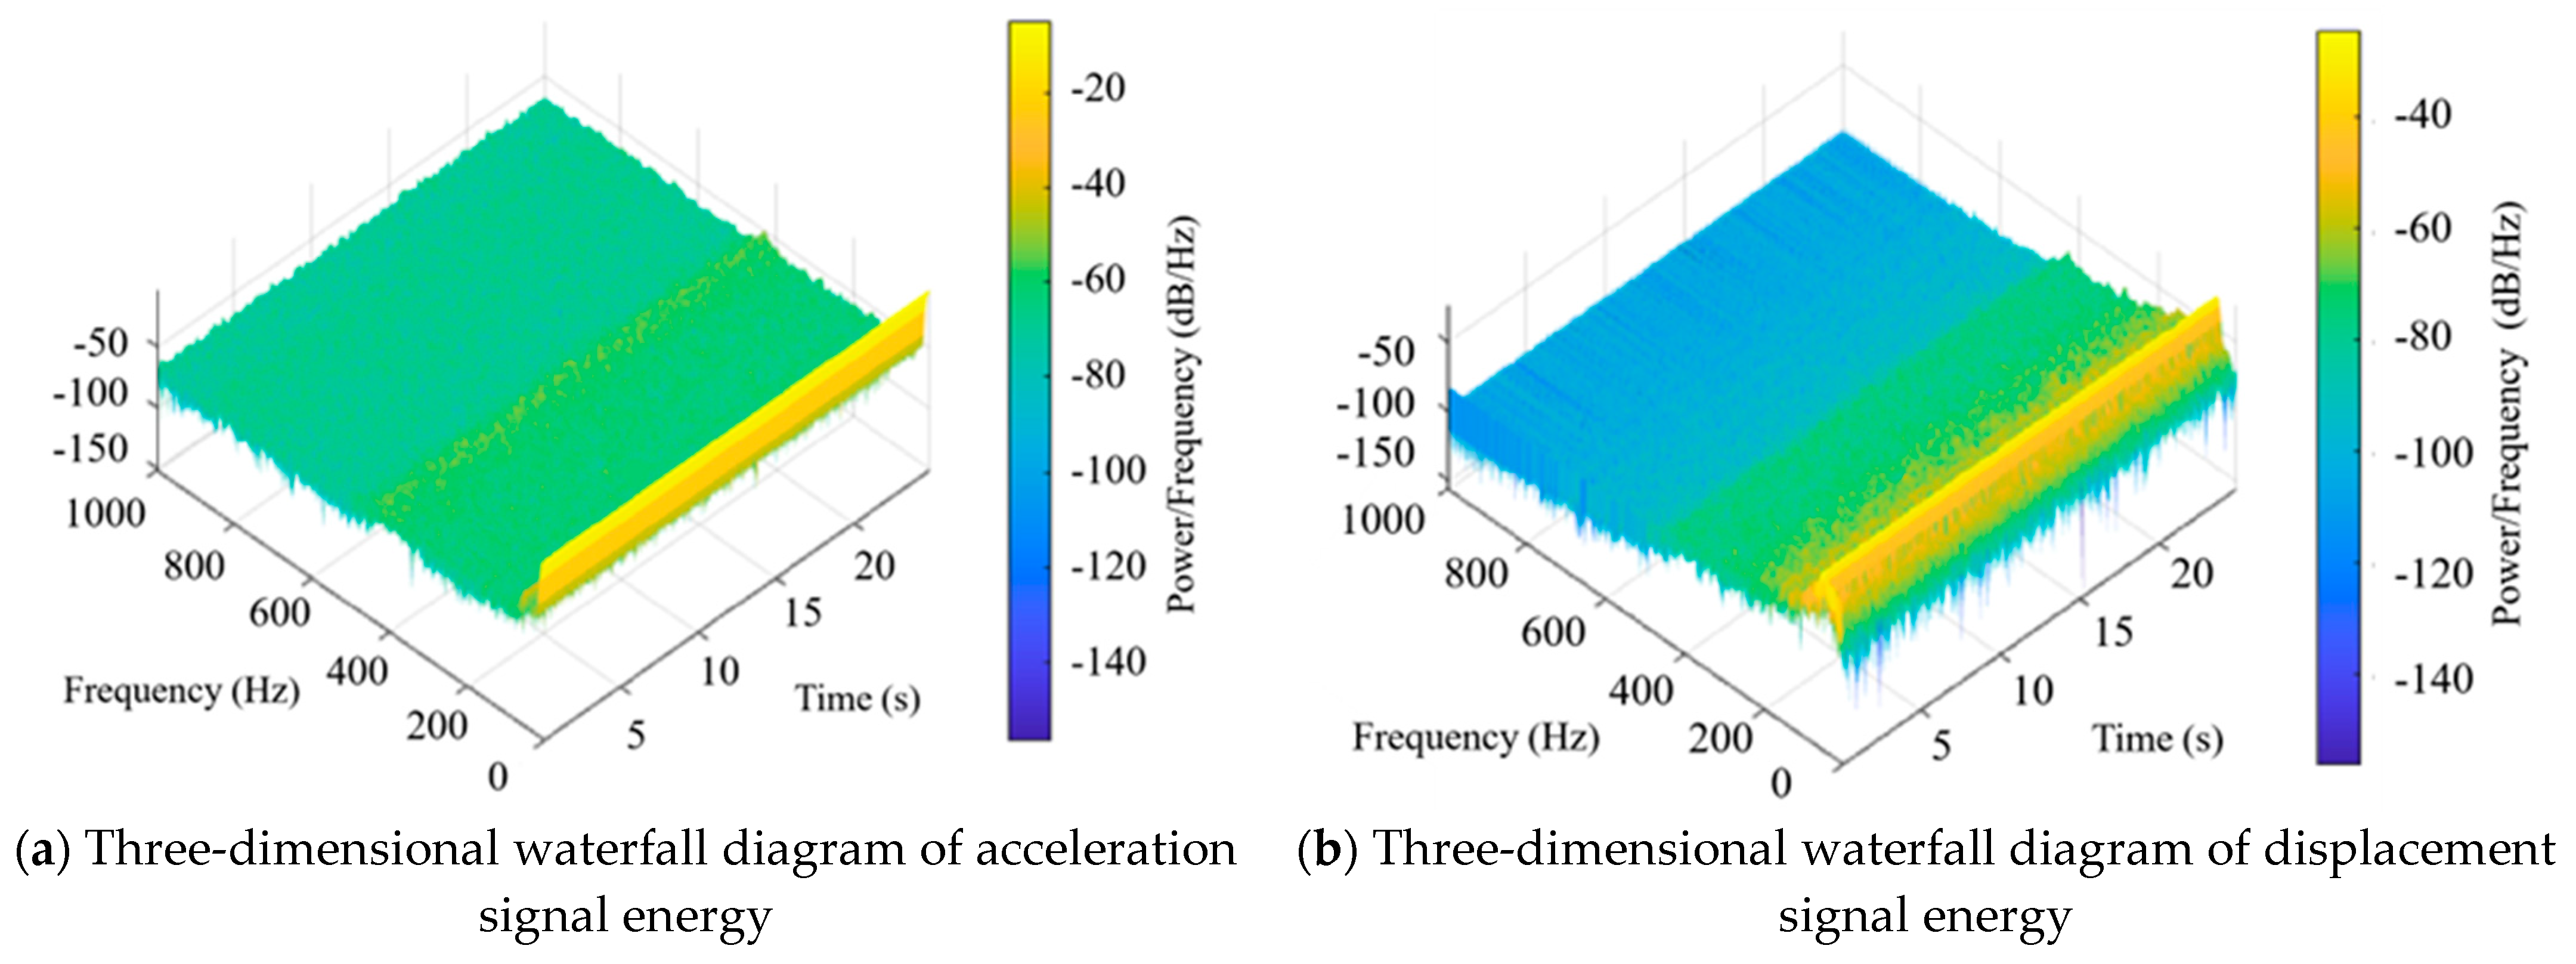
2.2. Vibration Signal of Threshing Drum with Slip Condition

The threshing device of the combine harvester is an important component to achieve efficient harvesting and ensure harvesting quality. However, when the threshing drum is harvested for grains of different varieties and growth conditions, the loads on it are not exactly the same. When the load is suddenly loaded or cyclically loaded, the working state of the threshing drum may be abnormal, affecting the above-mentioned working indicators. At present, the failure situation of the threshing drum mainly includes two forms: material blockage and fracture, and slippage of the transmission system.
In order to verify the accuracy of the characterization model established in this paper for the fault signal of the threshing drum and reveal the influence of different working conditions (different grain loads or different rotational speeds of the threshing system) on the vibration performance of the threshing drum. A comprehensive test bench of multi-stage threshing drum was built to verify and evaluate the vibration performance of the threshing drum [27,28,29]. The built multi-stage threshing drum test bench is shown in Figure 4.
The multi-drum test bench of the combine harvester consists of a transverse axial flow drum and a longitudinal axial flow drum, which are driven by a transverse axial flow motor and a longitudinal axial flow motor respectively. The test bench can realize two transmission modes of belt drive and chain drive, the pulley or sprocket drive can be replaced according to the test needs. When the drum is working, it can be loaded by adding a counterweight on the web to simulate the working condition of the threshing drum or the magnetic powder brake can be used to apply torque to the drive shaft to simulate its working condition.
The magnetic powder brake used in this test bench is FZK50 from Nantong Hongda Electromechanical Manufacturing Co., Ltd. (Nantong, China) When the electromagnetic coil is energized, the magnetic powder particles are subjected to the magnetic force. It attracts and gathers together to form a whole, so as to transmit torque. For measurement, choose IEPE piezoelectric acceleration sensor, the rotational speed sensor is used to measure the rotational speed change of the threshing drum, choose DH5640 photoelectric rotational speed sensor, the installation method of each sensor is shown in Figure 4b.
The front end of the photoelectric sensor should be perpendicular to the axis of the rotating shaft to be measured, and the measurement window of the sensor should rotate with the measured rotation. The axes are parallel to each other. The acceleration sensor is installed on the bearing seat of the measured shaft through the magnetic seat, which is installed near the center line of the bearing.
When installing the speed sensor, stick a reflective label on the pulley to keep the distance between the sensor and the reflective strip within its measurement range. The signal test and analysis system used in this test is the DH5902 data acquisition system. The technical indicators are shown in the Table 1. During the test, various sensors are installed on the multi-drum test bench and connected to the data acquisition system. Perform a certain excitation test on the sensor, observe that the information can be collected normally, and then the test can be started.
The sensor collects the voltage and current signals of the working parts of the combine harvester, which obtains a discrete pulse sequence corresponding to the current or voltage. The discrete pulses are converted into discrete digital signals by the A/D converter, the digital-to-analog of the sensor signal is completed transformation [30].
(1) Design of test plan for threshing system slip condition
In this paper, the above test bench is used to simulate the normal operation of the combine harvester threshing system during the field harvesting operation, the blockage of the threshing drum and the slippage of the transmission belt. The transmission mode is belt transmission. During normal operation, the speed of the drum is a constant speed, when the drum is blocked or the threshing drum is slipping, the speed of the drum is decelerated. The magnetic powder brake is used to load the drum shaft to be tested in the threshing system to simulate this working condition, the speed of the drum is increased as a working condition comparison group.
Regarding the vibration distribution of the multi-stage threshing drum, scholars such as Tang found that the vibration amplitude of the second axis is the largest [28]. Therefore, the test and analysis of the vibration signal in this paper are mainly carried out for the second axis. When the speed sensor is installed, the reflective strip is attached to the pulley of the threshing drum of the second shaft, the sensor is installed on the bracket for the pulley and perpendicular to the pulley. The distance between the sensor and the reflective strip is kept at about 8 cm, so as to ensure that the distance is within the measurement range of the sensor and will not interfere with the rotation of the threshing drum when measuring the rotational speed. The three-axis acceleration sensor is installed on the bearing seat of the threshing drum shaft through the magnetic base. The X direction of the sensor measures the horizontal vibration of the threshing drum, the Y direction measures the axial vibration, and the Z direction measures the vertical vibration.
In order to realize the precise control of the working state of the threshing system, this paper used the control panel of the threshing drum to adjust the speed of the threshing drum. During the test, the motor speed is changed through the speed control panel to change the speed of the threshing drum, the magnetic powder on the end face of the threshing drum is changed through the loading current control panel. The current of the brake is applied to the threshing drum, and its control structure is shown in Figure 5a.
In this paper, four sets of tests at different speeds are made on the multi-drum test bench, the operating conditions of the threshing drum at different speeds are obtained by changing the speed of the drive motor through the speed control panel. The actual speed of the drum is measured by the photoelectric speed sensor. The average value of the speed during the measurement time is taken as the actual speed of the drum; the speed signal and the acceleration signal of the shaft end of the threshing drum during each group of tests are collected.
(2) Vibration signal of different loads of threshing drum
When the combine harvester faces crops with different grain growth densities and different stubble heights, the load on the threshing drum is different, which may cause different vibration characteristics. When the grain feeding amount changes suddenly or the load is too large, the threshing drum may be blocked and cause abnormal vibration. In this paper, the magnetic powder brake is used to load the measured drum shaft of the threshing system to simulate the drum slipping and blocking conditions. Four sets of rotation tests under different loads were performed on the multi-drum test bench, the rotational speed signal and shaft end acceleration signal of the threshing drum during each set of tests were also collected. The load of the threshing drum is shown in Table 2.
In the test, torque was applied to the threshing drum shaft by changing the current of the loading current control panel. The four groups of experimental currents were 0, 0.2 A, 0.4 A and 0.6 A respectively. The load torque of the drum under different loading conditions is calculated, and the loading voltage is 220 V. The corresponding relationship between the test loading current and the loading torque is shown in the table. The initial rotation speed of the threshing drum is 36.5 r·min−1, and the rotation speed n of the drum under different loads is taken as the average value during the measurement time. As the loading current increases, the rotational speed of the drum gradually decreases. This is because when the loading current is increased, the torque applied by the magnetic powder brake on the shaft end of the threshing drum to the drum increases, which will inevitably cause a decrease in the drum speed when the initial speed is constant.

3. Results and Discussion

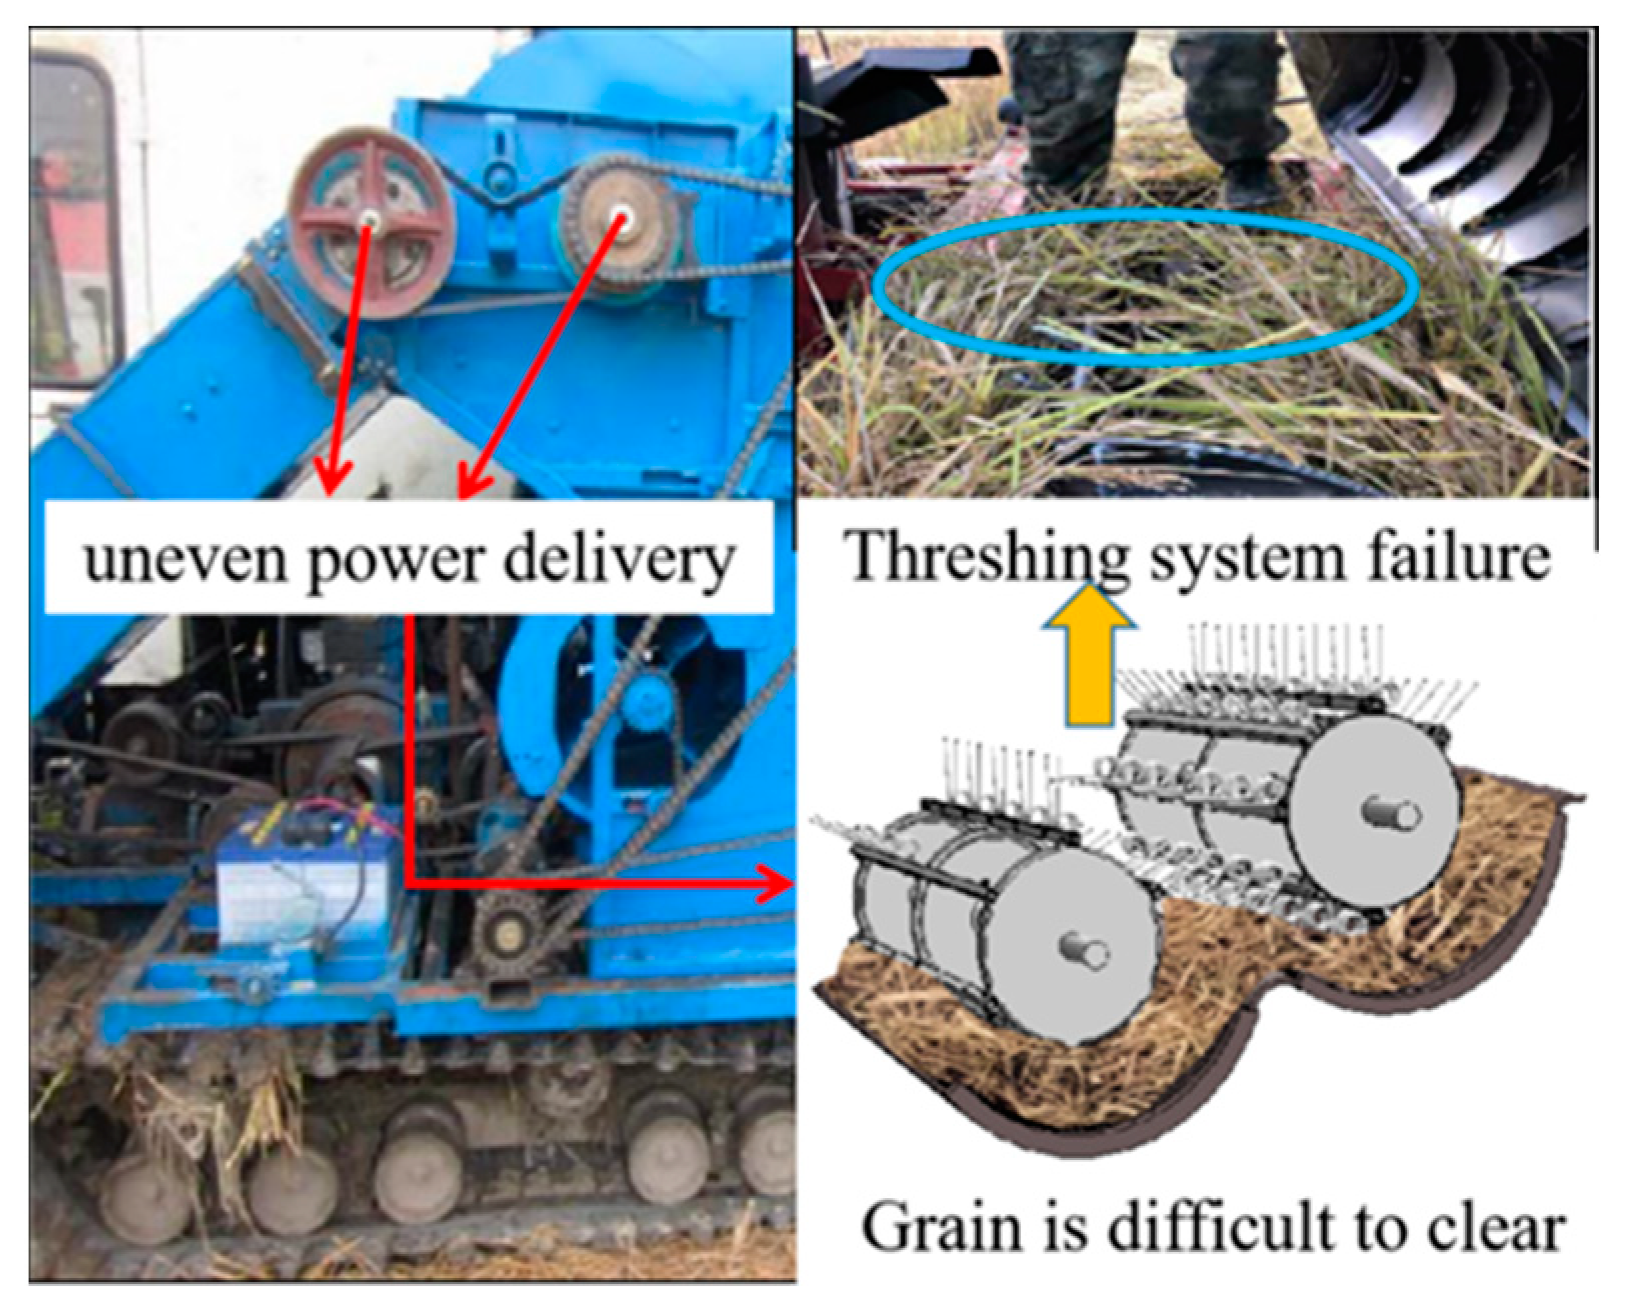
3.1. Signal Response and Failure Analysis

(1) Numerical simulation analysis of threshing drum transmission slip
When the threshing drum slips, its rotational speed will be significantly reduced, so the torque at the input end will also decrease accordingly. In this experiment, two different input torques, 50 N·m and 100 N·m are designed, of which 50 N·m simulates slippage and 100 N·m was used as the control group for comparative analysis. Therefore, in the corresponding model, the vibration characteristic signal of the threshing drum in this state can be solved with the help of Equations (17)–(21). The time domain displacement of the threshing drum bearing in the Z direction can be calculated and extracted with the help of MATLAB. After FFT transformation, the vibration response state of the threshing drum can be obtained through the solution, as shown in Figure 6.
It can be seen that at the resonance point of the threshing drum, due to the low tangential stiffness, the vibration amplitude there will reach the maximum value. At the same time, it can be seen that at the low frequency of 50 Hz, there is an obvious vibration characteristic peak, indicating that the vibration energy of the threshing drum is mainly concentrated in the low frequency. The displacement fluctuations in the Z direction in the time domain are more obvious, and the fluctuation range is at −0.2 mm–0.1 mm.
In addition, it can be seen that the vibration peak displacement is about 0.097 mm when the threshing drum slips. In order to reveal the vibration intensity in the entire frequency domain, this paper analyzes the amplitudes corresponding to all frequency in the low frequency domain (0–80 Hz). Take the root mean square value (RMS), as shown in Equation (22).
RMS = 1 N i = 1 N ( x i ) 2
where, N is the total number of intervals in the step size, and xi is the data on the ith interval. It can be seen that in this numerical model, because the fixed impact load caused by the grain impact is simplified, the vibration characteristics displayed are stable in the low frequency band, which can be used for the subsequent threshing drum. The slip fault evaluation provides a certain theoretical basis.
(2) Numerical simulation of threshing drum transmission blockage
When the threshing drum is blocked, the drum will be constant or overloaded and act on the central shaft to generate torque. The magnitude of this torque is related to the period and the current grain feeding amount. Therefore, in the vibration model of the threshing drum, in order to simplify the calculation, the specific performance is that the damping of the system changes periodically, the frequency of change is related to the crop feeding. The frequency into the threshing drum is the same. Since the load on the threshing system is a periodic load, the torque it receives is a sawtooth pulse function. It can be seen from Equations (7)–(12), (15), (18) and modifying the damping of the system, we can get vibration signature of the threshing system when it is clogged. In the experiment, the impact loads were set to 10 N·m and 20 N·m, respectively, simulating the working conditions under normal operation and blockage.
At the same time, under this working condition, the vibration frequency of the threshing system will also change. After correcting Equation (12), it is brought back into the calculation to obtain the vibration response state of the threshing system in this state. The calculation result is shown in Figure 7.
Figure 7 shows the vibration characteristic signal of the threshing system under different loads. When the working condition of blockage occurs, the peak vibration frequency of the threshing system is about 25 Hz, the vibration amplitude is about 0.55 mm. Different from the slip condition, when the threshing system is blocked, the vibration frequency is significantly reduced, indicating that the vibration energy is concentrated in the low frequency band in this state. The vibration components are relatively regular in the frequency domain and the vibration characteristics are more obvious.
The simulated vibration characteristics of the threshing drum during blockage and slippage are shown in Table 3. It can be seen that when the blockage or slippage occurs, the vibration amplitude of the threshing drum in the Z direction will increase significantly.

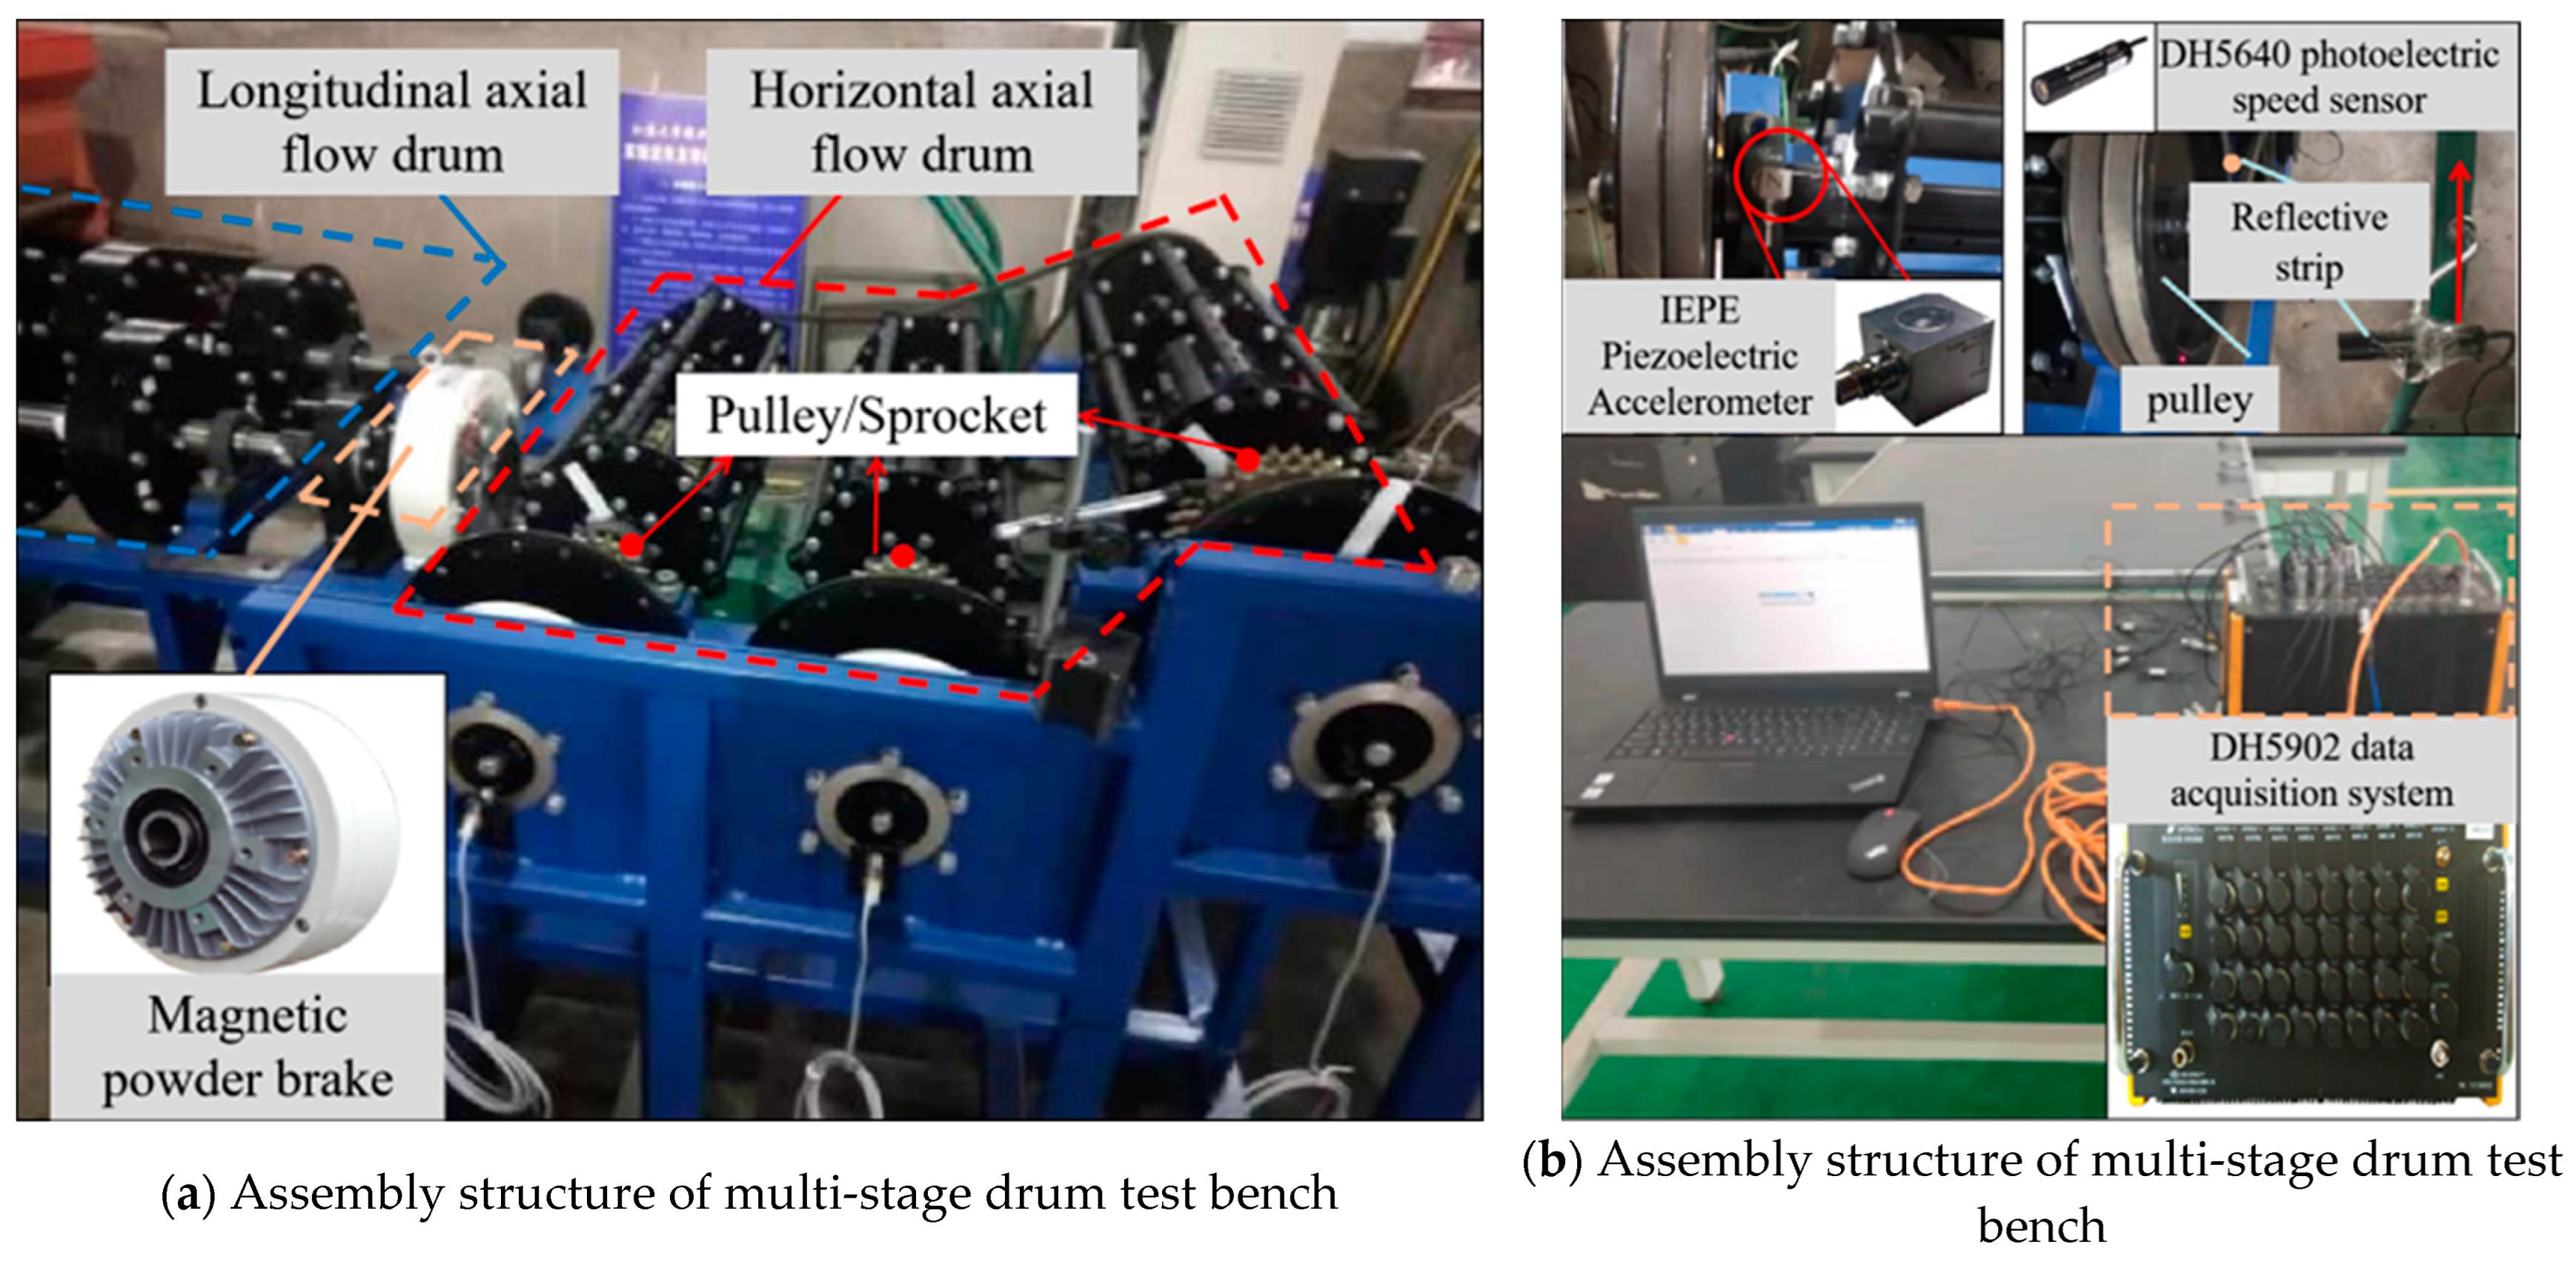
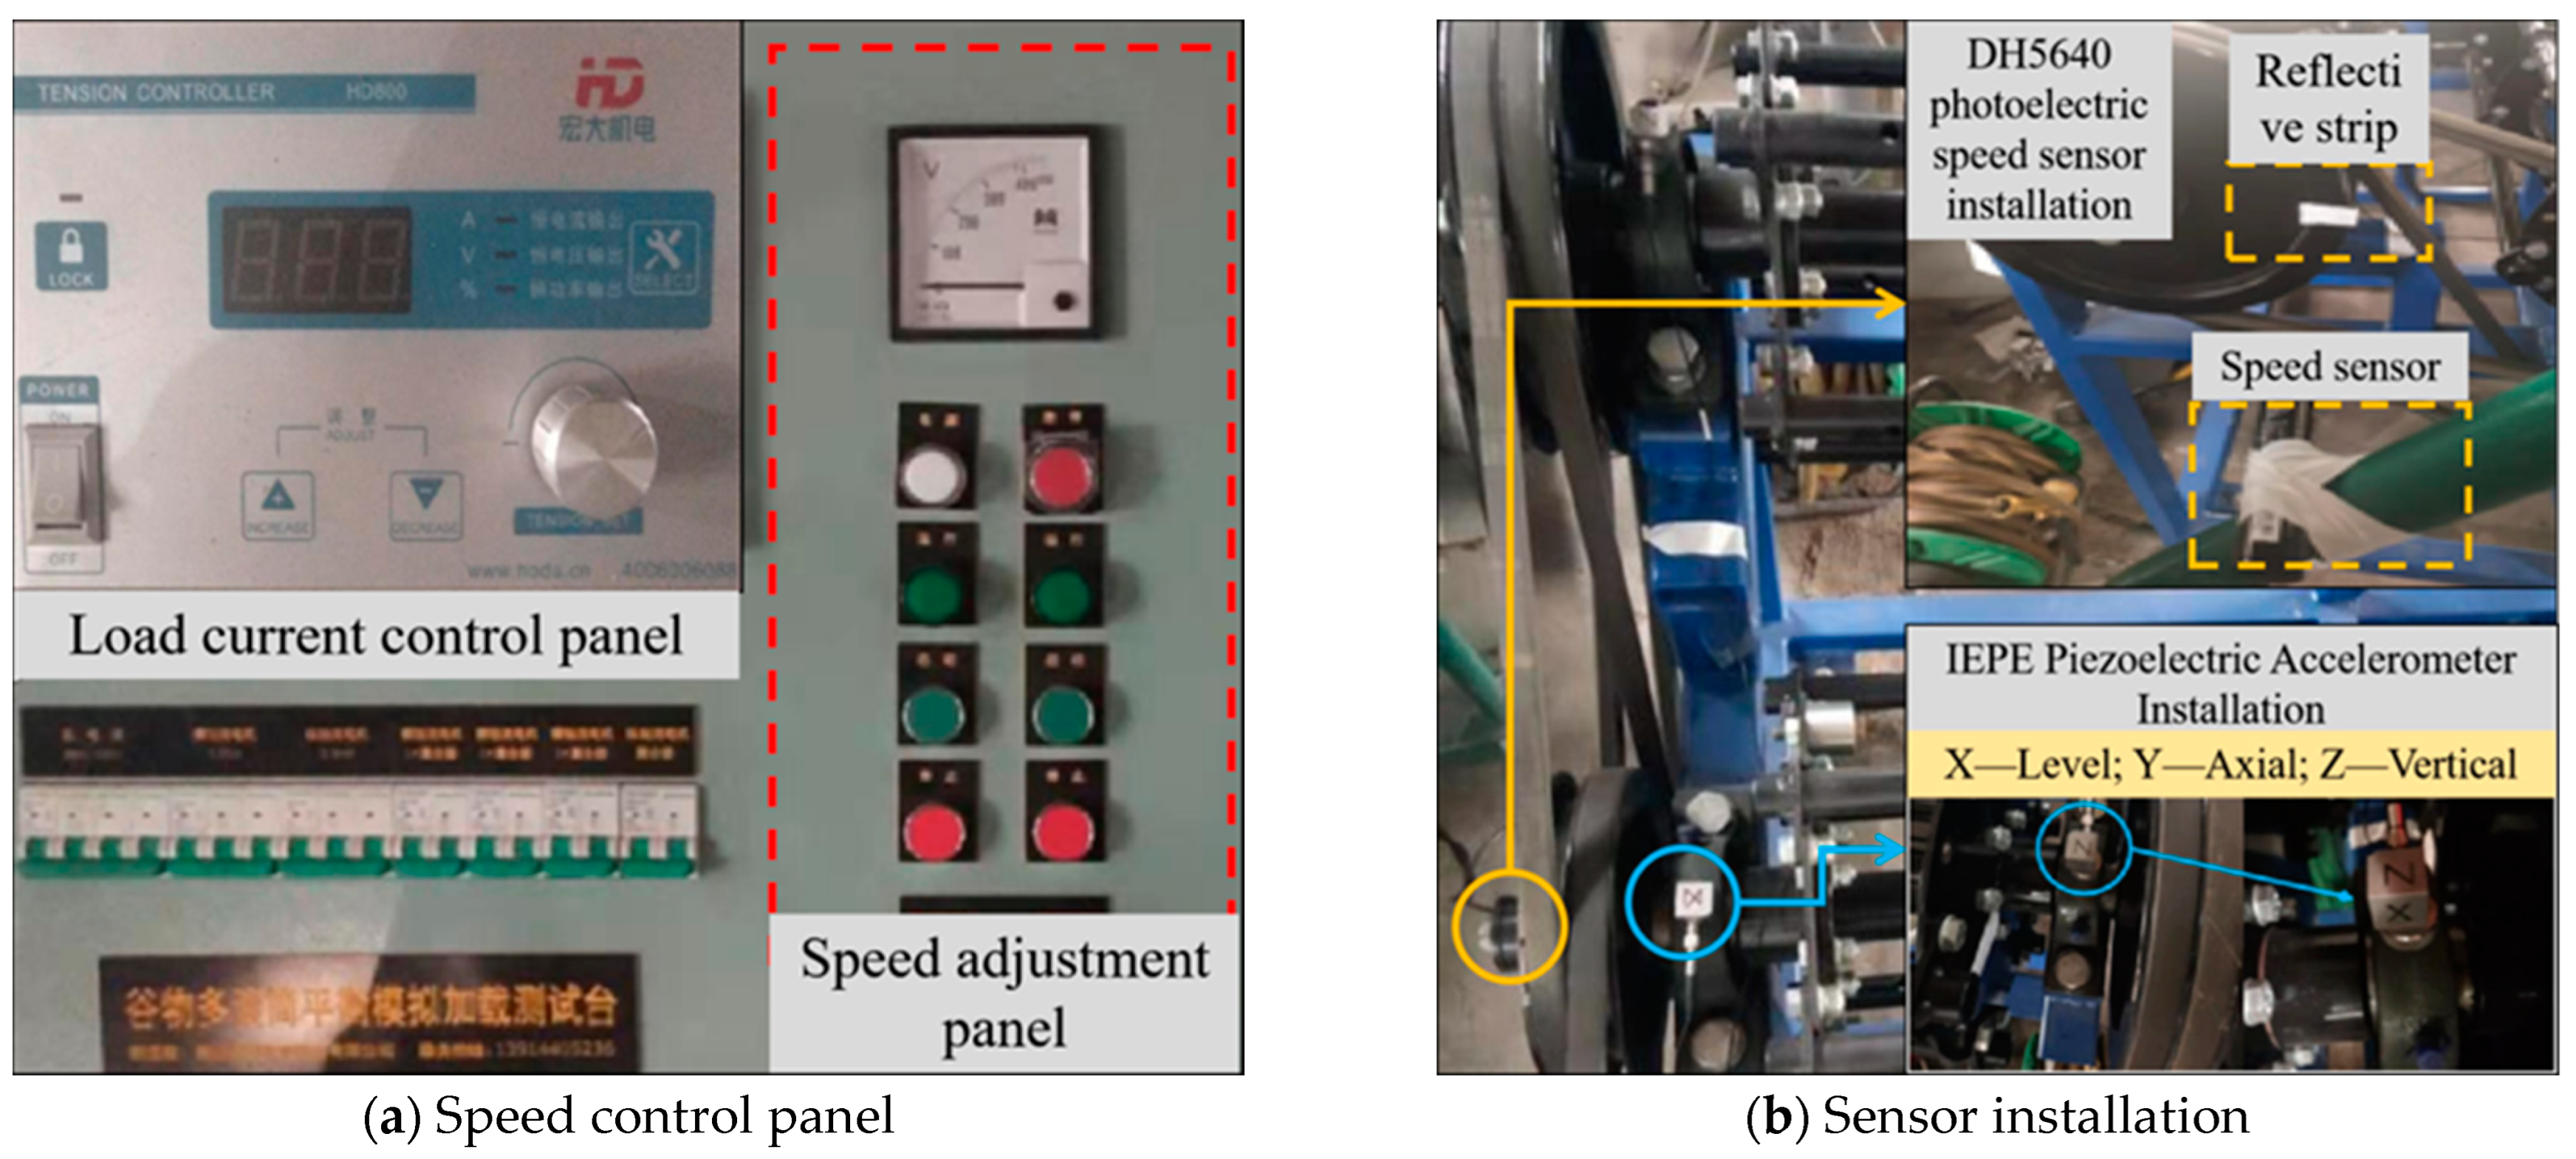
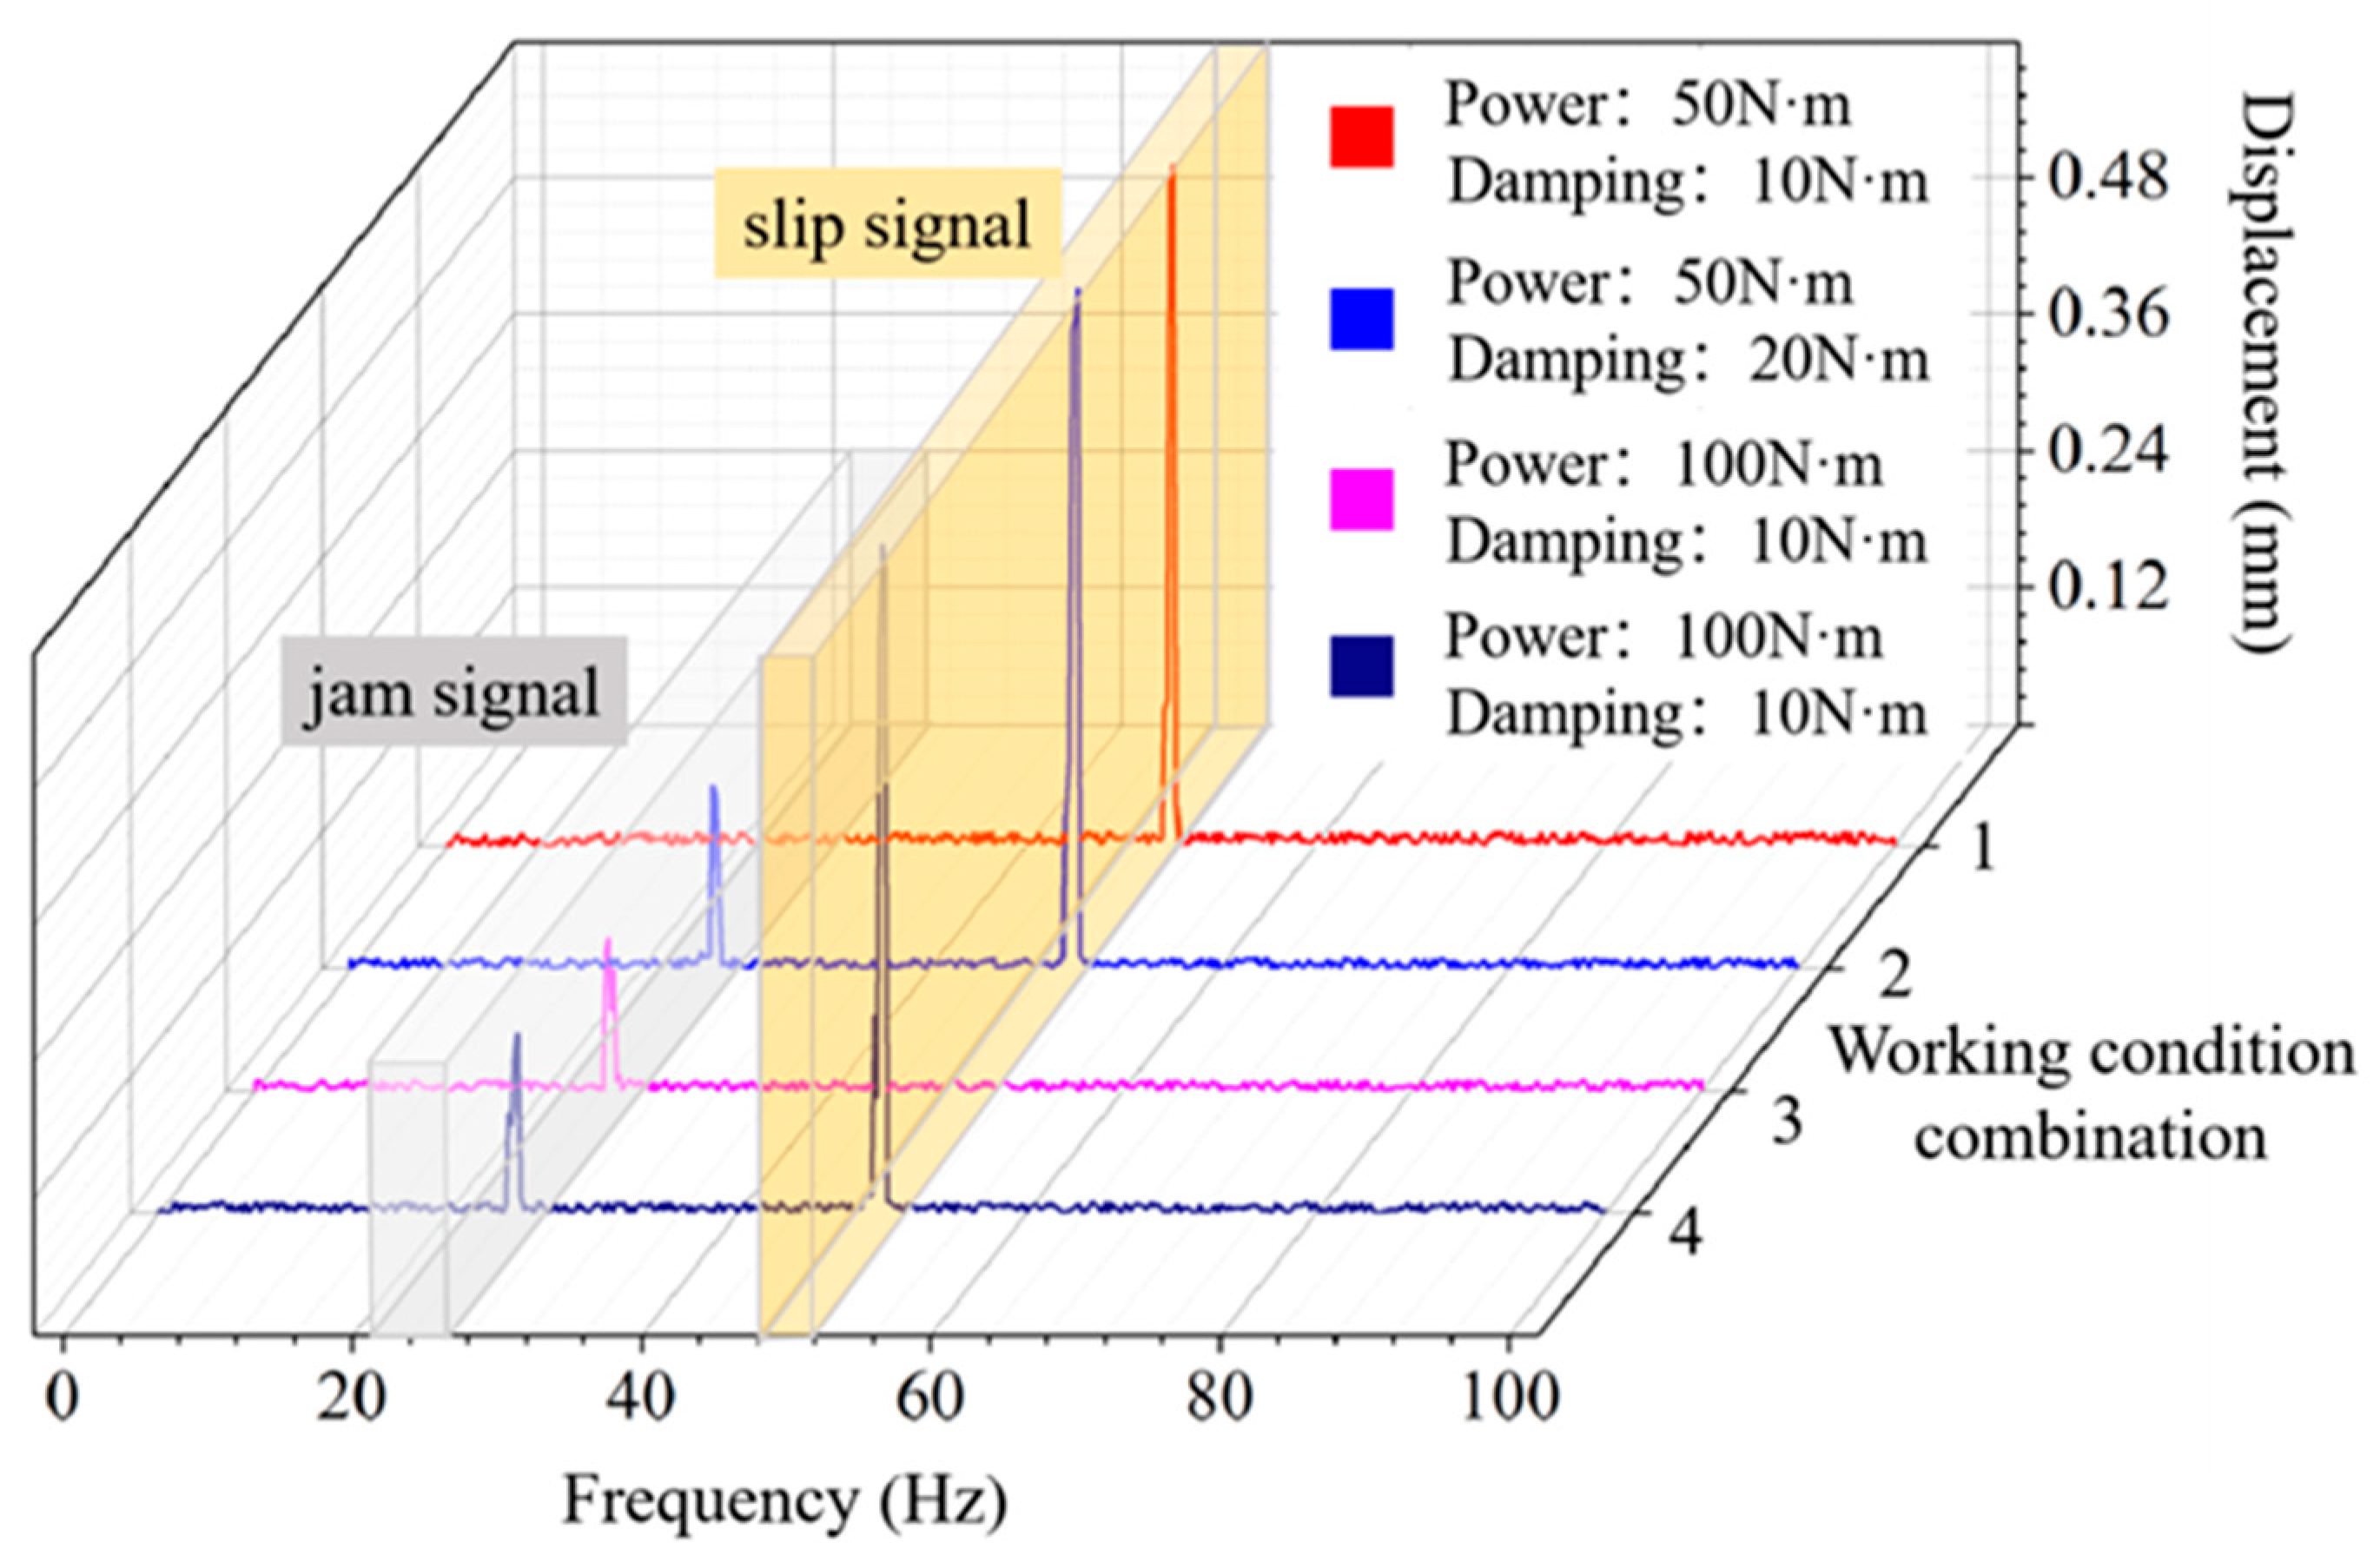
3.2. Fault Diagnosis of Threshing System Slip Condition Test

In the research on parallel threshing drums, Tang found that the vibration signal of the multi-stage threshing drum is mainly in the Z direction [31], which is the vibration signal measured in the Z direction in this paper. Therefore, the vibration signals of the shaft end of the threshing drum in the Z direction collected under different rotational speed conditions during the test were mainly analyzed and processed. The operating parameters of the drum under different rotational speed conditions are shown in the Table 4.
It can be seen from Table 4 that with the increase of the rotational speed of the drum, the acceleration in the Z direction of the drum shaft end also increases. The maximum displacement is about 0.3 mm, but it can be seen that the maximum displacement in the Z direction increases first and then decreases slowly. When the speed is lower than 725 r·min−1, the peak displacement increases gradually, and when it reaches 725 r·min−1, the peak displacement decreases obviously. It can be seen that the frequencies when the peak displacement is reached at different speeds are all around 50 Hz.
It can be seen from the Figure 8 that the drum acceleration fluctuates continuously during the whole measurement process and the signal is relatively complex. But as a whole, it can be seen that the magnitude of the acceleration also increases with the increase of the speed, the peak acceleration in the frequency domain is concentrated in the low frequency part. About 50 Hz is the peak period, so the vibration energy of the threshing drum is mainly concentrated in the low frequency band, and this result is in good agreement with the theoretical model.
In addition, with the increase of the rotation speed of the threshing drum, it can be seen that the vibration acceleration of the threshing drum in the frequency domain increases under the working conditions of 632 r·min−1 to 695 r·min−1, the vibration acceleration decreases significantly at 725 r·min−1. For the change of the vibration amplitude of the threshing drum, the acceleration signal is further processed by quadratic integration to obtain the time domain diagram of the displacement signal, and FFT is performed on it to obtain the frequency domain diagram of the displacement signal. The results are shown in Figure 9.
It can be seen from Figure 9 that with the increase of the rotational speed, the vibration response of the shaft end of the drum increases, resulting in a slight change in the running state of the drum. In the frequency domain spectrum, it can be seen that the frequency distribution of the drum when the peak displacement is reached is about 50 Hz. This is because the belt drive mainly relies on the friction transmission between the belt and the pulley, so its vibration energy should be concentrated in the low frequency position. Contrast chain In terms of transmission, the vibration impact brought by the belt drive is smaller, so the belt drive is relatively stable, as the speed increases from 631 r·min−1 to 695 r·min−1, its peak displacement also gradually increases, but when the speed reaches 725 r·min−1, instead, the peak displacement decreases.
The displacement signal has the same response characteristics as the acceleration signal. In the time domain, the displacement in the Z direction of the drum is relatively obvious, and the fluctuation range is −0.4 mm to 0.4 mm. In the frequency domain, the peak displacement of the drum is mainly concentrated in the low frequency part, and all are around 50 Hz, the maximum peak value is 0.184 mm corresponding to the frequency is 49.93 Hz, which is consistent with the acceleration signal. But the peak characteristic is more obvious than the acceleration signal, which can be used as the basis for judging the slippage condition.

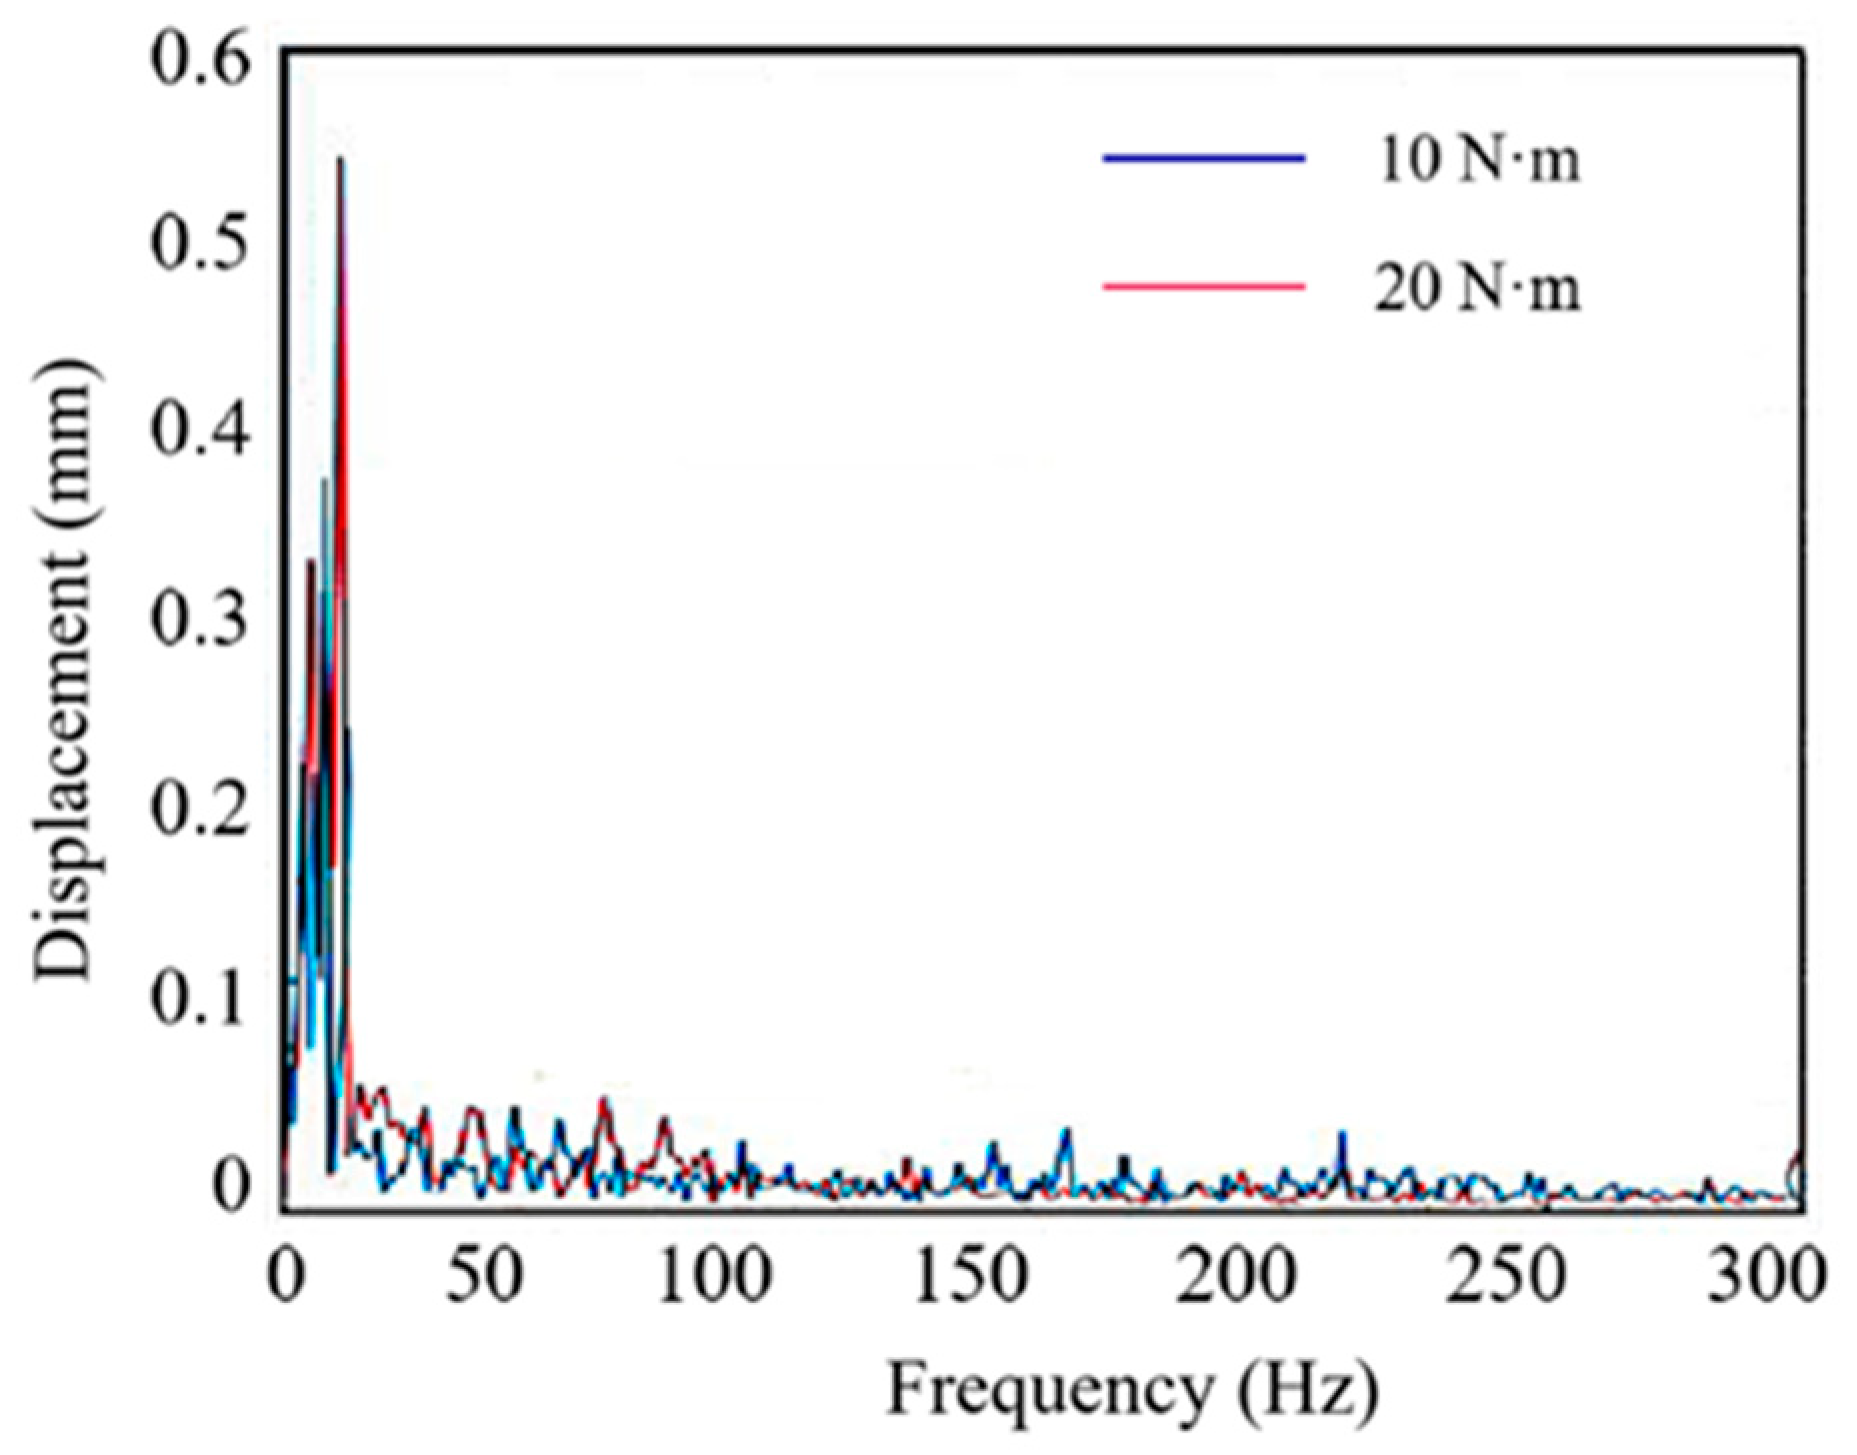
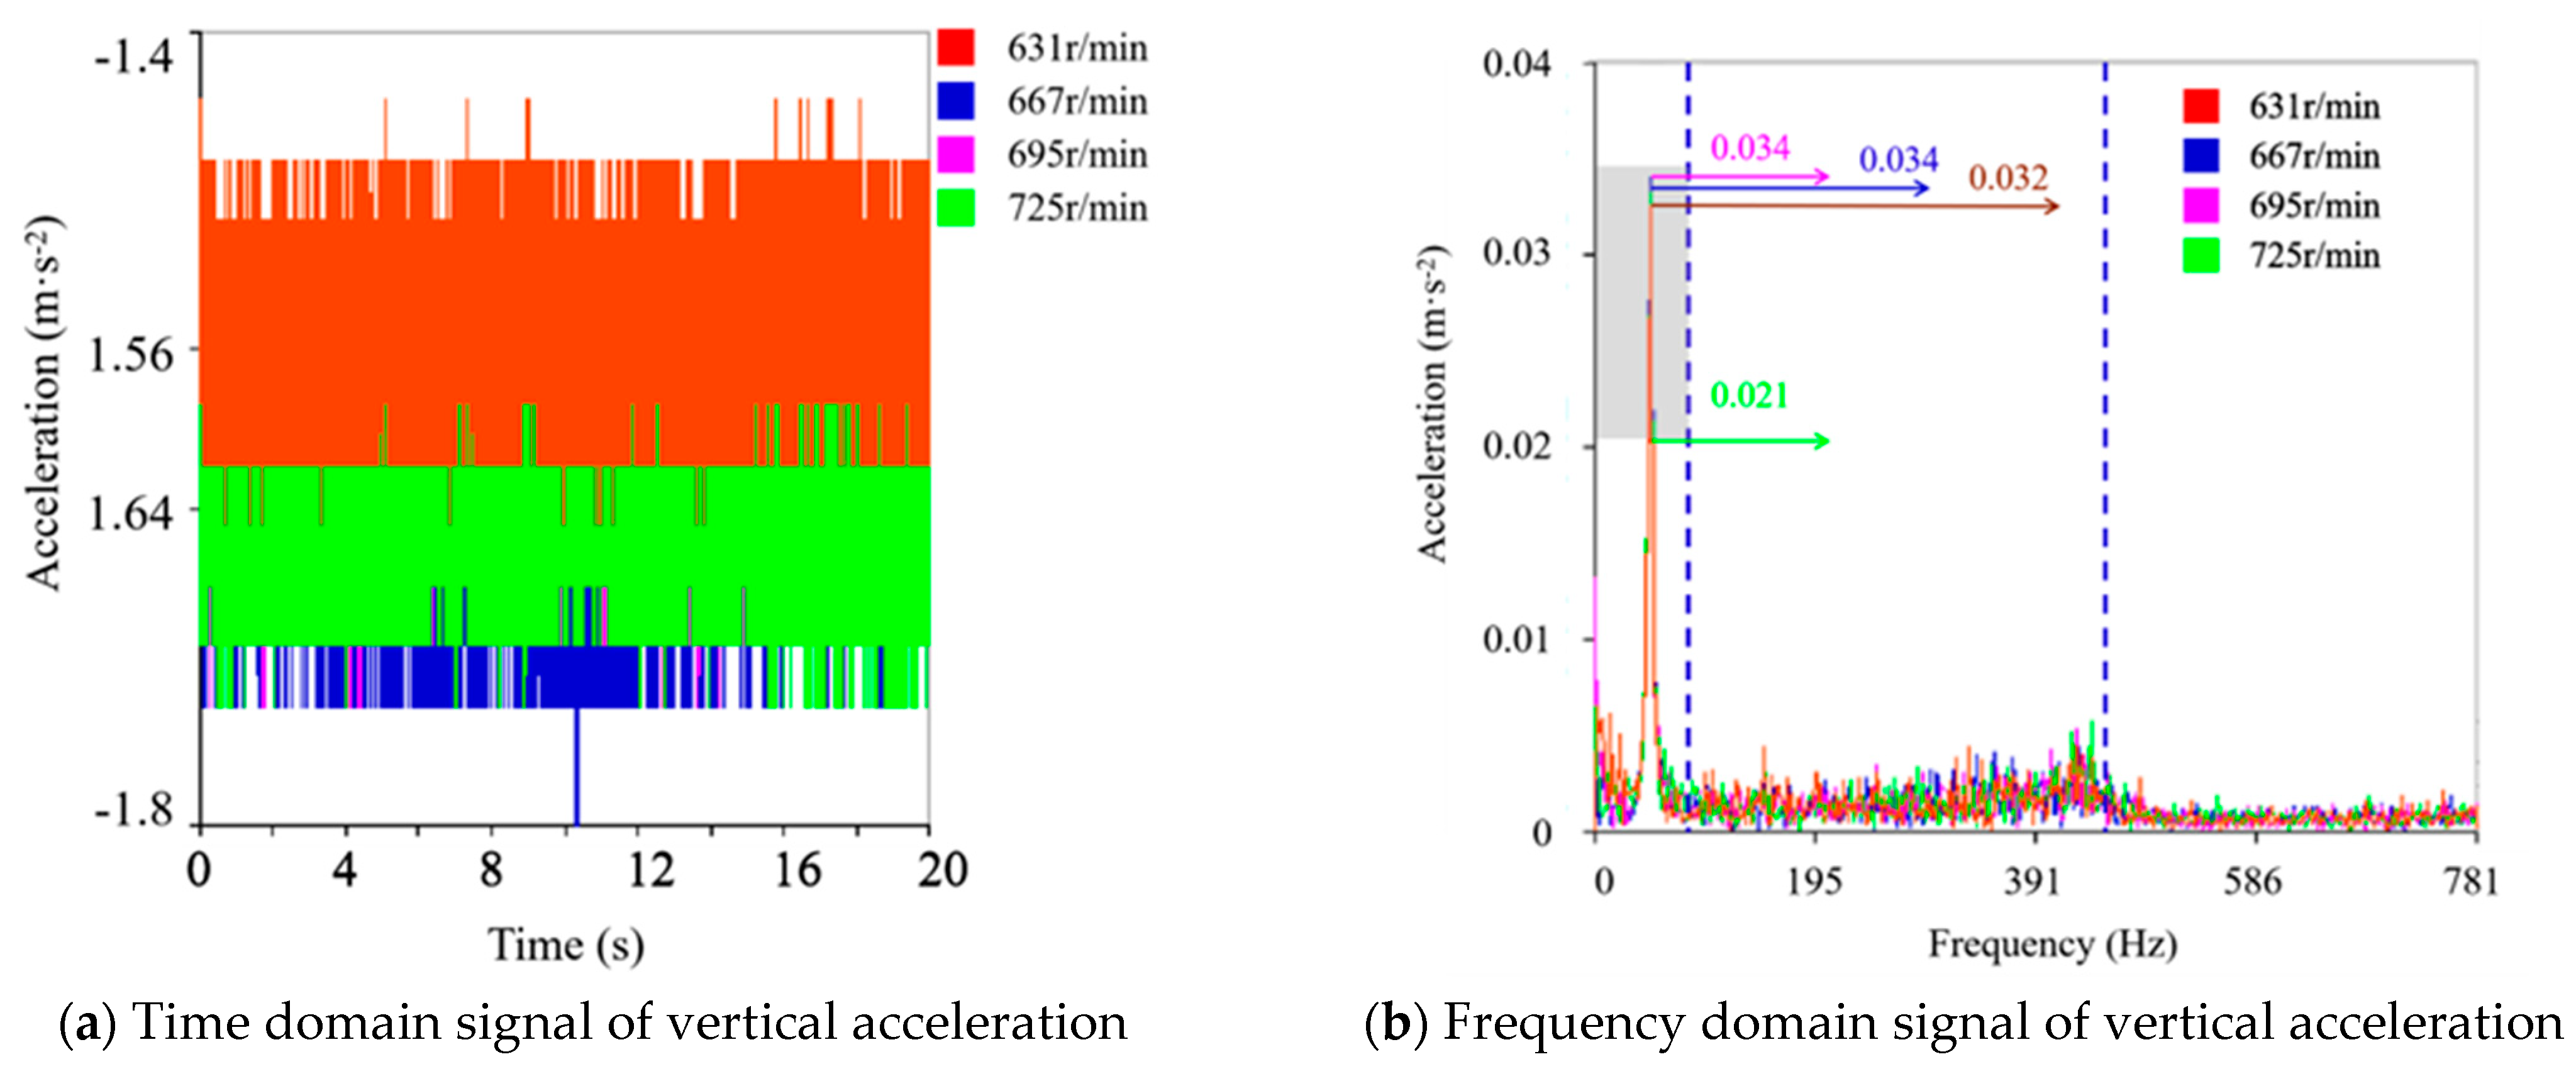
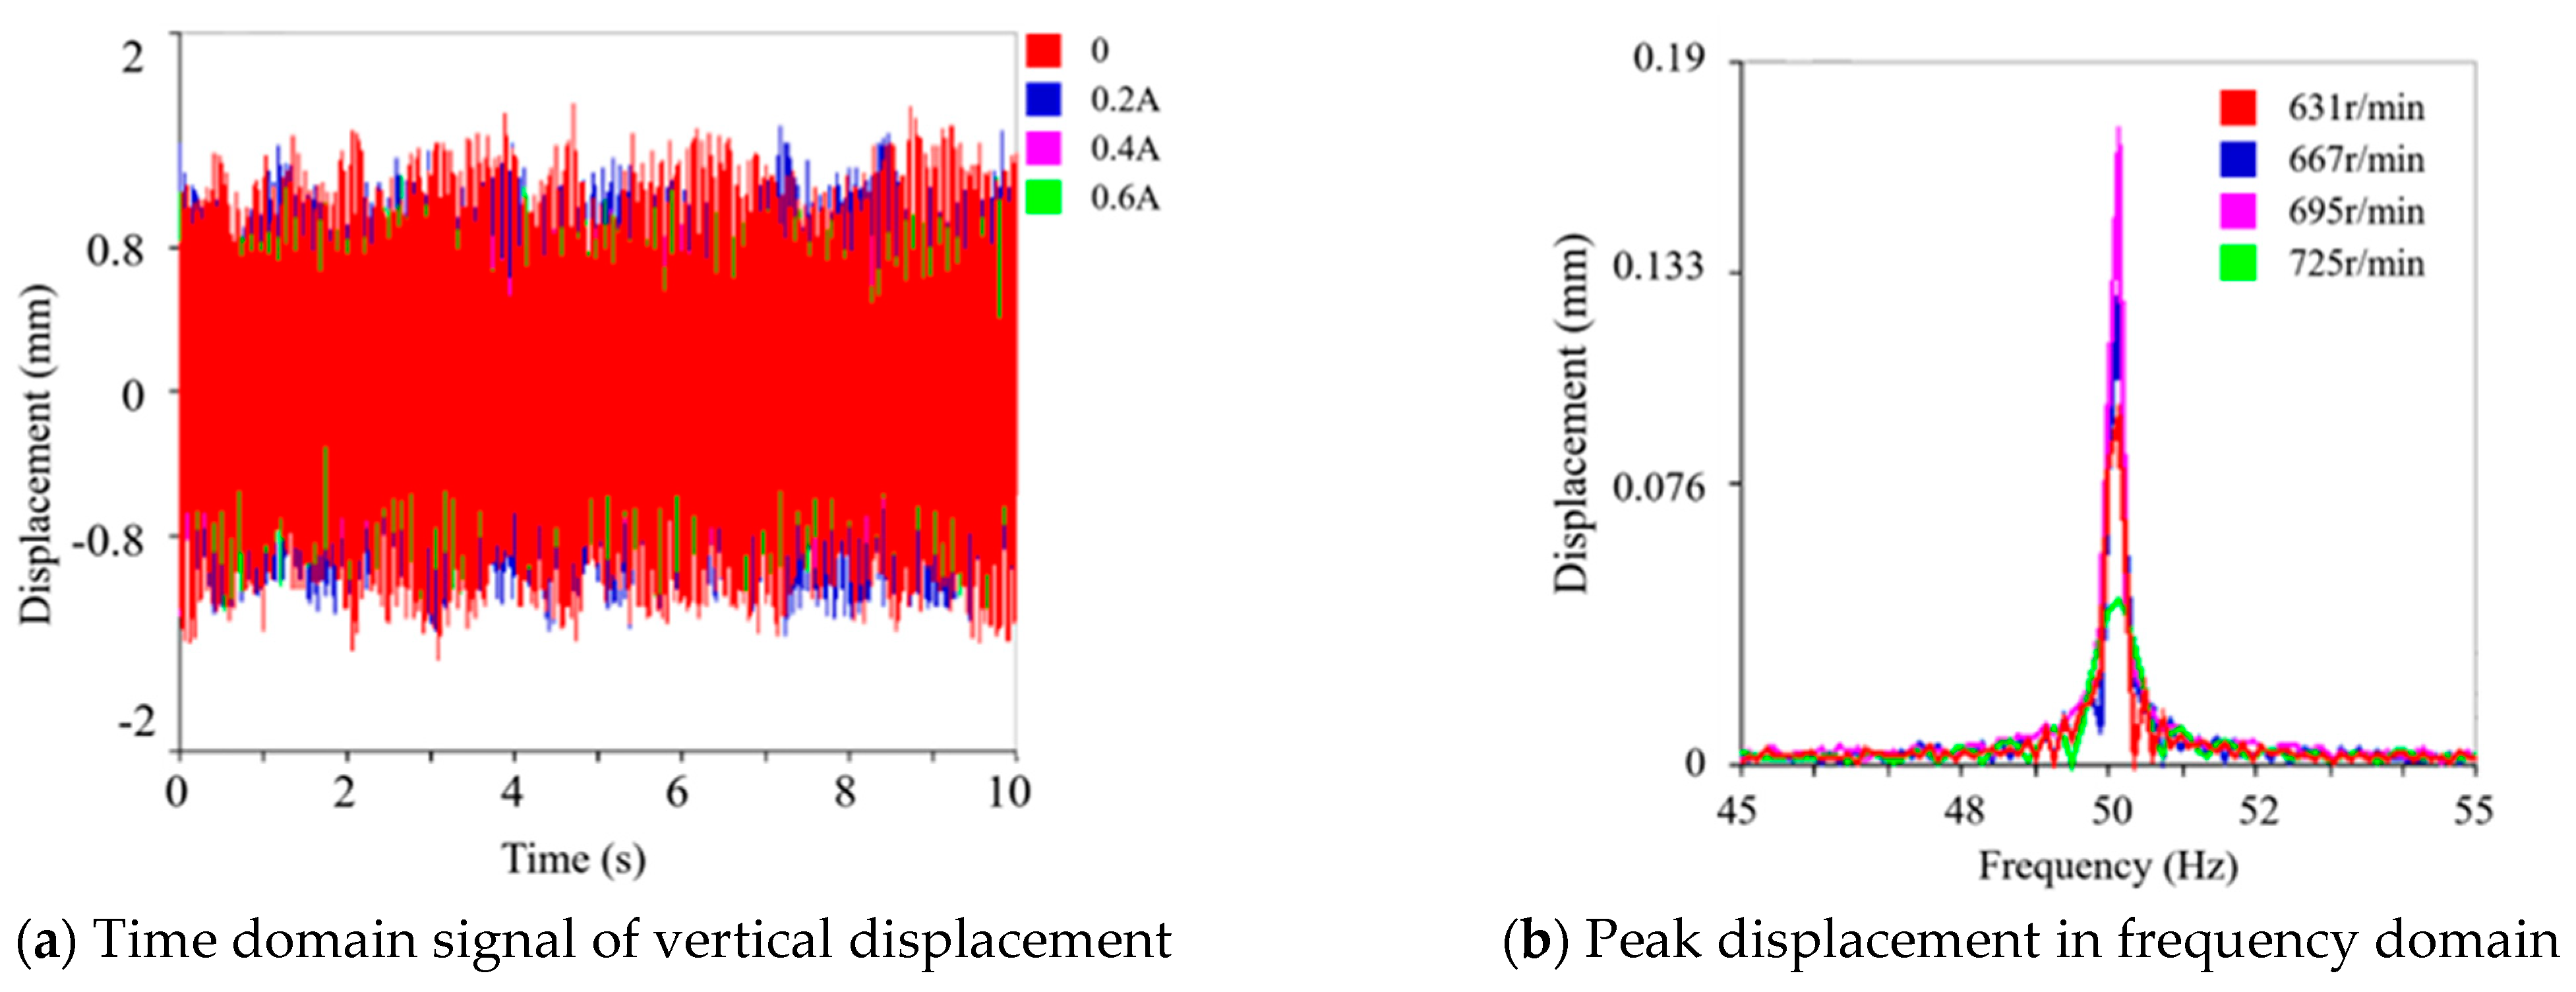
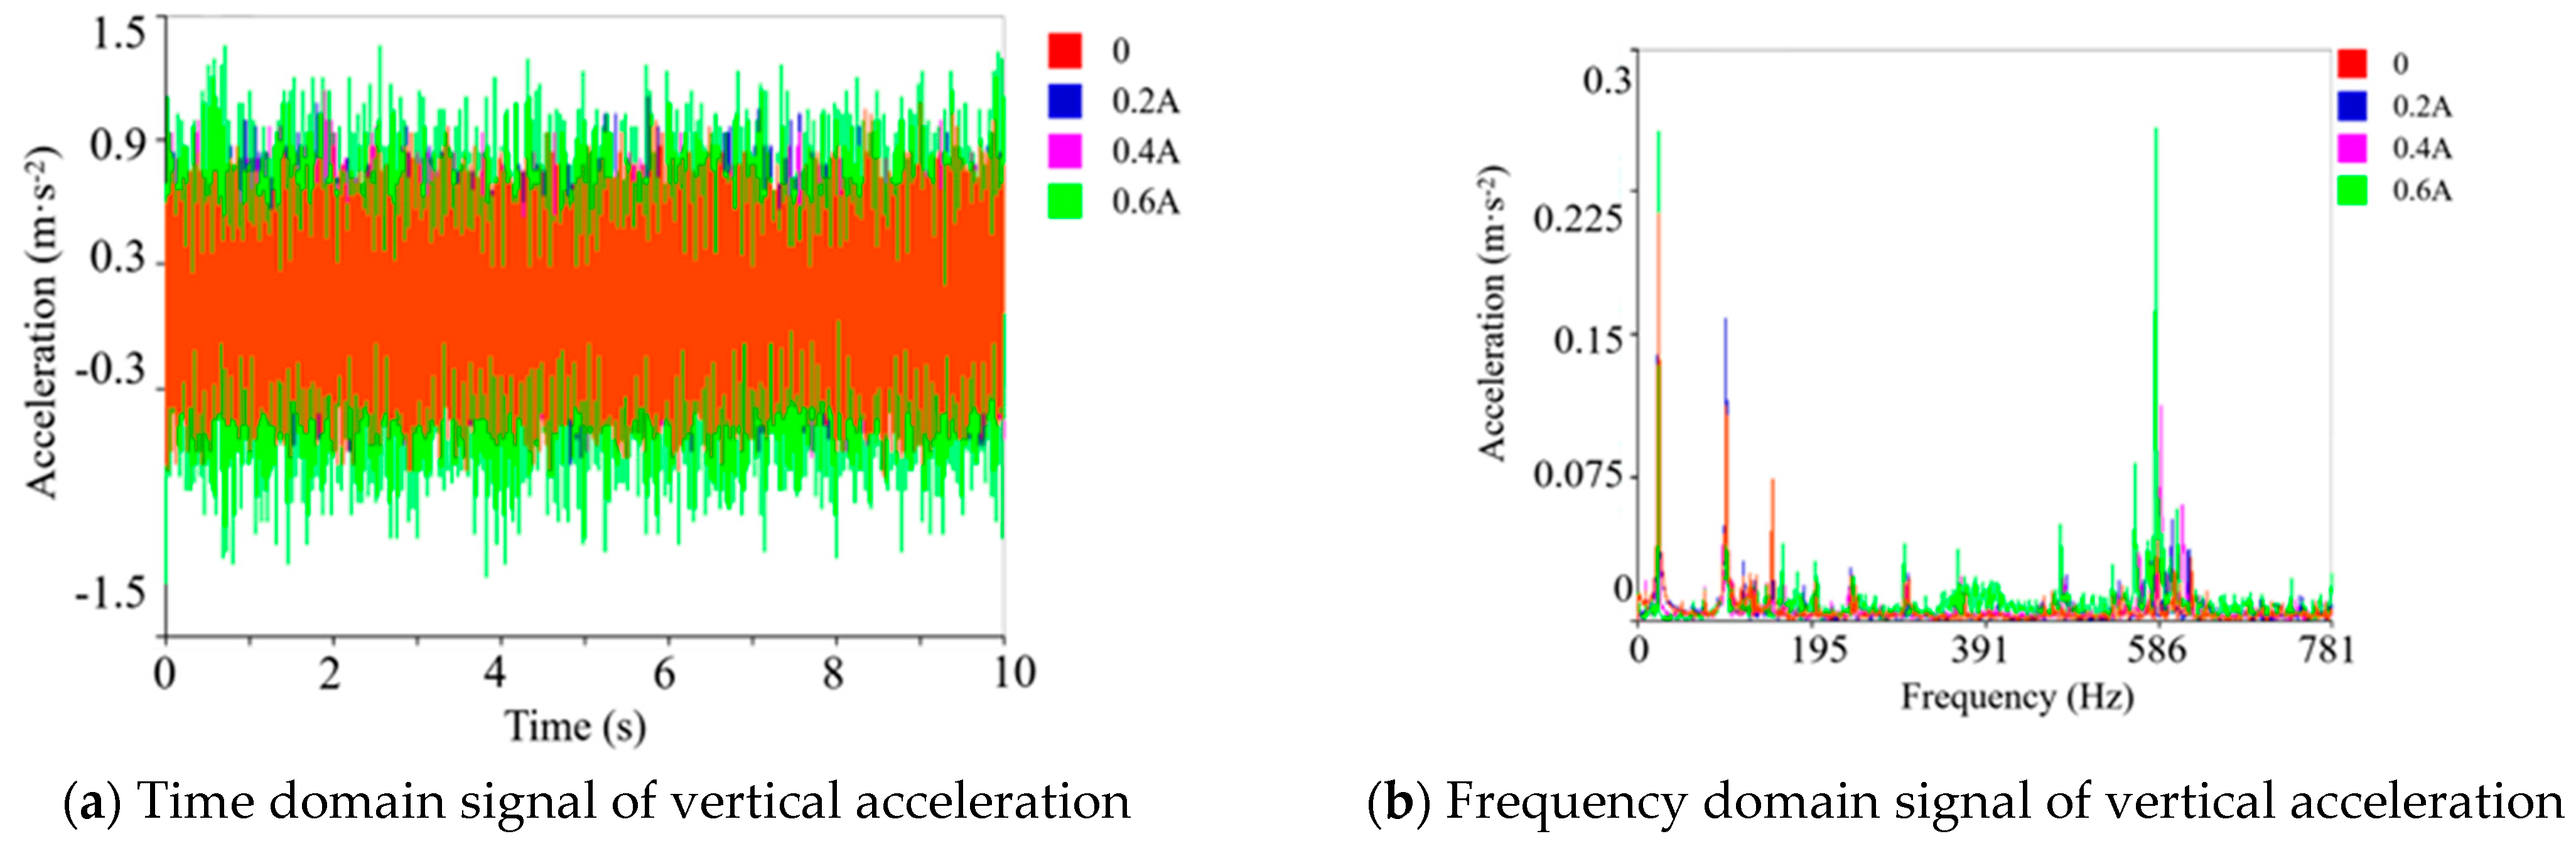
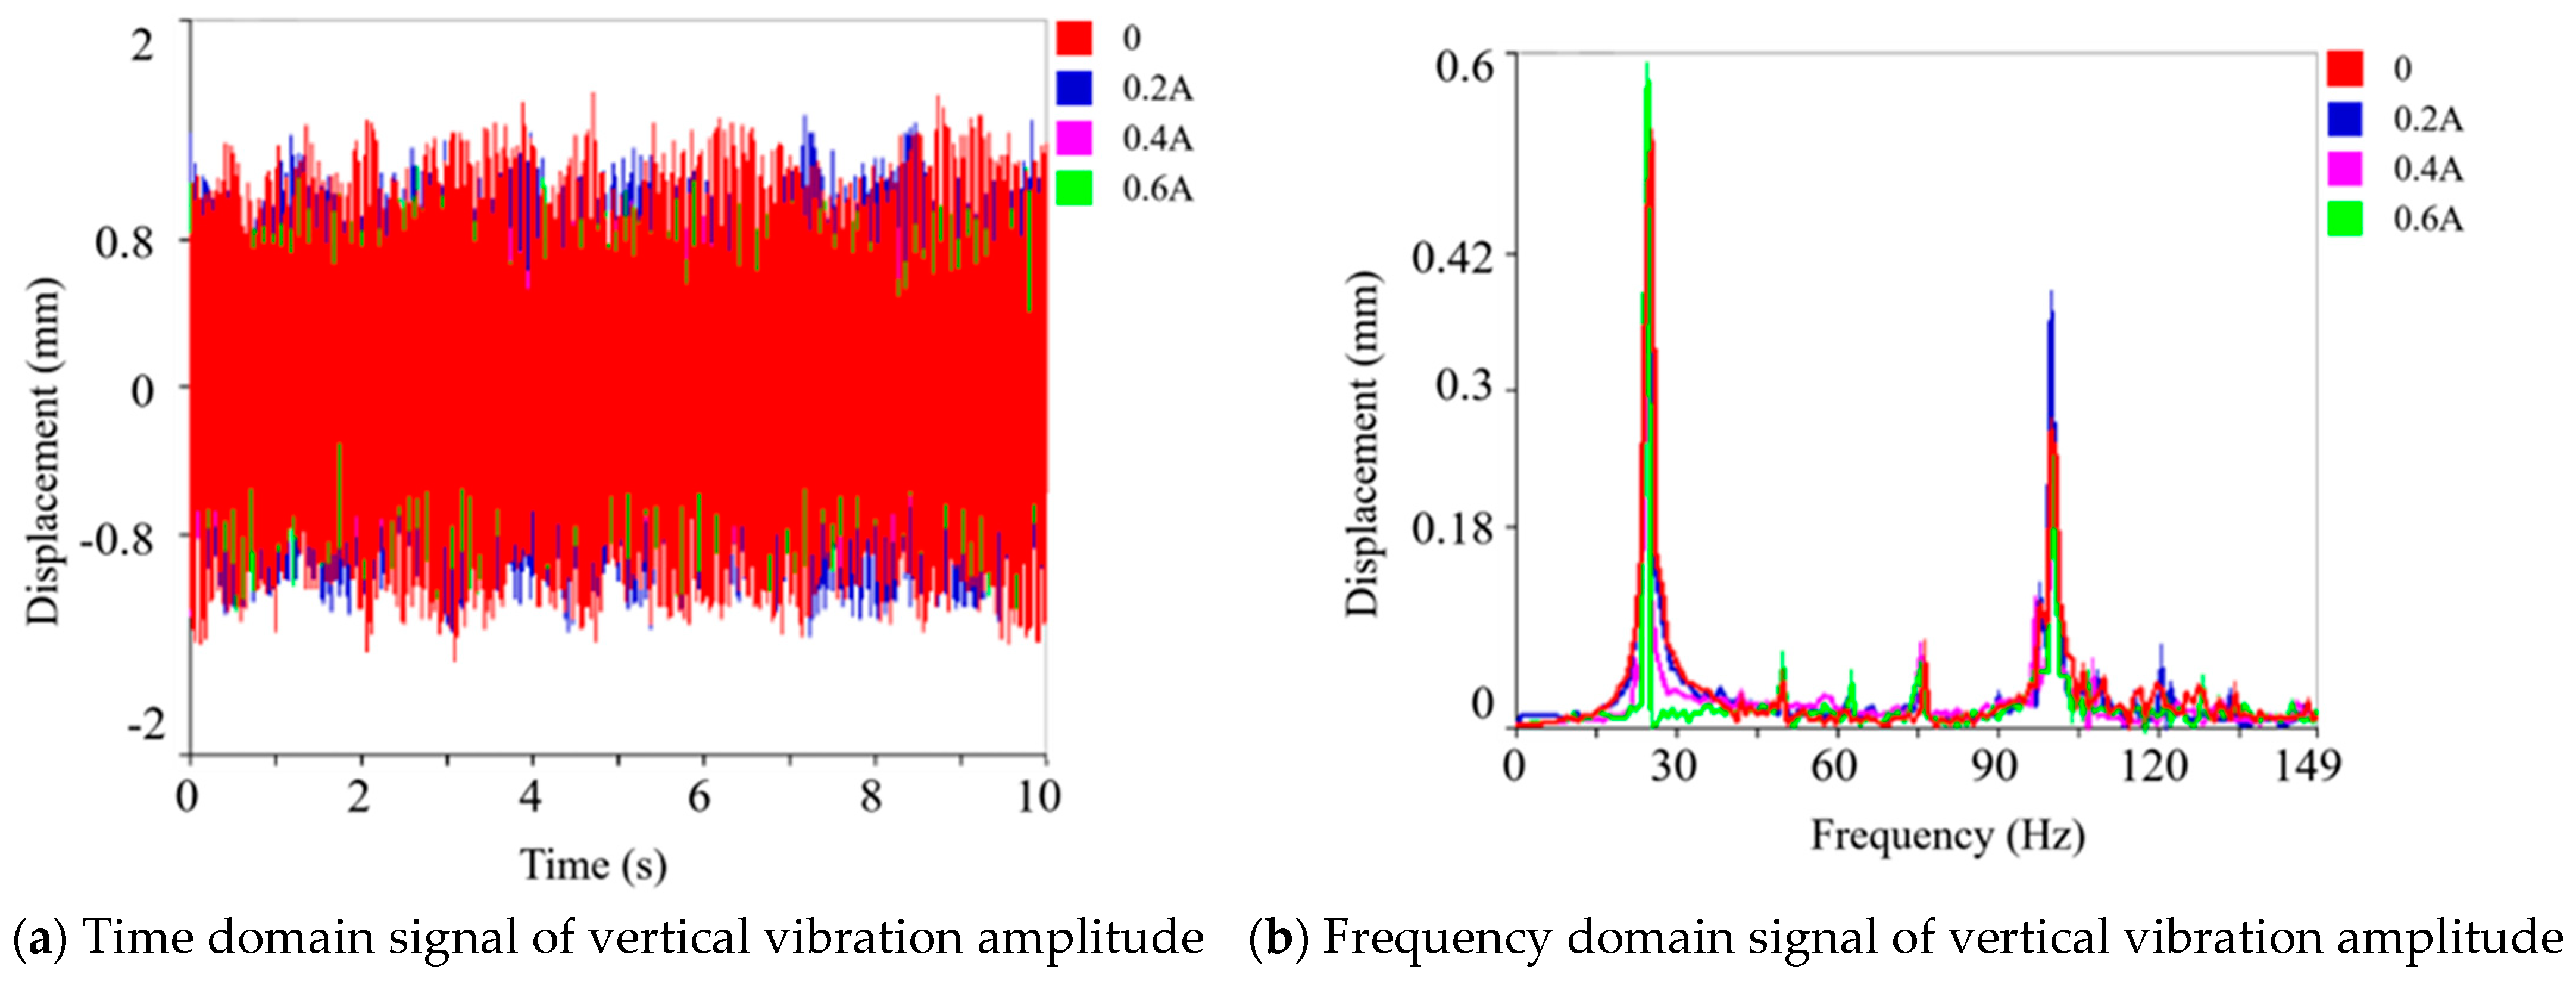
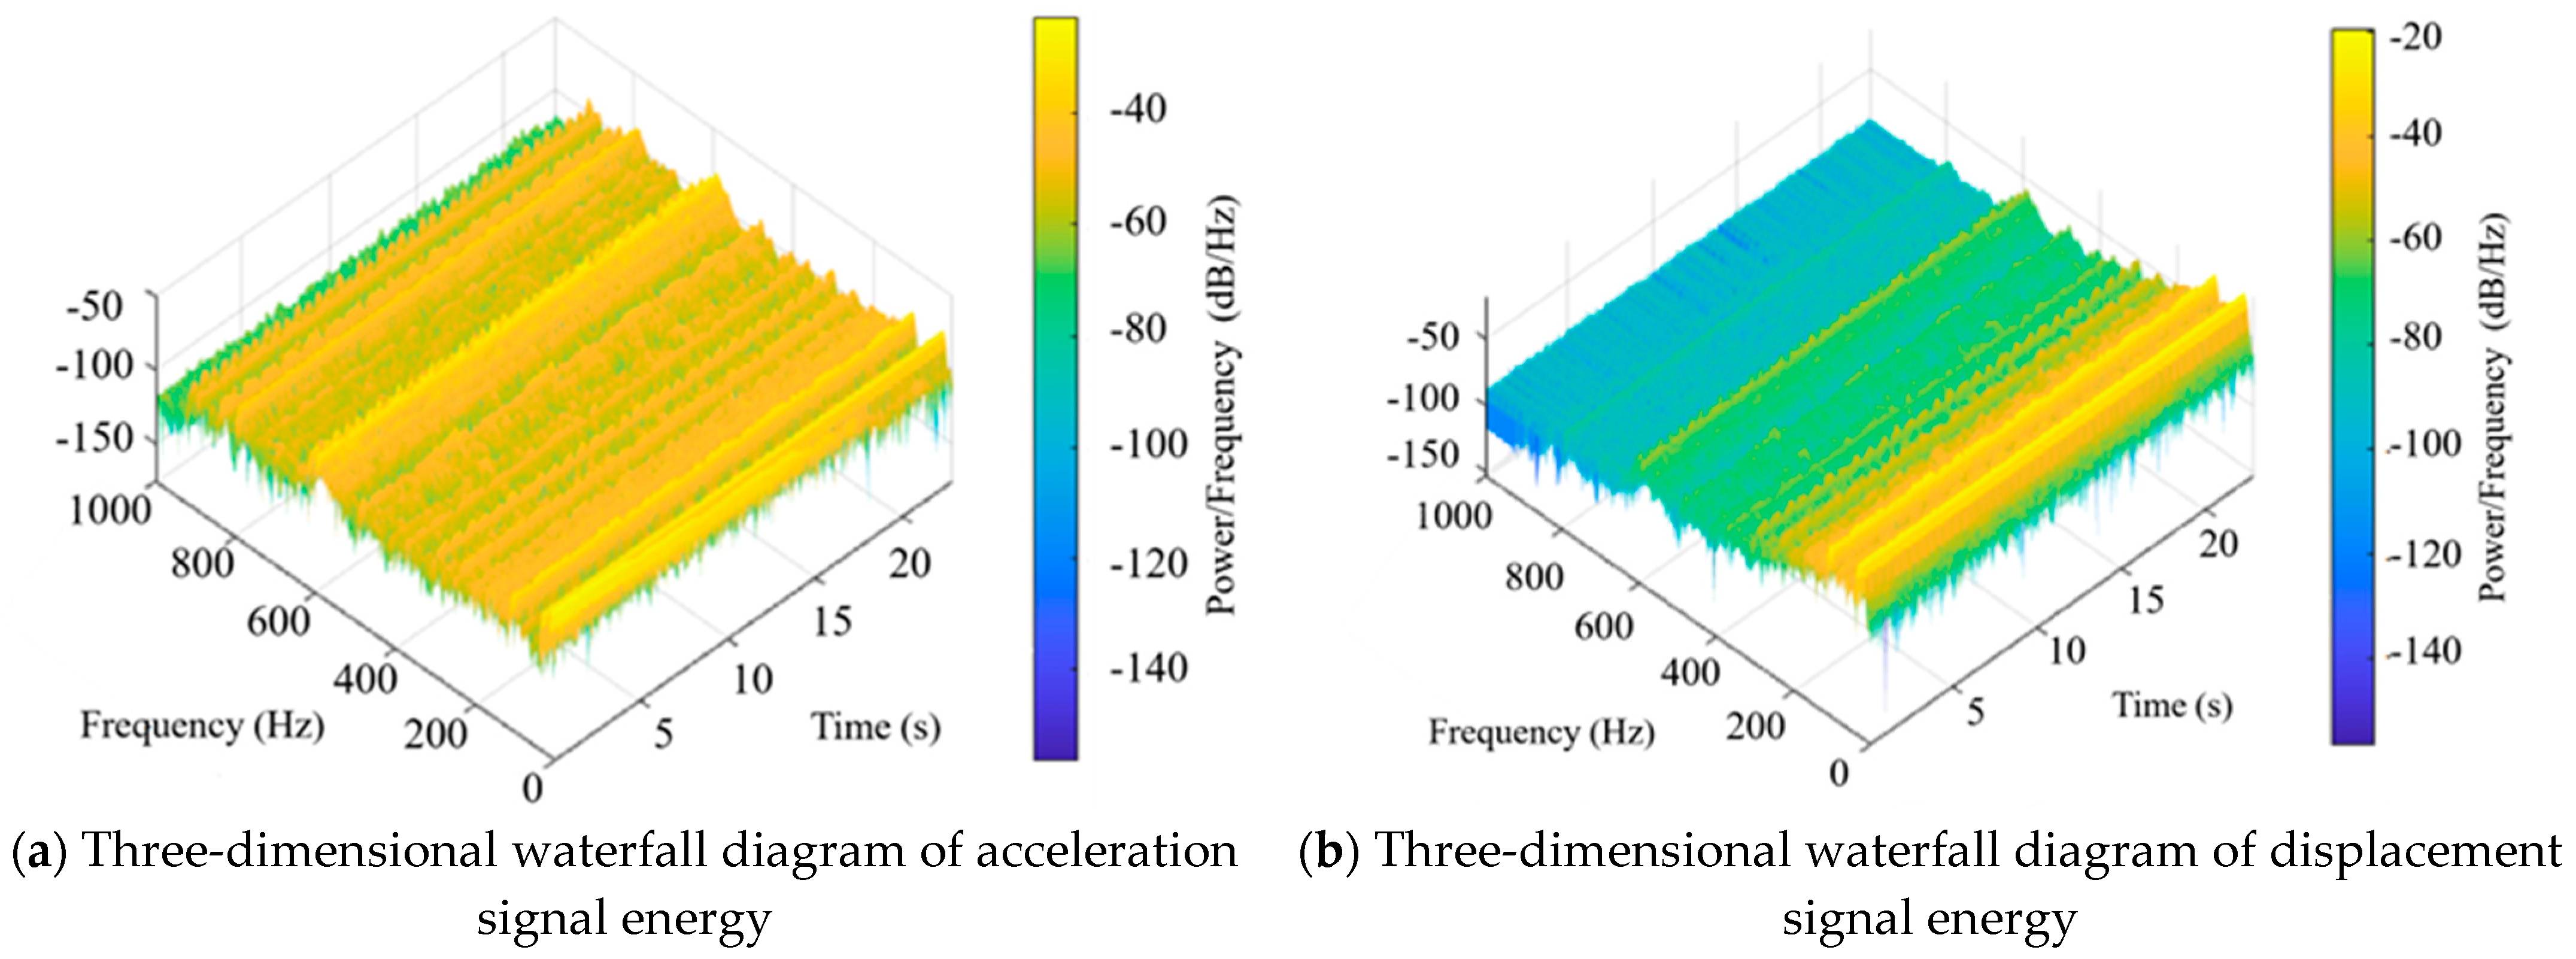
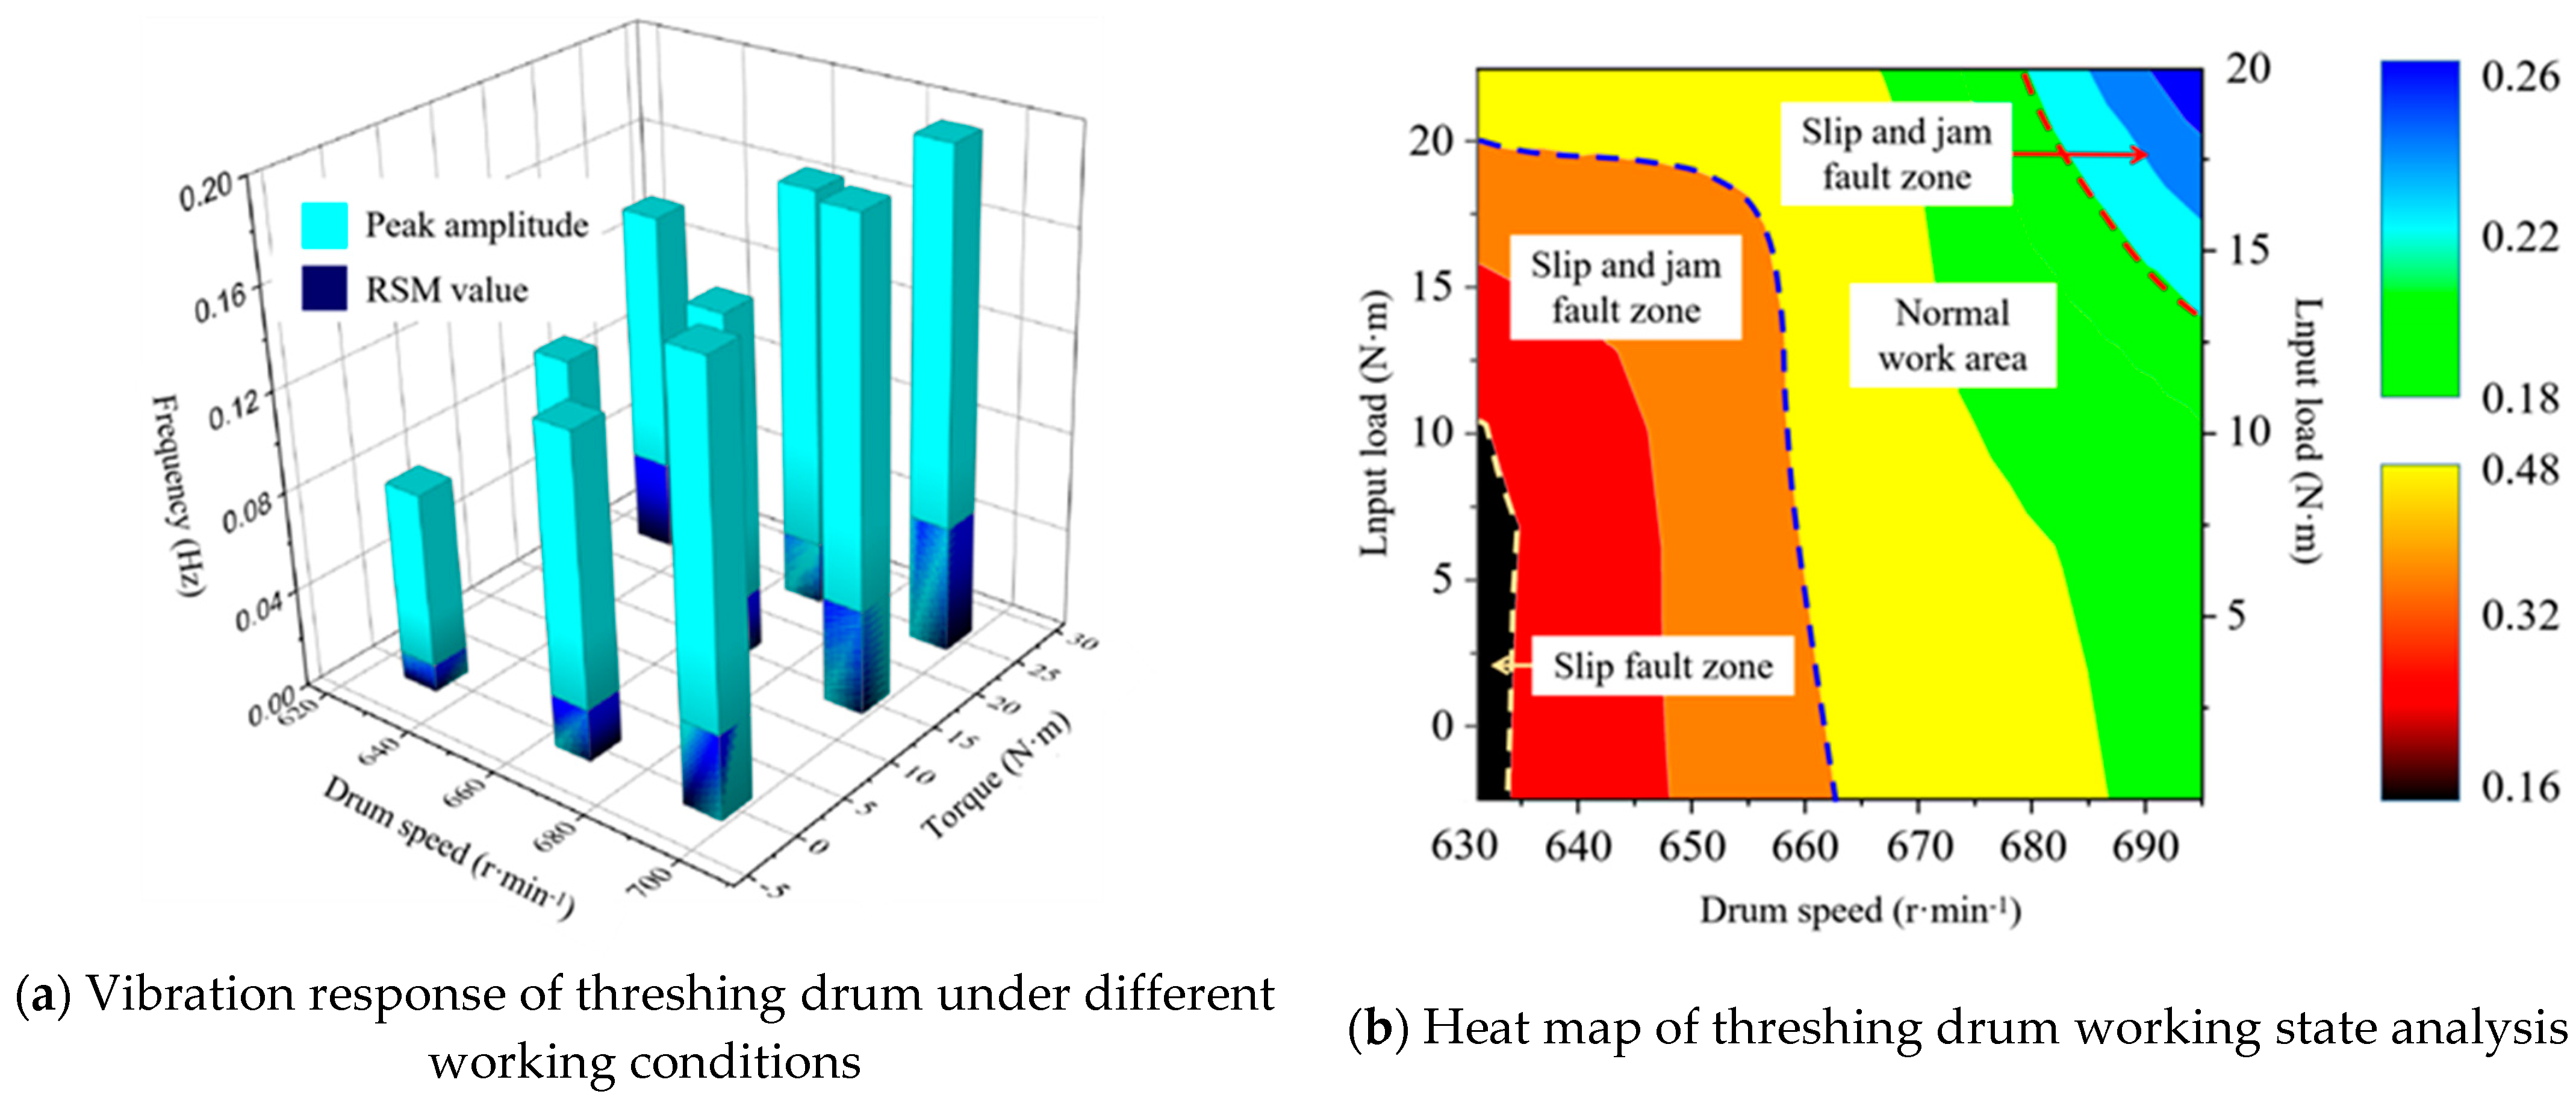
3.3. Vibration Signal Analysis of Threshing Drum with Different Loads

In order to simulate the process of threshing drum blockage, the initial drum speed is 36.5 r·min−1, then the magnetic powder brake does not apply torque. The progression of a drum from a tendency to jam to jamming is simulated by gradually applying torque to the drum. When the loading torque was 25 N∙m, the drum started to block. As the damping continues to increase, the vibration acceleration and vibration peak displacement of the threshing drum have changed significantly. The operating parameters of the drum under different loads during the whole process are shown in the Table 5.
This test mainly analyzes the collected acceleration signals of the drum shaft end. Figure 10 is the time domain signal of the acceleration of the drum shaft end in the Z direction. It can be seen from Figure 10b that when the threshing drum has a tendency to block, the average acceleration in the Z direction increases from 0.088 m·s−2 to 0.150 m·s−2, the increase is more obvious. When the torque continues to increase, the average acceleration in the Z direction decreases from 0.150 m·s−2 to 0.071 m·s−2, showing a decreasing trend as a whole. The low frequency part is about 0–195 Hz and the high frequency is about 586 Hz, and the peak acceleration also increases with the increase of the load.
The running state of the drum under different torques is further analyzed; the signal is processed by quadratic integration to obtain the displacement time domain signal of vibration and the displacement signal is obtained by FFT transformation. Figure 11 is the time domain signal of the vertical displacement of the shaft end of the drum. The Figure 11 is the peak displacement graph in the frequency domain in the Z direction.
It can be seen from Figure 11a that when the load is applied to the drum, the time domain signal of the displacement of the drum shaft end in the Z direction has a certain periodicity, the vertical displacement in the stage of blocking tendency is somewhat different. Blockage occurs when the load continues to increase, the vertical displacement gradually decreases, from the frequency domain point of view, the peak displacement of the drum during the entire test process is mainly concentrated in the low frequency part, the frequency is around 25 Hz, and the frequency also has a peak around 100 Hz; the maximum peak occurs at around 25 Hz. The maximum peak displacement increases from 0.511–0.514 mm with the increase of load. When the drum is blocked, the maximum peak displacement first decreases to 0.393 mm, with the load continues to increase, the maximum peak displacement of the load continues to increase to 0.571 mm, which is a significant increase.
In the time domain, the vibration of the shaft end of the threshing drum in the Z direction is relatively obvious, and the vibration amplitude is between −0.85 mm and 1.4 mm. In the frequency domain, the peak displacement and acceleration displacement of the drum are consistent, the maximum peak displacement is 0.312 mm, and the corresponding frequency is 24.54 Hz; the peak displacement displacement is 0.227 mm, and the corresponding frequency is 99.98 Hz. The characteristics of the displacement signals at 24 Hz and 100 Hz are more obvious, which can be used as the basis for judging the clogging condition of the threshing drum.
In this paper, the signal collected by the sensor is imported into MATLAB for short-time FFT transformation, the vibration energy response diagram of the Z direction of the shaft end of the threshing drum during the working process is obtained. The vibration energy response diagram of the Z direction of the shaft end of the threshing drum under the blockage condition was obtained through processing, as shown in Figure 12.
According to the signal energy distribution, the energy of the acceleration and displacement signals is mainly concentrated in the low frequency part. It can be seen from the Figure 12 that the vibration energy is mainly 25 Hz and 100 Hz. The Figure 12 shows the energy distribution under the blockage condition. From the energy point of view, the results are consistent with the analysis results from the acceleration and displacement point of view. Similarly, for the belt drive system, the characteristics are most obvious in the low frequency range. The fault characteristics on the displacement angle are more obvious, then the vibration sensor can directly measure the amplitude on the vertical side of the shaft end of the drum as a characteristic parameter.
Figure 13 is the energy distribution diagram of the acceleration signal and the displacement signal. It can be seen from the energy distribution diagram of the signal that whether it is the acceleration signal or the displacement signal, their energy is mainly concentrated in the low frequency part, which the energy in the Z direction of the drum shaft end is mainly 50 Hz. The three-dimensional diagram of the acceleration signal and the displacement signal can be more intuitively express the energy distribution of the slip condition. With the change of time, except for the small amplitude jump at a few time points, the tracking trajectory of the peak frequency is stable.
It can be seen from the above analysis that the characteristics of the belt drive in the low frequency range are the most obvious in terms of acceleration, displacement or energy. This is because the slip of the transmission belt produces low-frequency signal characteristics in this process, so its displacement and vibration energy are mainly concentrated in the low-frequency position and the characteristics at the high-frequency position are not obvious.
This paper analyzes the vibration state of the threshing drum under the interaction, as shown in Figure 14. Under different combined working conditions, the vibration of the threshing drum shows obvious anisotropy. When the blockage occurs, the main component of the vibration of the threshing drum is concentrated at about 50 Hz, the peak displacement of the vibration is about 0.18 mm; when the load increases, the vibration amplitude increases significantly. When a slip fault occurs, the fault frequency is mainly concentrated at about 50 Hz, the peak displacement of the vibration reaches about 0.55 mm. With the increase of the input power, the vibration amplitude decreases significantly. When the disturbance load on the system is too large or the power input is too low, multiple failures may occur, as shown in working conditions 2 and 4 in Figure 14. It can be obtained that the energy of the vibration is mainly in the low frequency band, and the resonance frequency increases due to the increase of the damping when the block is blocked, so that the frequency of the large vibration is shifted backward.
At the same time, it can be seen that for the threshing system, the failure of slippage or blockage is manifested as self-excited vibration vibrating at the natural frequency of the system. Due to the new variable nature of unbalanced resonance, this natural frequency will exist somewhere in the frequency band (25 Hz or 50 Hz), which will depend on the range of bearing settings and their effect on rotor modal stiffness. Compared with the original mode shape, the rotation of the threshing system is unbalanced due to the introduction of the load. Therefore, reducing the input load, or increasing the stiffness of the power system can reduce vibration to a certain extent.
On this basis, an orthogonal test is designed in this paper to analyze the vibration characteristics at different rotational speeds (631–695 r·min−1) and different loading torques (0–20 N·m), then analyze the vibration in the Z direction under abnormal conditions. According to the response, under different states, the Z-direction vibration peak value of the threshing drum and the vibration RMS value in the frequency domain range are obtained; the comparative analysis results are shown in Figure 15.
The above picture shows results of the vibration signal of the threshing system modeling and the vibration peak signal measured by the test. The experimental results are different from the numerical simulation results. This may be due to the vibration interference introduced by the test device, leading to the increase of displacement. It can be seen that when the speed of the threshing drum is at 660–685 r·min−1, the threshing drum can work normally. When the speed is too low or too high, it will fail.
It can be noticed that in the vibration signal, the decrease of the rotational speed and the increase of the load will cause the vibration amplitude of the threshing drum to increase, but the influence of the load on the drum vibration is significantly greater than that of the rotational speed. Therefore, the abnormal vibration state of the drum at a specific frequency can predict its working state, by adjusting the rotational speed, the working state of the threshing drum can be converted, thereby reducing the failure rate of the threshing device to a certain extent.

4. Conclusions

(1) A mathematical model based on the vibration of the shaft end of the threshing drum is established. It is clarified that under different power and load inputs, the different vibration response states exhibited by the threshing system as well as the characteristic signals in the frequency domain. The results show that when the threshing drum fails, vibration energy is in the low frequency band (below 50 Hz), the peak vibration displacement can reach 0.184 mm when it slips and the peak vibration displacement can reach 0.55 mm when it is blocked.
(2) A bench test was carried out with the rotational speed of the threshing drum and the vertical vibration signal of the shaft end as the characteristic signals, then the field harvesting of the combine harvester threshing system was simulated. The signals are processed and analyzed under normal working conditions and fault conditions; the fault judgment criterion of the threshing system is obtained. When slip occurs, the vibration signal in the Z direction of the drum shaft end reaches its peak value at a frequency of 50 Hz at which time the displacement is 0.179 mm.
(3) When the threshing drum is blocked, the vibration signal in the Z direction of the shaft end of the threshing drum reaches its peak value when the frequency is 24 Hz. At this time, the acceleration is 0.136 m·s−2, the displacement is 0.558 mm and the frequency is about 100 Hz. At the same time, the orthogonal test under the action of input power and torque is carried out to verify the accuracy of the system and the effectiveness of the fault diagnosis method.

Author Contributions

Conceptualization, Z.T.; Methodology, Z.D. and Z.S.; Validation, S.H. and S.G.; Formal Analysis, Z.D. and S.G.; Data Curation, Z.S. and S.H.; Investigation, S.H. and S.G.; Writing—Original Draft Preparation, Z.S. and S.H.; Writing-Review & Editing, S.H.; Supervision, S.G. All authors have read and agreed to the published version of the manuscript.

Funding

This research work was supported by the Key Laboratory of Modern Agricultural Equipment and Technology (Jiangsu University), Ministry of Education (MAET202109), Jiangsu Province and Education Ministry Co-sponsored Synergistic Innovation Center of Modern Agricultural Equipment (XTCX2007), the Jiangsu University Industrial Center Student Innovation and Practice Fund Project (ZXJG2021074), and National College Student Practice Innovation Training Program Project (202110299074Z).

Data Availability Statement

The data used to support the findings of this study are available from the corresponding author upon request.

Conflicts of Interest

The authors declared that there is no conflict of interest.

References

  1. Tang, Z.; Zhang, H.T.; Li, H.C. Developments of crawler steering gearbox for combine harvester straight forward and steering in situ. Int. J. Agric. Biol. Eng. 2020, 13, 120–126. [Google Scholar] [CrossRef]
  2. Amponsah, S.K.; Addo, A.; Dzisi, K.A.; Moreira, J.; Ndindeng, S.A. Performance evaluation and field characterization of the sifang mini rice combine harvester. Appl. Eng. Agric. 2017, 33, 479–489. [Google Scholar] [CrossRef]
  3. Liu, Y.B.; Li, Y.M.; Dong, Y.H. Development of a variable-diameter threshing drum for rice combine harvester using MBD-DEM coupling simulation. Comput. Electron. Argic. 2022, 196, 106859. [Google Scholar] [CrossRef]
  4. Wang, K.; Xie, R.; Ming, B.; Hou, P.; Xue, J.; Li, S. Review of combine harvester losses for maize and influencing factors. Int. J. Agric. Biol. Eng. 2021, 14, 1–10. [Google Scholar] [CrossRef]
  5. Hussain, S.; Zheng, D.C.; Song, H.Y. Computational fluid dynamics simulation and optimisation of the threshing unit of buckwheat thresher for effective cleaning of the cleaning chamber. J. Argic. Eng. 2022, 53. [Google Scholar] [CrossRef]
  6. Tang, Z.; Zhang, H.T.; Zhou, Y.P. Unbalanced vibration identification of tangential threshing cylinder induced by rice threshing process. Shock. Vib. 2018, 2018, 4708730. [Google Scholar] [CrossRef] [Green Version]
  7. Lu, S.; Cheng, G.; Li, T.; Xue, L.; Liu, X.; Huang, J.; Liu, G. Quantifying supply chain food loss in China with primary data: A large-scale, field-survey based analysis for staple food, vegetables, and fruits. Resour. Conserv. Recycl. 2022, 177, 106006. [Google Scholar] [CrossRef]
  8. Dumitru, O.M.; Iorga, S.; Vladut, N.V.; Bracacescu, C. Food losses in primary cereal production: A review. Inmateh-Agric. Eng. 2020, 63, 133–146. [Google Scholar] [CrossRef]
  9. Astanakulov, K.; Abdillaev, T.; Umirov, A. Monitoring of the combine with smart devices in soybean harvesting. EDP Sci. 2021, 227, 07003. [Google Scholar] [CrossRef]
  10. Juostas, A.; Jotautiene, E. Study of combine harvester remote monitoring systems for fuel consumption and environmental impact control. In Proceedings of the 1st International Online Conference on Agriculture—Advances in Agricultural Science and Technology, Online, 10–25 February 2022. [Google Scholar]
  11. Qian, P.; Pu, C.; Liu, L.; Li, X.; Zhang, B.; Gu, Z.; Meng, D. Development of a new high-precision friction test platform and expeimental study of friction characteristics for pneumatic cylinders. Meas. Sci. Technol. 2022, 33, 065001. [Google Scholar] [CrossRef]
  12. Vakhrushev, V.V.; Nemtsev, A.E.; Ivanov, N.M. Evaluation of the main indicators of the reliability of the power transmission of a combine harvester John Deere 9660. In Proceedings of the International Scientific and Practical Conference “Modern Problems of Ecology, Transport and Agricultural Technologies”, Barnaul, Russia, 26–27 June 2020; Volume 941. [Google Scholar]
  13. Tang, Z.; Zhang, B.; Wang, M.L. Damping behaviour of a prestressed composite beam designed for the thresher of a combine harvester. Biosyst. Eng. 2021, 204, 130–146. [Google Scholar] [CrossRef]
  14. Shin, D.; Palazzolo, A. Nonlinear analysis of a geared rotor system supported by fluid film journal bearings. J. Sound Vib. 2020, 475, 115269. [Google Scholar] [CrossRef]
  15. Pavlyuk, R.V.; Zaharin, A.V.; Gevora, Y.I. Researching operational reliability of key combine systems in Stavropol Territory. IOP Conf. Ser. Earth Environ. Sci. 2022, 996, 012011. [Google Scholar] [CrossRef]
  16. Wang, S.; Lu, B.; Cao, J. Research on a method for diagnosing clogging faults and longitudinal axial flow in the threshing cylinders of drum harvesters. Noise Control Eng. J. 2021, 69, 209–219. [Google Scholar] [CrossRef]
  17. Kumar, B.K.P.; Basavaraj, Y.; Kumar, N.K. Vibration based condition monitoring of rotating part using spectrum analysis: A case study on milling machine. Mater. Today Proc. 2021, 49, 744–747. [Google Scholar] [CrossRef]
  18. Novotný, P.; Hrabovský, J.; Juračka, J. Effective thrust bearing model for simulations of transient rotor dynamics. Int. J. Mech. Sci. 2019, 157, 374–383. [Google Scholar] [CrossRef]
  19. Si, H.; Sun, C.; Chen, B. Analysis of socket communication technology based on machine learning algorithms under TCP/IP protocol in network virtual laboratory system. IEEE Access 2019, 7, 80453–80464. [Google Scholar] [CrossRef]
  20. Nikolov, N. Research of the communication protocols between the iot embedded system and the cloud structure. In Proceedings of the 2018 IEEE XXVII International Scientific Conference Electronics—ET, Sozopol, Bulgaria, 13–15 September 2018; pp. 1–4. [Google Scholar]
  21. Xie, Z.Y.; Zhou, Q.D.; Pan, Y.C. Simulation and tests for vibration of structures under multi-point complex Loads. J. Vib. Shock 2018, 37, 166–174. [Google Scholar]
  22. Abdeen, M.A.; Xie, G.; Salem, A.E. Longitudinal axial flow rice thresher feeding rate monitoring based on force sensing resistors. Sci. Rep. 2022, 12, 1369. [Google Scholar] [CrossRef]
  23. Jiang, T.; Guan, Z.; Li, H. A feeding quantity monitoring system for a combine harvester: Design and experiment. Agriculture 2022, 12, 153. [Google Scholar] [CrossRef]
  24. Dell’Isola, F.; Seppecher, P.; Madeo, A. How contact interactions may depend on the shape of cauchy cuts in Nth gradient continua: Approach “a la D’Alembert”. Z. Angew. Math. Phys. 2012, 63, 1117–1141. [Google Scholar] [CrossRef]
  25. Hong, J.; Chen, X.Q.; Wang, Y.F. Optimization of dynamics of non-continuous rotor based on model of rotor stiffness. Mech. Syst. Signal Process. 2019, 131, 166–182. [Google Scholar] [CrossRef]
  26. Zhang, Y.; Chen, D.; Yin, Y. Experimental study of feed rate related factors of combine harvester based on grey correlation. IFAC Pap. 2018, 51, 402–407. [Google Scholar] [CrossRef]
  27. Sahasranand, K.R. Dithered A/D Conversion of Bandlimited Signals under Frequency Band Uncertainty. IEEE Signal Process. Lett. 2022, 29, 493–497. [Google Scholar] [CrossRef]
  28. Wang, J.; Feng, W.; Qian, W.; Wang, K. Influencing factors of magnetic coupling transmission of magnetic pump. J. Drain. Irrig. Mach. Eng. 2022, 40, 244–249. [Google Scholar]
  29. Li, Y.; Dai, X.; Wang, Z. Sensitivity of different sealing structures to axial movement of centrifugal pump impeller. J. Drain. Irrig. Mach. Eng. 2021, 39, 122–127. [Google Scholar]
  30. Chen, J.; Zhou, C.; Wang, X.; Jiang, X.; Pan, H.; Cao, L. Optimization design of high-speed well pump based on orthogonal experiment. J. Drain. Irrig. Mach. Eng. 2021, 39, 457–463. [Google Scholar]
  31. Tang, Z.; Zhang, B.; Liu, X. Structural model and bundling capacity of crawler picking and baling machine for straw wasted in field. Comput. Electron. Agric. 2020, 175, 105622. [Google Scholar] [CrossRef]
Figure 1. Reasons for the structural failure of the threshing drum.
Agriculture 12 01968 g001
Figure 2. Torque vibration of the threshing drum.
Agriculture 12 01968 g002
Figure 3. Vibration response of threshing system under the action of impulse function.
Agriculture 12 01968 g003
Figure 4. Multi-stage parallel drum test bench and acquisition system.
Agriculture 12 01968 g004
Figure 5. Multi-stage threshing drum test console.
Agriculture 12 01968 g005
Figure 6. Numerical modeling and calculation of threshing drum vibration at different rotational speeds.
Agriculture 12 01968 g006
Figure 7. Frequency Domain Vibration Simulation of Threshing Drum in Blocked State.
Agriculture 12 01968 g007
Figure 8. Acceleration signal of slipping vibration of threshing drum.
Agriculture 12 01968 g008
Figure 9. Vibration amplitude signal of threshing drum slipping vibration.
Agriculture 12 01968 g009
Figure 10. Acceleration signal of threshing drum under load.
Agriculture 12 01968 g010
Figure 11. Displacement signal of threshing drum under load.
Agriculture 12 01968 g011
Figure 12. Distribution diagram of vibration energy distribution under load of detachment drum.
Agriculture 12 01968 g012
Figure 13. Vibration energy distribution diagram of separation drum.
Agriculture 12 01968 g013
Figure 14. Simulation of vibration signal of threshing drum in frequency domain under interaction.
Agriculture 12 01968 g014
Figure 15. Model verification of threshing drum dynamic system.
Agriculture 12 01968 g015
Table 1. DH5902 data acquisition system technical indicators.
Serial NumberModelDH5902
1Number of channels32 acceleration channels, 4 speed channels
2Supported capture card typesStrain/voltage/IEPE acquisition card, speed/counter card, signal source card, CAN module card
3Continuous sampling rate256kHZ channel, binning switch
4Communication methodGigabit Ethernet and wireless WIFI communication
5Operating modeOnline work mode/offline work mode
6PowerBattery powered + power adapter powered, 4 h of battery life (32 channels)
7Shock resistance of the whole machine100 g/(4 ± 1) mg
Table 2. Operating conditions of the drum under different torques.
Serial NumberLoading Current (A)Drum Speed (r·min−1)Loading Torque (N·m)
1036.50
20.234.812
30.433.525
40.632.239
Table 3. Numerical simulation vibration signal of threshing drum.
Operating StatusVibration Peak
(mm)
RMS
(mm)
Peak Frequency
(Hz)
Normal rotation0.0810.02150
Blockage0.550.1125
Skid0.0970.02650
Table 4. Drum operating parameters at different speeds.
Drum Speed
(r·min−1)
Average Vertical Acceleration
(m·s−2)
Maximum Vertical Displacement
(mm)
Peak Displacement
(mm)
Frequency at Peak Displacement
(Hz)
6311.5430.2970.09450
6671.6270.3050.12749
6951.6350.3020.16550
7251.6430.3010.04449
Table 5. Drum operating parameters under different loads.
Loading Torque
(N·m)
Average Vertical Acceleration (m·s−2)Maximum Vertical Displacement
(mm)
Peak Displacement
(mm)
Frequency at Peak Displacement
(Hz)
00.0881.5890.51125
120.1501.4530.51424
250.1471.0190.39324
390.0711.1950.57124
Publisher’s Note: MDPI stays neutral with regard to jurisdictional claims in published maps and institutional affiliations.

