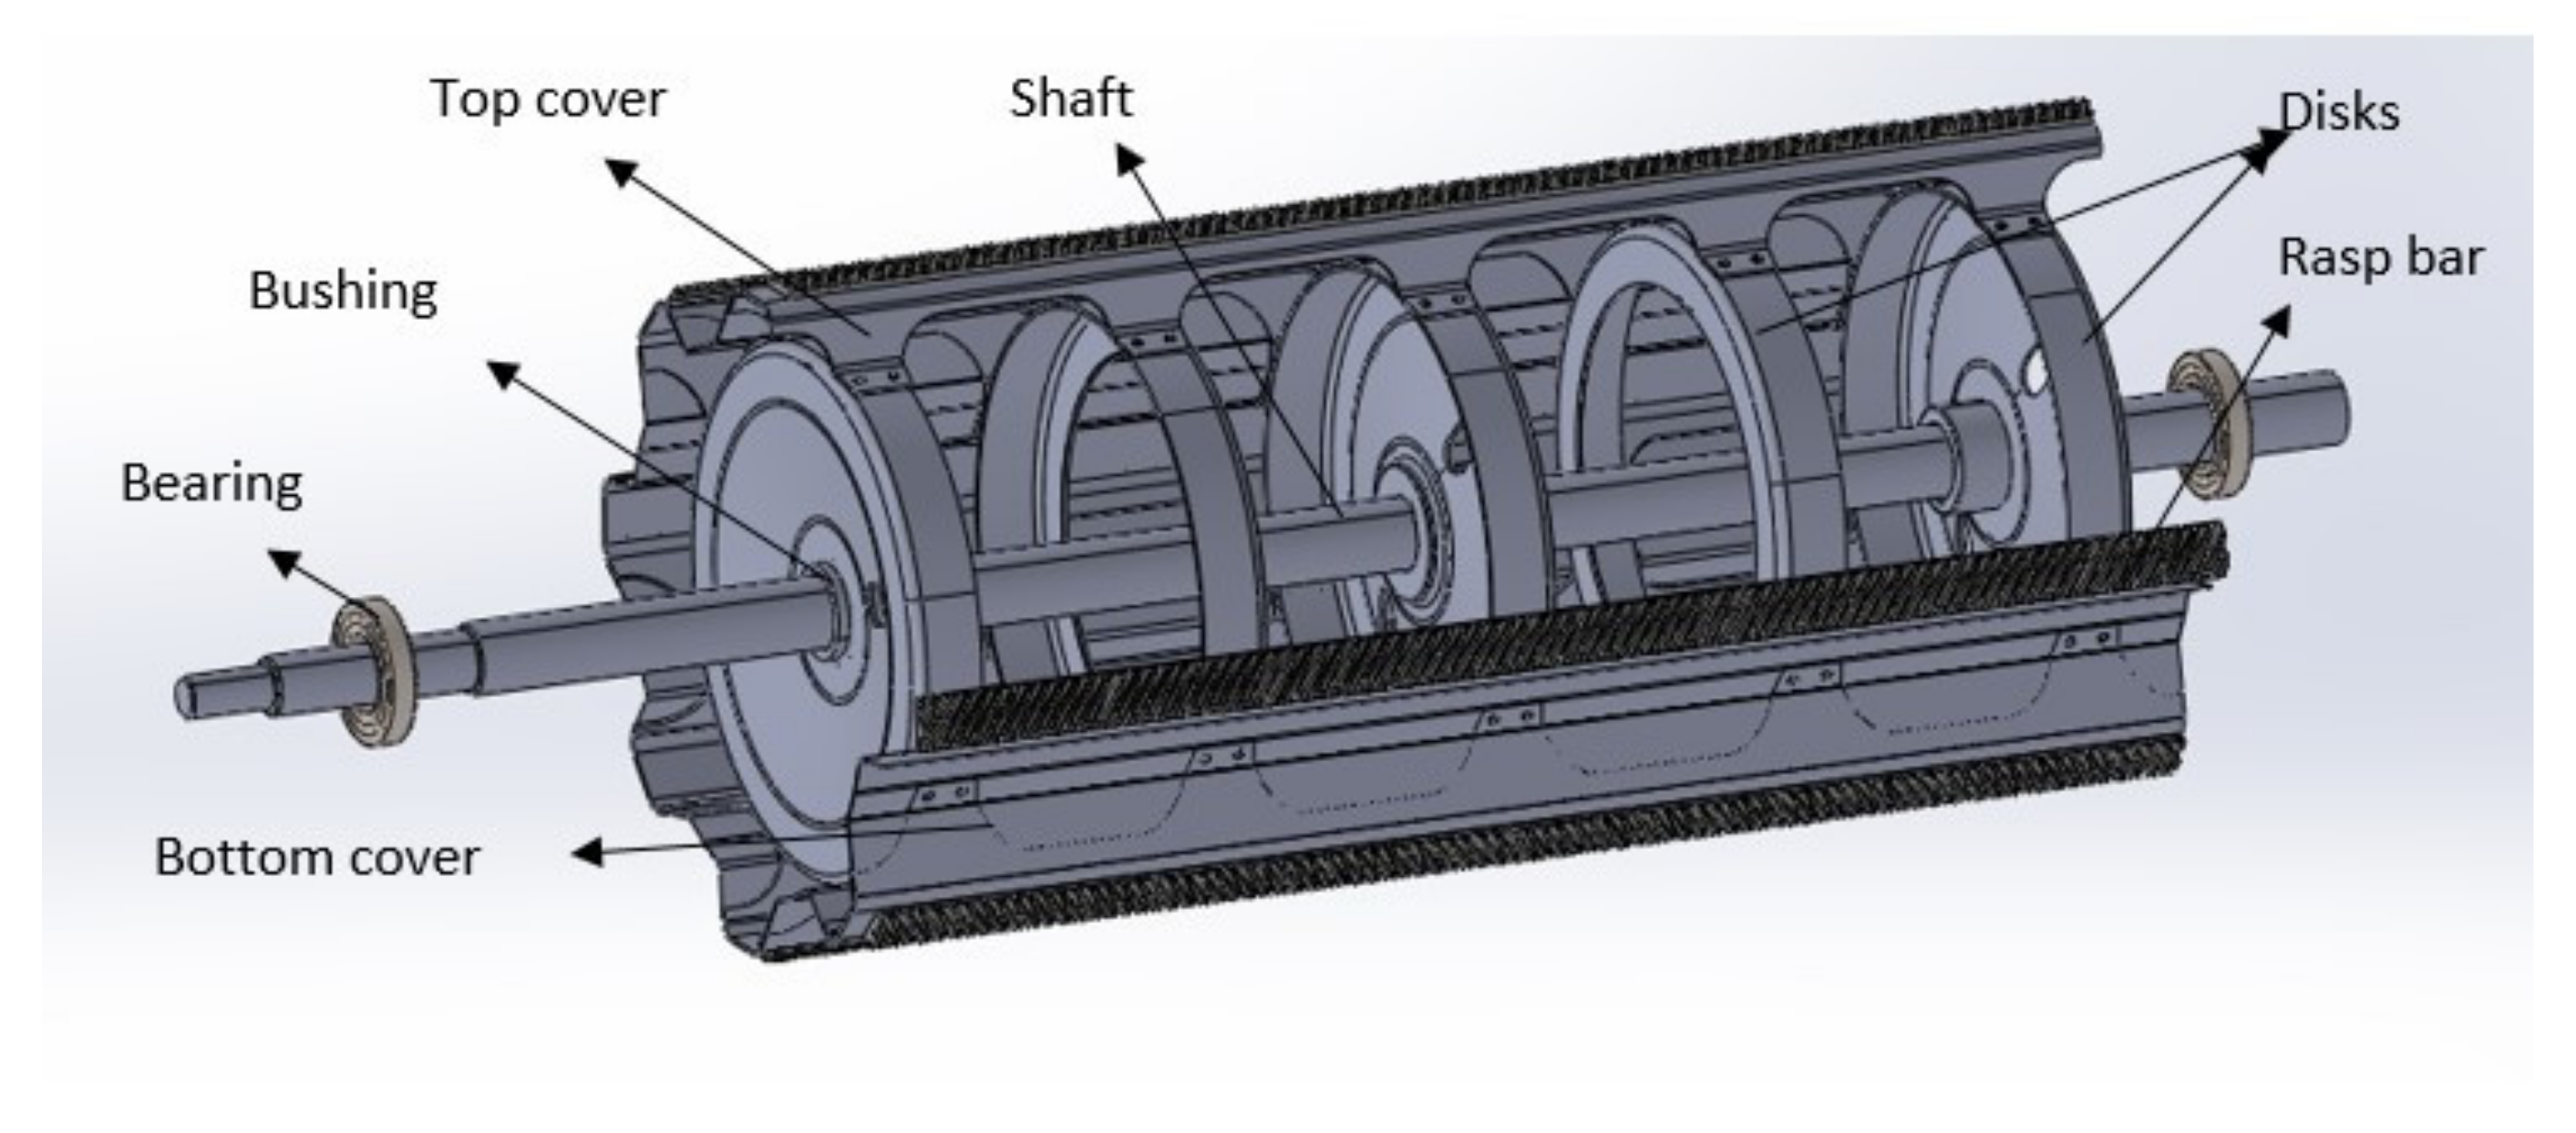
Article

Vibration Analysis of a Roller Bearing Condition Used in a Tangential Threshing Drum of a Combine Harvester for the Smooth and Continuous Performance of Agricultural Crop Harvesting

by
Shankar Bhandari
* and
Eglė Jotautienė
Department of Agricultural Engineering and Safety, Agriculture Academy, Vytautas Magnus University, LT-53362 Akademija, Lithuania
*
Author to whom correspondence should be addressed.
Agriculture 2022, 12(11), 1969; https://doi.org/10.3390/agriculture12111969
Submission received: 21 October 2022 / Revised: 14 November 2022 / Accepted: 16 November 2022 / Published: 21 November 2022
(This article belongs to the Special Issue Advances in Agricultural Engineering Technologies and Application)

Abstract

:
Testing the reliability of the threshing unit is difficult and thus often neglected before the harvesting season, which can result in breakdown maintenance during peak harvesting time in difficult-to-access areas for sensor mounting. In this paper, the vibration analysis of the threshing condition of the combine harvester was performed by introducing the bracket for inaccessible locations. The Adash A4900 Vibrio M analyzer (Adash spol. s.r.o., Ostrava, Czech Republic) was used for a vibration signal measurement and the DDS Adash software was used for signal processing. The demodulated fast Fourier transform (FFT) root mean square (RMS) (500 Hz–16 kHz) method was used to evaluate the bearing condition and DDS Adash Fault Source Identification Tool (FASIT) technology was used to evaluate other mechanical conditions such as the looseness, misalignment, and unbalance of the threshing unit of the Massey Ferguson series of combine harvesters. Modal and random vibration analyses were performed on the bracket and components and compared to prevent the resonance phenomenon using the Ansys Software (Ansys, Inc., Canonsburg, PA, USA). The constrained modal analysis of the threshing drum was performed to observe the deformation. Decent results were obtained from the method used. The method was again validated by the tangential threshing test bench and successfully determined the bearing fault condition. The method used is an uncomplicated and effective way of performing the bearing analysis of the tangential unit of the combine harvester.

1. Introduction

Threshing is one of the most important parameters to complete the harvesting process which is time-sensitive [1]. The grain damage and grain loss are consistent significant parameters of the threshing mechanism which can be monitored by vibration analysis for optimal performances [2]. A discharge beater is one of the essential tools constituting the threshing mechanism which is adjoined to the outlet and selectively rotates in response to the feeding rate. It is arranged to transfer the crop remains from the threshing drum and conveyor arrangement and is responsible for the net production of grains outlets [3]. The partial load is the major parameter that determines the unbalanced vibration on a tangential threshing unit which disturbs the working accuracy of the machine and the comfort of the operator [4].
The mode of the cylinder used, the loads on the threshing units, and the frequency range of measurement play vital roles in the vibration analysis of the threshing unit of a combine harvester [5]. Ji Jangtoa studied the interaction between the threshing unit and the plant materials, concluding that the amplitude of the vibration signal experienced the maximum elevation of amplitude on the horizontal radial axis (feeding direction)—more than that of the vertical axis during the loading threshing condition [6]. The sensor mounted on the vertical radial axis encountered maximum vibration amplitude and the sensor mounted at 45° with the horizontal radial axis is capable of displaying the vibration from the vertical and horizontal directions combined under no-load conditions [7].
Zhong analyzed the comparative study of the idling state of the no-load and loading states of the tangential threshing and shaft vibration by solving the modalities of a tangential threshing cylinder. It was observed that the rotation speed frequency would not induce the occurrence of the resonance phenomenon and the vibration amplitude increases 22–25 times with a loading condition compared to the no-load condition [8]. Investigations were made into the swirl features and instability of a combine harvester’s thresher under loading conditions as it is subjected to stalk winding. The stalks looped around the thresher significantly impacts the stability and swirling properties of the thresher–stalk system [9]. Xiang made a comparative study of machine learning, ensemble learning, and deep learning with his approach to the fast Fourier transform (FFT) with the decimation-in-time (DIT) and XGBoost algorithm to quickly and accurately identify the fault type of bearing [10].
Zhou detected the bearing defect by collectively using signal collective processing techniques including self-adaptive noise cancellation (SANC), kurtogram, and envelope analysis [11]. To enable a more effective calculation in impulse signal analysis, online bearing vibration detection and analysis were carried out using the enhanced fast Fourier transform algorithm, which is based on a straightforward arithmetic operation [12]. The selection of the suitable demodulation frequency band is seen as an important and demanding stage in bearing fault diagnostics. It decides whether envelope analysis may be used to derive fault information from the demodulated signal [13].
If bearing defects exist, the measured vibration signal would be amplitude modulated at its characteristic defect frequency. The modulating wave is a pass vibration signal corresponding to local defects. Wang applied an envelope demodulation method based on the Hilbert transform to extract the characteristics of defect frequencies. He obtained the FFT after the Hilbert transform for the envelope spectrum [14].
Wide vibration analysis techniques and their applications are very popular in automobile industries [15,16,17,18], however, these have few implementations concerning the threshing unit of combine harvesters. Most vibration analyses are conducted in the cabin area of the harvester and focus on driver safety and comfort [19,20], simulated vibration analysis [21], and under laboratory conditions [22]. However, the vibration analysis techniques of the threshing unit’s health monitoring are mostly under laboratory conditions. The vibration analysis performed for the threshing unit of a combine harvester includes the complexity of instrumentation due to its complex structure, as the components need to be dismantled to obtain the raw vibration signal for processing. To avoid such complexities, in this paper, the manufactured bracket is mounted on the bearing housing to obtain the vibration signal. The modal analysis is performed for bracket and connected components (housing, bolt, threshing shaft, disk, and hub) for comparative analysis to avoid resonance. The demodulated fast Fourier transform (FFT) (500 Hz–16 kHz) method was used to evaluate the bearing condition and DDS Adash Fault Source Identification Tool (FASIT) technology was used to evaluate other mechanical conditions such as the looseness, misalignment, and unbalance of the tangential threshing unit of the Massey Ferguson series of combine harvesters.

2. Materials and Methods

The Massey Ferguson 7374 s ACTIVA with 1300 engine hours (EH) and the new Massey Ferguson 7370 Beta were investigated for vibration analysis as shown in Figure 1.
The threshing drum bearings consist of 6310 (SKF, Gothenburg, Sweden) for both series of Massey Ferguson. The vibration measurement was conducted three times for each location. The detail of the technical condition is shown in Table 1.
The measurement was taken at 45° with the horizontal radial axis of the threshing shaft. The measurement was taken in the bracket and the housing on the new Beta version, but only in housing for the Activa version of Massey Ferguson as the bracket mounting was not viable for the Activa version due to the compact housing design. The variable working measuring speed was the same for both combine harvesters. The measuring speeds were 900, 1100, 1800, and 2500 engine RPMs, corresponding to 220, 290, 410, and 470 threshing drum RPMs, respectively. These engine speeds, which are the real operating speeds used during the harvesting period on the farm from low- to high-speed range, were obtained from the operators themselves, whilst the corresponding speeds at a threshing unit were obtained from the inbuilt sensor mounted in the Massey Ferguson combine harvesters. The major parameters of the threshing unit are shown in Table 2. The measuring position of the accelerometer on the bearing housing is shown in Figure 2.
For the vibration measurement and data analysis, the Adash A4900 Vibrio M vibration accelerometer with a magnetic base and the Adash A4900 Vibrio M vibration analyzer were both used. This instrument complies with the ISO 10816-3 standard [23] and the requirements for mechanical vibration testing listed in ISO 10816-3, 2009 ISO10816-3:2009.
The Adash A4900Vibrio M, an accelerometer of type AC 150 with a magnetic base and a vibration spectrum analyzer with a sensitivity of 100 mV/g and an accuracy range of 2.5%, was used in the vibration instrumentation [24]. The DDS software was used by the Adash vibration analyzer to show the machine’s overall vibration severity, bearing condition, speed, looseness, imbalance, misalignment, and other unidentified source severity.
For the bracket and housing bearing, modal analysis was carried out using the ANSYS software to locate and eliminate the typical natural frequencies that could lead to resonance. This is required to undertake the adequate design, material selection, and simulation of that material to prevent the resonance problem before taking the true vibration measurement of the bearing from the made–added materials. Before measuring the vibration from the added bracket, the choice of material was examined and recommended from the standpoint of material qualities.
The rotating cylinder drum and the concaves make up the majority of the threshing apparatus, which separates the grain from the stalks. The rasp bar cylinders have slotted plates that are attached to the cylinder rings so that one plate’s slot direction is the opposite of another plate’s slot direction. The drum with the rasp bar on its surface will impact the plant entering in the tangential direction to remove the seeds from the stalks and husks. The bearing, housing, bolt, and bracket system components were subjected to a modal analysis in Ansys. To avoid resonance in the system, the findings were compared to the fundamental and natural frequencies of the individual components.
To validate the measuring positions, using the vibration method and FASIT tool technology, all the processes were again verified on the threshing stand test bench. The tangential threshing drum bearings test bench was constructed and investigated for vibration analysis, as shown in Figure 3. The threshing unit was procured from a NIVA SK-5 combine harvester and modified. The main units of the tangential threshing units consist of the bearing, bushing, top cover, shaft, disks, rasp bar, and bottom cover, as shown in Figure 4.
The threshing drum bearings consist of KBC 6313 BS: 65 × 140 × 33 (KBC Industrial Co., Ltd., Zhejiang, China) with 3620 MH (motor hours). The vibration measurement was conducted three times for each location. The detailed dimensions of the stand and bearing are shown in Table 3.
The threshing drum bearing vibration measurement was taken from a sensor mounted directly on the bearing housing. The variables measuring the threshing speed were the same for both the driving and non-driving sides of the threshing. The measuring speeds were 210, 350, and 420 threshing drum RPMs, respectively.
The threshing cylinder rotation frequency was changed by a voltage frequency converter DeltaVFD-C2000 SERIES and a cylinder gear variator. The test bench was driven by a 30 kW electric motor. The measurement was taken at 45° with the horizontal radial axis of the threshing. The vibration measuring device Adash A4900 Vibrio M device with an AC150 piezoelectric sensor was used, as shown in Figure 5.

3. Results

3.1. Modal Analysis

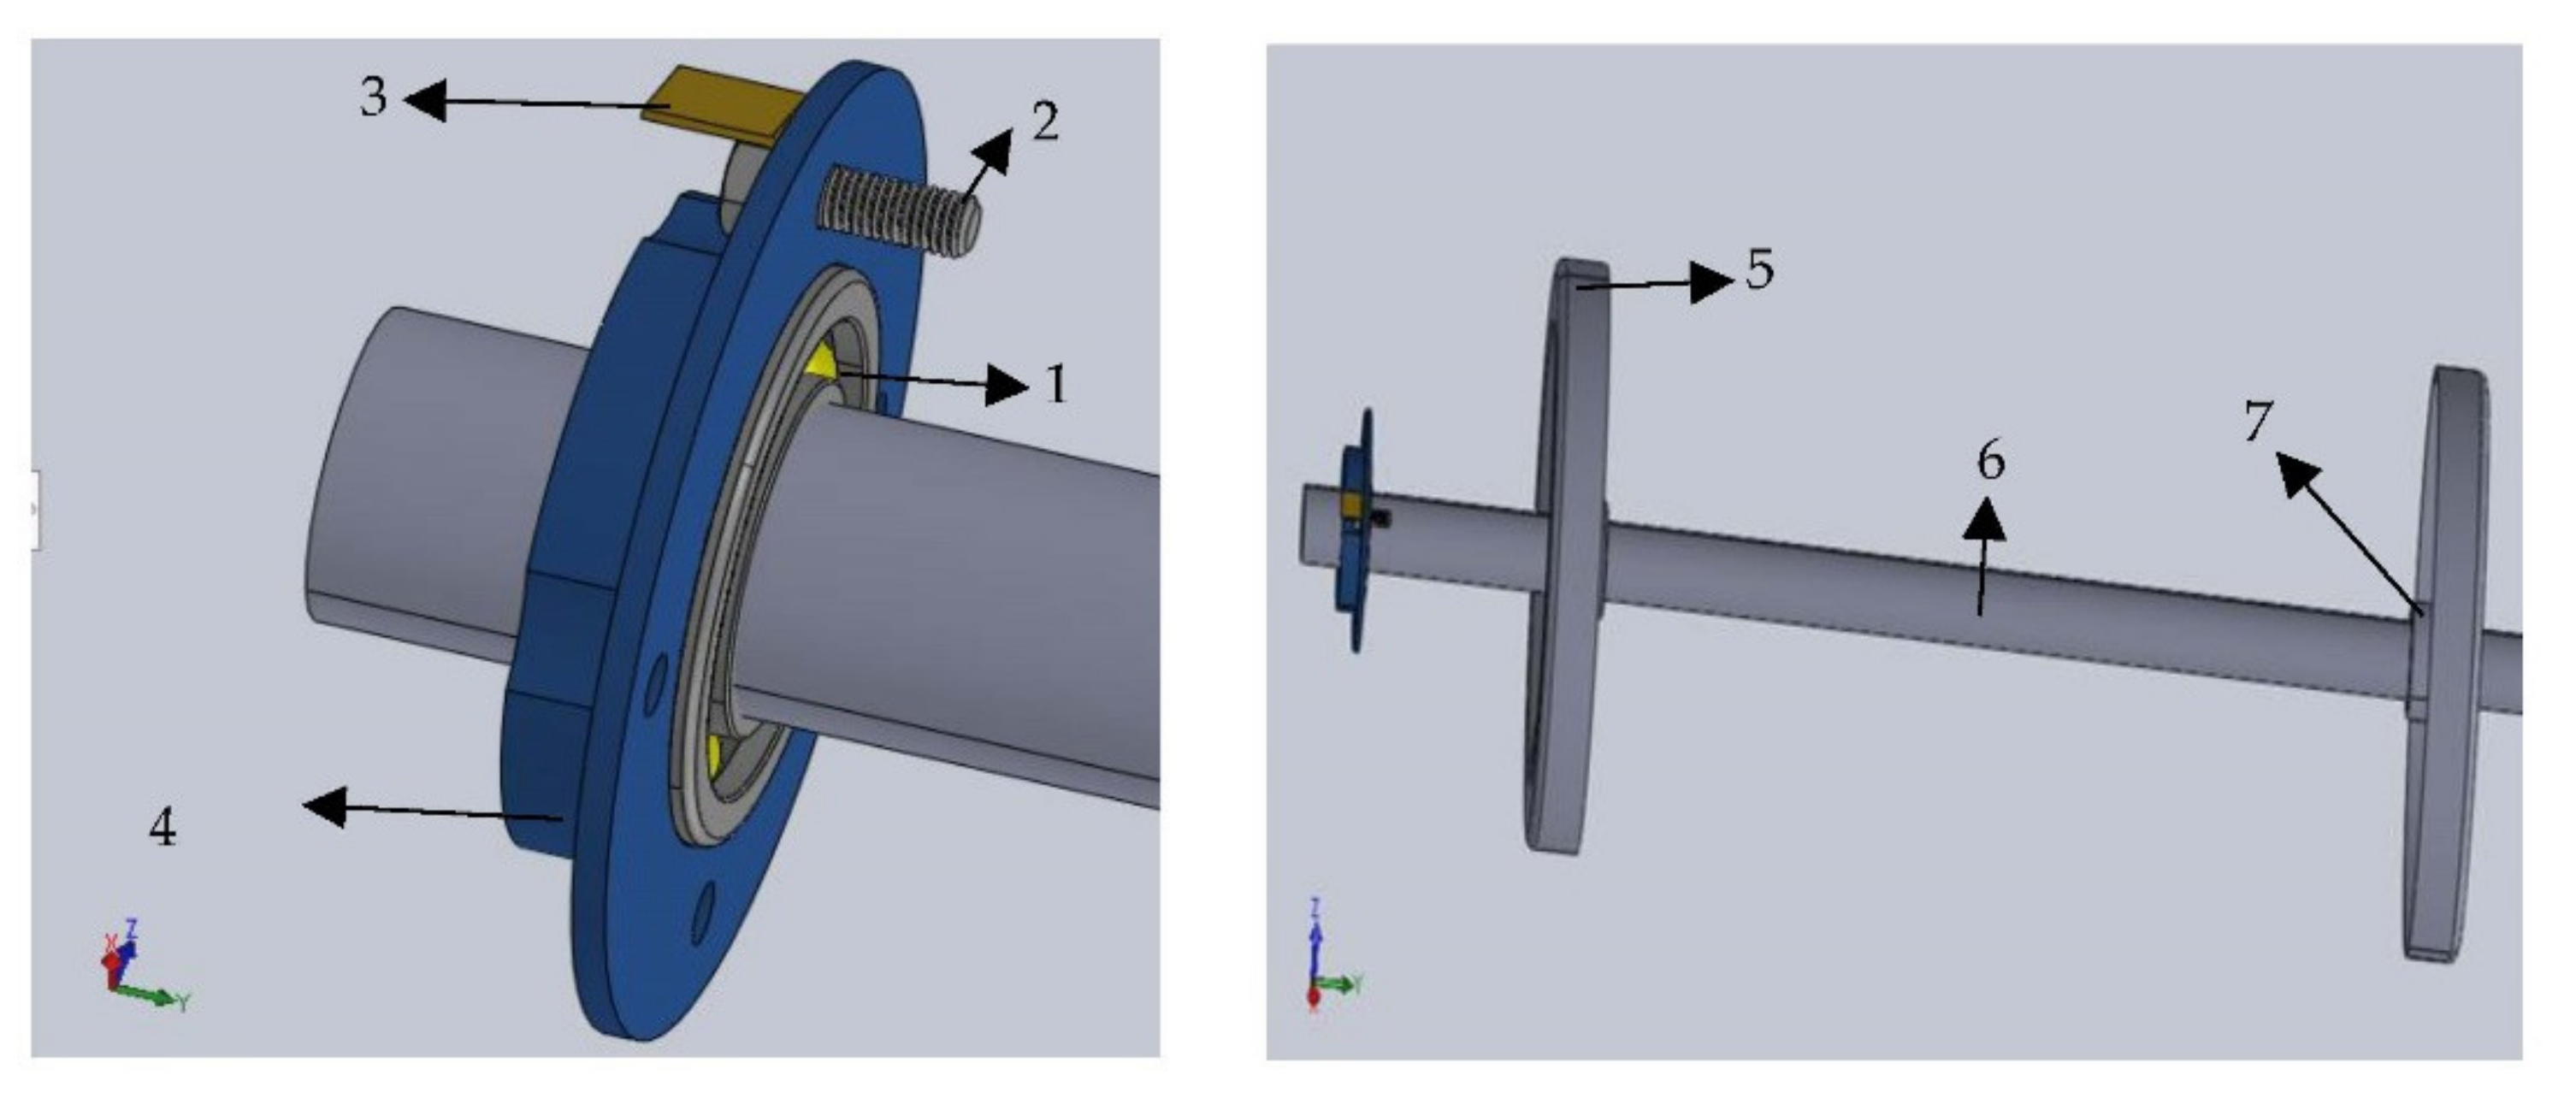
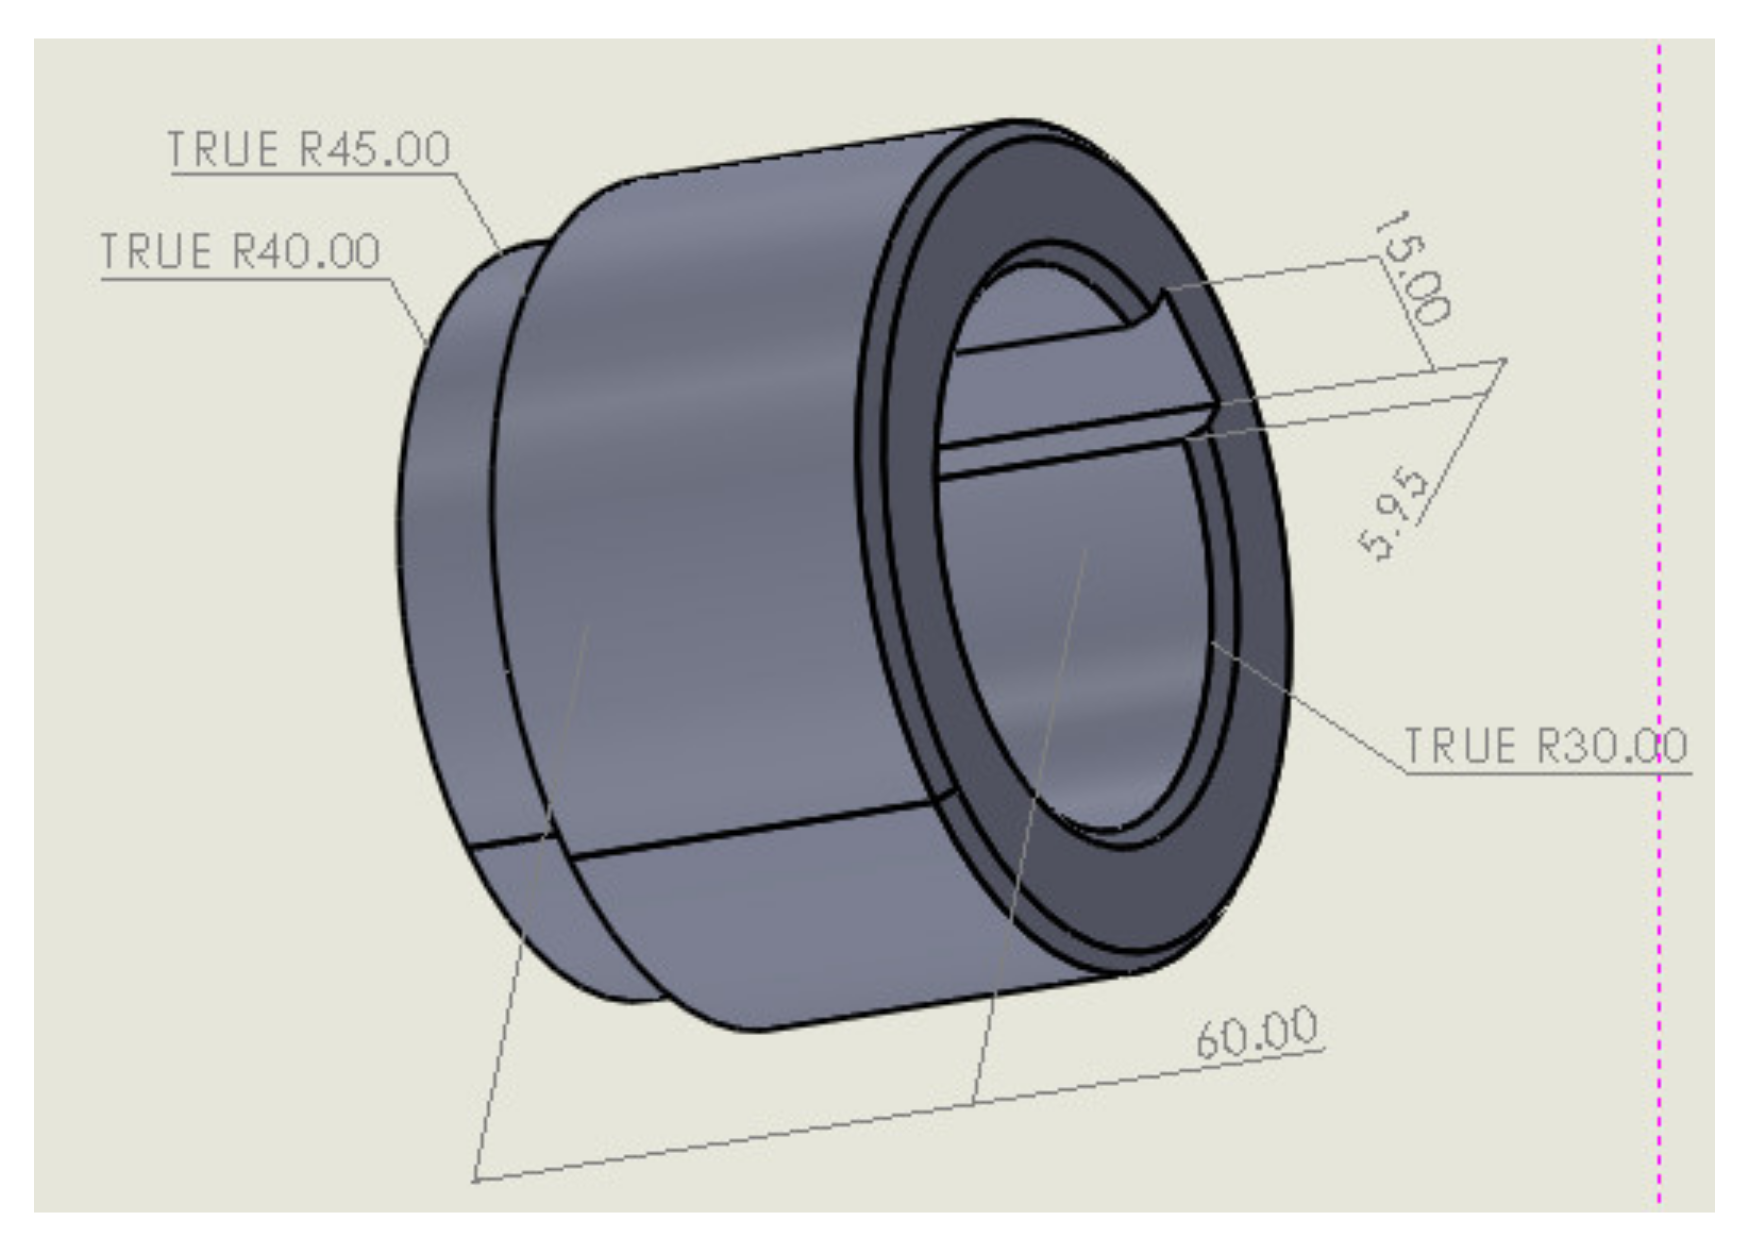
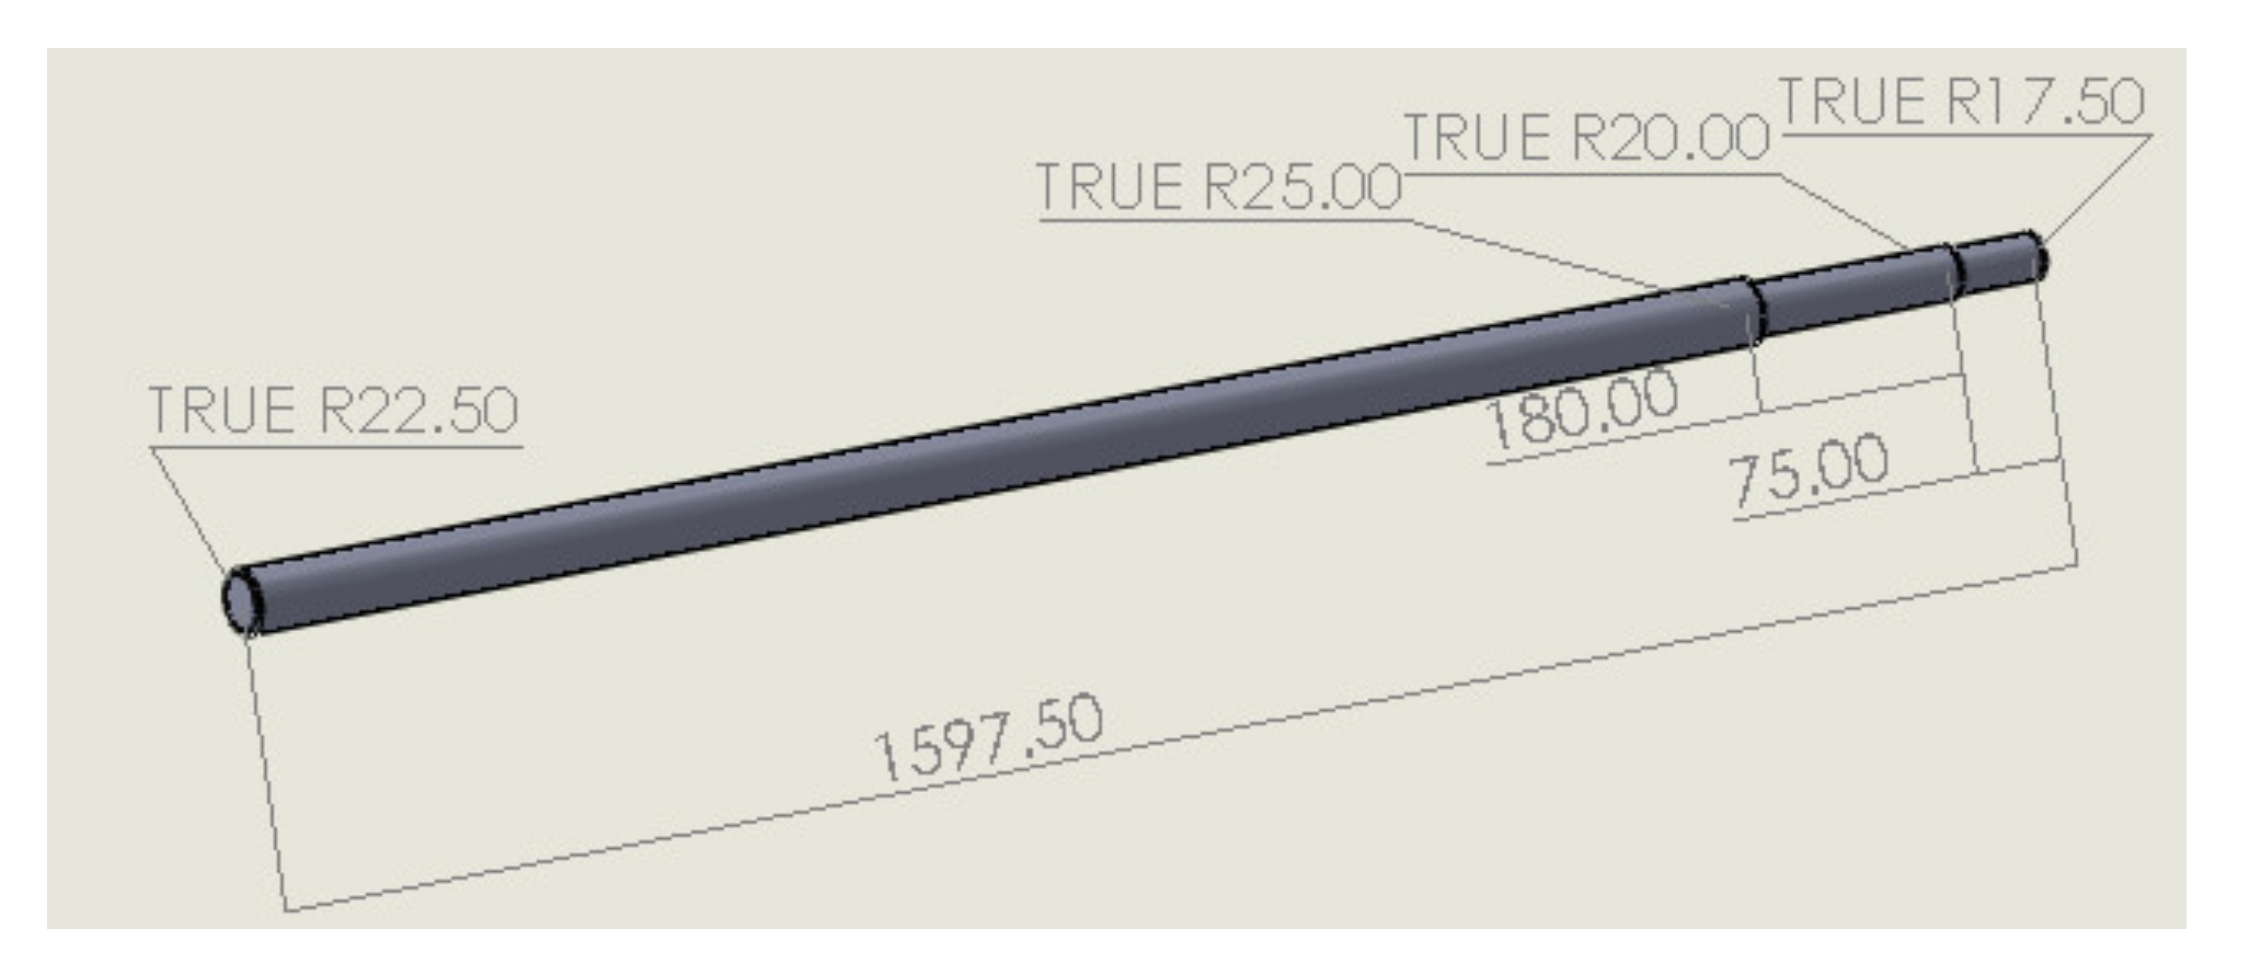
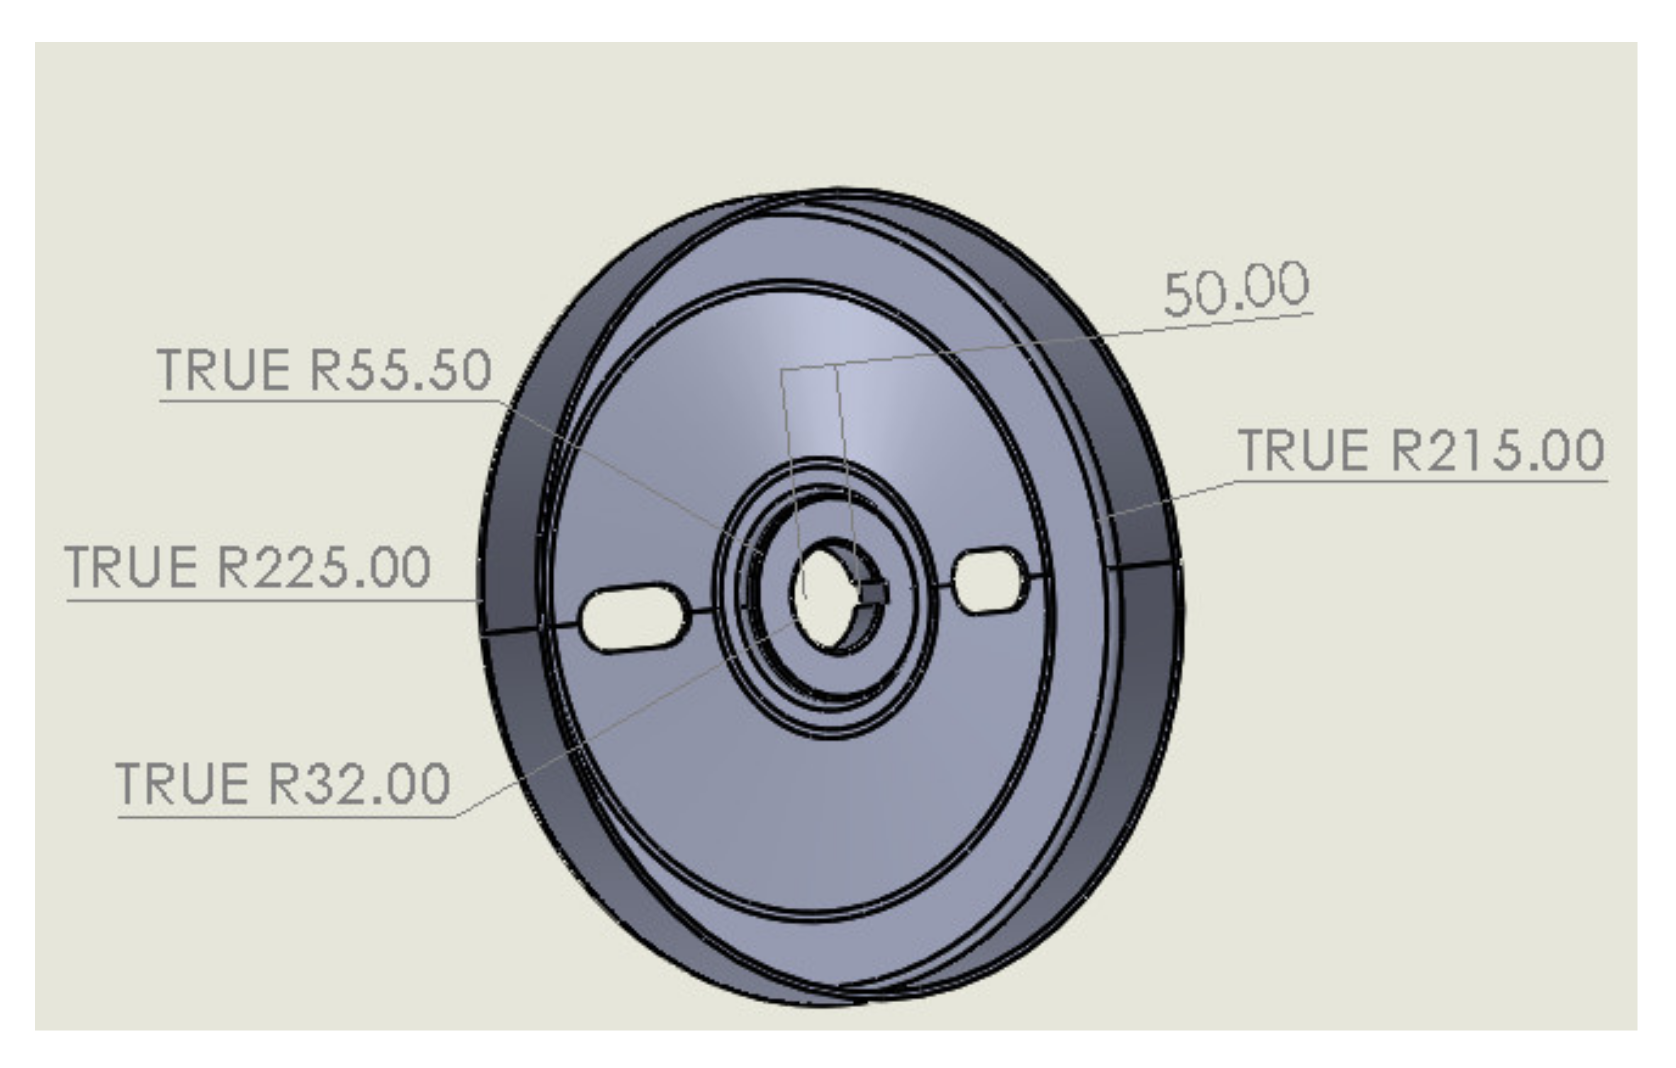
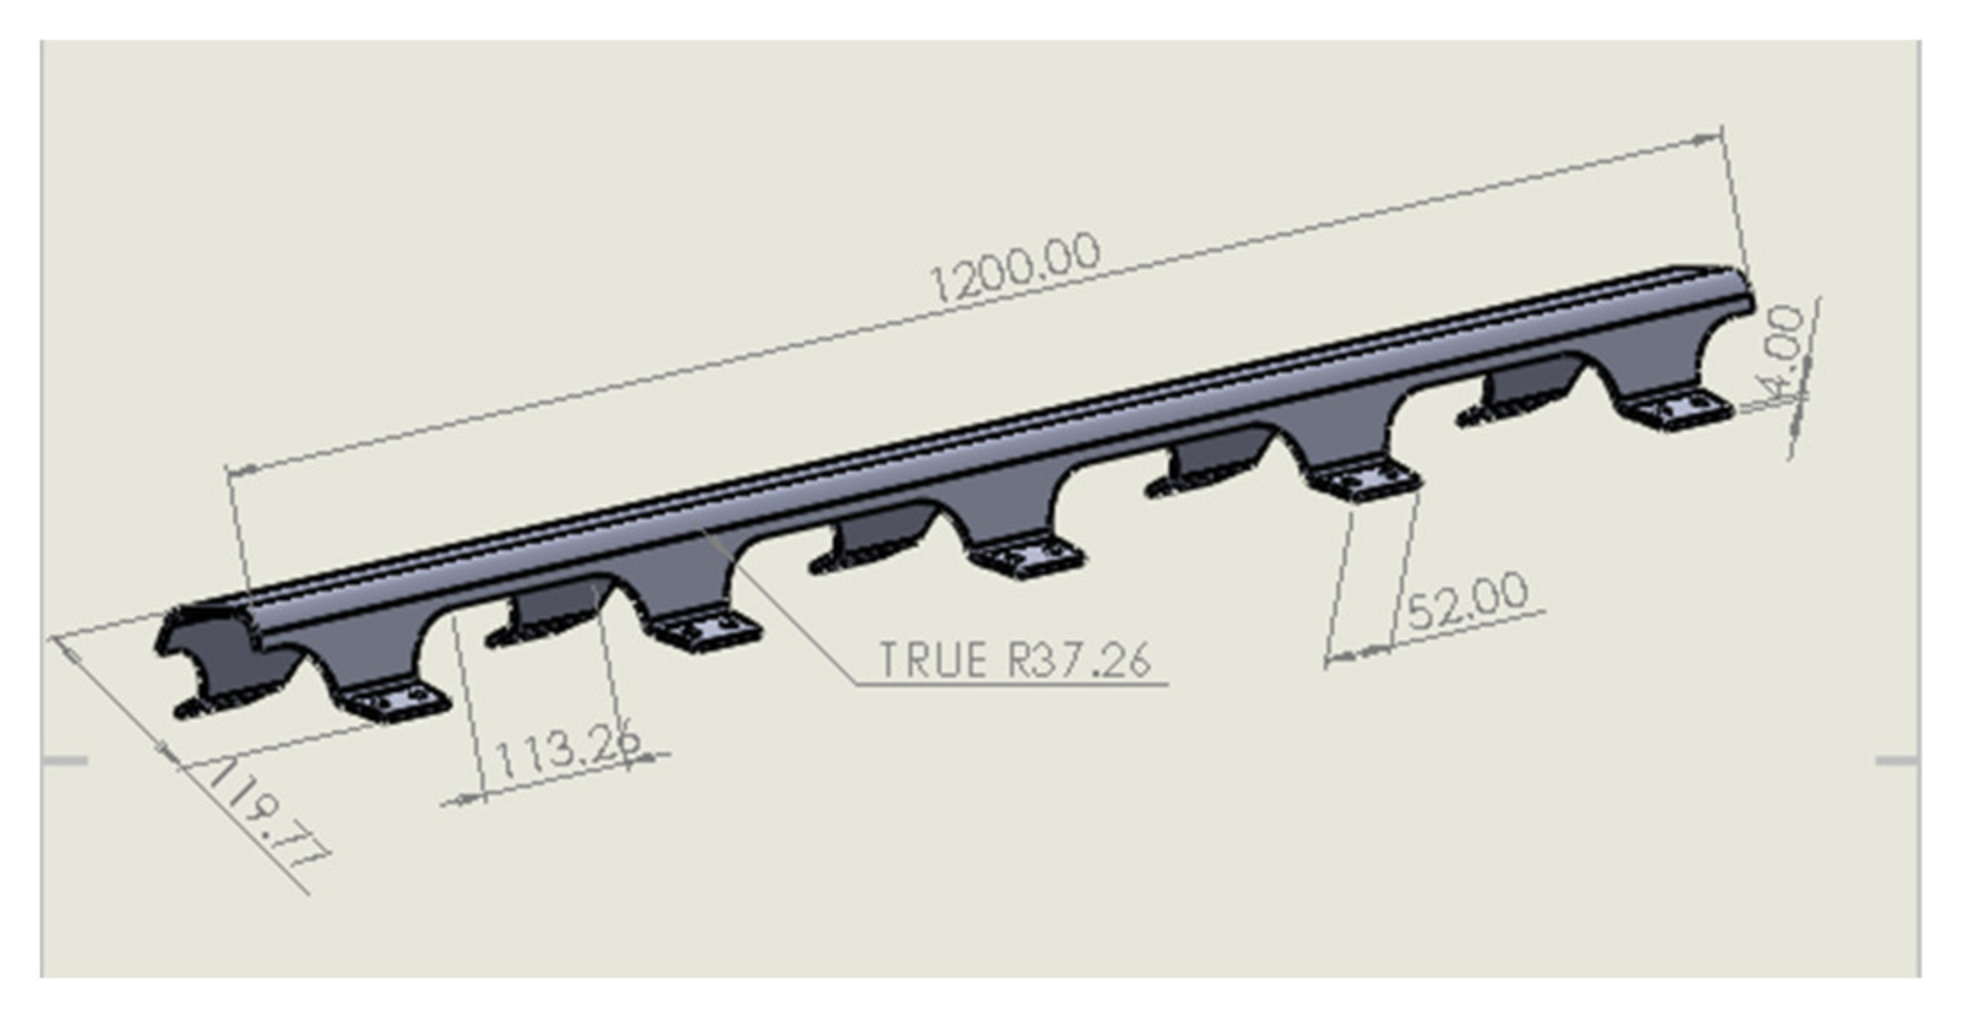
The 3D CAD modal of components (bearing, bracket, housing, bolt, hub, threshing shaft, and threshing disk), as shown in Figure 6, are designed in the solid works software and exported to the Ansys software for modal analysis.
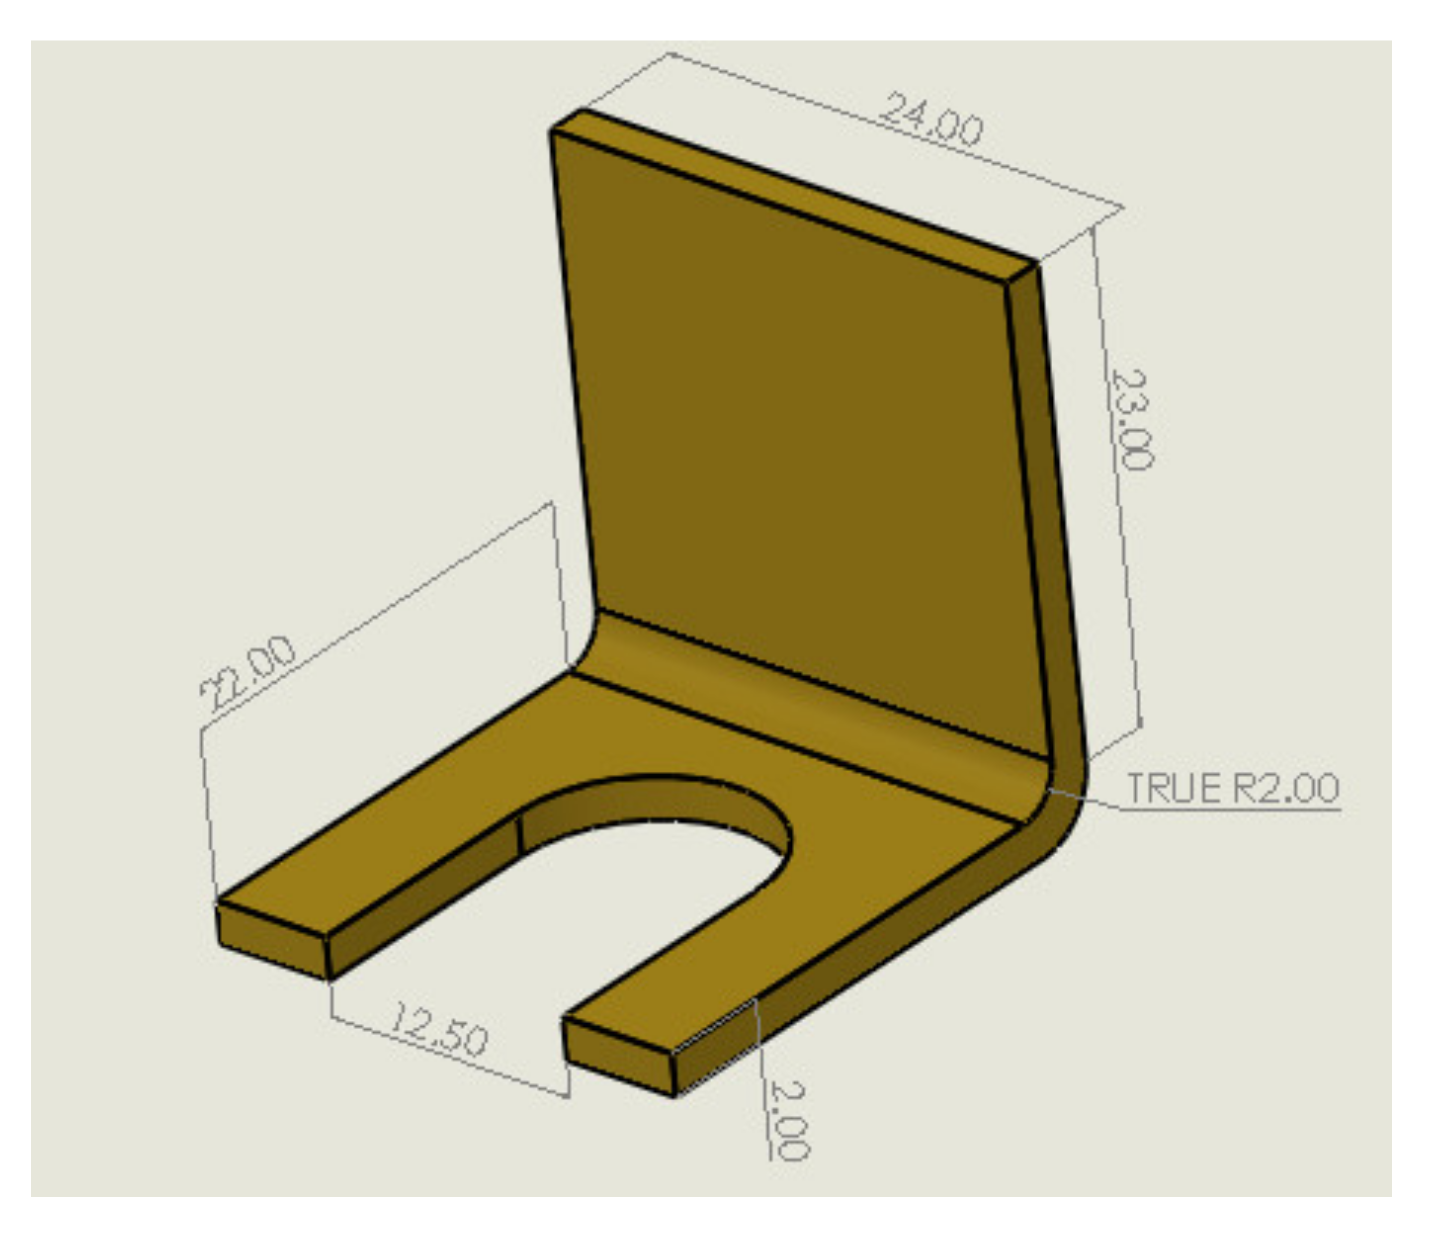
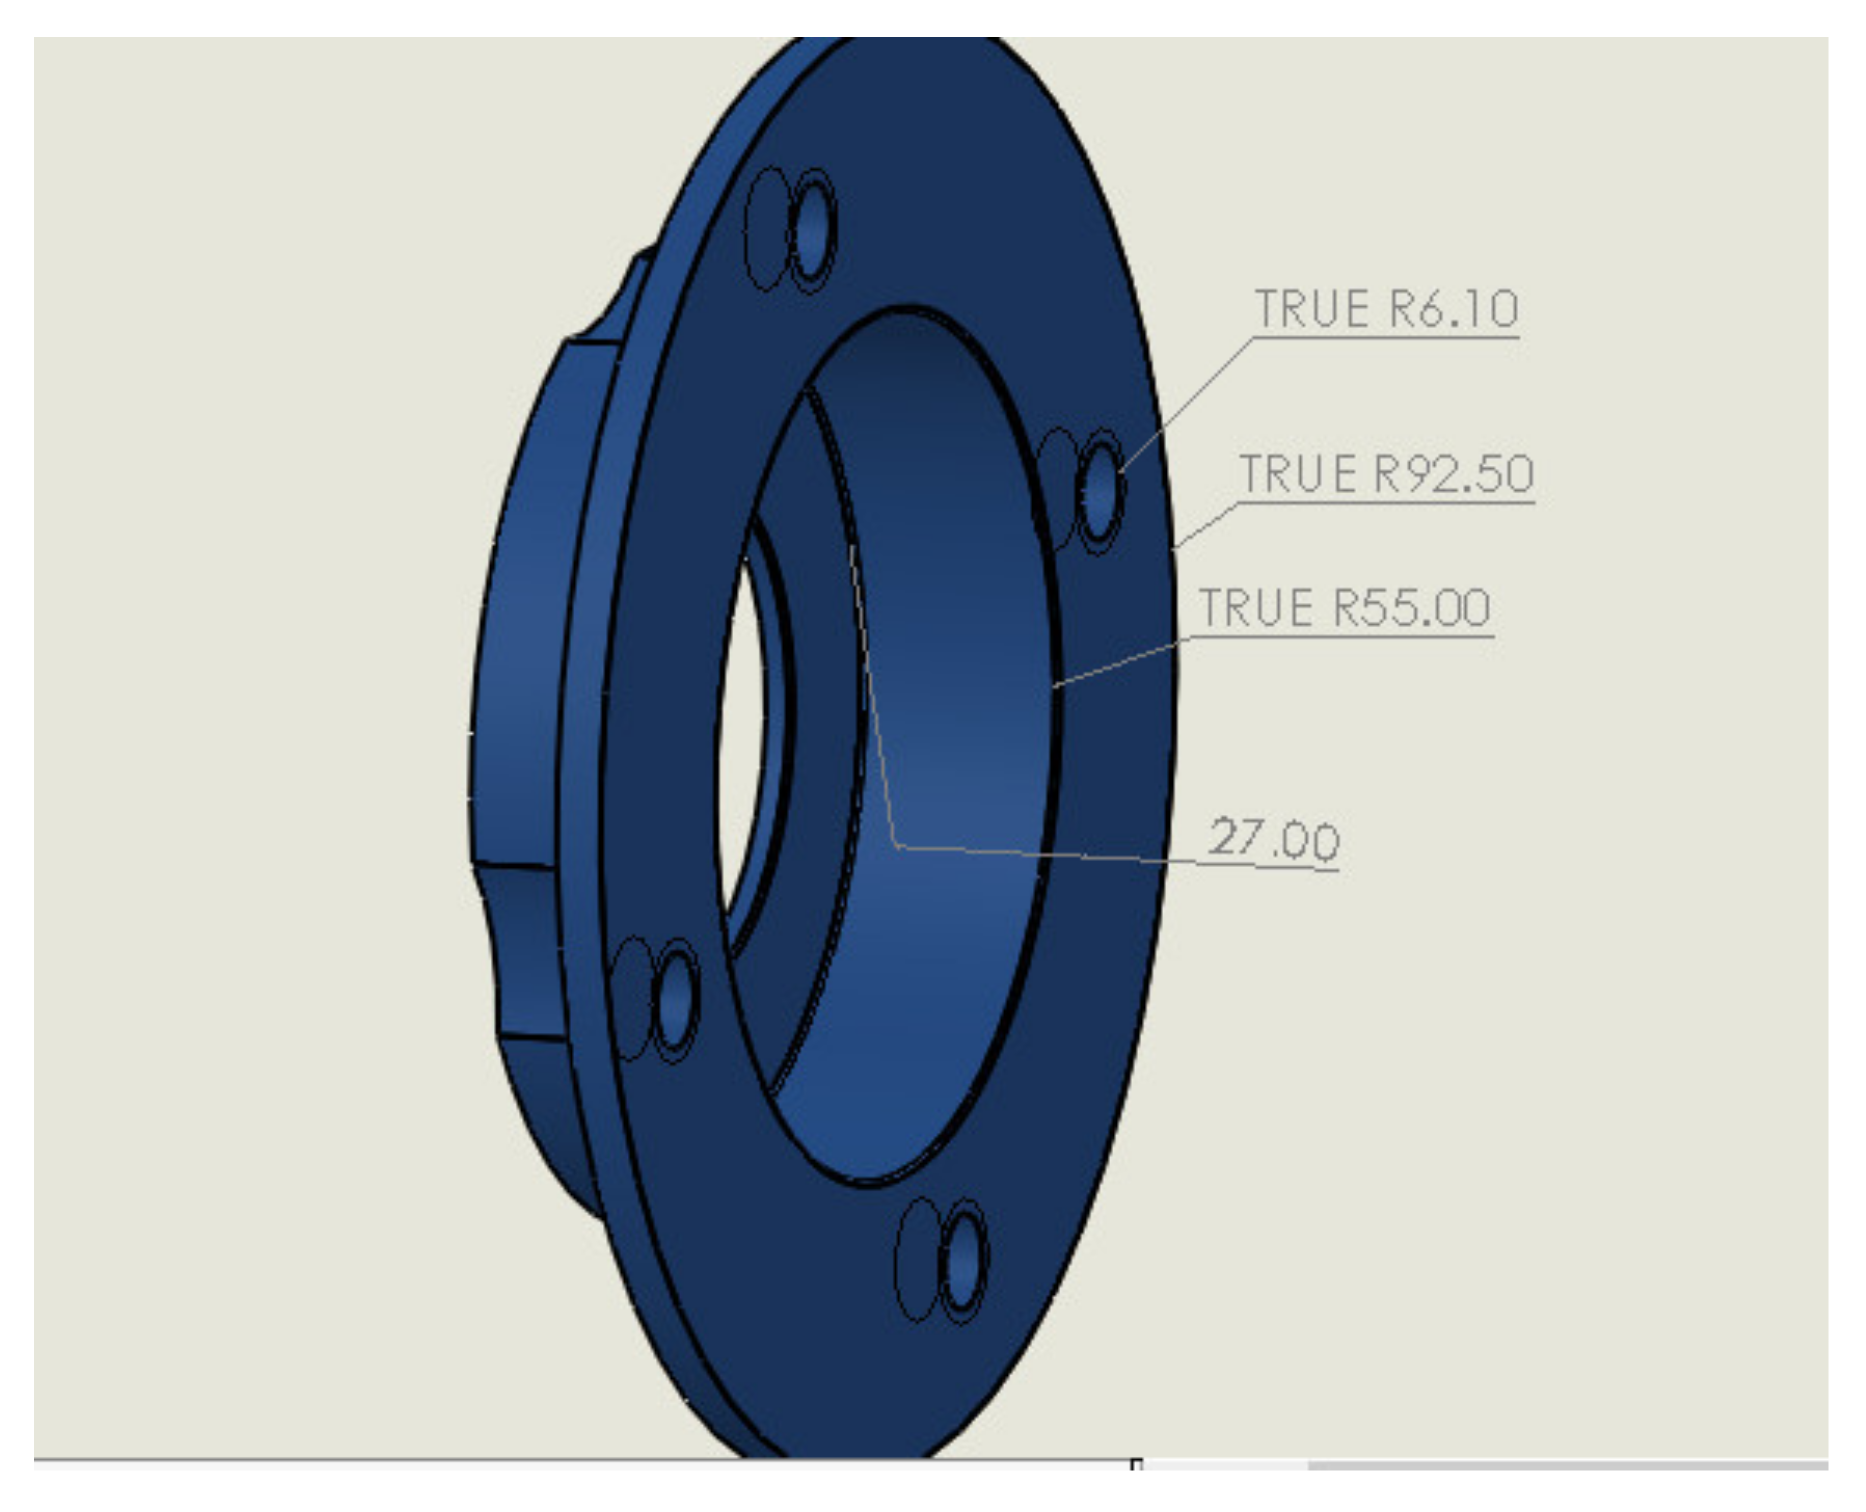
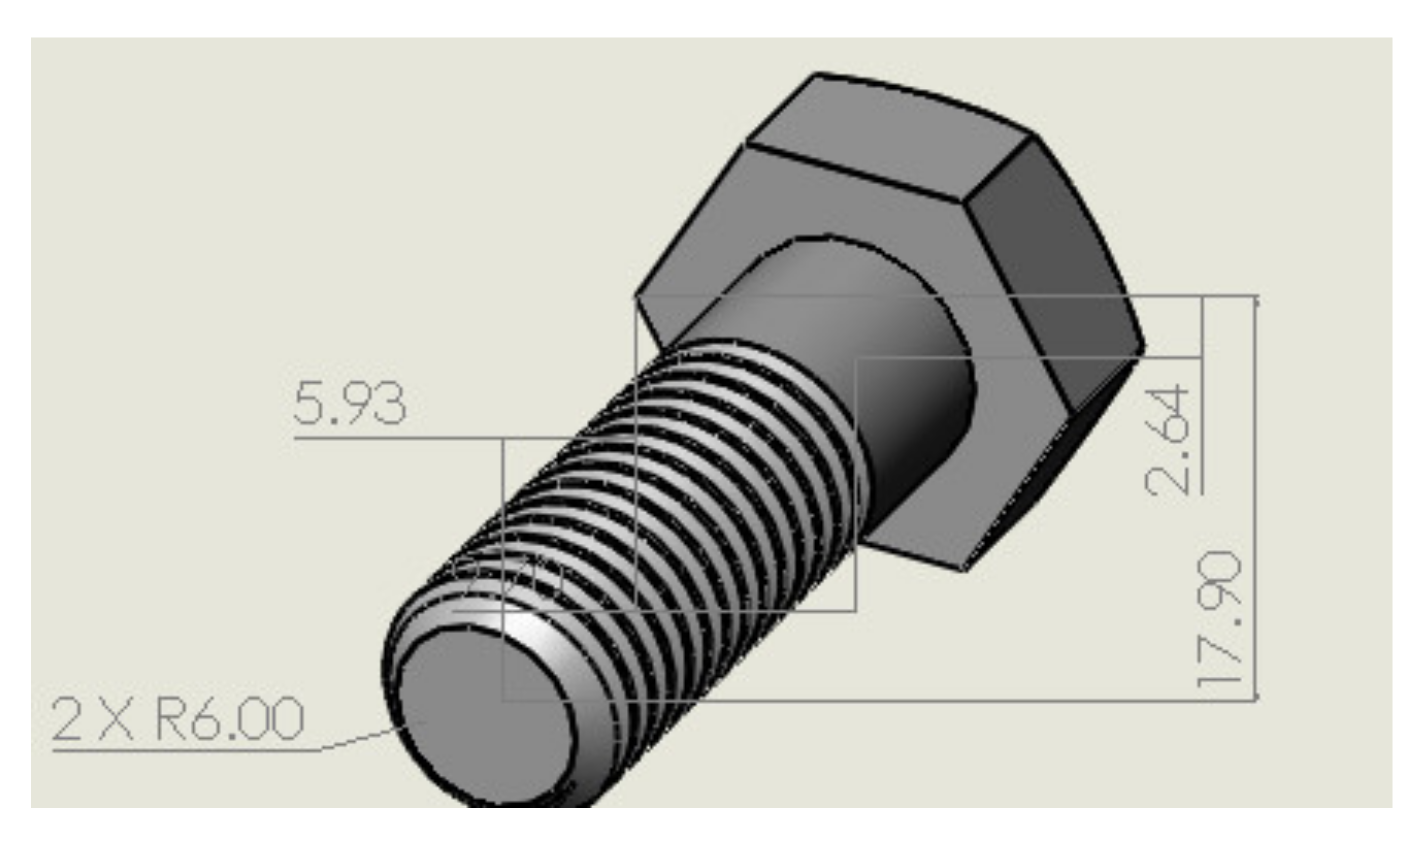
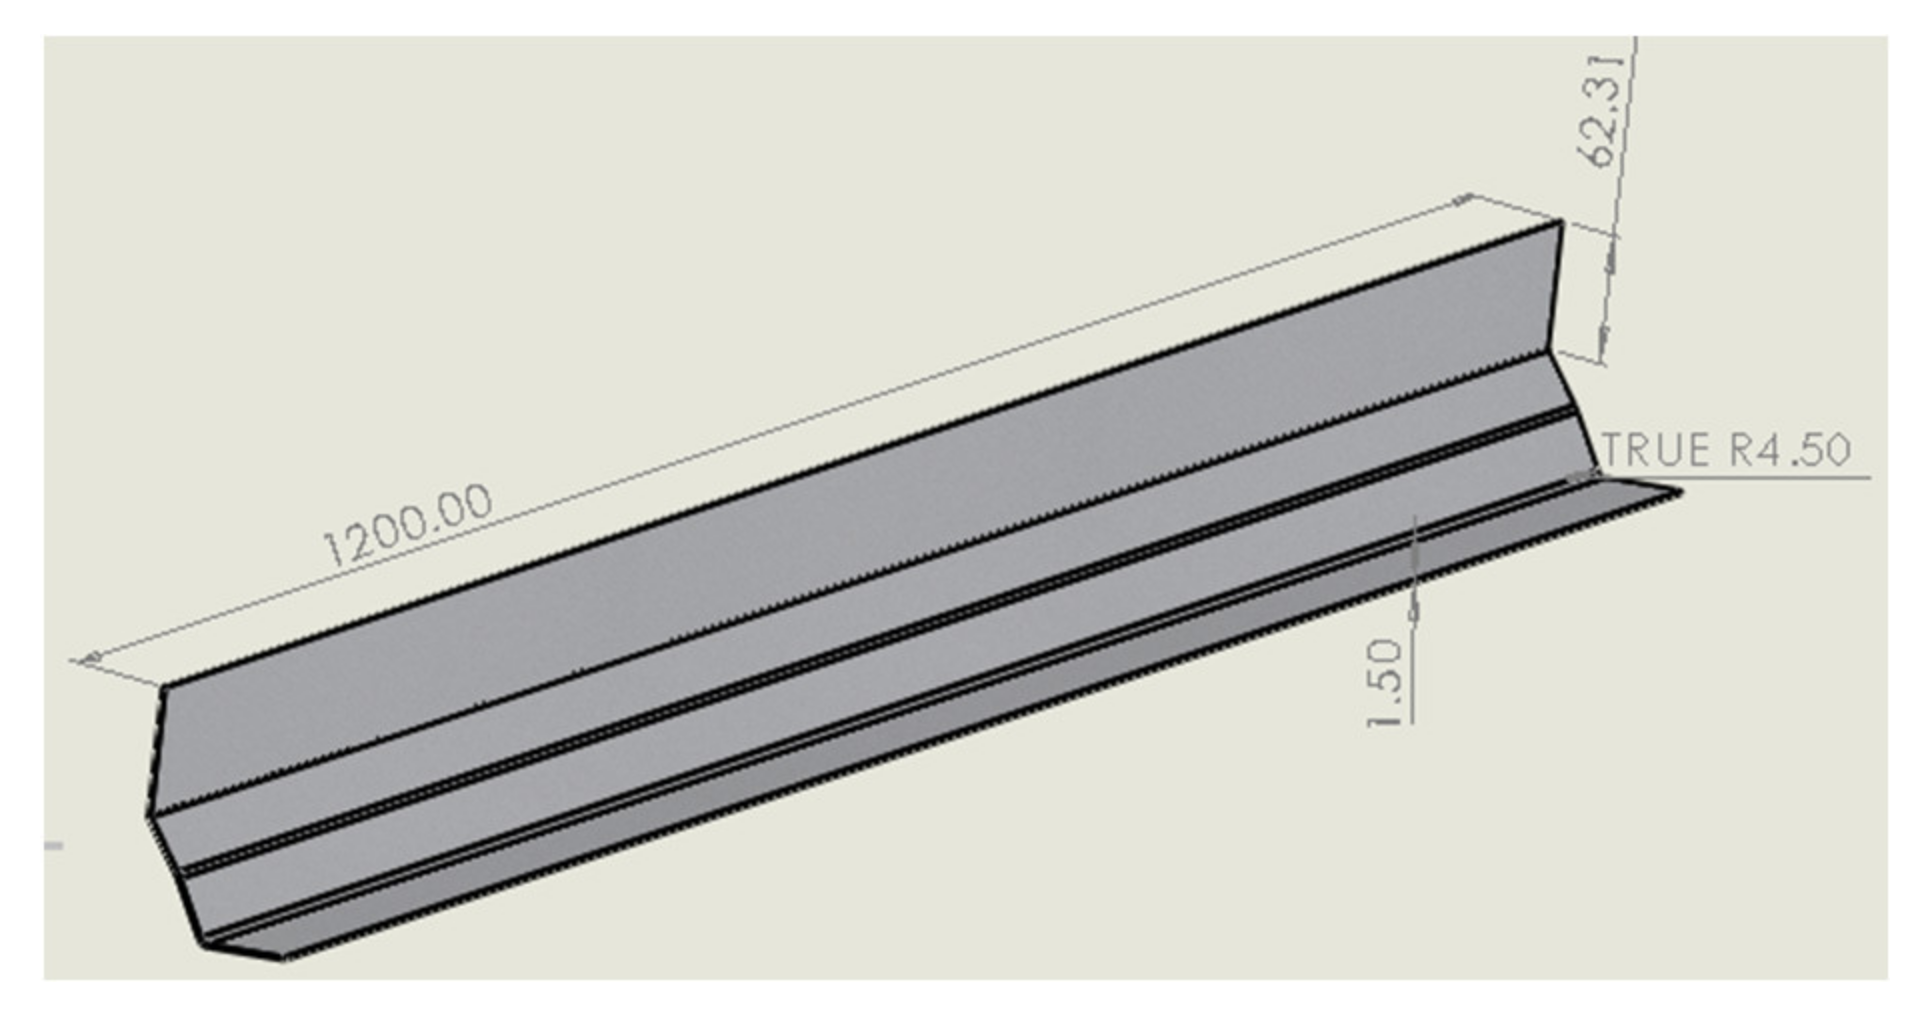
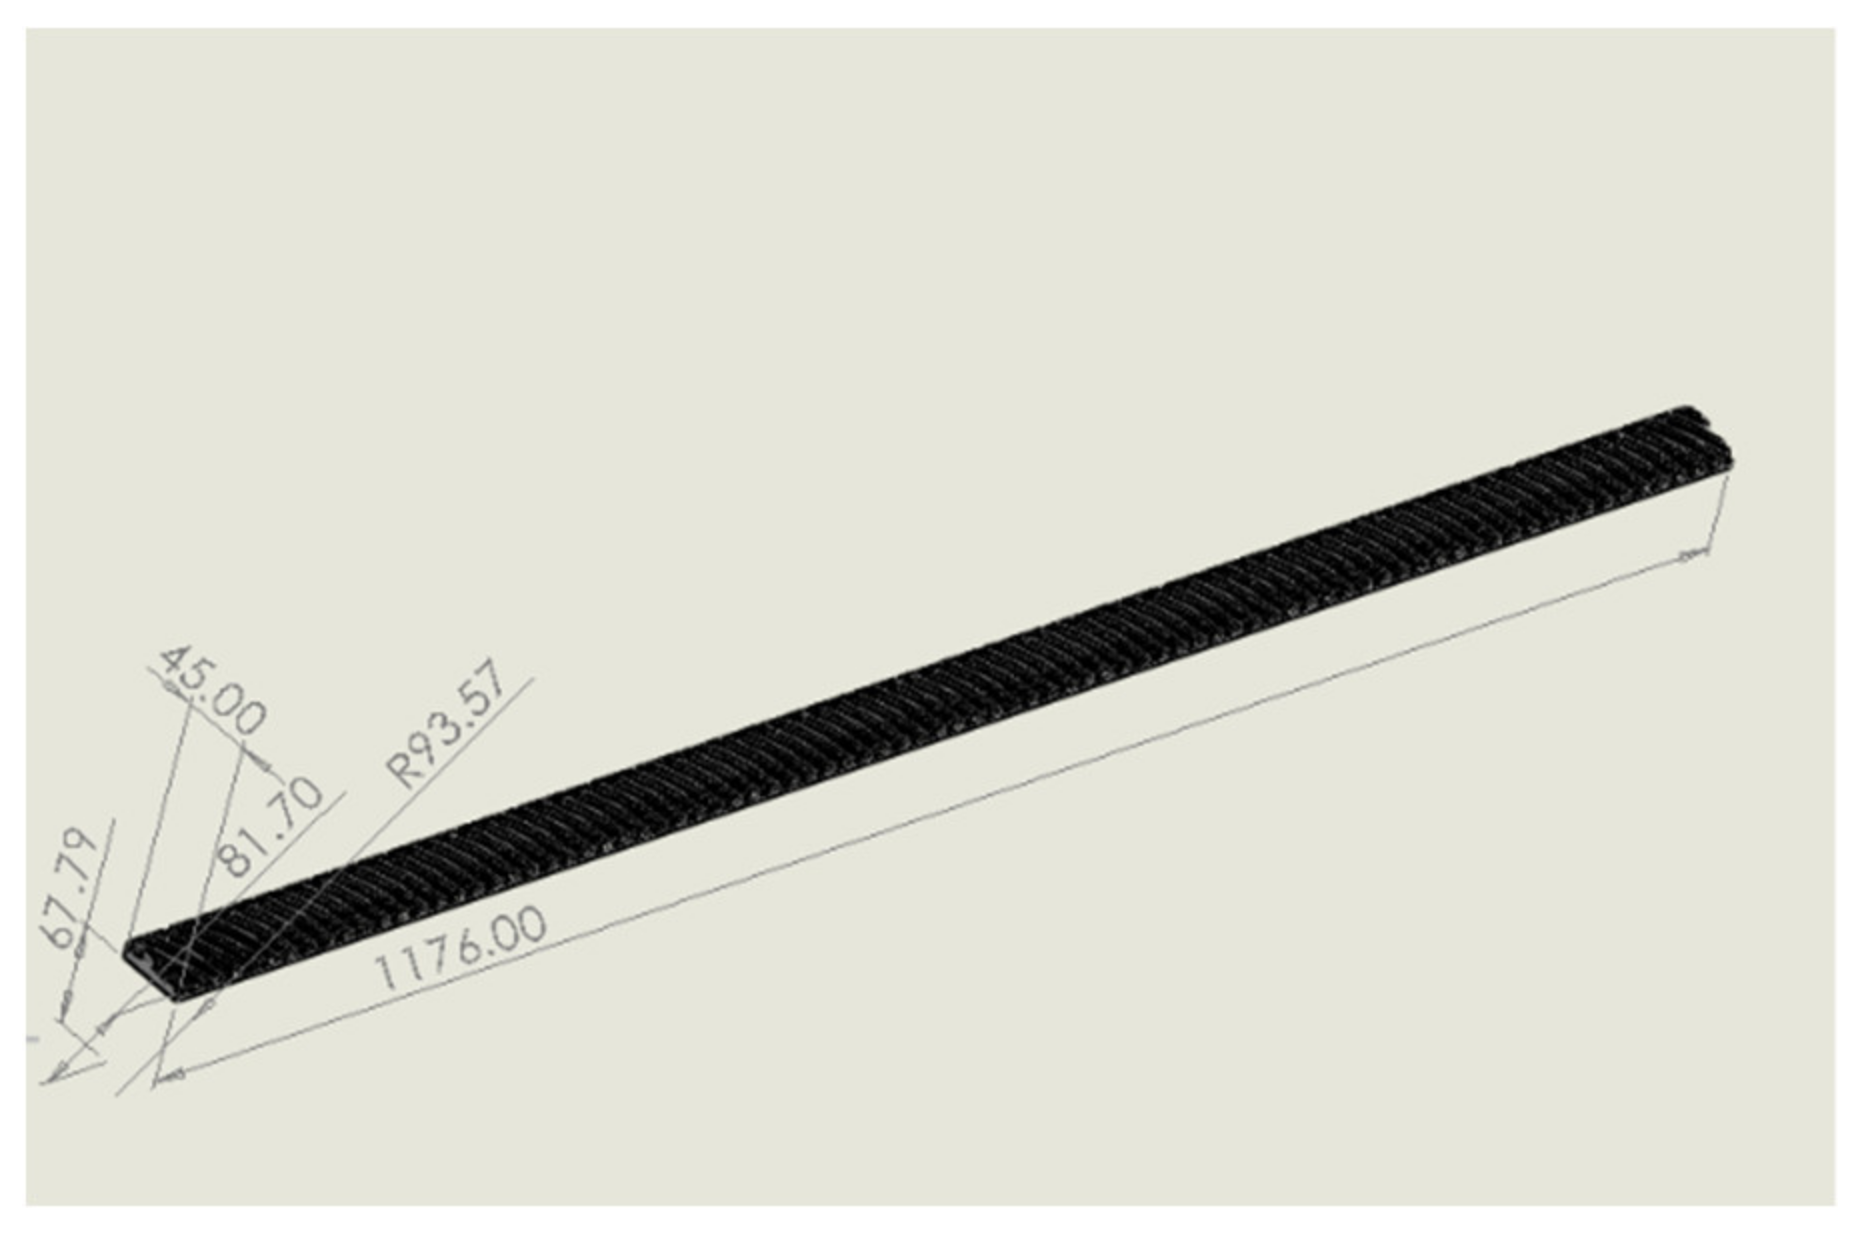
The modal analysis was performed for each component individually to obtain the eigenvalues and eigenvectors of the components for the first six different modes. The bracket is set as fixed onto the contact region with the bolt for modal analysis. Furthermore, the bearing, housing, bolt, and bracket used in the system were subjected to modal analysis. The dimension of each component is presented in Appendix A (Appendix A.1, Appendix A.2, Appendix A.3, Appendix A.4, Appendix A.5, Appendix A.6, Appendix A.7, Appendix A.8, Appendix A.9). The material was set as S235 steel for the bracket, gray cast iron for the housing, and stainless steel for other components. The material properties of the stainless steel and gray cast iron were obtained from Ansys material library, whereas the material properties of S235 are shown in Table 4. Since the eigenvalue of the bracket does not coincide with the components (Table 5) and the fundamental frequencies of the bearing, the bracket is processed for manufacturing.
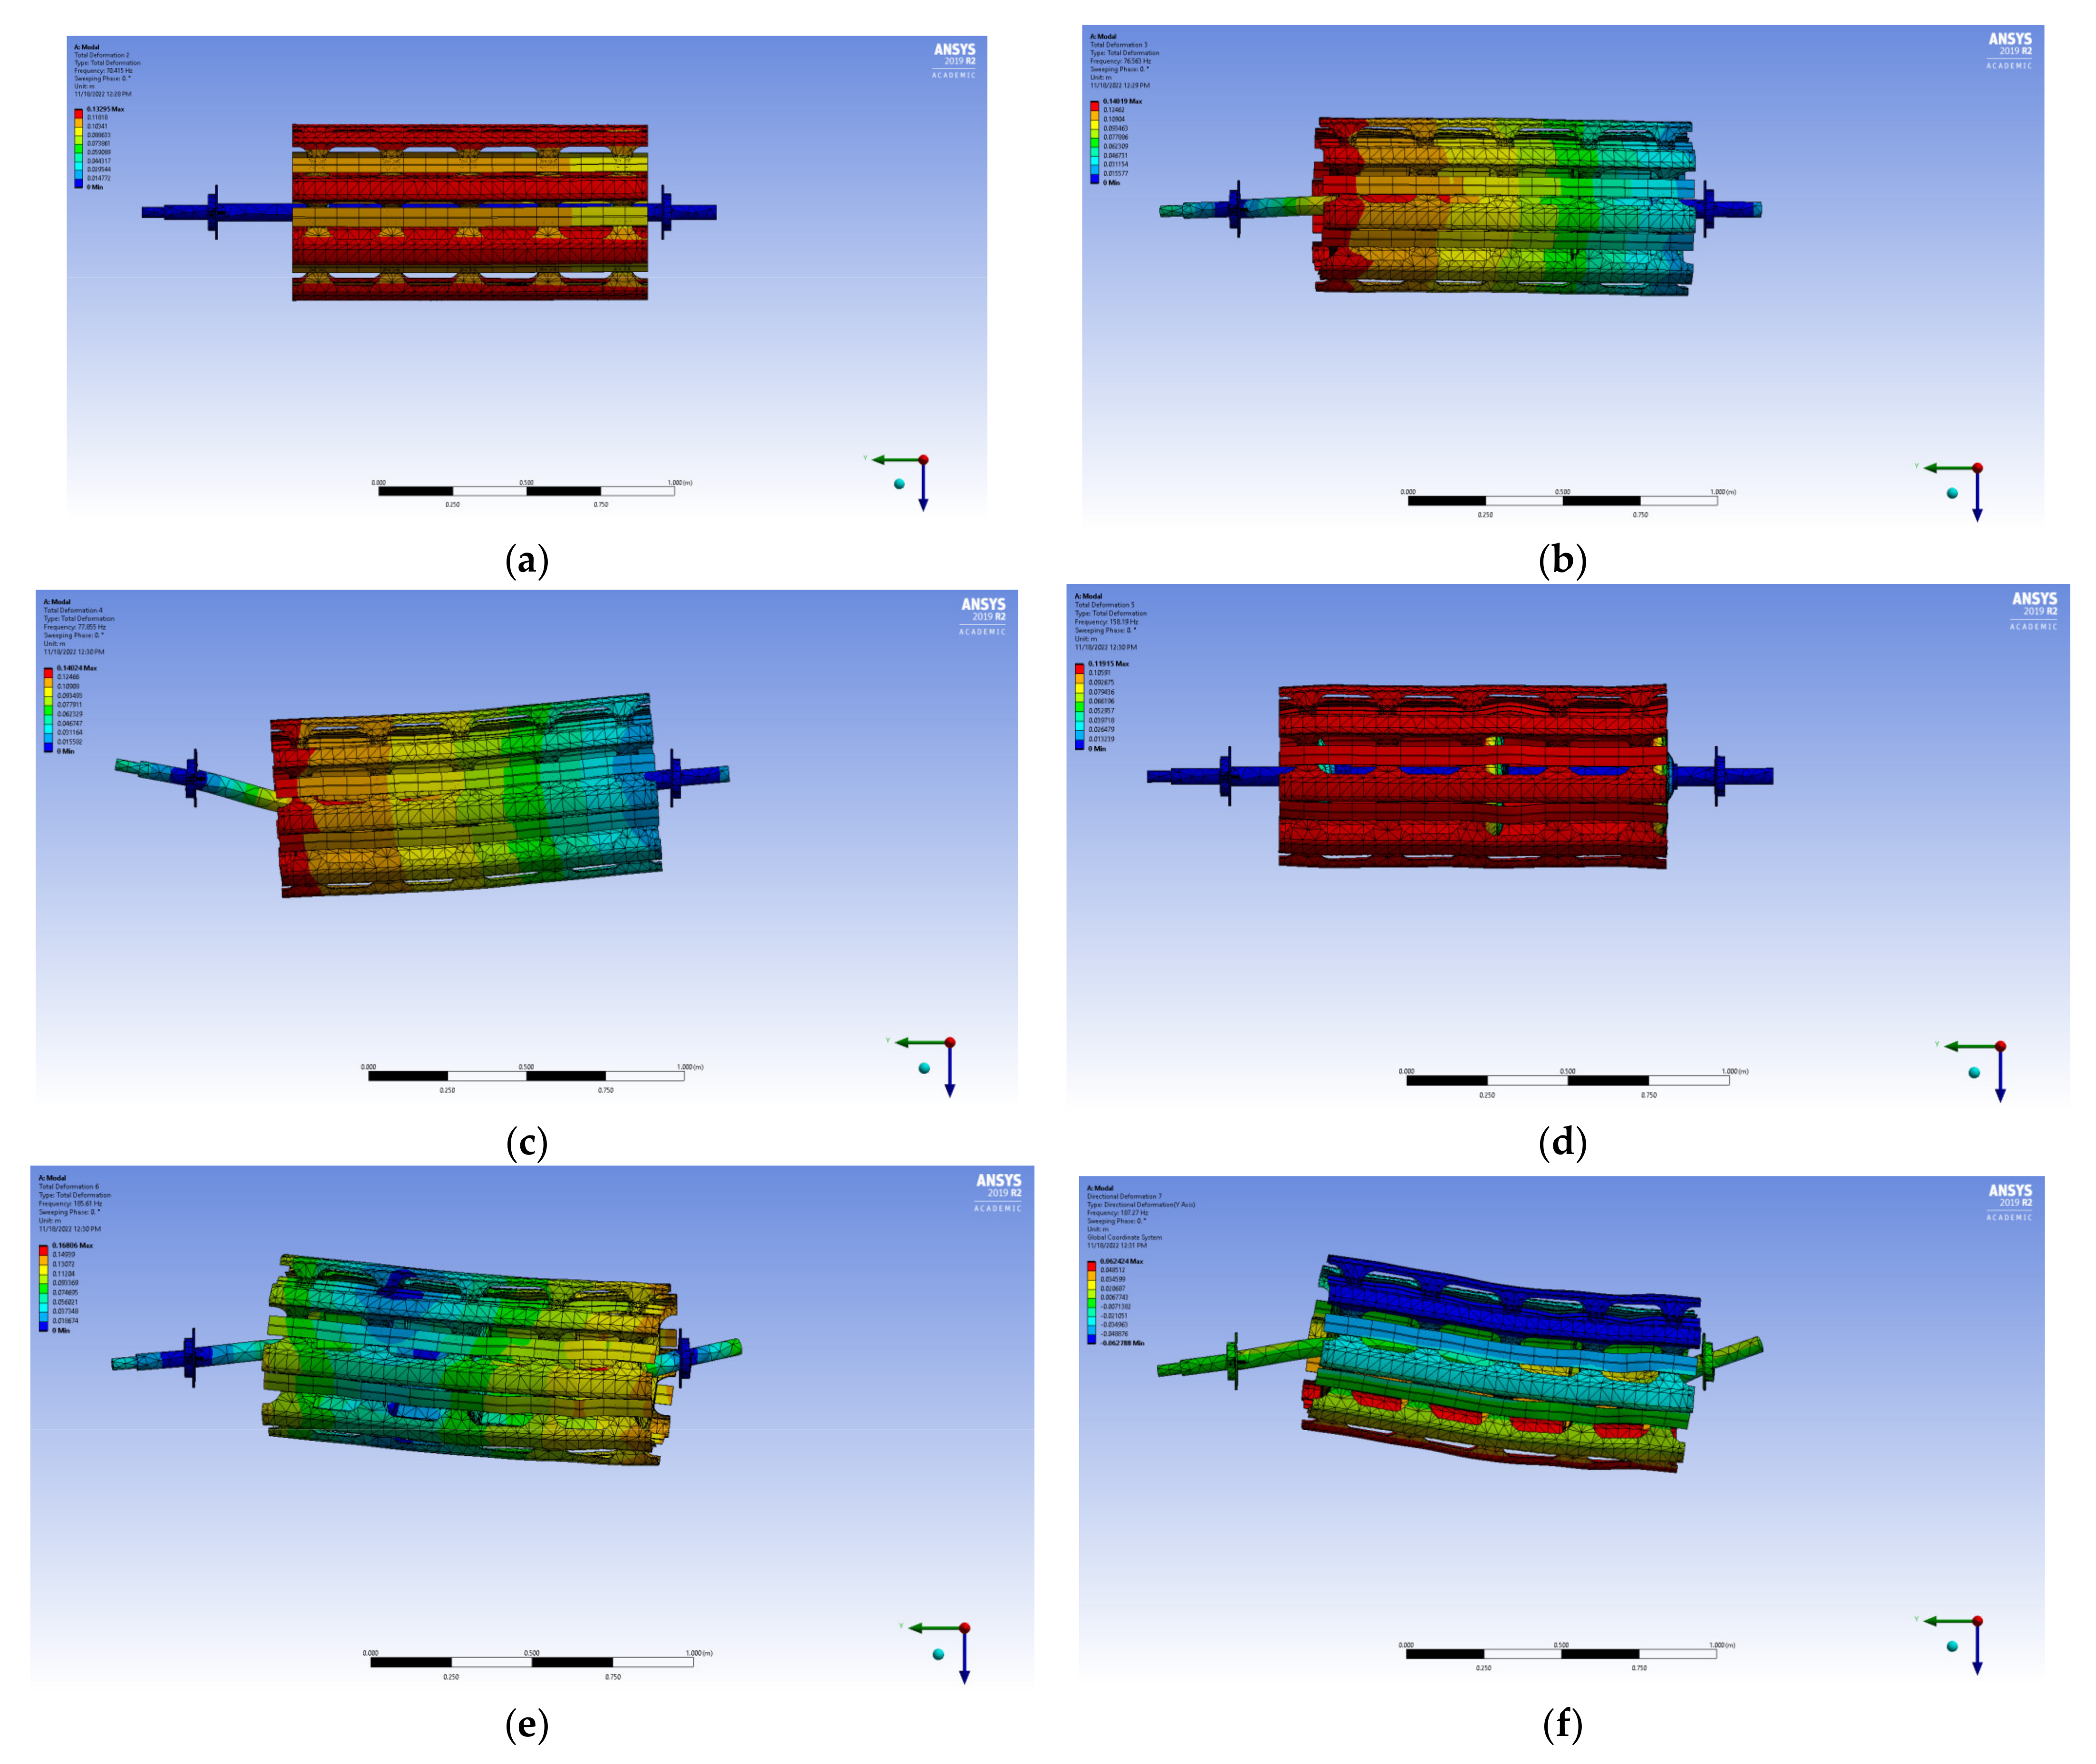
The rotational constraint of 470 RPM was imposed based on the established threshing cylinder finite element model, and the natural frequencies of the sixth-order constraint mode and the related modal shapes are presented in Figure 7. The first-order modal shape has the maximum deformation, measuring 0.123 m, occurring at the outer covers. The second-order modal shape was general bending; the maximum deformation, measuring 0.14 m, occurred at the intersection of the outer cover, inner cover, drum, and shaft. The third-order modal shape was general bending; the maximum deformation, measuring 0.14 m, occurred at the intersection of the outer cover, inner cover, drum, and shaft. The fourth-order modal shape has the maximum deformation, measuring 0.119 m, occurring at the outer covers. The fifth-order modal shape was general bending; the largest maximum deformation, measuring 0.168 m, occurred at the shaft. The sixth-order modal shape was general bending; the largest maximum deformation, measuring 0.168 m, occurred at the shaft.

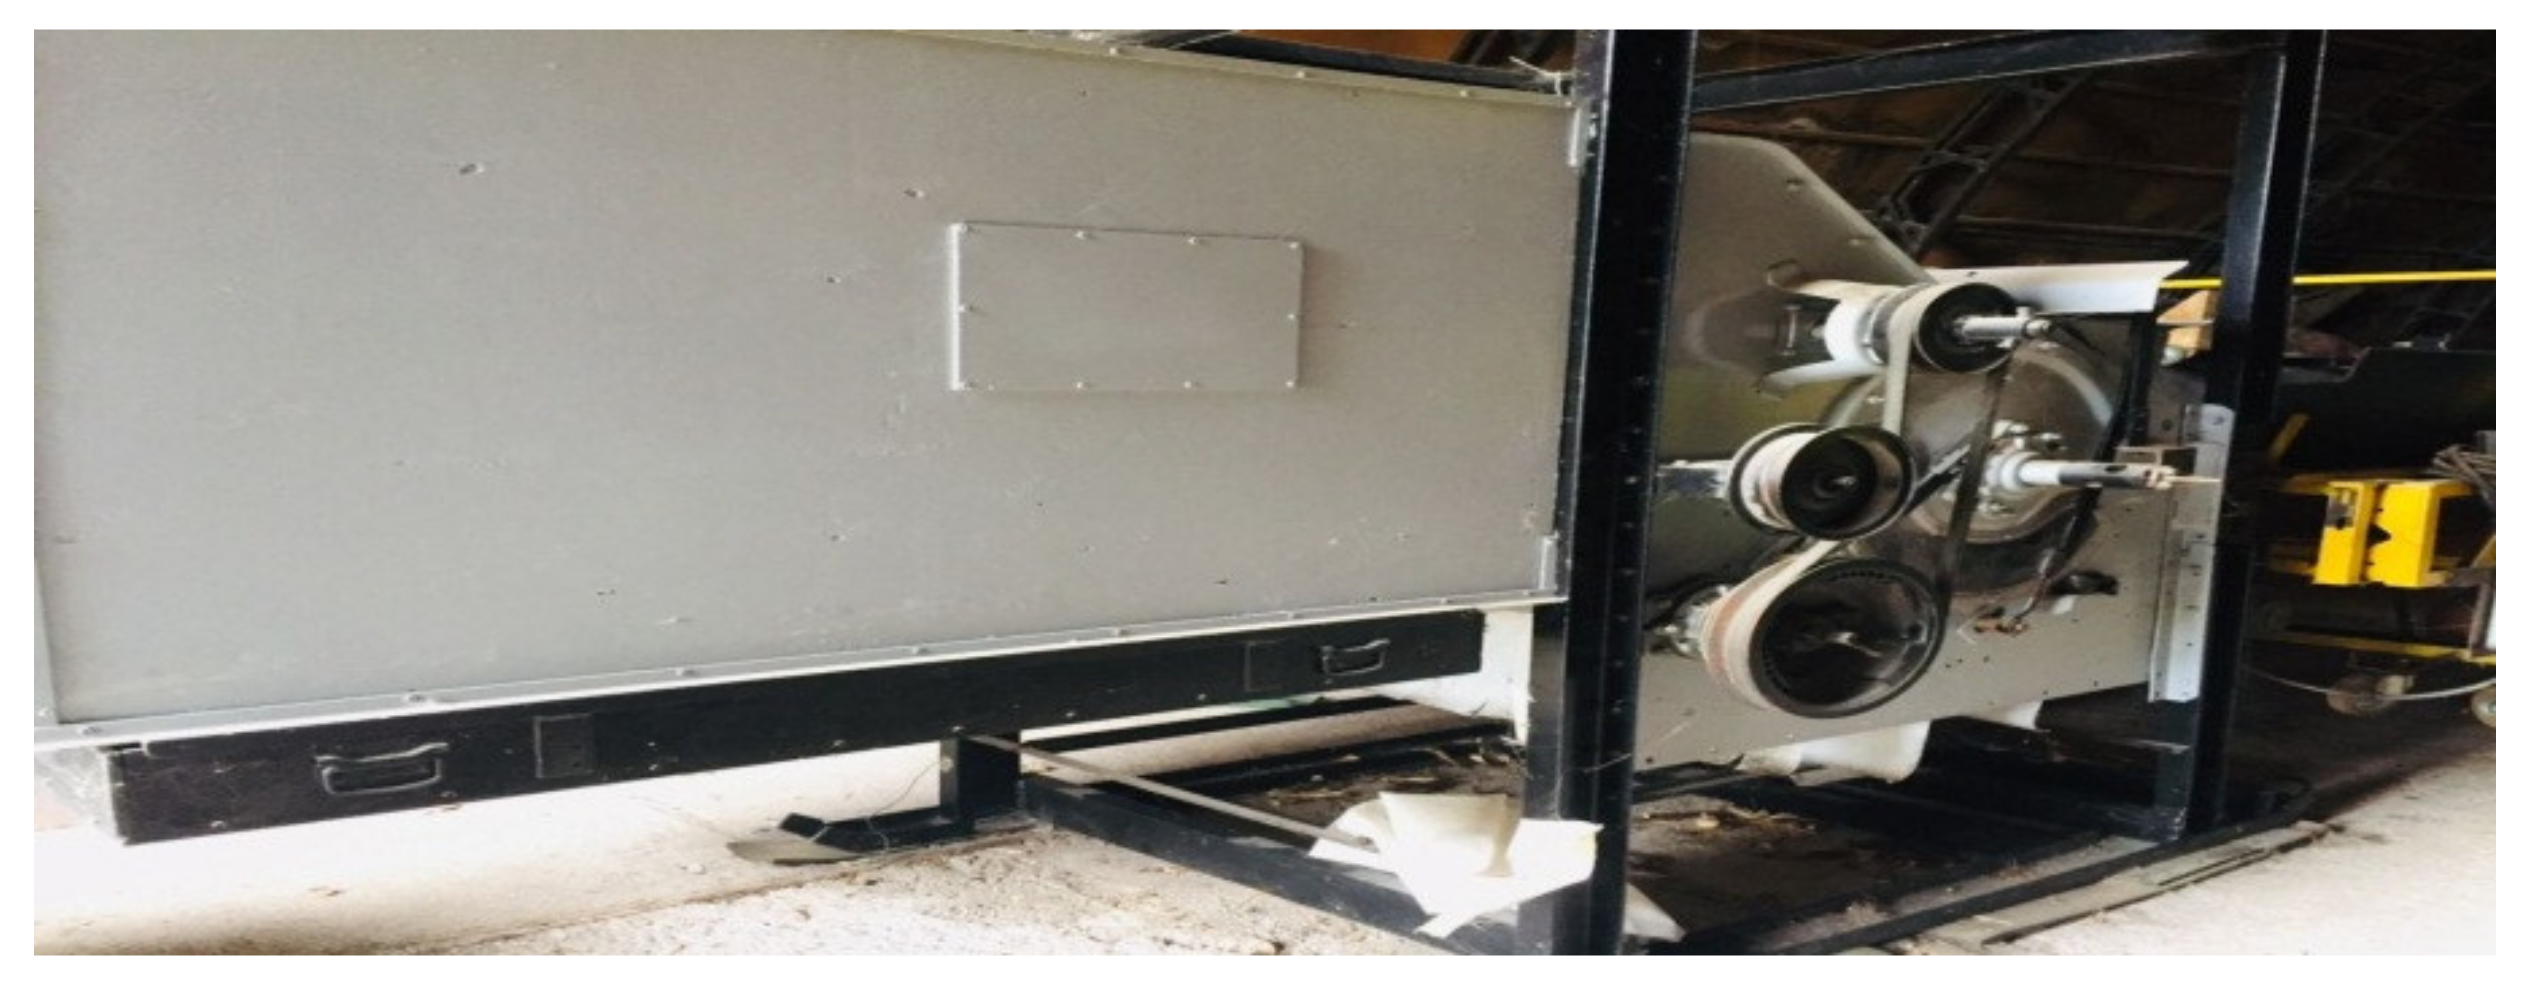
3.2. Vibration Analysis

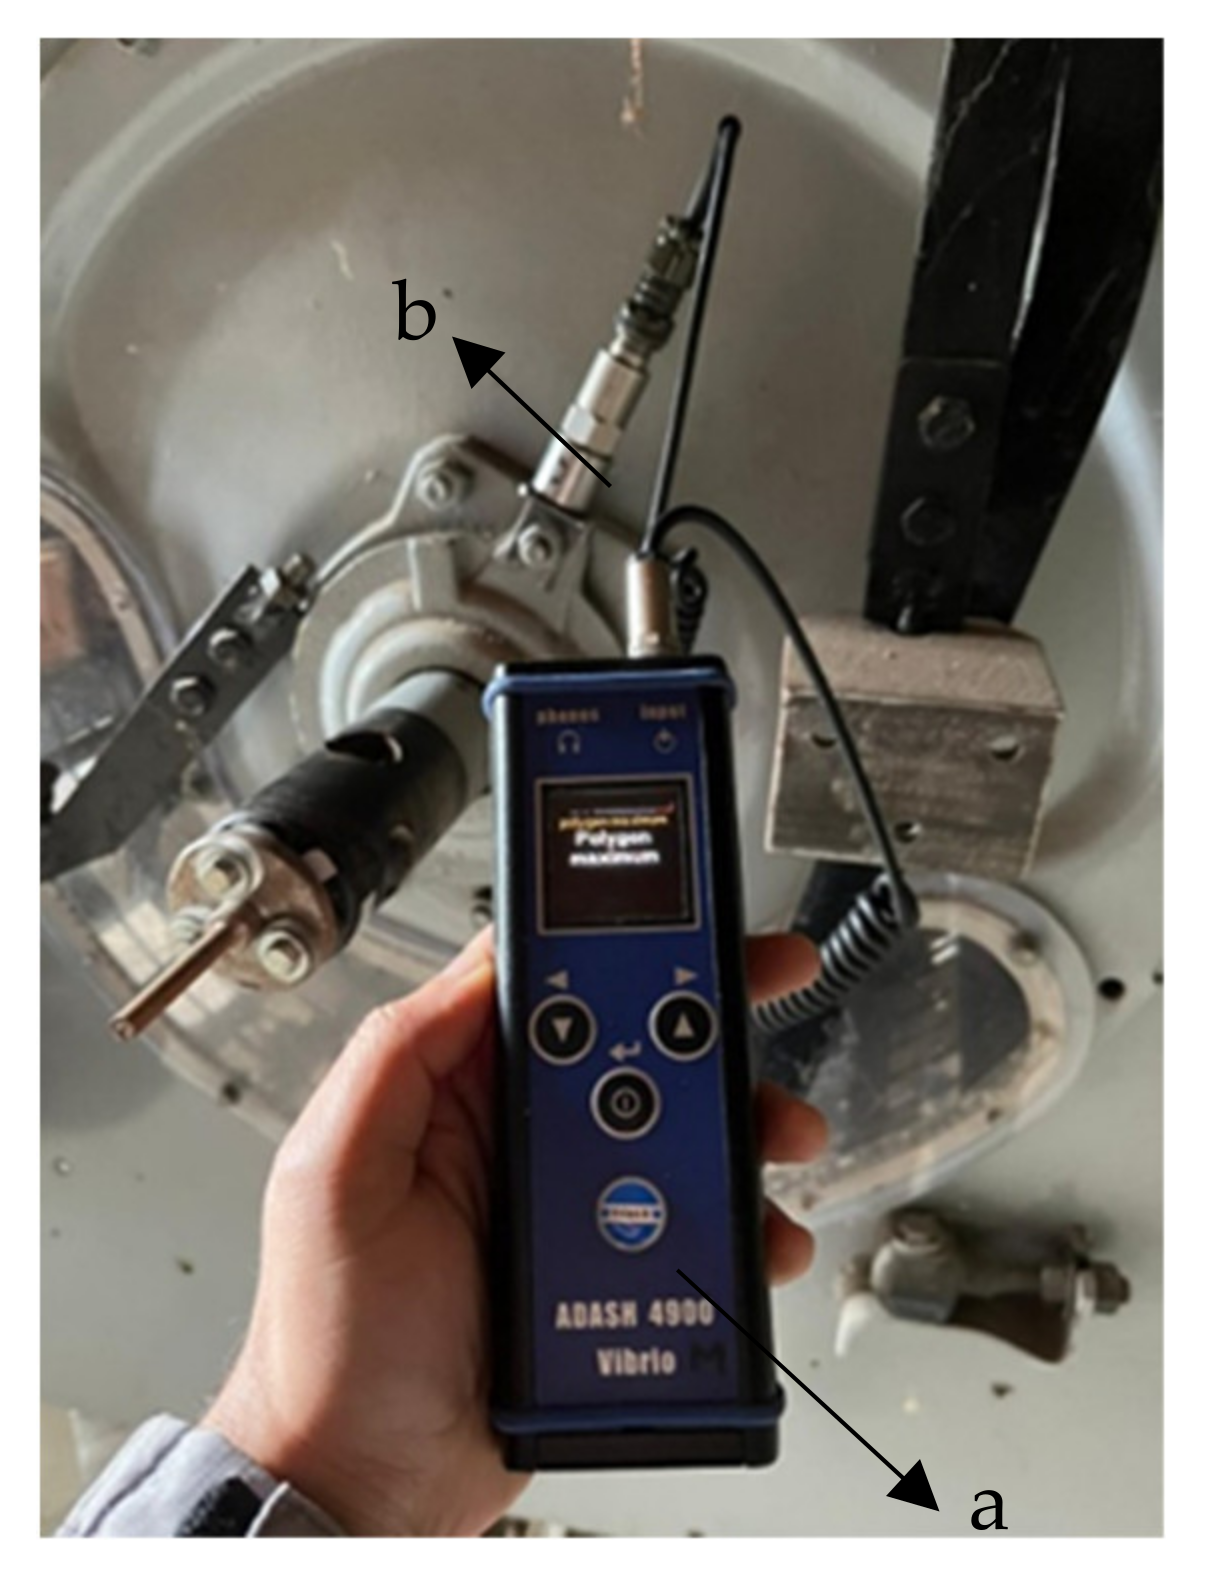
To determine the bearing vibration differences with and without a bracket, the easily accessible bearing housing of the combine harvester was selected. The measurements were performed by comparing the data. The main objective of these measurements was to develop a database to determine the differences between a measurement with the manufactured bracket and without the bracket. These results are presented in 
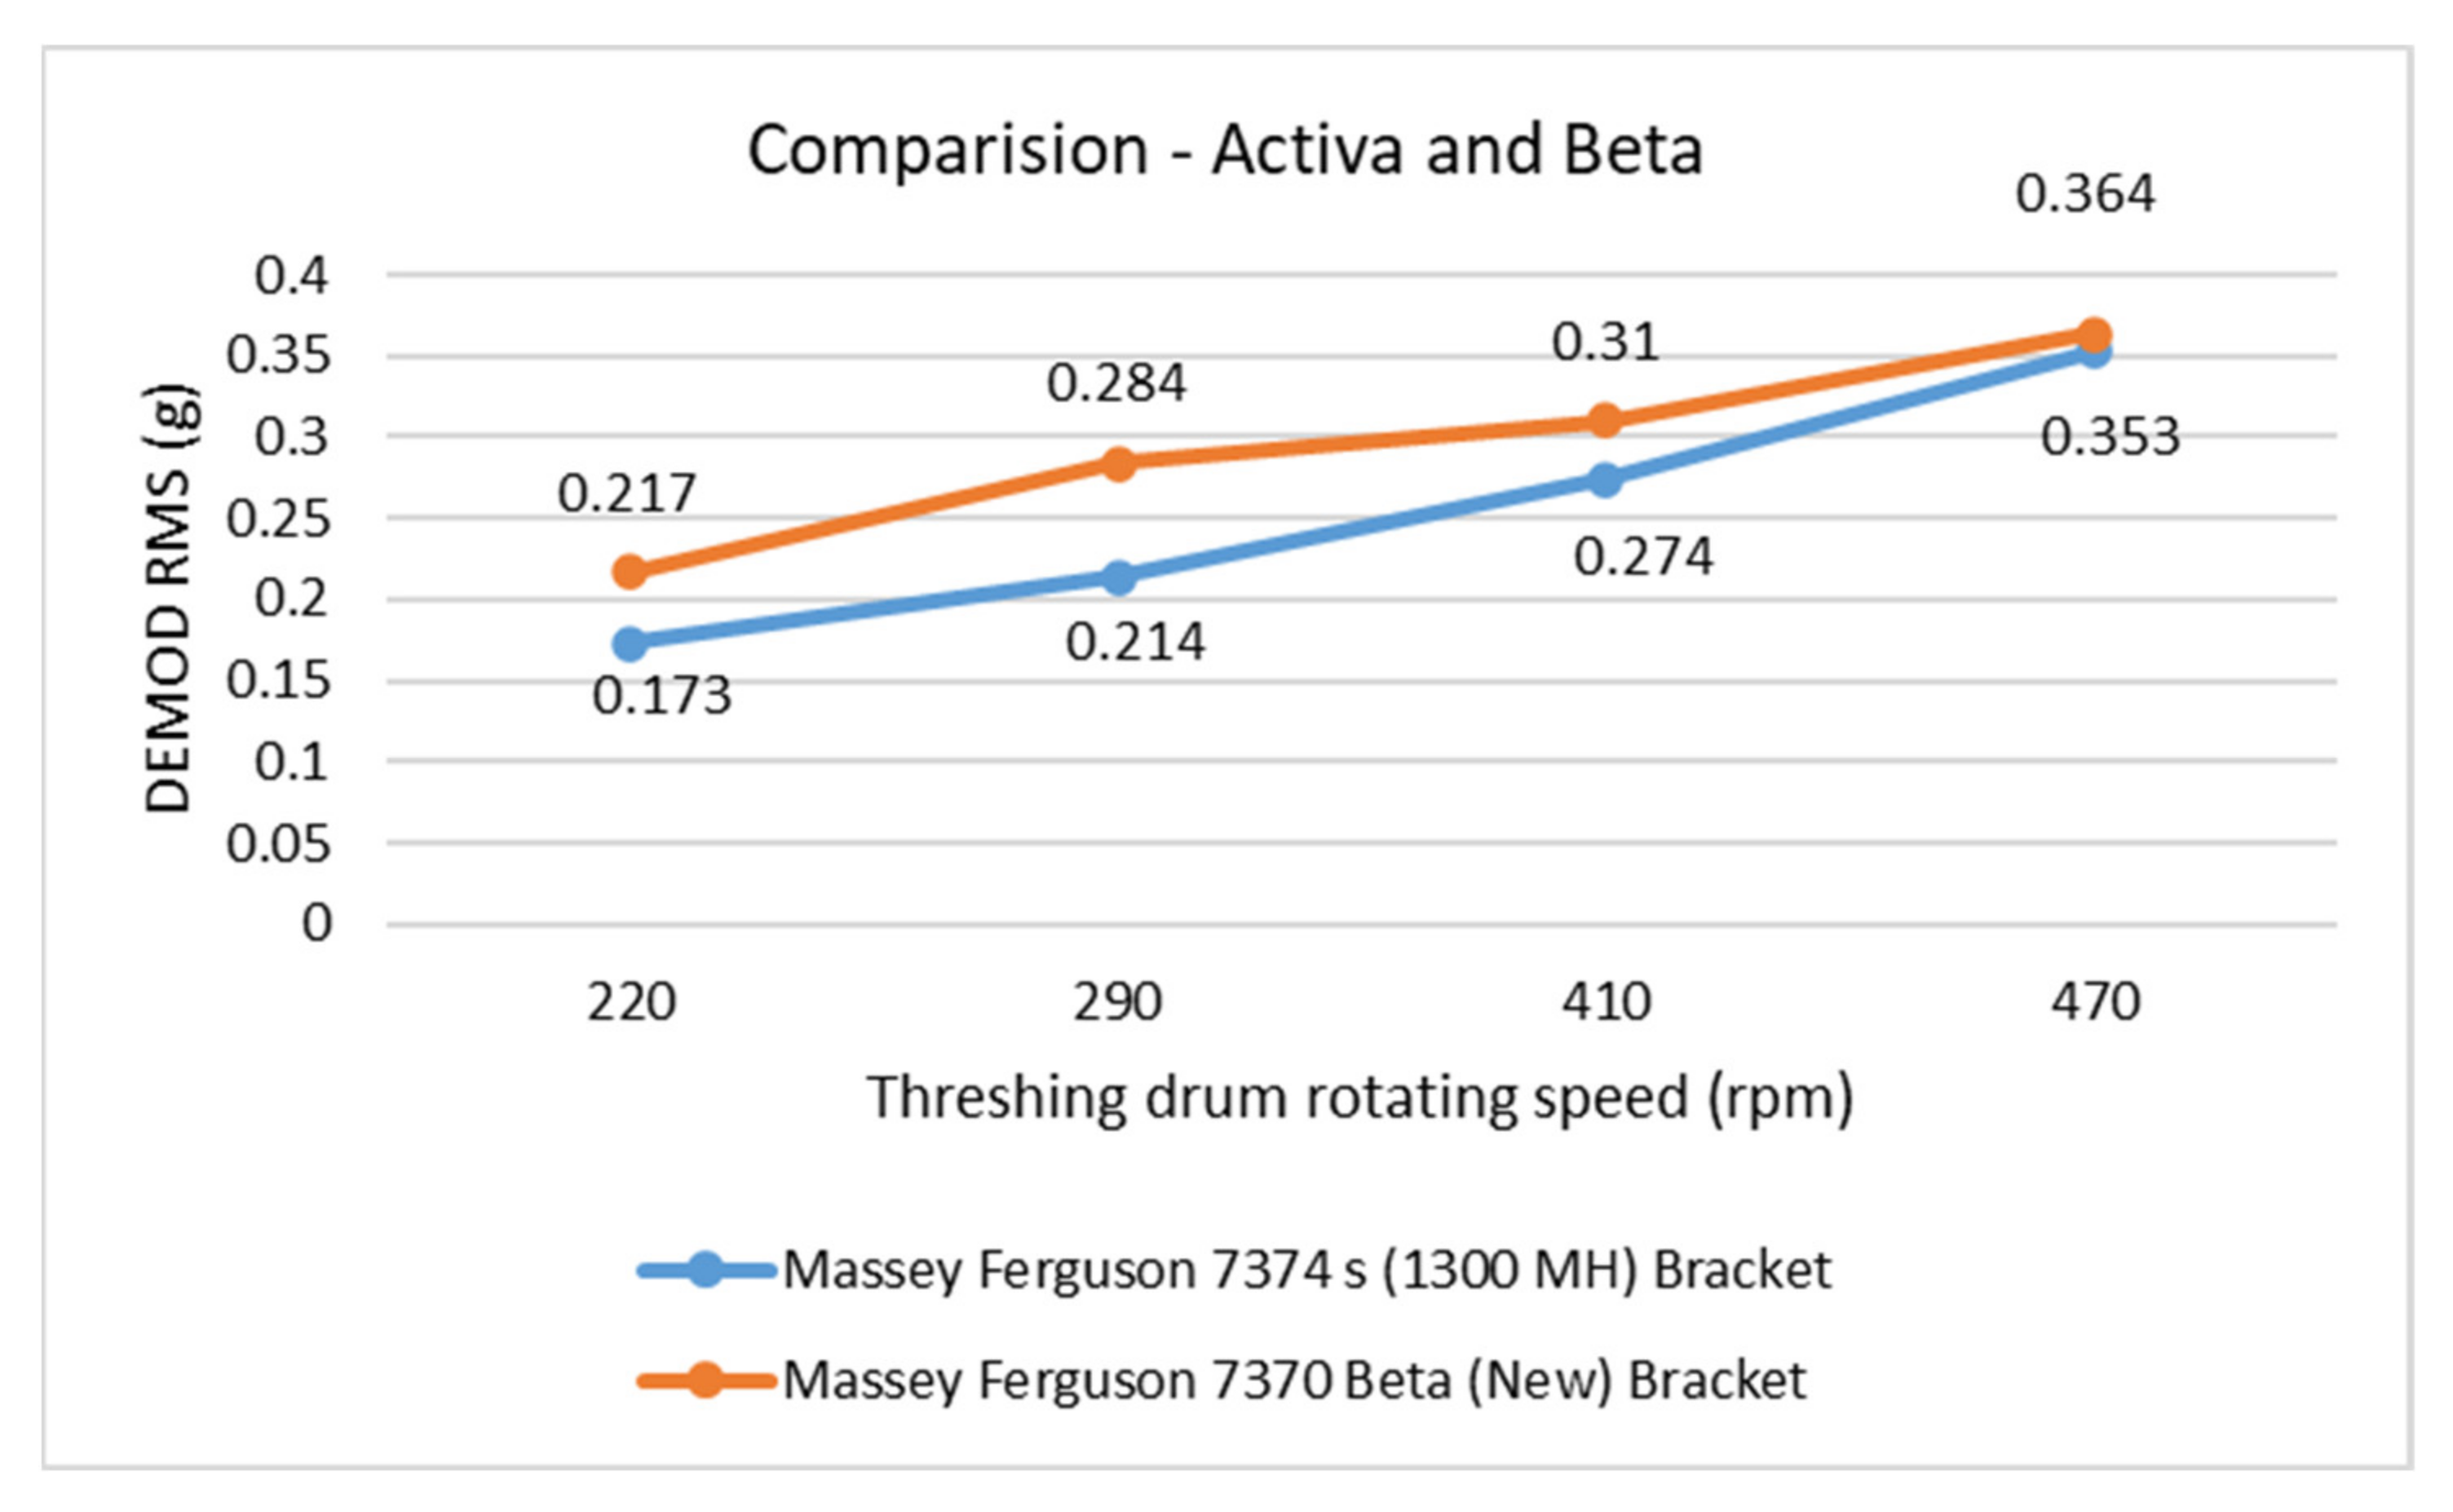
Figure 8. Also, the comparison of the measurement of Beta and Activa variants using a bracket is shown in Figure 9 where demodulated RMS value is slightly higher for the Beta version due to higher loads and dimensions compared to the Activa version.
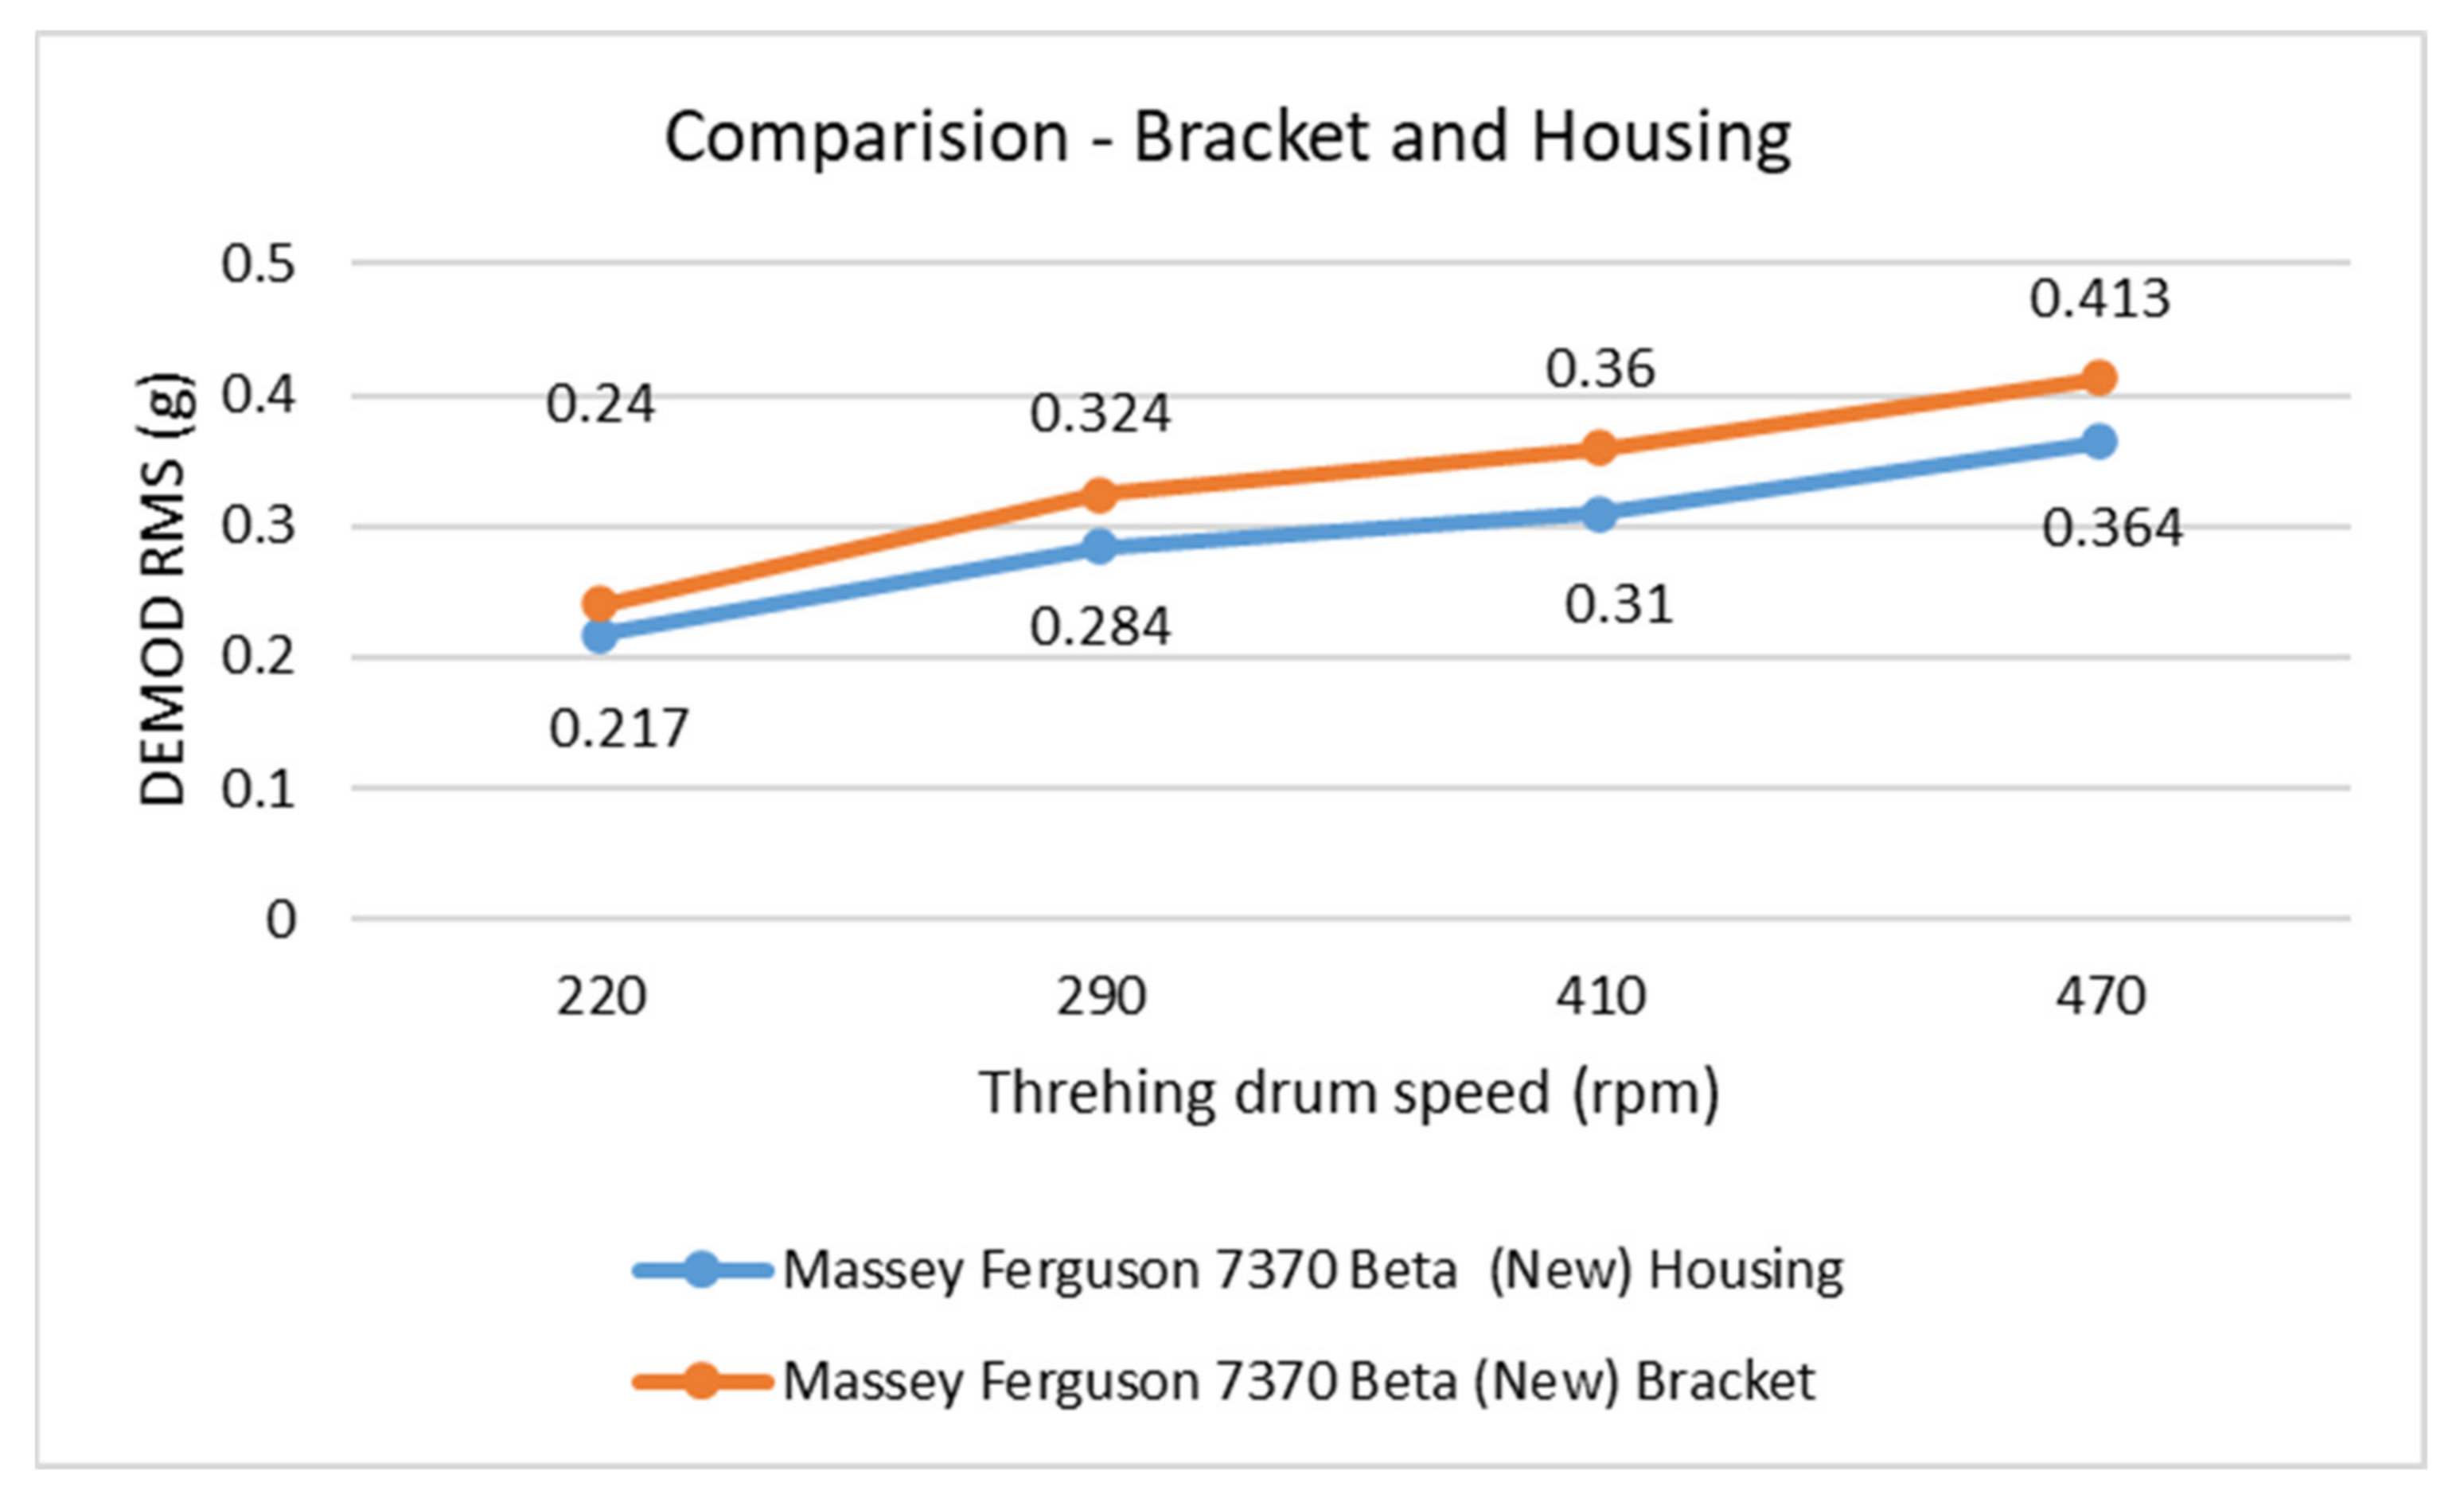
As the demodulated RMS is responsible for the evaluation of the bearing conditions, the difference between when the accelerometer is mounted in housing compared to on the bracket is analyzed, which is up to 16.13% increased for the data measured on the bracket compared to those on the housing, as shown in Figure 8. The metal bracket can therefore be utilized to help with the vibration measurements of the threshing drum bearings if it is properly fitted in specific spots. The demodulated RMS value increases with respect to the speed for both conditions, which satisfies the proper vibration measurement.
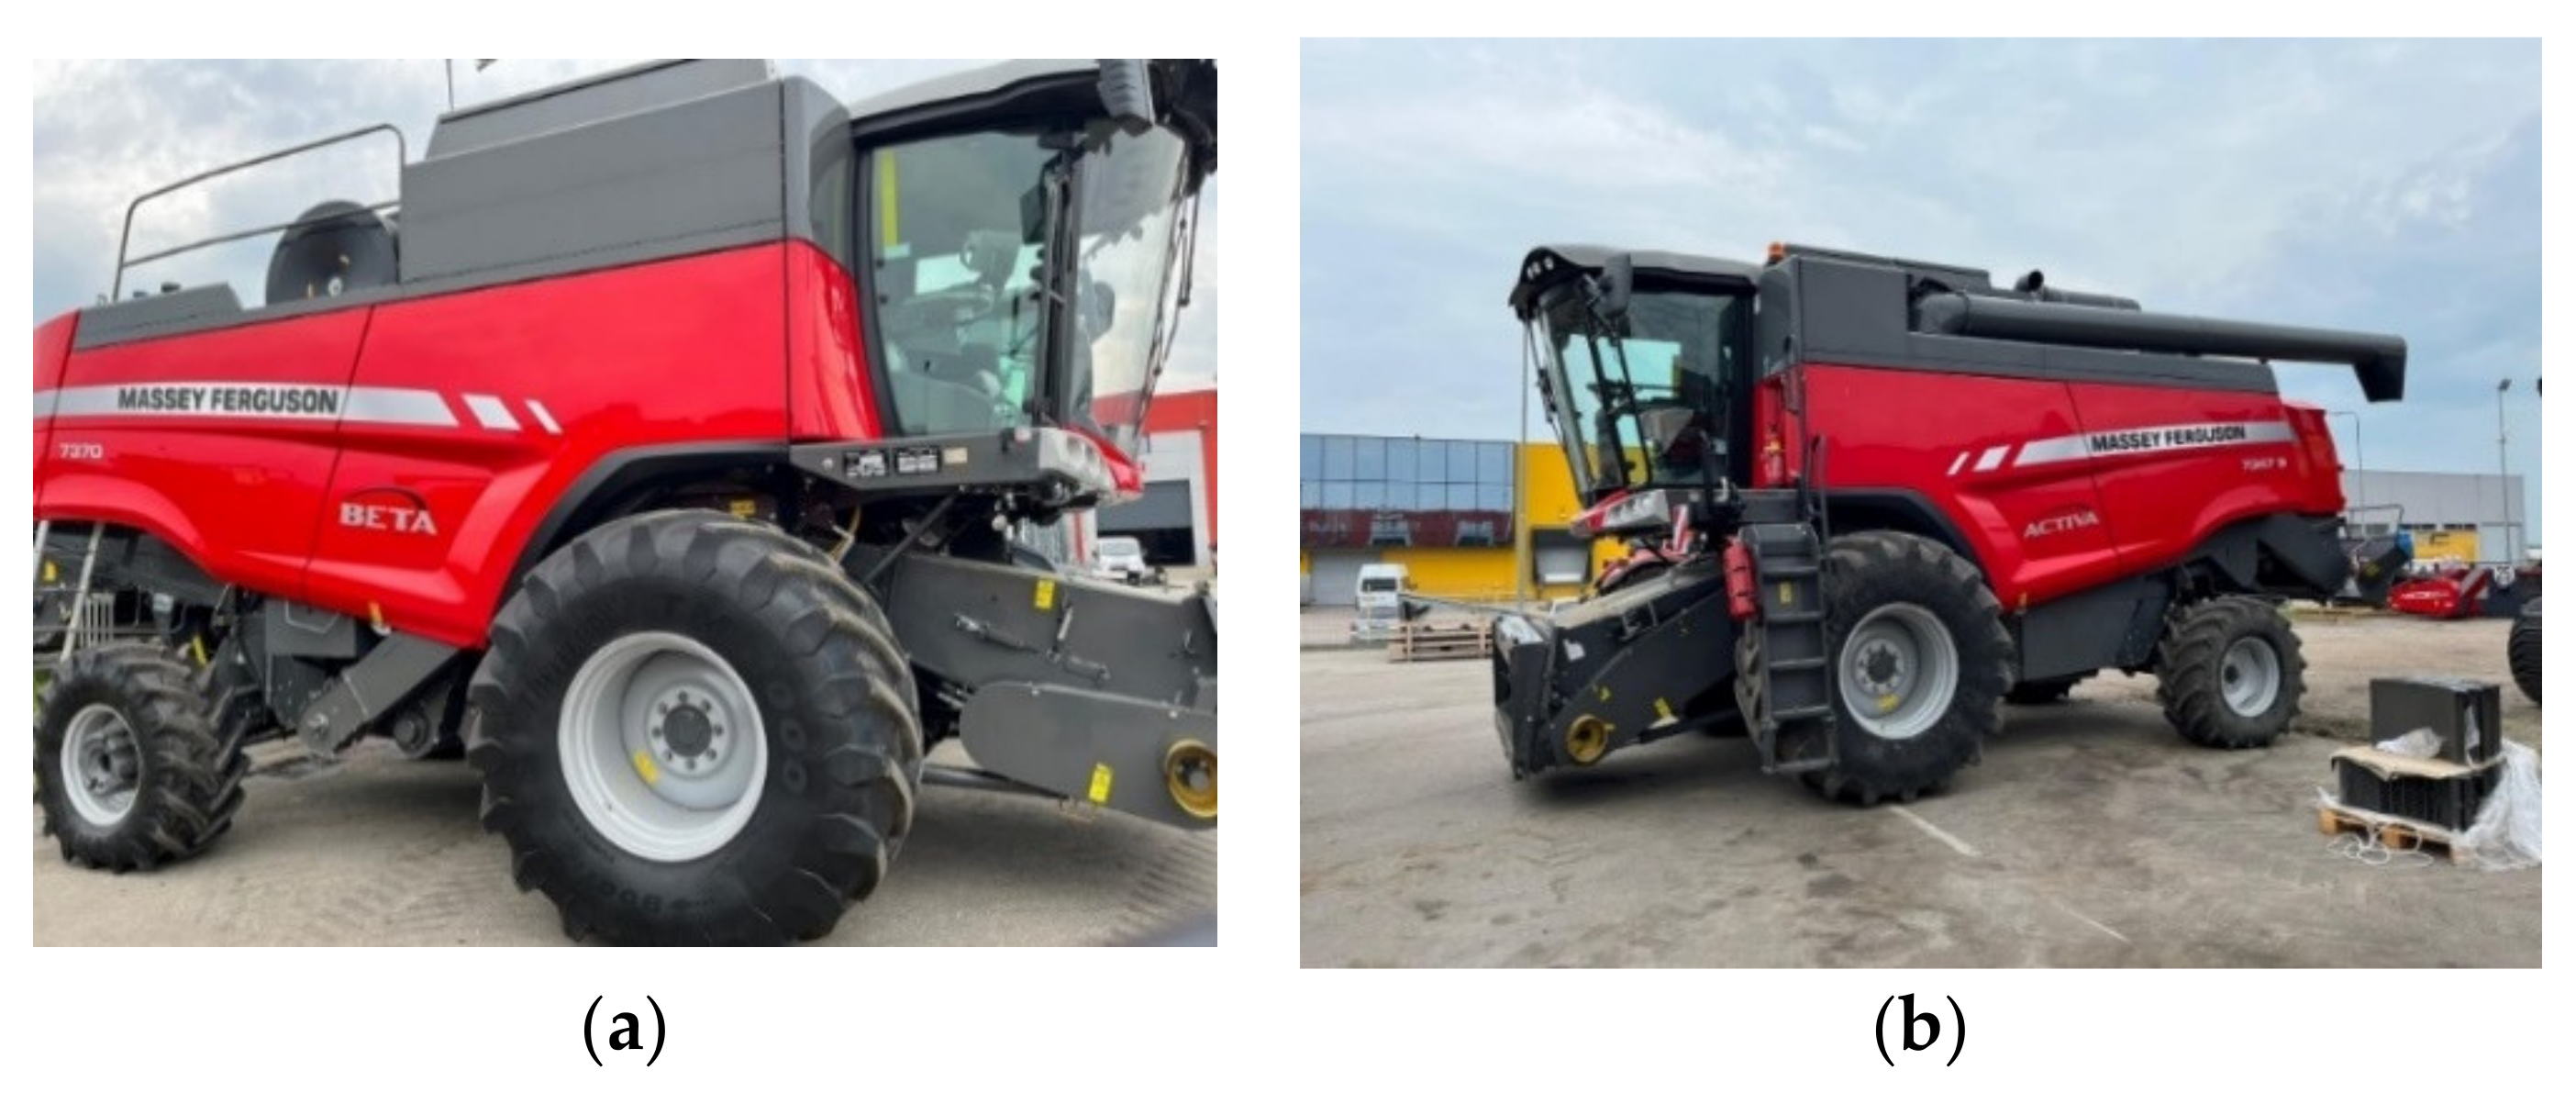
The demodulated RMS (g) values are compared between the two versions of the Massey Ferguson (Figure 10) as the constructions are with some changes in shaft and drum dimensions, as shown in Table 1 and 
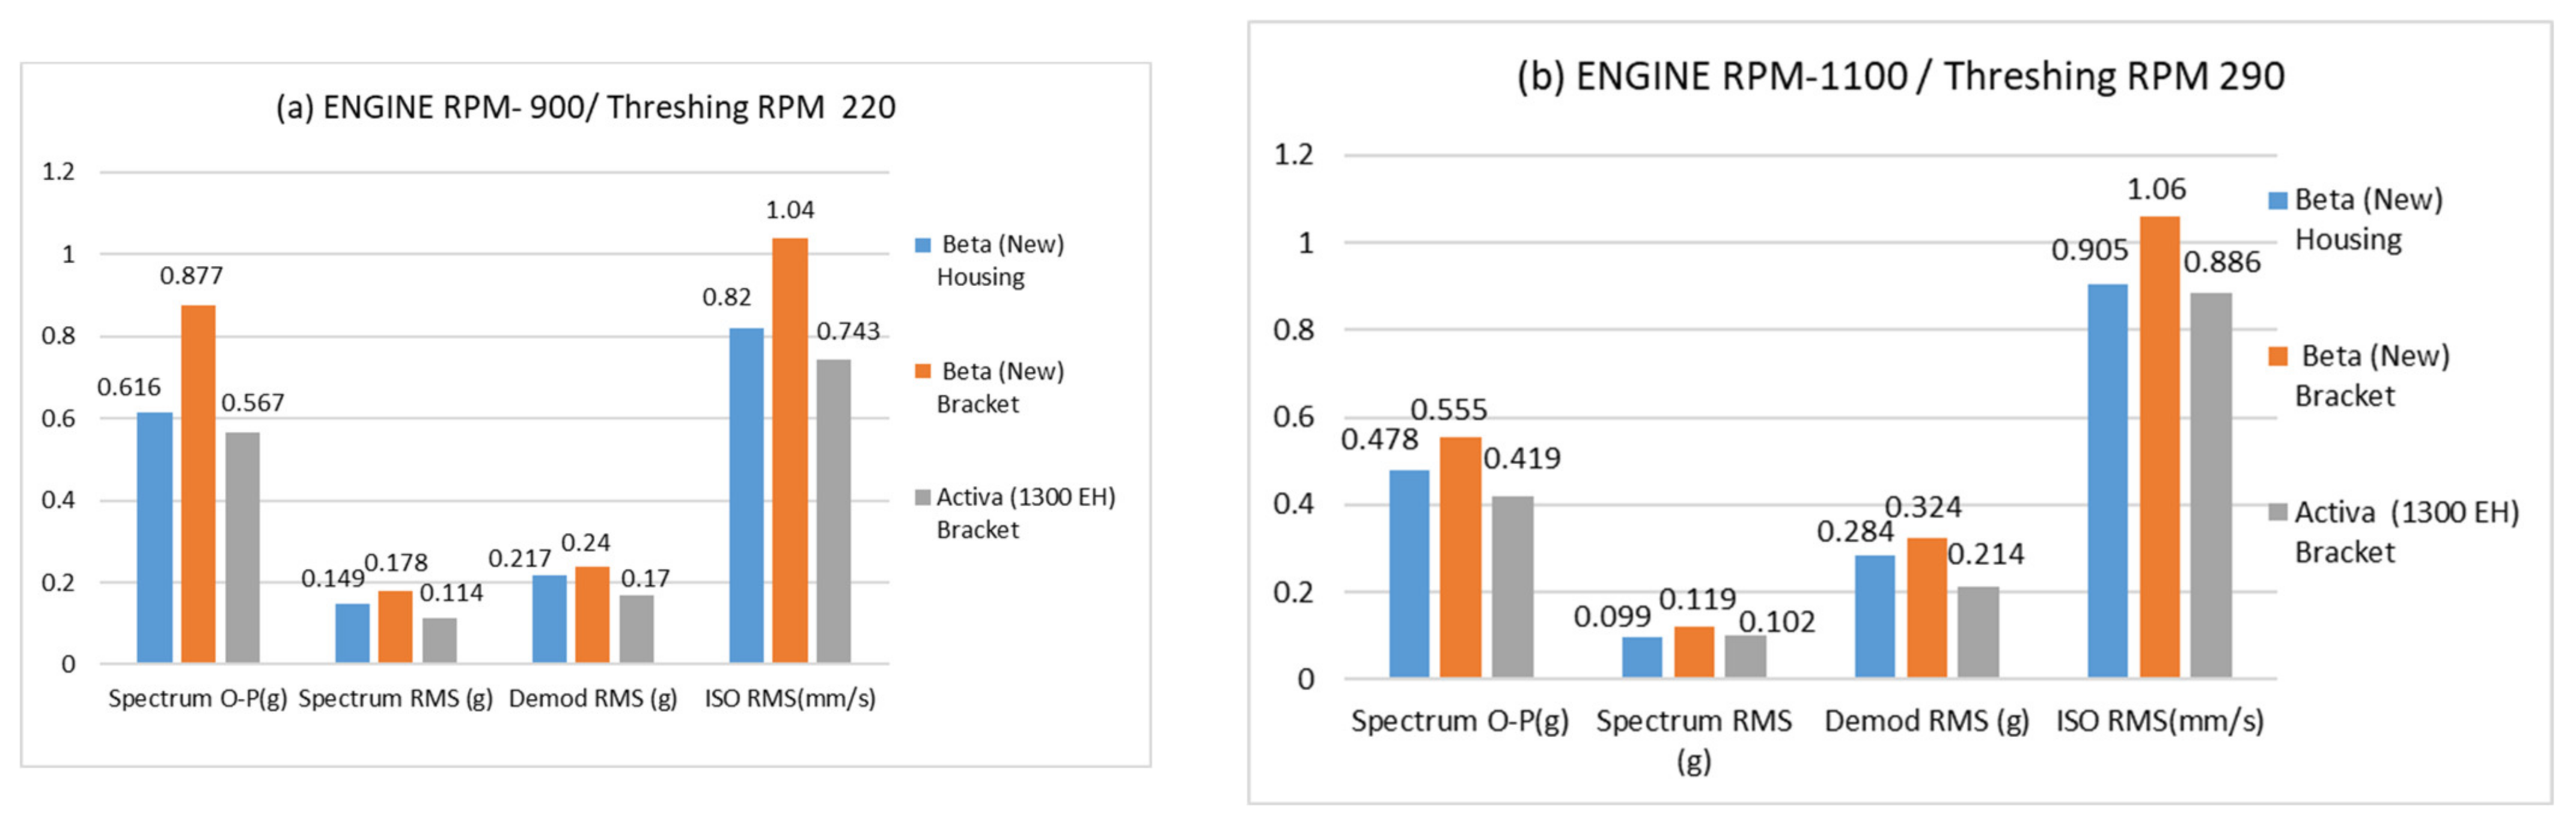
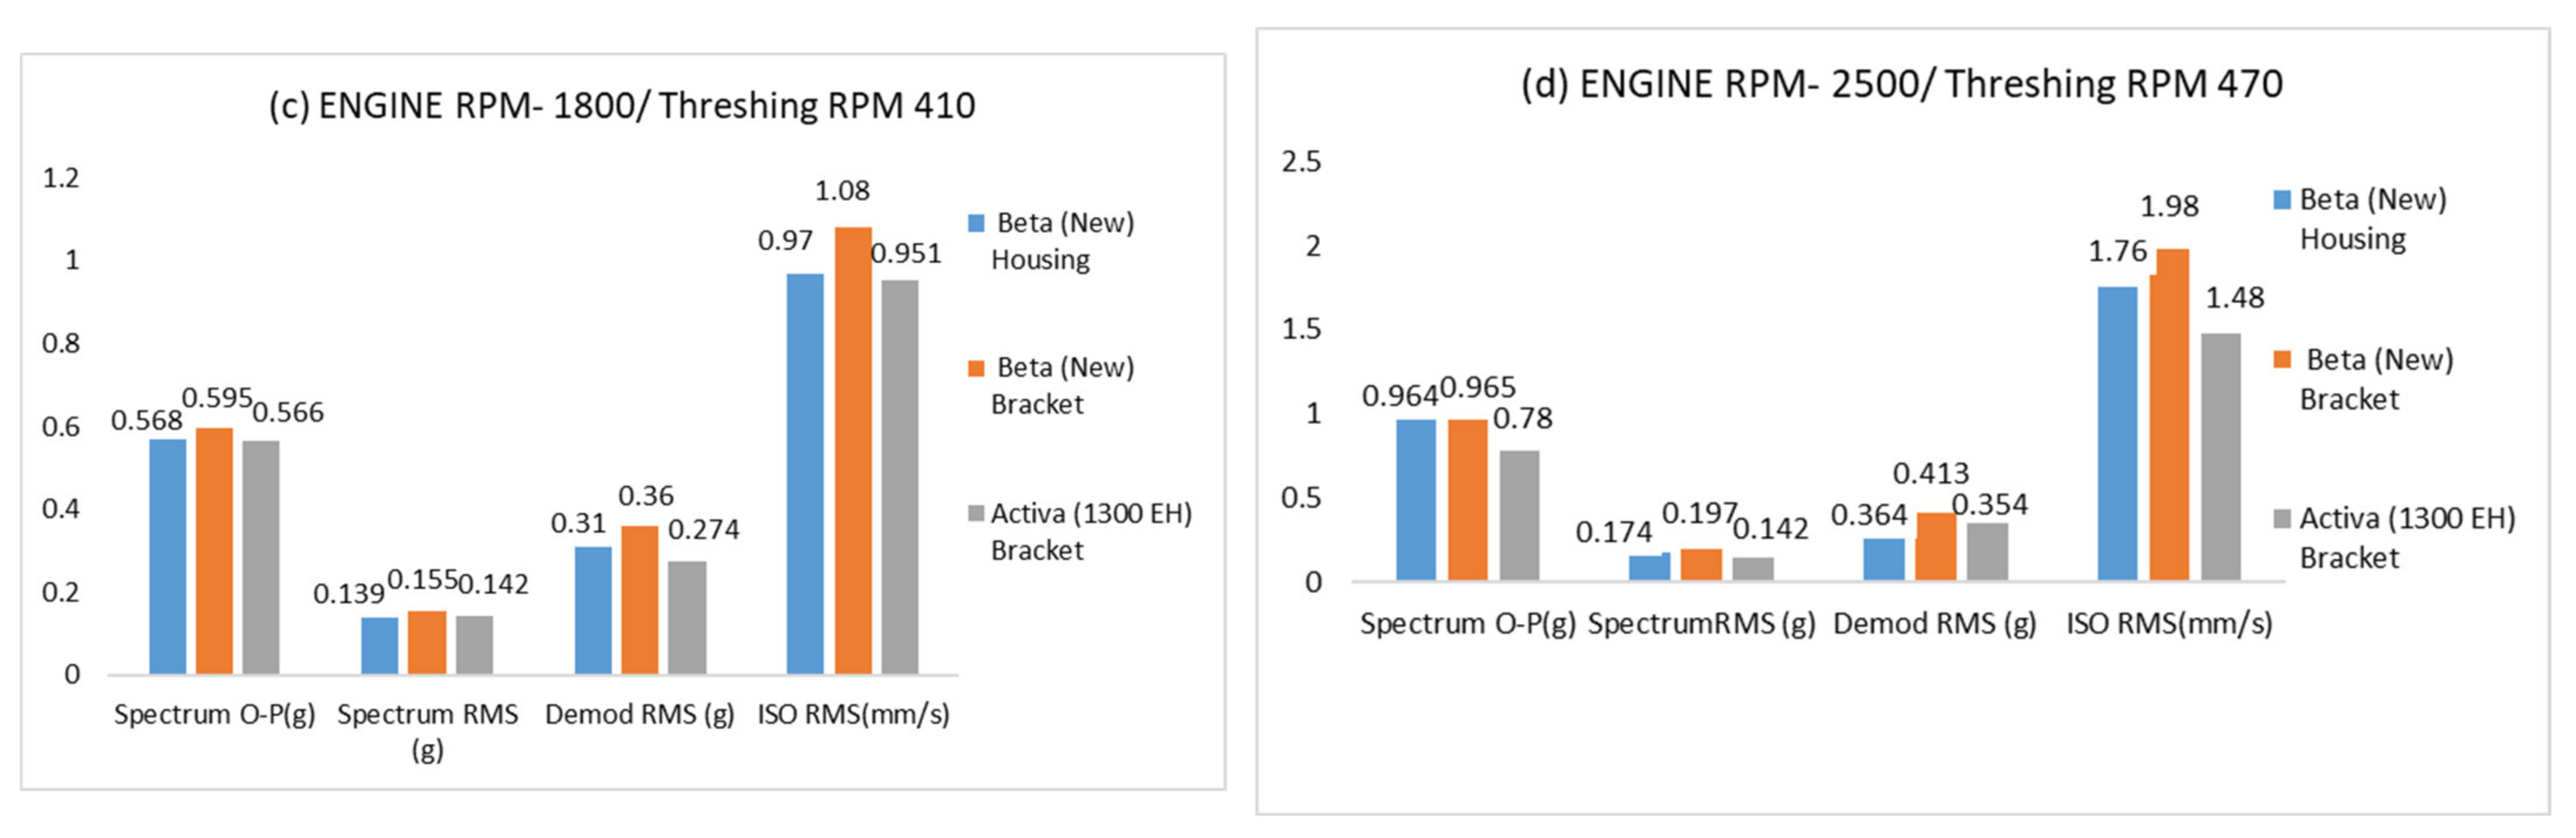
Table 2. The recorded value increases with the speed and is higher for the new Massey Ferguson 7374 s (1300 EH), which satisfies the condition as the dimensions of the threshing units such as the drum and shaft are larger compared to the Activa version. The comparison of the vibration measurement is collectively analyzed in the Activa and Beta versions with and without bracket with the vibration analysis parameters, as shown in Figure 5. The difference in the vibration measurement was compared in the Beta (New) version and Activa version with the vibration parameters such as the spectrum (0-P, g), spectrum (RMS, g), demodulated RMS (g), and velocity RMS (g). The recorded vibration data show a higher magnitude with the bracket measurement compared to the housing measurement in the Beta version. As the threshing unit of both combine harvesters was similar in construction with a similar bearing, the recorded data were compared with both harvesters when measured on a bracket. The maximum amplitude was obtained for the new Beta version as the dimension is higher which results in a larger radial load and high vibration magnitude.
To study the bearing used in both combine harvesters, the demodulated FFT was considered for both variants of combine harvester when the measurement was taken with the bracket and housing for the Beta version and just with the bracket for the Activa version. The fundamental frequency was obtained from the DDS Adash bearing library and verified from the SKF catalog for bearing 6310 (SKF, Gothenburg, Sweden), as shown in Table 3. Multiplying the rotational speed of the threshing drum with the fundamental frequencies of the bearing gives fault frequencies for different operating speeds.
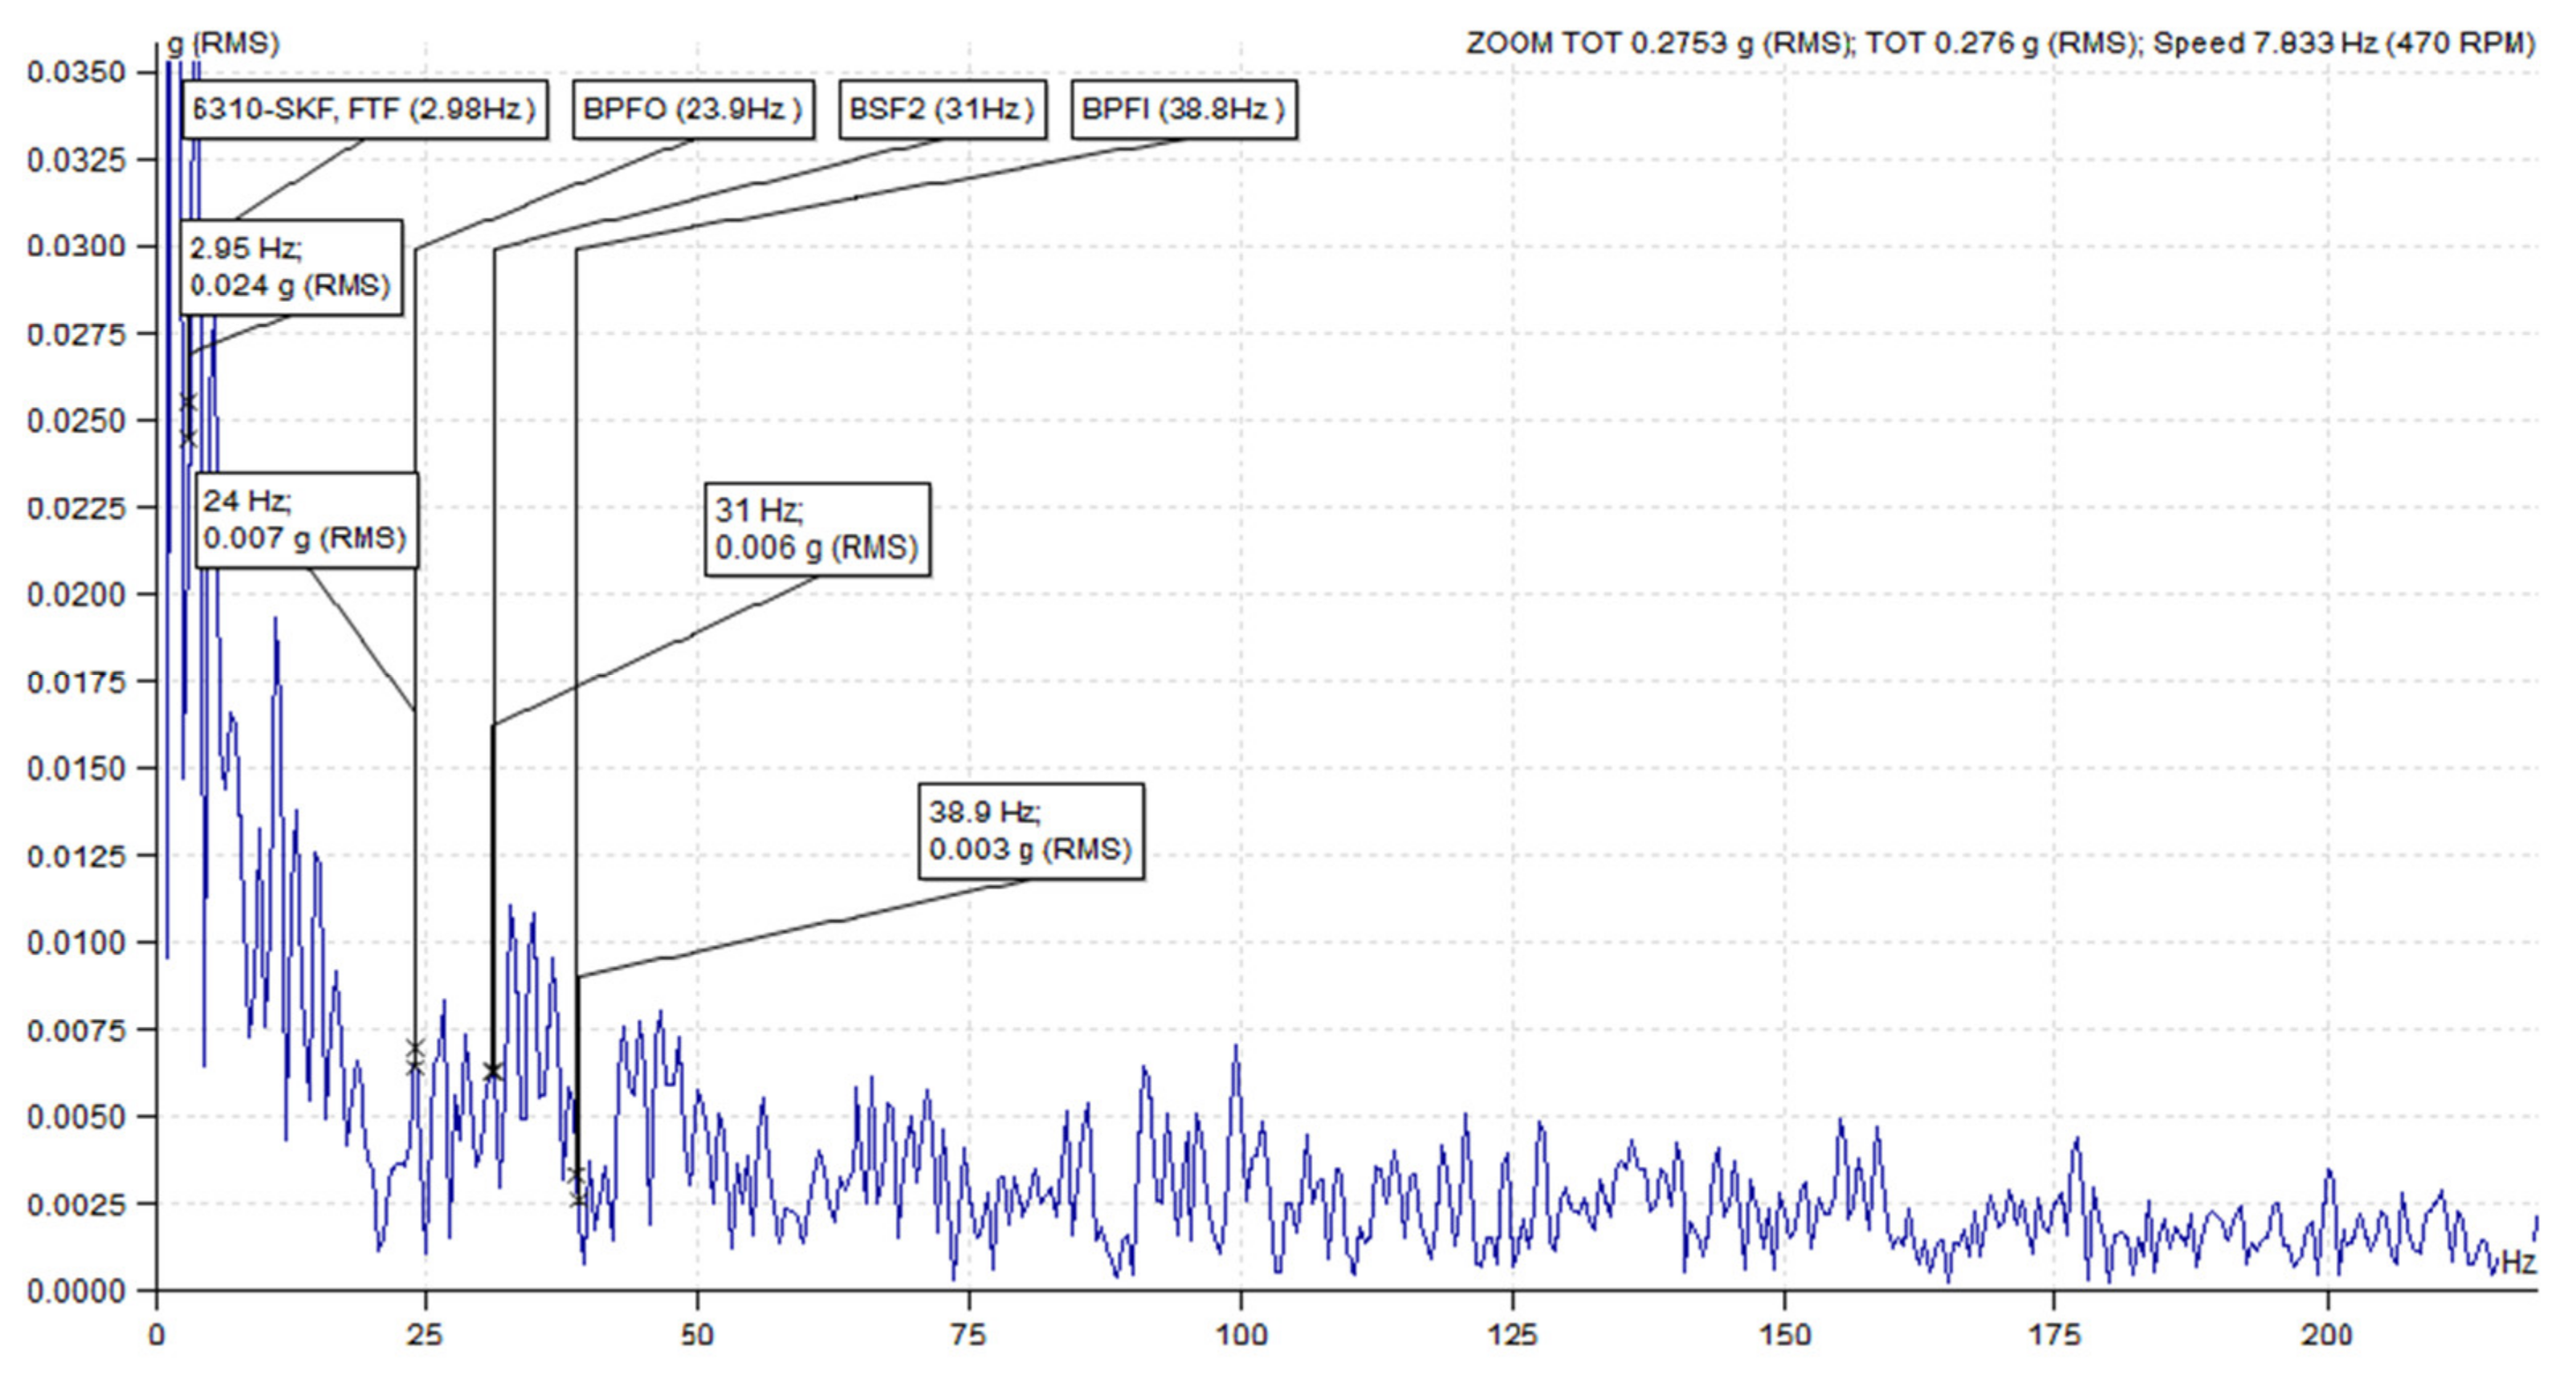
Peak amplitude is under the noise threshold for envelope analysis. The demodulated FFT spectrum with an amplitude RMS(g) and a threshing speed of 470 RPM for bearing failure frequencies FTF (2.98 Hz, 0.024 g), BPFO (23.9 Hz, 0.007 g), BSF (31 Hz, 0.006 g), and BPFI (38.8 Hz, 0.003 Hz) were measured (Figure 11). The higher RMS values should be as near to zero as possible when being assessed.
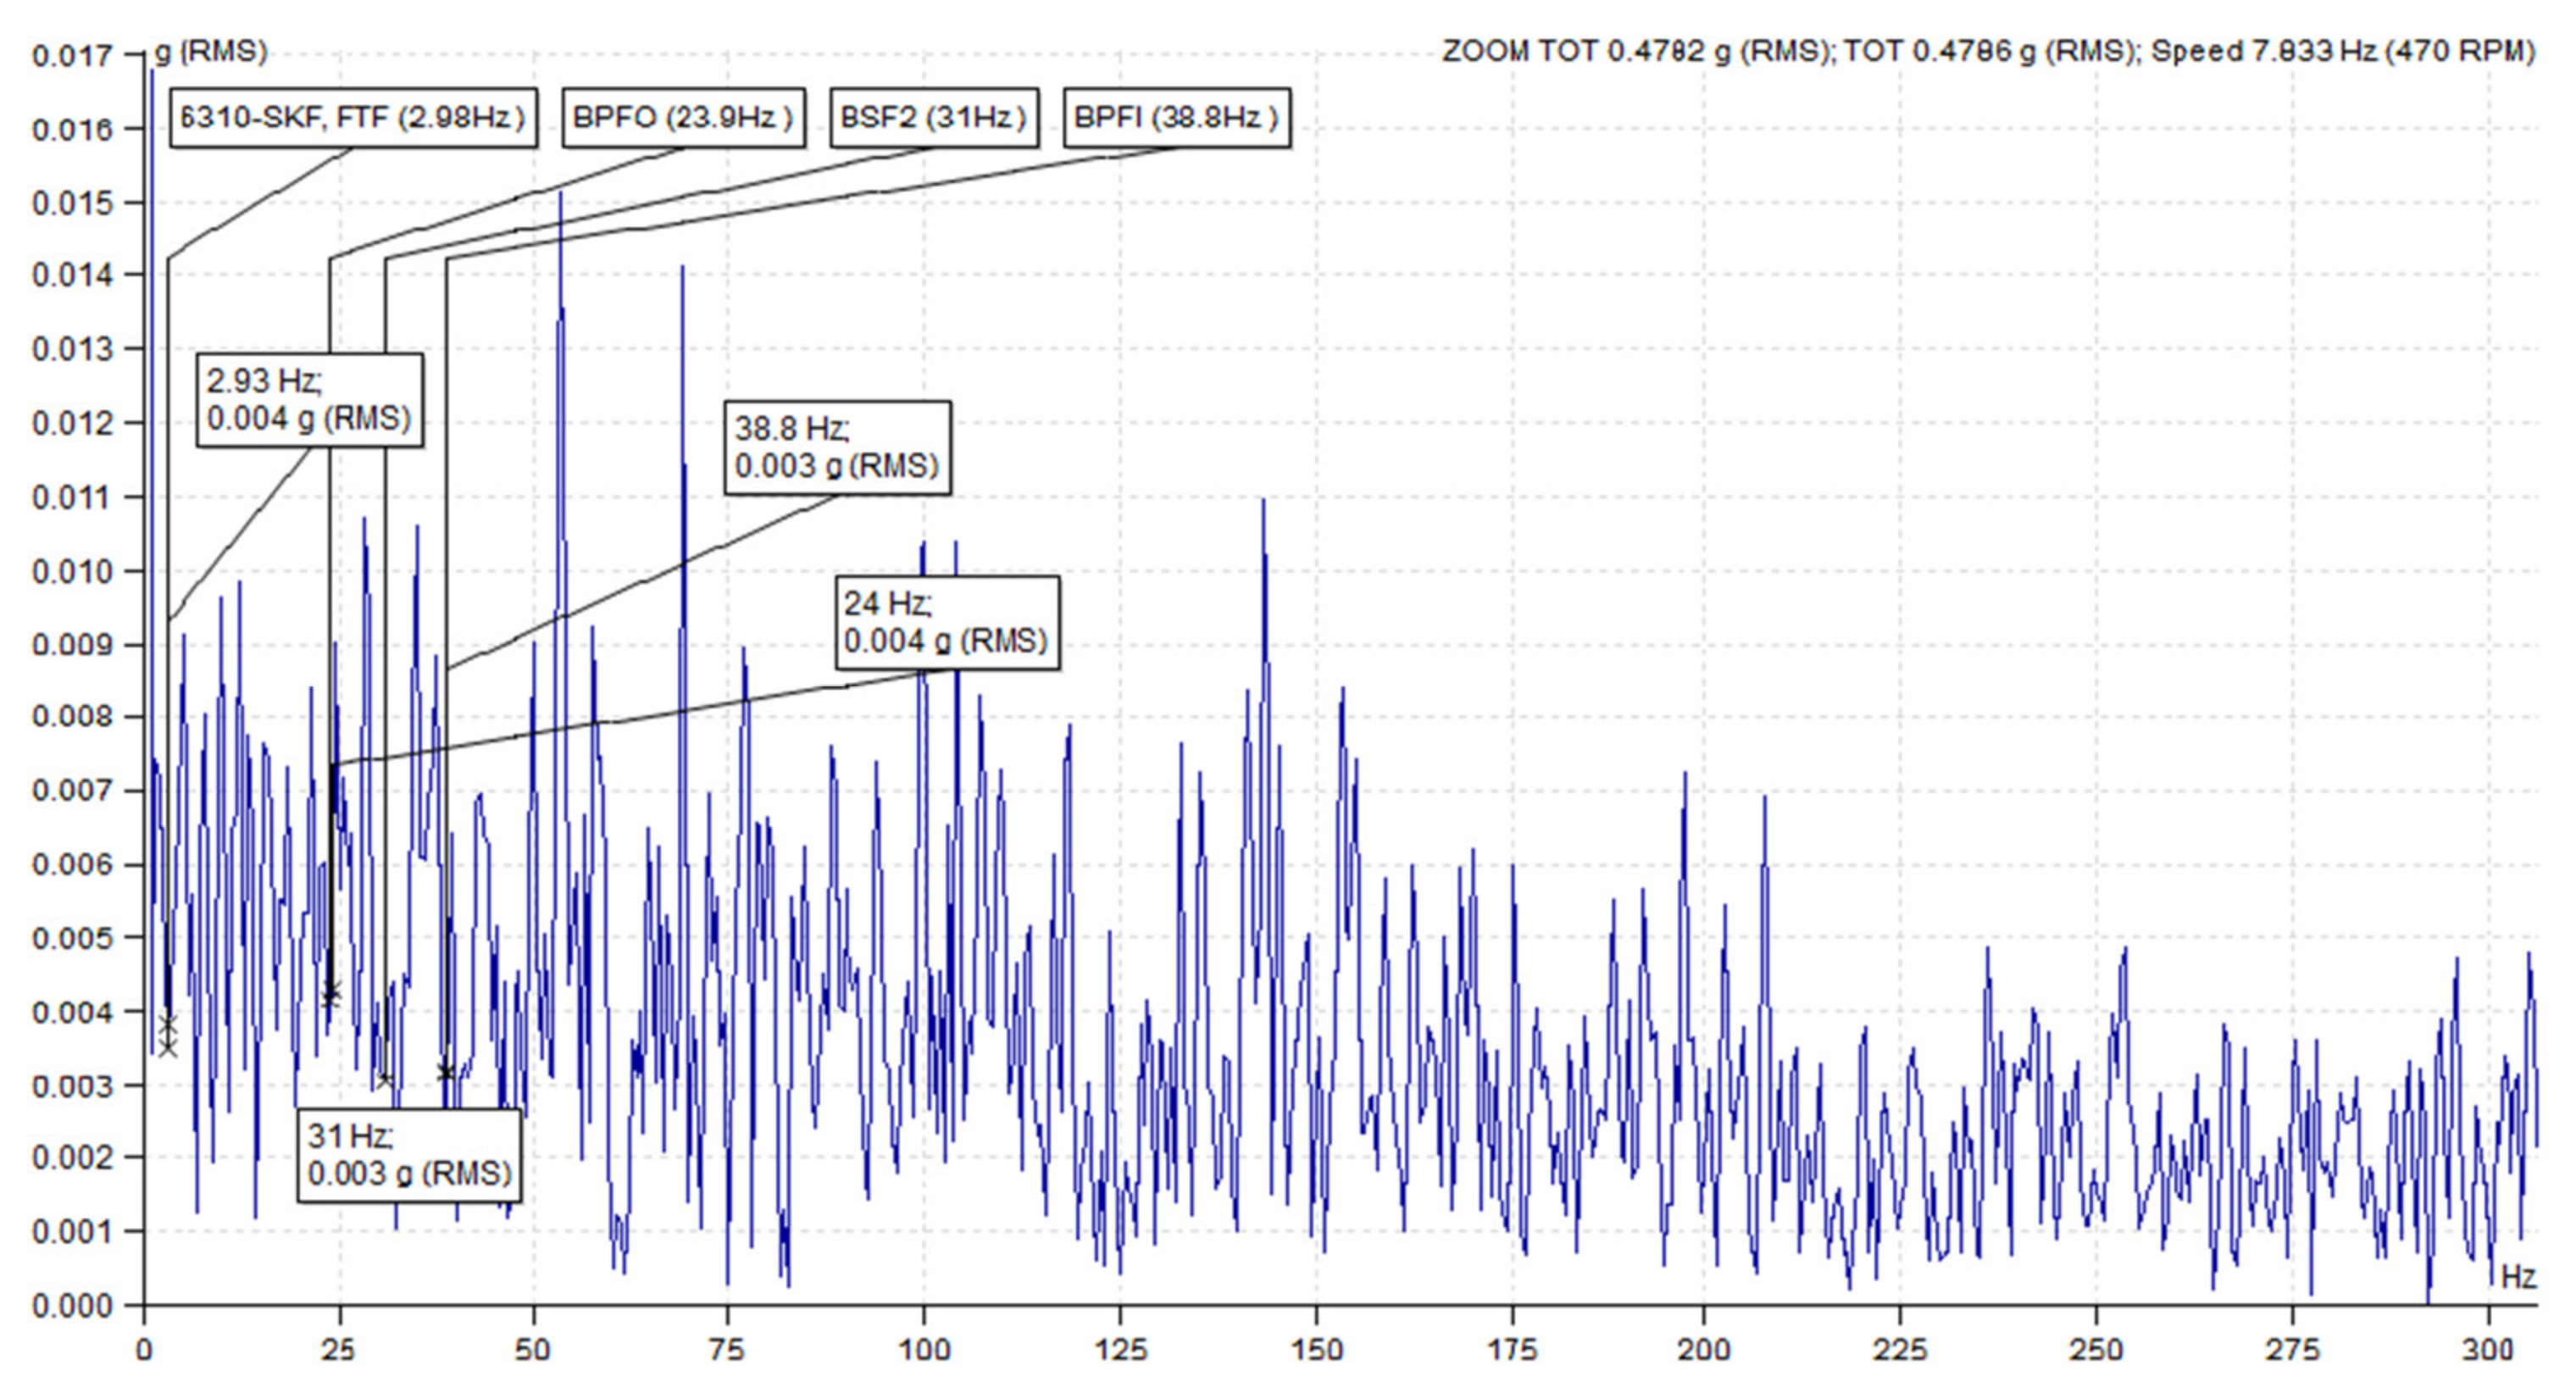
Similarly, the demodulated FFT spectrum RMS analysis was performed for the Beta version when the sensor was mounted on the housing and on the bracket, respectively. The demodulated FFT spectrum with an amplitude RMS (g) with a threshing speed of 470 RPM for bearing failure frequencies FTF (2.98 Hz, 0.004 g), BPFO (23.9 Hz, 0.003 g), BSF (31 Hz, 0.003 g), and BPFI (38.8 Hz, 0.004 Hz) were measured when the data were recorded from the accelerometer mounting on the housing (
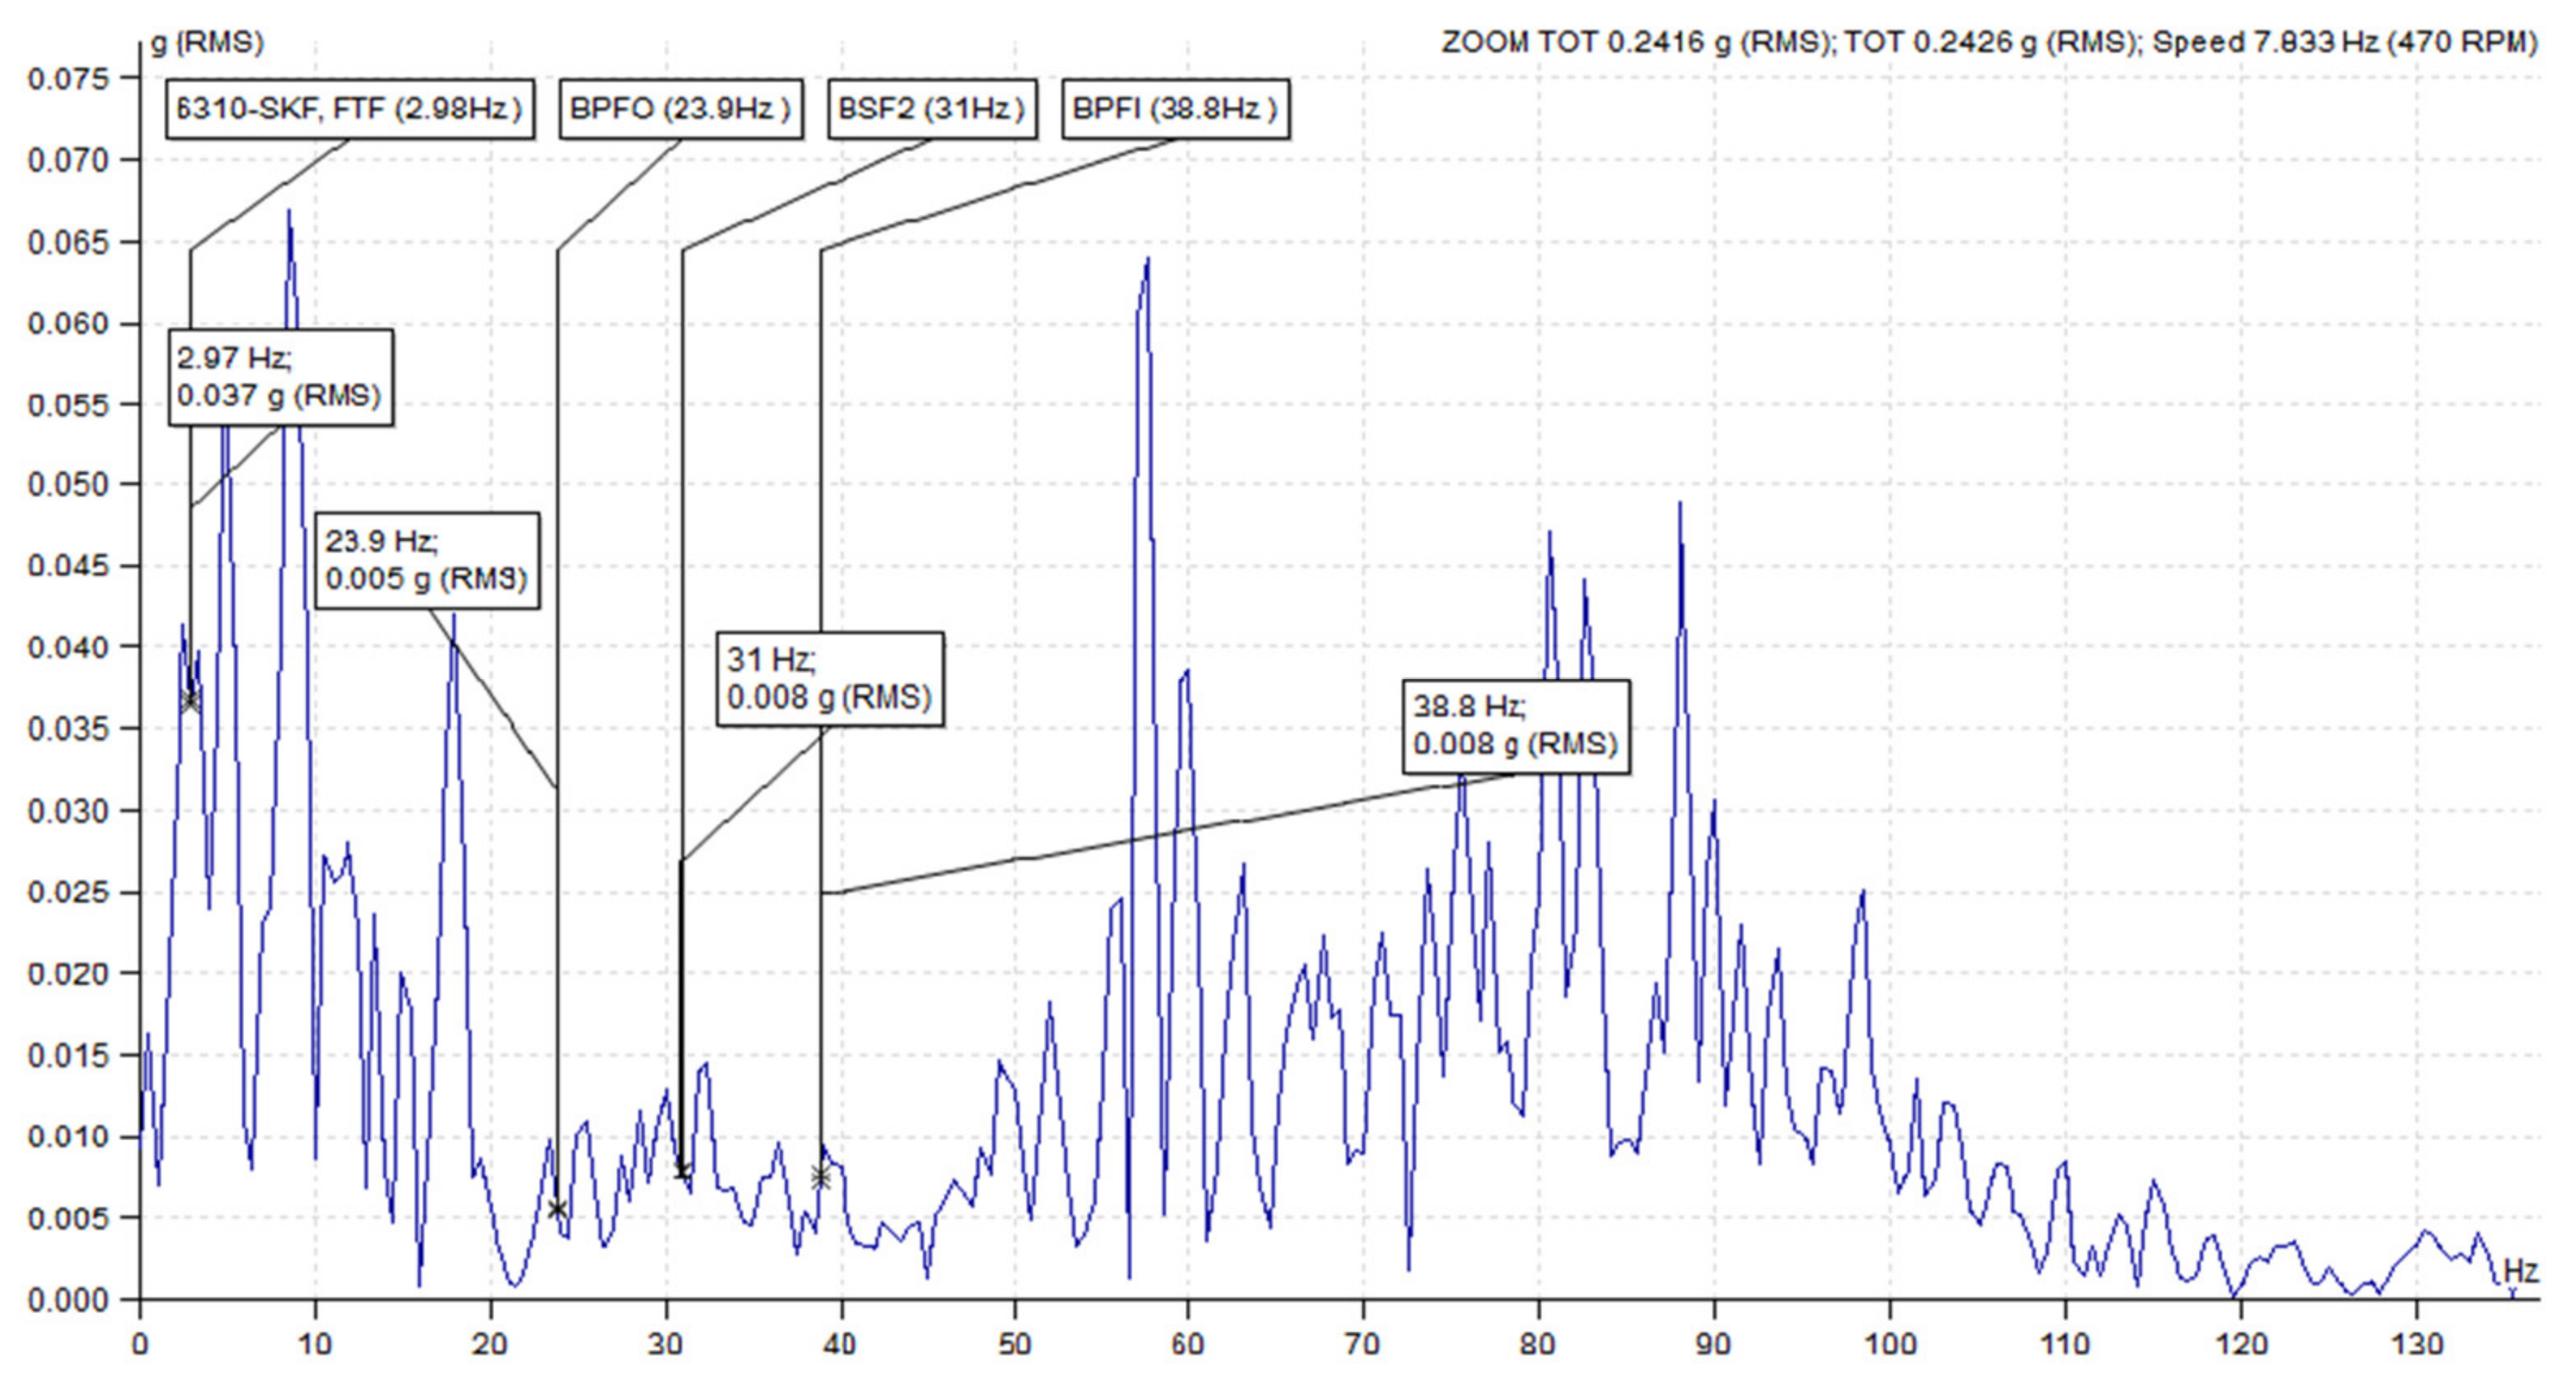
Figure 12). The demodulated FFT spectrum with an amplitude RMS (g) with a threshing speed of 470 RPM for bearing failure frequencies FTF (2.98 Hz, 0.037 g), BPFO (23.9 Hz, 0.005 g), BSF (31 Hz, 0.008 g), and BPFI (38.8 Hz, 0.008 Hz) were measured when the data were recorded from the accelerometer mounting on the bracket (Figure 13).
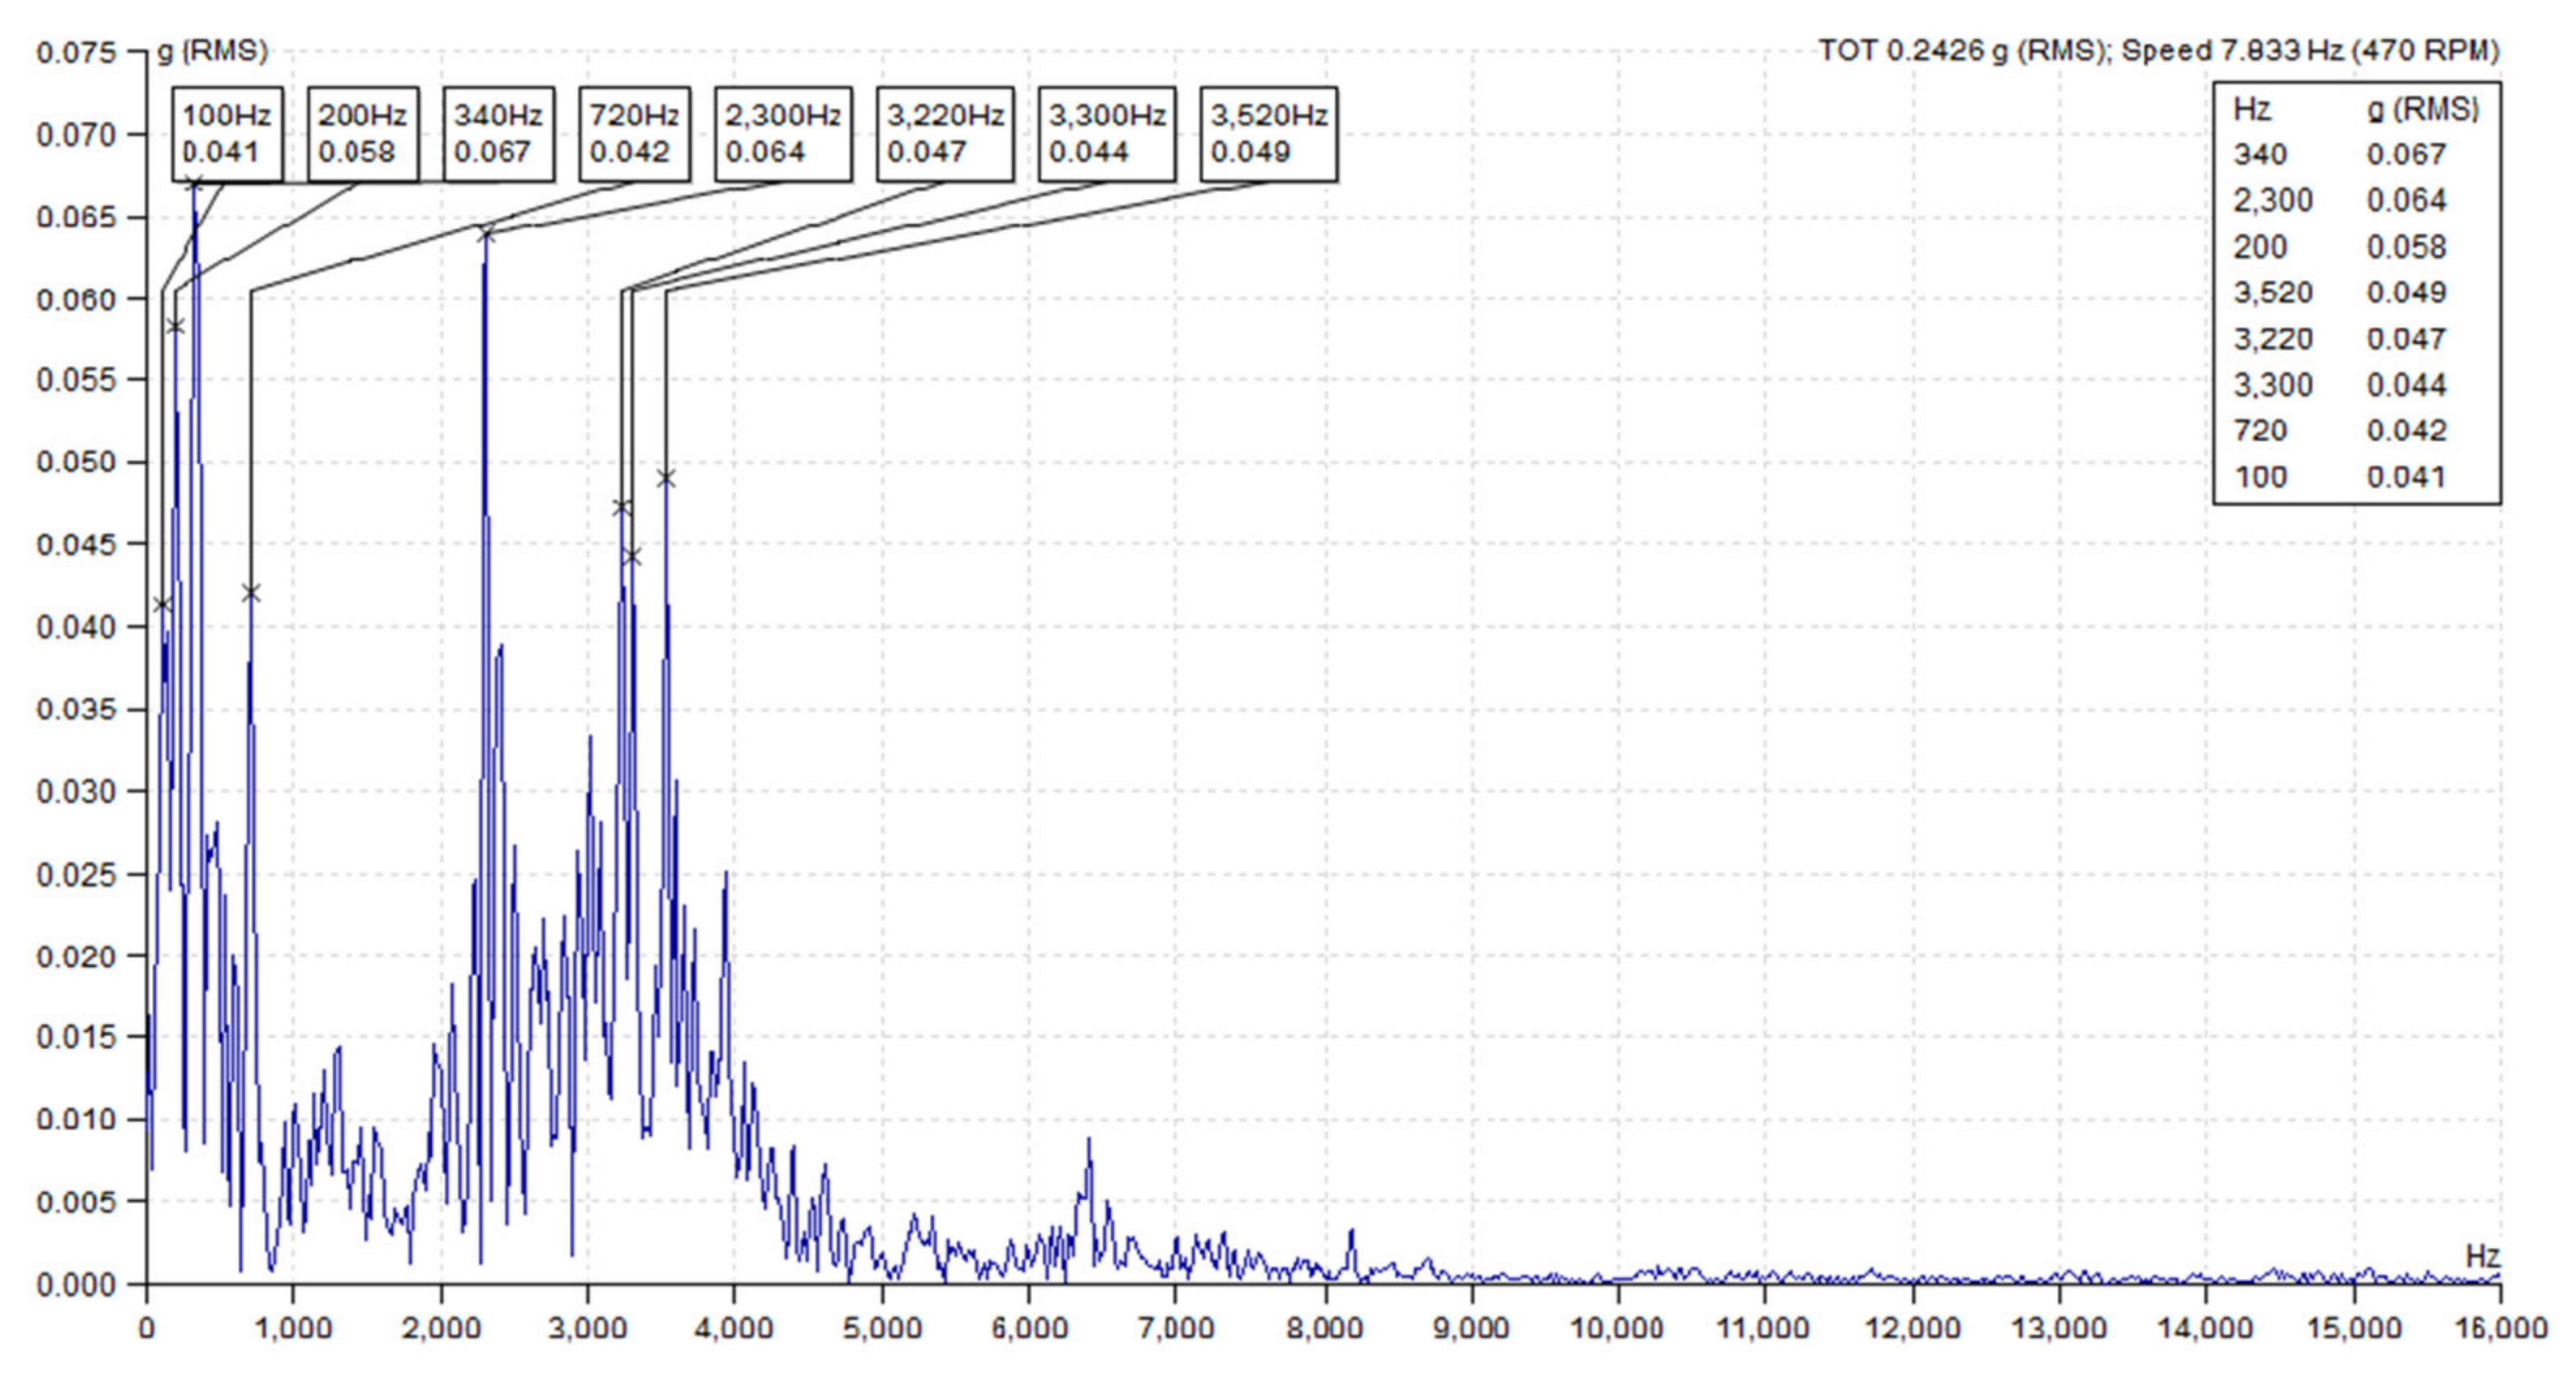
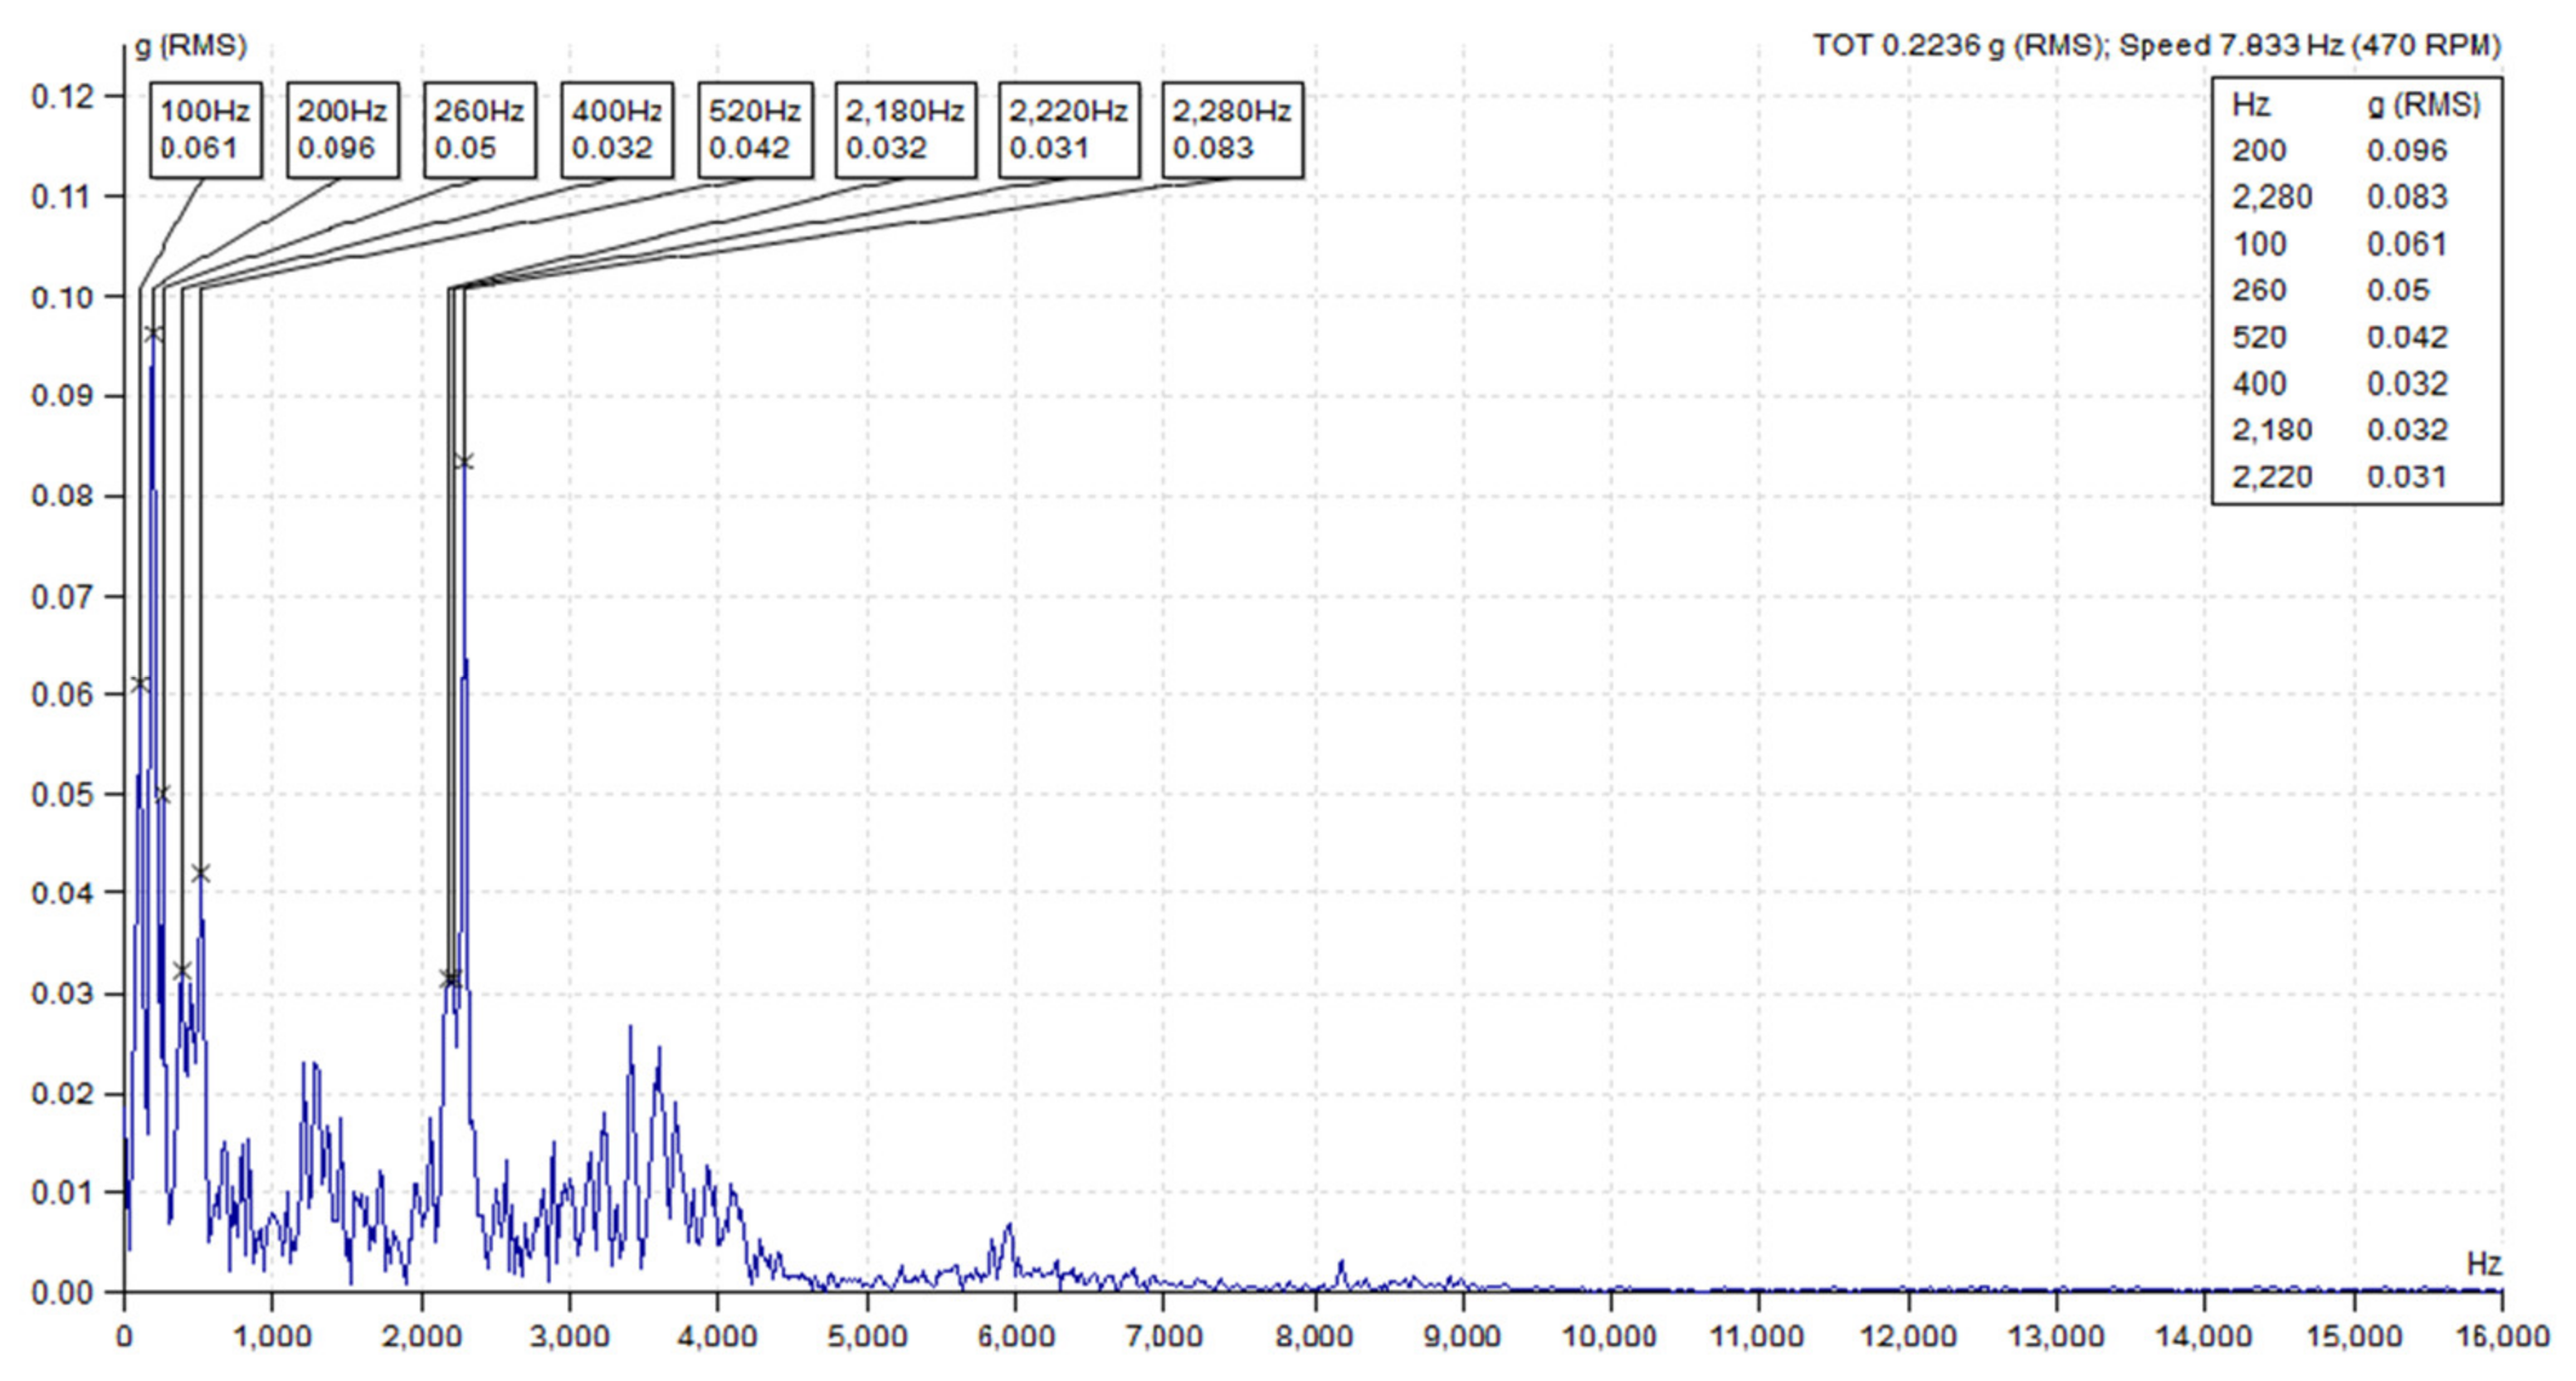
To observe the higher amplitude peaks in the spectrum and to identify any sidebands and harmonics resembling the bearing and other parts, the overall spectrum (g) is considered for both combine harvesters, as shown in Figure 14 and Figure 15. No higher amplitude peaks, harmonics, and side bands are present in the analyses. The bearing is considered safe to operate. The magnitudes of the measured RMS value indicate no bearing faults in the Massey Ferguson 7370 Beta (New). The bearing condition is in good condition to operate. The RMS bearing static amplitude is 0.353 g, which indicates a lower number than the alarm limit specified on ISO 10800: Noise and Vibration standard alarm set on the DDS software.
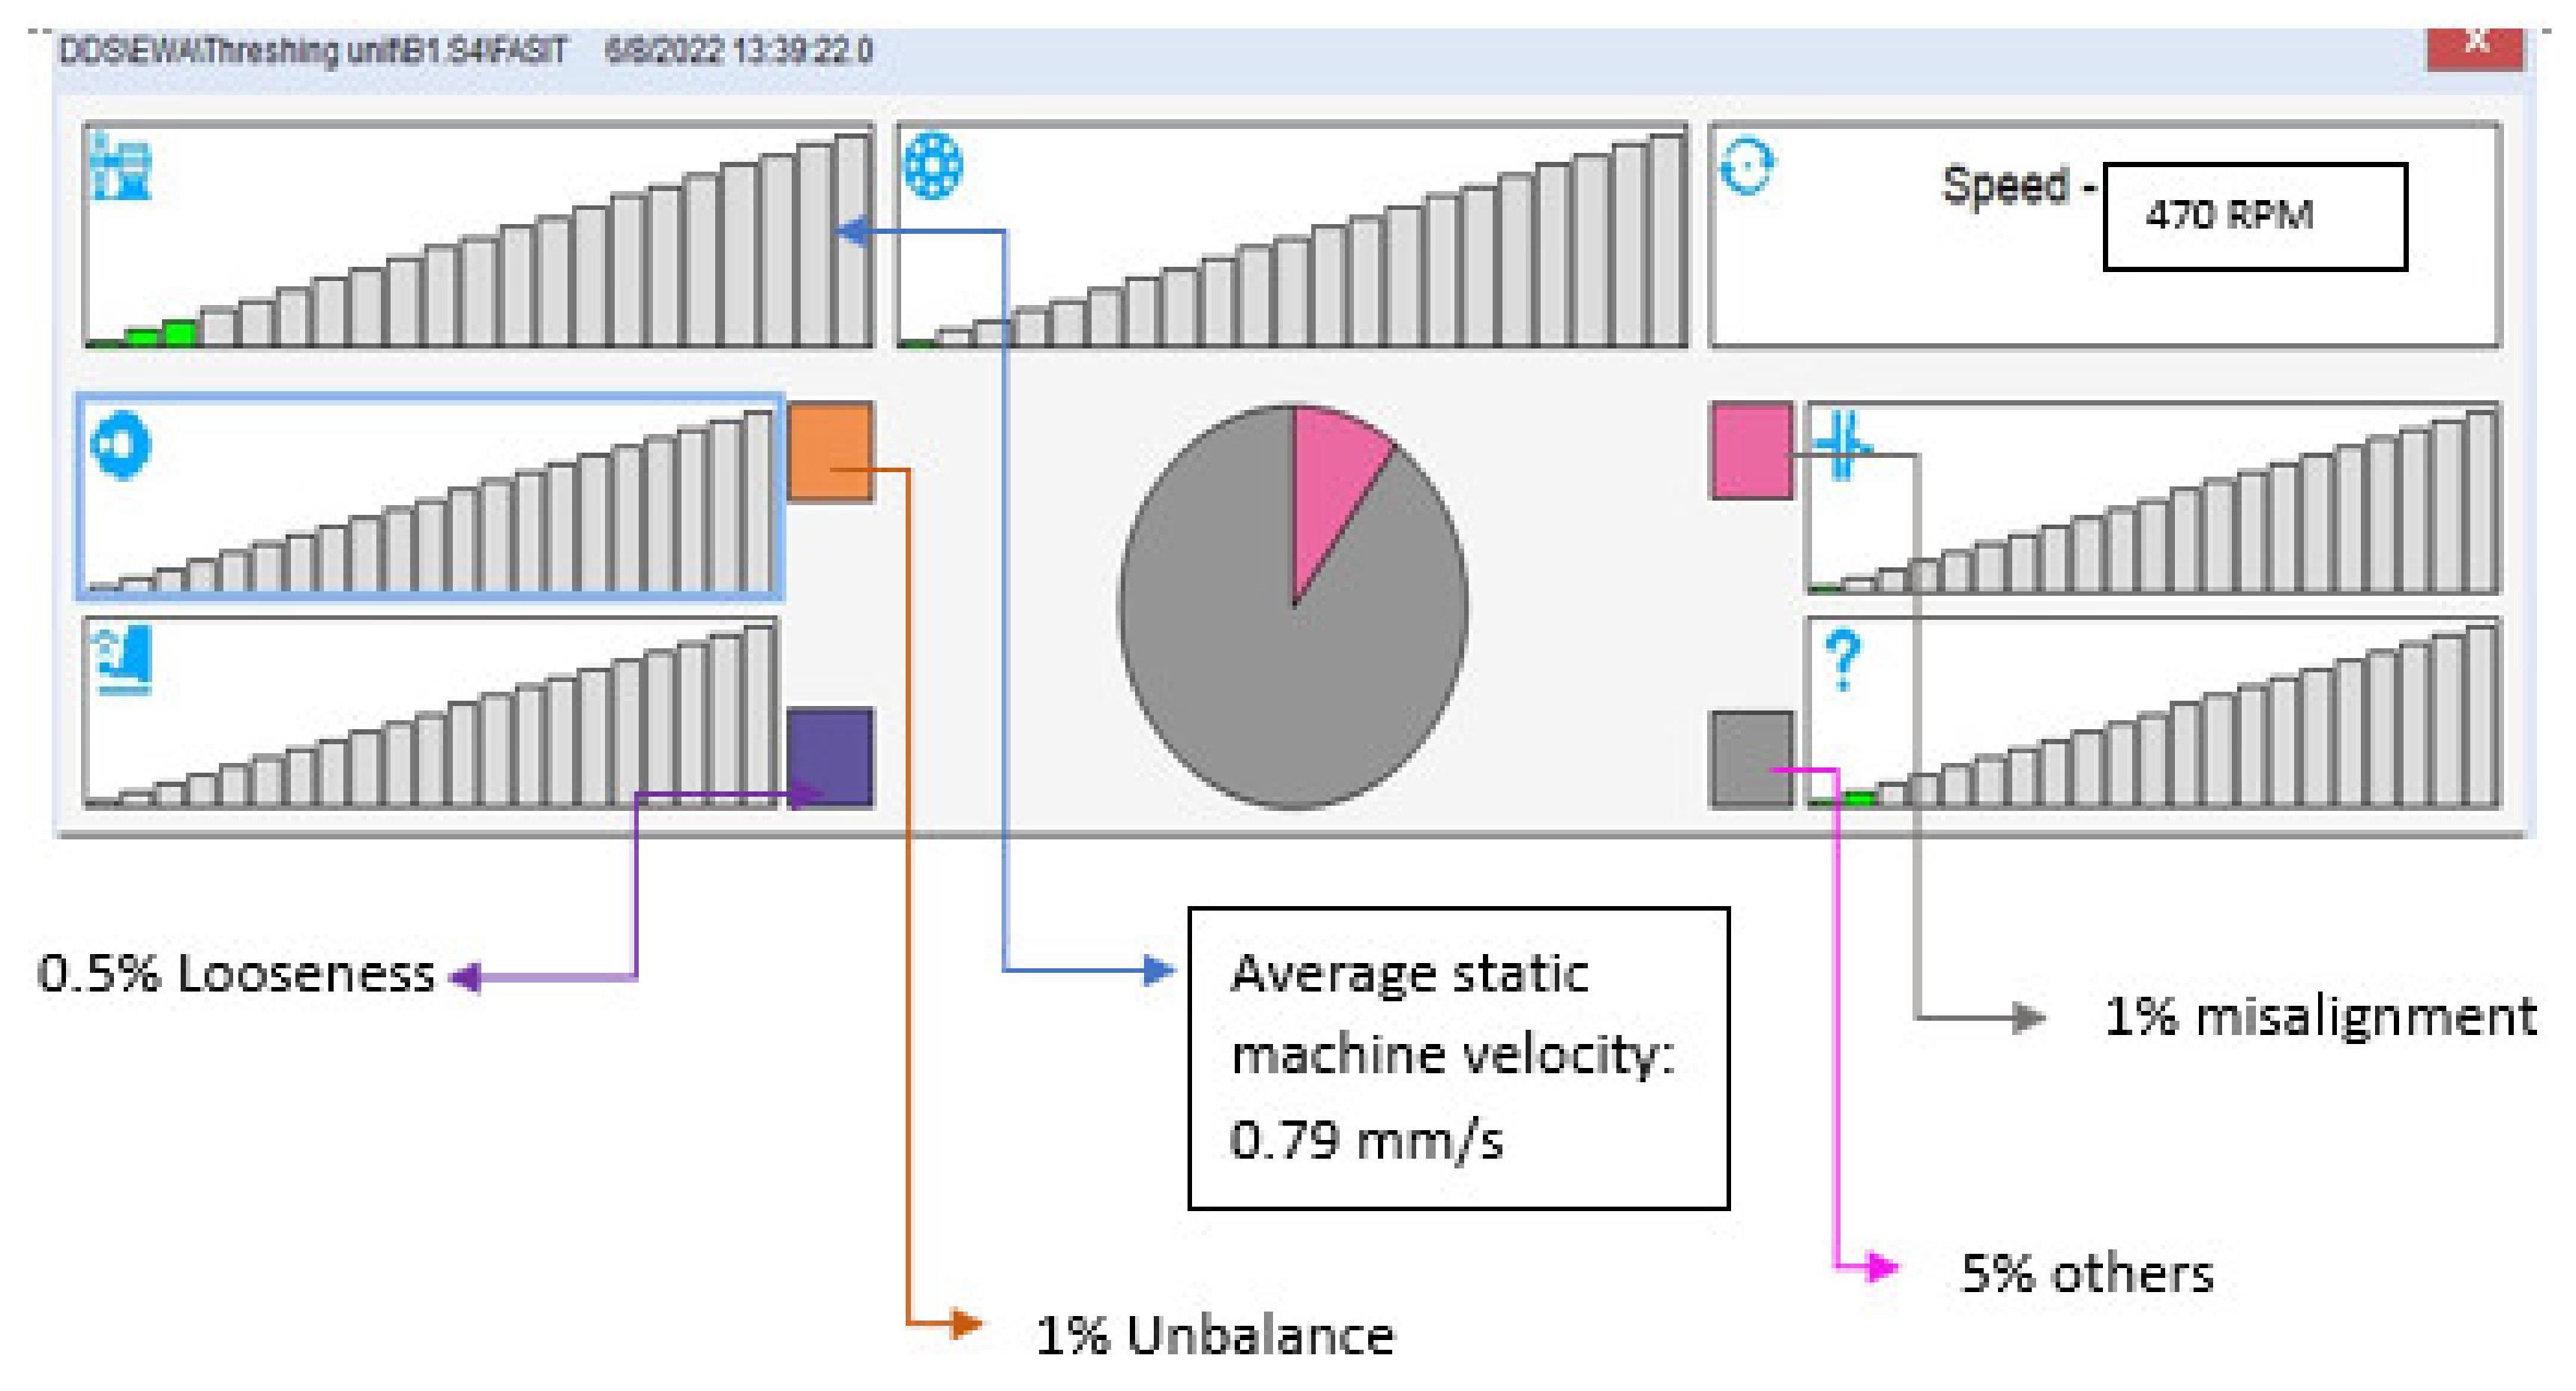
The FASIT tool provided by the Adash DDS helps identify the other mechanical condition of the threshing unit. The results show 0.5% looseness, 1% unbalance, 1% misalignment, and 5% other mechanical faults, as shown in Figure 16.
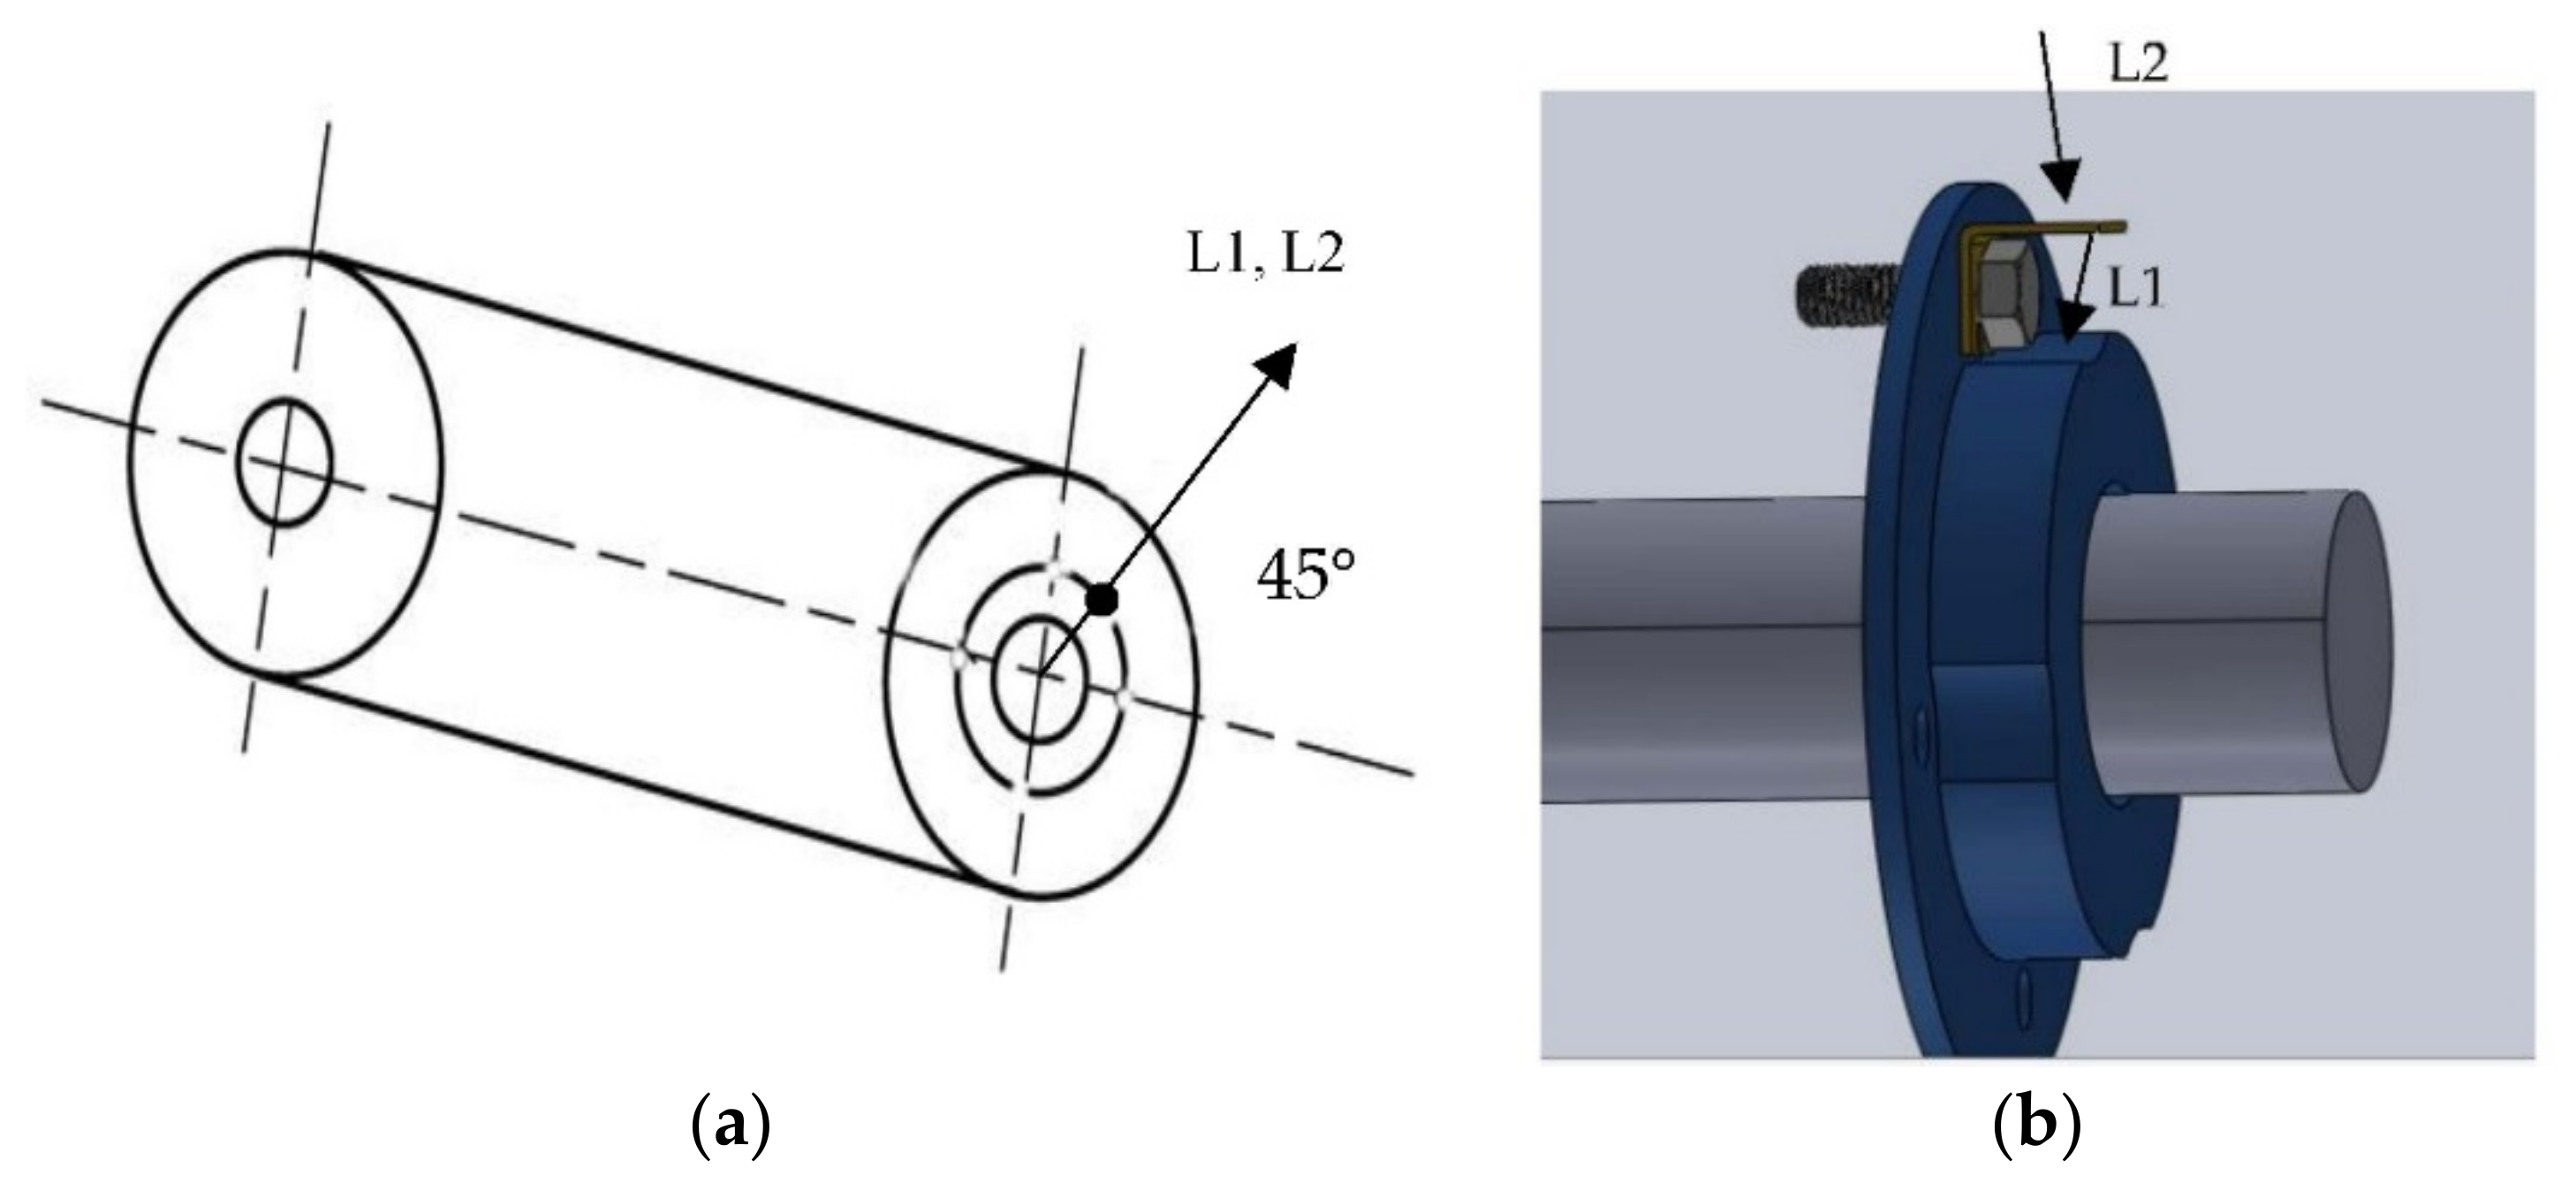
The validation of the method was again performed on the tangential threshing test bench. To study the bearing used in the stand demodulated FFT is considered when the measurement is from an accelerometer-mounted housing at 45° from the horizontal radial axis. When the sensor was directly mounted on the housing, 30% unbalance, 0% misalignment, and 40% looseness were observed from the FASIT tool display. The unbalance and looseness issues were fixed for the tangential threshing stand and the vibration analysis was performed. The fundamental frequency was obtained from the DDS Adash bearing library, as shown in Table 6.
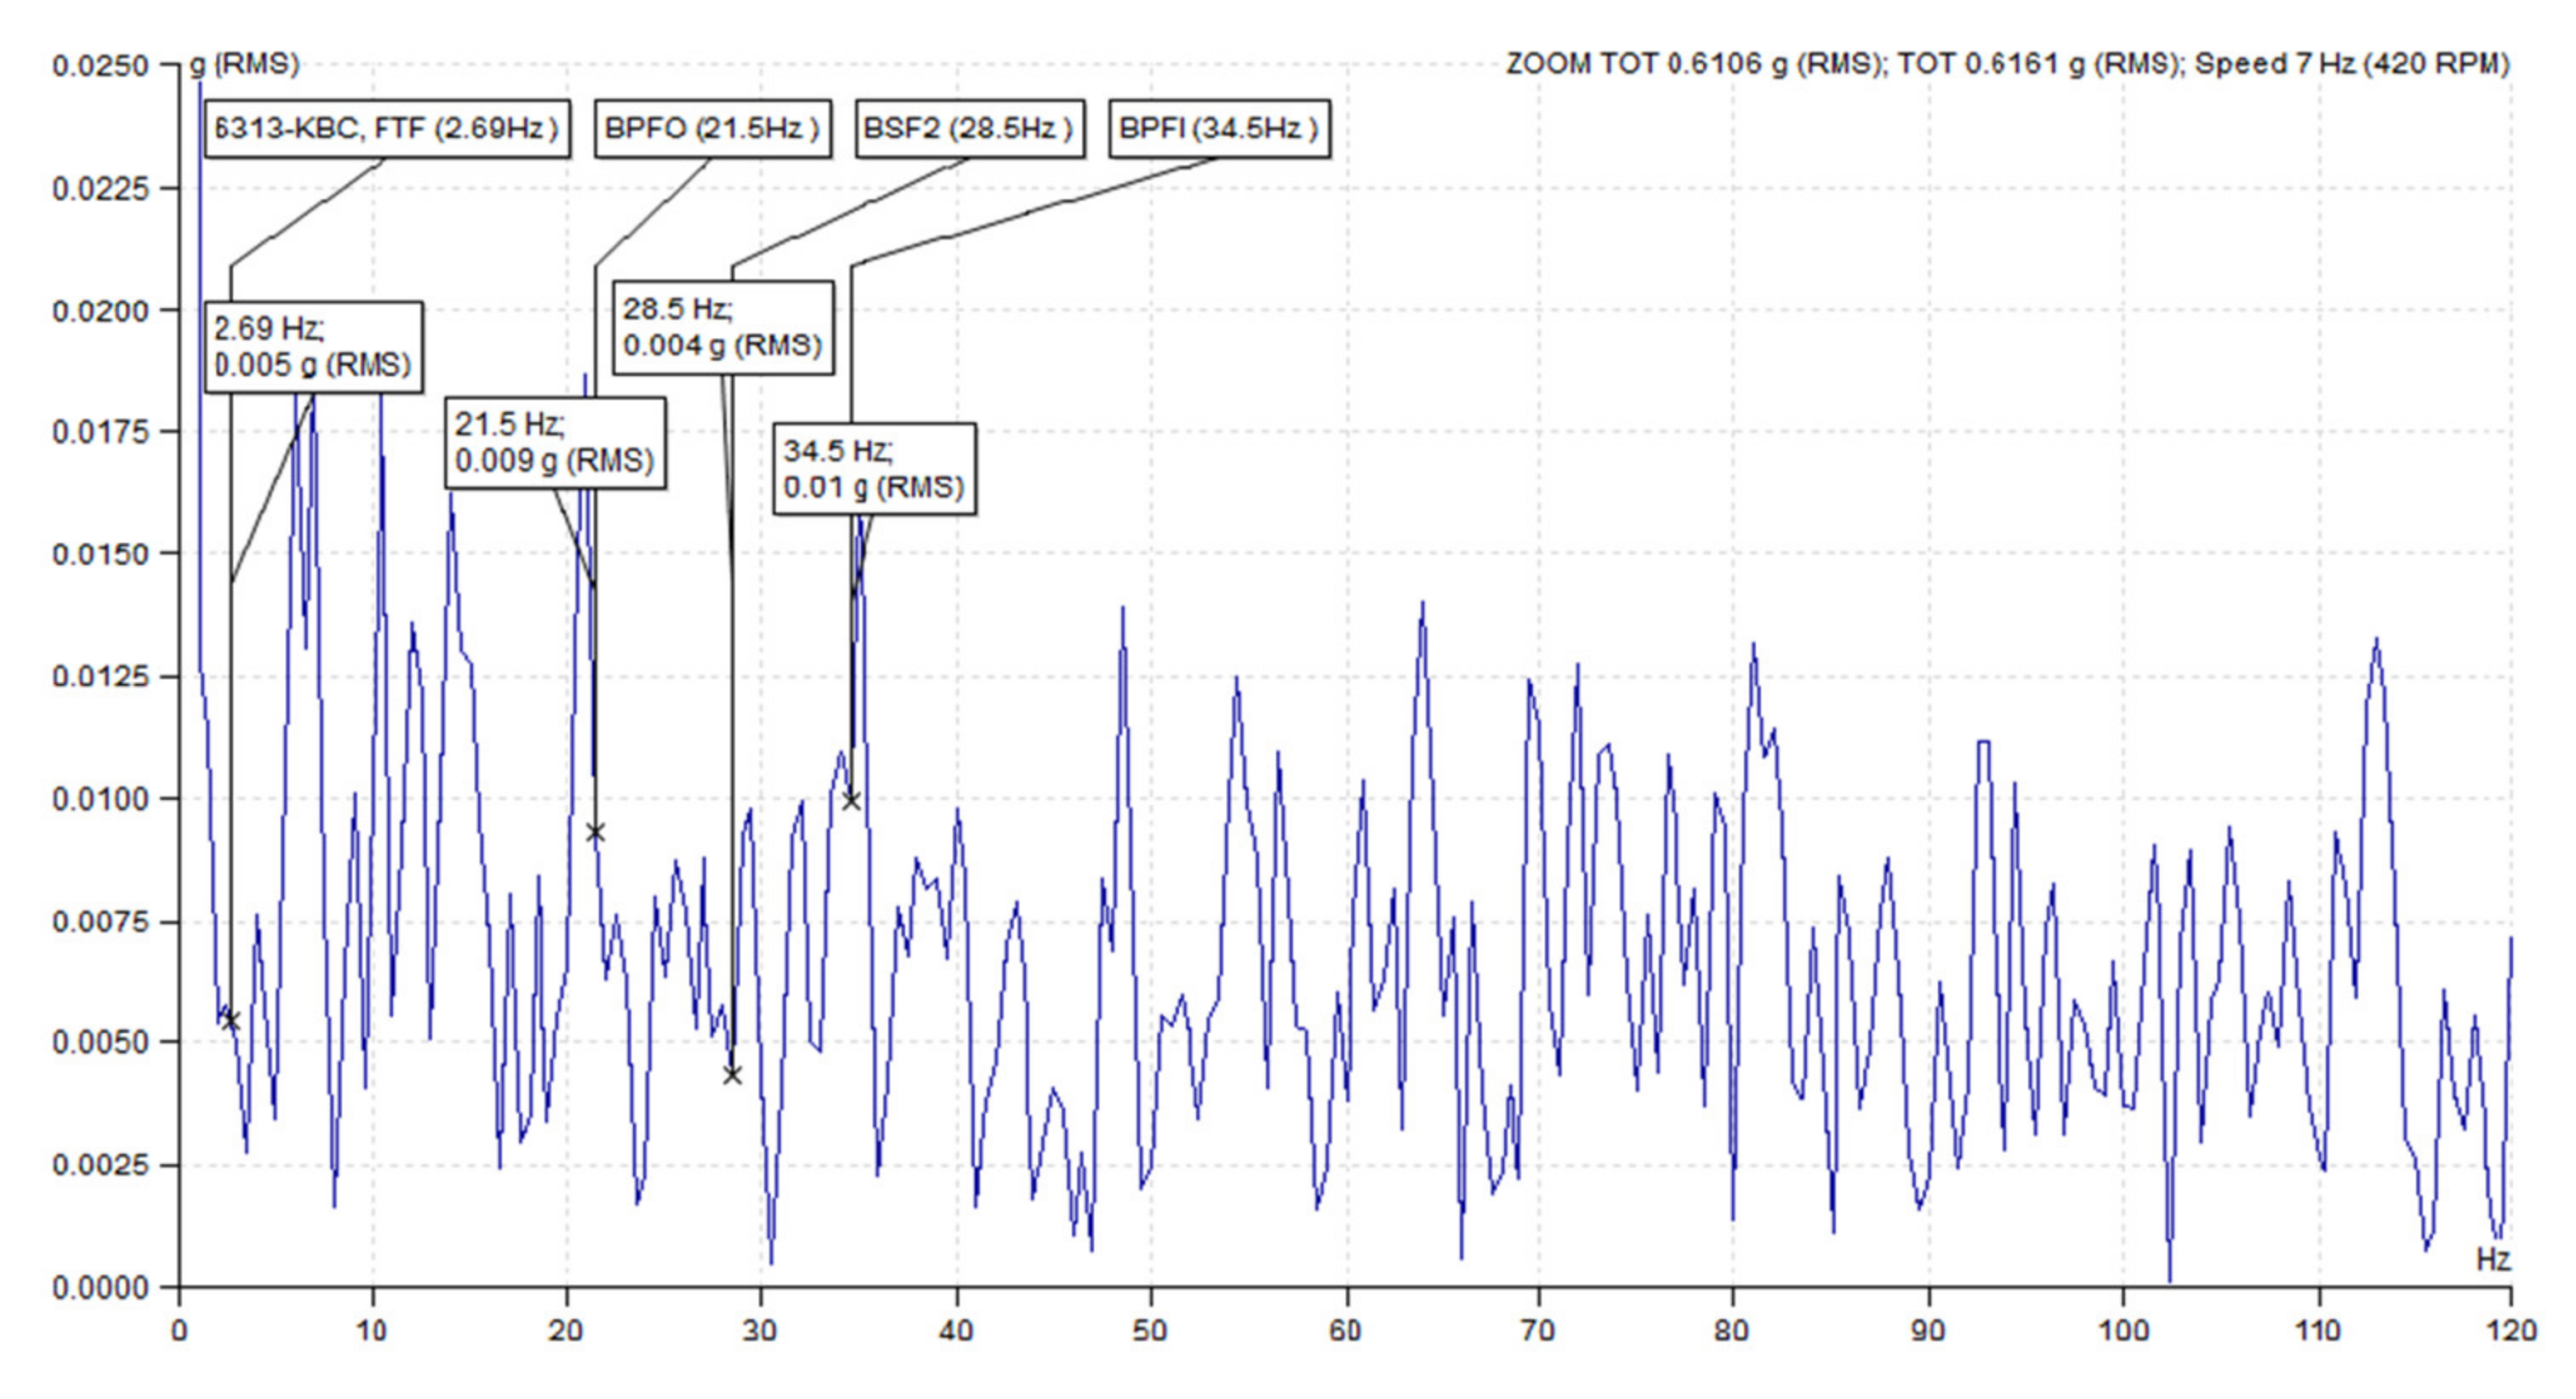
The demodulated FFT spectrum, with an amplitude RMS (g) with a threshing speed of 420 RPM (maximum operating speed), and when the sensor was directly mounted onto the housing for the bearing fundamental train frequency (FTF) (2.69 Hz, 0.005 g), ball passing frequency of outer race (BPFO) (21.5 Hz, 0.009 g), ball spin frequency (BSF) (28.5 Hz, 0.004 g), and ball passing frequency of inner race (BPFI) (34.5 Hz, 0.01 Hz), was measured and is shown in 
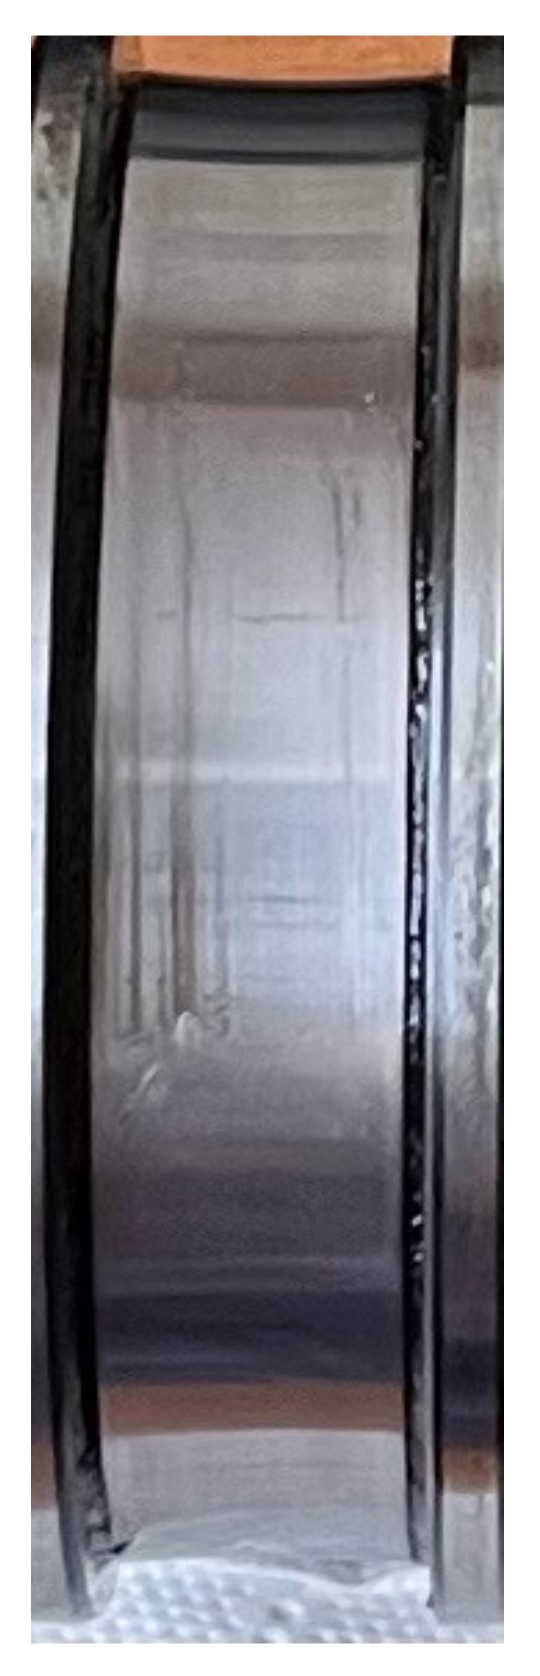
Figure 17. The RMS higher values should be as near to zero as possible when being assessed. Since the BPFI amplitude is close to the second digit after decibel and higher compared to the other amplitudes, it is further diagnosed with the digital camera with 12-megapixel-wide and ultrawide lenses (Figure 18). It is observed that the bearing has initiated the abrasive marking with contamination. The main causes include filthy hands, contaminated workspaces, dirty instruments, and foreign objects in lubricants.
Therefore, the fast Fourier transform (FFT) (500 Hz–16 kHz) demodulated RMS vibration analysis technique successfully determined the bearing initial fault condition and is suitable for the easy and effective analysis of the tangential threshing bearing condition. The FASIT tool successfully determined the other machine condition.

3.3. Random Vibration Analysis

The reaction of structures exposed to random vibration loads must be examined by random vibration analysis. Compared to the scenario of a deterministic time history loading, random vibration loads were not always quantifiable with the confidence of the size and duration. The outcomes are also statistical in nature because the input loads are described using statistical values.
The design was assembled in Solid works software and imported to the Ansys software. The shaft extruded and was cut to 50 mm (millimeters) to reduce the computational time. The inner race-shaft and roller-bearing races have a friction coefficient of 0.21, the bearing races-housing and bracket and housing have a friction coefficient of 0.4, whilst the bolts-bracket has a friction coefficient of 0.23.
The FFT (500–16,000 Hz) data range between 400 Hz and 800 lines. The fundamental frequencies of the bearing corresponding to the FFT frequency of measurement (Figure 16) were converted into power spectral density (PSD), as shown in Table 7. The frequency domain analysis with PSD estimation based on FFT [25] is given by:
PSD = Amplitude 2 / Δ f × W f
where W f   is   the   correction   value   3.671441636   and   Δ f is the frequency resolution obtained by:
Δ f =   Frequency   range No .   of   Lines
The corresponding PSD frequency and amplitude are applied to all the connections and PSD deformation and response PSD due to the adjacent PSD input being observed on the bracket in the vertical radial direction. The first sigma scale factor showed 3.211 × 10 8   mm . minimum deformation and 1.23 × 10 3 mm. maximum deformation and the third sigma scale factor showed 9.6329 × 10 8   mm . minimum deformation and 3.7184 × 10 3 mm. maximum deformation on the x axis (vertical radial direction). Again, the random vibration was applied to the system, as shown in Table 8. These values are random in nature and obtain the PSD response in frequency range from 10 to 2000 Hz. The first sigma scale factor showed 1.73 × 10 9   mm . minimum deformation and 2.288 × 10 7 mm. maximum deformation and the third sigma scale factor showed 5.16 × 10 9   mm . minimum deformation and 6.57 × 10 3 mm. maximum deformation on the x axis (vertical radial direction).
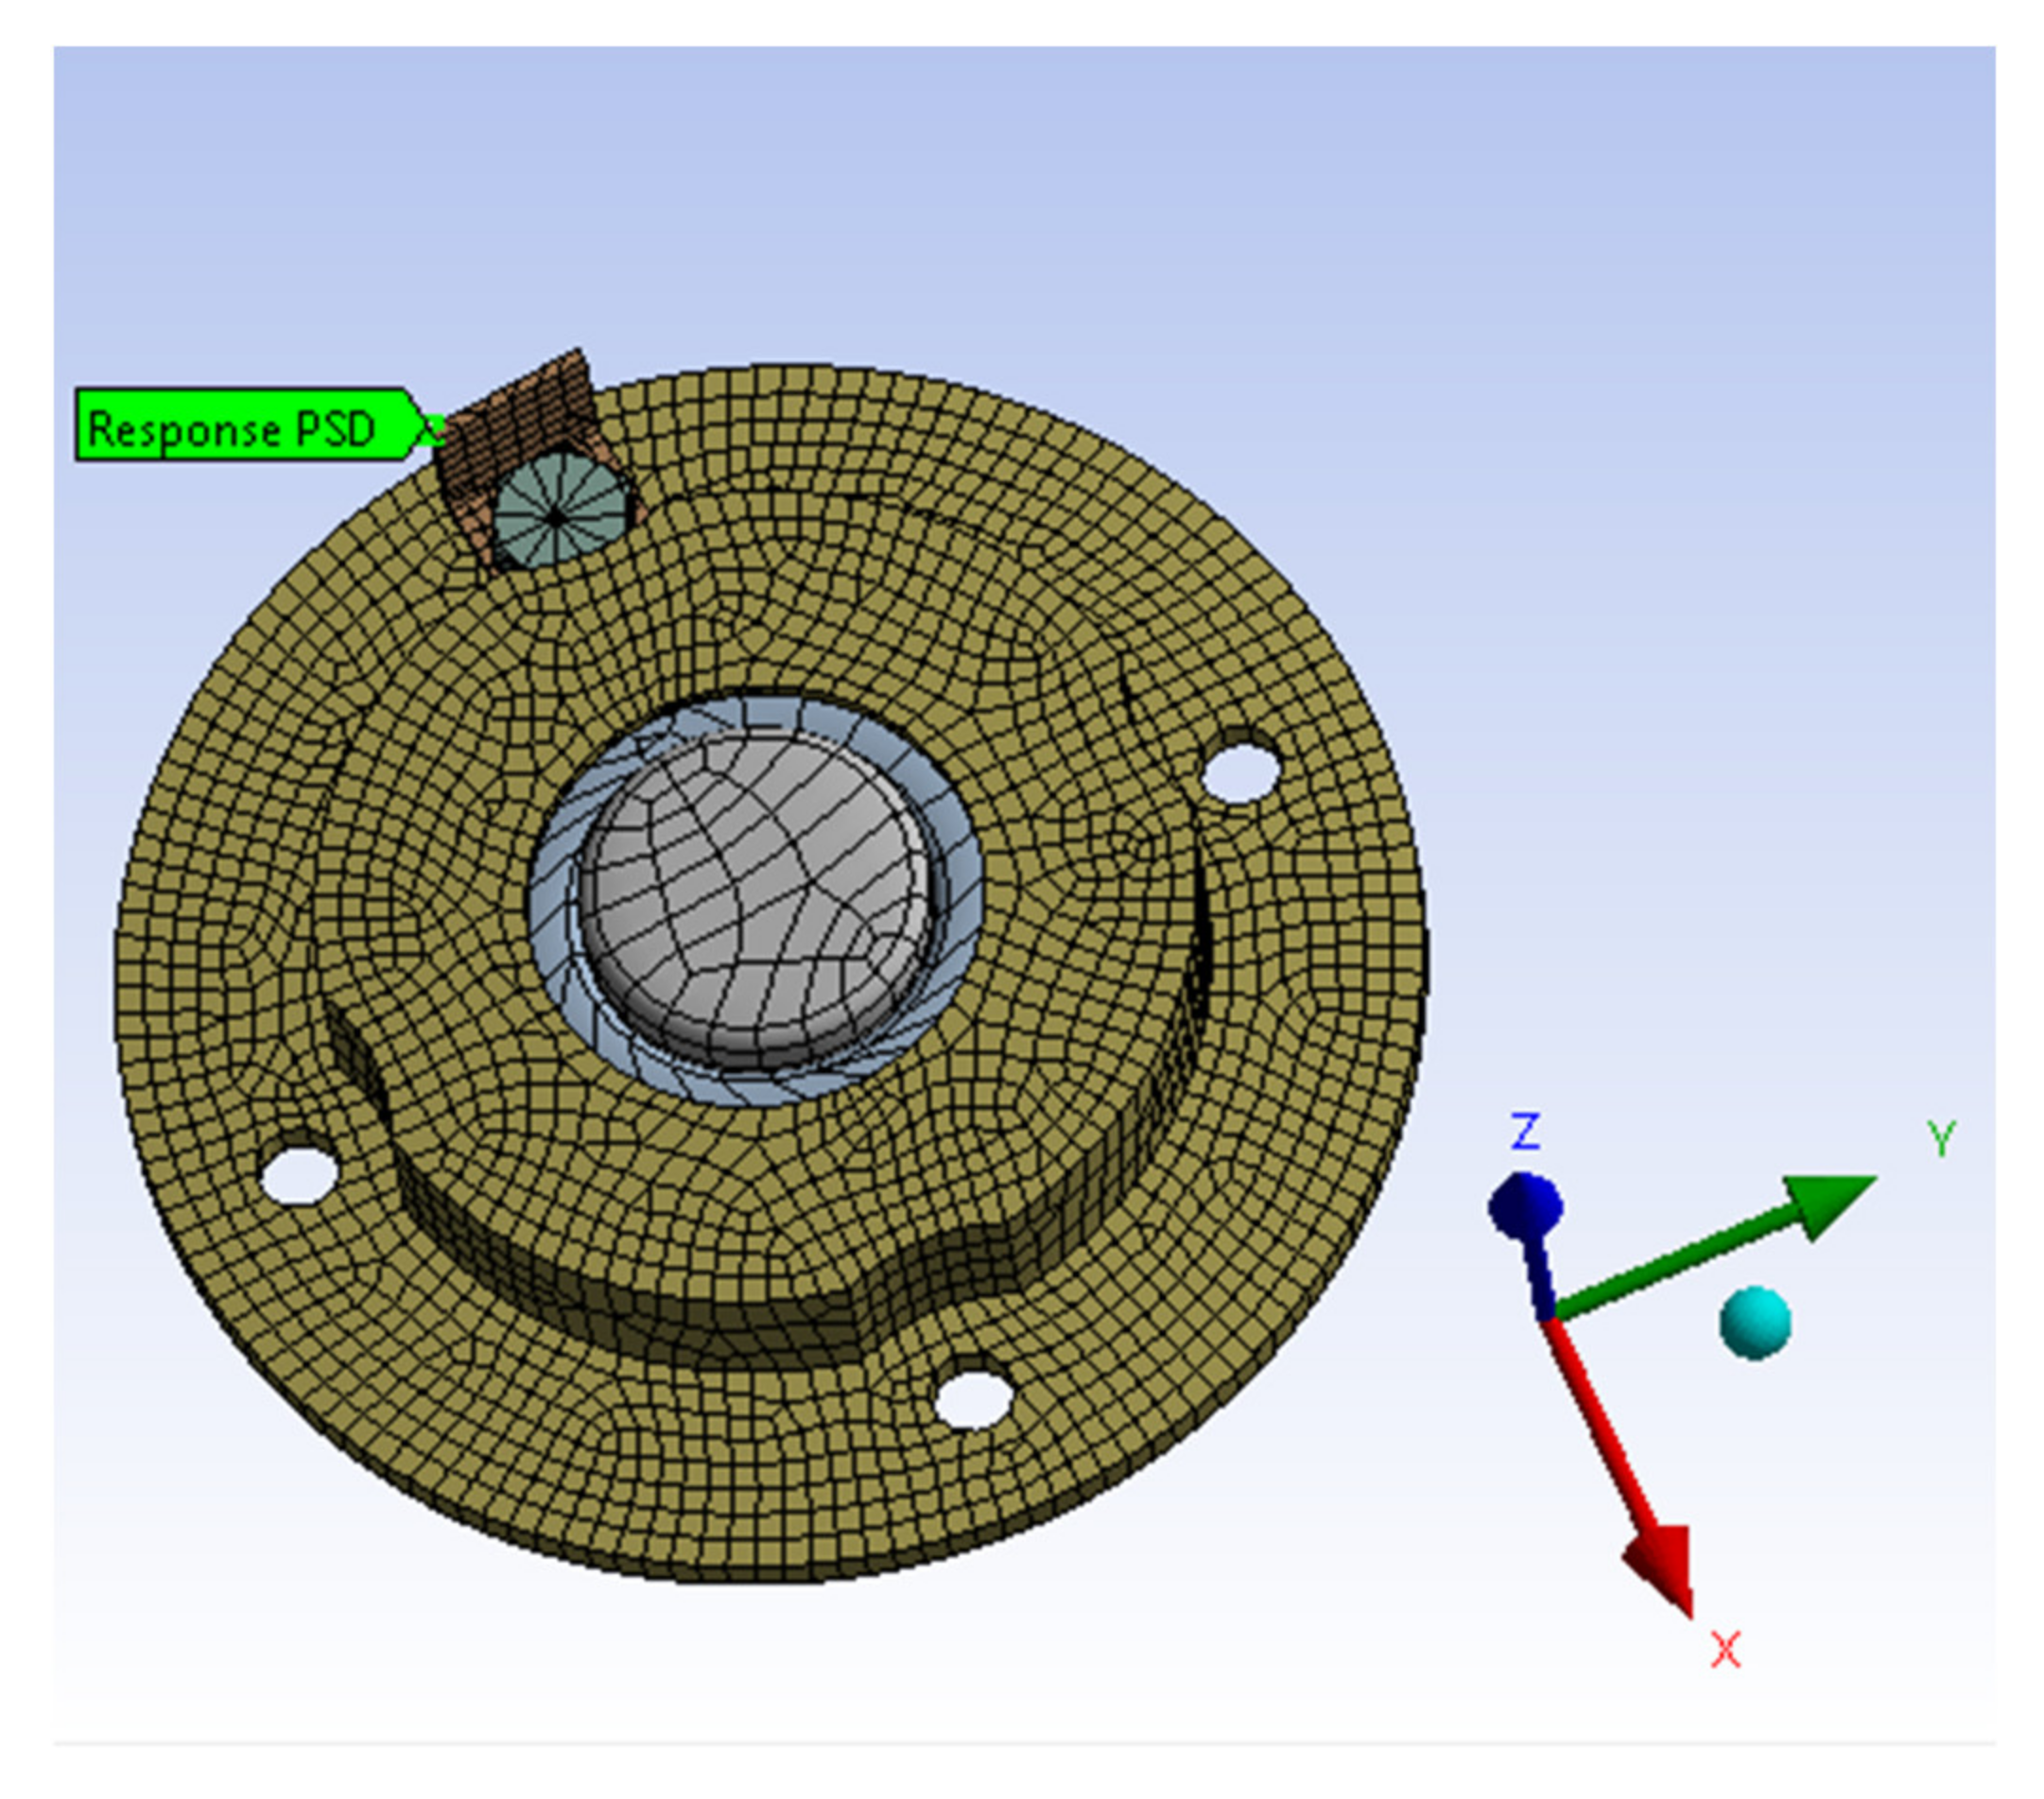
The first sigma represents 68.26% deformation, and the third sigma represents 99.73% deformation. Since the deformations on the brackets are negligibly very small, the deformation on the other parts can be calculated and analyzed using a bracket. Furthermore, the PSD response is taken on the vertex of the bracket, as shown in Figure 19 in the x direction.
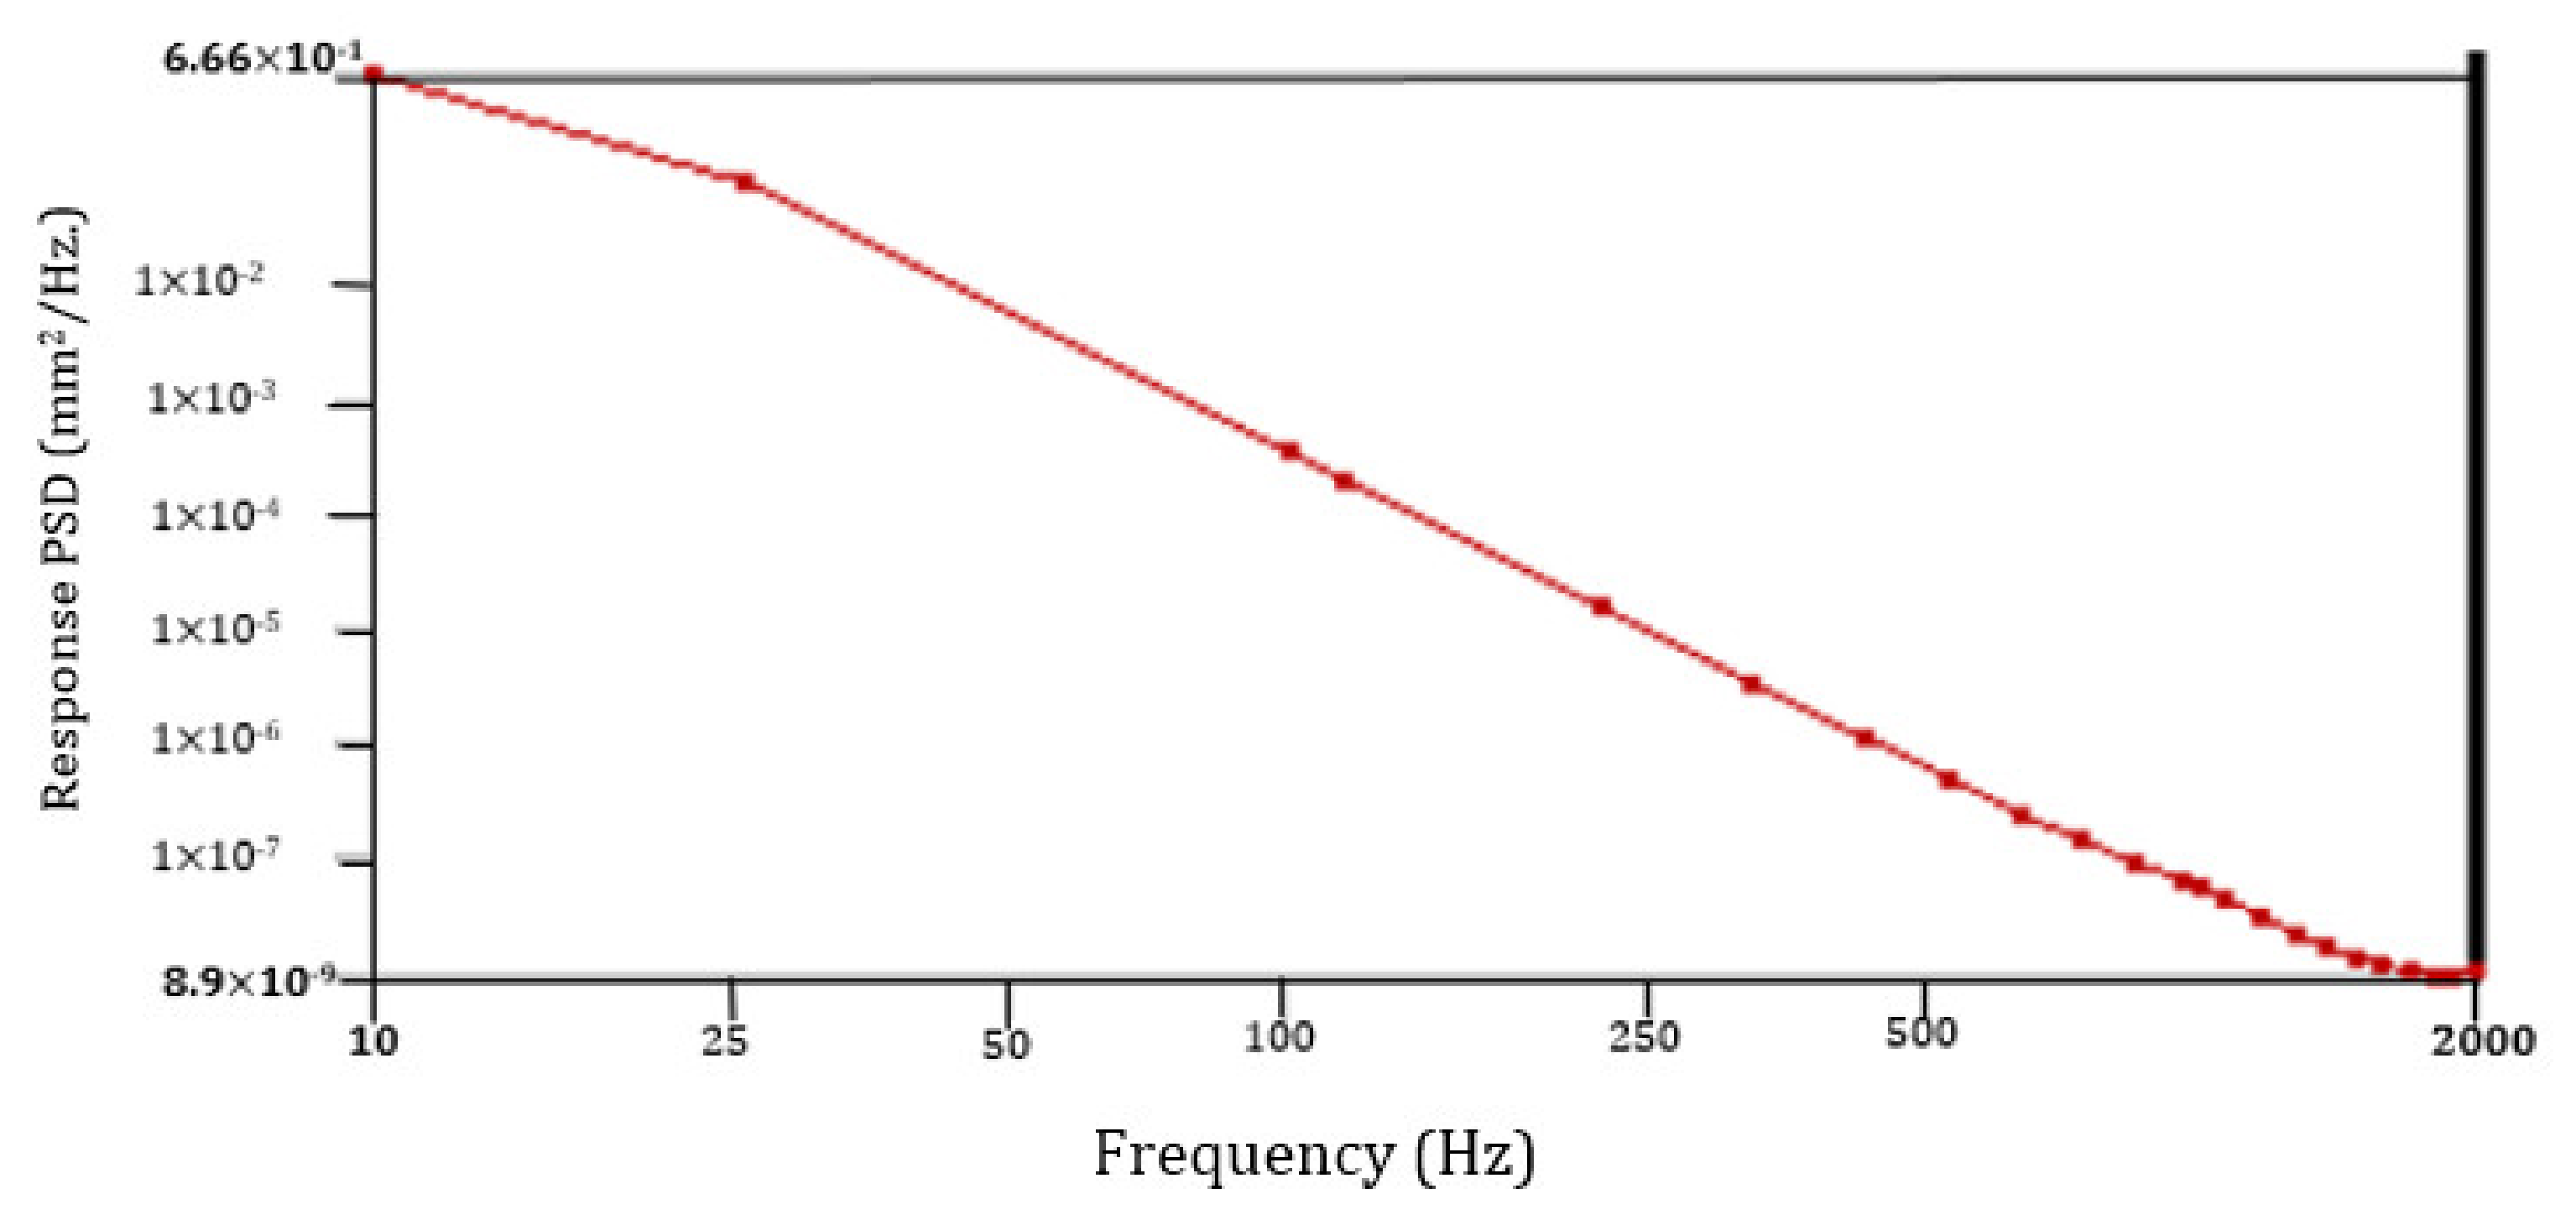
The PSD response (RPSD) provides the spectral response of a structure subjected to random excitation and the RPSD plot gives the information as to where the average power is distributed as a function of frequency. This gives the RMS value of the selected frequency range over the entire available frequency range as well as information about the peak g acceleration responses that occur at the resonant frequency on the assembly (Figure 20).
Therefore, the bracket deformation is comparatively negligible for the PSD corresponding to the test result and random vibration PSD inputs. Thus, the bracket can provide the deformation information of other associated components during vibration analysis when the sensor is mounted onto its surface in the radial direction.

4. Discussion

The most suitable vibration signals were selected to assess the threshing drum technical characteristics of a combine and to spot flaws when the combine is in function under nonloading conditions. The best method for determining the bearing quality condition is demodulated FFT spectrum analysis, which offers the necessary vibration information. The FASIT tool technology provided by Adash DDS is effective and can easily identify machine conditions such as misalignment, looseness, unbalance, and other mechanical conditions to account for before every harvesting season.
The measurement was taken by introducing the simple bracket into the bearing housing to locations where sensor mounting is difficult, as the vibration analysis is conducted for the Massey Ferguson Beta and Activa variants. The comparison was performed to identify the difference in measurement taken when the sensor was mounted on the bracket and housing. The modal analysis was performed on Ansys to identify the eigenvalues and eigenvectors to prevent the resonance phenomenon. The static demodulated RMS recording was found to be 16.23% more on the bracket compared to the housing which satisfies the evaluation of the bearing condition. The magnitudes of the measured RMS value indicated no bearing faults in the Massey Ferguson 7370 Beta (New) and Ferguson 7374 s (1300 EH) Activa. The RMS bearing static amplitude was 0.353 g and 0.364 g for the Beta and Activa variants, respectively, which indicates a lower number than the alarm limit specified on ISO 10800: Noise and Vibration standard alarm set on the DDS software. The FASIT tool provided by the Adash DDS helps identify the other mechanical conditions of the threshing unit. The results show 0.5% looseness, 1% unbalance, 1% misalignment, and 5% other mechanical faults. This indicates no severe mechanical machine condition problems and that it is safe to operate for the harvesting season. This method is again validated from the tangential threshing stand and successfully determines the bearing fault condition. Additionally, a PSD response plot (RPSD) is obtained to study the peak g acceleration responses that occur at the resonant frequency on the assembly. Therefore, the fast Fourier transform (FFT) (500 Hz-16 kHz) determined the bearing condition, and the FASIT technology can determine other mechanical conditions such as looseness, misalignment, and the unbalance of the tangential threshing unit.

Author Contributions

Conceptualization, S.B. and E.J.; methodology, S.B.; software, S.B.; validation, E.J. and S.B.; formal analysis, E.J.; investigation, S.B.; resources, E.J.; data curation, S.B.; writing—original draft preparation, S.B.; writing—review and editing, S.B.; visualization, S.B.; supervision, E.J.; project administration, E.J. All authors have read and agreed to the published version of the manuscript.

Funding

This research received no external funding.

Data Availability Statement

Not applicable.

Acknowledgments

We acknowledge the East West Agro (EWA) group, Kaunas, Lithuania, for providing the Massey Ferguson series of combine harvesters for investigation and the Agriculture Academy of Vytautas Magnus University.

Conflicts of Interest

The authors declare no conflict of interest.

Appendix A

Appendix A.1

Figure A1. Manufactured Bracket (Dimensions in mm).
Agriculture 12 01969 g0a1

Appendix A.2

Figure A2. Bearing housing (Dimensions in mm).
Agriculture 12 01969 g0a2

Appendix A.3

Figure A3. Bolt M12 (Dimensions in mm).
Agriculture 12 01969 g0a3

Appendix A.4

Figure A4. Hub (Dimensions in mm).
Agriculture 12 01969 g0a4

Appendix A.5

Figure A5. Threshing shaft (Dimensions in mm).
Agriculture 12 01969 g0a5

Appendix A.6

Figure A6. Threshing disk (Dimensions in mm).
Agriculture 12 01969 g0a6

Appendix A.7

Figure A7. Top cover (Dimensions in mm).
Agriculture 12 01969 g0a7

Appendix A.8

Figure A8. Bottom cover (Dimensions in mm).
Agriculture 12 01969 g0a8

Appendix A.9

Figure A9. Rasp bar (Dimensions in mm).
Agriculture 12 01969 g0a9

References

  1. Špokas, L.; Adamčuk, V.; Bulgakov, V.; Nozdrovicḱ, L. The experimental research of combine harvesters. Res. Agric. Eng. 2016, 62, 106–112. [Google Scholar] [CrossRef] [Green Version]
  2. Zhao, Z.; Li, Y.; Chen, J.; Xu, J. Grain separation loss monitoring system in combine harvester. Comput. Electron. Agric. 2011, 76, 183–188. [Google Scholar] [CrossRef]
  3. Hollaz, B.; Alegra, P. Beater and Feed Mechanism for a Combine Harvester. U.S. Patent US 8,118,652 B2, 21 February 2012. [Google Scholar]
  4. Yao, Y.; Song, Z.; Du, Y.; Zhao, X.; Mao, E.; Liu, F. Analysis of vibration characteristics and its major influenced factors of header for corn combine harvesting machine. Nongye Gongcheng Xuebao/Trans. Chin. Soc. Agric. Eng. 2017, 33, 40–49. [Google Scholar]
  5. Zhong, T.; YaoMing, L.; Rui, W.; JingSong, C. Experimental study of multi-source dynamic load of combine harvester in rice harvesting. Int. Agric. Eng. J. 2016, 25, 46–52. [Google Scholar]
  6. Jiangtao, J.; Jingpeng, H.; Shengsheng, W.; Ruihong, Z.; Jing, P. Vibration and Impact Detection of Axial- Flow Threshing Unit Under Dynamic Threshing Conditions. Inmateh Agric. Eng. 2020, 60, 183–192. [Google Scholar] [CrossRef]
  7. Shamsha, S.M.; Sinha, J.K. Rotor Unbalance Estimation with Reduced Number of Sensors. Machines 2016, 4, 19. [Google Scholar] [CrossRef] [Green Version]
  8. Tang, Z.; Zhang, H.; Zhou, Y. Unbalanced Vibration Identification of Tangential Threshing Cylinder Induced by Rice Threshing Process. Shock. Vib. 2018, 2018, 4708730. [Google Scholar] [CrossRef] [Green Version]
  9. Wang, G.; Wang, X.; Yuan, H. Dynamic analysis for the thresher of a combined harvester subjected to stalk winding. AIP Adv. 2022, 12, 095320. [Google Scholar] [CrossRef]
  10. Xiang, C.; Ren, Z.; Shi, P.; Zhao, H. Data-Driven Fault Diagnosis for Rolling Bearing Based on DIT-FFT and XGBoost. Complexity 2021, 2021, 4941966. [Google Scholar] [CrossRef]
  11. Zhou, L.; Duan, F.; Corsar, M.; Elasha, F.; Mba, D. A study on helicopter main gearbox planetary bearing fault diagnosis. Appl. Acoust. 2019, 147, 4–14. [Google Scholar] [CrossRef]
  12. Lin, H.C.; Ye, Y.C.; Huang, B.J.; Su, J.L. Bearing vibration detection and analysis using enhanced fast Fourier transform algorithm. Adv. Mech. Eng. 2016, 8, 1687814016675080. [Google Scholar] [CrossRef] [Green Version]
  13. Smith, W.A.; Fan, Z.; Peng, Z.; Li, H.; Randall, R.B. Optimised Spectral Kurtosis for bearing diagnostics under electromagnetic interference. Mech. Syst. Signal Process. 2016, 75, 371–394. [Google Scholar] [CrossRef]
  14. Wang, H.Q.; Hou, W.; Tang, G.; Yuan, H.F.; Zhao, Q.L.; Cao, X. Fault detection enhancement in rolling element bearings via peak-based multiscale decomposition and envelope demodulation. Math. Probl. Eng. 2014, 2014, 329458. [Google Scholar] [CrossRef] [Green Version]
  15. Senthil Kumar, M.; Naiju, C.D.; Chethan Kumar, S.J.; Kurian, J. Vibration analysis and improvement of a vehicle chassis structure. Appl. Mech. Mater. 2013, 372, 528–532. [Google Scholar] [CrossRef]
  16. Liu, Z.; Yuan, S.; Xiao, S.; Du, S.; Zhang, Y.; Lu, C. Full Vehicle Vibration and Noise Analysis Based on Substructure Power Flow. Shock. Vib. 2017, 2017, 8725346. [Google Scholar] [CrossRef] [Green Version]
  17. Yu, W. Analysis and Optimization of Low-Speed Road Noise in Electric Vehicles. Wirel. Commun. Mob. Comput. 2021, 2021, 5537704. [Google Scholar] [CrossRef]
  18. Qi, F.; Lei, Y.; Deng, P.; Huang, Q. Car body vertical vibration analysis under track medium wave irregularity and the influence factors of ballast bed. J. Low Freq. Noise Vib. Act. Control. 2019, 38, 1160–1177. [Google Scholar] [CrossRef] [Green Version]
  19. Jahanbakhshi, A.; Ghamari, B.; Heidarbeigi, K. Vibrations analysis of combine harvester seat in time and frequency domain. J. Mech. Eng. Sci. 2020, 14, 6251–6258. [Google Scholar] [CrossRef] [Green Version]
  20. Xu, L.H.; Chai, X.Y.; Gao, Z.P.; Li, Y.M.; Wang, Y.D. Experimental study on driver seat vibration characteristics of crawler-type combine harvester. Int. J. Agric. Biol. Eng. 2019, 12, 90–97. [Google Scholar] [CrossRef]
  21. Chen, S.; Zhou, Y.; Tang, Z.; Lu, S. Modal vibration response of rice combine harvester frame under multi-source excitation. Biosyst. Eng. 2020, 194, 177–195. [Google Scholar] [CrossRef]
  22. Wang, J.; Xu, C.; Xu, Y.; Qi, X.; Liu, Z.; Tang, H. Vibration analysis and parameter optimization of the longitudinal axial flow threshing cylinder. Symmetry 2021, 13, 571. [Google Scholar] [CrossRef]
  23. ISO 10816-3:2019; Mechanical Vibration. Evaluation of Machine Vibration by Measurements on Non-Rotating Parts. ISO Standard: Geneva, Switzerland, 2009.
  24. User ’s Guide Adash 4900. Available online: https://adash.com/documents/A4900/Adash-A4900-Vibrio-manual.pdf (accessed on 1 March 2022).
  25. Qinghua, H.; Li, J.; Ye, F.; Carpinteri, A.; Lacidogna, G. A new frequency domain method for random fatigue life estimation in a wide-band stationary Gaussian random process. Fatigue Fract. Eng. Mater. Struct. 2019, 42, 97–113. [Google Scholar]
Figure 1. (a) Massey Ferguson 7370 Beta; and (b) Massey Ferguson 7347 s Activa.
Agriculture 12 01969 g001
Figure 2. Sensor mounting position: L1 when the accelerometer is placed directly on a bearing seat; and L2 when the accelerometer is placed on a manufactured bracket: (a) The angle of the accelerometer mounted, and (b) The position of the accelerometer mounted.
Agriculture 12 01969 g002
Figure 3. Tangential threshing unit bearing test bench.
Agriculture 12 01969 g003
Figure 4. Computer-aided design of the main units of the tangential threshing units of the test bench.
Agriculture 12 01969 g004
Figure 5. a. Adash A4900 Vibrio M device; and b. AC150 piezoelectric sensor.
Agriculture 12 01969 g005
Figure 6. CAD modal of components: 1. Bearing, 2. Bolt, 3. Bracket, 4. Housing, 5. Threshing disk, 6. Threshing shaft, 7. Hub.
Agriculture 12 01969 g006
Figure 7. Modal analysis of the threshing cylinder. (a) First-order modal shape (70.41 Hz); (b) Second-order modal shape (76.56 Hz); (c) Third-order modal shape (77.85 Hz); (d) Fourth-order modal shape (158.9 Hz); (e) Fifth-order modal shape (185.61 Hz); and (f) Sixth-order modal shape (187.27 Hz).
Agriculture 12 01969 g007
Figure 8. Comparison of the demodulated RMS value when the sensor is mounted on a bracket with respect to the housing of the Beta version in different threshing rotating speeds.
Agriculture 12 01969 g008
Figure 9. Comparison of the demodulated RMS value when the sensor is mounted on a bracket of the Beta and Activa versions at different threshing rotating speeds.
Agriculture 12 01969 g009
Figure 10. Comparison of the vibration parameters values when the sensor is mounted on bracket and the housing of Beta and Activa versions at different threshing rotating speeds: (a) Threshing drum rotating at 220 RPM; (b) Threshing drum rotating at 290 RPM; (c) Threshing drum rotating at 410 RPM; and (d) Threshing drum rotating at 470 RPM.
Agriculture 12 01969 g010aAgriculture 12 01969 g010b
Figure 11. The fast Fourier transform (FFT) (500 Hz–16 kHz) demodulation of the 6310 SKF of the non-driving end of the threshing drum of Massey Ferguson 7374 s (1300 EH) Activa, a sensor mounted on a bracket.
Agriculture 12 01969 g011
Figure 12. The fast Fourier transform (FFT) (500 Hz–16 kHz) demodulation of the 6310 SKF of the non-driving end of the threshing drum of Massey Ferguson 7370 Beta (New), a sensor mounted on housing.
Agriculture 12 01969 g012
Figure 13. The fast Fourier transform (FFT) (500 Hz–16 kHz) demodulation of the 6310 SKF of the non-driving end of the threshing drum of Massey Ferguson 7370 Beta (New), a sensor mounted on a bracket.
Agriculture 12 01969 g013
Figure 14. Top 8 peaks from the overall spectrum (10 Hz–16 kHz) of Massey Ferguson Activa.
Agriculture 12 01969 g014
Figure 15. Top 8 peaks from overall spectrum (10 Hz–16 kHz) of Massey Ferguson Beta.
Agriculture 12 01969 g015
Figure 16. The Adash FASIT tool display for correctable mechanical conditions (looseness, misalignment, bearing, unbalance, and speed).
Agriculture 12 01969 g016
Figure 17. The fast Fourier transform (FFT) (500 Hz–16 kHz) demodulation 6313 KBC of the non-driving end of the tangential threshing drum rotating at 420 rpm with the sensor mounted on the housing.
Agriculture 12 01969 g017
Figure 18. Image of bearing surface inner ring.
Agriculture 12 01969 g018
Figure 19. PSD response vertex.
Agriculture 12 01969 g019
Figure 20. PSD response graph displaying peak g acceleration responses.
Agriculture 12 01969 g020
Table 1. Threshing unit technical parameters of the Activa and Beta version of Massey Ferguson.
Massey Ferguson 7374 s (1300 EH) ACTIVAMassey Ferguson 7370 (New) BETA
Engine power306 KW365 KW
Threshing systemTangential threshingTangential threshing
Threshing drum1340 mm × 600 mm1600 mm × 600 mm
Threshing bearing6310 SKF6310 SKF
No. of drums66
No. of rasp bar1212
Table 2. 6310 SKF bearing details.
Bore diameter50 mm
Outer diameter110 mm
Width27 mm
Static load rating65 kN
Dynamic load rating38 kN
Table 3. Tangential threshing unit test bench parameters.
SegmentDescriptionDimension
PlatformLength3700 mm
Width2060 mm
Height1540 mm
Threshing unitLength1940 mm
Drum diameter597.88 mm
No. of rasp bar8
Fillet parameter of rasp bar (symmetric)3 mm
Rasp bar length1176 mm
Width45 mm
Distance between rasp bar178 mm
Length65 mm
Bearing (KBC 6313 BS)Bore diameter65 mm
Outer diameter140 mm
Raceway width33 mm
Table 4. Material properties of S235.
Material PropertiesS235
Density ρ 7850 kg/m3
Unit weight γ78.5 KN/m3
Young’s modulus210,000 MPa
Shear modulus G81,000 Mpa
Yield strength fy235 Mpa
Ultimate strength fu360 Mpa
Poisson’s ratio in elastic range ν0.3
Coefficient of linear thermal expansion α12 × 10−6 °K−1
Table 5. Eigenvalues of the bracket and components.
Mode 1 (Hz)Mode 2 (Hz)Mode 3 (Hz)Mode 4 (Hz)Mode 5 (Hz)Mode 6 (Hz)
Bracket1918.53598.26566.88610.816,58621,780
Housing5027.45078.450865153.35203.45748.7
Bolt43,89344,42247,37285,08794,16194,580
Threshing shaft130.02131.64355.46359.73689.14687.11
Disk779.03948.93953.321253.71379.81586.9
Hub165.13166.81253.97256.03281.54471.13
Threshing drum assembly70.41576.56377.855158.19185.61187.27
Table 6. Fundamental frequencies of the 6310 SKF bearing.
Fundamental train frequency (FTF)0.381 Hz
Ball spin frequency (BSF)1.98 Hz
Ball passing frequency of outer race (BPFO)3.05 Hz
Ball passing frequency of inner race (BPFI)4.95 HZ
Table 7. Conversion from FFT to PSD.
Fundamental Bearing Frequencies at 420 rpm of 6313 KBCFFT Amplitude Demodulated RMS (g)PSD Amplitude (g2/Hz)
Fundamental train frequency (FTF) (2.69 Hz.)0.005 3.405 × 10 5
Ball spin frequency (BSF) (21.5 Hz.)0.009 1.1031 × 10 4
Ball passing frequency of outer race (BPFO) (25.5 Hz.)0.004 2.179 × 10 5
Ball passing frequency of inner race (BPFI) (34.5 Hz.)0.01 1.3619 × 10 4
Table 8. Random Input PSD (10–2000 Hz.).
Frequency (Hz)G Acceleration (G2/Hz)
10 0.1
25.5 0.5
100 0.5
1000 0.5
2000 0.2
Publisher’s Note: MDPI stays neutral with regard to jurisdictional claims in published maps and institutional affiliations.

