Communication

Explainable Neural Network for Classification of Cotton Leaf Diseases

1
Computer Science Department, University of Wah, Wah 47010, Pakistan
2
National University of Technology, Islamabad 44000, Pakistan
3
Wah Campus, COMSATS University Islamabad, Wah 47040, Pakistan
4
Department of Applied Data Science, Noroff University College, 4612 Kristiansand, Norway
5
Artificial Intelligence Research Center (AIRC), College of Engineering and Information Technology, Ajman University, Ajman 346, United Arab Emirates
6
Department of Electrical and Computer Engineering, Lebanese American University, Byblos 13-5053, Lebanon
7
Department of Software, Kongju National University, Cheonan 31080, Republic of Korea
*
Authors to whom correspondence should be addressed.
Agriculture 2022, 12(12), 2029; https://doi.org/10.3390/agriculture12122029
Submission received: 23 September 2022 / Revised: 30 October 2022 / Accepted: 11 November 2022 / Published: 28 November 2022
(This article belongs to the Special Issue The Application of Machine Learning in Agriculture)

Abstract

:
Every nation’s development depends on agriculture. The term “cash crops” refers to cotton and other important crops. Most pathogens that significantly harm crops also impact cotton. Numerous diseases that influence yield via the leaf, such as powdery mildew, leaf curl, leaf spot, target spot, bacterial blight, and nutrient deficiencies, can affect cotton. Early disease detection protects crops from additional harm. Computerized methods perform a vital role in cotton leaf disease detection at an early stage. The method consists of two core steps such as feature extraction and classification. First, in the proposed method, data augmentation is applied to balance the input data. After that, features are extracted from a pre-trained VGG-16 model and passed to 11 fully convolutional layers, which freeze the majority and randomly initialize convolutional features to subsequently generate a score of the anomaly map, which defines the probability of the lesion region. The proposed model is trained on the selected hyperparameters that produce great classification results. The proposed model performance is evaluated on two publicly available Kaggle datasets, Cotton Leaf and Disease. The proposed method provides 99.99% accuracy, which is competent compared to existing methods.

1. Introduction

The primary cause of the decline in cotton productivity is cotton diseases. Approximately 80 to 90% of cotton diseases, including Alternaria spot in leaves and bacterial leaf blight, mostly affect the leaves of cotton plants. Many people rely on the crop of cotton, either for its production or for its processing. Due to rising domestic and global demand, the productivity of cotton has recently become more goal-oriented [1]. Experts typically use their own eyes to assess symptoms. However, in the case of large farms, this calls for ongoing expert monitoring, which is costly. Farmers interpret symptoms based on their own experiences; inaccurate diagnosis results in incorrect control measures, such as the overuse of pesticides at the wrong time. By making cotton fields more productive and complicated, detecting these illnesses by sight reduces the accuracy of identification efficiency. With such a poor method, even a medical professional would be unable to examine and identify the infections with their own eyes, further wasting crops of cotton. These erroneous inferences frequently lead to the application of superfluous pesticides that negatively impact healthy leaves of cotton. Even a brief absence from the farm will have an impact on the GDP of the entire country [2]. Deep learning integrates data analysis and image processing to make more likely discoveries. Because it has been a successful application, it is being used in agriculture. Many deep learning-based programs, including RNNs, DBNs and CNNs, are currently capable of accurately performing tasks [3]. CNNs, however, are the research’s most well-known applications. CNN approaches are being utilized to identify various objects and generate automatic diagrams of directions for evaluation. Deep learning attracts attention as it is used to improve performance on a variety of tasks that offer data from human involvement [4,5,6,7]. Deep learning is being used extensively in the real world to decode the functions of the brain [8,9]. Several methods have been proposed for cotton disease detection, but there are still limitations in the existing work because of poor contrast, the association between the texture patterns of the symptoms and healthy pixels, variations in the shape, texture, and color of leaves, redundant features, and class imbalance problems [10,11]. To overcome such limitations, the one-class explainable neural network method is proposed. The core contribution steps of the proposed method are as follows:
  • Data augmentation is applied in terms of rotation and scaling to balance the data on cotton leaves.
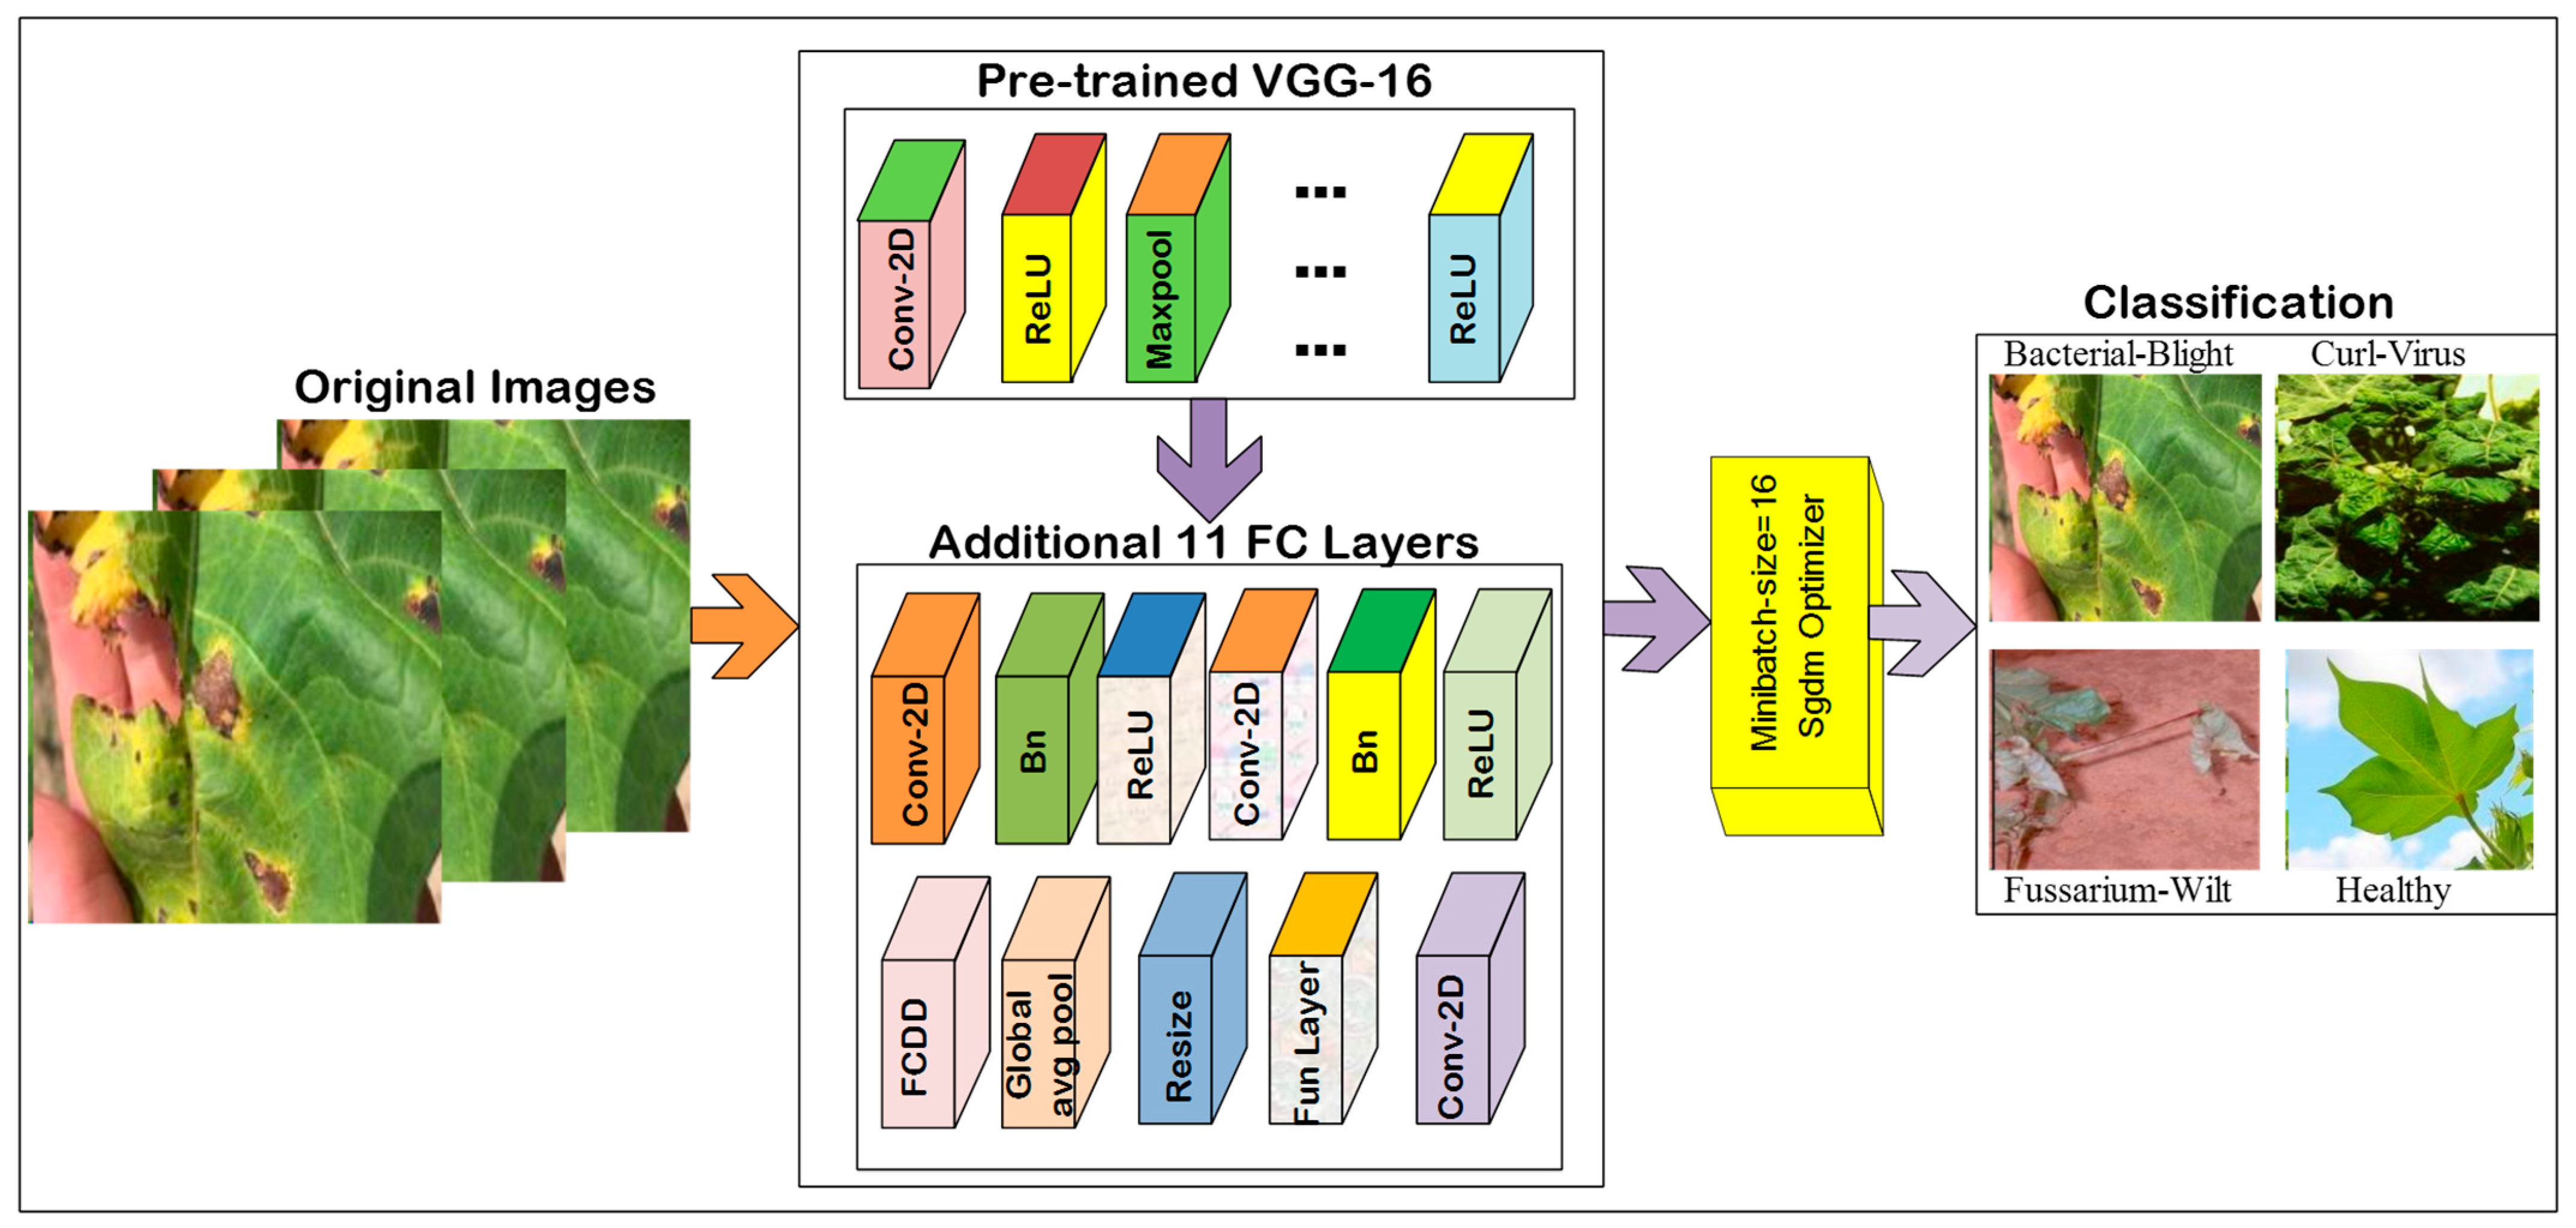
  • The features are extracted from the VGG-16 and passed as input to a model with eleven fully convolutional layers. Said model is trained on selected hyperparameters after extensive experimentation for optimum training.
The article organization is as follows: Section 2 discusses the related work; the steps of the proposed method are explained in Section 3; the obtained outcomes written in Section 4; and conclusion is provided in Section 5.

2. Related Works

The discrete wavelet transform has been applied with k-means clustering for segmentation [12]. Classification between normal and abnormal images has been performed through neural networks and achieved an accuracy of 90% [13]. The color features were extracted through color-based histogram and shape features by Canny and Sobel methods to compute the location/variance of the edges. The texture skew divergence was computed through a Gabor filter [14]. The features were extracted through a self-organizing map and classify the cotton leaf images based on neural network [15]. A median filter was used for image smoothing and segmenting the cotton diseases using fuzzy c-means clustering [16]. The VGG-16 model has been used for cotton disease classification. The optimum features were selected using PCA, and the performance of this method was tested on 2204 images [17]. The texture and color features, as well as SVM, NB and multi-layer perceptron classifiers, were used to provide 96.69% accuracy [18]. The cotton leaf images were converted into grayscale, and GLCM features were extracted; then three convolutional layers were applied vertically, horizontally and in a grid manner. The extracted feature vectors were passed to softmax for the classification of the normal/abnormal cotton leaf images, attaining 80% accuracy [19]. A mask-RCNN model was applied with transfer learning for cotton disease detection with 94% accuracy [10]. A CNN model was trained on selected parameters, such as 300 training epochs, and a dense layer was added with flattening for optimization. This method provides 99.38% classification accuracy [20]. A bilateral filter was used for noise reduction. The level set and Chan-Vese techniques were applied for the segmentation of cotton disease, attaining a 0.96 precision rate [21]. The pre-trained efficient-net-b0 was applied for disease detection and found to provide 99.95% accuracy [11]. An SVM model was used with regression for cotton disease classification with 83.26% accuracy [22]. A 3D-CNN model was applied for the detection of infections [23].The pre-trained VGG-16, ResNet-50, VGG-19, DenseNet-121, NasNetlarge, Xception, inceptionresnetv2 and inceptionv3 models were fine-tuned for classification. The Densenet-121 model provided the highest accuracy, attaining values of 98.77% [24].

3. Materials and Methods

A cotton leaf disease classification method is proposed, which consists of two core steps: feature extraction and classification. Data augmentation is used during the preprocessing phase to balance the input data. Following that, features are retrieved using two convolutional neural networks, FCDD and VGG-16, which are then trained using the chosen hyperparameters that improve classification outcomes.
Figure 1 shows the suggested model’s overall layout.
In the study being presented, two publicly accessible datasets are being used: Cotton Disease [25] and Leaf [26].
These datasets are downloaded from the Kaggle website. The Cotton Disease dataset contains two classes, normal and abnormal, and the Cotton Leaf dataset comprises four classes: curl virus (CV), Fusarium wilt (FW), healthy, and bacterial blight (BB).
The cotton leaf dataset contains three folders: training, testing and validation. The training comprises 288 diseased and 427 healthy samples, while testing and validation have 25/26 and 43/66 samples, respectively. The multi-class data contain four classes, in which there are 434/334/335/340 training and 90/84/84/85 testing images of BB, CV, FW and healthy samples, respectively.
Data augmentation was applied through rotation, scaling (configure image data augmentation—MATLAB (mathworks.com (accessed on 9 October 2022))) and translation (translate an image using imtranslate function—MATLAB and Simulink—MathWorks India) to increase and balance the size of the images [27]. The images were resized into dimensions of 200 × 200 × 3 .
All experiments were implemented on an 11th-generation Intel i7 core and a 2070 RTX on a Windows operating system running MATLAB toolbox R2022a.

Features Extraction Using Convolutional Neural Networks

The input cotton leaf data was augmented in terms of rotation and scaling to balance the data, which was then passed to the deep learning models for feature extraction and classification.
In the proposed model, VGG-16 is used; it consists of 24 layers, including 10 convolutional, 10 ReLU, and 3 maxpooling layers, which are passed to the additional 11 fully connected layers, including 3 convolutional layers, 2 batch-normalization layers, 1 functional layer, 1 FCDD loss layer, 1 2D resize layer, 1 average pool layer, and 2 ReLU layers. One-class deep classification is used to perform lesion detection through learning the neural model in which mapped samples of nominal that are close to the c-centre in the space of the output [28]. The hypersphere classifier is a modified version of semi-supervised DSVDD. Let u 1 , u n represent the number of input samples and v 1 , v n represent the labels in which vi = 1 is an infected region and v i = 0 represents a nominal sample. The objective of HSC is:
min w , c 1 n i = 1 n ( 1 v i ) h ( φ ( u 1 ; w ) c ) u 1 log ( 1 exp ( h ( φ ( u 1 ; w ) c ) ) )
Here, c R d denotes the center, and φ :   R c × h × w R d denotes the neural model with w weights.
The Huber pseudo-loss h(a) = a 2 2 1 is a robust function of loss which interpolates quadratic to the penalization of linear. The loss of HSC φ encourages mapped normal samples that are close to c and infected samples far from the c center. The c-centre relates to the bias from the last network layers, such as the φ network. The objective FCDD is defined as follows. The HSC is used with FCN; a method is proposed known as a one-class deep network in which output features maintain spatial information and serve to downsample the heatmap of the anomaly. The up-sampling process is used to preserve the full resolution of the heatmap. The FCDD model is trained on the infected and normal cotton imaging data. With FCN φ :   R c × h × w R u × v , the objective of FCDD uses Huber pseudo-loss on the FCN output A ( u ) = ( p φ ( u ; w ) 2 + 1 1 ), where all element-wise operations are applied. The FCDD objectives are:
min w 1 n i = 1 n ( 1 v i )   1 l . m A ( u i ) 1 v i log ( 1 exp   ( 1 l . m A ( u i ) 1 ) )
Here, A ( u i ) 1 represent the sum of A ( u i ) positive entries. FCDD is used with FCN in conjunction with novel HSC loss adaptation. The main objective is to maximize A ( u i ) 1 for infectious samples and minimize normal samples. A ( u i ) 1 is used as the infection score. A ( u ) entries contribute to A ( u i ) 1 , which relates to input regions that are added to the anomaly scores. The region shapes are the dependent receptive field of the FCN. The proposed model training parameters with error rate are mentioned in Table 1.
The hyperparameters mentioned in Table 1, including a batch size of 16 with the Sgdm optimizer, were utilized for model training and provided a 0.1 error rate.

4. Results and Discussion

In this work, three experiments were performed for cotton disease classification, including binary and multi-classification.

4.1. Experiment #1: Cotton Diseases Classification

In this experiment, cotton images were classified into the binary classes of infected and normal. The classification outcomes are computed in terms of different measures such as accuracy, precision, F1-scores, and recall, as depicted in Table 2. As shown in Figure 2, the categorization outcomes are displayed in a confusion matrix.
In Table 2, the classification results are computed on cotton diseases in terms of 5- and 10-fold cross-validation, where we achieved 99.58% accuracy, 1.0 precision, on 5-fold. Similarly, on 10-fold, the achieved results are 98.89% accuracy, 0.99 precision, and 0.98 recall. The computed results are graphically presented in Figure 3.

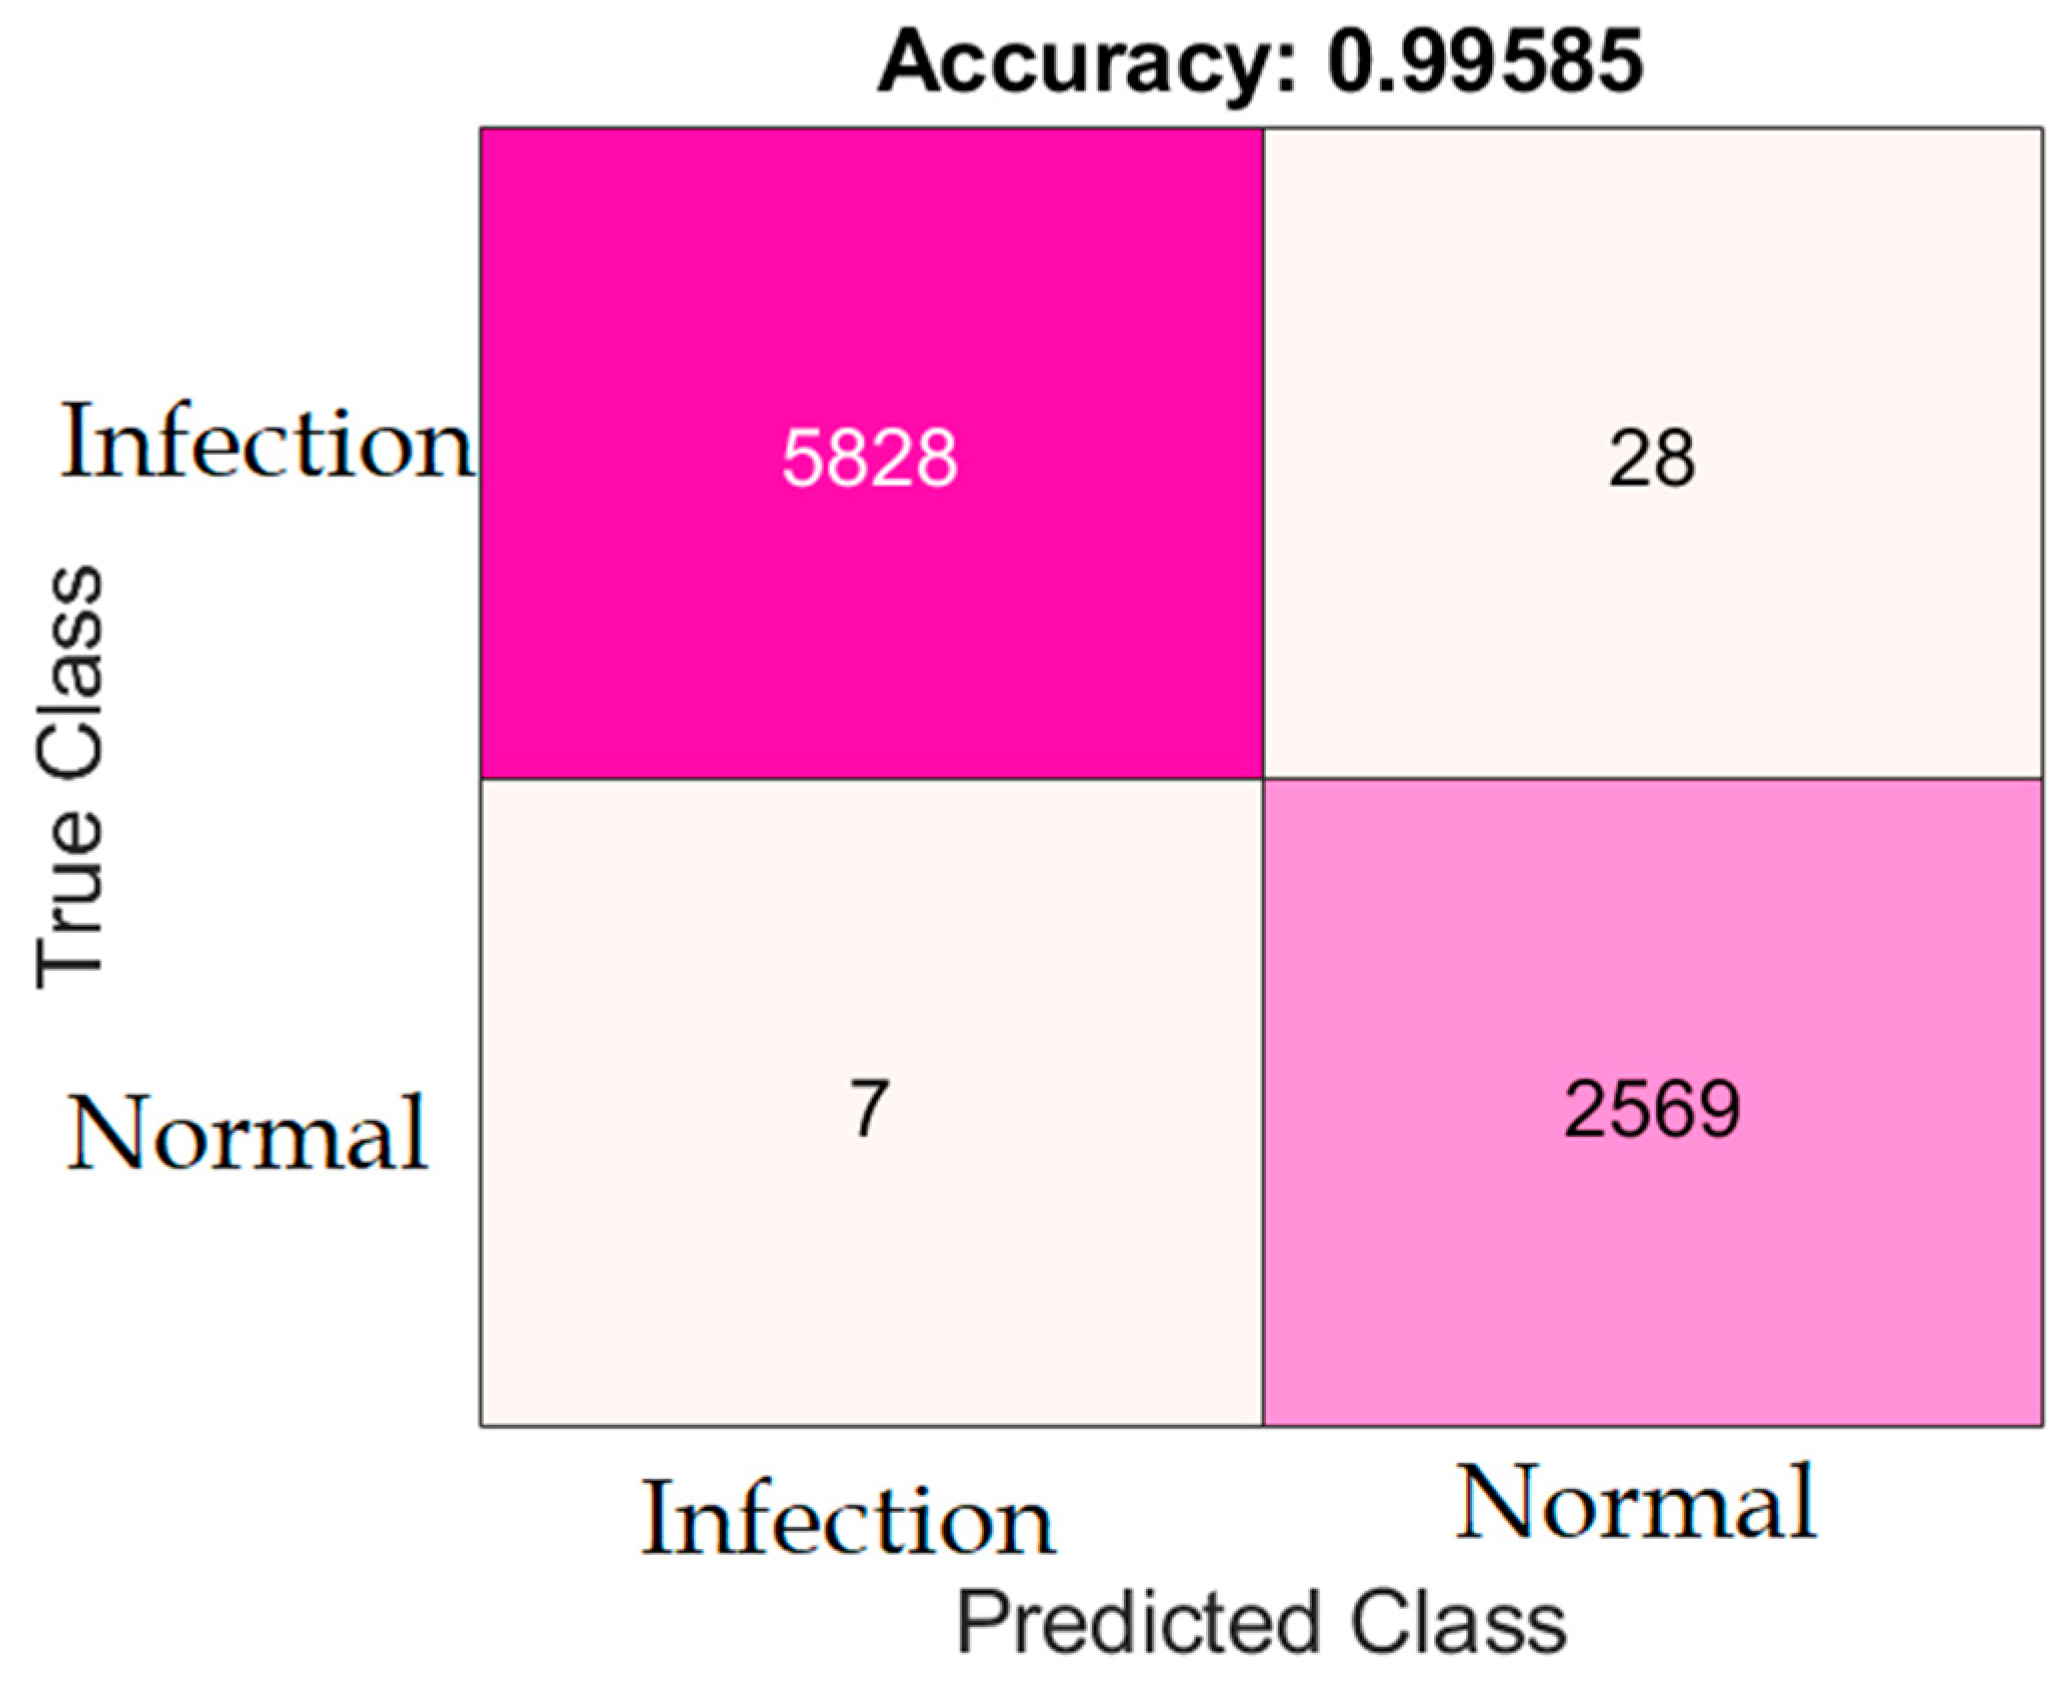
4.2. Experiment #2: Classification of Cotton Leaf

The cotton leaf classification was performed using normal and abnormal classes. The classification results are computed in terms of 5- and 10-fold cross-validation, as depicted in Table 3.
Table 3 depicts the classification results of cotton leaf based on 5- and 10-fold cross-validation. On 5-fold, we achieved accuracy of 95.89%. On 10-fold, the achieved accuracy is 99.91%. The achieved ROC is graphically plotted in Figure 4.
The suggested leaf classification methods are contrasted with those obtained using the cutting-edge techniques listed in Table 4.

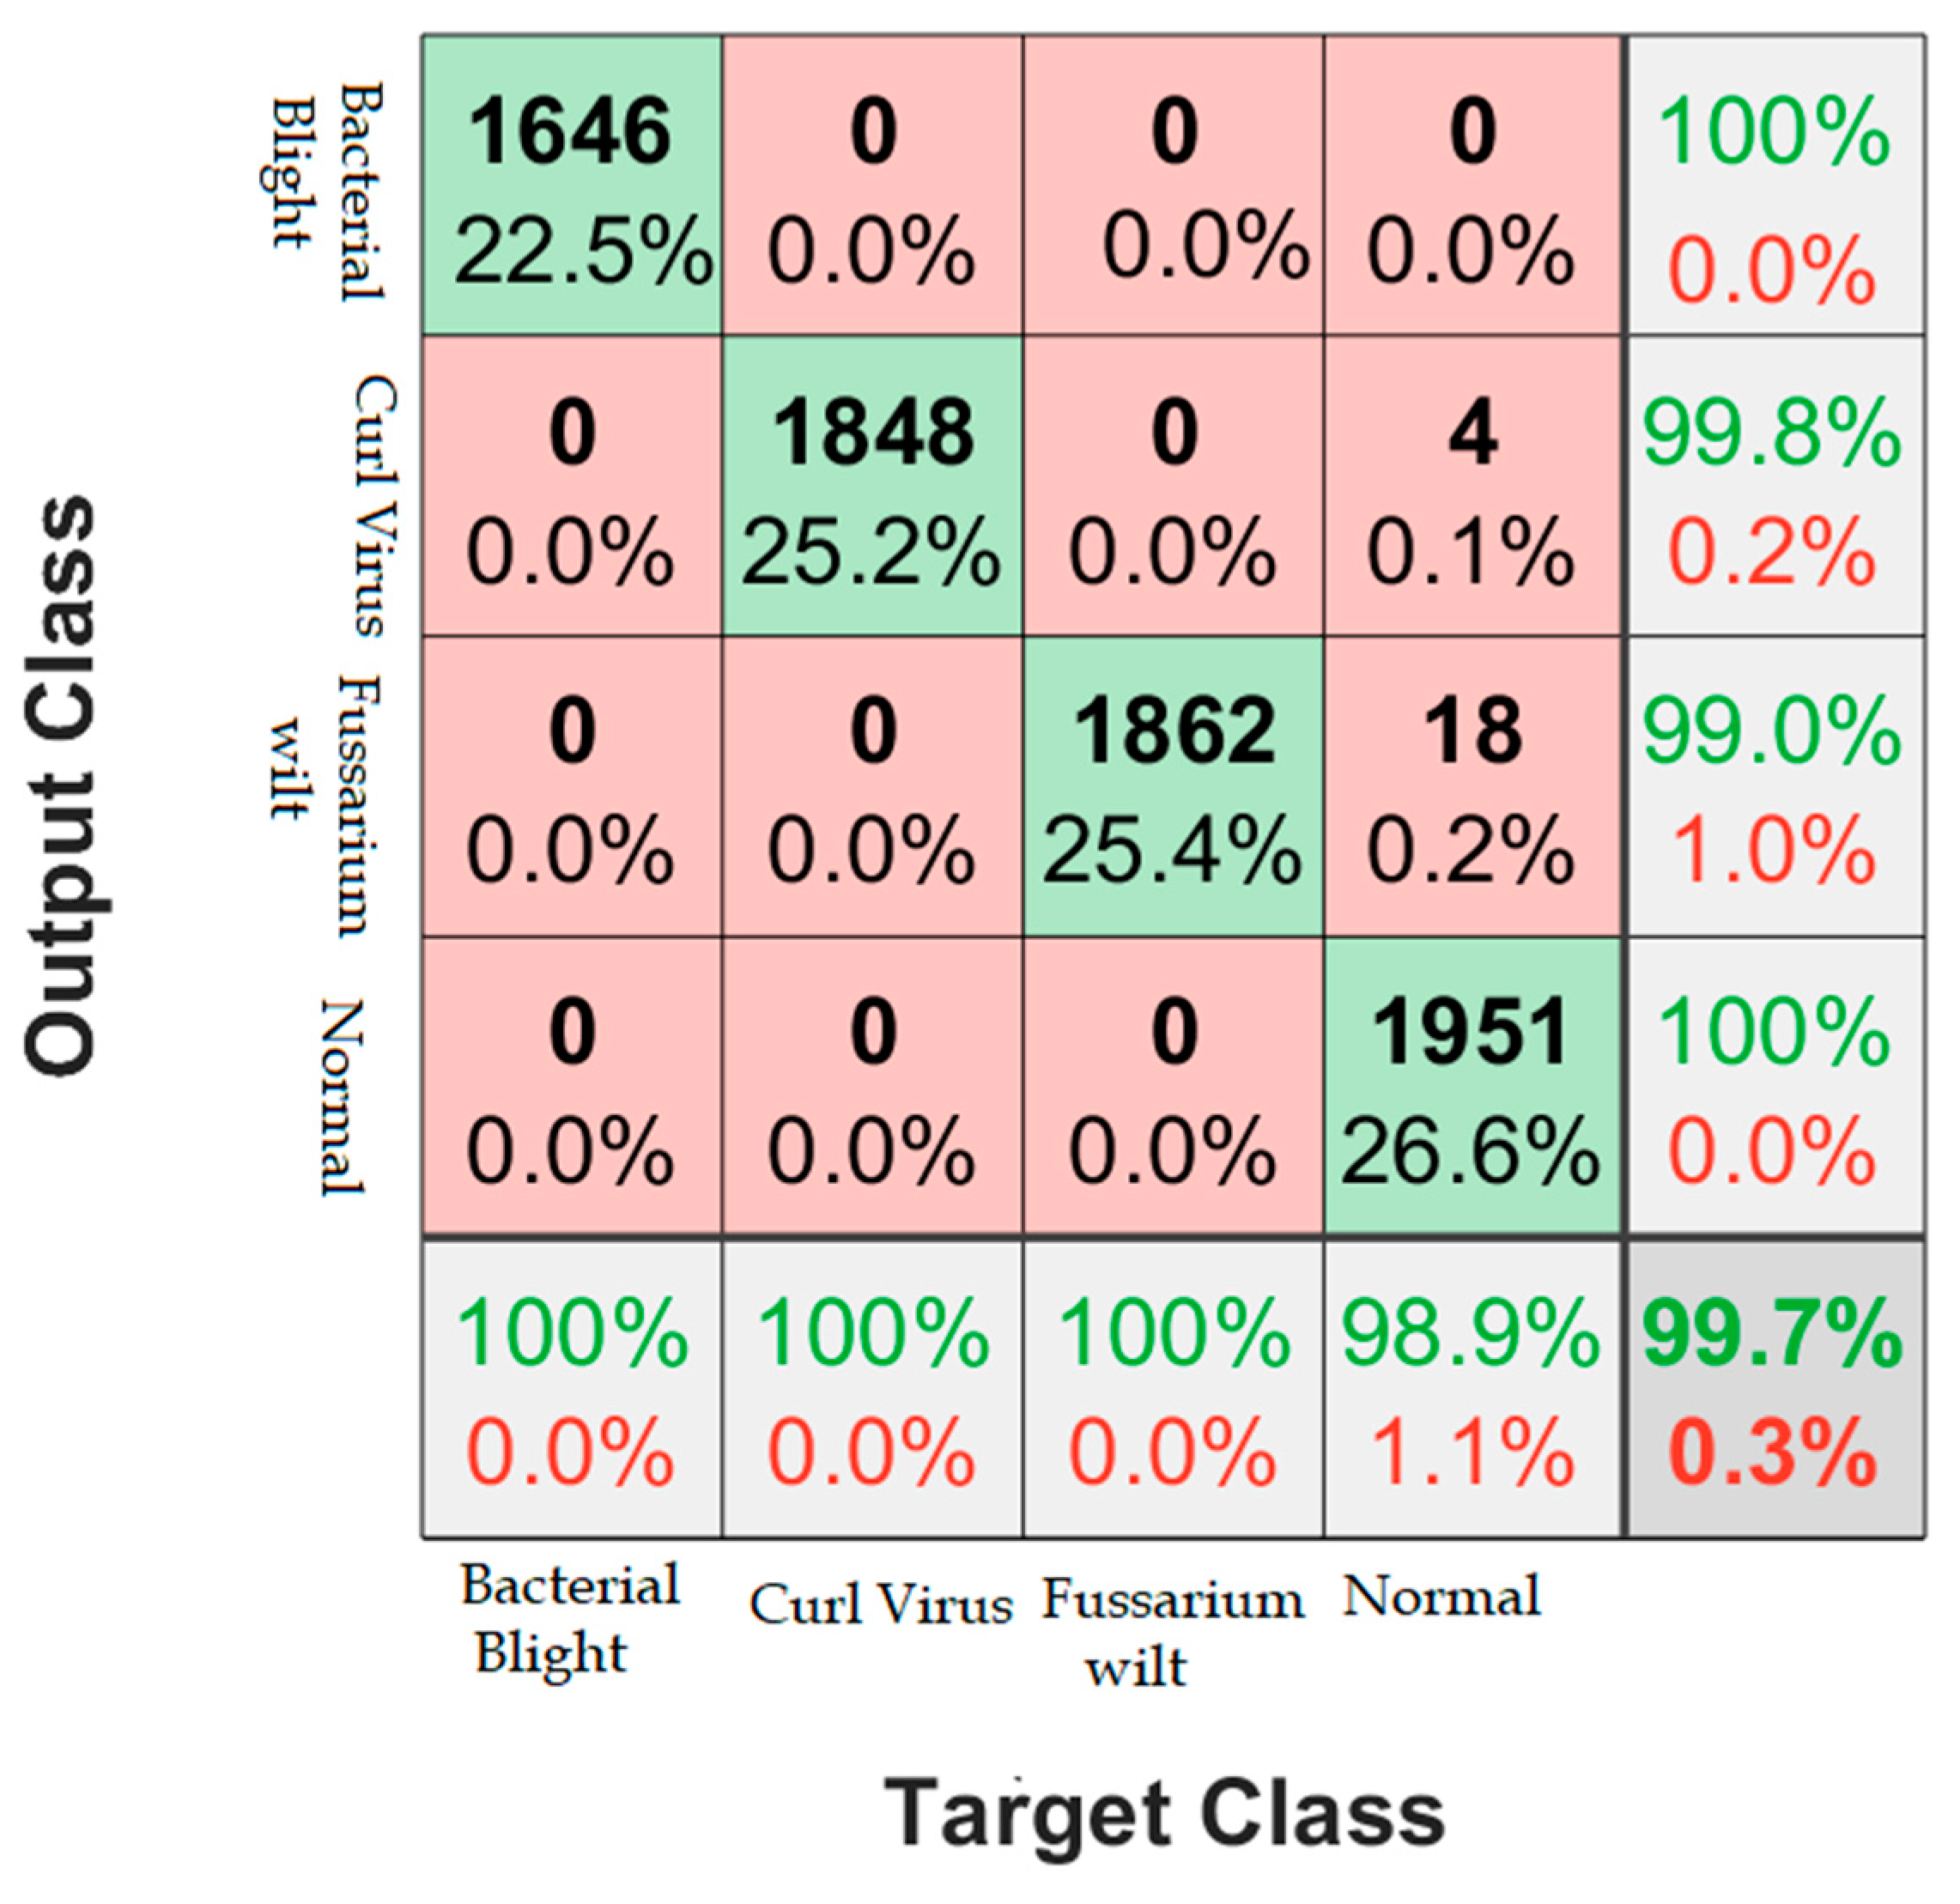
4.3. Multi-Classification of Cotton Leaf Infection

The cotton leaf infections were classified as normal, bacterial blight, curl virus, and Fusarium wilt using 5- and 10-fold cross-validation, as mentioned in Table 4. The classification results are graphically shown in Figure 5.
Table 4 depicts the classification outcomes, in which we achieved an accuracy of 100% on CV, 99.95% on FW, 99.75% on BB and 99.70% on the normal class based on 5-fold cross-validation. However, on 10-fold cross-validation, we achieved an accuracy of 100% on CV, 99.92% on FW, 99.74% on BB and 99.66% on the normal class. Table 5 depicts the comparison of the results.
The pre-trained VGG-16, ResNet-50 and custom CNN were used for classification and provided accuracies of 98.10%, 95.37% and 98.32% [29]. The k-means clustering method iwas used with the OTSU method for segmentation. Then, GLCM and LBP features were derived and passed to the classifiers, attaining 92.2% accuracy [30]. The transfer learning model was used with mask-RCNN for cotton disease detection with 94.0% accuracy [31]. The pre-trained Alex-net model was used for the classification of cotton leaves with 97.98% accuracy [32]. The cotton diseases were classified into four classes based on the deep learning features, attaining 96.4% accuracy [11].

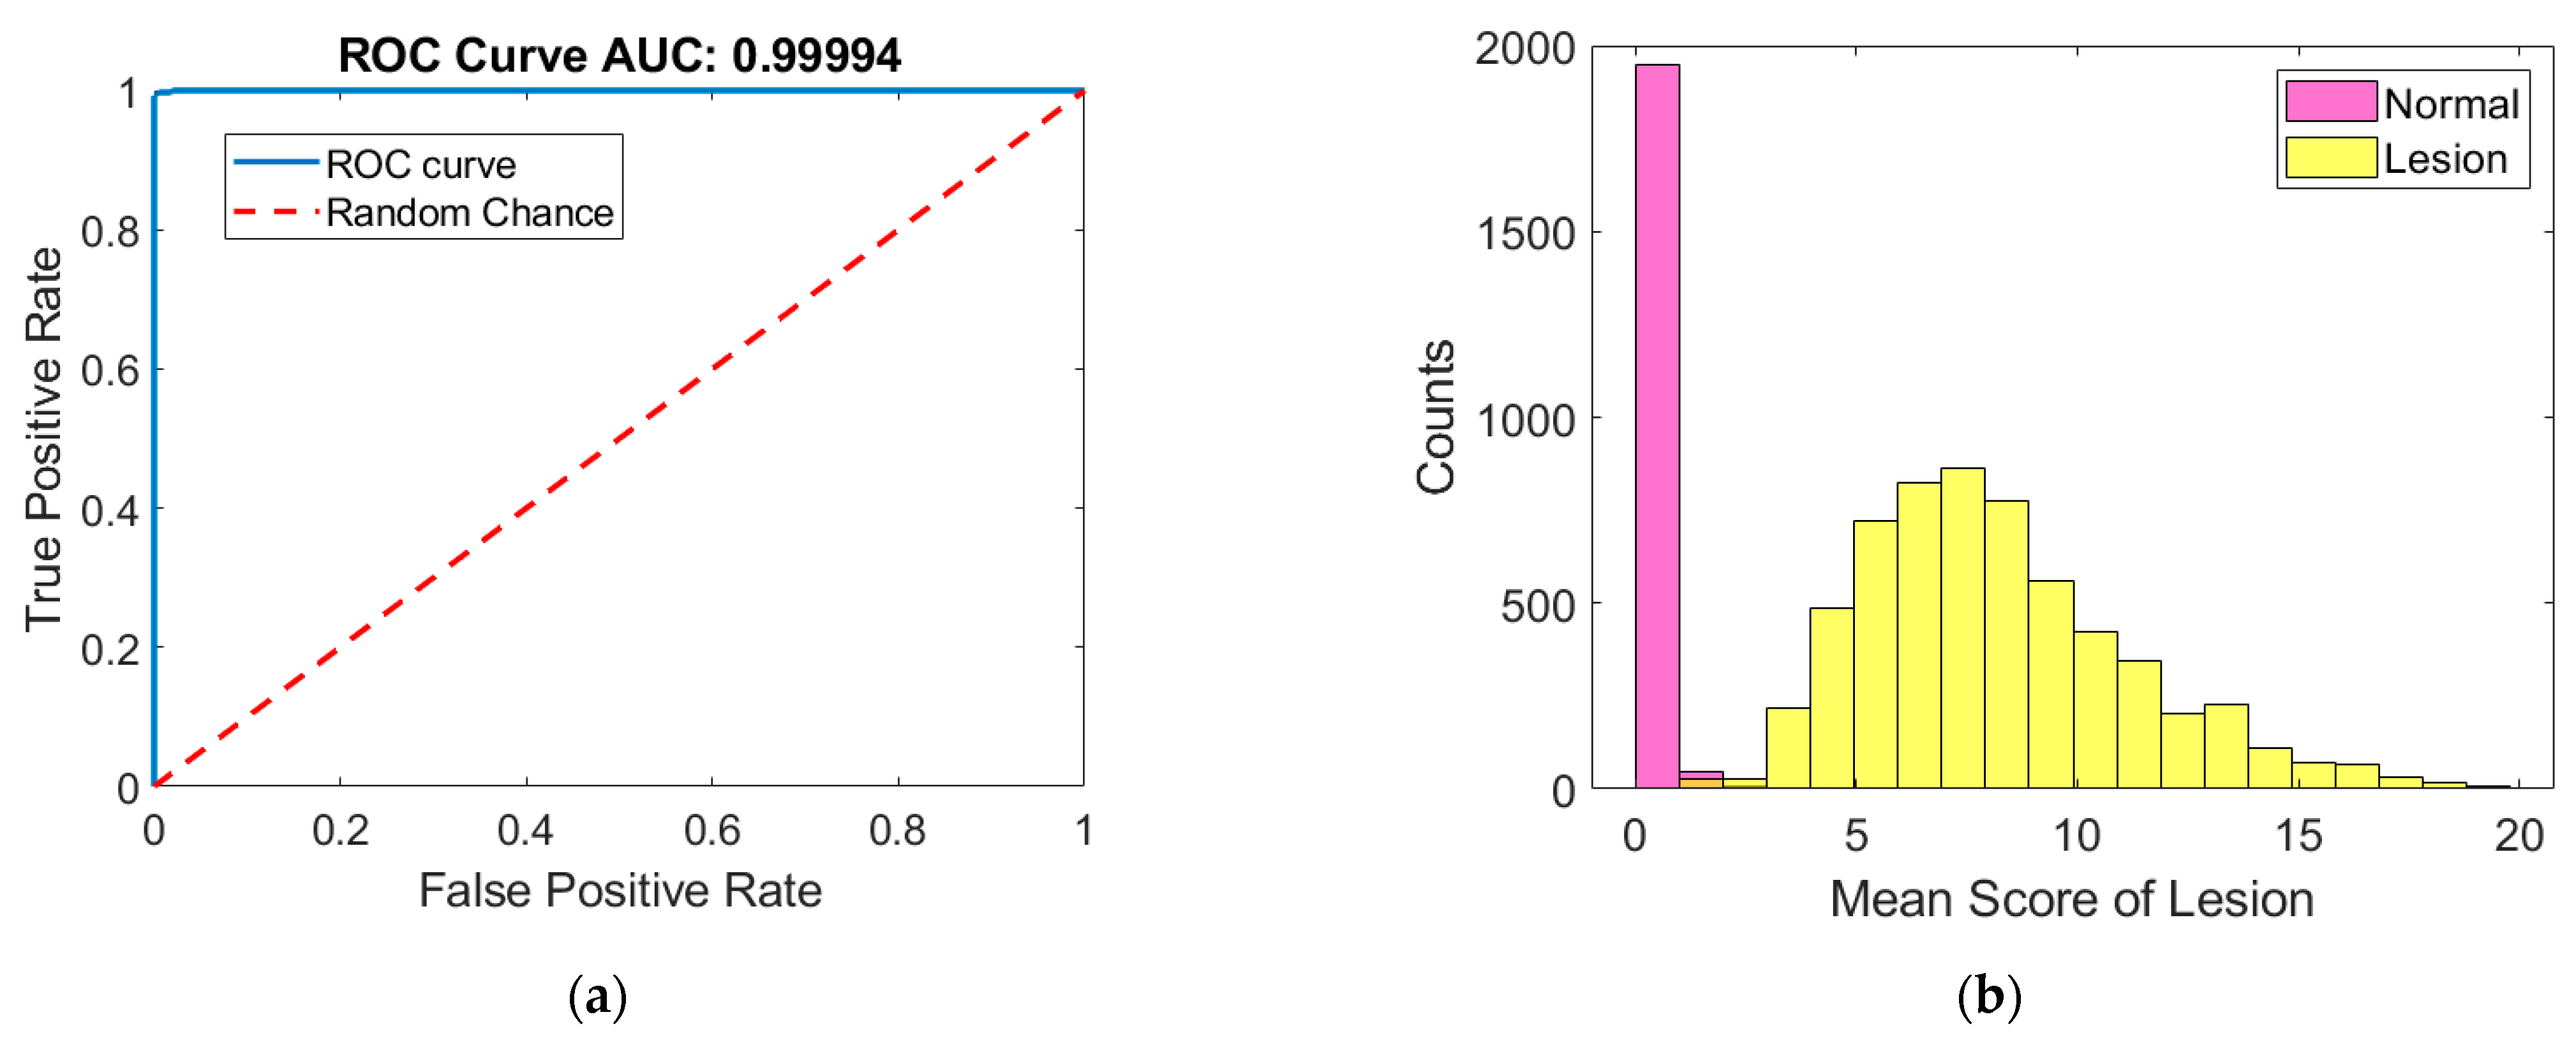
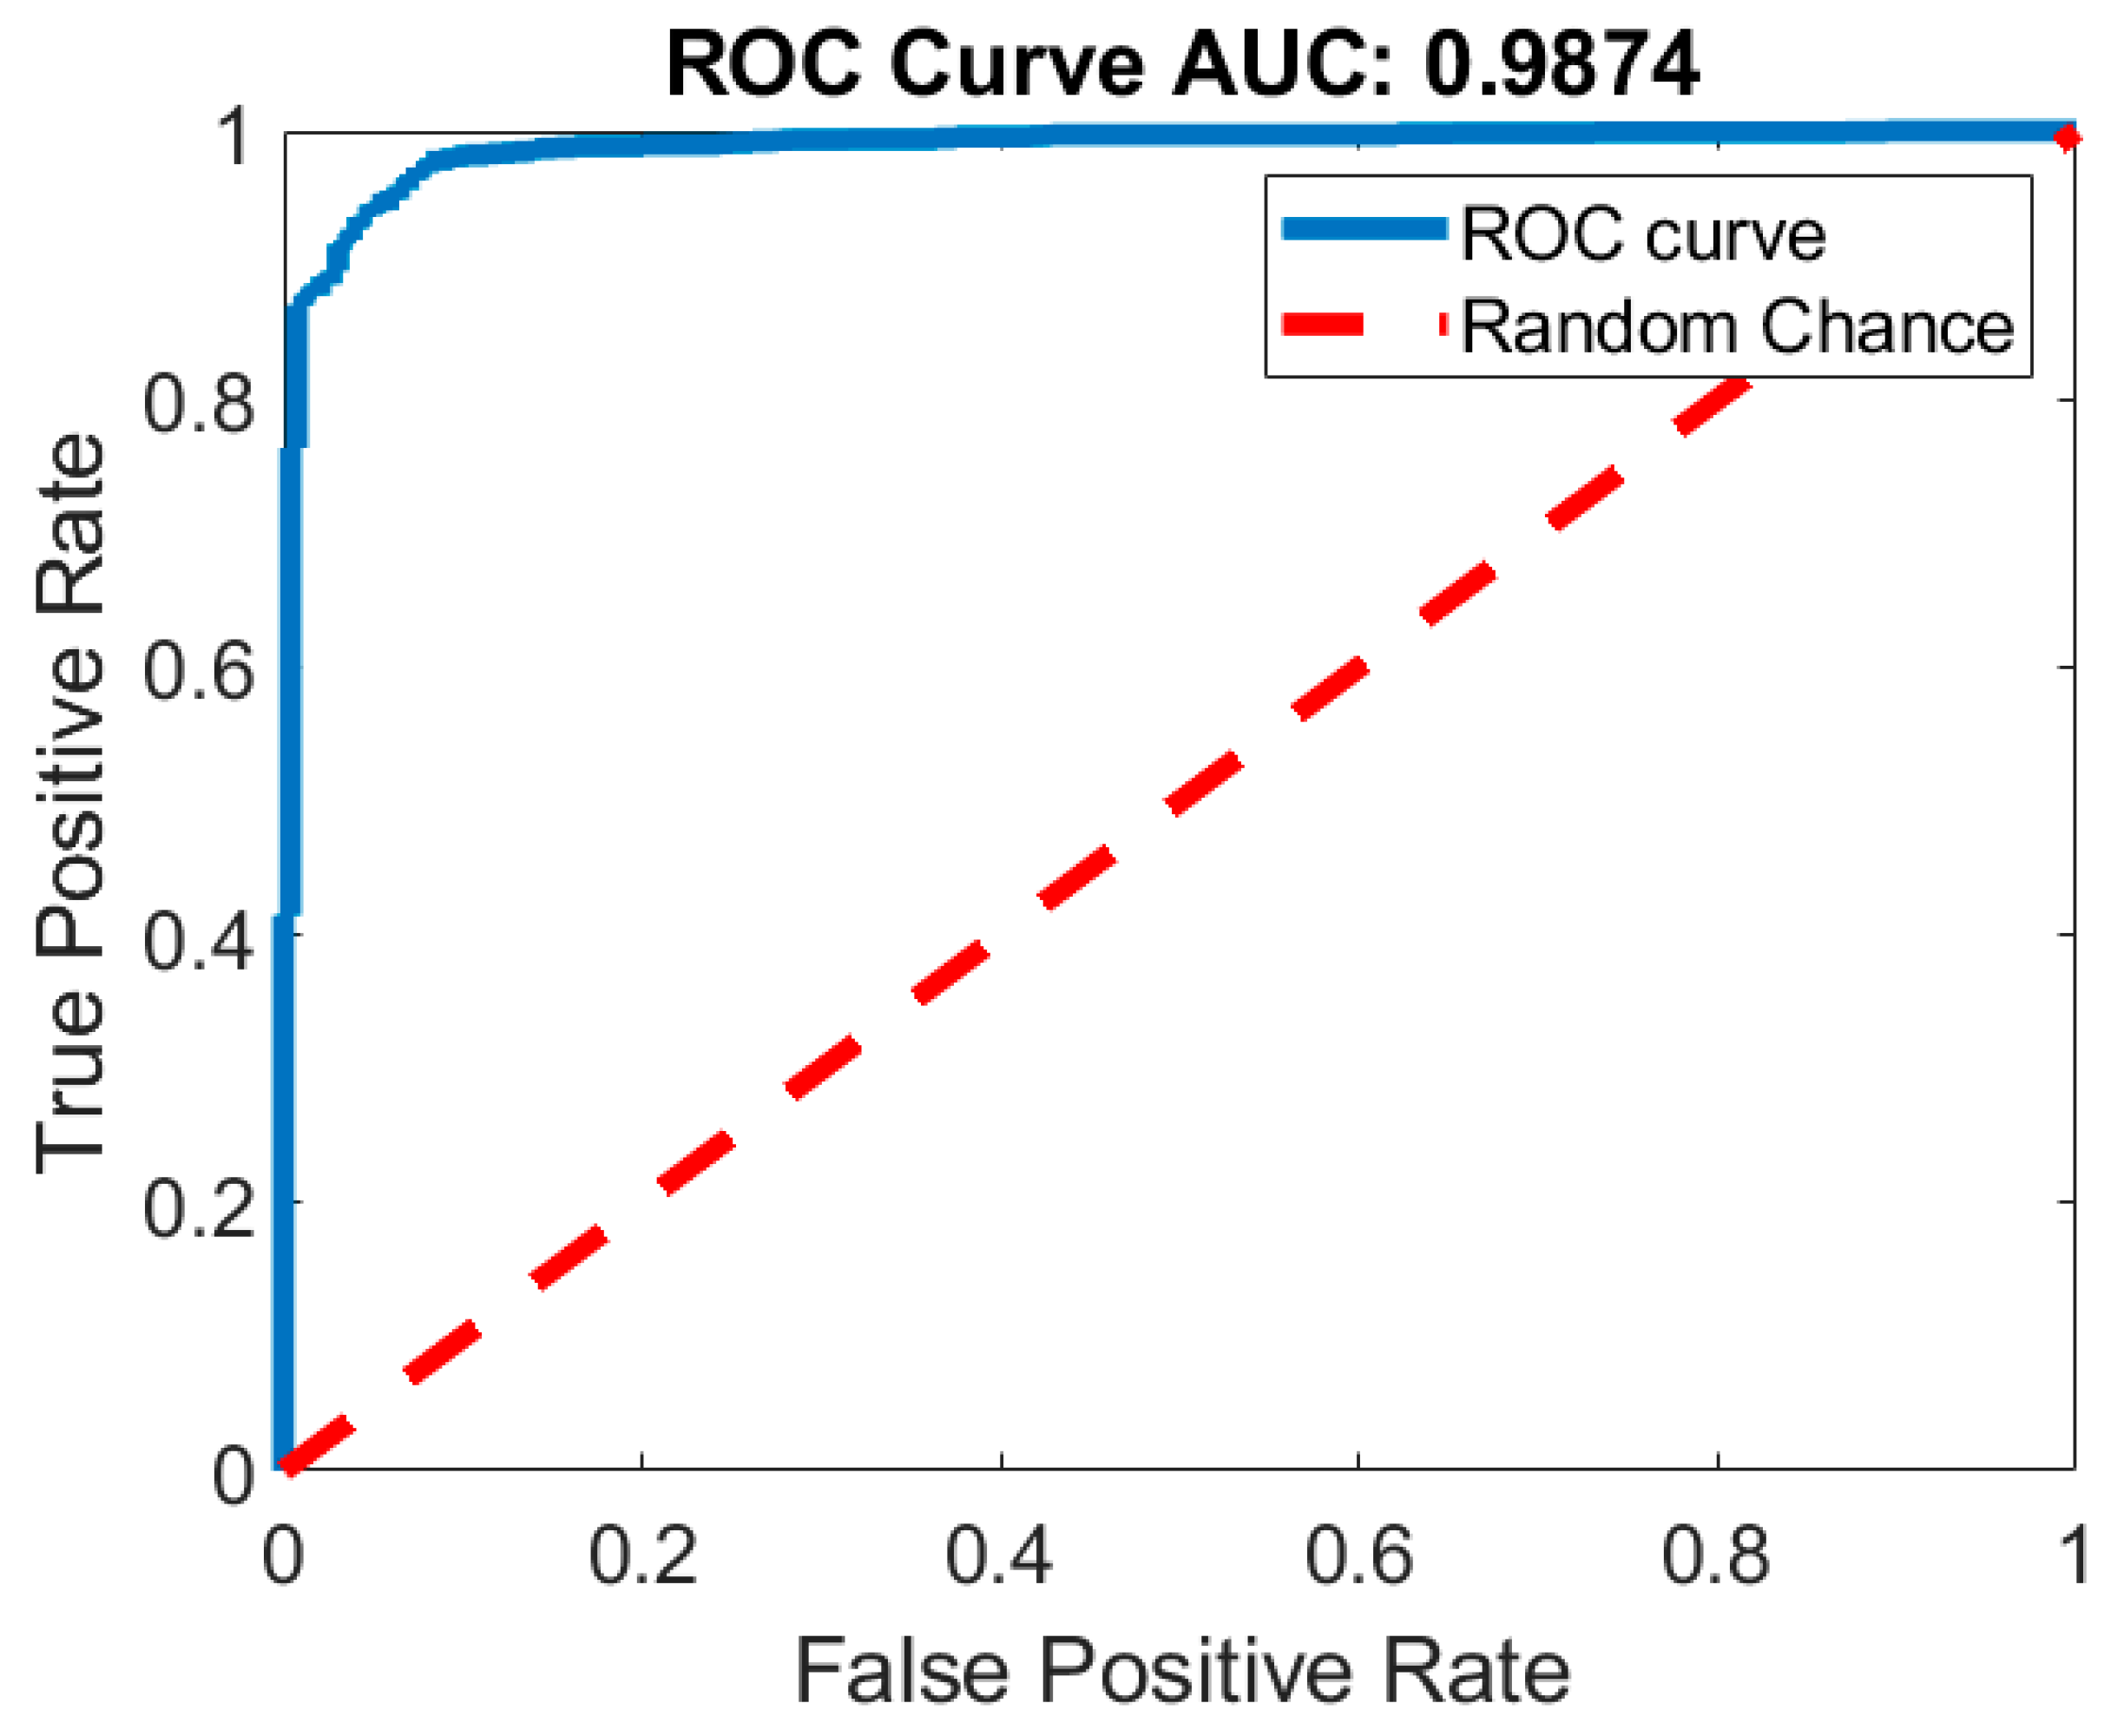
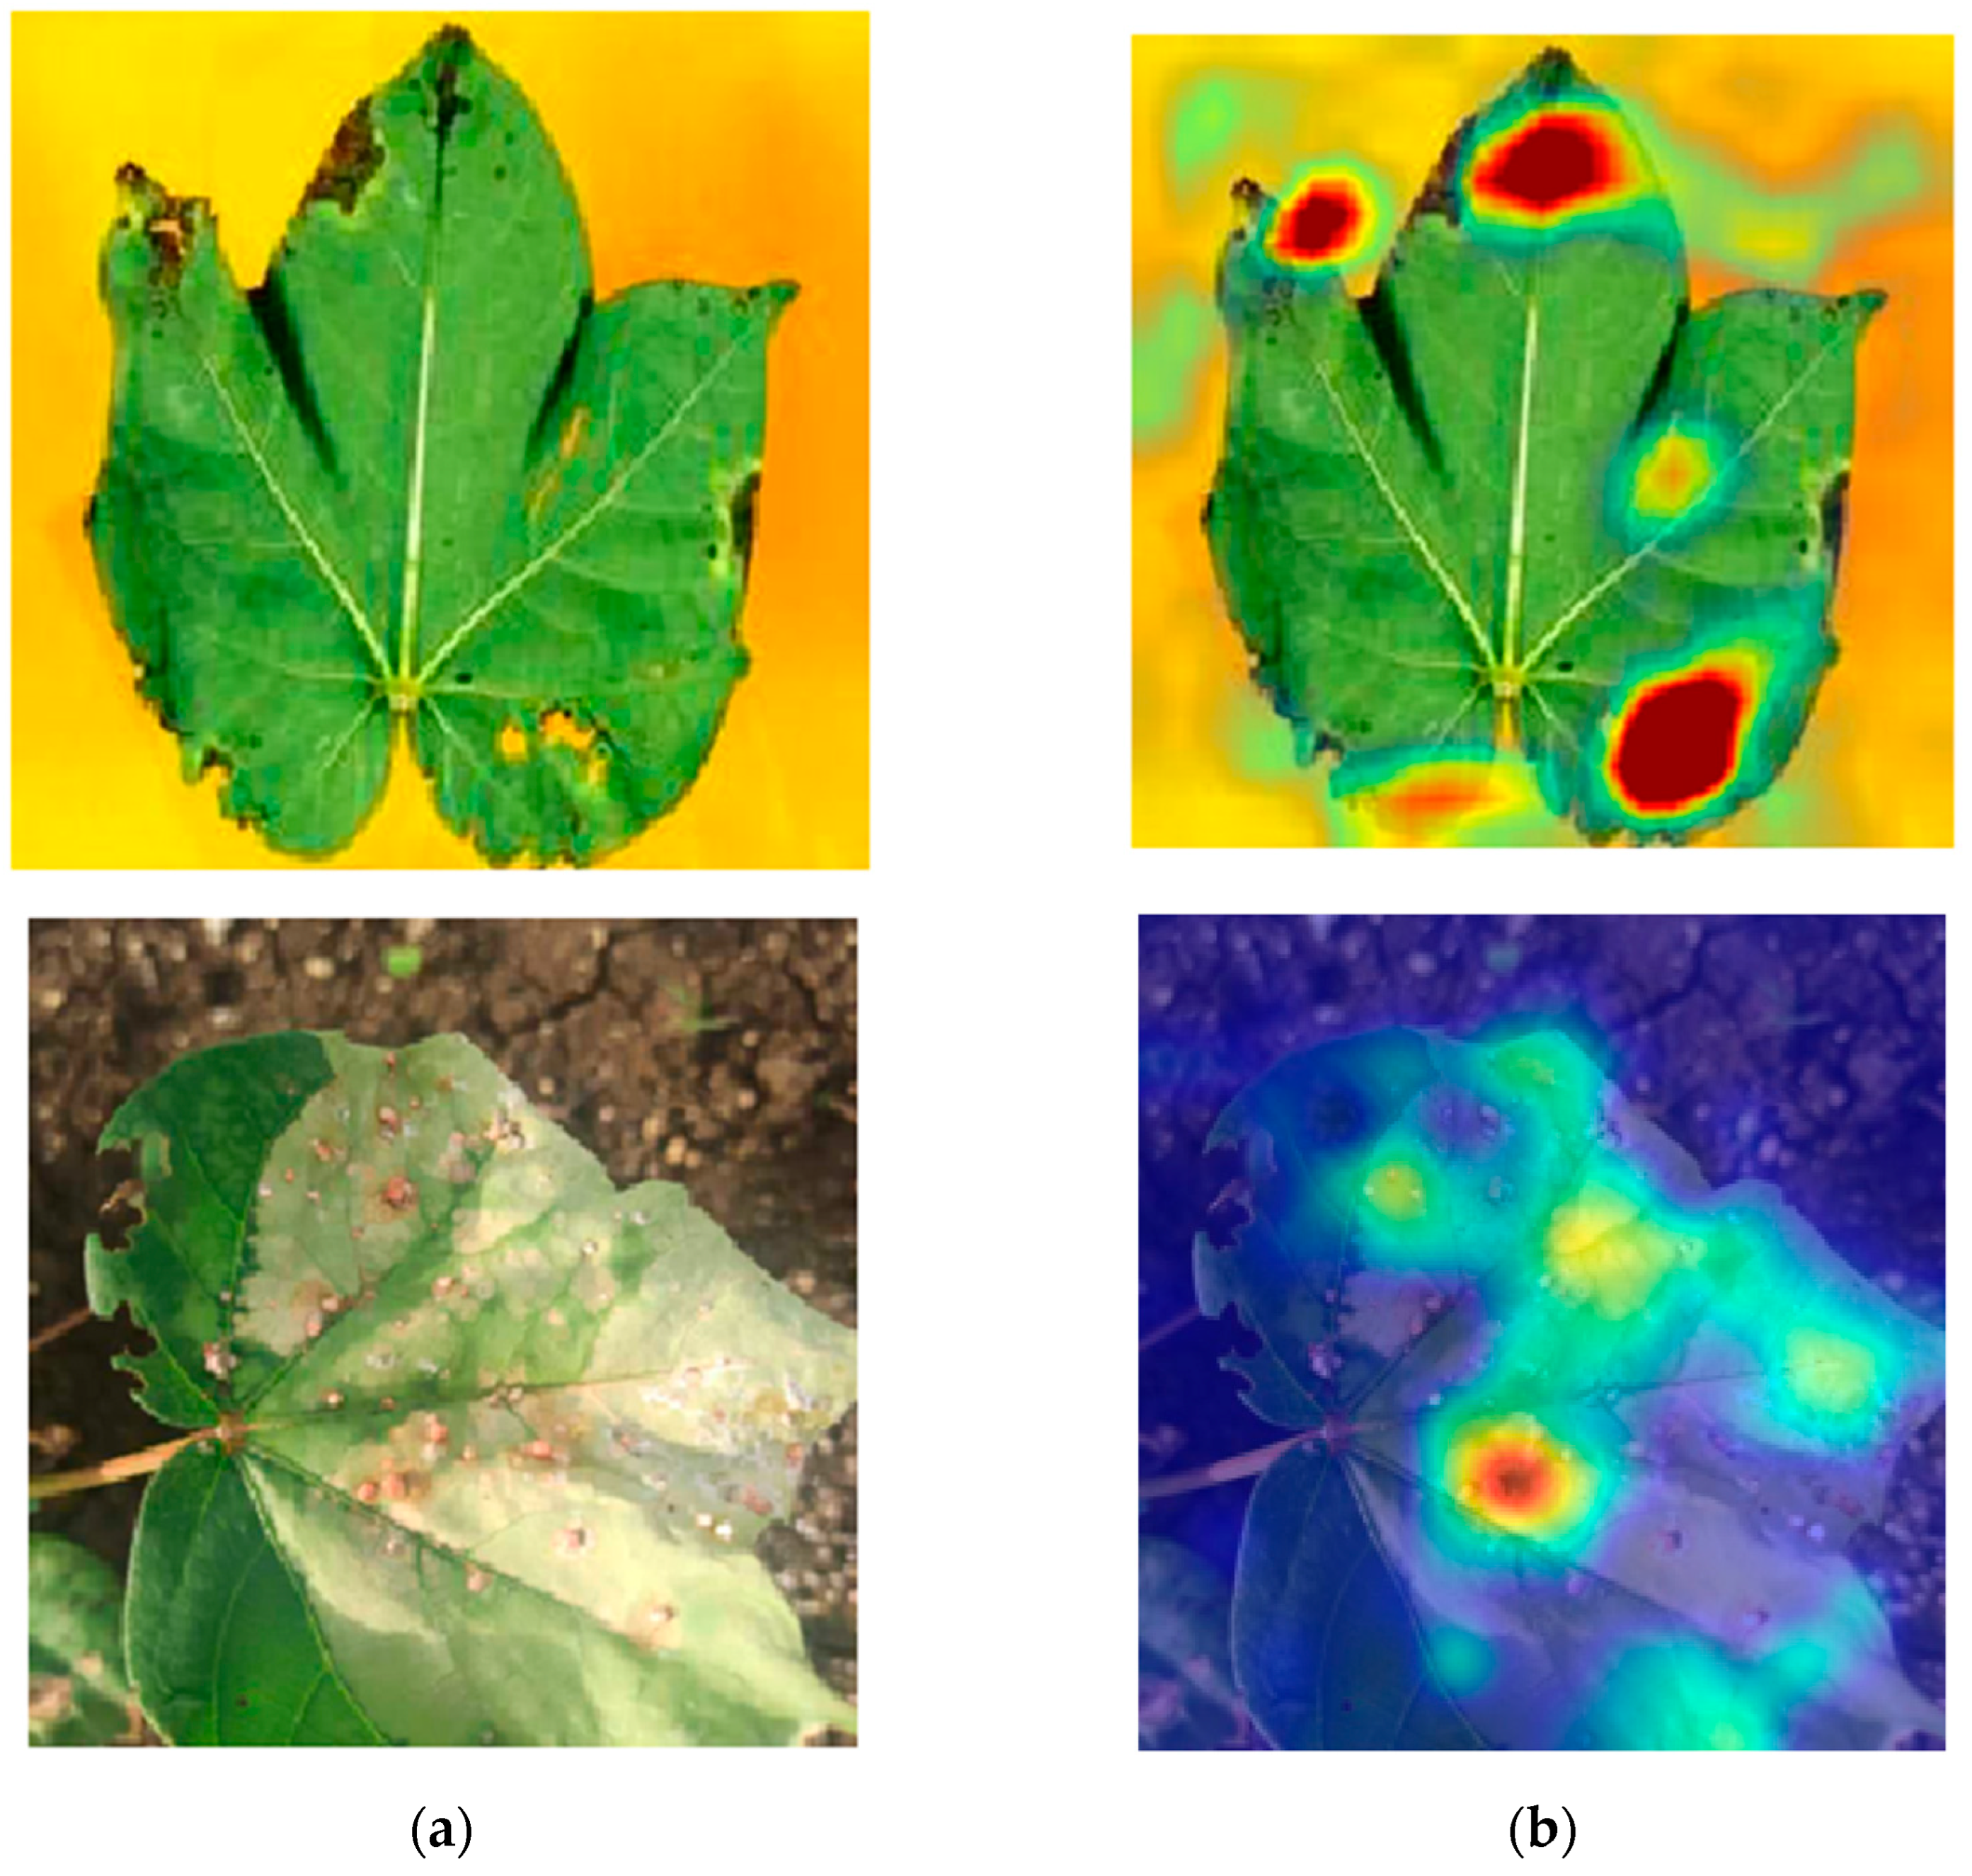
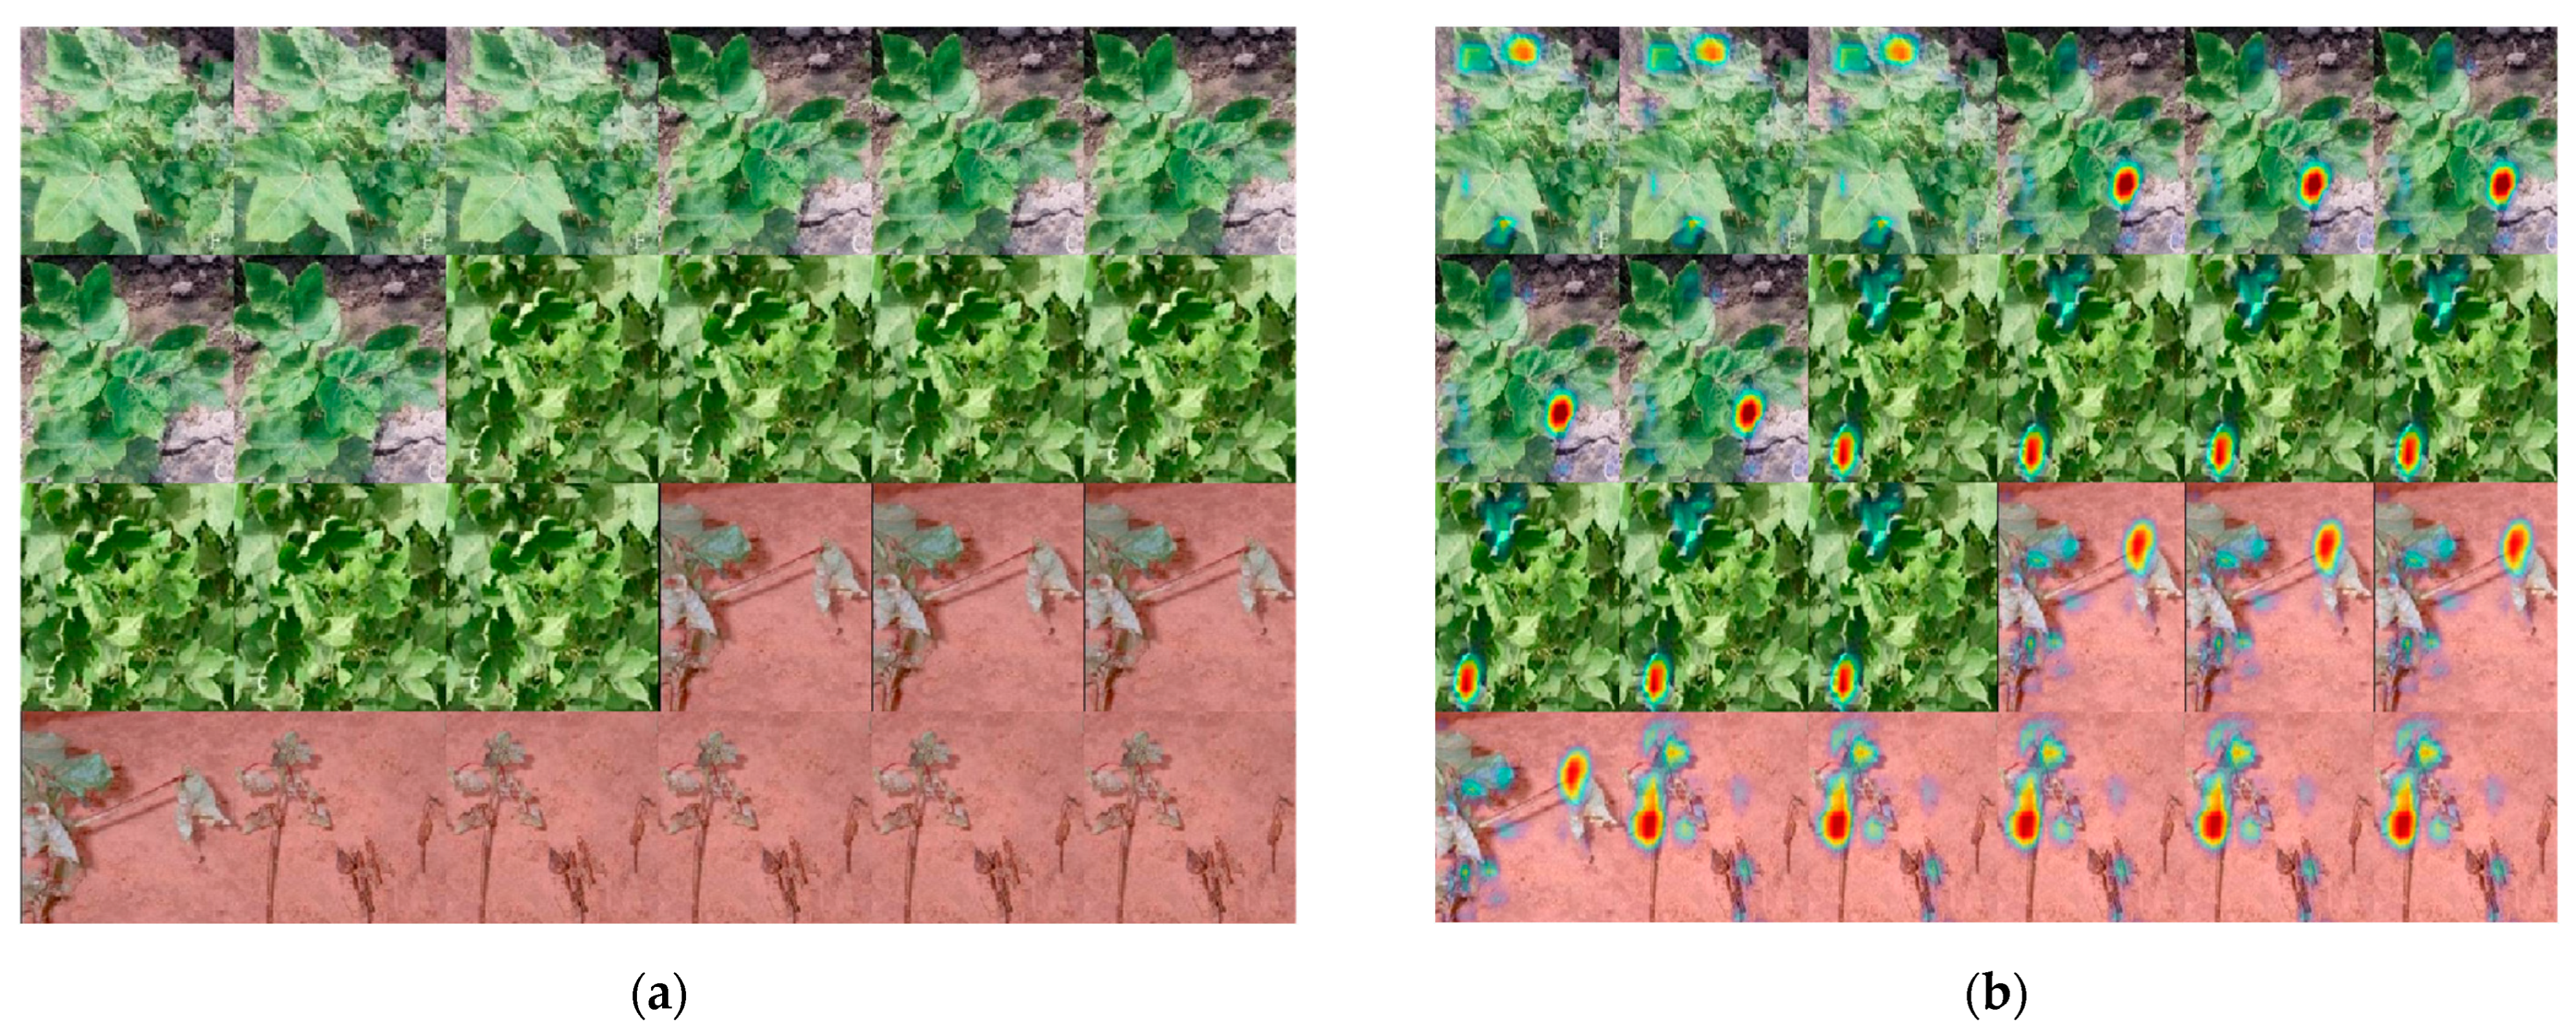
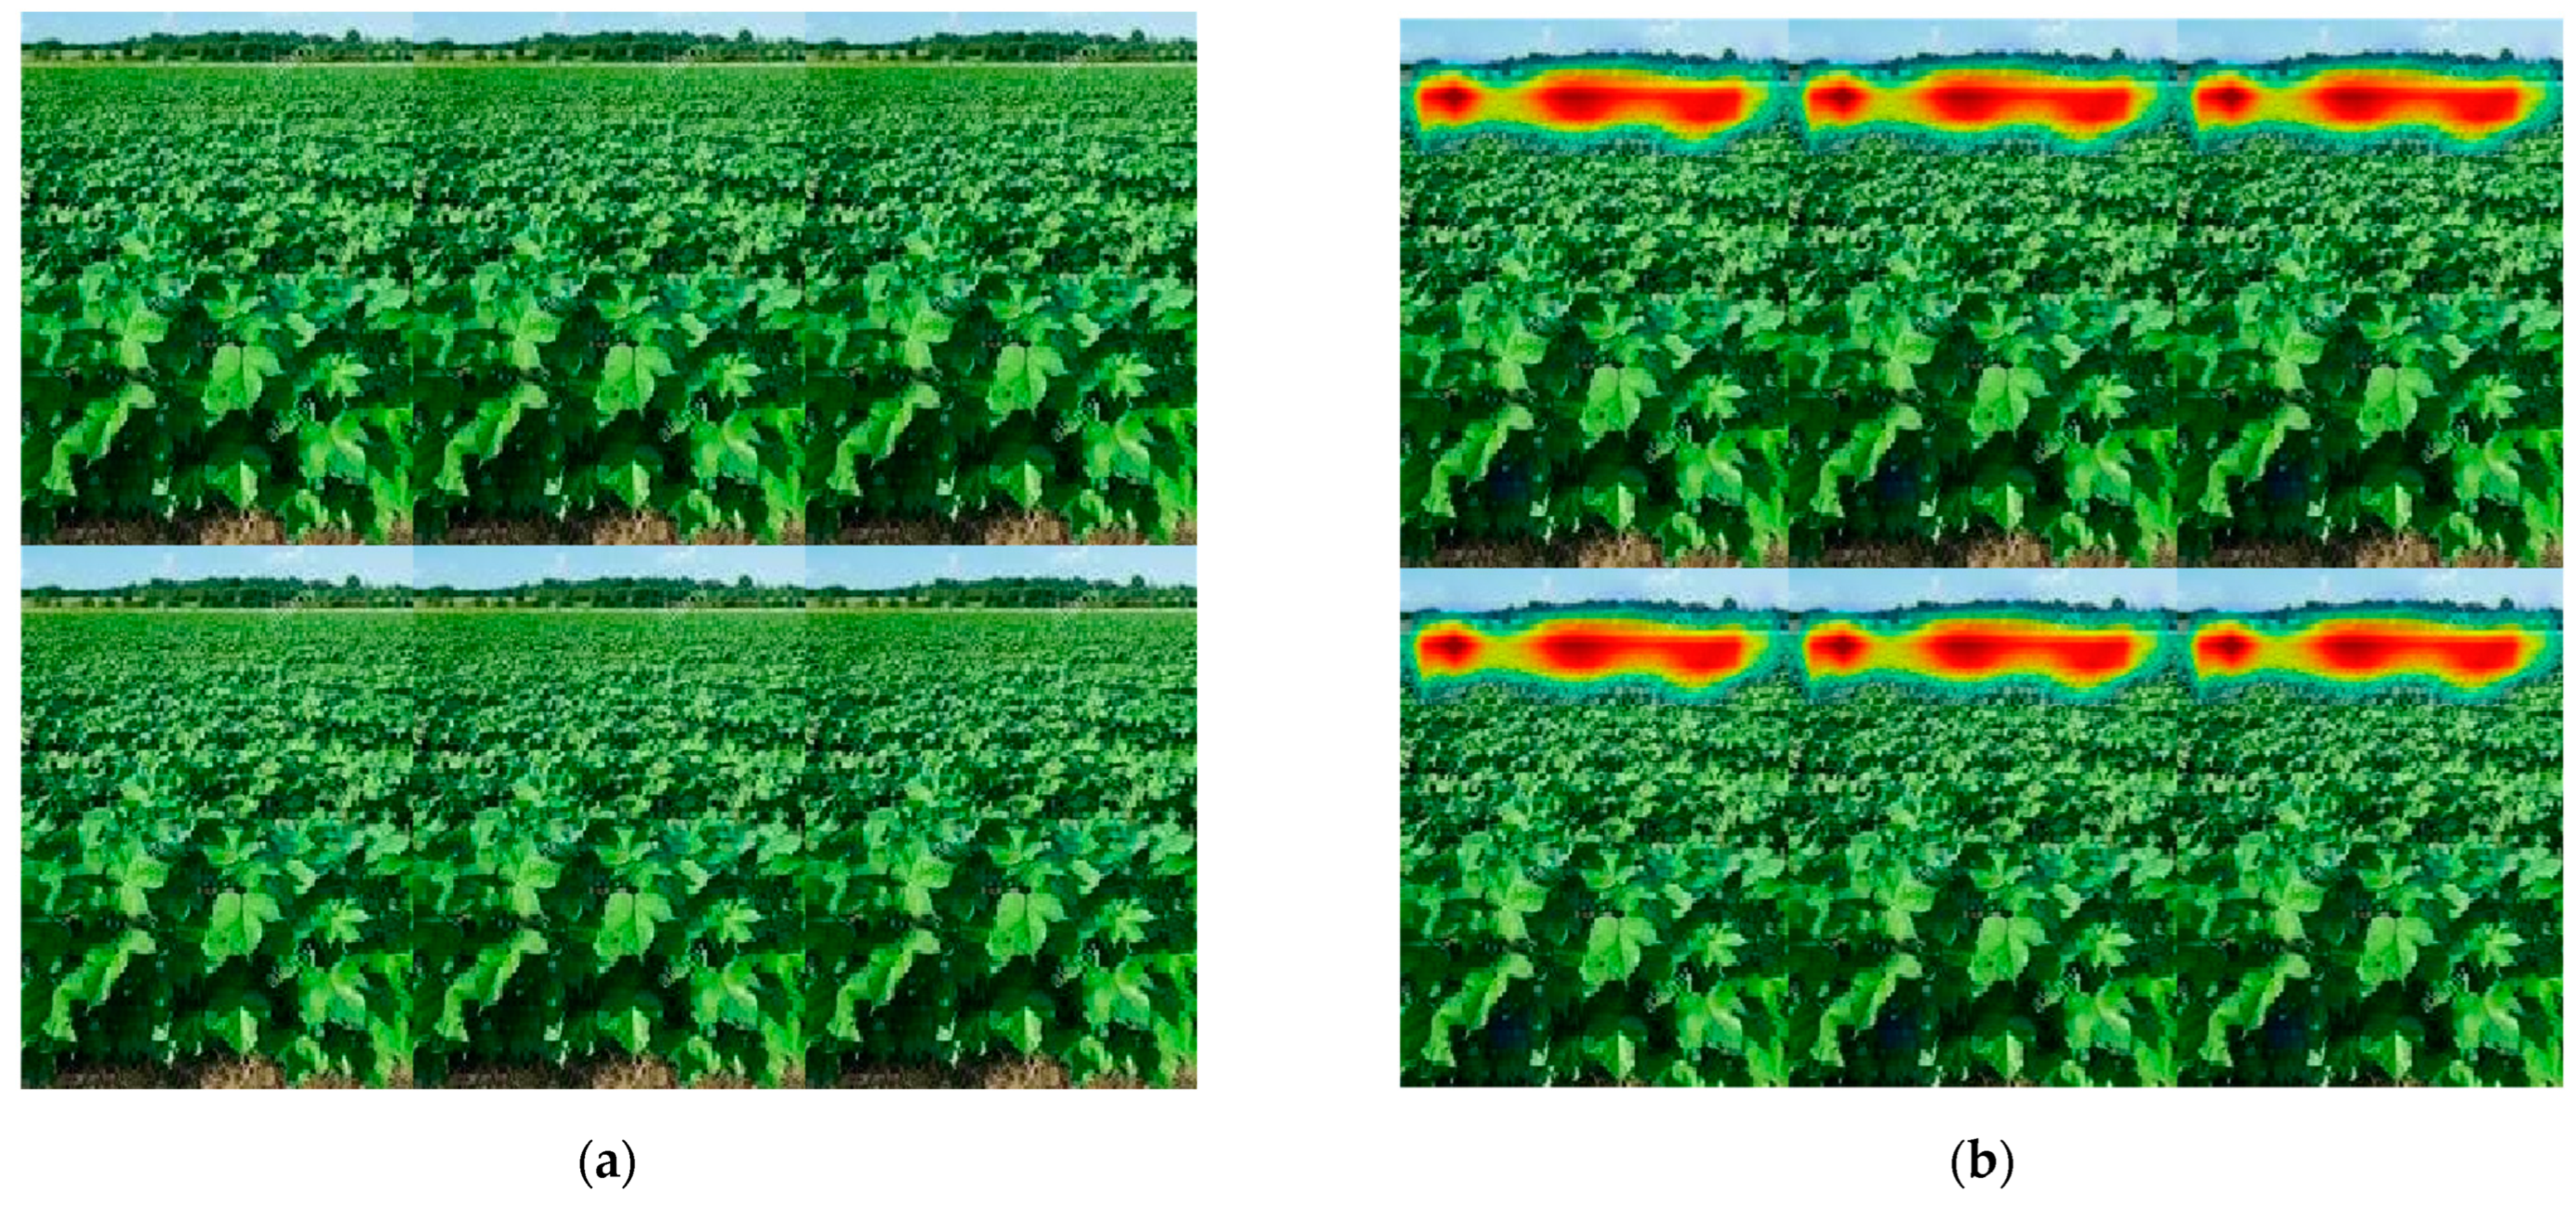
4.4. Visualization of the Classification Heatmap Results Based on Explainable One-Deep Class Model

Heatmaps of the infected class predicted through a network helped to explain why the image was classified into either the healthy or abnormal class. This method is helpful for the detection of patterns in false positives and negatives. Images selected as being correctly classified as the abnormal class are shown in Figure 5. The classification is a true positive. The heatmap of the abnormal images through extract activation upsample heatmap and resize two-dimensional layer of the model. The resize network layer returns a heatmap of lesion scores, the size of which is similar to the input. The heatmap is predicted through the model over the input by using the heatmap overlay function, in which the display range of the heatmap is set to the 0 and 80th percentile.
The false negative images are abnormal, but the network detected them as normal. Heatmaps of false negative images are presented in the Figure 6.
The false-positive images are without infection, but the model classifies them as an infection. The false-positive and negative images are visualized using the network, as shown in Figure 7 and Figure 8.

5. Conclusions

A major threat to agriculture worldwide is plant disease. The accurate detection of leaf disease is essential to preventing further crop damage. Therefore, in this research, an explainable deep-one class model is used for infected/normal cotton images classification. and trained on the selected hyperparameters that provide excellent results. The proposed model provides binary classification results with 99.91% accuracy on the cotton leaf and 99.58% on the cotton disease datasets. The proposed model performance is also evaluated by performing a multi-classification experiment in which we achieved an accuracy of 100% on CV, 99.92% on FW, 99.74% on BB and 99.66% on normal classes. The testing classification results are also visualized using heatmaps. The obtained classification outcomes are also compared to existing techniques to authenticate the effectiveness of the proposed methodology.

Author Contributions

Conceptualization, J.A.; methodology, M.A.A.; software, M.S.; validation, S.K.; formal analysis, J.K. All authors have read and agreed to the published version of the manuscript.

Funding

This research was partly supported by the Technology Development Program of MSS (No. S3033853) and by the Basic Science Research Program through the National Research Foundation of Korea (NRF) funded by the Ministry of Education (No. 2020R1I1A3069700).

Institutional Review Board Statement

Not applicable.

Informed Consent Statement

Not applicable.

Data Availability Statement

Not applicable.

Conflicts of Interest

The authors declare no conflict of interest.

References

  1. Prajapati, B.S.; Dabhi, V.K.; Prajapati, H.B. A survey on detection and classification of cotton leaf diseases. In Proceedings of the 2016 International Conference on Electrical, Electronics, and Optimization Techniques (ICEEOT), Chennai, India, 3–5 March 2016; pp. 2499–2506. [Google Scholar]
  2. Jalloul, A.; Sayegh, M.; Champion, A.; Nicole, M. Bacterial blight of cotton. Phytopathol. Mediterr. 2015, 54, 3–20. [Google Scholar]
  3. Alzubaidi, L.; Zhang, J.; Humaidi, A.J.; Al-Dujaili, A.; Duan, Y.; Al-Shamma, O.; Santamaría, J.; Fadhel, M.A.; Al-Amidie, M.; Farhan, L. Review of deep learning: Concepts, CNN architectures, challenges, applications, future directions. J. Big Data 2021, 8, 1–74. [Google Scholar] [CrossRef]
  4. Amin, J.; Sharif, M.; Anjum, M.A.; Raza, M.; Bukhari, S.A.C. Convolutional neural network with batch normalization for glioma and stroke lesion detection using MRI. Cogn. Syst. Res. 2020, 59, 304–311. [Google Scholar] [CrossRef]
  5. Amin, J.; Sharif, M.; Mallah, G.A.; Fernandes, S.L. An optimized features selection approach based on Manta Ray Foraging Optimization (MRFO) method for parasite malaria classification. Front. Public Heal. 2022, 10, 969268. [Google Scholar] [CrossRef]
  6. Shaukat, N.; Amin, J.; Sharif, M.; Azam, F.; Kadry, S.; Krishnamoorthy, S. Three-Dimensional Semantic Segmentation of Diabetic Retinopathy Lesions and Grading Using Transfer Learning. J. Pers. Med. 2022, 12, 1454. [Google Scholar] [CrossRef]
  7. Amin, J.; Anjum, M.A.; Malik, M. Fused information of DeepLabv3+ and transfer learning model for semantic segmentation and rich features selection using equilibrium optimizer (EO) for classification of NPDR lesions. Knowl.-Based Syst. 2022, 249, 108881. [Google Scholar] [CrossRef]
  8. Yamashita, R.; Nishio, M.; Do, R.K.G.; Togashi, K. Convolutional neural networks: An overview and application in radiology. Insights Imaging 2018, 9, 611–629. [Google Scholar] [CrossRef] [PubMed] [Green Version]
  9. Hou, Y.; Jia, S.; Lun, X.; Hao, Z.; Shi, Y.; Li, Y.; Zeng, R.; Lv, J. GCNs-net: A graph convolutional neural network approach for decoding time-resolved eeg motor imagery signals. arXiv 2020, arXiv:2006.08924. [Google Scholar] [CrossRef] [PubMed]
  10. Udawant, P.; Srinath, P. Cotton leaf disease detection using instance segmentation. J. Cases Inf. Technol. (JCIT) 2022, 24, 1–10. [Google Scholar] [CrossRef]
  11. Zekiwos, M.; Bruck, A. Deep learning-based image processing for cotton leaf disease and pest diagnosis. J. Electr. Comput. Eng. 2021, 2021, 9981437. [Google Scholar]
  12. Jajja, A.I.; Abbas, A.; Khattak, H.A.; Niedbała, G.; Khalid, A.; Rauf, H.T.; Kujawa, S. Compact Convolutional Transformer (CCT)-Based Approach for Whitefly Attack Detection in Cotton Crops. Agriculture 2022, 12, 1529. [Google Scholar] [CrossRef]
  13. Chaudhari, V.; Patil, C. Disease detection of cotton leaves using advanced image processing. Int. J. Adv. Comput. Res. 2014, 4, 653. [Google Scholar]
  14. Revathi, P.; Hemalatha, M. Identification of cotton diseases based on cross information gain deep forward neural network classifier with PSO feature selection. Int. J. Eng. Technol. 2014, 5, 4637–4642. [Google Scholar]
  15. Gulhane, V.A.; Gurjar, A.A. Detection of diseases on cotton leaves and its possible diagnosis. Int. J. Image Process. 2011, 5, 590–598. [Google Scholar]
  16. Zadokar, A.R.; Bhagat, D.P.; Nayase, A.A.; Mhaske, S.S. Leaf disease detection of cotton plant using image processing techniques: A review. Int. J. Electron. Commun. Soft Comput. Sci. Eng. 2017, 53–55. [Google Scholar]
  17. Vinoda, N.; Borugadda, P.; Beera, V.; Babu, R.M. Dimensionality reduction-based approach to classify the cotton leaf images using transfer learning on VGG16. Pharma Innov. J. 2022, 11, 1361–1366. [Google Scholar]
  18. Patil, B.M.; Burkpalli, V. A Perspective View of Cotton Leaf Image Classification Using Machine Learning Algorithms Using WEKA. Adv. Human-Computer Interact. 2021, 2021, 9367778. [Google Scholar]
  19. Kumbhar, S.; Nilawar, A.; Patil, S.; Mahalakshmi, B.; Nipane, M. Farmer buddy-web based cotton leaf disease detection using CNN. Int. J. Appl. Eng. Res. 2019, 14, 2662–2666. [Google Scholar]
  20. Zambare, R.; Deshmukh, R.; Awati, C.; Shirgave, S.; Thorat, S.; Zalte, S. Deep Learning Model for Disease Identification of Cotton Plants. Spec. Ugdym. 2022, 1, 6684–6695. [Google Scholar]
  21. Patil, B.M.; Burkpalli, V. Segmentation of cotton leaf images using a modified chan vese method. Multimed. Tools Appl. 2022, 81, 15419–15437. [Google Scholar] [CrossRef]
  22. Sarangdhar, A.A.; Pawar, V. Machine learning regression technique for cotton leaf disease detection and controlling using IoT. In Proceedings of the 2017 International conference of Electronics, Communication and Aerospace Technology (ICECA), Coimbatore, India, 20–22 April 2017. [Google Scholar]
  23. Yan, T.; Xu, W.; Lin, J.; Duan, L.; Gao, P.; Zhang, C.; Lv, X. Combining Multi-Dimensional Convolutional Neural Network (CNN) With Visualization Method for Detection of Aphis gossypii Glover Infection in Cotton Leaves Using Hyperspectral Imaging. Front. Plant Sci. 2021, 12, 604510. [Google Scholar] [CrossRef] [PubMed]
  24. Ahmed, M.R. Leveraging convolutional neural network and transfer learning for cotton plant and leaf disease recognition. Int. J. Image Graph. Signal Process. 2021, 13, 47–62. [Google Scholar] [CrossRef]
  25. Kaggle. Cotton Disease Dataset. Available online: https://www.kaggle.com/datasets/janmejaybhoi/cotton-disease-dataset (accessed on 5 August 2022).
  26. Kaggle. Cotton-Leaf-Infection. Available online: https://www.kaggle.com/datasets/raaavan/cottonleafinfection (accessed on 12 August 2022).
  27. Mikołajczyk, A.; Grochowski, M. Data augmentation for improving deep learning in image classification problem. In Proceedings of the 2018 international interdisciplinary PhD workshop (IIPhDW), Świnouście, Poland, 9–12 May 2018. [Google Scholar]
  28. Liznerski, P.; Ruff, L.; Vandermeulen, R.A.; Franks, B.J.; Kloft, M.; Müller, K.-R. Explainable deep one-class classification. arXiv 2020, arXiv:2007.01760. [Google Scholar]
  29. Memon, M.S.; Kumar, P.; Iqbal, R. Meta Deep Learn Leaf Disease Identification Model for Cotton Crop. Computers 2022, 11, 102. [Google Scholar] [CrossRef]
  30. Patil, B.M.; Burkpalli, V. Cotton Leaf Disease Classification by Combining Color and Texture Feature-based Approach. In Proceedings of the 2022 6th International Conference on Intelligent Computing and Control Systems (ICICCS), Madurai, India, 25–27 May 2022. [Google Scholar]
  31. Rossi, L.; Valenti, M.; Legler, S.E.; Prati, A. LDD: A Grape Diseases Dataset Detection and Instance Segmentation. In Proceedings of the 21st International Conference, Lecce, Italy, 23–27 May 2022. [Google Scholar]
  32. Rai, C.K. Automatic Classification of Real-Time Diseased Cotton Leaves and Plants Using a Deep-Convolutional Neural Network. Res. Sq. 2022; preprint. [Google Scholar]
Figure 1. Cotton disease detection model.
Agriculture 12 02029 g001
Figure 2. Confusion matrix of the cotton disease classification results.
Agriculture 12 02029 g002
Figure 3. Classification results. (a) ROC-AUC curve; (b) mean lesion scores.
Agriculture 12 02029 g003
Figure 4. ROC of the proposed cotton leaf classification model.
Agriculture 12 02029 g004
Figure 5. Multi-class confusion matrix of cotton leaf infection.
Agriculture 12 02029 g005
Figure 6. True-positive classification. (a) Input image. (b) Heatmap scores.
Agriculture 12 02029 g006
Figure 7. False-negative classification results. (a) Input image. (b) Heatmap.
Agriculture 12 02029 g007
Figure 8. False-positive classification results. (a) Input image. (b) Heatmap.
Agriculture 12 02029 g008
Table 1. Proposed model training parameters.
ParametersSizeOptimizerError rate
Batch size8Sgdm0.5
40.7
160.1
100 training epochs
Table 2. Classification results of cotton disease.
Cross-ValidationAccuracyPrecisionRecallF1 Score
5-fold99.58%1.01.01.0
99.58%1.00.990.99
10-fold98.89%0.990.980.99
99.09%0.990.990.98
Table 3. Classification results of cotton leaf using Kaggle datasets.
Cross-ValidationAccuracyPrecisionRecallF1 Score
5-fold95.89%0.940.990.97
95.89%0.990.910.95
10-fold99.91%0.990.990.99
99.97%0.990.990.99
Table 4. Multi-classification of cotton leaf infection.
Cross-ValidationClassesAccuracyPrecisionRecallF1 Score
5-foldCV100%1.001.001.00
FW99.95%1.001.001.00
BB99.75%0.991.001.00
Normal99.70%1.000.990.99
10-foldCV100%1.001.001.00
FW99.92%1.001.001.00
BB99.74%0.991.000.99
Normal99.66%1.000.990.99
Table 5. Comparison of the proposed cotton disease classification results.
Ref#YearModelDatasetResult (Accuracy%)
[29]2022Custom CNN, VGG16, ResNet50Local 98.53
[30]2022LBP and GLCMKaggle92.2
[31]2022Mask-RCNNLocal 94
[32]2022Alex-networkKaggle97.98
[11]2021Deep FeaturesLocal 96.4
Proposed ModelKaggle (Cotton diseases)99.58
Kaggle (Cotton leaf)99.91
Kaggle (leaf infection)99.97
Publisher’s Note: MDPI stays neutral with regard to jurisdictional claims in published maps and institutional affiliations.

