Article

Designing an Interactively Cognitive Humanoid Field-Phenotyping Robot for In-Field Rice Tiller Counting

1
School of Mechanical Engineering, Shanghai Jiao Tong University, Shanghai 200240, China
2
MoE Key Lab of Artificial Intelligence, AI Institute, Shanghai Jiao Tong University, Shanghai 200240, China
3
Key Laboratory of Intelligent agricultural technology (Yangtze River Delta), Ministry of Agriculture and Rural Affairs, Shanghai 200240, China
*
Author to whom correspondence should be addressed.
Agriculture 2022, 12(11), 1966; https://doi.org/10.3390/agriculture12111966
Submission received: 1 October 2022 / Revised: 5 November 2022 / Accepted: 6 November 2022 / Published: 21 November 2022
(This article belongs to the Special Issue Robots and Autonomous Machines for Agriculture Production)

Abstract

:
Field phenotyping is a crucial process in crop breeding, and traditional manual phenotyping is labor-intensive and time-consuming. Therefore, many automatic high-throughput phenotyping platforms (HTPPs) have been studied. However, existing automatic phenotyping methods encounter occlusion problems in fields. This paper presents a new in-field interactive cognition phenotyping paradigm. An active interactive cognition method is proposed to remove occlusion and overlap for better detectable quasi-structured environment construction with a field phenotyping robot. First, a humanoid robot equipped with image acquiring sensory devices is designed to contain an intuitive remote control for field phenotyping manipulations. Second, a bio-inspired solution is introduced to allow the phenotyping robot to mimic the manual phenotyping operations. In this way, automatic high-throughput phenotyping of the full growth period is realized and a large volume of tiller counting data is availed. Third, an attentional residual network (AtResNet) is proposed for rice tiller number recognition. The in-field experiment shows that the proposed method achieves approximately 95% recognition accuracy with the interactive cognition phenotyping platform. This paper opens new possibilities to solve the common technical problems of occlusion and observation pose in field phenotyping.

1. Introduction

The growing population places high demands on crop yields [1]. Crop breeding is a crucial technique to increase yields, disease resistance and other desirable properties by improving the genetic characteristics of crops [2]. Phenotyping is a process central to breeding, which refers to measuring the key parameters related to crop properties, such as plant height, leaf area, leaf angle, number of grains and number of tillers [3,4]. The phenotyping process is currently mainly performed by crop breeding experts, who measure these parameters with manual tools and their sufficient experience.
In order to acquire crop growth status at different growth stages, breeding experts need to perform in-field manual phenotyping for each crop at regular intervals. Undoubtedly, this work is labor-intensive and time-consuming. The traditional manual phenotyping method is highly experience-dependent and its efficiency and reliability are limited. As a result, the rate of plant genome research is restricted by the rate of phenotyping, which is defined as the “Phenotyping Bottleneck” [5].
To speed up the breeding process and relieve the bottleneck, studies on high-throughput phenotyping platforms (HTPPs) have been widely conducted [6]. Many advanced technologies have been applied for automatic phenotyping [7]. The Scanalyzer 3D High Throughput platform [8] developed by German research institute LemnaTec has high impact [9]. Plants are transported by conveyers through a sequence of imaging cabinets equipped with various sensors to acquire various phenotype data. This system is widely used in various phenotyping platforms, such as the Plant Accelerator of Australian Centre for Plant Functional Genomics (ACPFG) [10]. The Plant Accelerator, consisting of four greenhouses and two Scanalyzer 3D platforms, can accomplish high-throughput phenotyping, as well as watering and weighing the plants. Hartmann et al. [11] developed an open-source image analysis pipeline called HTPheno. It can acquire crop images using pipelines in greenhouses and measure various phenotypic parameters from the images. Liu et al. [12] presented a Digital Plant Phenotyping Platform for multiple trait measurement, such as leaf and tiller orientation. These HTPPs significantly increased the phenotyping efficiency compared with the traditional manual process. However, plants grown in greenhouses are not affected by soil condition, weather variation or many other natural factors, so phenotypes may differ from those grown naturally in fields. Moreover, to avoid the influence of leaf occlusion and overlap on measurement, plants are planted separately, which cannot simulate the plant interplay when planted closely in fields.
For the purpose of field high-throughput phenotyping, many field high-throughput phenotyping platforms have been developed to date. LemnaTec also developed a field HTPP named the Scanalyzer Field recently [13]. It is a fully automated gantry system with an extensive measurement platform equipped with cameras and sensors. It can measure up to 0.6 hectares of crops to acquire detailed phenotypic data. Researchers at the University of Arizona and the United States Department of Agriculture (USDA) [14] developed a field HTPP that included a sonar proximity sensor, sonar and GPS antenna and infrared radiometer (IRT) sensors. The system can measure canopy height, reflectance, and some other phenotypic parameters, but it can only acquire data overhead. The Robotanist developed by Mueller-Sim et al. [15] is a ground-based platform. It can autonomously navigate fields to measure stalk strength with a manipulator and collect phenotypic parameters with non-contact sensors. The platform developed by researchers at Iowa State University employs a stereo camera rig that consists of six stereo camera heads to accomplish high quality 3D reconstruction of sorghum plant architecture [16]. The system is carried by a self-navigate tractor equipped with RTK-GPS signals. Zhou et al. [17] introduced a rice panicle counting platform using images captured by an unmanned aerial vehicle based on deep learning algorithms.
Field HTPPs automatically conduct phenotyping in natural fields with high efficiency using automatic navigating and measurement systems. However, leaf occlusion and overlap in field environments severely restrict the measurement accuracy of some parameters. This has become a key challenge for automatic in-field phenotyping and restricts practical applications.
Tillers refer to the aboveground branches of gramineous plants, and the number of tillers is one of the most important parameters in ecology and breeding studies. The rice yield is usually dominated by primary tillers and some early secondary tillers [18]. As a result, tiller number is a key phenotypic trait for rice and the measurement and analysis of the tiller number are indispensable in phenotyping [19]. Rice tillers are currently manually counted using the separated shoots from a single plant by experts. The counting process is inefficient and labor-intensive. Automatic tiller counting methods have been studied in the past few years. For instance, Yang et al. [20] used an X-ray computed tomography (CT) system to measure rice tillers on a conveyer. In their work, a mean absolute error (MAE) of approximately 0.3 was reached. Huang et al. [21] proposed to measure rice tillers through magnetic resonance imaging (MRI). However, it is not suitable to perform in-field high-throughput measurements using these cumbersome and expensive systems. Scotford et al. [22] used spectral reflectance and ultrasonic sensing techniques to estimate tiller density and an accuracy of ±125 tillers per m2 was achieved. Deng et al. [23] presented a rice tiller counting platform based on in-field images captured by smartphones and they were measured after the rice plants were cut and the branches were removed. Yamagishi et al. [24] proposed to count rice tillers using proximal sensing data taken by an unmanned aerial vehicle. These methods provided some attempts for in-field tiller counting, but the key problem of occlusion and overlap was not addressed, restricting the recognition accuracy in practical applications.
To tackle the occlusion and overlap problem in in-field phenotyping in this paper, a novel phenotyping paradigm of interactive cognition is proposed. A detectable quasi-structured environment is actively constructed for in-field phenotyping; therefore, the cognition process can be accomplished smoothly. This method overcomes the problem of occlusion and overlap in traditional passive automatic phenotyping methods. Meanwhile, a field phenotyping robot is developed and a bio-inspired solution is adopted so that it mimics the manual operations of breeding experts in fields. In this way, the phenotyping operational schedules are regularized. Moreover, based on the interactive cognition phenotyping method, a rice tiller counting method based on attentional residual networks (AtResNet) is proposed using the structured light images captured by the robot. The main contributions of this paper are as follows:
(1)
An interactive cognition methodology is proposed for full growth period in-field high-throughput phenotyping.
(2)
To accomplish the interactive cognition-based field phenotyping, a humanoid robot is designed with human-in-the-loop interactive methodology.
(3)
A high-accuracy rice tiller counting method based on the phenotyping platform is proposed.
The rest of this paper is organized as follows. Section 2 introduces the interactive cognition phenotyping method based on the humanoid robot. Section 3 presents the bio-inspired operational forms. Section 4 describes the rice tiller counting algorithm and Section 5 shows the experimental results. Section 6 concludes the paper.

2. Interactive Cognition Phenotyping Method

In many industrial applications, the machine vision techniques for object detection and measurement are mature. Industrial robots generally use non-interactive passive detection methods to achieve cognition of the surrounding environment. However, occlusion and overlap rarely exist in industrial scenes; in other words, the scenes are structured. Hence, non-interactive cognition methods can basically meet the cognition requirements. However, in fields, simple machine vision inspection methods are not compatible with complex unstructured agricultural scenes [25]. It is difficult to perform phenotyping for crops in occlusion scenes. To solve this problem, we propose a new phenotyping paradigm of interactive cognition. A phenotyping robot is introduced to interact with the surrounding plants. The robot mimics breeding experts’ manual operations of removing occlusion and overlap, while performing phenotyping in fields. A detectable quasi-structured environment is constructed; therefore, full cognition of the crops can be achieved through machine vision-based detecting methods.

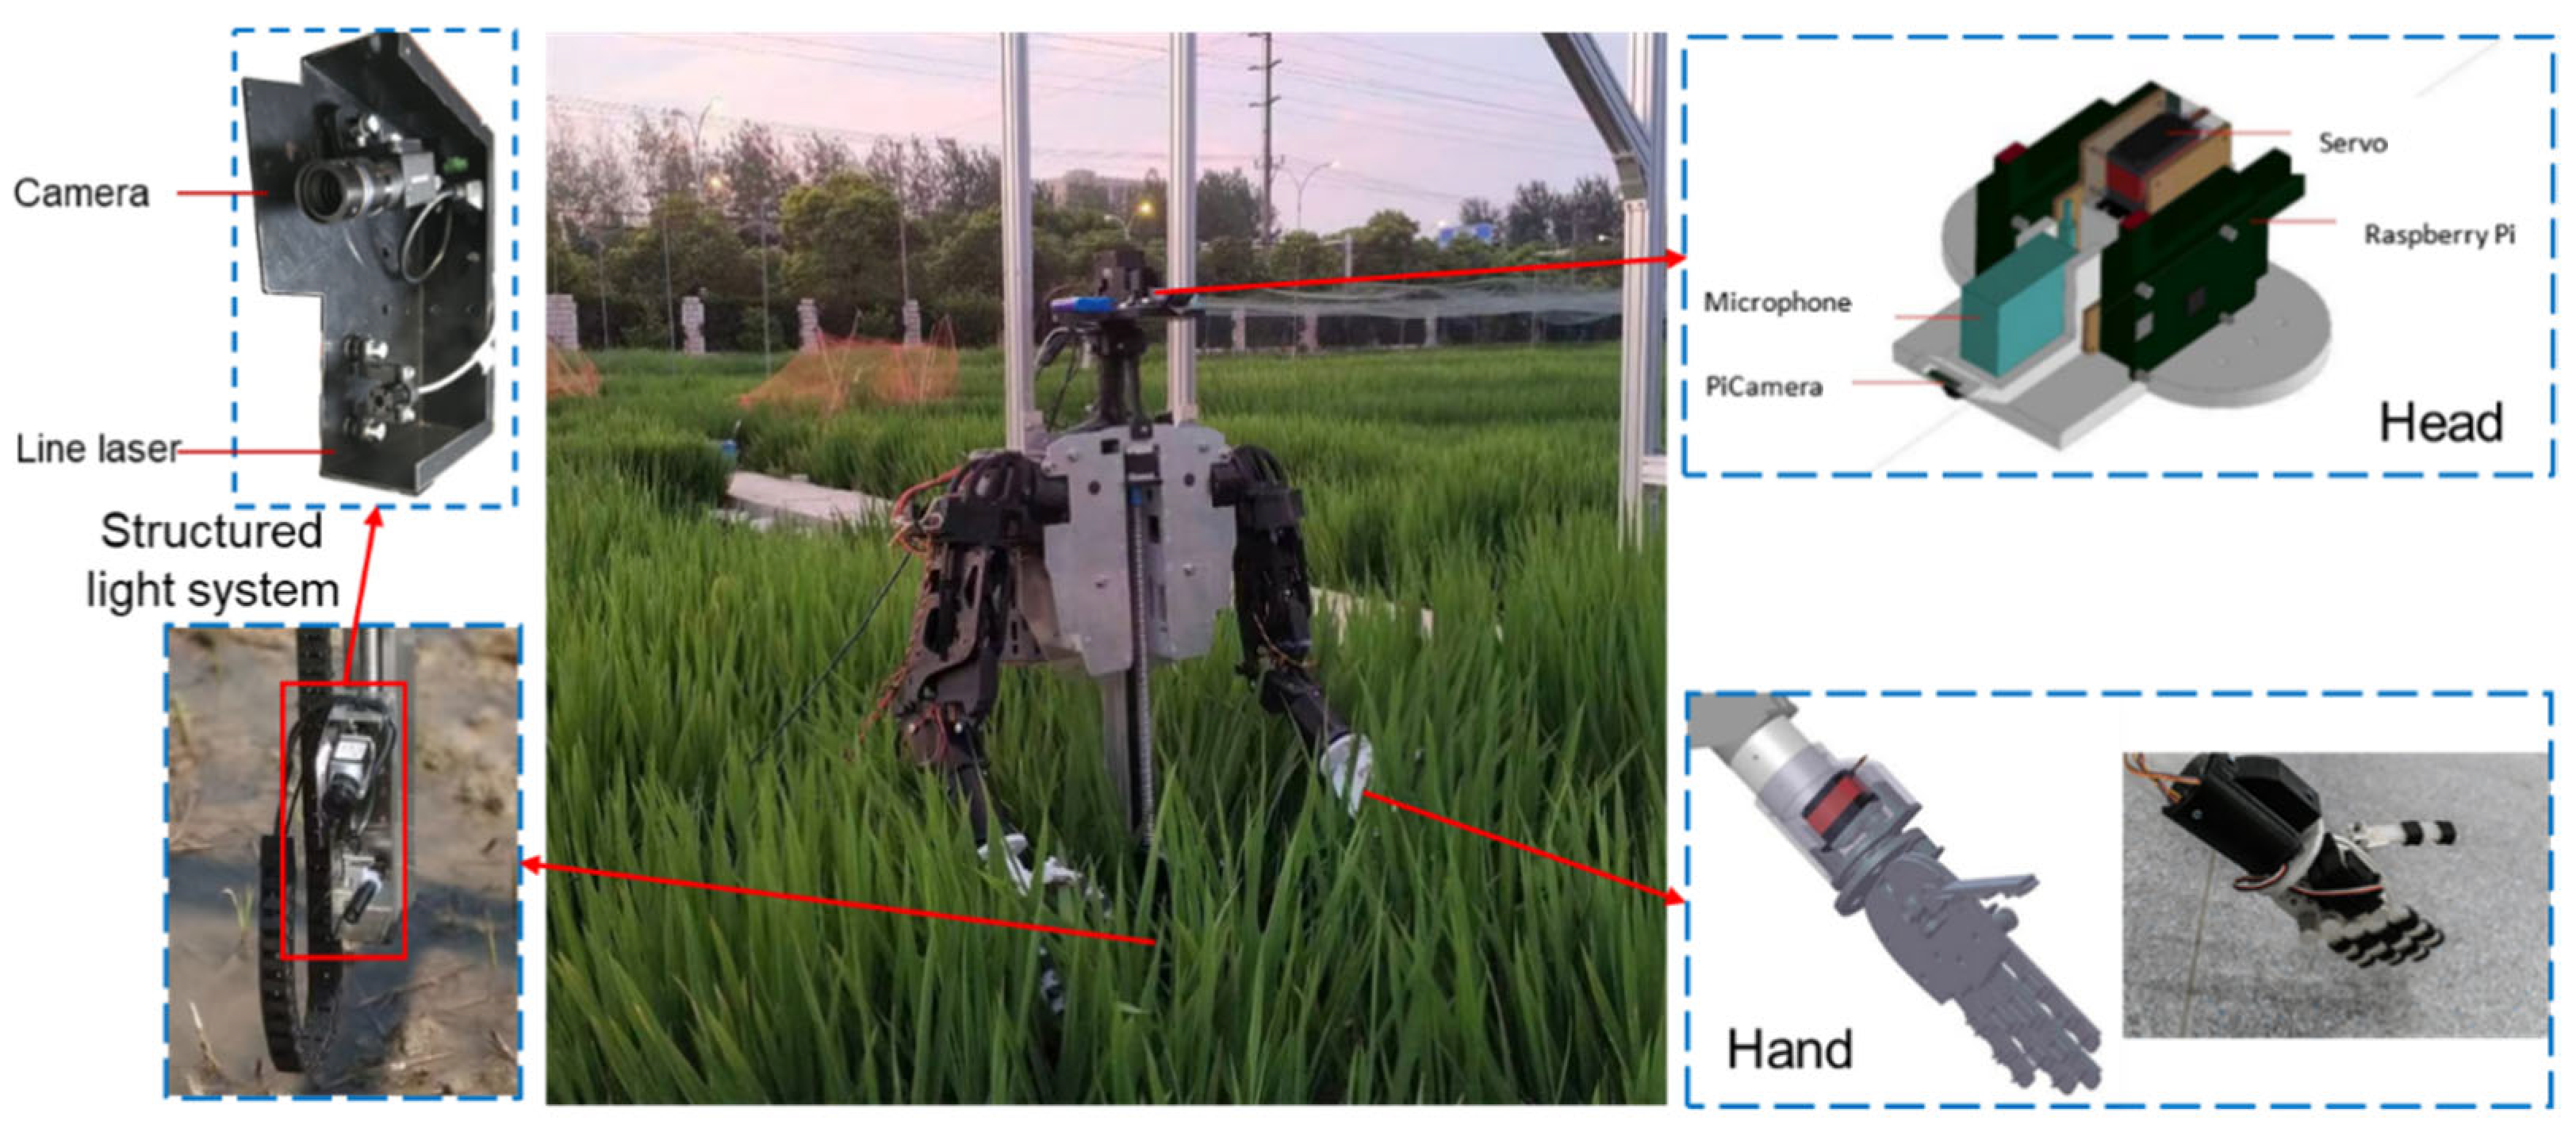
2.1. Interactively Cognitive Humanoid Field Phenotyping Robot

In order to interactive with crops and construct various detectable scenes for phenotyping, the robot needs to have high operational dexterity. To perform the phenotyping operations of experts, we used a bio-inspired design methodology to design the humanoid robot ontology. The robot ontology, as shown in Figure 1, is based on an open-source project named InMoov [26], and it has been redesigned to improve its adaptability to the agricultural working environment. Its shoulder and arm have five degrees of freedom, ensuring the completion of complex actions, such as those carried out by humans, and sufficient space for movement. The manipulator is a humanoid mechanical hand, inspired by an open-source project [27]. The mechanical hand has one degree of freedom. Five fingers can grip and stretch at the same time so that phenotyping actions, such as separating ears and handling stalks, can be performed.
The robot is placed on a field truss platform that can move along the tracks in field. The robot can move to a suitable position to interact with the plants under analysis. It can move along two mutually perpendicular horizontal tracks with a moving speed of 0.1 m/s to 0.3 m/s. It can descend 25 cm towards the ground and lift 75 cm above the ground.
The liftable line-structured light system equipped on the chest of the robot body is used for environmental detection and cognition. The system consists of a Basler acA2500-14gc color camera and line laser module that can scan up and down, driven by a stepper motor. The camera has a horizontal and vertical resolution of 2590 × 1942 px, a frame rate of 14 FPS, and a sensor area of 1/2.5 inch. The scanning speed is approximately 20 mm/s and the scanning stroke is 500 mm. The 3D reconstruction of plants and measurement of many phenotypic parameters can be realized using the structured light system.
An interactive system that consists of a raspberry Pi, a microphone and a PiCamera is mounted on the robot’s head. The PiCamera can screen live video of the field and transmit video streams to the server built by the raspberry Pi. The video stream delay is about 0.5 s, and the resolution is 1280 × 960 with a 30-fps frame rate.

2.2. Interactive Cognition Phenotyping Process

When the robot moves to the front of the plant under analysis, it can actively interact with the plant to build a more detectable environment if there is evidence of occlusion and overlap. As shown in Figure 2, when the plant is sheltered by other plants, the robot arm can push aside the plants to remove the occlusion. Then, the plant can be detected by the vision system and full phenotypic data can be acquired. Similarly, when the back part of a plant is occluded by the front part, the same active interaction process can be used to build a phenotype detectable environment.
The robot operates on a field truss platform and it can move along two mutually perpendicular horizontal tracks. A fixed position in the field can be taken as the origin of the absolute coordinate system, and the two moving directions are the X-axis and the Y-axis, respectively. We use the motor-driven signals of the servo motors as odometers. When the robot moves to a position to measure a specific plant, the moving distance along the two directions can be calculated by the pulse number of the motor-driven signals. Therefore, the geographic coordinates of the robot can be determined. The relative distance of the plant to the robot can be measured by the pre-calibrated structural light system and the geographic coordinate of the plant can be determined. In our experimental field spot, where the longest moving distance is 50 m, the measurement error of the robot geographic coordinates is approximately 2 cm. In the robot operating space, the structural light system measurement error is approximately 0.1 cm. In this manner, an electronic map of every plant in the field can be established. Phenotypic data of every plant measured by the robot platform can be recorded on the map. With the electronic map, the robot platform can measure the same plant at different growth stages, thus establishing a complete full growth cycle phenotype database to provide complete phenotypic data for crop breeding.
Despite the introduction of the robot technique and active interactive cognition method, the efficiency and accuracy of automatic phenotyping can still be considerably improved, which is required to release the “Phenotyping Bottleneck”. In addition, with the use of electronic maps, automatic phenotyping of full growth cycles can be realized.

3. Bio-Inspired Operational Forms

In natural agricultural environments, it is extremely difficult for robots to perform fully autonomous measurements and cognition. To date, operation in these non-structured scenes cannot reach relatively high accuracy. As a result, phenotyping schedules and operation need to be formulated first. Due to the humanoid structure of the robot, a bio-inspired solution is proposed. By mimicking phenotyping operations of breeding experts, the phenotyping operational schedules are regularized.
The human–robot interactive technique (HRI) is used to regularize the phenotyping schedule. Breeding experts remotely control the robot platform to perform interactive phenotyping operations with the HRI system. The HRI framework is shown in Figure 3.

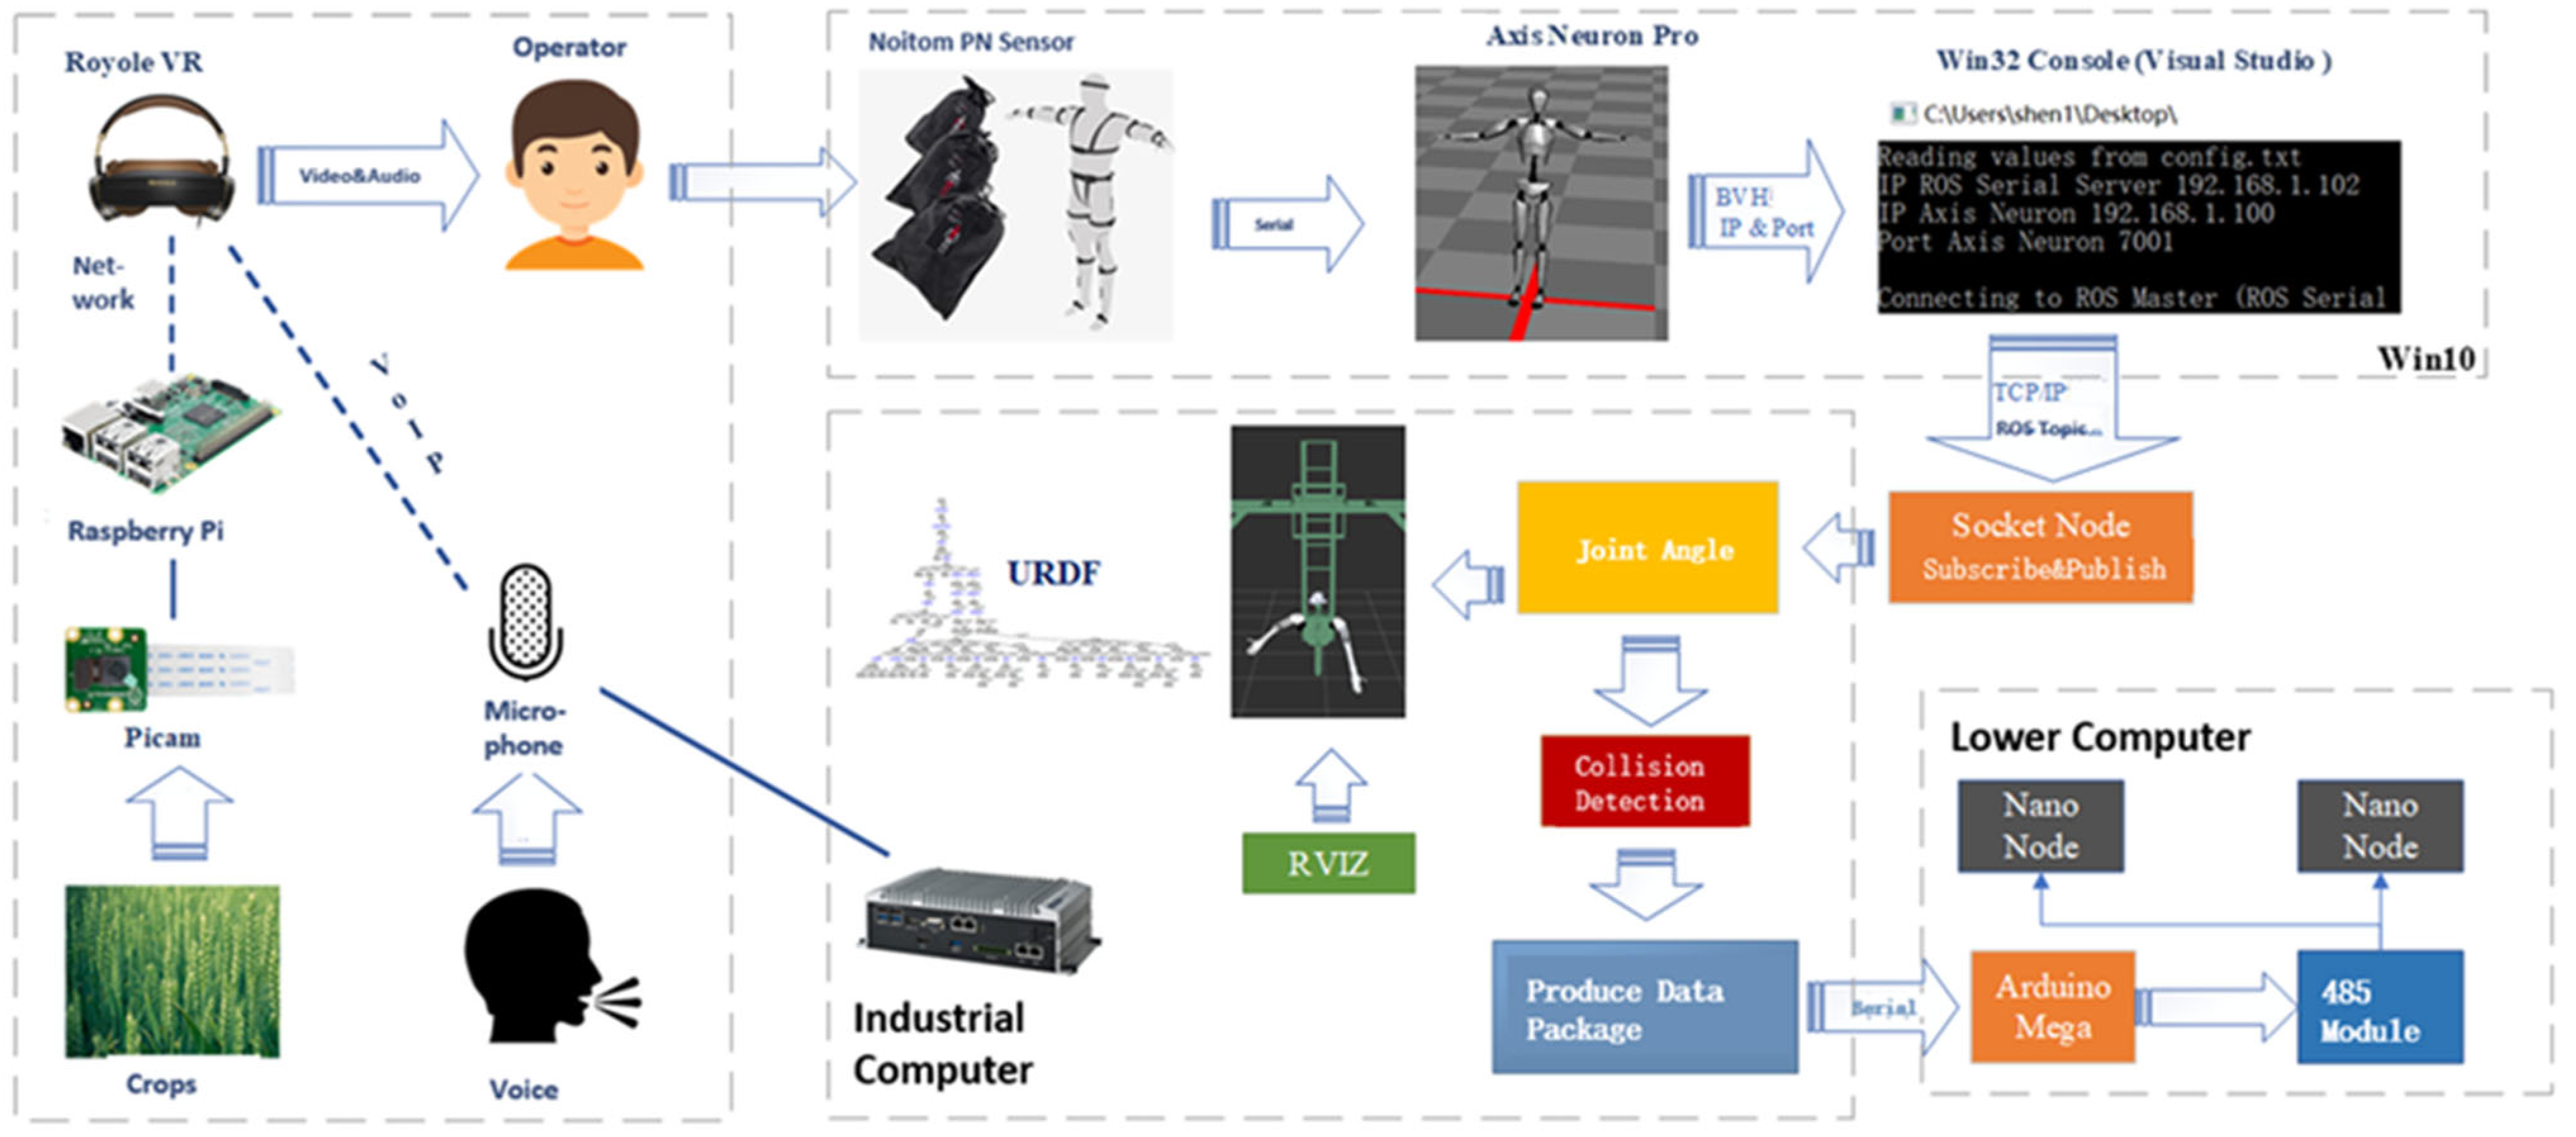
3.1. Head-Mounted Interactive System

A head-mounted interactive system is used to acquire the live scenes and voice, so that the operator can easily manipulate the robot to interact with the in-field environment. An approximately immersive operation experience can be obtained when breeding experts use this system.
The structure of the head-mounted interactive system is described in Section 2.1. The operator wears a Royole VR standalone headset to acquire the live video. In this way, the operator can remotely observe the scene of the robot in the current field of view in real time. The microphone mounted at the robot head can record the sound around the robot. The operator end and the robot end can communicate through the VR standalone headset and the robot computer. The raspberry Pi works as a server. In this way, the operator can hear the real-time voice that is “heard” by the robot to monitor the in-field situations better.

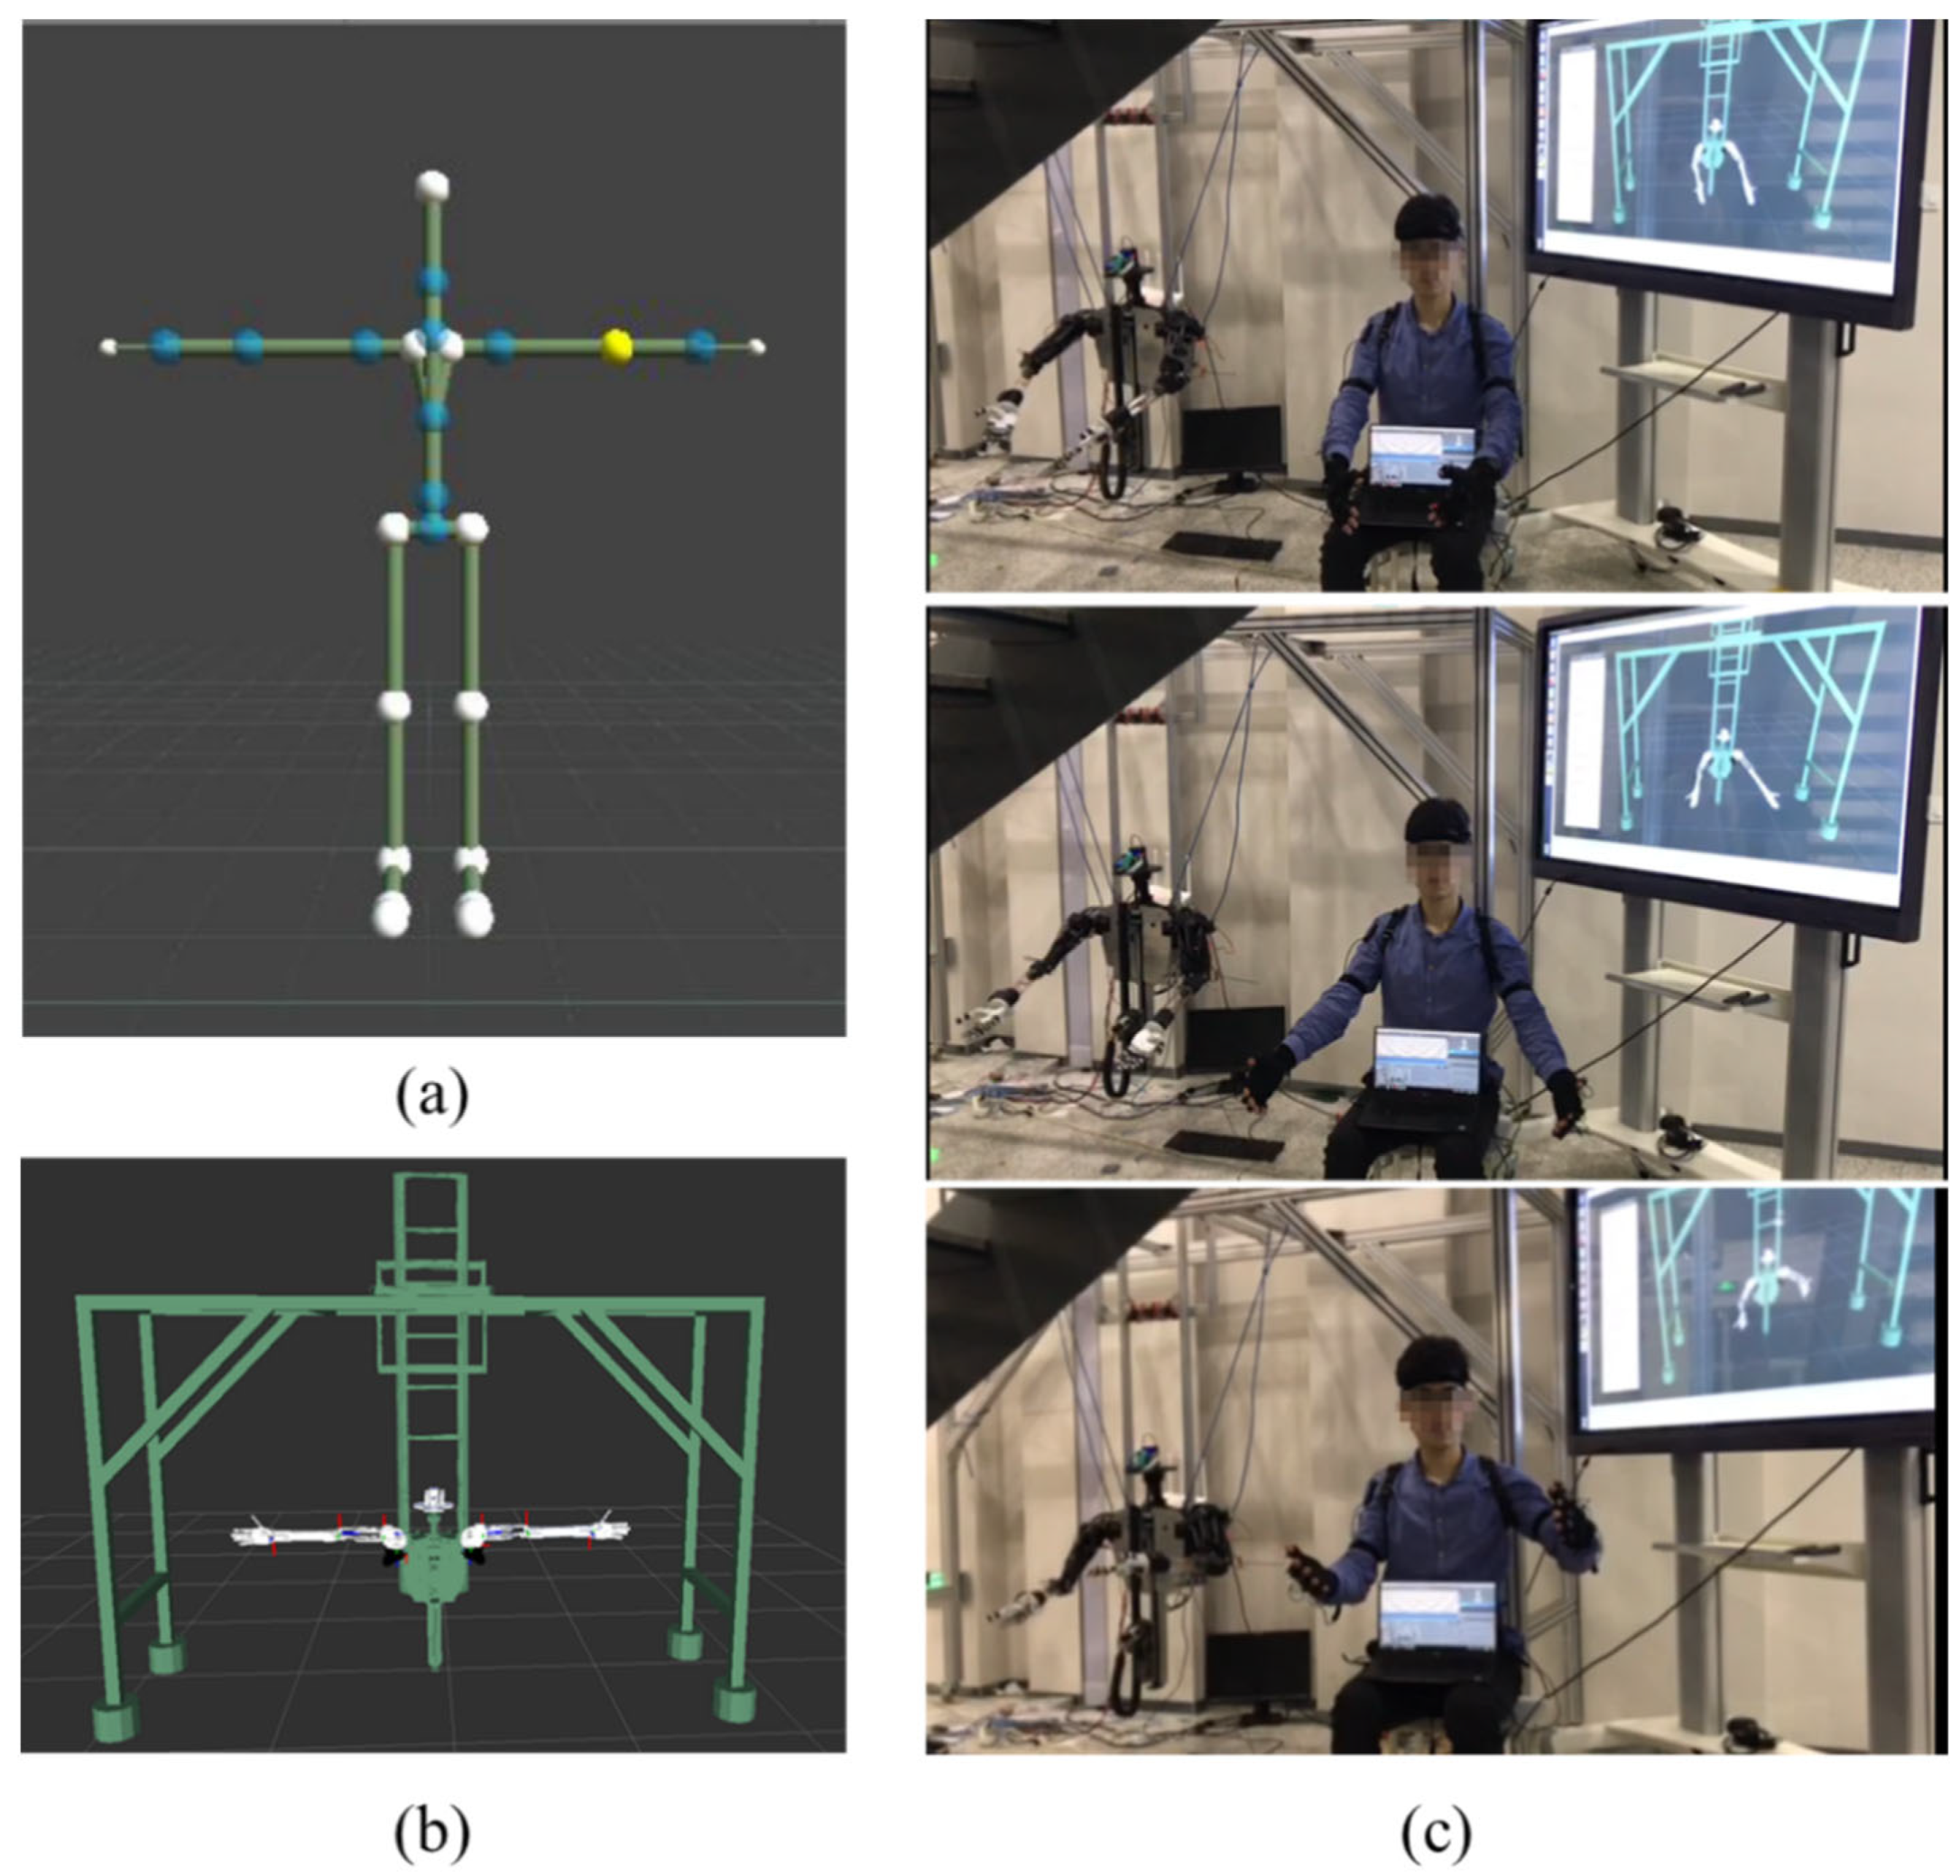
3.2. Motion Interactive System Based on Perception Neuron (PN) Sensor

In order to expediently control the complex movement of the multi-degree of freedom robot and improve control precision, a wearable sensor system is adopted to map the operator’s movement to the robot’s movement. Then, the robot can mimic the operator’s phenotyping operations.
A perception neuron (PN) sensor system produced by Noitom Company® [28] is used. This sensor system includes thirty-two inertial measurement units, each of which has a three-axis gyroscope, a three-axis accelerometer, and a three-axis magnetometer.
A PN sensor can export a BioVision Hierarchy (BVH) file after acquiring human motion data. A BVH file is a universal human motion feature description format, which is often used in skeletal animation models [29]. The BVH file describes the human skeleton model in the joint diagram shown in Figure 4a. Each joint describes the motion information through three rotation parameters and a complete description of the human motion is achieved. After the BVH data collected by the PN sensor are transmitted to the robot controller through the TCP/IP protocol, the Euler angles in the BVH need to be converted into joint angles and sent to the lower computer.
However, the actual movement of the human body is physiologically constrained. Not every joint has three degrees of freedom, and some degrees of freedom are not independent of each other, so there is a large difference between the BVH model and human body. Therefore, the mapping of Euler angles to the joint angle of the robot requires a reasonable algorithm. For example, the human shoulder joint has three degrees of freedom, which is similar to the shoulder of the robot body, so the Euler angle of the shoulder joint motion can be directly mapped to the robot body through rotation matrix. Since the elbow joint of the robot body has only one bending degree of freedom and lacks a rotational one, the elbow bending angle can be obtained by calculating the angle between the direction vector of the large arm and forearm. The angle of rotation of the wrist joint is mapped by the angle of rotation of the human elbow. We denote vector r 1 and r 2 as the large arm and forearm, respectively, and r 1 is the position direction of the X-axis. Therefore, the elbow bending angle can be calculated as
θ = π r 1 ,   r 2 = π a r c c o s r 1 · r 2 .
We assume that the two rotation degrees of freedom are along the Y- and Z-axes, respectively. The PN sensor can acquire the Euler angles of ZYX axes of the human arm, i.e., α z ,   β y ,   γ x . Since the rotation degree of freedom of the X-axis does not exist in the human arm, γ x 0 . The rotation matrix of the elbow is formulated as
R = 1 0 0 0 1 0 0 0 1 c o s β y 0 s i n β y 0 1 0 s i n β y 0 c o s β y c o s α z s i n α z 0 s i n α z c o s α z 0 0 0 1 .
The direction vector of r 1 is r 1 ^ = 1 , 0 , 0 T . Therefore, the direction vector of r 1 is
r 2 ^ = R r 1 ^ = 1 0 0 0 1 0 0 0 1 c o s β y 0 s i n β y 0 1 0 s i n β y 0 c o s β y c o s α z s i n α z 0 s i n α z c o s α z 0 0 0 1 1 0 0 = c o s β y c o s α z s i n α z s i n β y c o s α z .
Finally, the elbow bending angle can be obtained by
θ = π a r c c o s r 1 · r 2 = π a r c c o s r 1 ^ , r 2 ^ = π a r c c o s c o s β y c o s α z .
The robot hand has only one degree of freedom. In order to map the human hand motion to the maximum extent, the hand degree of freedom selects the fold angle of the human middle finger. Because of the high degree of freedom of the human neck, the left and right rotational degrees of freedom of the robot are directly mapped by the left and right rotation angle of the human neck.
A Unified Robot Description Format (URDF) file is constructed in the robot operating system (ROS) that runs on the robot’s industrial computer. It contains the joint relations of each mechanical parts of the robot and real-time simulation of the robot can be realized based on the URDF file, as shown in Figure 4b. ROS transmits the mapped joint angle data in real time through the serial port to the lower machine with a 10 Hz sampling frequency. Then, the lower machine drives the joint servos moving to the corresponding angle. Therefore, the operator’s motion is mapped to the robot ontology. Some motion interactive experiments are shown as Figure 4c.

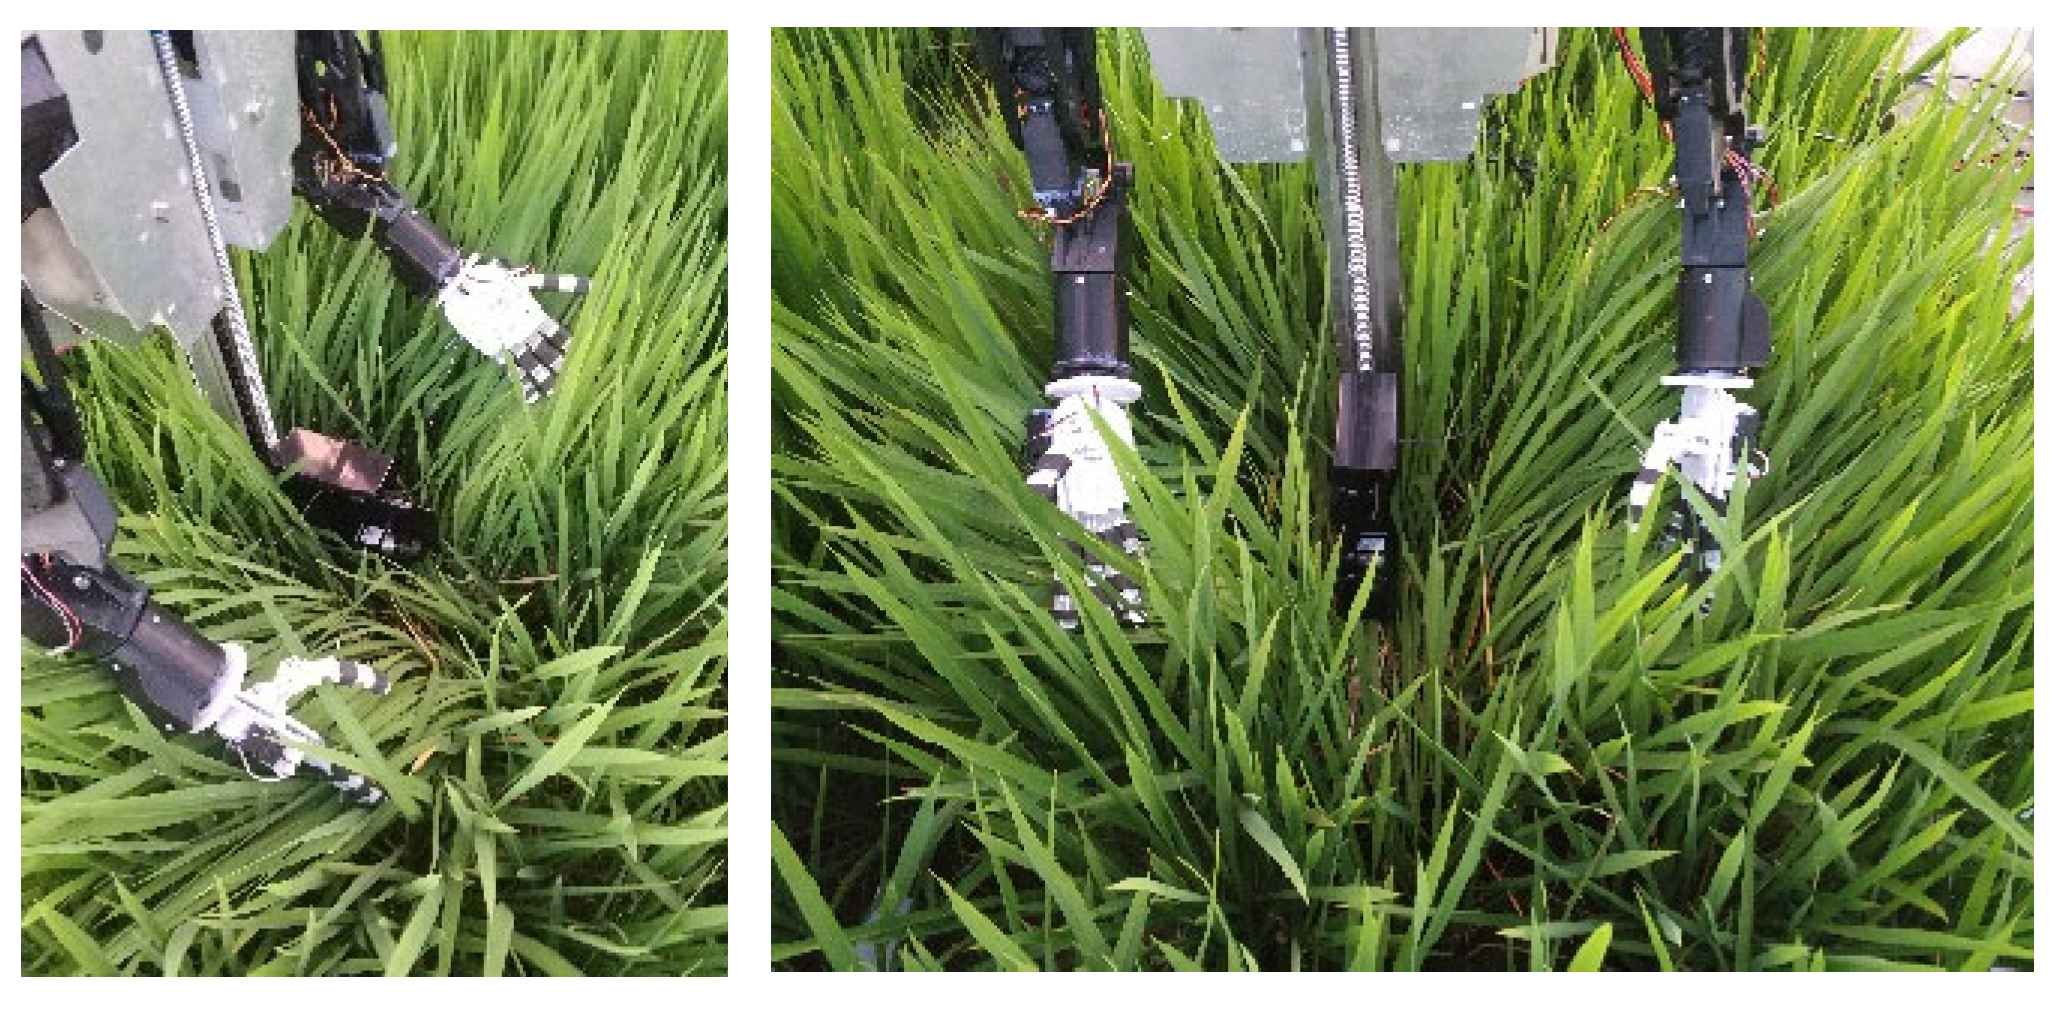
3.3. Bio-Inspired Operation

Through the head-mounted interactive system and the motion interaction system based on PN sensors, the operator can remotely control the robot in an immersive interactive way. The breeding expert must wear a full headset linked to the interactive system in the control room, so that it is possible to observe the real-time environment around the robot by the head-mounted interactive system through the movement of their head. The operator observes the plants that need to be measured and moves the robot to the appropriate position. The operator only needs to repeat the procedure and operations during the traditional manual phenotyping process, then the robot can be controlled to mimic his/her action to interact with the plant. The phenotype is then measured by the machine vision system. The naturally instructive paradigm is user-friendly and especially highly efficient with the first person view (FPV), which can accomplish efficient phenotyping operations [30]. The robot completely mimics the interactive operations of the breeding experts, so this interactive form has high efficiency and strong adaptability. With the help of the automated visual system, high-efficiency and high-precision phenotyping is achieved through the interactive cognition method.
Regularized phenotyping forms are formed through the bio-inspired operations based on the HRI technique. In the process of HRI, the typical operation schedules and actions of the breeding experts are recorded. In the long term, a large amount of data is recorded to form a manual teaching dataset. With a sufficiently large data set, the automation of interactive cognition can be continuously improved through continuous training using machine learning algorithms. We have conducted various studies on the human-in-the-loop imitation control method to improve robot adaptability to uncertain environments, although it is still challenging to realize entire task autonomy in a short period of time [31]. Eventually, fully automated bio-inspired phenotyping systems can be implemented to replace the traditional manual phenotyping pattern.

4. In-Field Rice Tiller Counting Method

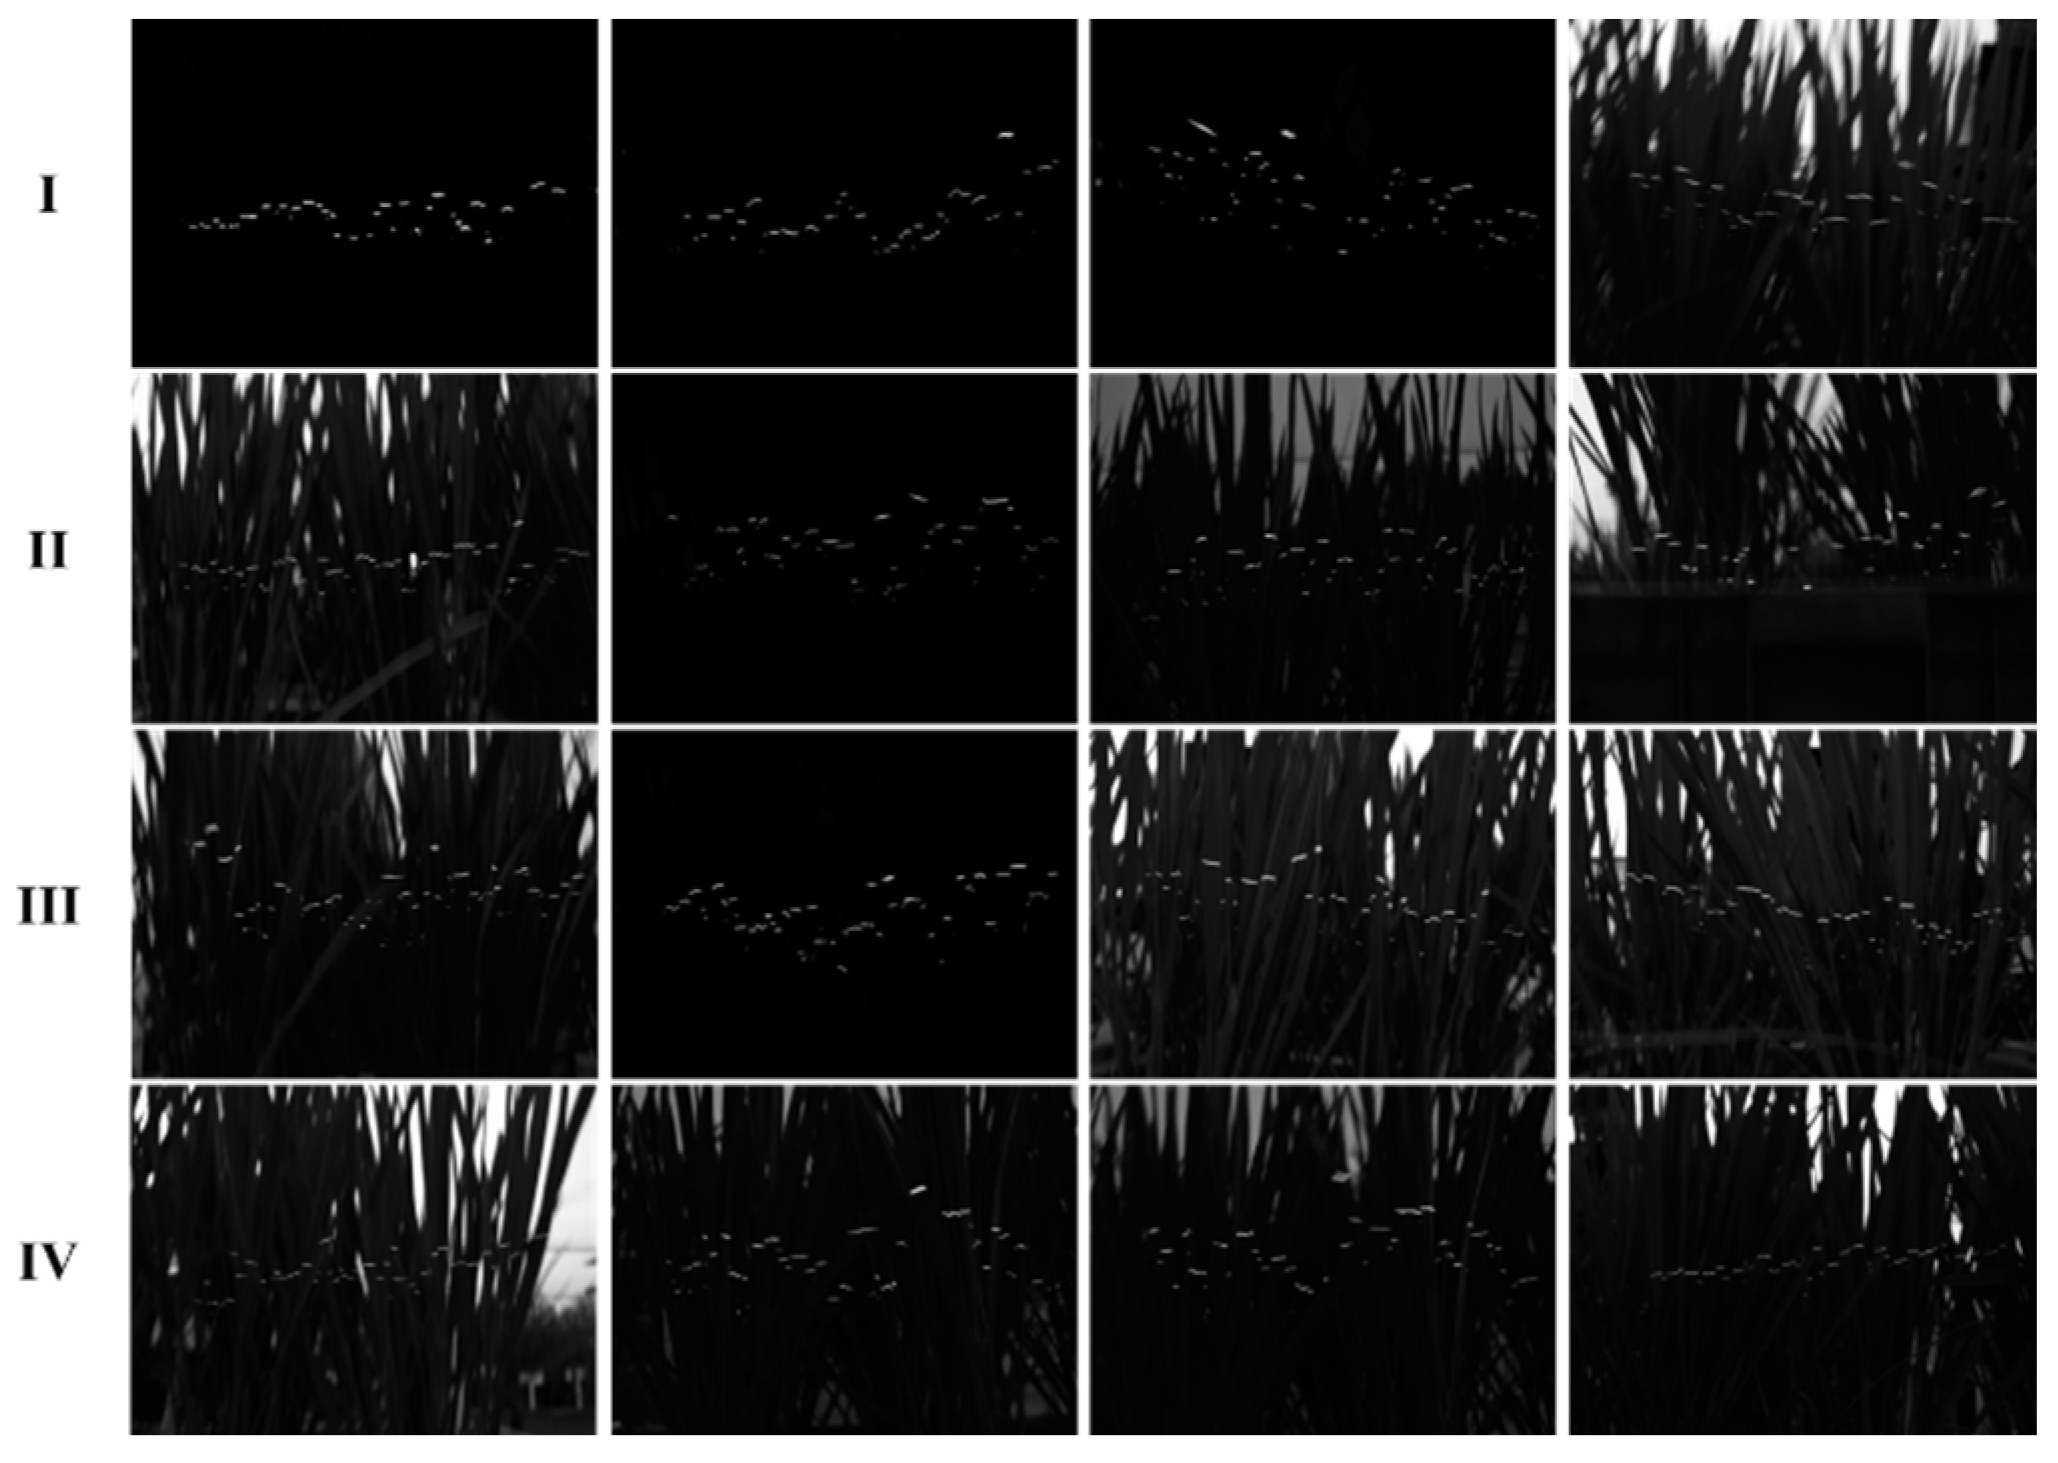
4.1. Image Acquisition

When the occlusion is removed through the interactive method illustrated above, images of the rice plant can be captured by the camera for tiller counting. However, since the tillers have similar colors with the background, it is difficult to recognize each tiller from an RGB image without depth information. To provide depth information for the images captured by an RGB camera, we use a horizontal line laser to scan the tillers. While the structured light system scans up and down, multiple images that scan different heights of the plant can be recorded for further tiller number recognition.
To reduce the influence of natural light on the light spots of the laser, we capture images with a small aperture to reduce the amount of light. Under this circumstance, the laser light spots can still be clearly identified and the rest of the regions are relatively dark. The images are then transformed to grayscale images to reduce computation. These grayscale images are resized to 256 × 256 pixels through bilinear interpolation to further improve computation efficiency.

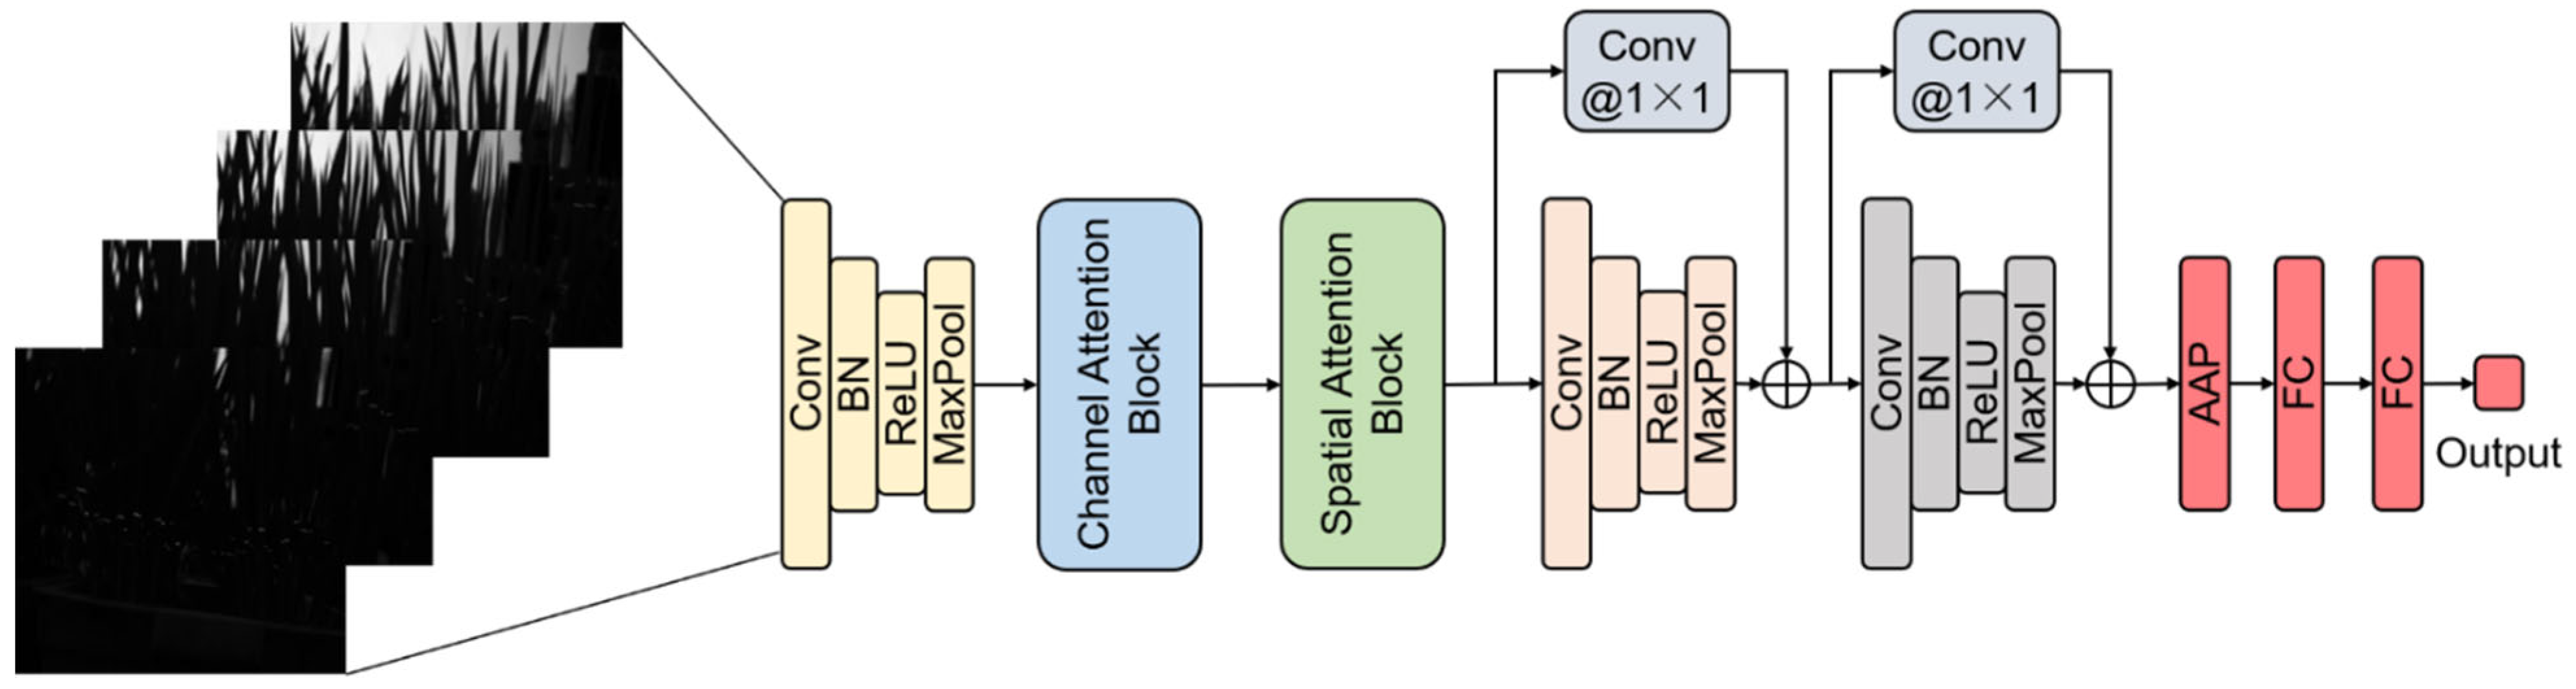
4.2. Rice Tiller Number Recognition Algorithm

After the images with laser light are obtained and preprocessed, a rice tiller counting algorithm is then used to obtain tiller numbers from the images. In practical applications, accurately counting the tiller number is difficult and unnecessary. In practice, the aim of gene-editing breeding is to promote effective tillering (tillers with panicles) to obtain high yields, while eliminating ineffective tillering (tillers without panicles) for reduced nutrition consumption [32]. Since the panicle numbers can be statistically estimated by drone detection, we aim to statistically estimate the total number of under-canopy tillers and then the number of effective tillers can be estimated. Therefore, we divide the tiller numbers into several grades and the task in this paper is to obtain the approximate ranges of tiller numbers.
In this paper, a deep learning method based on an attentional residual network (AtResNet) is proposed. Figure 5 illustrates the network structure. Resized grayscale images are directly input into the network, and they are processed through stacked layers. The backbone network is a deep convolutional neural network (CNN) with residual connections to ResNet [33] to prevent the overfitting problem. There are three convolutional blocks with similar structures, each of which firstly processes the input through a two-dimensional convolution operation as follows.
x i l = f c o n v l x i l 1 ; θ c , l = x i l 1 w c , l + b c ,   l ,
where x i l 1 denotes the input of the convolutional layer and θ c , l = w c , l , b c , l are the parameters of this layer. Then, a batch normalization (BN) [31] layer is introduced to speed up the network convergence, which is formulated for each mini-batch as follows.
x i l ^ = x i l E x i l V a r x i l ,
y i l = γ l x i l ^ + β l ,
where γ l and β l are learnable parameters. E · and V a r · denote the mean and variance value, respectively. Then, a rectified linear unit (ReLU) layer is used with a rectified linear function, which is formulated as
R e L U x = max 0 ,   x .  
Then, a max-pooling layer is adopted, which calculates the maximum values within the receptive field.
Figure 5. AtResNet model for rice tiller number recognition.
Agriculture 12 01966 g005
Residual connections are introduced to the second and last convolutional blocks to accelerate network training and prevent overfitting. A convolutional layer with a 1 × 1 kernel is used to perform identity mapping, which keeps the input and output size of the convolutional block the same. Then, the output of the l -th convolutional block can be calculated as follows.
x i l = σ f C B x i l 1 ; θ C B + B N f 1 × 1 x i l 1 , θ 1 × 1 ,
where f C B is the mapping function of the convolutional block, and f 1 × 1 is the mapping function of the 1 × 1 convolutional layer in residual connections. σ denotes the ReLU function. The output of the last convolutional block is processed by an adaptive average pooling (AAP) layer and two fully connected (FC) layers and the final output is a vector whose length is the same as the tiller number grades.
Since these images are dark in most regions and the laser light spots only appear in some small areas, attention mechanisms [34] are introduced to help the model focus on the informative regions. Firstly, a channel attention block [35] is adopted to allocate different weights to different feature channels. The channel attention block firstly aggregates spatial information through adaptive average pooling and adaptive max pooling operations. Then, a shared convolutional network is used to generate attention maps for each aggregated feature vector. In addition, two maps are summed to obtain the final channel attention map. In short, these channel attention operations are summarized as follows.
A c x = σ s f c o n v c A v g P o o l x + f c o n v c M a x P o o l x ,
where x R W × H × C represents the input features, and f c o n v c denotes the mapping function of the shared convolutional network, which consists of a 1 × 1 convolutional layer with C / r channels, a ReLU layer, and a 1 × 1 convolutional layer with   C channels. σ s denotes the sigmoid function. Finally, the calculated channel attention map A c x is applied to the input feature by element-wise multiplication, as follows:
x = A c x x .
Similarly, a spatial attention block [36] is adopted afterwards to obtain spatial attention maps to help the network to focus on informative spatial regions. Channel information is aggregated by average and maximum values. Two features are concatenated and then processed by a convolutional layer to produce the spatial attention map. The spatial attention operations can be summarized as follows.
A s x = σ s f c o n v s A v g x ;   M a x x ,
where f c o n v s denotes the mapping function of the convolutional layer. Finally, the calculated spatial attention map A_s (x) is applied to the input feature by element-wise multiplication, as follows:
x = A s x x .
The whole network outputs a vector y i ^ , which represents the predicted probability of the i -th sample that belongs to each tiller number grade. y i ^ is obtained through a softmax function of the output y f c of the last FC layer, as follows:
y i , j ^ = e y f c , j j = 1 K e y f c , j ,
where y f c , j and y i , j ^ denote the j -th element of y f c and y i ^ , respectively, and K is the number of all tiller number grades. The network is trained by minimizing the cross-entropy loss, which is defined as follows.
L = 1 N i = 1 N k = 1 K I y i = k log y i ,   k ^ ,
where I · is the indicator function, y i is the true tiller number grade label of the i -th sample and N is the sample number.

5. Experiment and Results

5.1. Data Description

Following the image acquisition procedure illustrated in Section 4.1, a set of images are obtained in fields using the structured light system. Then, these images are categorized into four classes according to the rice plant tiller number. In large-scale variant breeding, we found that the total tiller numbers of most variants are mainly between 21 and 25 [37]. We hoped to achieve relatively accurate tiller counting in this range. Therefore, we subdivide this range and the numbers fewer than 21 and more than 25 are divided roughly. Some image examples are shown as Figure 6. The details of these images are shown in Table 1. These images are transformed to grayscale images and resized to 256 × 256. Then, they are randomly split into a training set and a testing set with the ratio of 3:1.

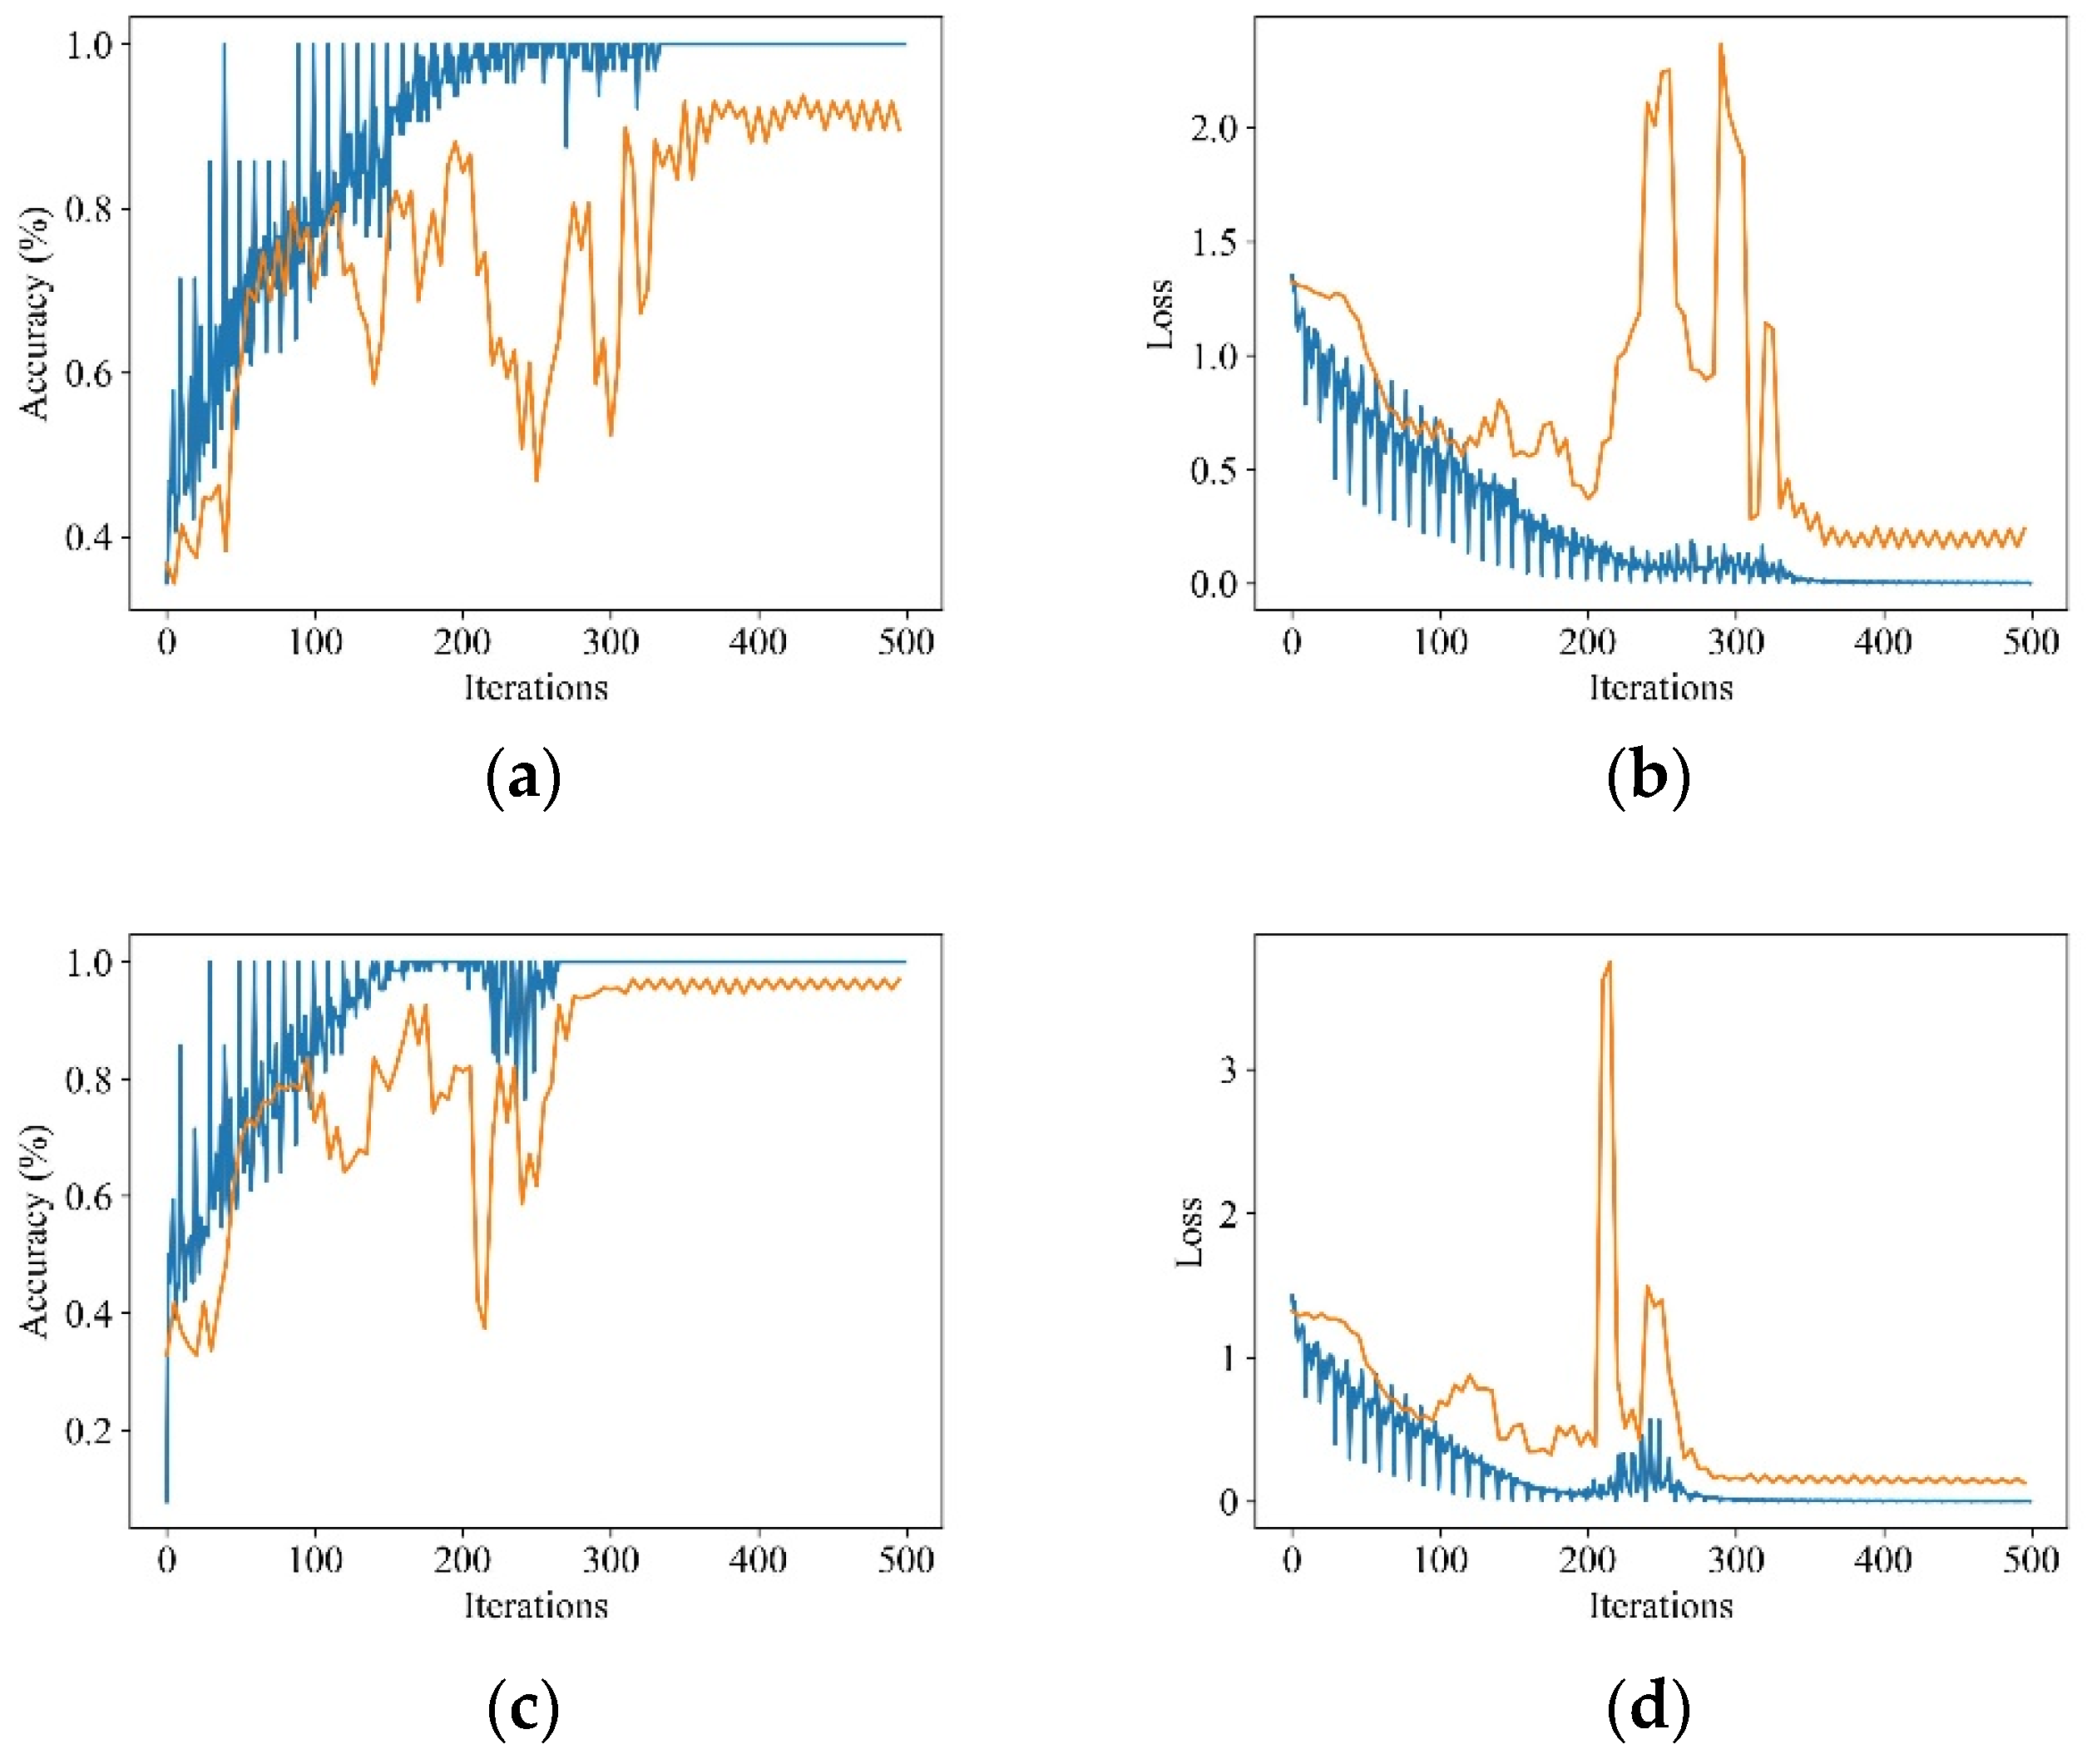
5.2. Experiment Setup
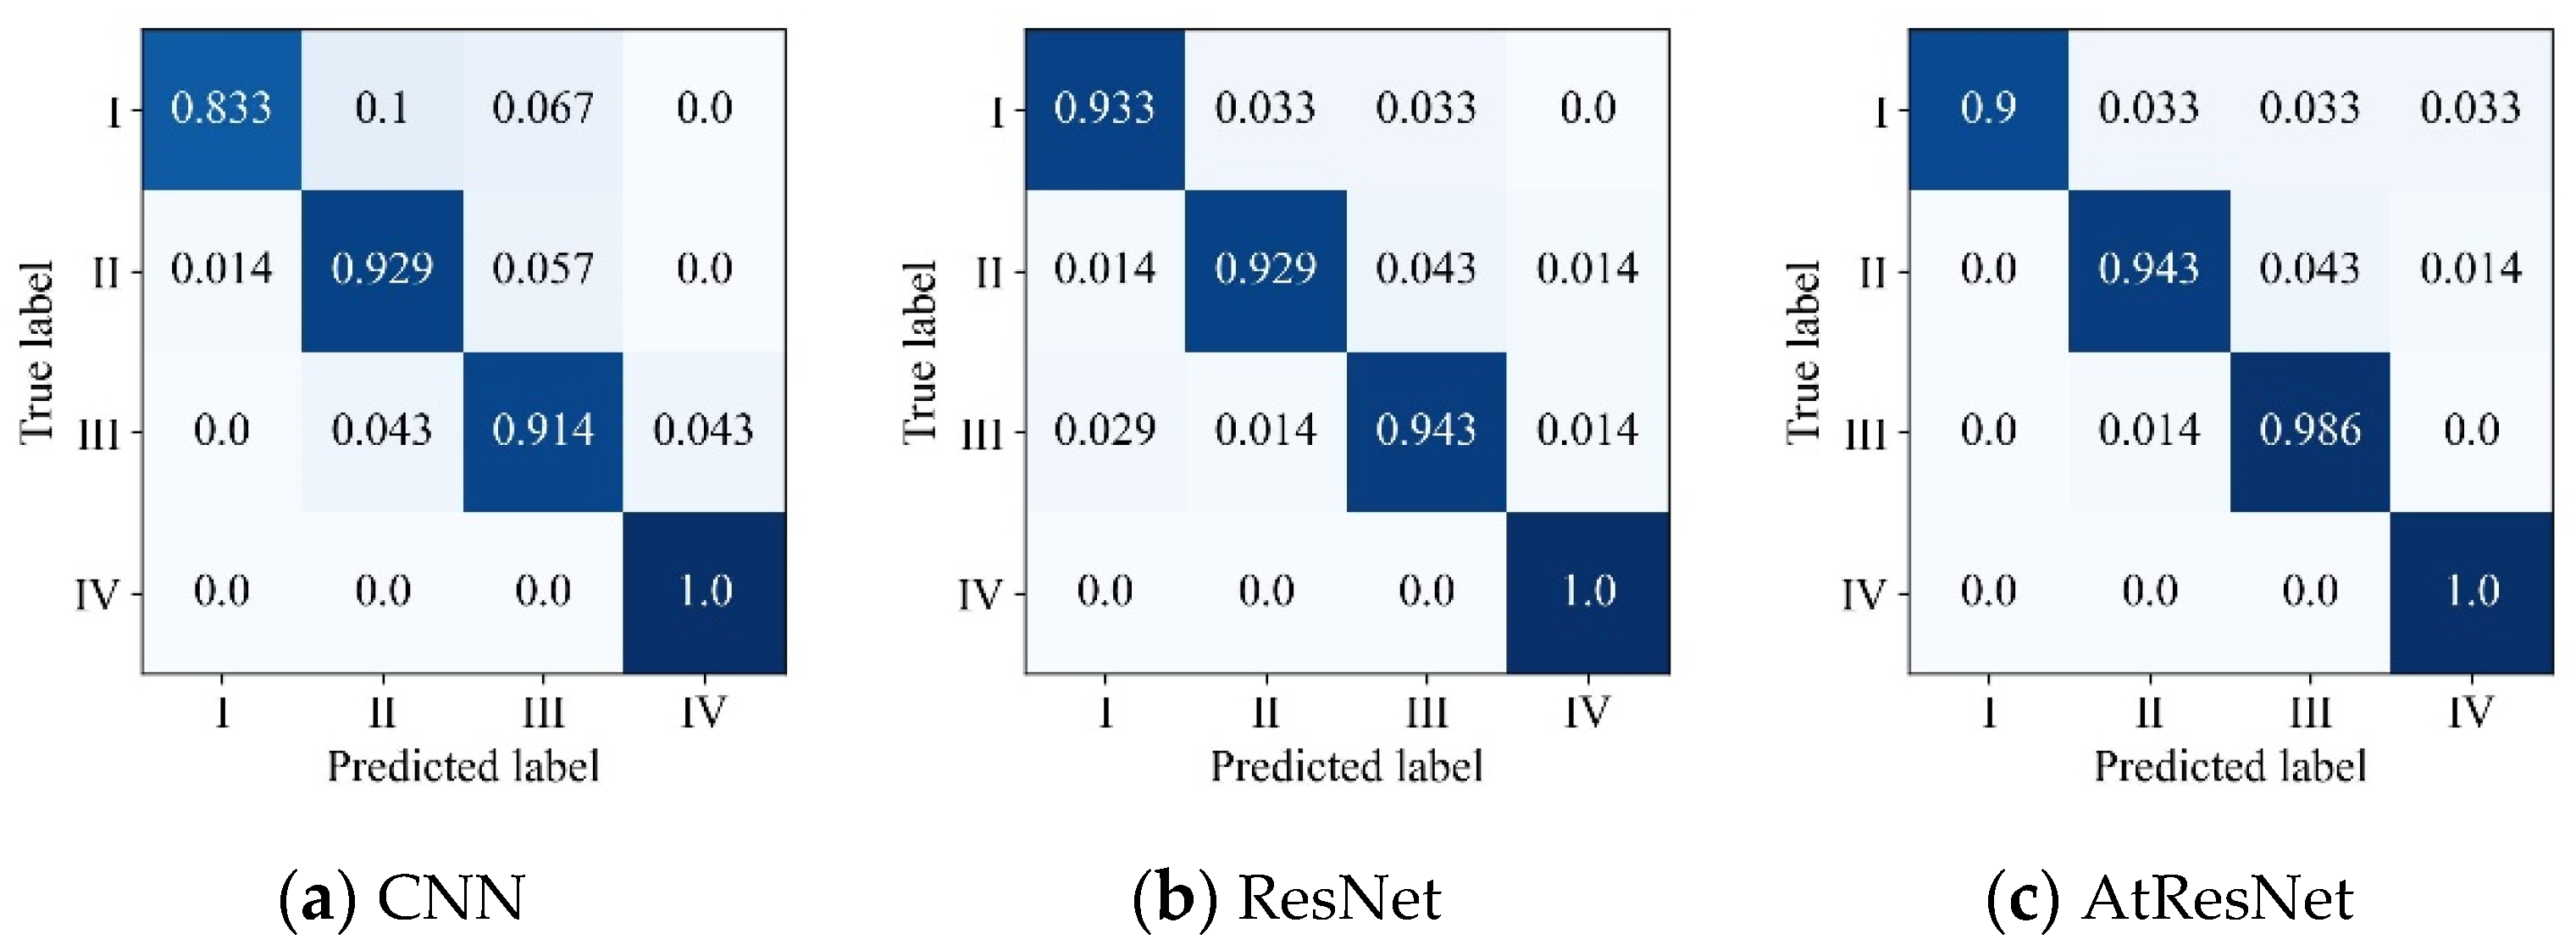
We use all the images in the training set to train the AtResNet and test the model using the testing set samples. The detailed parameter settings used in the experiment are listed in Table 2.
The network is implemented by PyTorch on an NVIDIA GTX 1660 GPU. It is trained by the Adam optimizer with a learning rate of 0.001 for 50 epochs. In each mini-batch, 64 samples are inputted into the system. A convolutional neural network (CNN) without residual connections and attention operations, and a ResNet without attention operations are also implemented for performance comparison. They share the same backbone structure and parameters with the AtResNet and all the experiments are repeated for 10 trials to reduce randomness.

5.3. Results

The experiment results of all the three methods are shown in Table 3. From the recognition results, we can observe that these deep learning-based methods achieved more than 93% tiller number recognition accuracy. This is satisfactory for practical applications. In addition, the proposed AtResNet outperforms the other two methods. We also illustrate the training and testing accuracy and loss values during the training process in Figure 7. We can observe that the AtResNet has lower accuracy and fewer loss fluctuations during model testing. It may be because the introduction of residual connections and attention operations helps the model to converge faster.
To further explore the recognition results, we also analyze the confusion matrix of the results, as shown in Figure 8. It is observed that all the three methods can accurately recognize images with grade IV tiller numbers. For grade II and III, the AtResNet displays higher recognition accuracy compared with the other two methods. Figure 9 shows some examples of spatial attention maps. The different colors represent different relative attention values. We can observe that the laser spot regions have different attention values with other dark areas. So, the network can selectively focus on the informative regions.

6. Conclusions

This paper presents a new in-field phenotyping paradigm. An interactive cognition method is proposed to overcome the problem of occlusion and overlap in traditional passive automatic phenotyping methods. A bio-inspired solution is introduced so that the phenotyping robot can mimic the manual phenotyping operations. In this way, automatic high-throughput phenotyping of full growth cycles is realized. A tiller number recognition method (AtResNet) is proposed based on interactive cognition. In-field images are collected for the experiments. The experiment results show that the proposed method can achieve approximately 95% tiller number recognition accuracy and outperforms other deep learning-based methods. This paper provides a new solution to the occlusion and observation pose problems in field phenotyping. Although drone detection can estimate the panicle number in a more efficient way, the proposed method overcomes the difficulty of under-canopy tiller counting, which assists in effective and ineffective tillering counting. Compared with traditional manual breeding processes, the proposed in-field phenotyping paradigm offers a more efficient solution to repeating phenotyping across the full growth period. In future work, we will develop multiple phenotyping robots and explore the control scheme of switching between them to further improve in-field phenotyping efficiency. Moreover, the panicle counting method based on drone detection over the canopy will be studied to estimate effective tillering.

Author Contributions

Conceptualization, Y.H. and L.G.; methodology, P.X. and L.G.; software, Y.H. and P.X.; validation, Y.L. and B.C.; data curation, Y.H., P.X. and L.G.; writing—original draft preparation, Y.H., P.X. and L.G.; writing—review and editing, L.G. and C.L.; visualization, P.X.; project administration, C.L.; funding acquisition, L.G. All authors have read and agreed to the published version of the manuscript.

Funding

This research was funded by the National Key Research and Development Program under Grant No. 2019YFE0125200.

Institutional Review Board Statement

Not applicable.

Data Availability Statement

The data presented in this study are available from the corresponding authors upon reasonable request.

Conflicts of Interest

The authors declare no conflict of interest.

References

  1. Godfray, H.C.J.; Beddington, J.R.; Crute, I.R.; Haddad, L.; Lawrence, D.; Muir, J.F.; Pretty, J.; Robinson, S.; Thomas, S.M.; Toulmin, C. Food Security: The Challenge of Feeding 9 Billion People. Science 2010, 327, 812–818. [Google Scholar] [CrossRef] [Green Version]
  2. Crossa, J.; Fritsche-Neto, R.; Montesinos-Lopez, O.A.; Costa-Neto, G.; Dreisigacker, S.; Montesinos-Lopez, A.; Bentley, A.R. The Modern Plant Breeding Triangle: Optimizing the Use of Genomics, Phenomics, and Enviromics Data. Front. Plant Sci. 2021, 12, 651480. [Google Scholar] [CrossRef]
  3. Hickey, L.T.; Hafeez, A.N.; Robinson, H.; Jackson, S.A.; Leal-Bertioli, S.C.M.; Tester, M.; Gao, C.; Godwin, I.D.; Hayes, B.J.; Wulff, B.B.H. Breeding crops to feed 10 billion. Nat. Biotechnol. 2019, 37, 744–754. [Google Scholar] [CrossRef] [Green Version]
  4. Yang, Z.; Gao, S.; Xiao, F.; Li, G.; Ding, Y.; Guo, Q.; Paul, M.J.; Liu, Z. Leaf to panicle ratio (LPR): A new physiological trait indicative of source and sink relation in japonica rice based on deep learning. Plant Methods 2020, 16, 1–15. [Google Scholar] [CrossRef]
  5. Furbank, R.T.; Tester, M. Phenomics—technologies to relieve the phenotyping bottleneck. Trends Plant Sci. 2011, 16, 635–644. [Google Scholar] [CrossRef]
  6. Araus, J.L.; Cairns, J.E. Field high-throughput phenotyping: The new crop breeding frontier. Trends Plant Sci. 2014, 19, 52–61. [Google Scholar] [CrossRef]
  7. Jin, X.; Zarco-Tejada, P.J.; Schmidhalter, U.; Reynolds, M.P.; Hawkesford, M.J.; Varshney, R.K.; Yang, T.; Nie, C.; Li, Z.; Ming, B.; et al. High-Throughput Estimation of Crop Traits: A Review of Ground and Aerial Phenotyping Platforms. IEEE Geosci. Remote Sens. Mag. 2020, 9, 200–231. [Google Scholar] [CrossRef]
  8. Scanalyzer 3d, Lemnatec Gmbh. Available online: http://www.lemnatec.com/products/hardware-solutions/scanalyzer-3d/ (accessed on 30 September 2022).
  9. Petrozza, A.; Santaniello, A.; Summerer, S.; Di Tommaso, G.; Di Tommaso, D.; Paparelli, E.; Piaggesi, A.; Perata, P.; Cellini, F. Physiological responses to Megafol® treatments in tomato plants under drought stress: A phenomic and molecular approach. Sci. Hortic. 2014, 174, 185–192. [Google Scholar] [CrossRef]
  10. Appf. Plant Accelerator. Available online: https://www.plant-phenomics.org.au/ (accessed on 30 September 2022).
  11. Hartmann, A.; Czauderna, T.; Hoffmann, R.; Stein, N.; Schreiber, F. HTPheno: An image analysis pipeline for high-throughput plant phenotyping. BMC Bioinform. 2011, 12, 148. [Google Scholar] [CrossRef] [Green Version]
  12. Liu, S.; Martre, P.; Buis, S.; Abichou, M.; Andrieu, B.; Baret, F. Estimation of Plant and Canopy Architectural Traits Using the Digital Plant Phenotyping Platform. Plant Physiol. 2019, 181, 881–890. [Google Scholar] [CrossRef]
  13. Scanalyzer Field, Lemnatec Gmbh. Available online: http://www.lemnatec.com/products/hardwaresolutions/scanalyzer-field/ (accessed on 30 September 2022).
  14. Andrade-Sanchez, P.; Gore, M.A.; Heun, J.T.; Thorp, K.R.; Carmo-Silva, A.E.; French, A.N.; Salvucci, M.E.; White, J.W. Development and evaluation of a field-based high-throughput phenotyping platform. Funct. Plant Biol. 2014, 41, 68–79. [Google Scholar] [CrossRef] [Green Version]
  15. Mueller-Sim, T.; Jenkins, M.; Abel, J.; Kantor, G. The Robotanist: A ground-based agricultural robot for high-throughput crop phenotyping. In Proceedings of the 2017 IEEE International Conference on Robotics and Automation (ICRA), Singapore, 29 May–3 June 2017; pp. 3634–3639. [Google Scholar] [CrossRef]
  16. Bao, Y.; Nakami, A.D.; Tang, L. Development of a Field Robotic Phenotyping System for Sorghum Biomass Yield Component Traits Characterization. In Proceedings of the ASABE and CSBE/SCGAB Annual International Meeting, Montreal, QC, Canada, 13–16 July 2014; Available online: https://elibrary.asabe.org/abstract.asp?aid=44616&t=5 (accessed on 30 September 2022).
  17. Zhou, C.; Ye, H.; Hu, J.; Shi, X.; Hua, S.; Yue, J.; Xu, Z.; Yang, G. Automated Counting of Rice Panicle by Applying Deep Learning Model to Images from Unmanned Aerial Vehicle Platform. Sensors 2019, 19, 3106. [Google Scholar] [CrossRef] [Green Version]
  18. Xing, Y.; Zhang, Q. Genetic and Molecular Bases of Rice Yield. Annu. Rev. Plant Biol. 2010, 61, 421–442. [Google Scholar] [CrossRef]
  19. Chen, J.; Gao, H.; Zheng, X.-M.; Jin, M.; Weng, J.-F.; Ma, J.; Ren, Y.; Zhou, K.; Wang, Q.; Wang, J.; et al. An evolutionarily conserved gene, FUWA, plays a role in determining panicle architecture, grain shape and grain weight in rice. Plant J. 2015, 83, 427–438. [Google Scholar] [CrossRef] [Green Version]
  20. Yang, W.; Xu, X.; Duan, L.; Luo, Q.; Chen, S.; Zeng, S.; Liu, Q. High-throughput measurement of rice tillers using a conveyor equipped with x-ray computed tomography. Rev. Sci. Instrum. 2011, 82, 025102. [Google Scholar] [CrossRef] [Green Version]
  21. Zhifeng, H.; Liang, G.; Chengliang, L.; Yixiang, H.; Qingliang, N. Measurement of Rice Tillers Based on Magnetic Resonance Imaging. IFAC-Pap. 2016, 49, 254–258. [Google Scholar] [CrossRef]
  22. Scotford, I.; Miller, P. Estimating Tiller Density and Leaf Area Index of Winter Wheat using Spectral Reflectance and Ultrasonic Sensing Techniques. Biosyst. Eng. 2004, 89, 395–408. [Google Scholar] [CrossRef]
  23. Deng, R.; Jiang, Y.; Tao, M.; Huang, X.; Bangura, K.; Liu, C.; Lin, J.; Qi, L. Deep learning-based automatic detection of productive tillers in rice. Comput. Electron. Agric. 2020, 177, 105703. [Google Scholar] [CrossRef]
  24. Yamagishi, Y.; Kato, Y.; Ninomiya, S.; Guo, W. Image-Based Phenotyping for Non-Destructive in Situ Rice (Oryza Sativa L.) Tiller Counting Using Proximal Sensing. Sensors 2022, 22, 5547. [Google Scholar] [CrossRef]
  25. Chen, Y.; Xiong, Y.; Zhang, B.; Zhou, J.; Zhang, Q. 3D point cloud semantic segmentation toward large-scale unstructured agricultural scene classification. Comput. Electron. Agric. 2021, 190, 106445. [Google Scholar] [CrossRef]
  26. Langevin, G. Inmoov—Open Source 3d Printed Life Size Robot. Available online: http://inmoov.fr (accessed on 30 September 2022).
  27. Kontoudis, G.P. Openbionics—Open-Source Robotic & Bionic Hands. Available online: http://www.openbionics.org (accessed on 30 September 2022).
  28. Perception Neuron System. Available online: https://noitom.com/perception-neuron-series (accessed on 30 September 2022).
  29. Ferenc, G.; Dimic, Z.; Lutovac, M.; Vidakovic, J.; Kvrgic, V. Open Architecture Platforms for the Control of Robotic Systems and a Proposed Reference Architecture Model. Trans. Famena 2013, 37, 89–100. [Google Scholar]
  30. Gong, L.; Li, X.; Xu, W.; Chen, B.; Zhao, Z.; Huang, Y.; Liu, C. Naturally teaching a humanoid Tri-Co robot in a real-time scenario using first person view. Sci. China Inf. Sci. 2019, 62, 50205. [Google Scholar] [CrossRef] [Green Version]
  31. Gong, L.; Chen, B.; Xu, W.; Liu, C.; Li, X.; Zhao, Z.; Zhao, L. Motion Similarity Evaluation between Human and a Tri-Co Robot during Real-Time Imitation with a Trajectory Dynamic Time Warping Model. Sensors 2022, 22, 1968. [Google Scholar] [CrossRef]
  32. Ren, M.; Huang, M.; Qiu, H.; Chun, Y.; Li, L.; Kumar, A.; Fang, J.; Zhao, J.; He, H.; Li, X. Genome-Wide Association Study of the Genetic Basis of Effective Tiller Number in Rice. Rice 2021, 14, 1–13. [Google Scholar] [CrossRef]
  33. He, K.M.; Zhang, X.Y.; Ren, S.Q.; Sun, J. Deep Residual Learning for Image Recognition. In Proceedings of the 2016 IEEE Conference on Computer Vision and Pattern Recognition (CVPR), Las Vegas, NV, USA, 27–30 June 2016; pp. 770–778. [Google Scholar]
  34. Ioffe, S.; Szegedy, C. Batch Normalization: Accelerating Deep Network Training by Reducing Internal Covariate Shift. In Proceedings of the International Conference on Machine Learning, Lille, France, 6–11 July 2015; Volume 37, pp. 448–456. [Google Scholar]
  35. Mnih, V.; Heess, N.; Graves, A.; Kavukcuoglu, K. Recurrent Models of Visual Attention. In Proceedings of the 27th International Conference on Neural Information Processing Systems, Montreal, QC, Canada, 8–13 December 2014. [Google Scholar]
  36. Woo, S.H.; Park, J.; Lee, J.Y.; Kweon, I.S. CBAM: Convolutional Block Attention Module. In Computer Vision—ECCV 2018; PT VII; Springer: Berlin/Heidelberg, Germany, 2018; Volume 11211, pp. 3–19. [Google Scholar]
  37. Yan, Y.; Wei, M.; Li, Y.; Tao, H.; Wu, H.; Chen, Z.; Li, C.; Xu, J.-H. MiR529a controls plant height, tiller number, panicle architecture and grain size by regulating SPL target genes in rice (Oryza sativa L.). Plant Sci. 2020, 302, 110728. [Google Scholar] [CrossRef]
Figure 1. Interactively cognitive humanoid phenotyping robot.
Agriculture 12 01966 g001
Figure 2. The robot removing occlusion.
Agriculture 12 01966 g002
Figure 3. Human–robot interactive (HRI) framework for interactive phenotyping.
Agriculture 12 01966 g003
Figure 4. Motion interaction. (a) BVH joint diagram. (b) URDF visualization. (c) Motion interactive experiments.
Agriculture 12 01966 g004
Figure 6. Some image examples of four tiller number grades (improved brightness).
Agriculture 12 01966 g006
Figure 7. Training and testing accuracy and loss value curve. (a) CNN accuracy. (b) CNN loss. (c) AtResNet accuracy. (d) AtResNet loss. Blue line denotes training process and orange line denotes testing process.
Agriculture 12 01966 g007
Figure 8. Confusion matrix of tiller number recognition results.
Agriculture 12 01966 g008
Figure 9. Examples of spatial attention maps in AtResNet.
Agriculture 12 01966 g009
Table 1. Dataset details.
GradeTiller NumberImage Number
I<21120
II21~22278
III23~25280
IV>25100
Table 2. Parameter details of AtResNet.
LayerParameterOutput Size
Conv1Kernel size: 5 × 5
Stride: 2 × 2
Padding: 2
Kernel number: 16
128 × 128 × 16
Pool1Kernel size: 2 × 2 64 × 64 × 16
Conv2Kernel size: 3 × 3
Stride: 1 × 1
Padding: 1
Kernel number: 32
64 × 64 × 32
Pool2Kernel size: 2 × 2 32 × 32 × 2
Conv3Kernel size: 3 × 3
Stride: 1 × 1
Padding: 1
Kernel number: 64
32 × 32 × 64
Pool3Kernel size: 2 × 2 16 × 16 × 64
Channel Attentionr: 16-
Spatial AttentionKernel size: 7 × 7
Stride: 1 × 1
Padding: 3
Kernel number: 1
-
AAPOutput size: 4 × 4 4 × 4 × 64
FC1Unit number: 128 128 × 1
FC2Unit number: 4 4 × 1
Table 3. Tiller number recognition accuracy (%) of three methods.
MethodMeanStandard Deviation
CNN93.491.64
ResNet94.212.06
AtResNet94.721.70
Publisher’s Note: MDPI stays neutral with regard to jurisdictional claims in published maps and institutional affiliations.

