
Full-Scale Experimental Study on Flexural Performance of the New Precast UHPC Diaphragm Slab in Utility Tunnels

Abstract
:1. Introduction
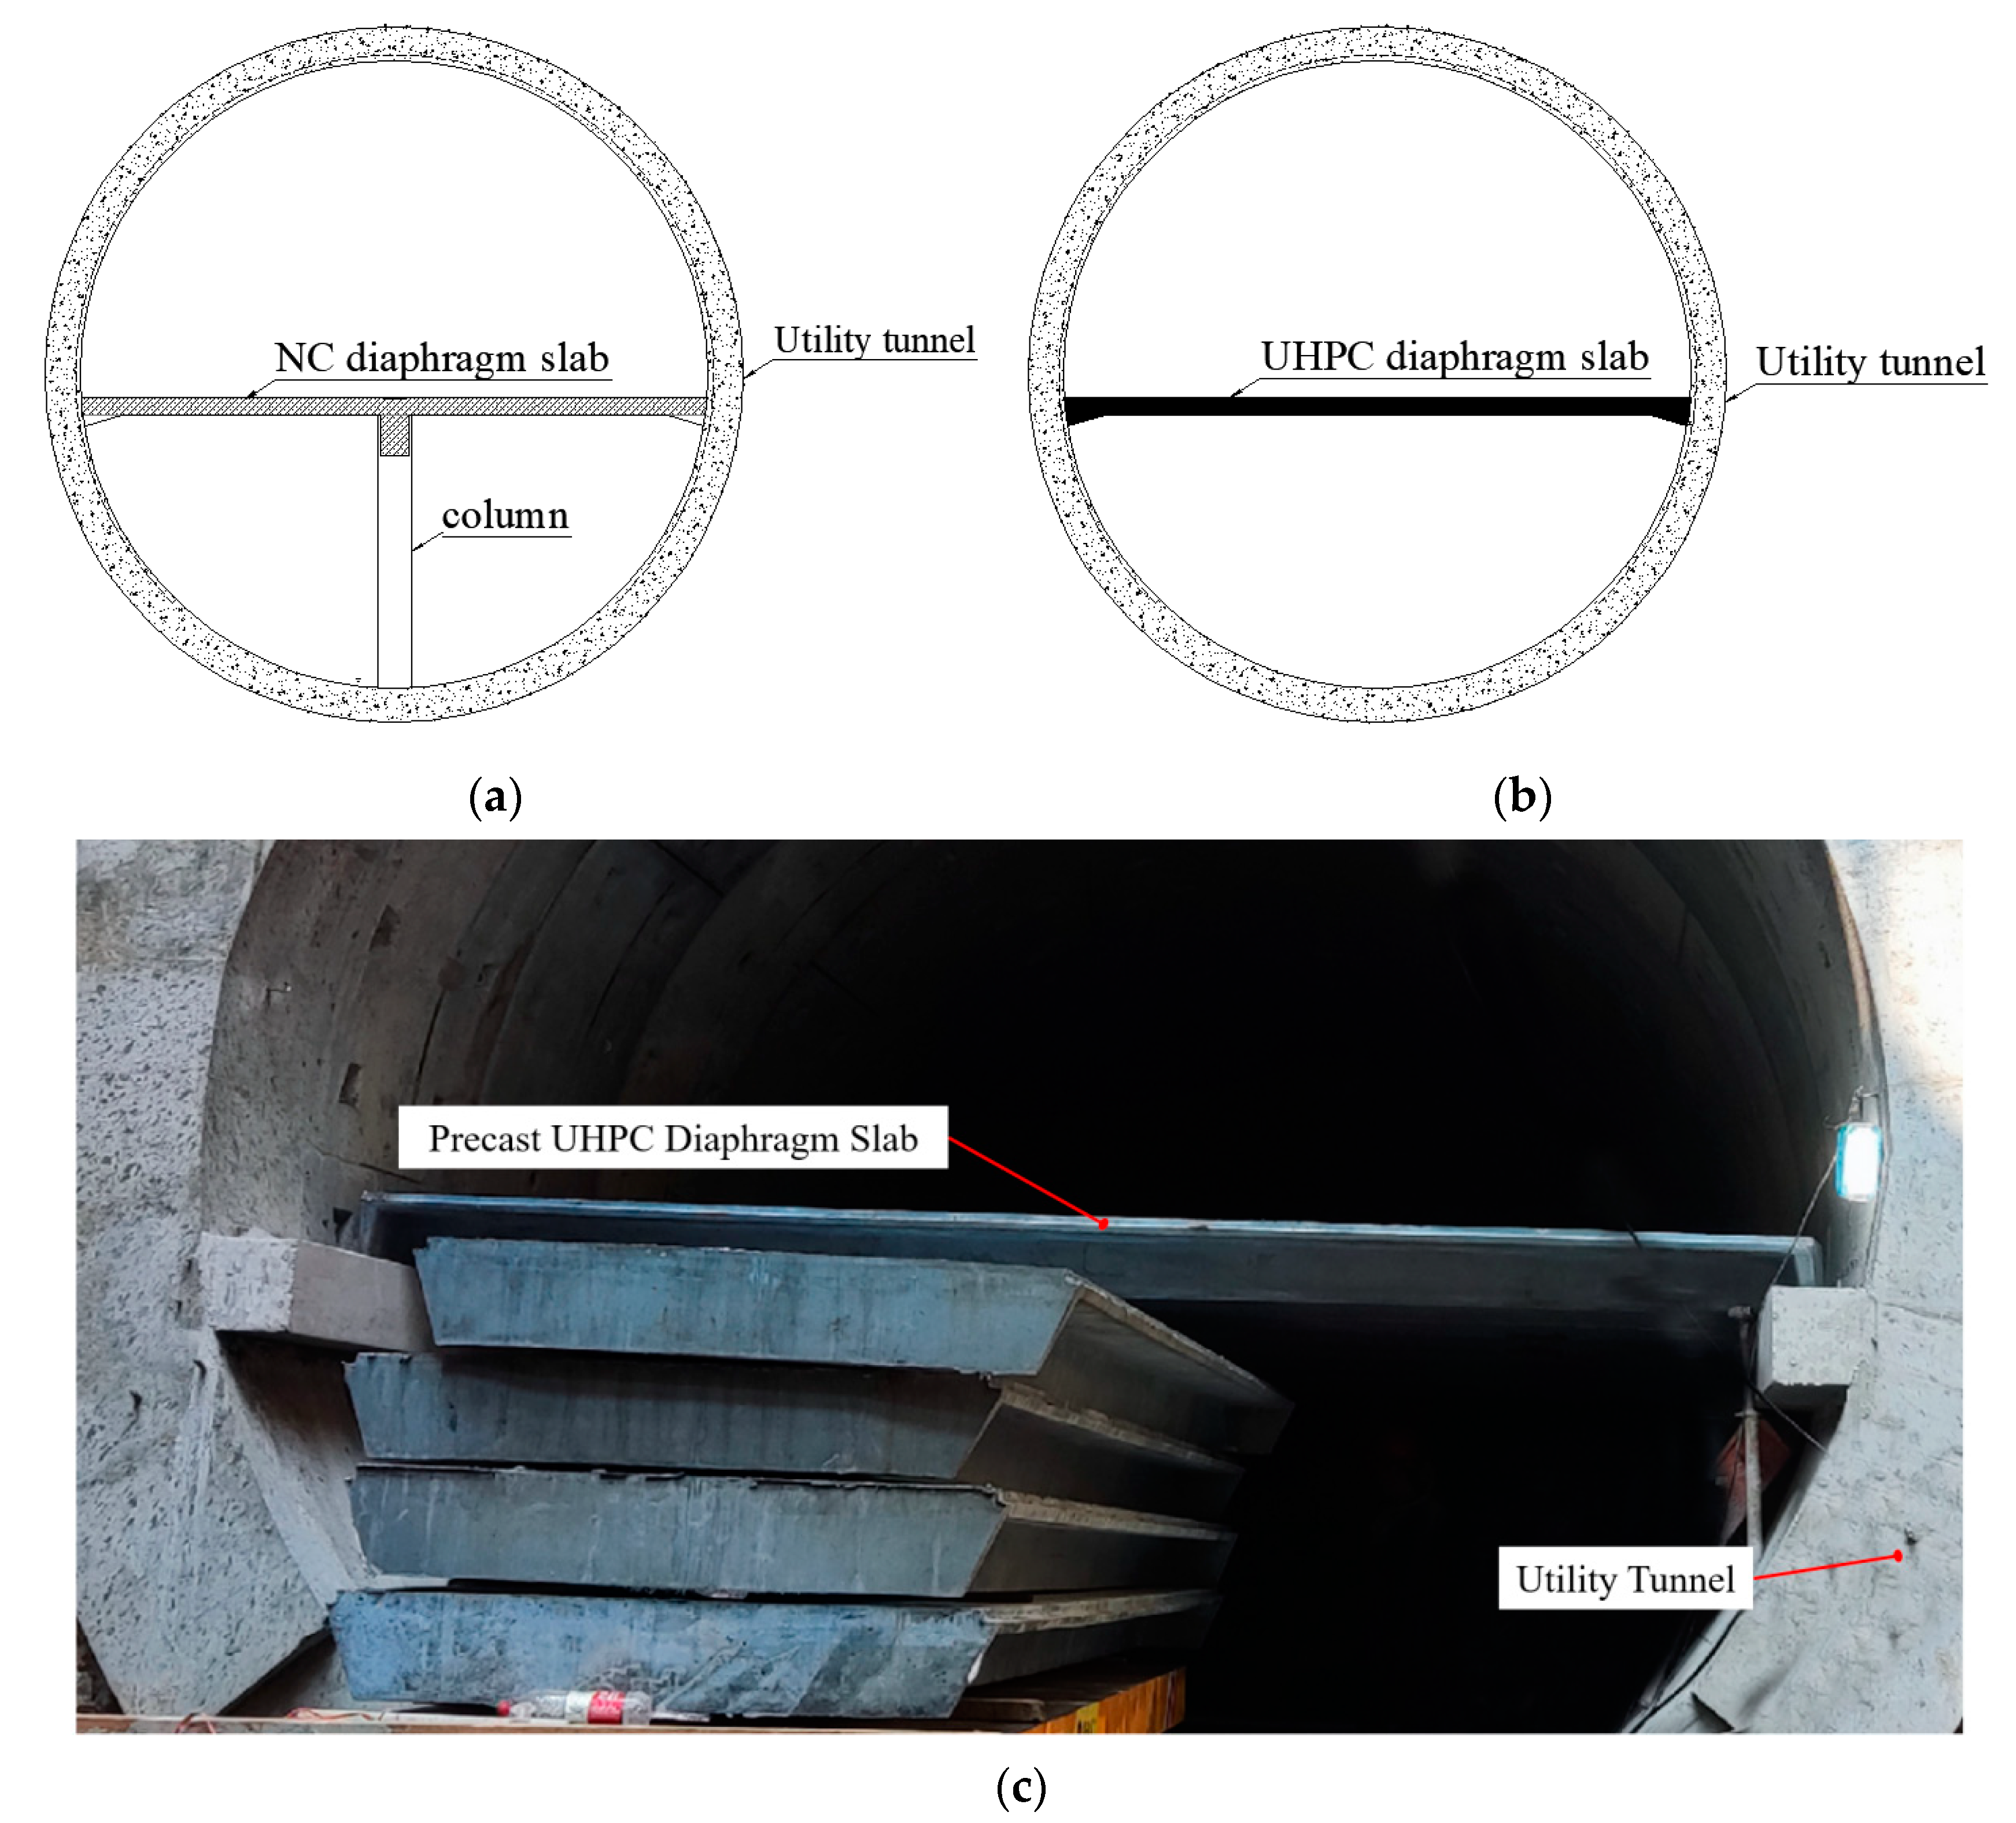
1.1. Background
1.2. Research Significance
2. Experimental Program
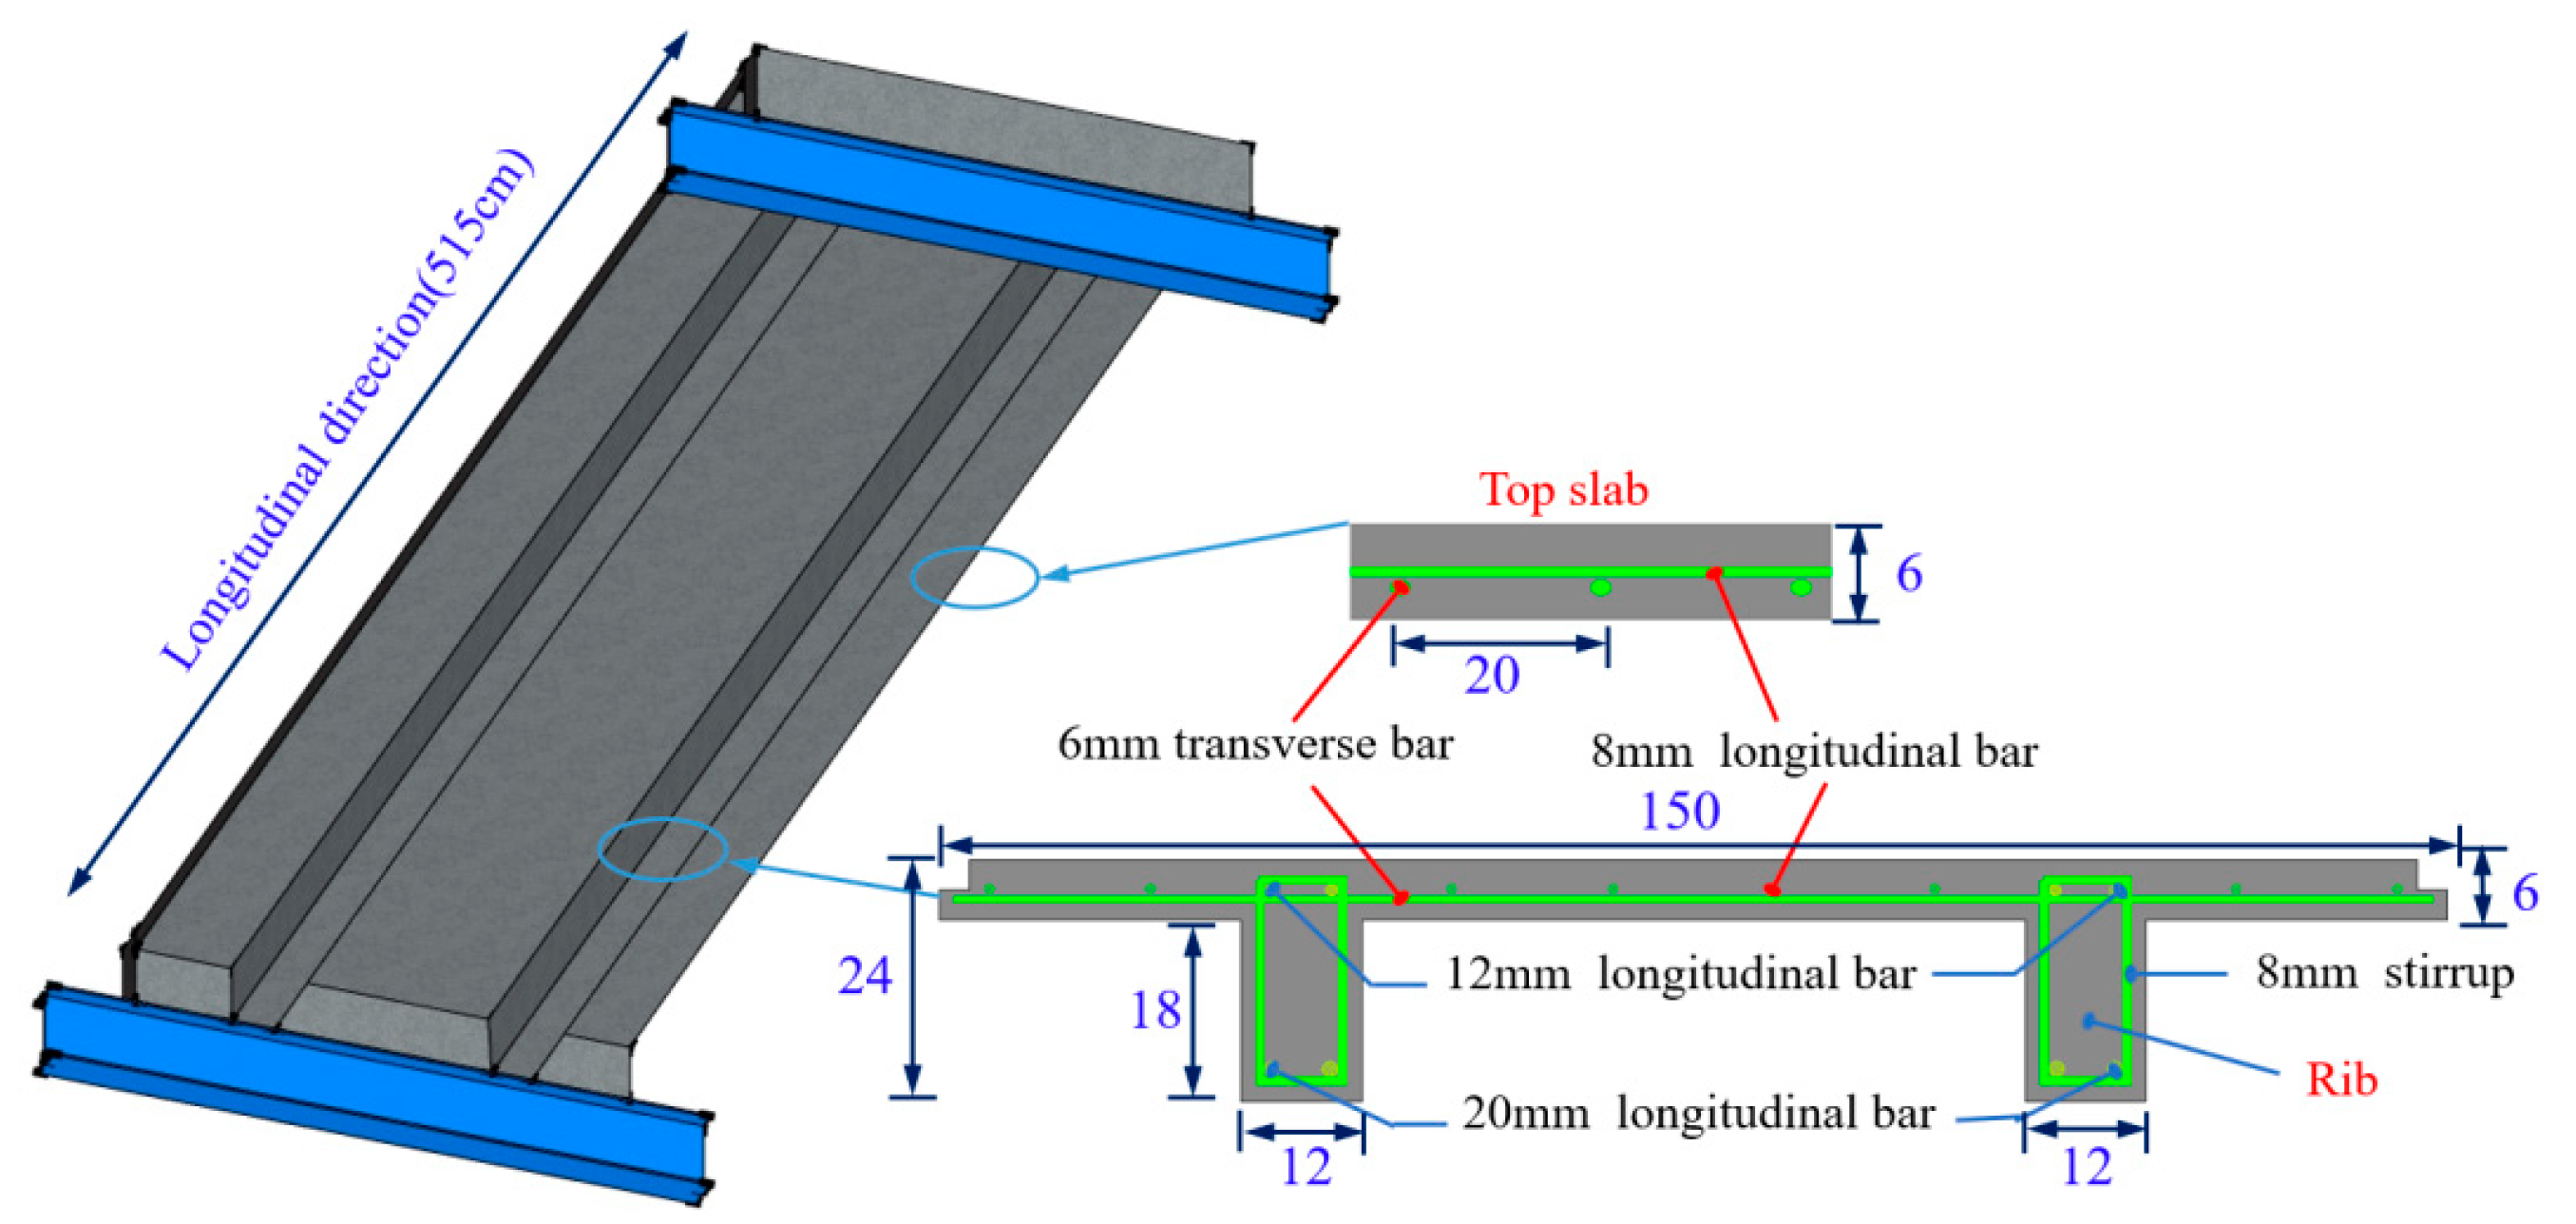
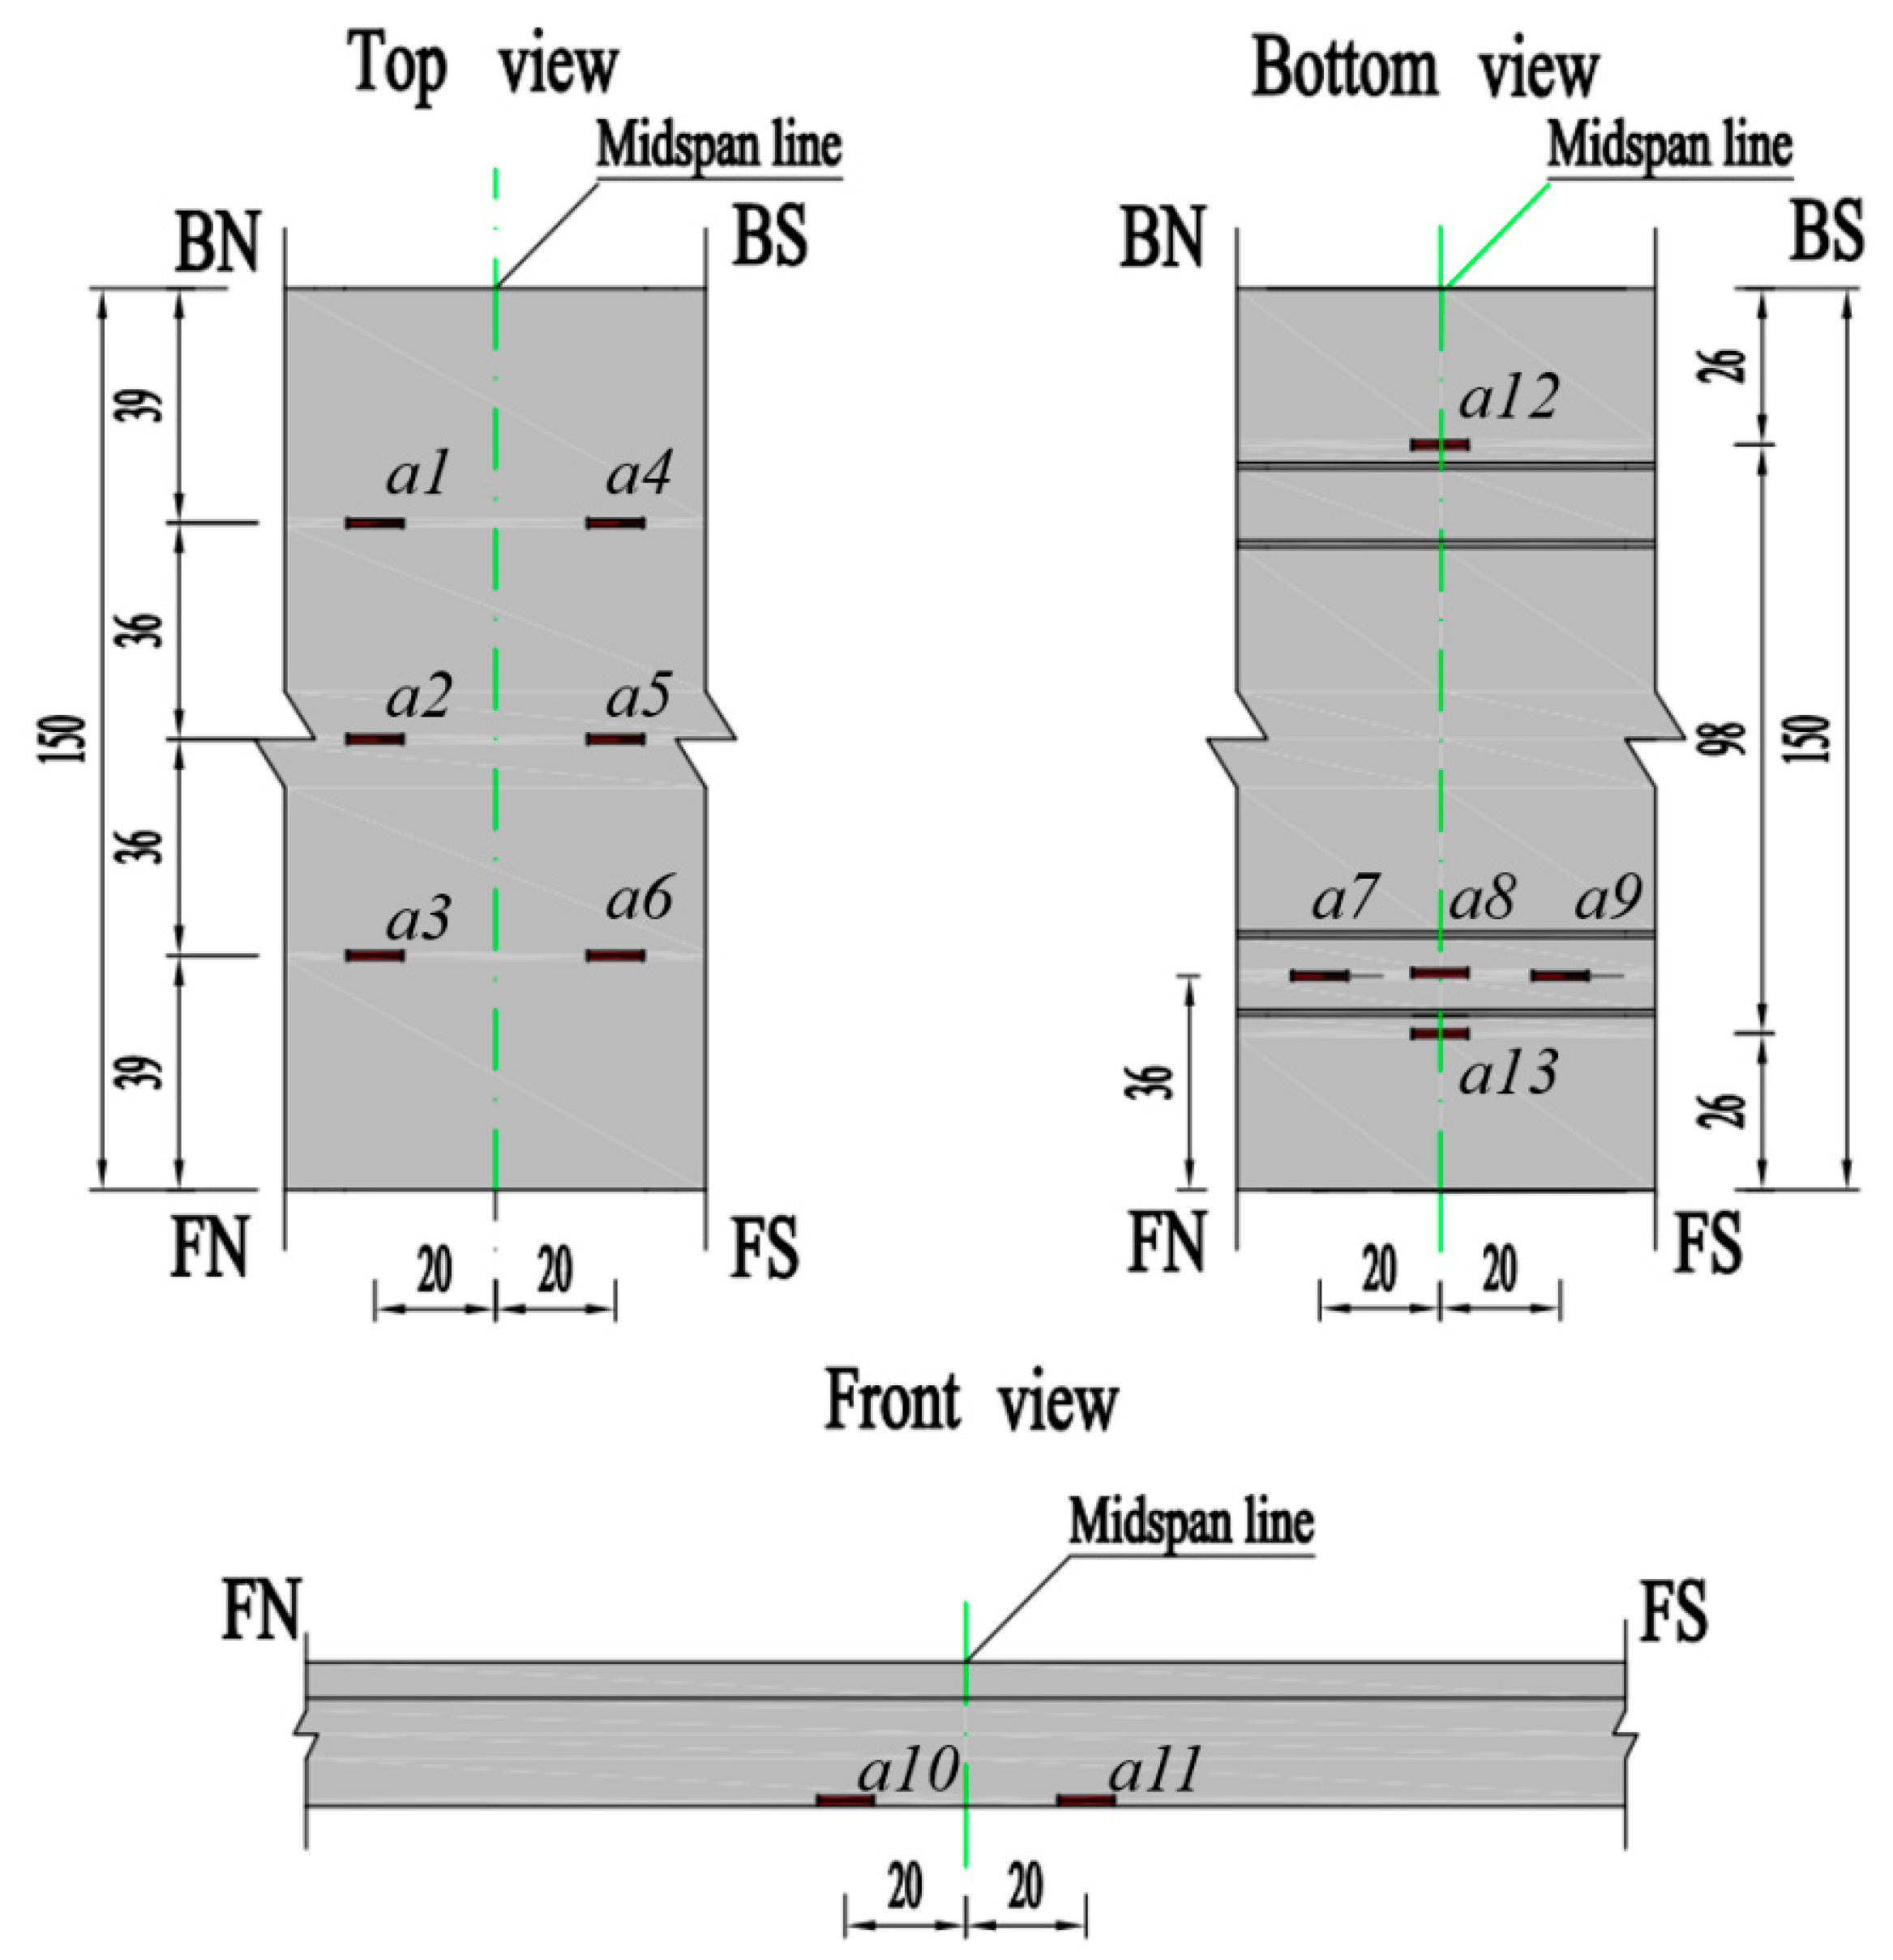
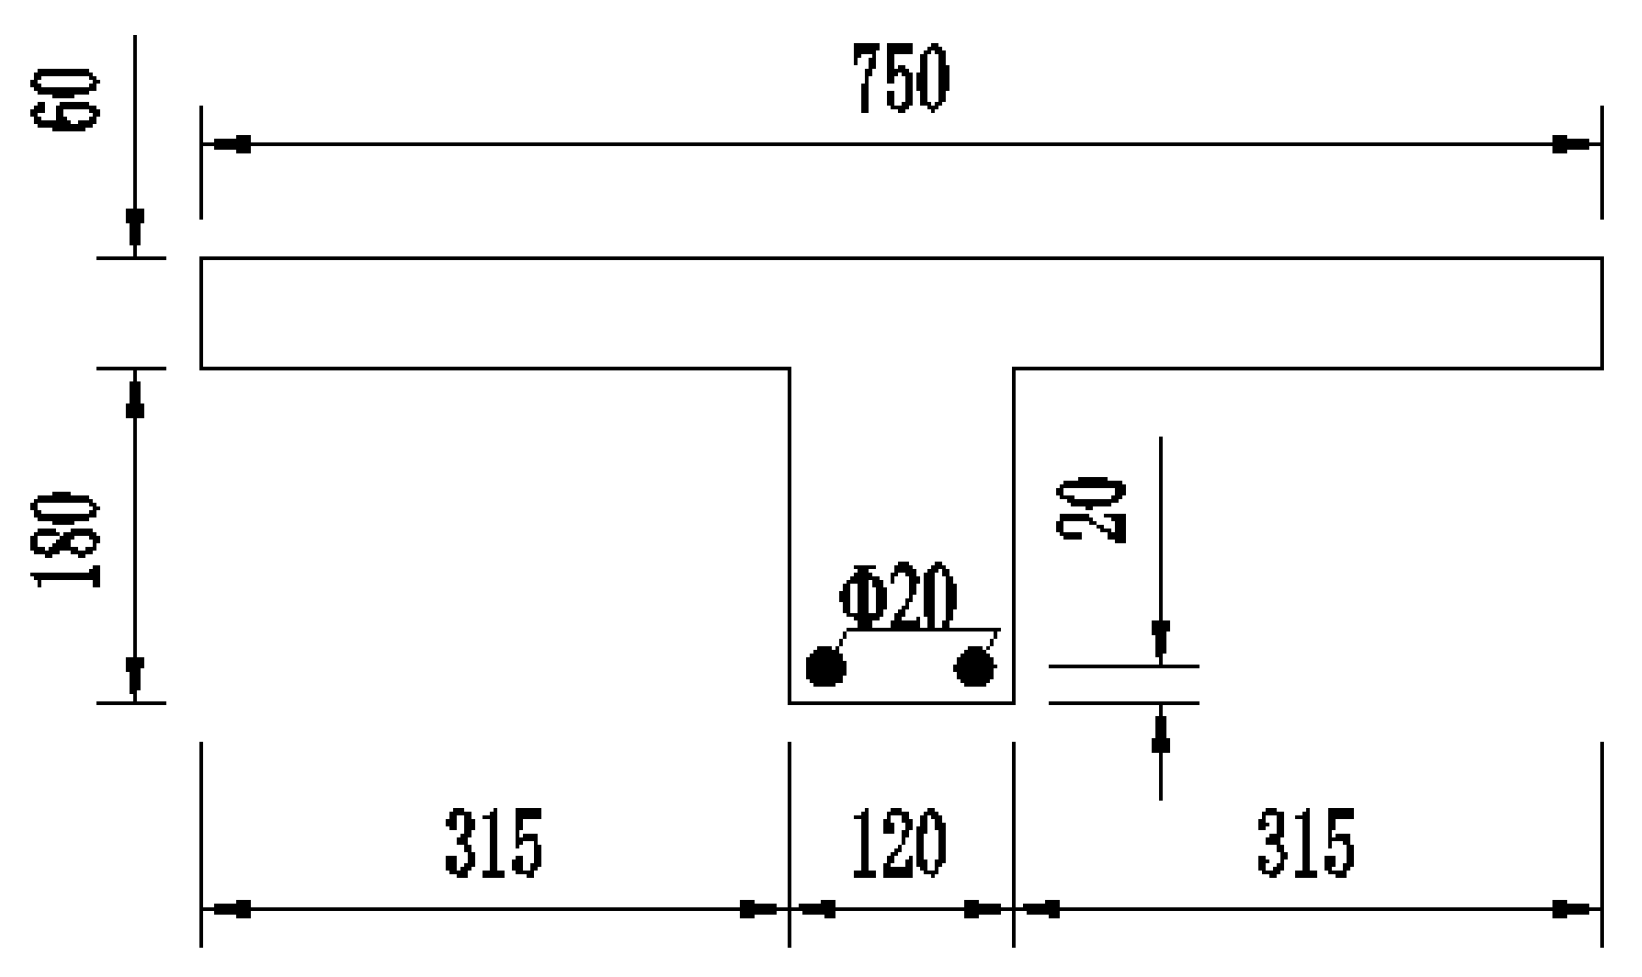
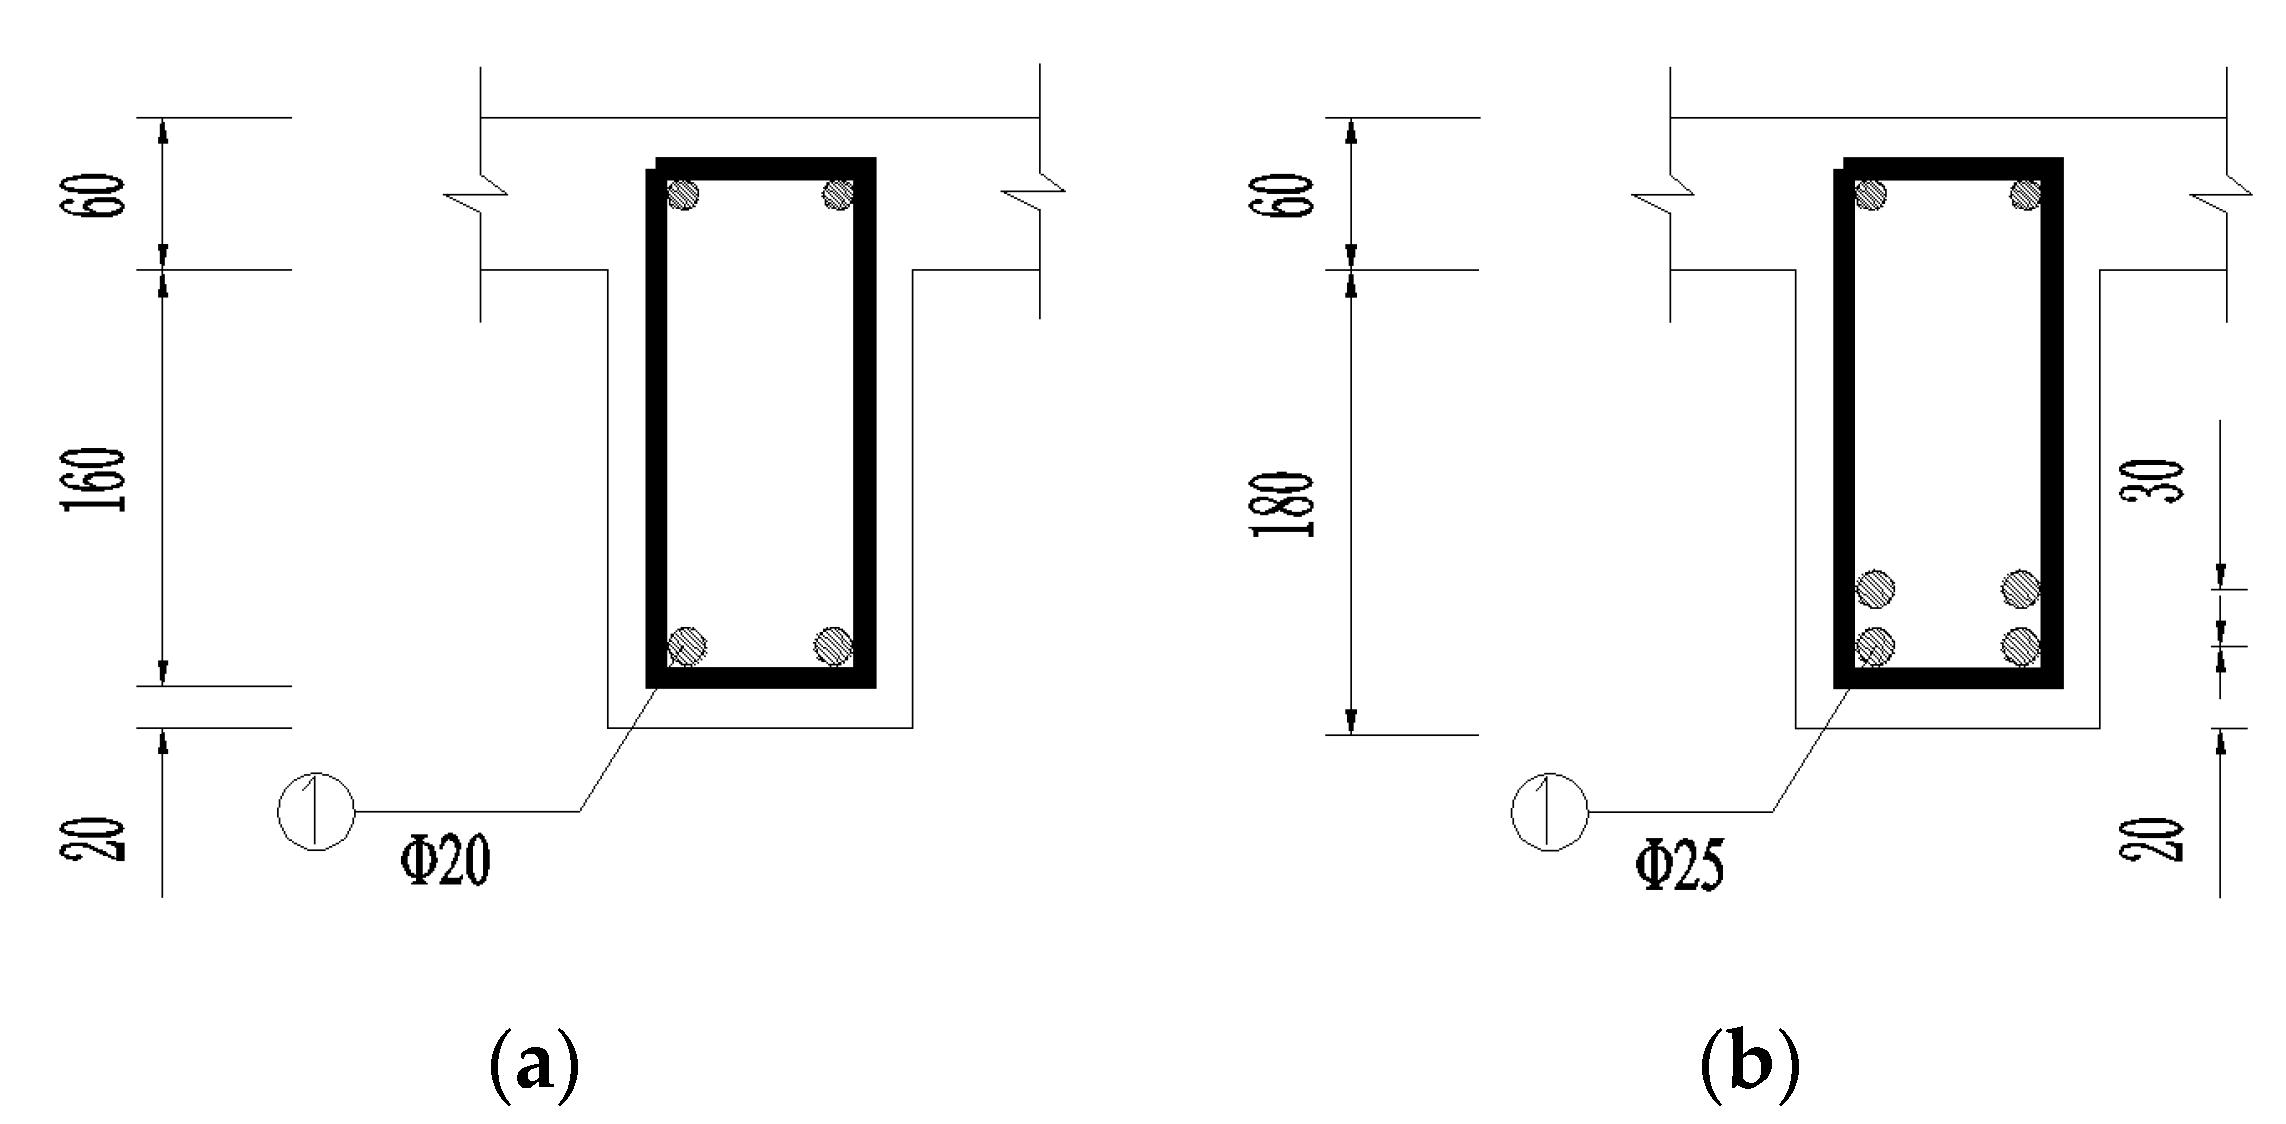
2.1. Design and Description of Specimens
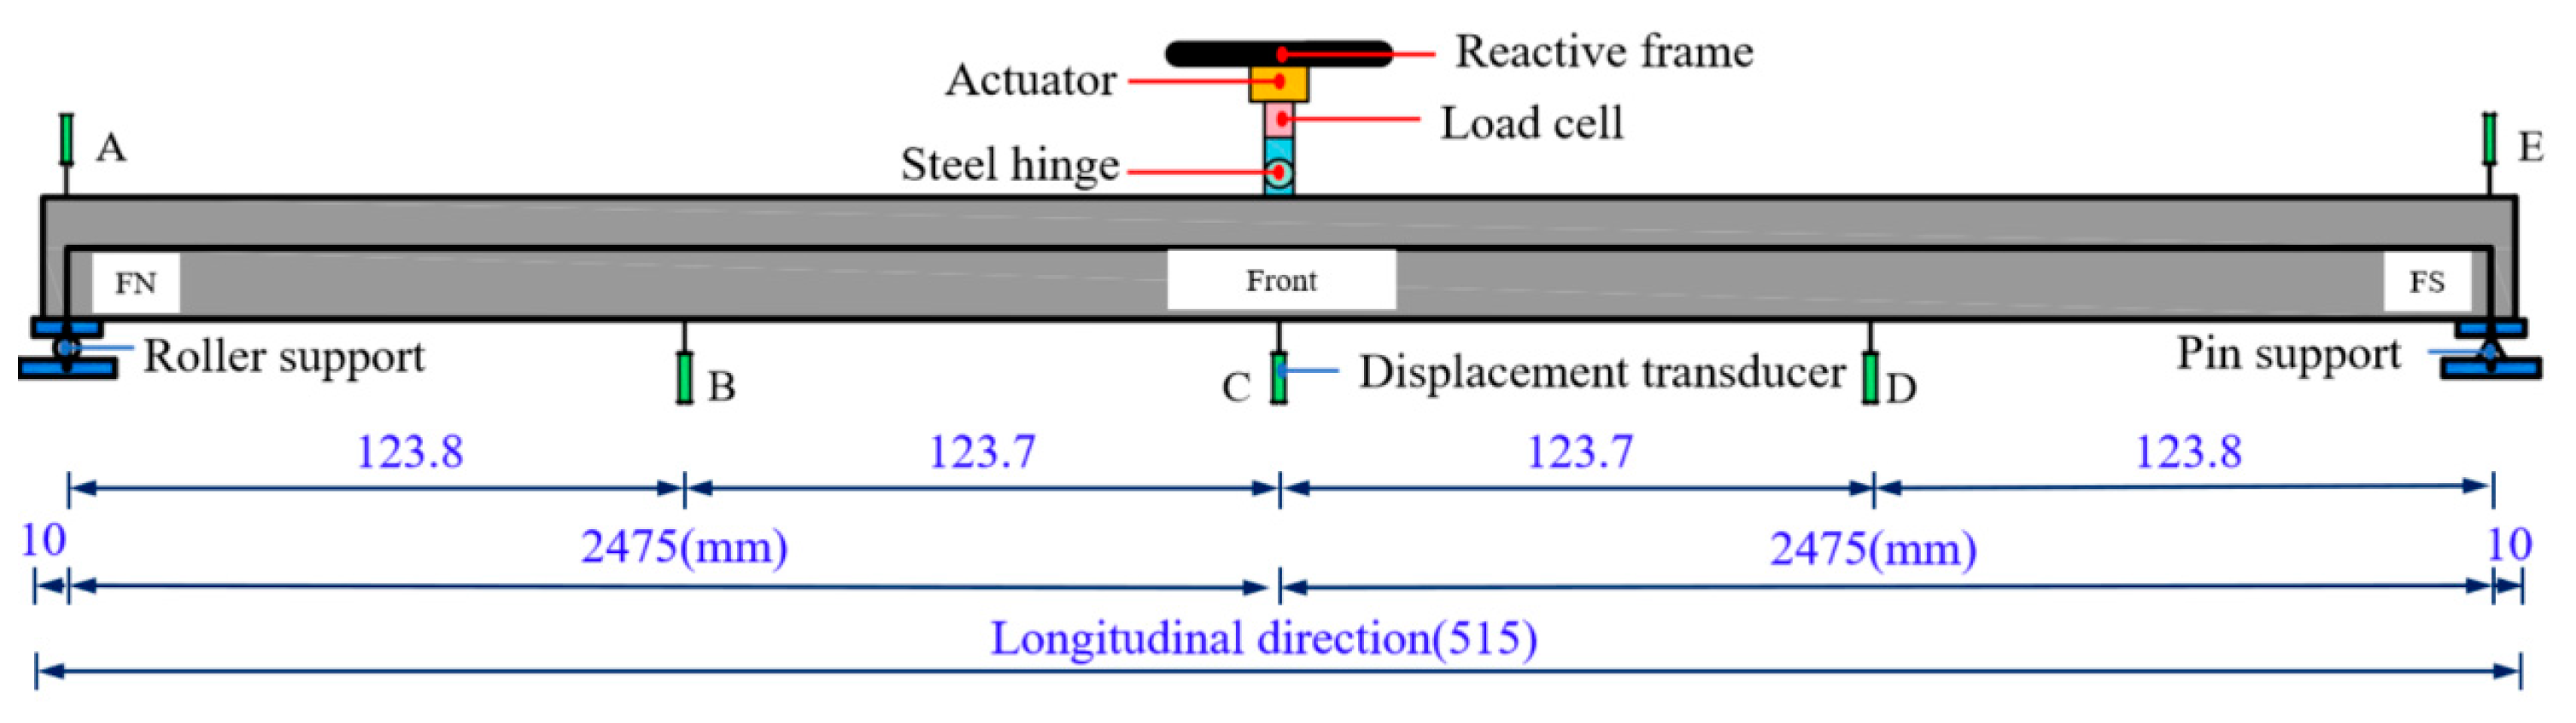
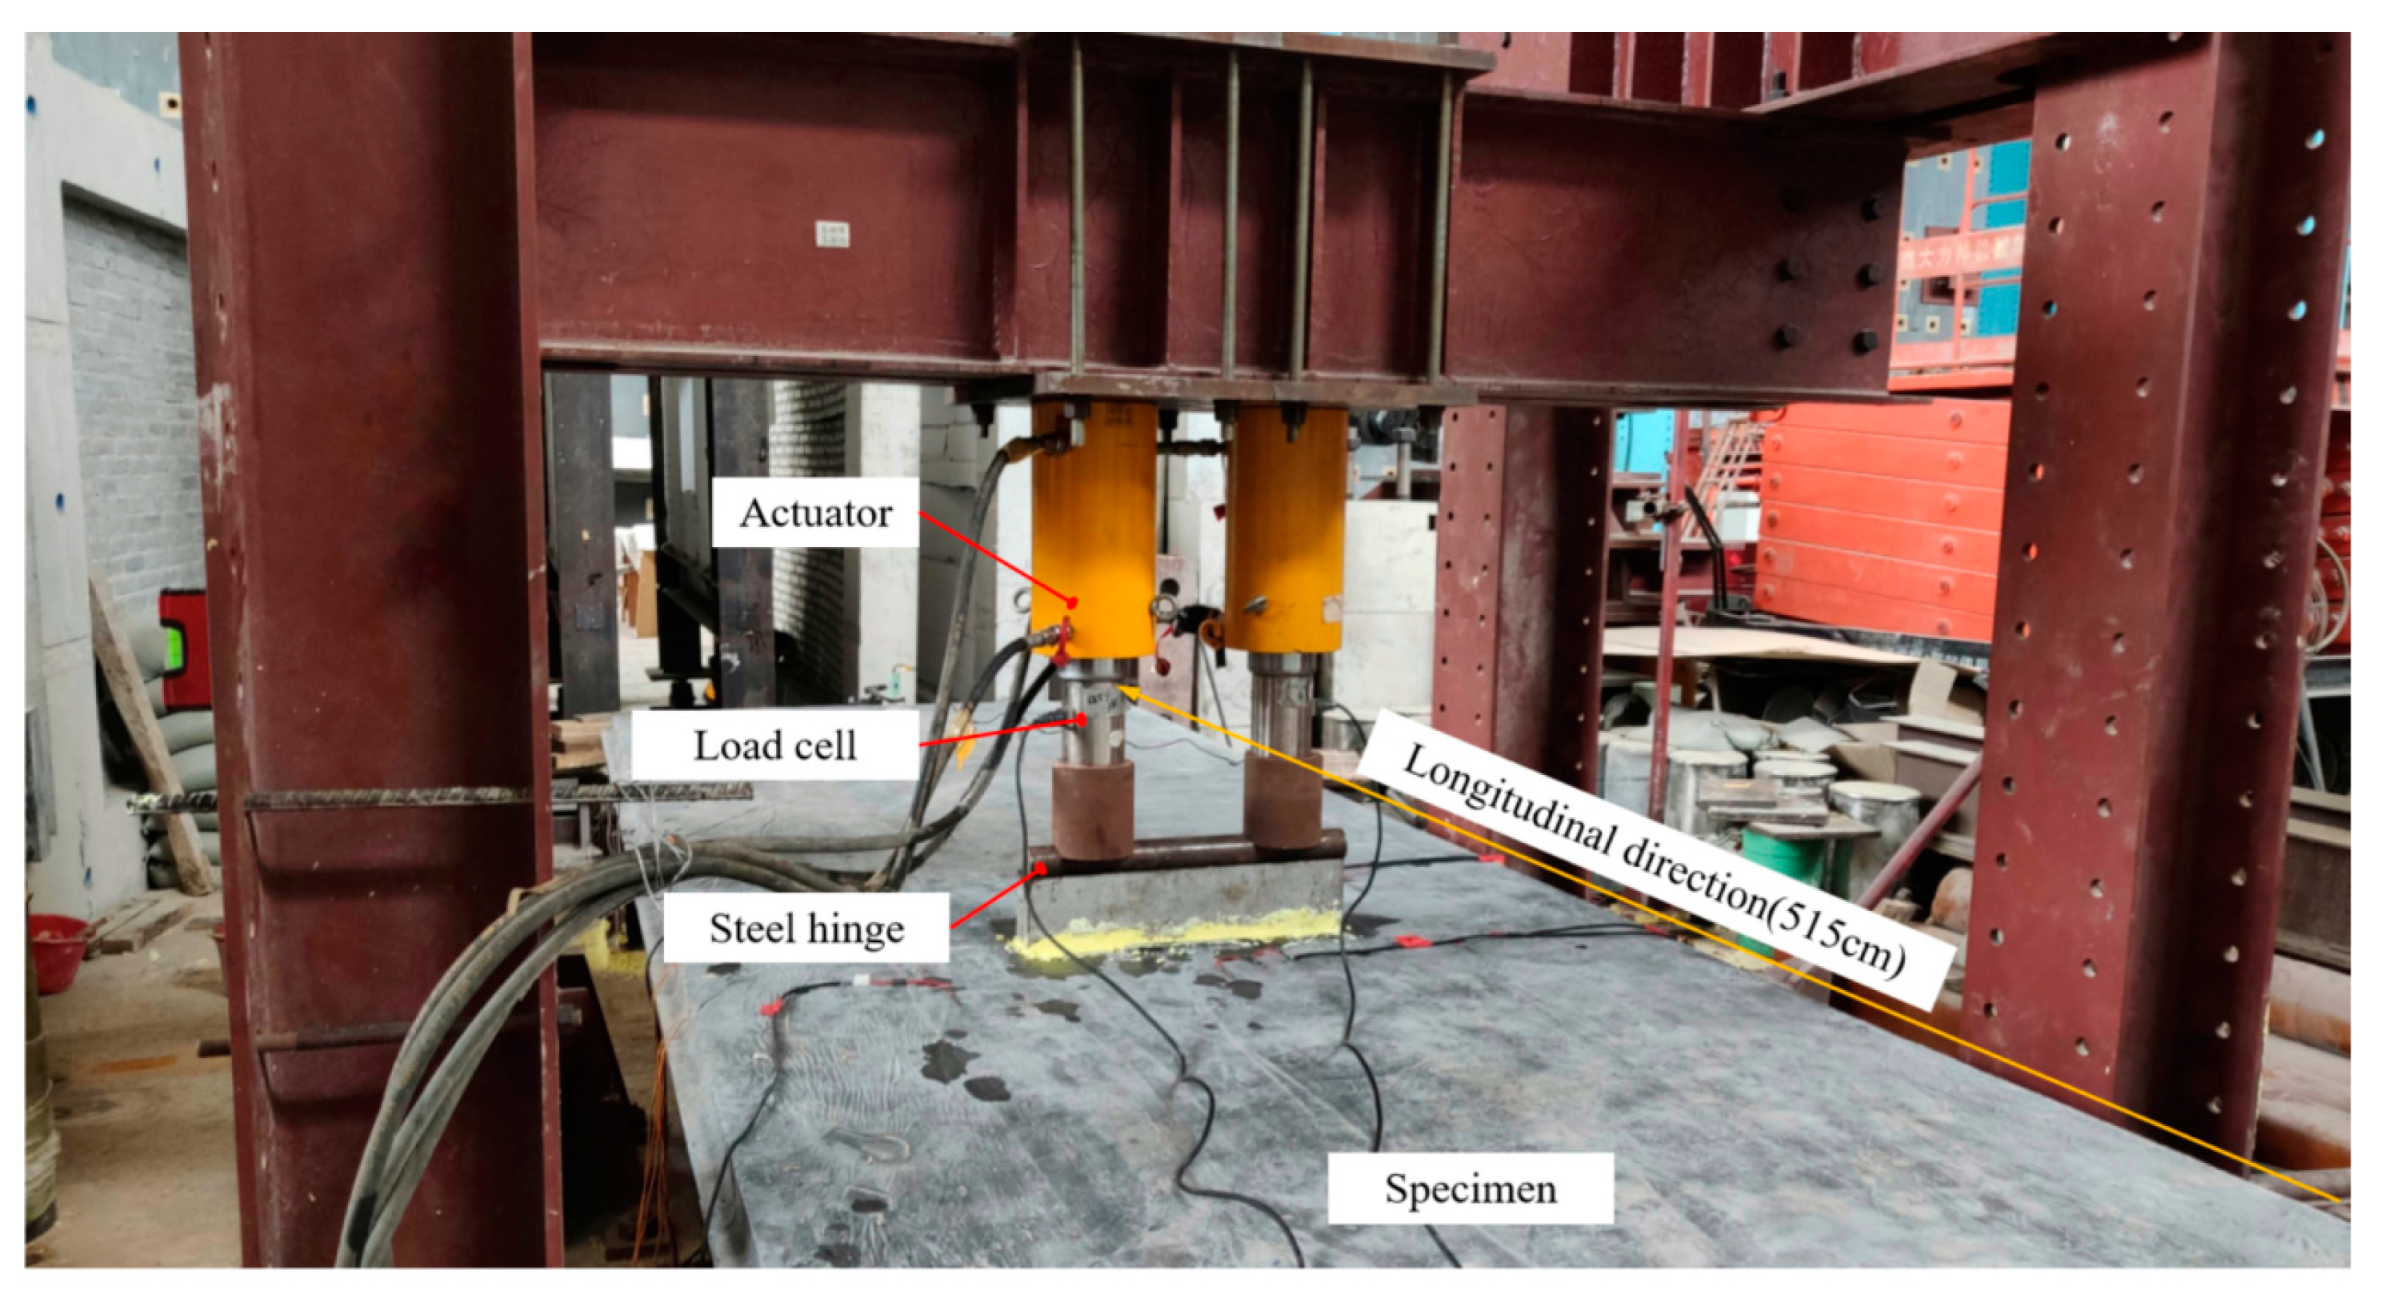
2.2. Test Setup and Measurements
Loading Instruments
2.3. Measurements
2.3.1. Displacement Measurements
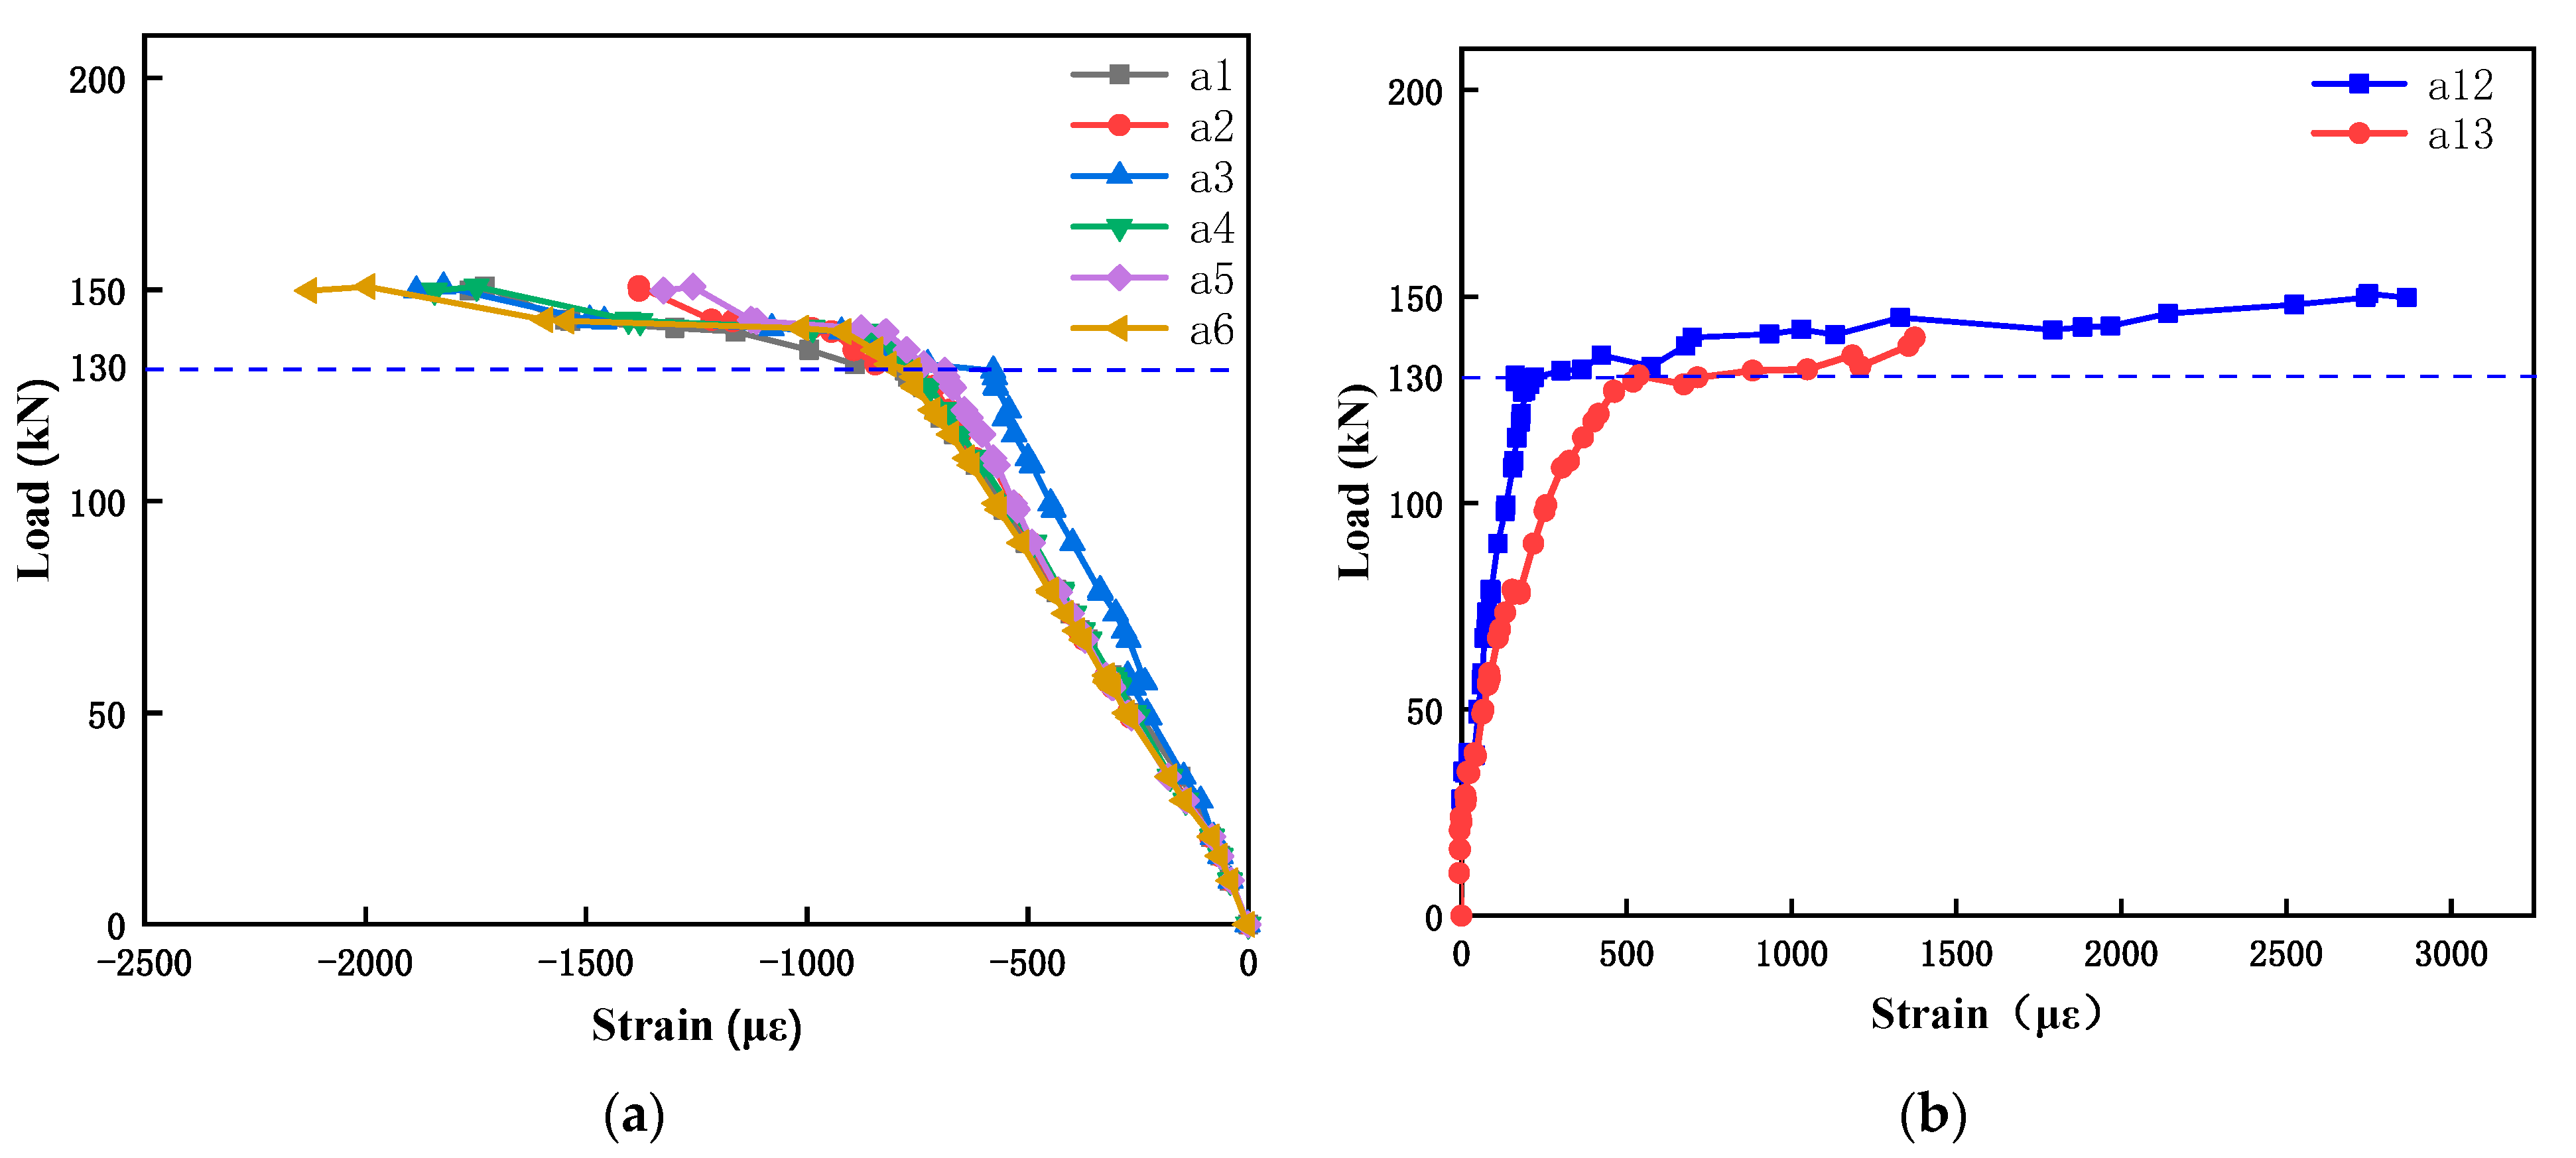
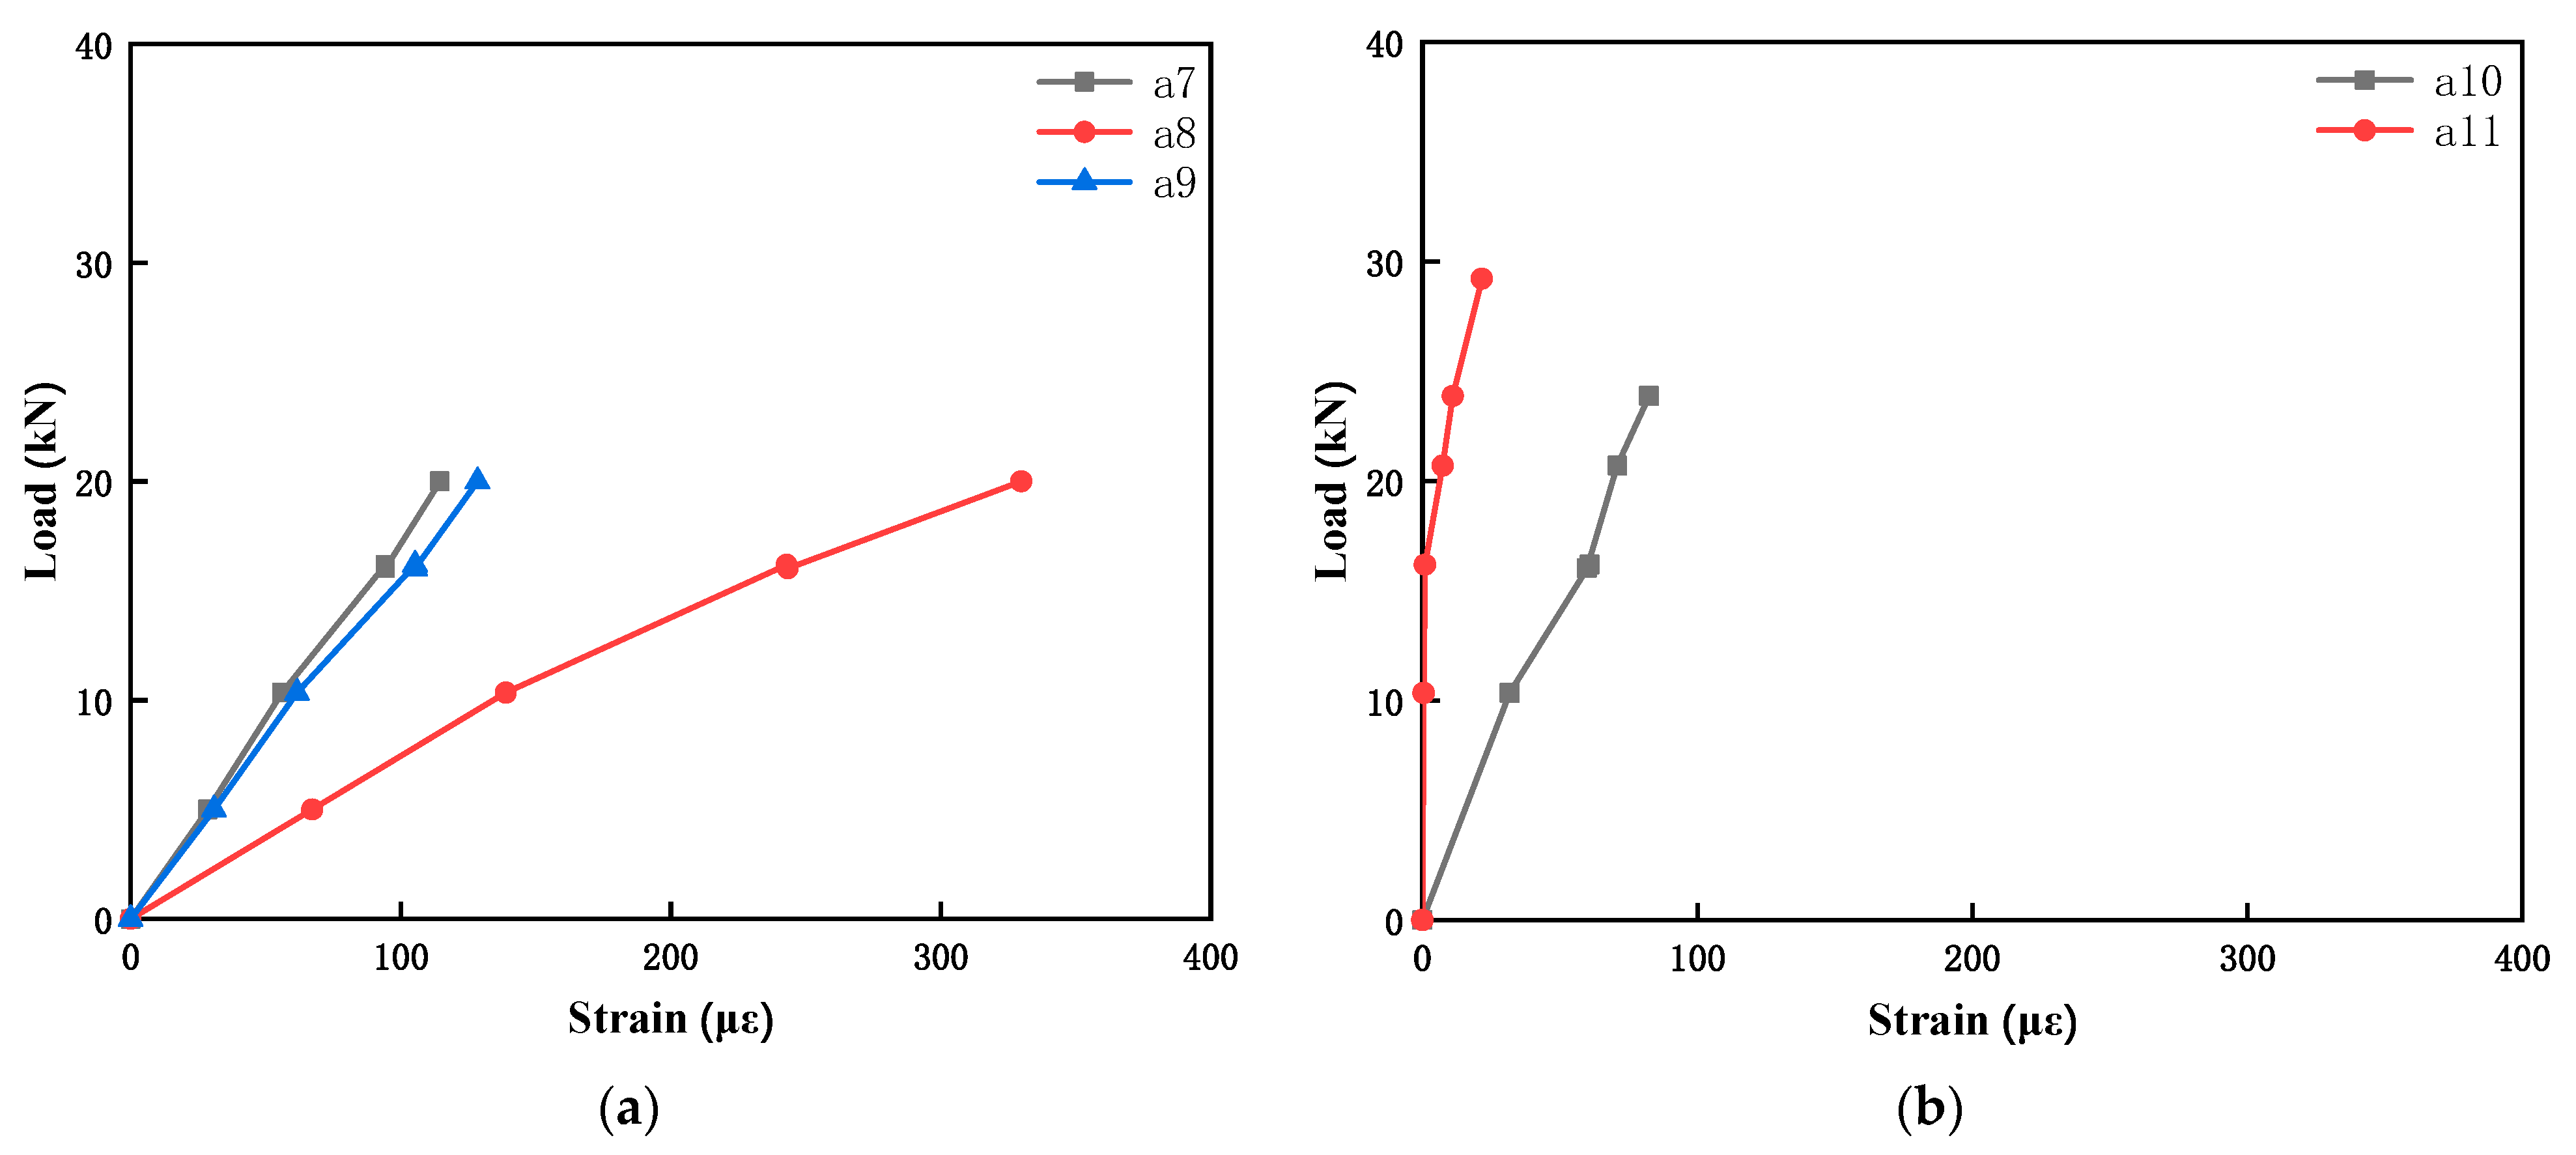
2.3.2. Strain Measurements
2.3.3. Loading Protocol
2.4. Material Properties
2.4.1. UHPC Properties
2.4.2. Steel Bars Properties
3. Experimental Results and Discussions
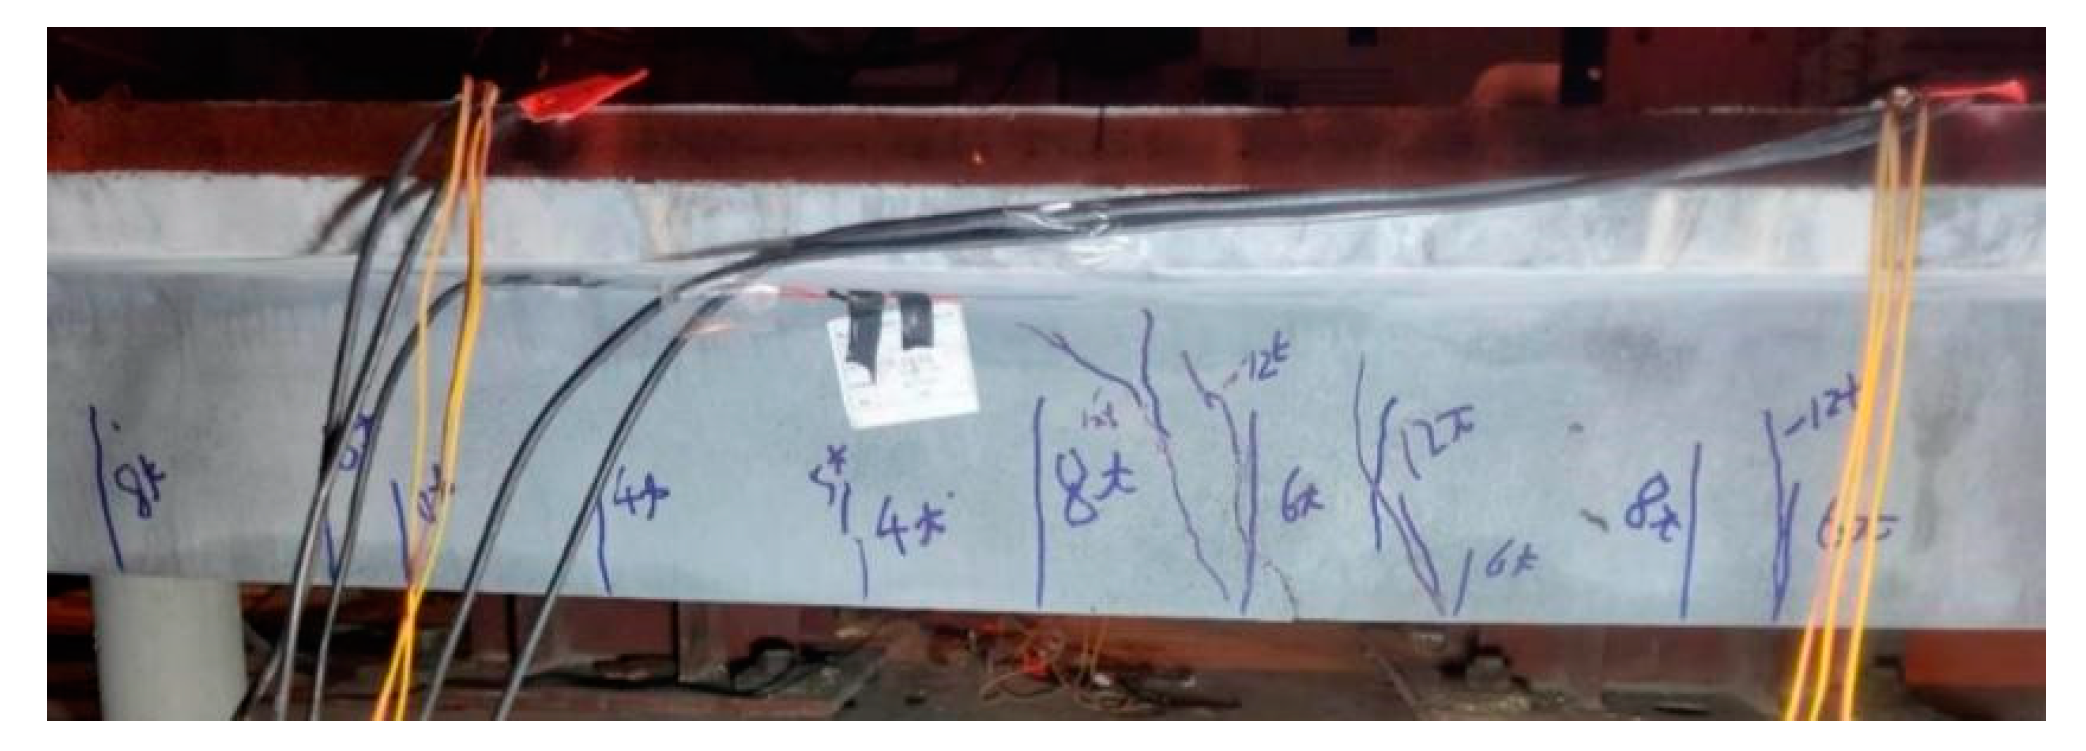
3.1. Failure Modes
3.2. Cracking Behaviors
4. Experimental Results and Discussions
4.1. Load–Deflection Behaviors
Load–Strain Behaviors
4.2. Theoretical Calculation
4.2.1. Flexural Bearing Capacity
4.2.2. Response 2000 Analysis
4.2.3. Comparison of Calculation Results
5. Numerical Analysis
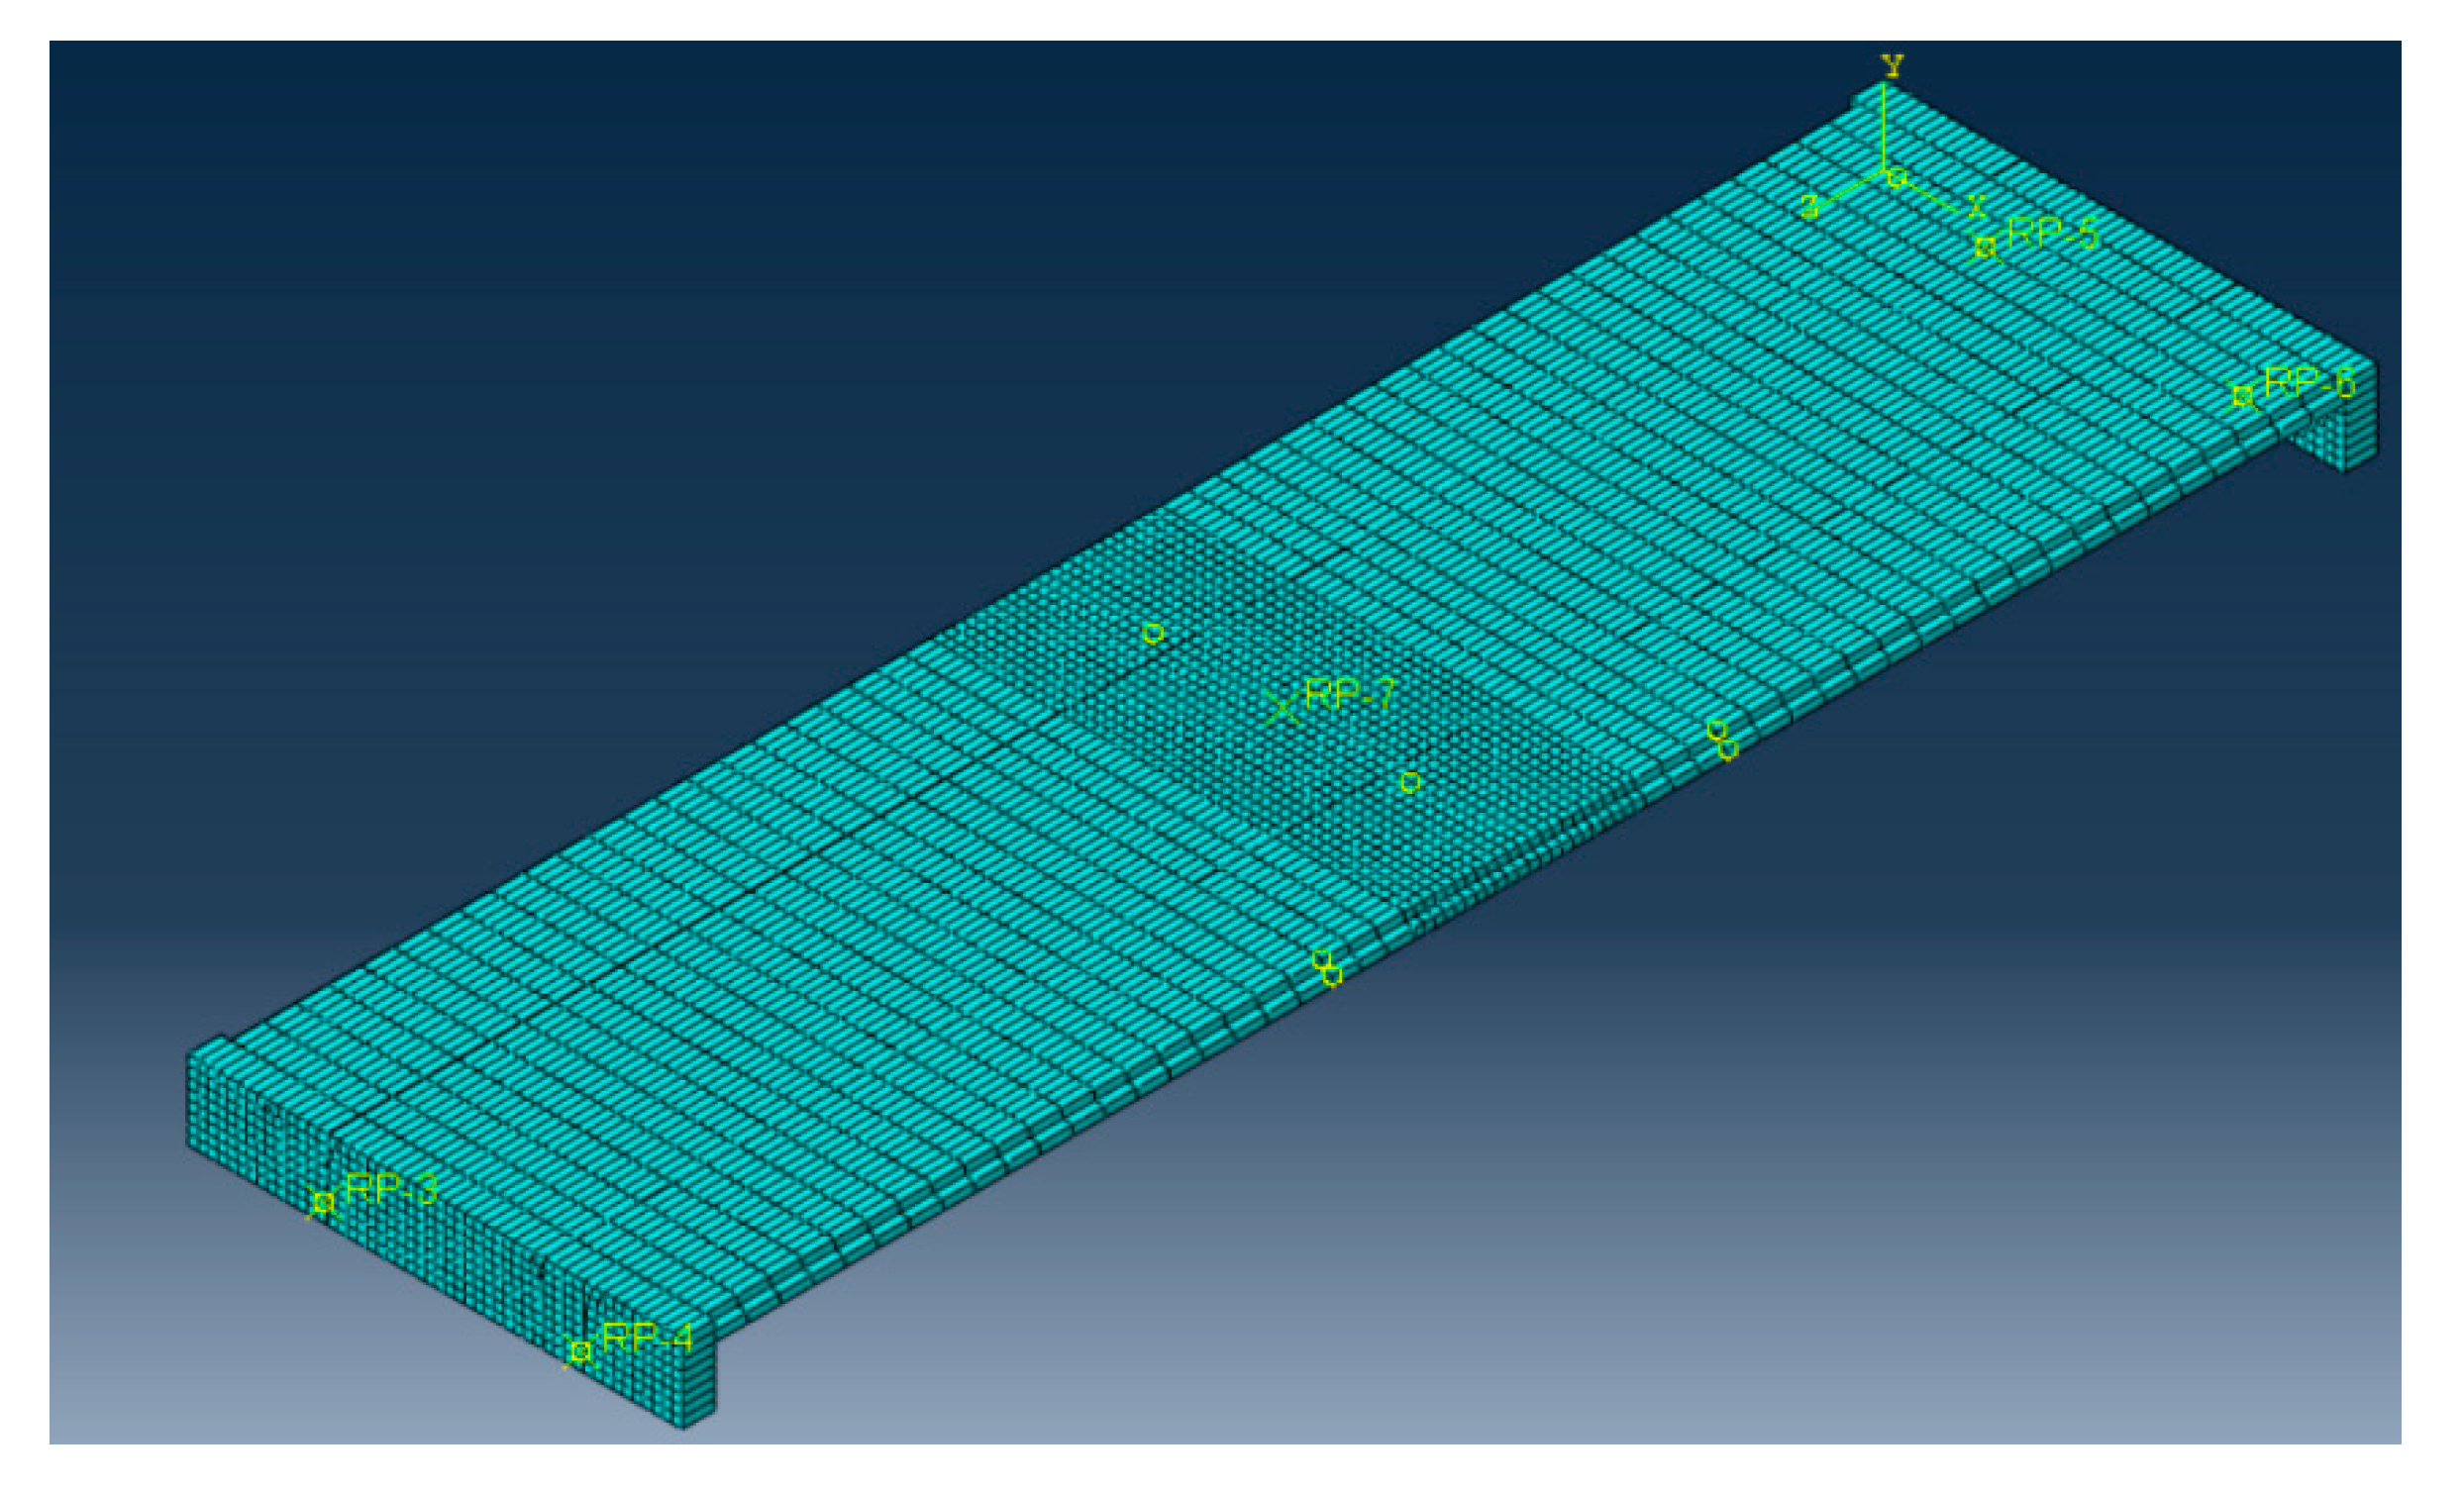
5.1. The Abaqus Analysis
5.2. Result of FEM Simulation
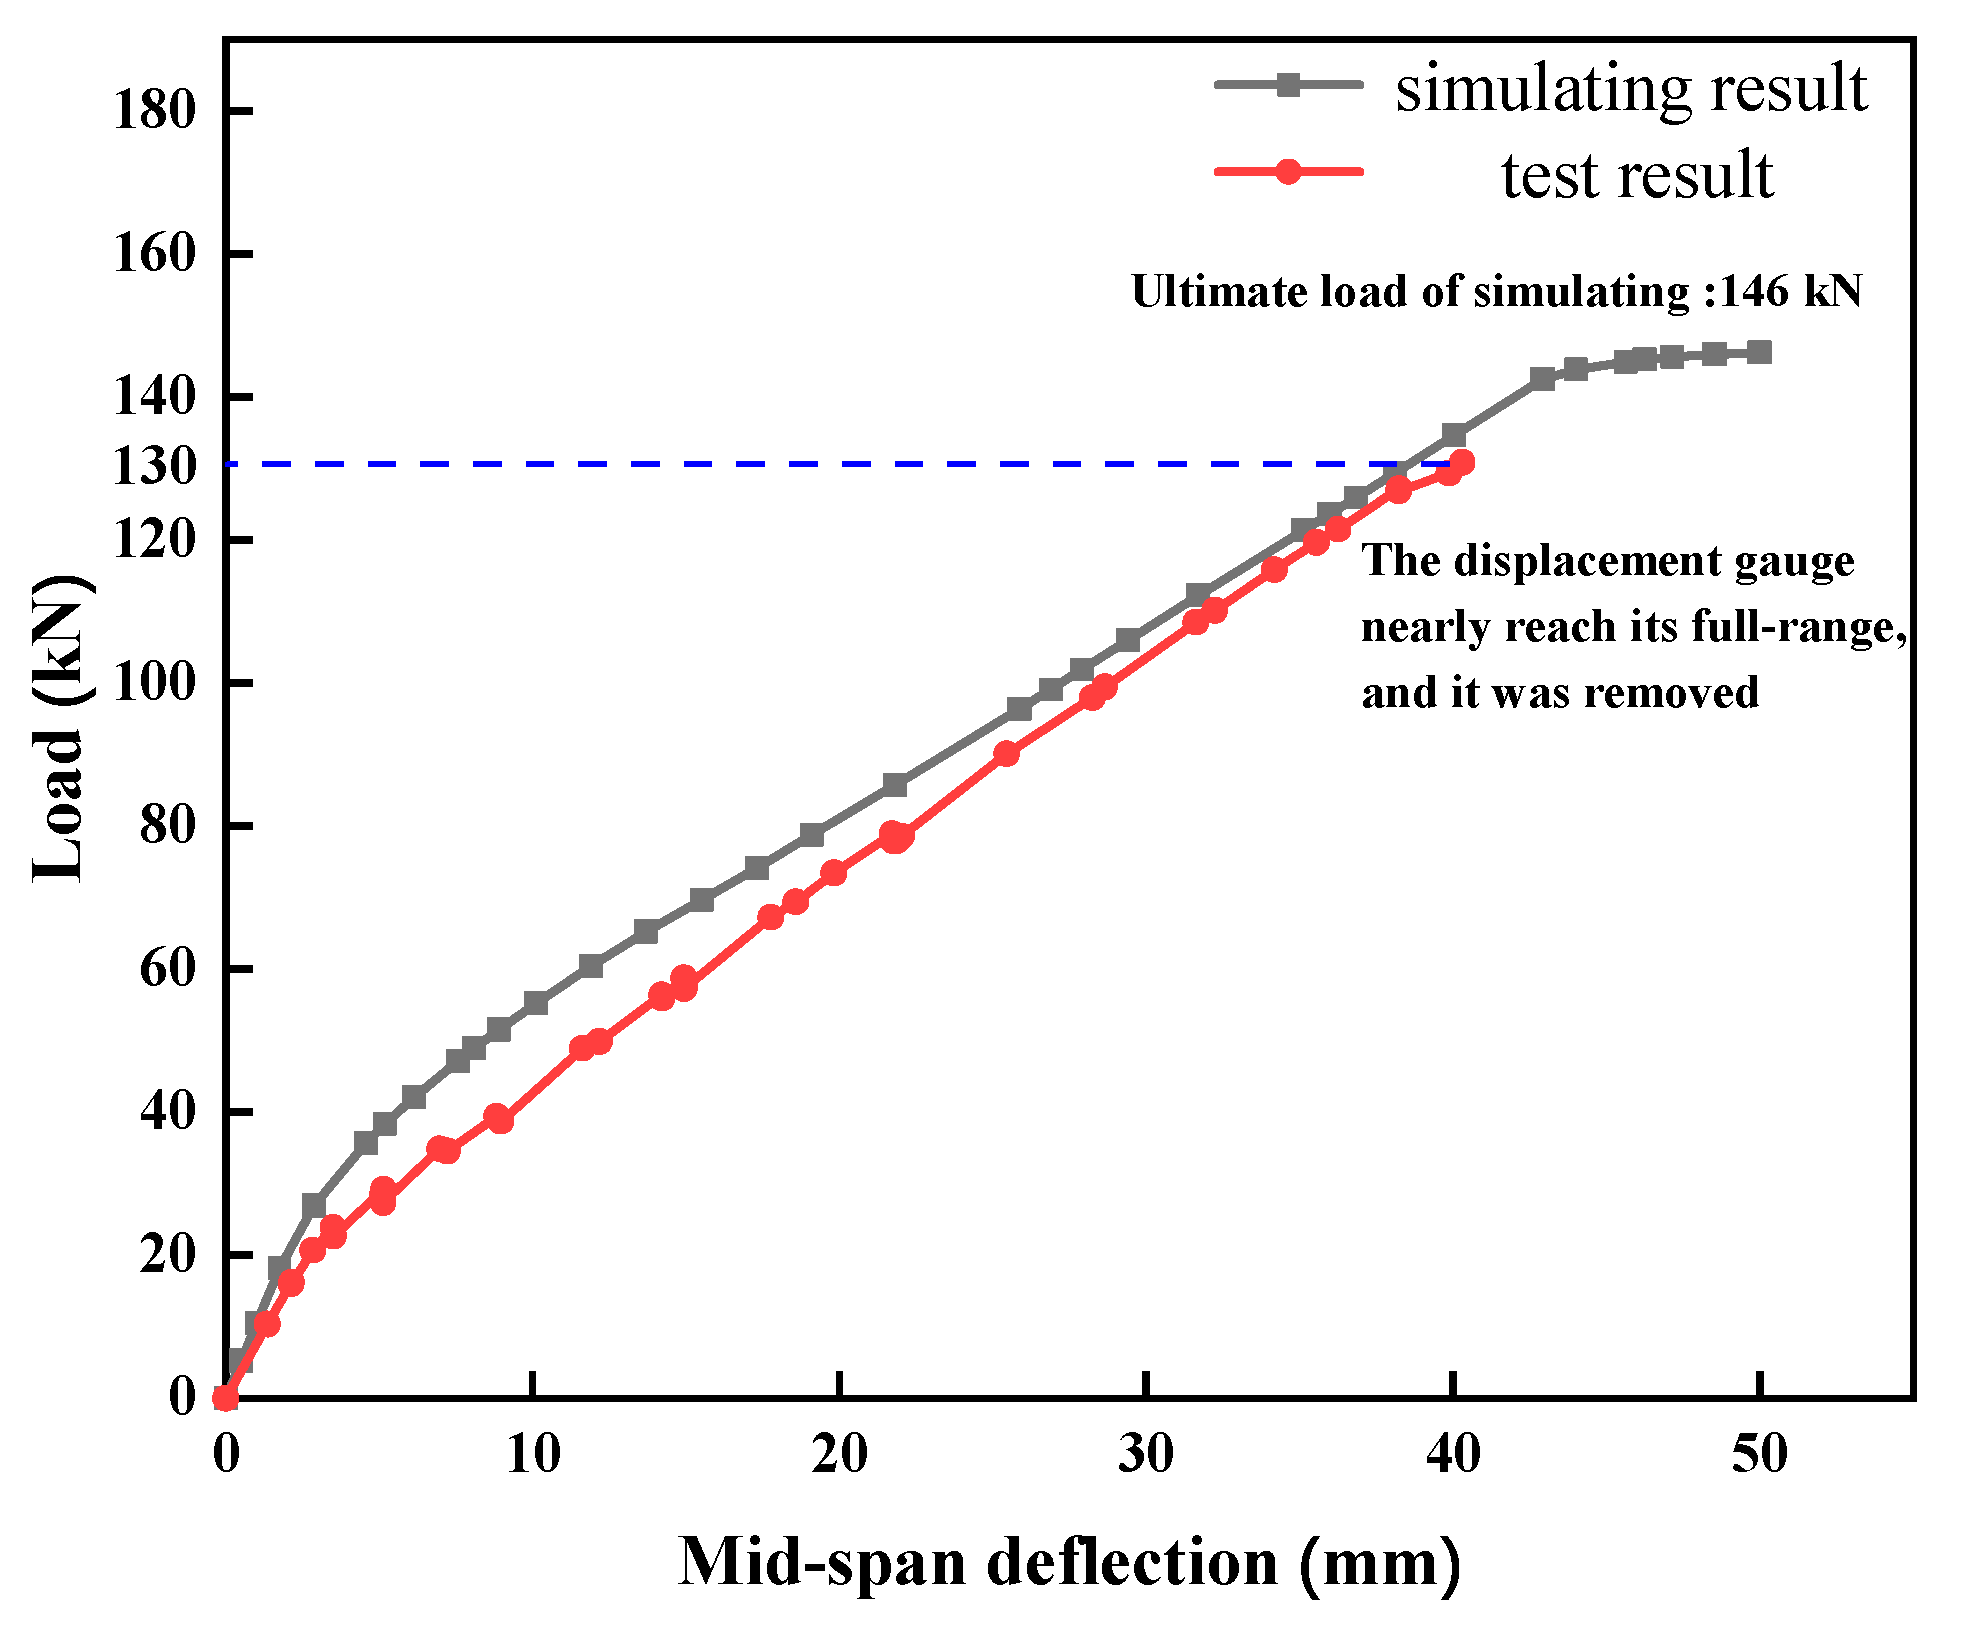
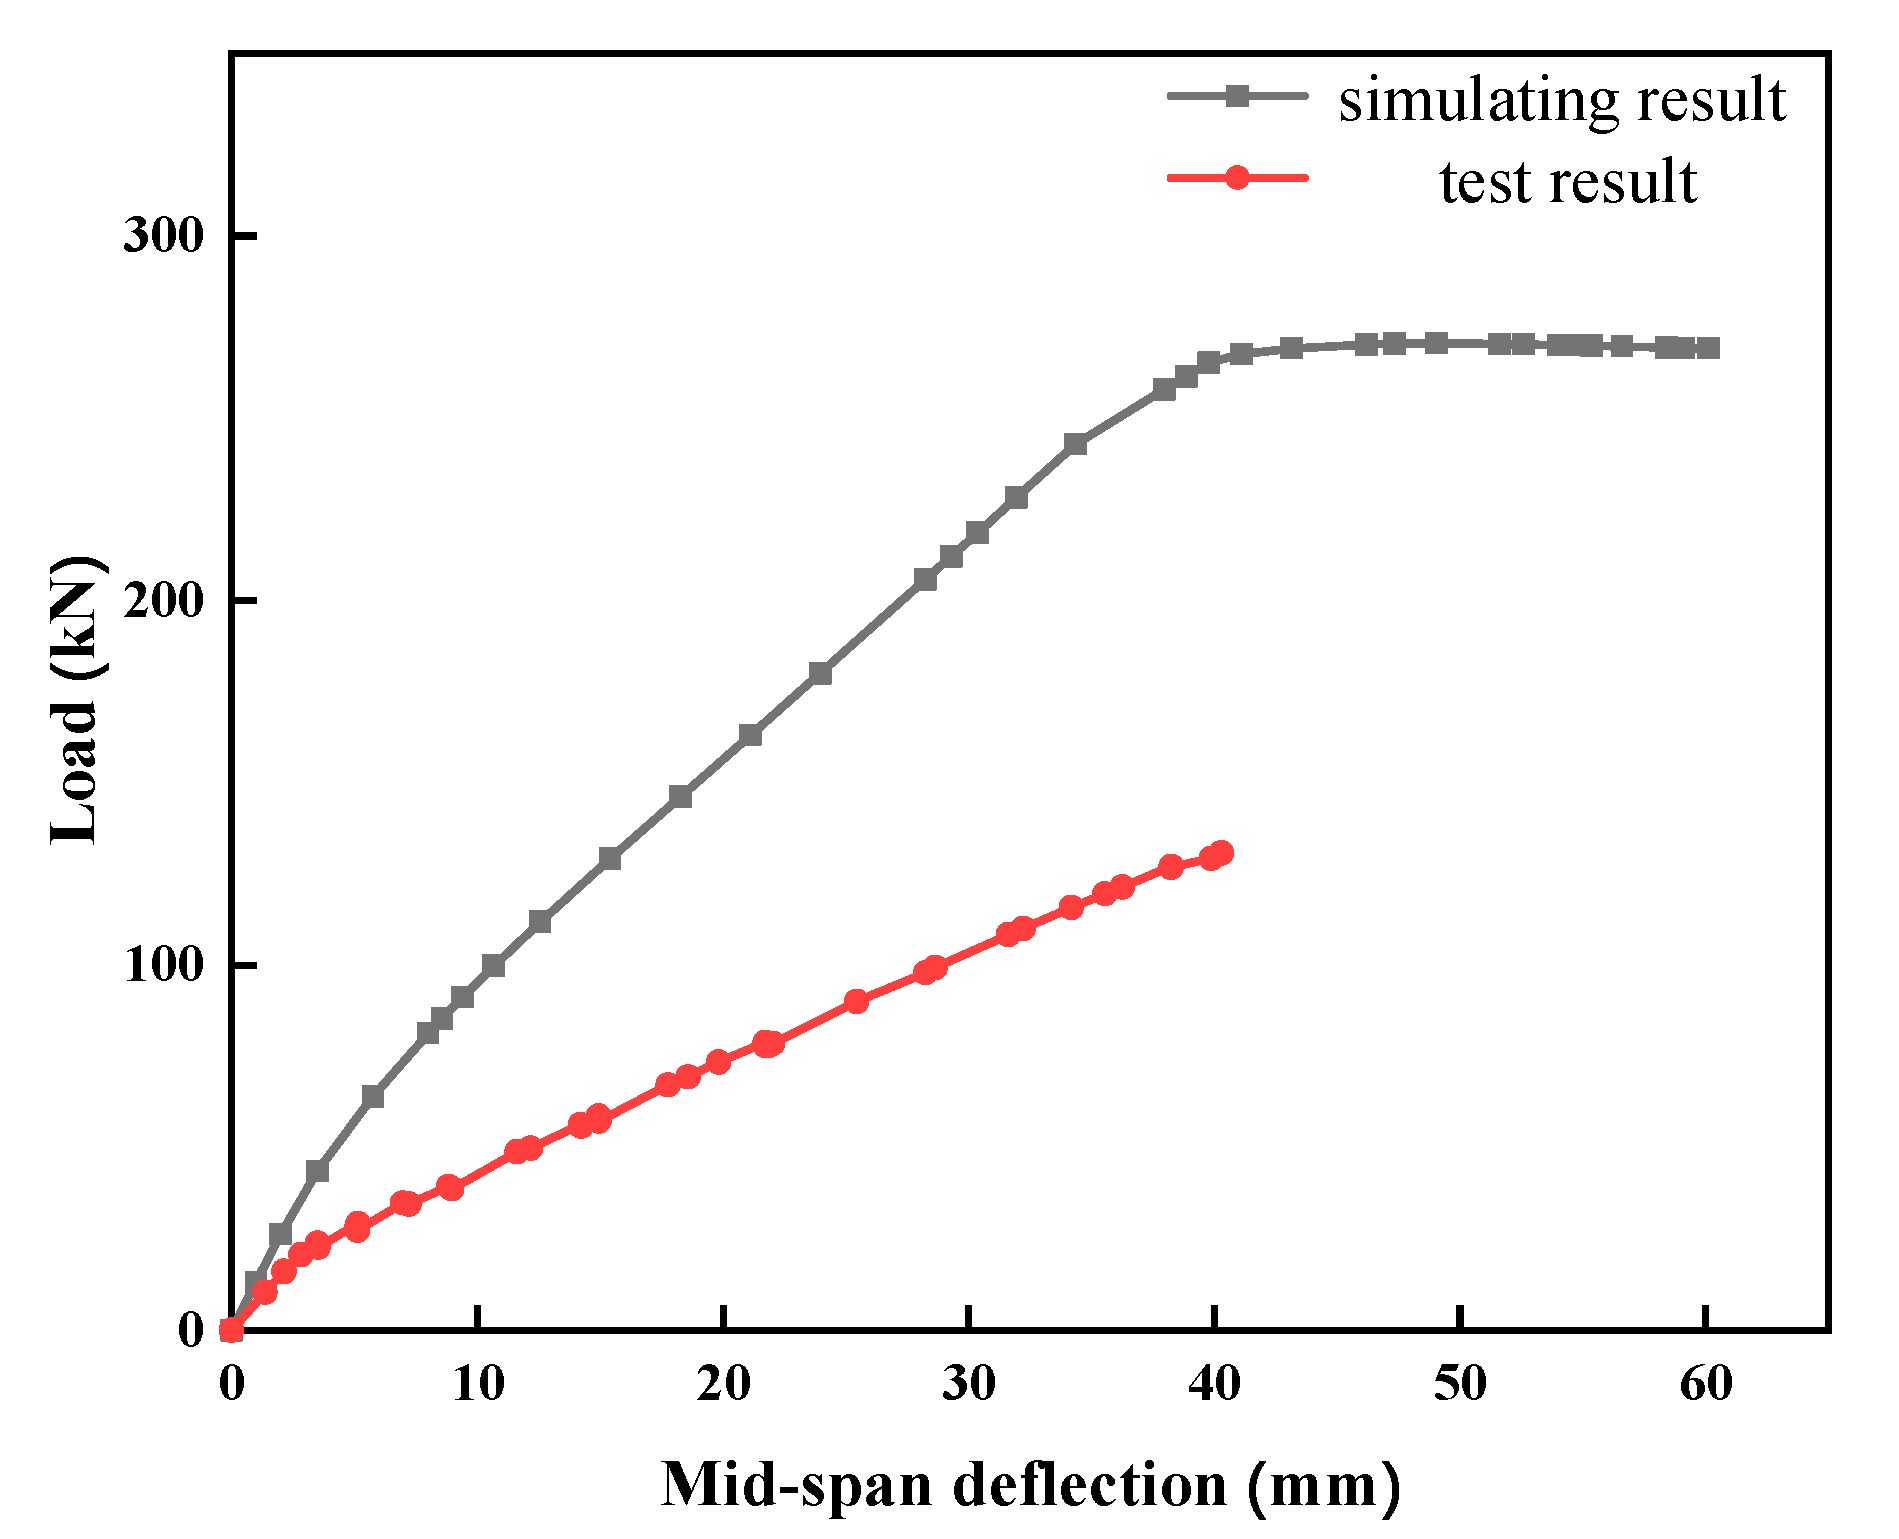
5.2.1. Load–Deflection Behaviors of the FE Model
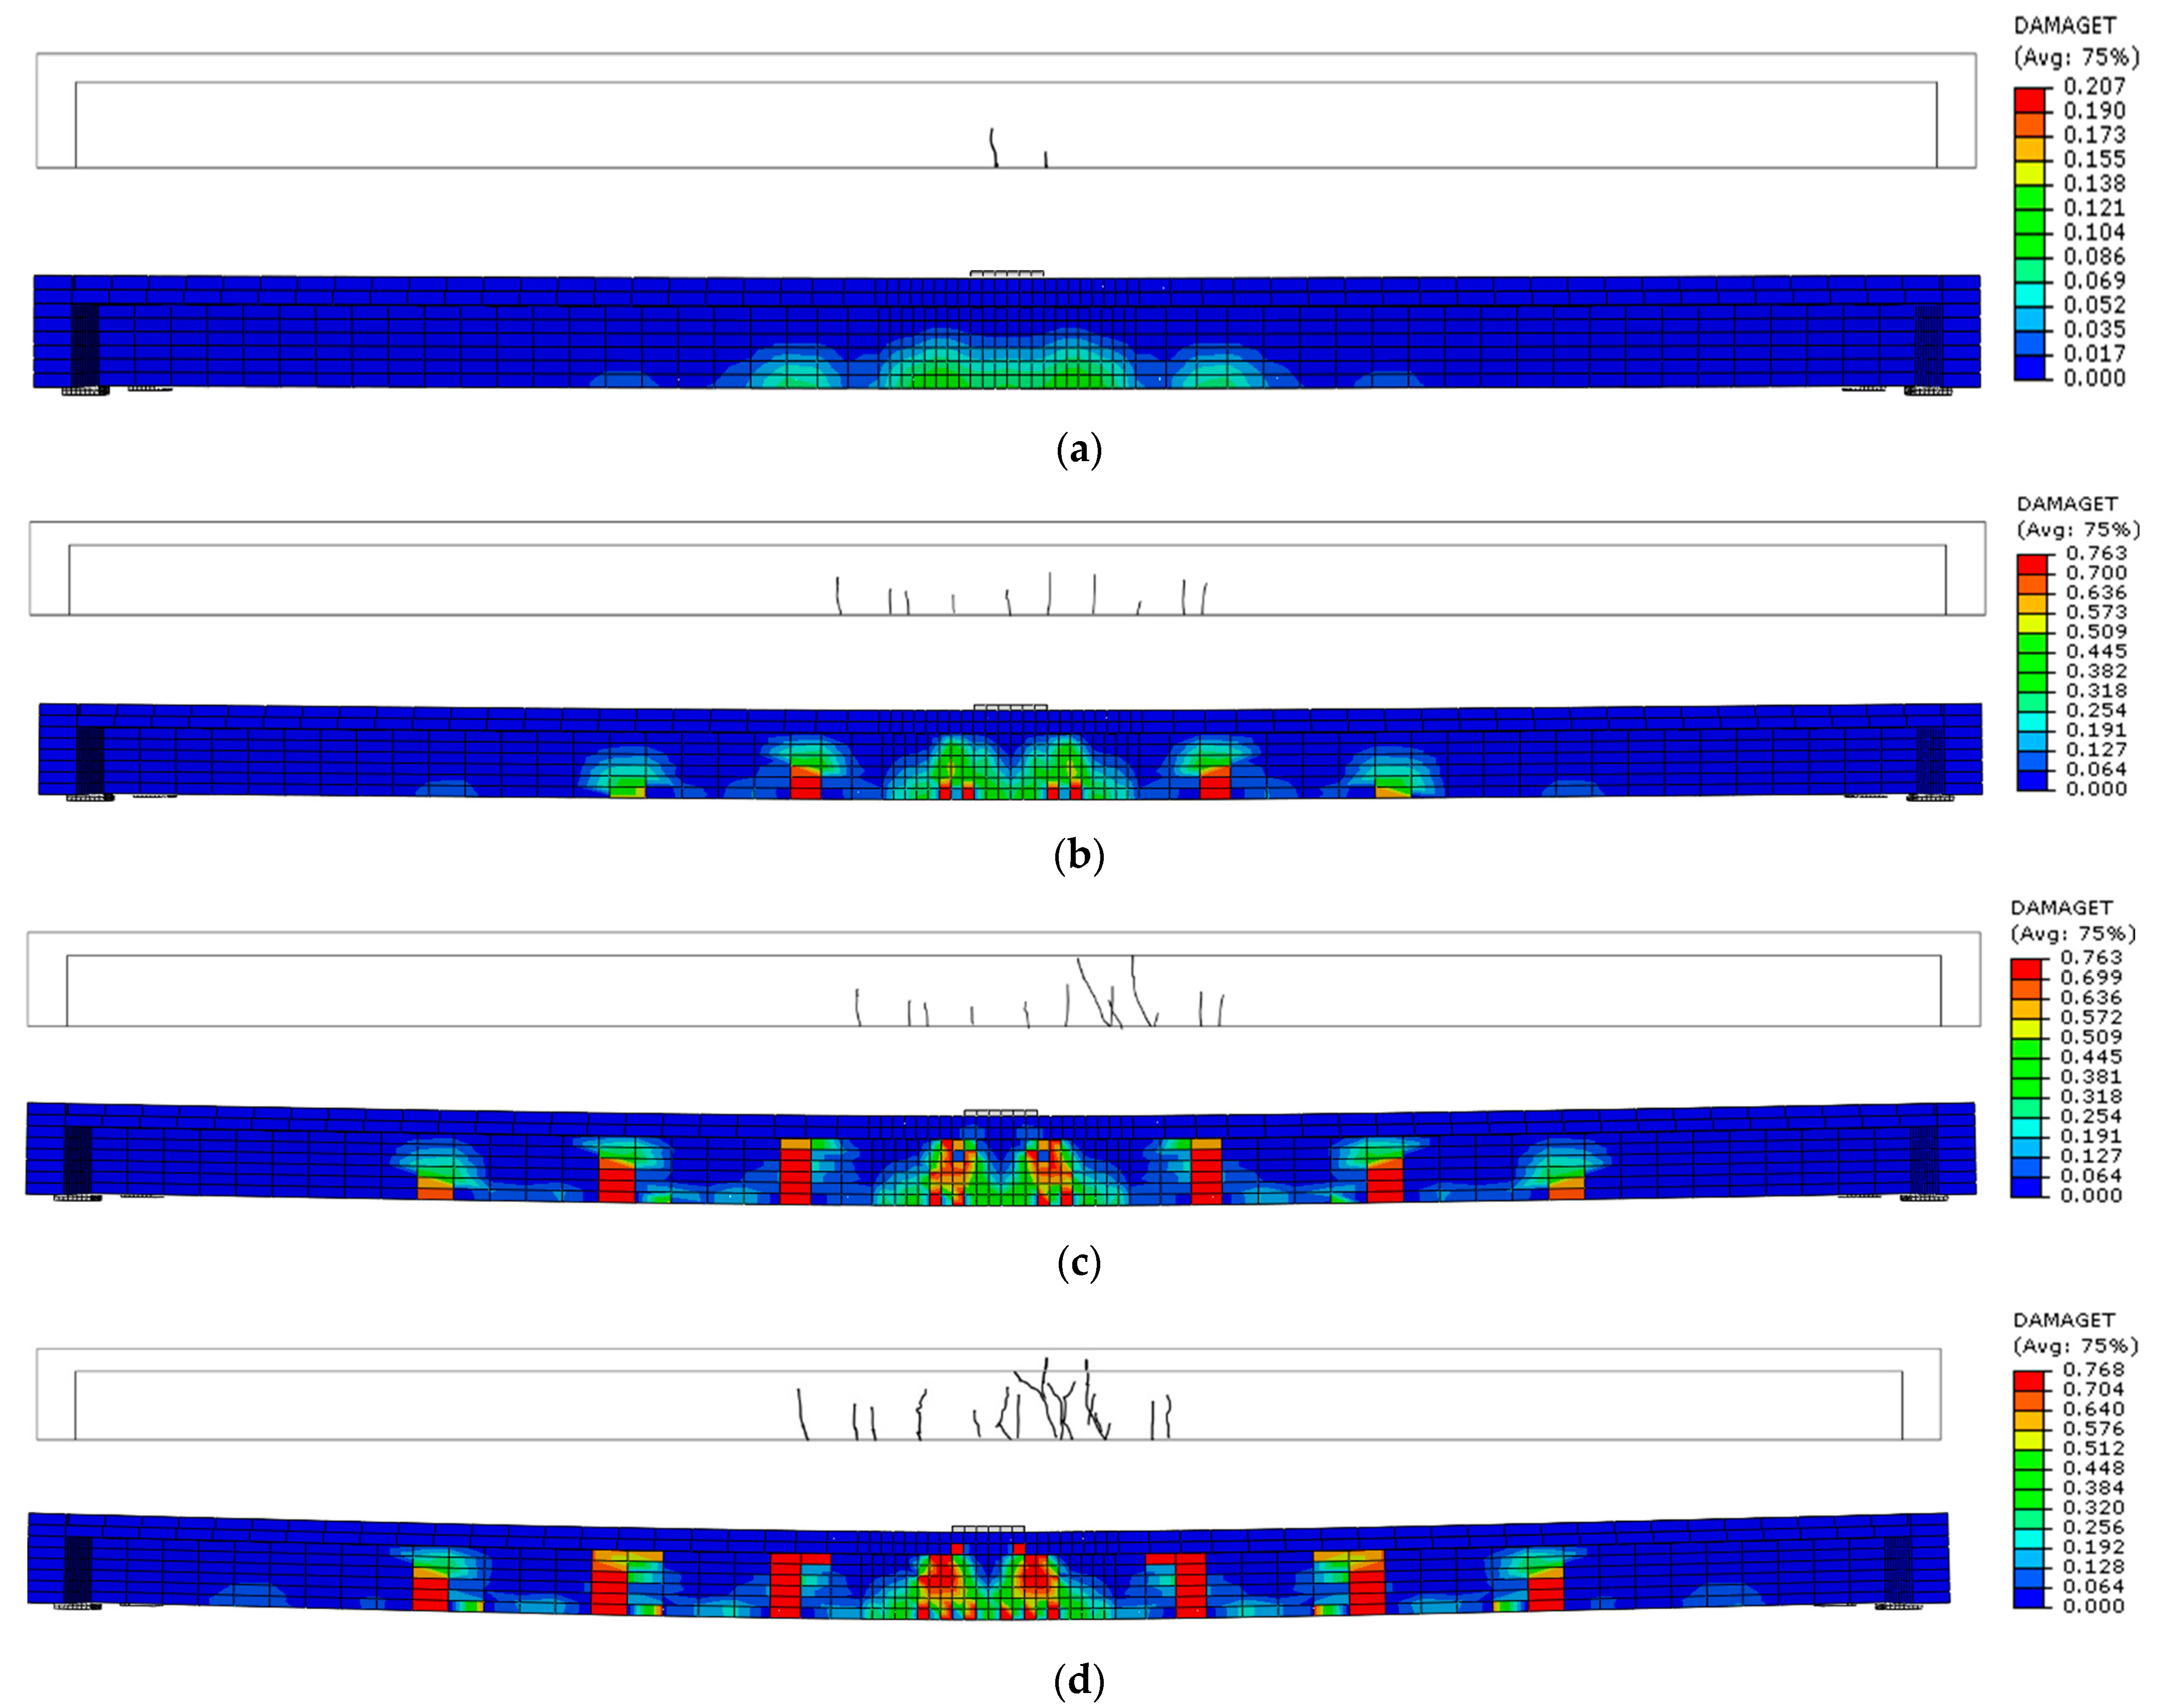
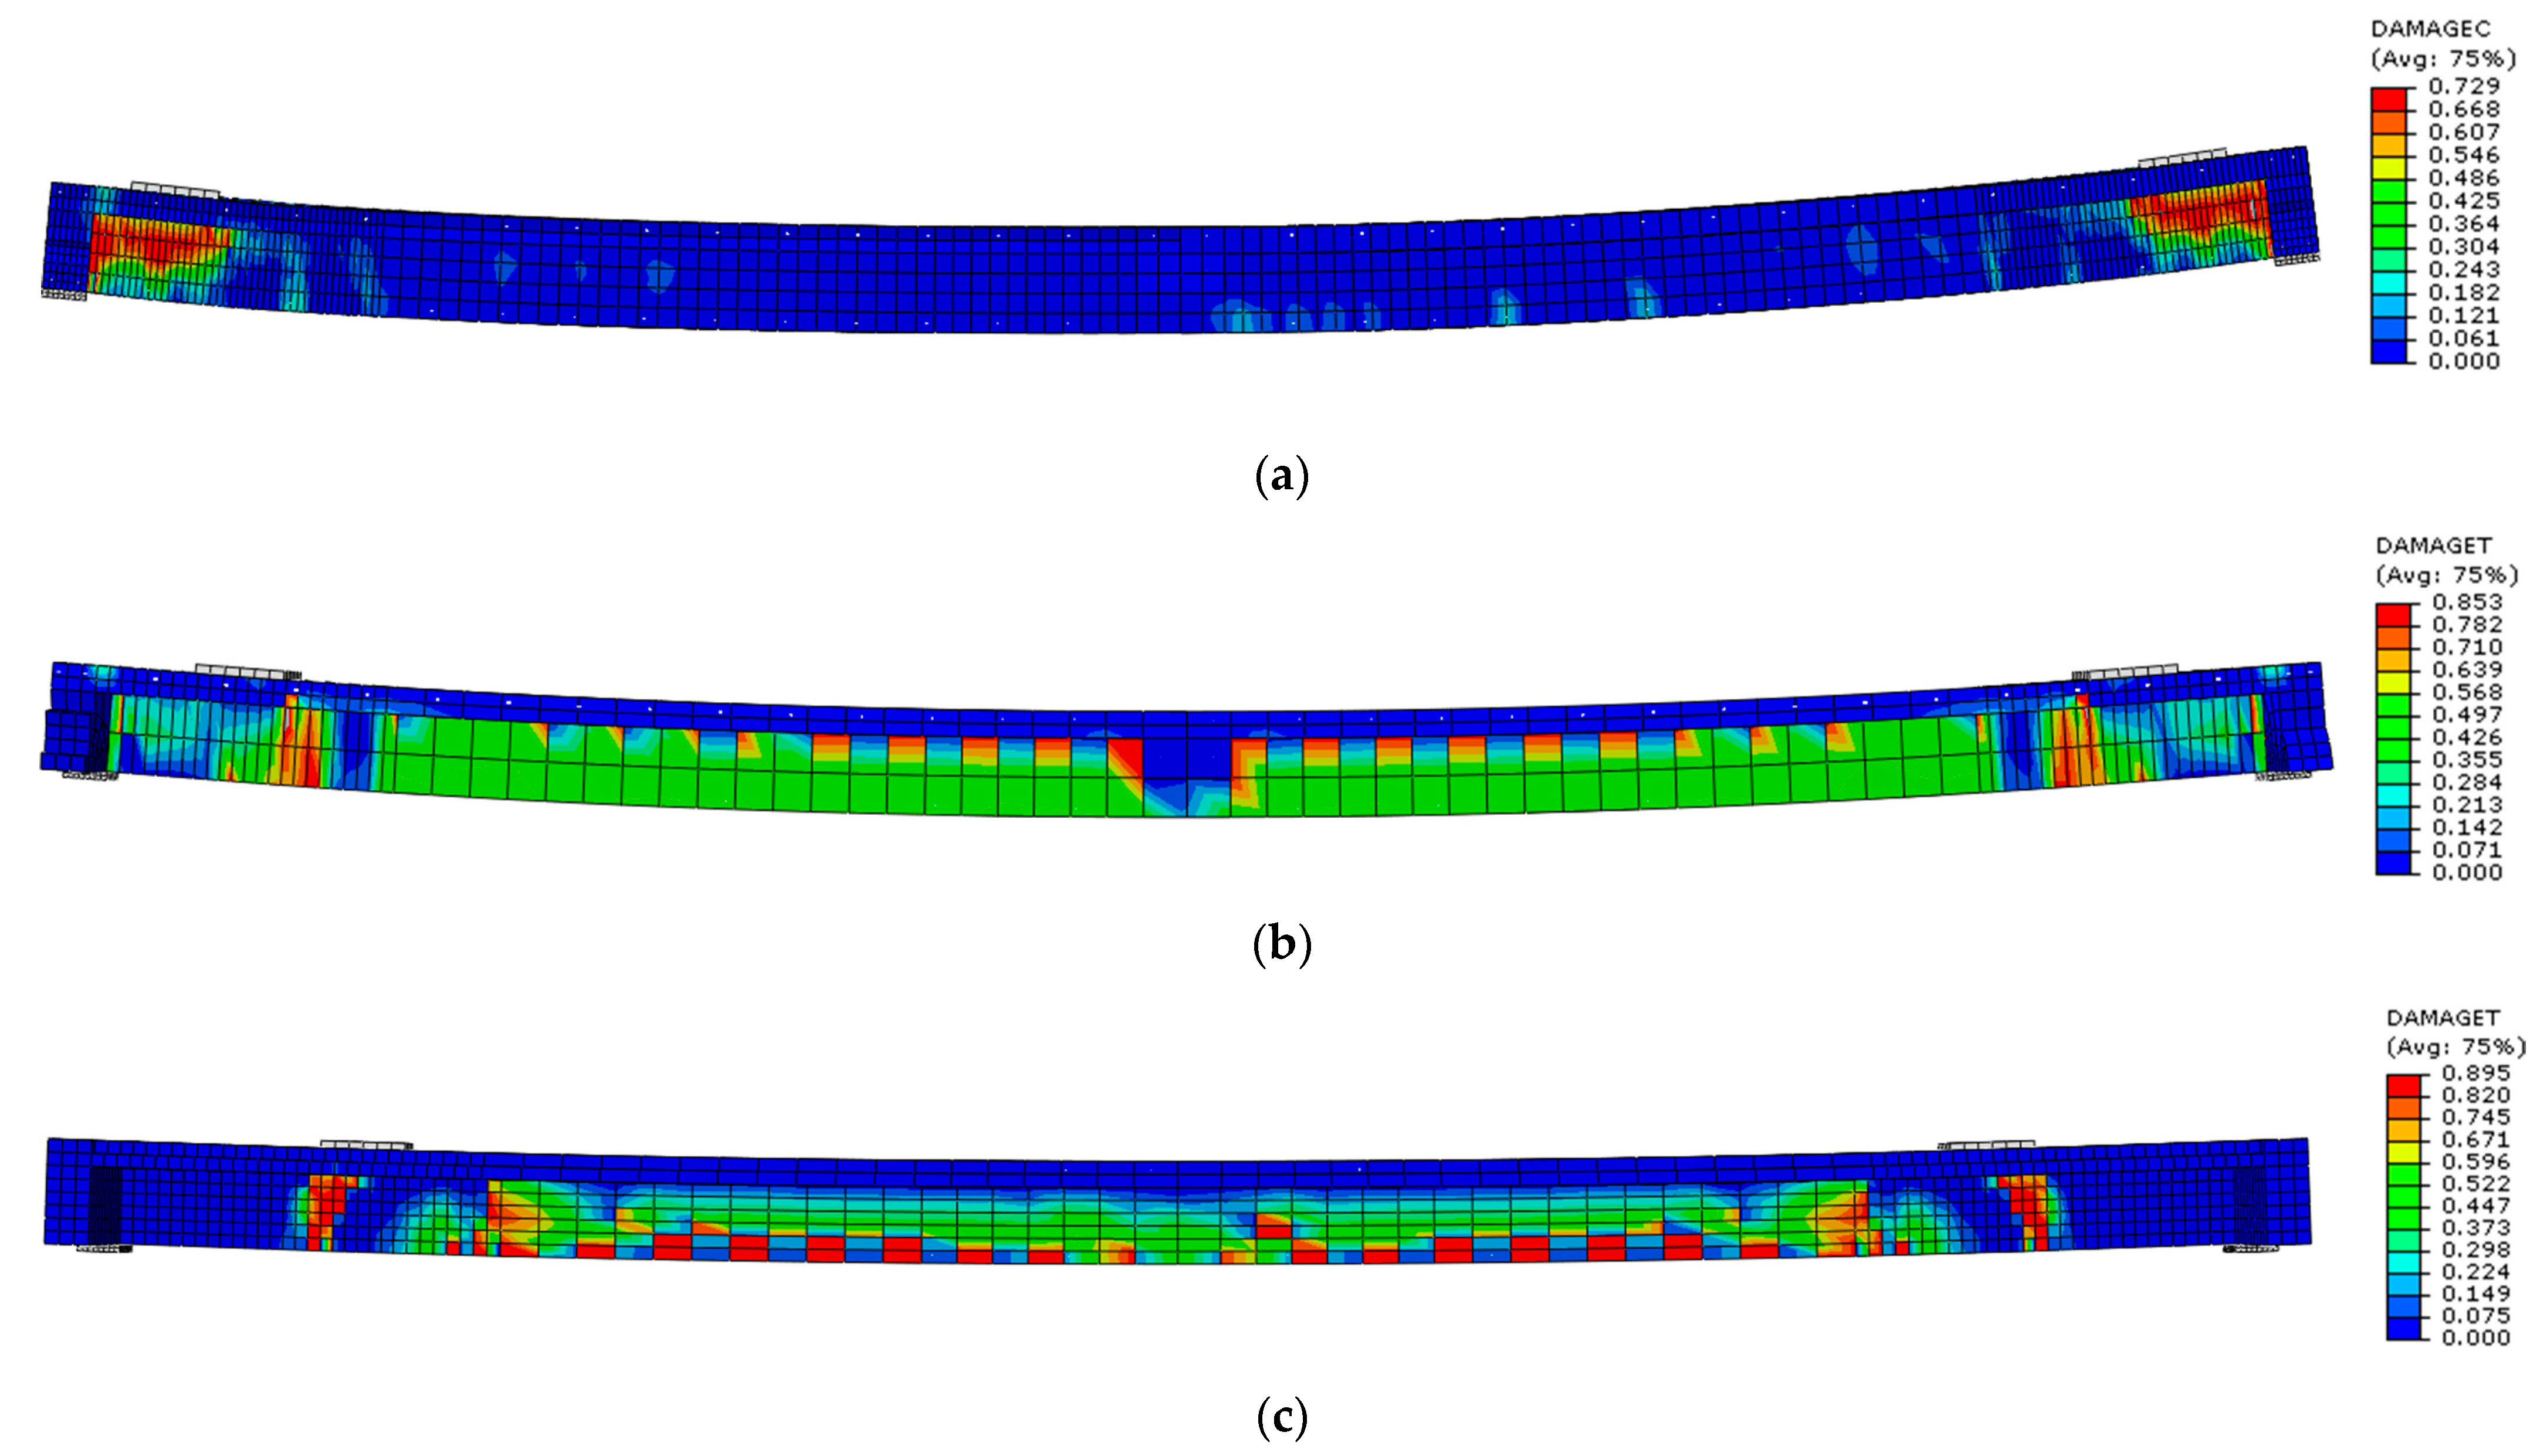
5.2.2. Failure Mode
5.2.3. Initial Crack Stress Analysis
5.3. Parametric Studies
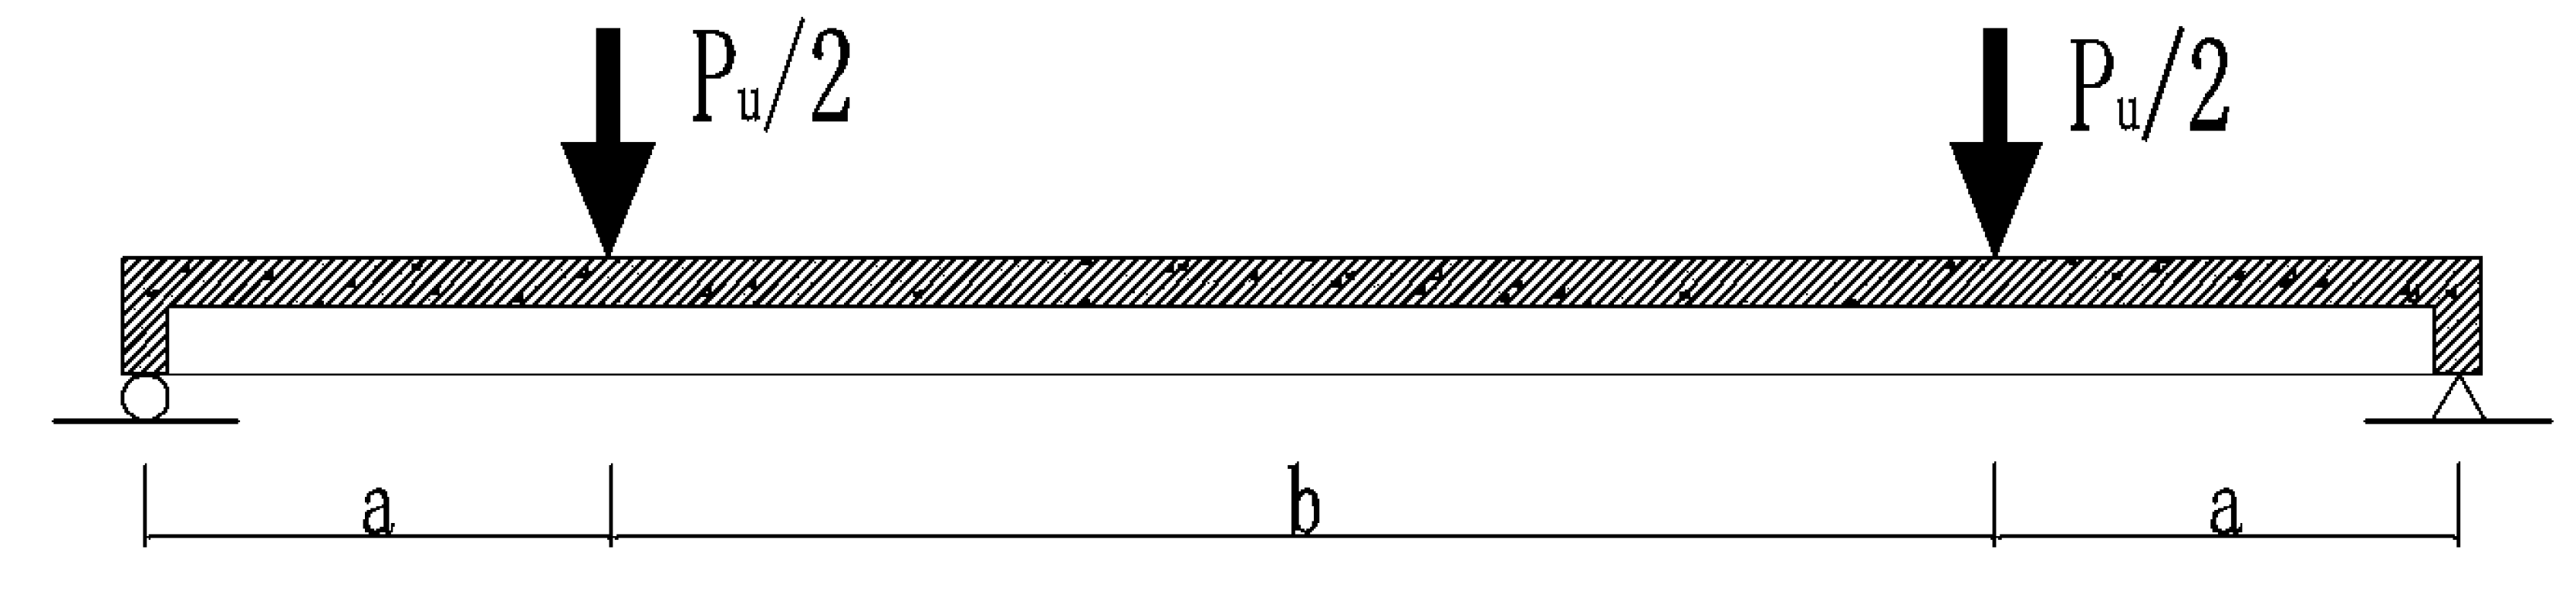
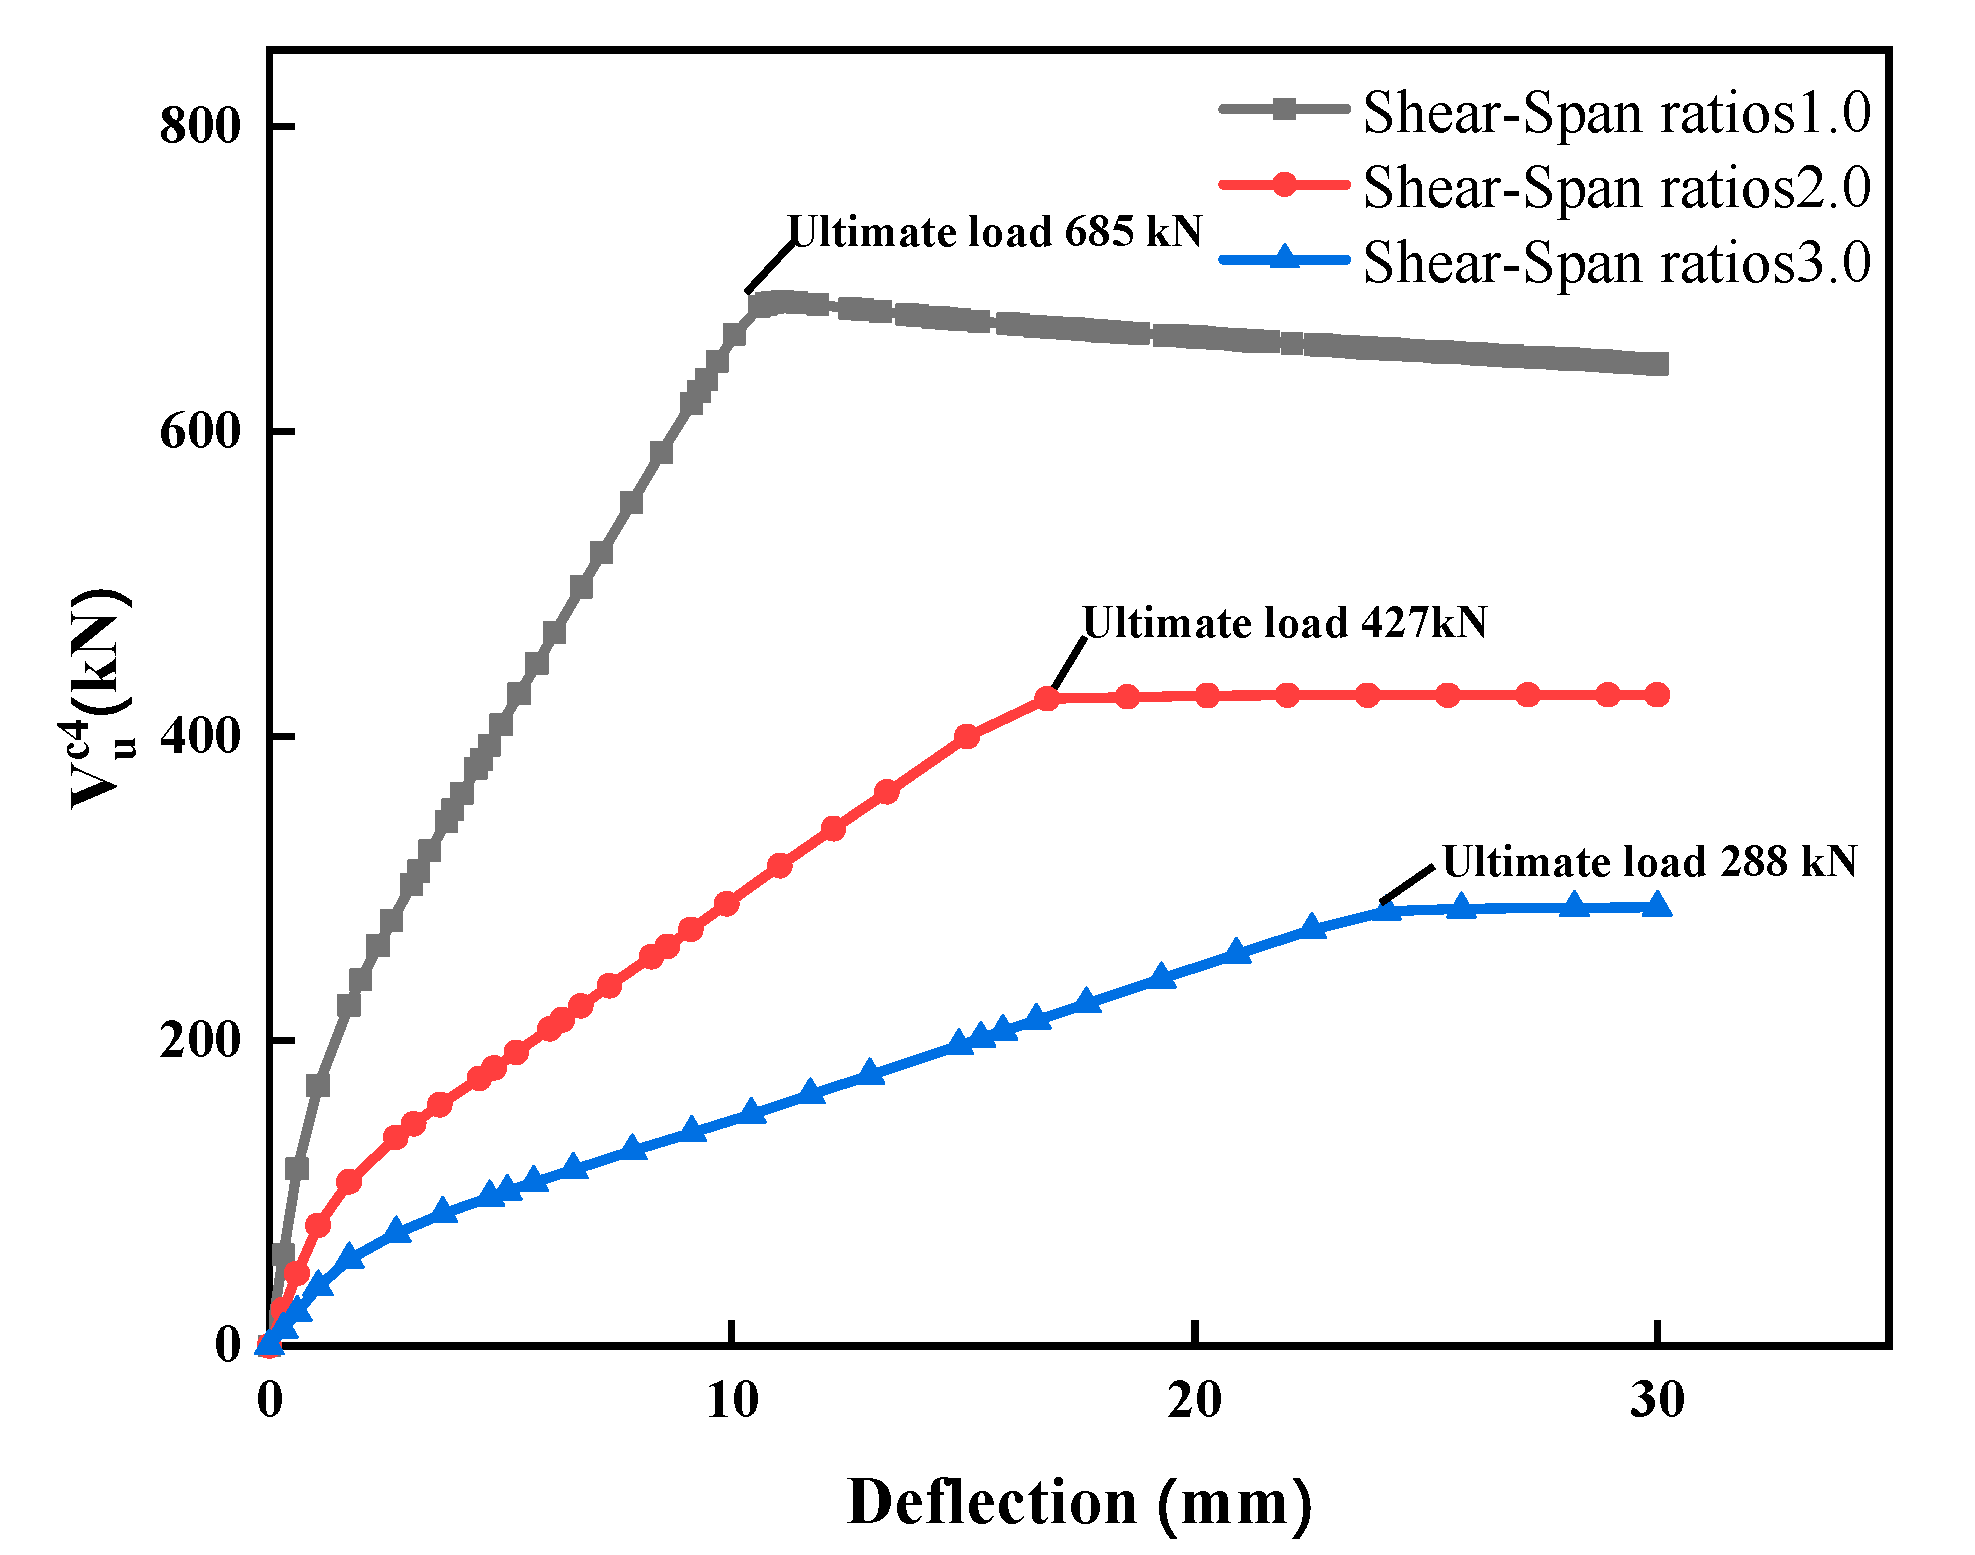
5.3.1. Shear Span Ratio
5.3.2. Load–Deflection Behaviors with Different Shear-Span Ratio
5.3.3. Failure Modes with Different Shear-Span Ratios
5.3.4. Calculation of Shear Capacity
5.3.5. Comparison of Results
5.3.6. Design Suggestion
6. Conclusions
- (1)
- The UHPC slab showed excellent mechanical properties and deformation ability. Under the action of the design load of 40 kN, only some tiny cracks appeared in the rib, and the mid-span deflection was also small, being only 8.83 mm. This could ensure the normal service of the new slab in the tunnel.
- (2)
- The entire process of flexural failure of the UHPC slab under three-point loading was divided into the elastic stage, the crack-propagation stage, and the yield stage. The ultimate bearing capacity (150 kN) of the specimen was 3.75 times the design load value (40 kN). Under the concentrated load in the mid-span, the failure mode of the slab was that the tensile steel bars at the bottom yielded, but the UHPC at the top was not crushed. The slab showed good toughness when it reached the ultimate load. Under the condition that the deflection increased sharply, it still conserved a high bearing capacity and no brittle failure occurred.
- (3)
- Using the theoretical formula, Response 2000, and the Abaqus finite element model, the ultimate bearing capacity calculation results were 154.9 kNm, 157.4 kNm, and 180.9 kNm, respectively. The ratio between the test value and the calculated values were 1.19, 1.17, and 1.02, respectively. The deviation between the calculated result and the test value was less than 20%. All the three calculation methods of flexural capacity can predict the flexural capacity of a slab accurately.
- (4)
- The load-deflection curves and the failure modes obtained by the finite element model were in good agreement with the test results. The stress at the lower edge of the rib during the initial crack test was 5.12 MPa. The parameter analysis of the finite element model showed that with the larger shear-span ratio, there is a smaller ultimate bearing capacity and lower stiffness of the specimen. The shear failure of the specimen occurred when the shear-span ratio was 1.0, but when the shear-span ratios were 2.0 and 3.0, flexural failure occurred. The French code formula can conservatively predict the shear capacity of slabs.
- (5)
- In the finite element model, by increasing the reinforcement ratio of the bottom longitudinal reinforcement from 1.4% to 8.0%, the ultimate bearing capacity of the diaphragm slab can reach 270.6 kN, which was 1.8 times the existing test bearing capacity. The structural behaviors of the diaphragm slab made with the current design had a large room for improvement.
Author Contributions
Funding
Data Availability Statement
Acknowledgments
Conflicts of Interest
References
- Wang, T.; Tan, L.; Xie, S.; Ma, B. Development and applications of common utility tunnels in China. Tunn. Undergr. Space Technol. 2018, 76, 92–106. [Google Scholar] [CrossRef]
- Pelà, A.L.; Aprile, A. Benedetti, Experimental study of retrofit solutions for damaged concrete bridge slabs. Compos. Part B Eng. 2012, 43, 2471–2479. [Google Scholar] [CrossRef]
- Kurama, Y.C.; Sritharan, S.; Fleischman, R.B.; Restrepo, J.I.; Henry, R.S.; Cleland, N.M.; Ghosh, S.; Bonelli, P. Seismic-resistant precast concrete structures: State of the art. J. Struct. Eng. 2018, 144, 03118001. [Google Scholar] [CrossRef]
- Cao, X.-Y.; Xiong, C.-Z.; Feng, D.-C.; Wu, G. Dynamic and probabilistic seismic performance assessment of precast prestressed reinforced concrete frames incorporating slab influence through three-dimensional spatial model. Bull. Earthq. Eng. 2022, 20, 6705–6739. [Google Scholar] [CrossRef]
- Cao, X.-Y.; Feng, D.-C.; Wu, G.; Wang, Z. Experimental and theoretical investigations of the existing reinforced concrete frames retrofitted with the novel external SC-PBSPC BRBF sub-structures. Eng. Struct. 2022, 256, 113982. [Google Scholar] [CrossRef]
- Shi, C.; Wu, Z.; Xiao, J.; Wang, D.; Huang, Z.; Fang, Z. A review on ultra high performance concrete: Part I. Raw materials and mixture design. Constr. Build. Mater. 2015, 101, 741–751. [Google Scholar] [CrossRef]
- Ullah, R.; Qiang, Y.; Ahmad, J.; Vatin, N.I.; El-Shorbagy, M.A. Ultra-high-performance concrete (UHPC): A state-of-the-art review. Materials 2022, 15, 4131. [Google Scholar] [CrossRef]
- Fang, S.; Zhang, S.; Cao, Z.; Zhao, G.; Fang, Z.; Ma, Y.; Jiang, H. Effects of stud aspect ratio and cover thickness on push-out performance of thin full-depth precast UHPC slabs with grouped short studs: Experimental evaluation and design considerations. J. Build. Eng. 2023, 67, 105910. [Google Scholar] [CrossRef]
- Fang, Z.; Hu, L.; Jiang, H.; Fang, S.; Zhao, G.; Ma, Y. Shear performance of high-strength friction-grip bolted shear connector in prefabricated steel–UHPC composite beams: Finite element modelling and parametric study. Case Stud. Constr. Mater. 2023, 18, e01860. [Google Scholar] [CrossRef]
- Feng, J.; Li, P.; Wu, J.; Jiang, H.; Tian, Y.; Sun, X. Shear behavior of externally prestressed UHPC beams without stirrups. Case Stud. Constr. Mater. 2023, 18, e01766. [Google Scholar] [CrossRef]
- Jiang, H.; Huang, C.; Mei, G.; Gao, X.; Tian, Y.; Sun, X. Experimental and numerical investigations on direct shear performance of UHPC dry joints. Eng. Struct. 2023, 283, 115872. [Google Scholar] [CrossRef]
- Jiang, H.; Hu, Z.; Cao, Z.; Gao, X.; Tian, Y.; Sun, X. Experimental and numerical study on shear performance of externally prestressed precast UHPC segmental beams without stirrups. In Structures; Elsevier: Amsterdam, The Netherlands, 2022; pp. 1134–1153. [Google Scholar]
- Hu, Z.; Xu, Z.; Zhang, S.; Jiang, H.; Chen, Y.; Xiao, J. Experimental study on shear behavior of precast high-strength concrete segmental beams with external tendons and dry joints. Buildings 2022, 12, 134. [Google Scholar] [CrossRef]
- Yu, Z.; Wu, L.; Yuan, Z.; Zhang, C.; Bangi, T. Mechanical properties, durability and application of ultra-high-performance concrete containing coarse aggregate (UHPC-CA): A review. Constr. Build. Mater. 2022, 334, 127360. [Google Scholar] [CrossRef]
- Wu, L.-S.; Yu, Z.-H.; Zhang, C.; Bangi, T. Design approach, mechanical properties and cost-performance evaluation of ultra-high performance engineered cementitious composite (UHP-ECC): A review. Constr. Build. Mater. 2022, 340, 127734. [Google Scholar] [CrossRef]
- Zhu, Y.; Zhang, Y.; Hussein, H.H.; Chen, G. Flexural strengthening of reinforced concrete beams or slabs using ultra-high performance concrete (UHPC): A state of the art review. Eng. Struct. 2020, 205, 110035. [Google Scholar] [CrossRef]
- AFGC (French Association of Civil Engineering). Ultra High Performance Fiber Reinforced Concrete Recommendations; AFGC: Paris, France, 2013. [Google Scholar]
- Yu, Z.; Wu, L.; Zhang, C.; Bangi, T. Influence of eco-friendly fine aggregate on macroscopic properties, microstructure and durability of ultra-high performance concrete: A review. J. Build. Eng. 2022, 65, 105783. [Google Scholar] [CrossRef]
- Yoo, D.-Y.; Kang, S.-T.; Yoon, Y.-S. Enhancing the flexural performance of ultra-high-performance concrete using long steel fibers. Compos. Struct. 2016, 147, 220–230. [Google Scholar] [CrossRef]
- Ragalwar, W.F.K.; Heard, B.A.; Williams, R. Ranade, Significance of the particle size distribution modulus for strain-hardening-ultra-high performance concrete (SH-UHPC) matrix design. Constr. Build. Mater. 2020, 234, 117423. [Google Scholar] [CrossRef]
- Arora, A.; Almujaddidi, A.; Kianmofrad, F.; Mobasher, B.; Neithalath, N. Material design of economical ultra-high performance concrete (UHPC) and evaluation of their properties. Cem. Concr. Compos. 2019, 104, 103346. [Google Scholar] [CrossRef]
- Toutlemonde, F.; Resplendino, J.; Sorelli, L.; Bouteille, S.; Brisard, S. Innovative design of ultra high-performance fiber reinforced concrete ribbed slab: Experimental validation and preliminary detailed analyses. In Proceedings of the 7th International Symposium on Utilization of High Strength/High Performance Concrete, Washington, DC, USA, 20–24 June 2005; pp. 1187–1206. [Google Scholar]
- Aaleti, S.; Petersen, B.; Sritharan, S. Design Guide for Precast UHPC Waffle Deck Panel System, Including Connections; Federal Highway Administration: Washington, DC, USA, 2013.
- Ghasemi, S.; Mirmiran, A.; Xiao, Y.; Mackie, K. Novel UHPC-CFRP waffle deck panel system for accelerated bridge construction. J. Compos. Constr. 2016, 20, 04015042. [Google Scholar] [CrossRef]
- Garcia, H. Analysis of an Ultra-High Performance Concrete Two-Way Ribbed Bridge Deck Slab; Federal Highway Administration Office of Infrastructure: Washington, DC, USA, 2007.
- Saleem, M.A.; Mirmiran, A.; Xia, J.; Mackie, K. Ultra-High-Performance Concrete Bridge Deck Reinforced with High-Strength Steel. ACI Struct. J. 2011, 108, 5. [Google Scholar]
- Shao, X.; Li, Y.; Liao, Z.; Cao, J. Test and finite element analysis on bending performance of UHPC waffle deck panel. J. Chang. Univ. (Nat. Sci. Ed.) 2018, 38, 52–63. [Google Scholar]
- Liang, X.; Wang, P.; Xu, M.; Wang, Z.; Yu, J.; Li, L. Investigation on flexural capacity of reinforced ultra high performance concrete beams. Eng. Mech. 2019, 36, 110–119. (In Chinese) [Google Scholar] [CrossRef]
- Deng, Z.; Wang, Y.; Xiao, R.; Lan, M. Flexural test and theoretical analysis of UHPC beams with high strength rebars. J. Basic Sci. Eng. 2015, 23, 68–78. (In Chinese) [Google Scholar] [CrossRef]
- Yang, I.H.; Joh, C.; Kim, B.-S. Structural behavior of ultra high performance concrete beams subjected to bending. Eng. Struct. 2010, 32, 3478–3487. [Google Scholar] [CrossRef]
- Peng, F.; Fang, Z. Calculation approach for flexural capacity of reinforced UHPC beams. China Civ. Eng. J. 2021, 54, 86–97. (In Chinese) [Google Scholar] [CrossRef]
- Zhu, Q.; Ye, L.; Cai, W.; Wen, X. Experimental study and theoretical calculations on flexural performance of UHPC-T beams. J. Archit. Civ. Eng. 2023, 40, 65–74. Available online: https://kns.cnki.net/kcms/detail/61.1442.TU.20220225.0946.004.html (accessed on 16 May 2023). (In Chinese).
- GB/T 31387-2015; Reactive Powder Concrete. MOHURD (Ministry of Housing and Urban-Rural Development of the People’s Republic of China): Beijing, China, 2015.
- GB/T 1499.1492-2018; Steel for the Reinforcement of Concrete—Part 2: Hot Rolled Ribbed Bars. SAMR (State Administration for Market Regulation of the People’s Republic of China): Beijing, China, 2018.
- Duval, A.; Al-akhras, H.; Maurin, F.; Elguedj, T.; Duval, A.; Al-akhras, H.; Maurin, F.; Elguedj, T. Abaqus/CAE 6.14 User’s Manual; Dassault Systémes Inc.: Velizy-Villacoublay, France, 2014. [Google Scholar]
- Lubliner, J.; Oliver, J.; Oller, S.; Oñate, E. A plastic-damage model for concrete. Int. J. Solids Struct. 1989, 25, 299–326. [Google Scholar] [CrossRef]
- Lee, J.; Fenves, G.L. Plastic-damage model for cyclic loading of concrete structures. J. Eng. Mech. 1998, 124, 892–900. [Google Scholar] [CrossRef]
- Yin, H.; Shirai, K.; Teo, W. Numerical assessment of ultra-high performance concrete material. IOP Conf. Ser. Mater. Sci. Eng. 2017, 012004. [Google Scholar] [CrossRef]
- Yang, J.; Fang, Z. Research on stress-strain relation of ultra high performance concrete. Concrete 2008, 225, 11–15. (In Chinese) [Google Scholar]
- Zhang, Z.; Shao, X.; Li, W.; Zhu, P. Axial tensile behavior test of ultra high performance concrete. China J. Of. Highw. Transp. 2015, 28, 50–58. (In Chinese) [Google Scholar] [CrossRef]
- GB 50010-2010; Code for Design of Concrete Structures. MOHURD (Ministry of Housing and Urban-Rural Development of the People’s Republic of China): Beijing, China, 2010.
- Afnor, N.; Droll, K. P18-710: National Addition to Eurocode 2—Design of Concrete Structures: Specific Rules for Ultra-High Performance Fiber-Reinforced Concrete (UHPFRC); Association Française de Normalisation: Saint-Denis, France, 2016. [Google Scholar]


| Material | Properties | Parameter (MPa) |
|---|---|---|
| UHPC | Cubic compressive strength | 141.0 |
| Flexural strength | 18.5 | |
| Elastic modulus | 43,000 |
| Items | φ6 mm | φ8 mm | φ12 mm | φ20 mm |
|---|---|---|---|---|
| Yield strength (MPa) | 448.6 | 461.6 | 469.2 | 425.8 |
| Ultimate strength (MPa) | 527.2 | 543.1 | 552.0 | 608.3 |
| Elastic modulus (GPa) | 189 | 190 | 198 | 195 |
| Specimen Number | fcd (MPa) | ftd (MPa) | bf (mm) | As (mm) | fy (MPa) | b (mm) | hf (mm) | h (mm) | h0 (mm) | x (mm) | |
|---|---|---|---|---|---|---|---|---|---|---|---|
| UHPC-T-2475 | 0.9 | 135 | 6 | 750 | 628 | 400 | 120 | 60 | 240 | 220 | 8.6 |
| Specimen Number | /kN∙m | /kN∙m | /kN∙m | /kN∙m | |||
|---|---|---|---|---|---|---|---|
| UHPC-T-2475 | 184.4 | 154.9 | 180.9 | 1.19 | 1.17 | 1.02 |
| Dilation Angle | Eccentricity | Viscosity Parameter | ||
|---|---|---|---|---|
| 36° | 0.1 | 1.16 | 0.667 | 0.005 |
| Specimen Number | a (mm) | b (mm) | λ | |
|---|---|---|---|---|
| UHPC-N-220 | 220 | 4510 | 220 | 1.0 |
| UHPC-N-440 | 440 | 4070 | 220 | 2.0 |
| UHPC-N-660 | 660 | 3630 | 220 | 3.0 |
| 240 | 200 | 220 | 200 | 100.5 | 48,000 | 45 | 400 | 6 | 129 | 40 | 288 | 457 |
| Specimen Number | /kN | /kN∙m | /kN | |
|---|---|---|---|---|
| UHPC-N-220 | 685.0 | 154.9 | 704.1 | 457.0 |
| UHPC-N-440 | 427.2 | 154.9 | 352.0 | 457.0 |
| UHPC-N-660 | 288.0 | 154.9 | 234.7 | 457.0 |
Disclaimer/Publisher’s Note: The statements, opinions and data contained in all publications are solely those of the individual author(s) and contributor(s) and not of MDPI and/or the editor(s). MDPI and/or the editor(s) disclaim responsibility for any injury to people or property resulting from any ideas, methods, instructions or products referred to in the content. |
© 2023 by the authors. Licensee MDPI, Basel, Switzerland. This article is an open access article distributed under the terms and conditions of the Creative Commons Attribution (CC BY) license (https://creativecommons.org/licenses/by/4.0/).
Share and Cite
Cheng, Q.; Li, Z.; Deng, S.; Jiang, H.; Tian, Y.; Geng, J. Full-Scale Experimental Study on Flexural Performance of the New Precast UHPC Diaphragm Slab in Utility Tunnels. Buildings 2023, 13, 1349. https://doi.org/10.3390/buildings13051349
Cheng Q, Li Z, Deng S, Jiang H, Tian Y, Geng J. Full-Scale Experimental Study on Flexural Performance of the New Precast UHPC Diaphragm Slab in Utility Tunnels. Buildings. 2023; 13(5):1349. https://doi.org/10.3390/buildings13051349
Chicago/Turabian StyleCheng, Quan, Zhengwei Li, Shaowei Deng, Haibo Jiang, Yueqiang Tian, and Jiayue Geng. 2023. "Full-Scale Experimental Study on Flexural Performance of the New Precast UHPC Diaphragm Slab in Utility Tunnels" Buildings 13, no. 5: 1349. https://doi.org/10.3390/buildings13051349