
Investigating the Viability of Recycling Rice Husk Ash and Plastic Bag Waste to Enhance Durability of Lightweight Concrete

Abstract
:1. Introduction
2. Experimental Plan
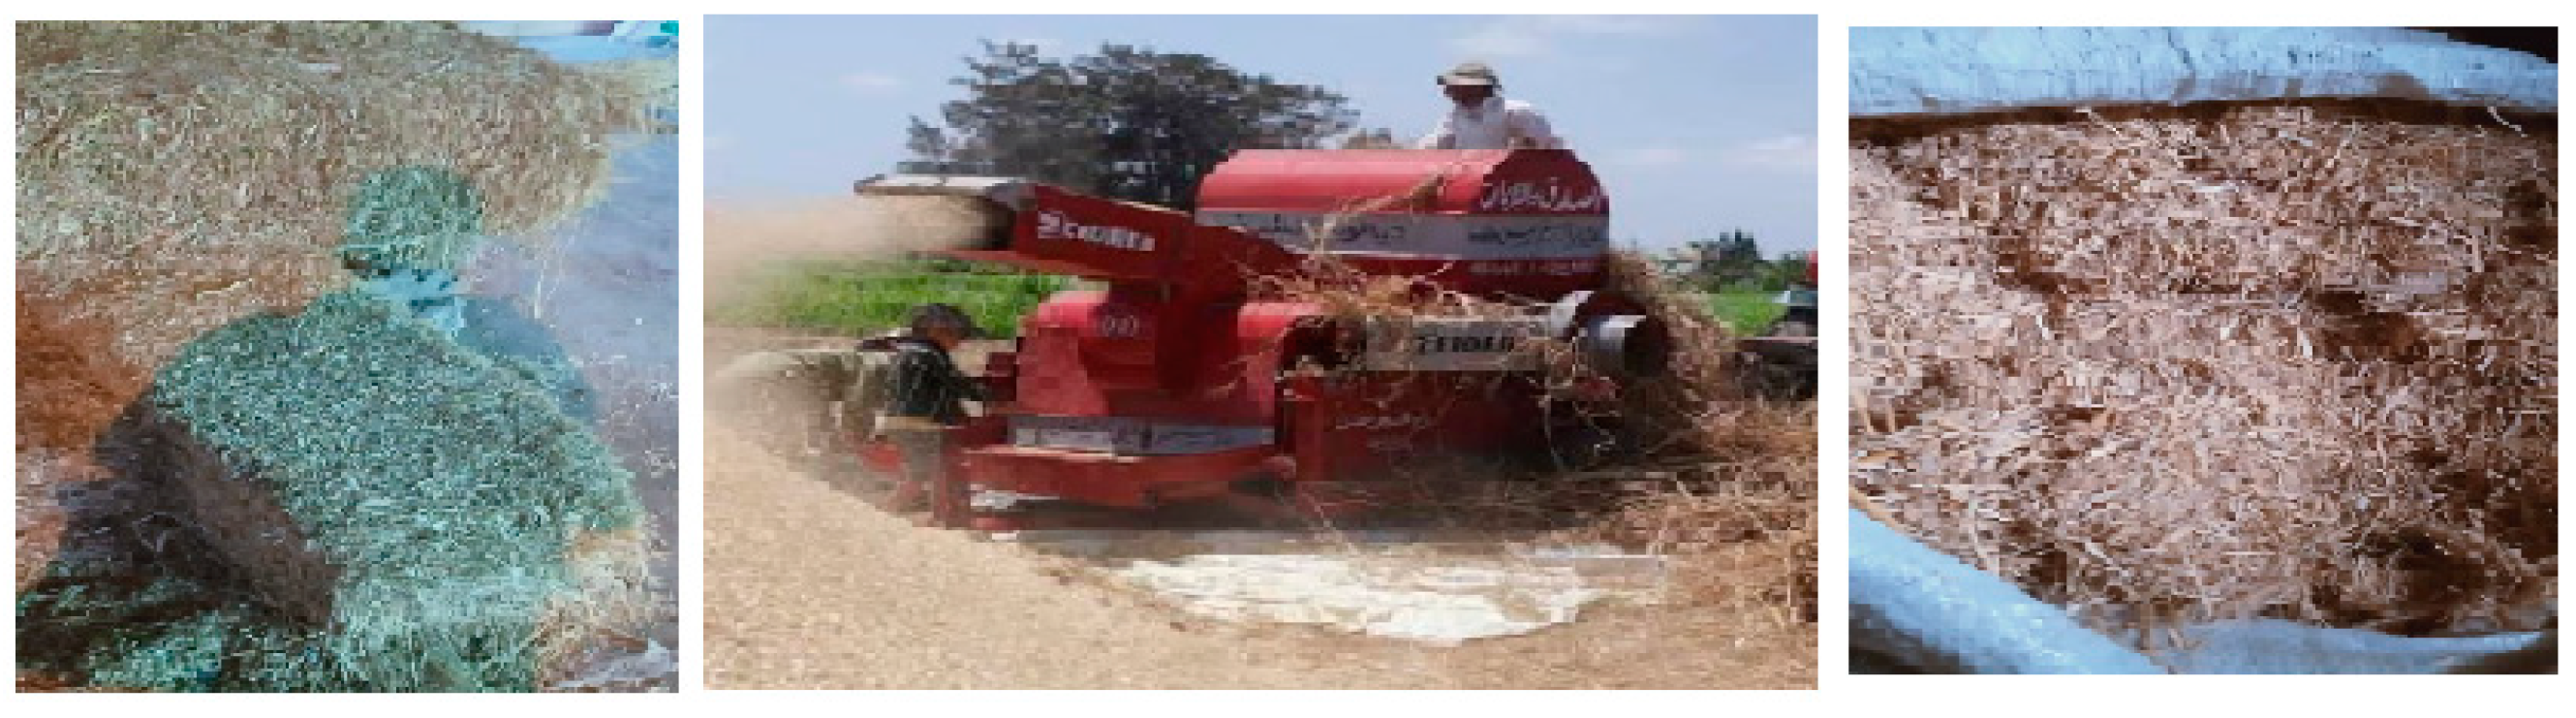
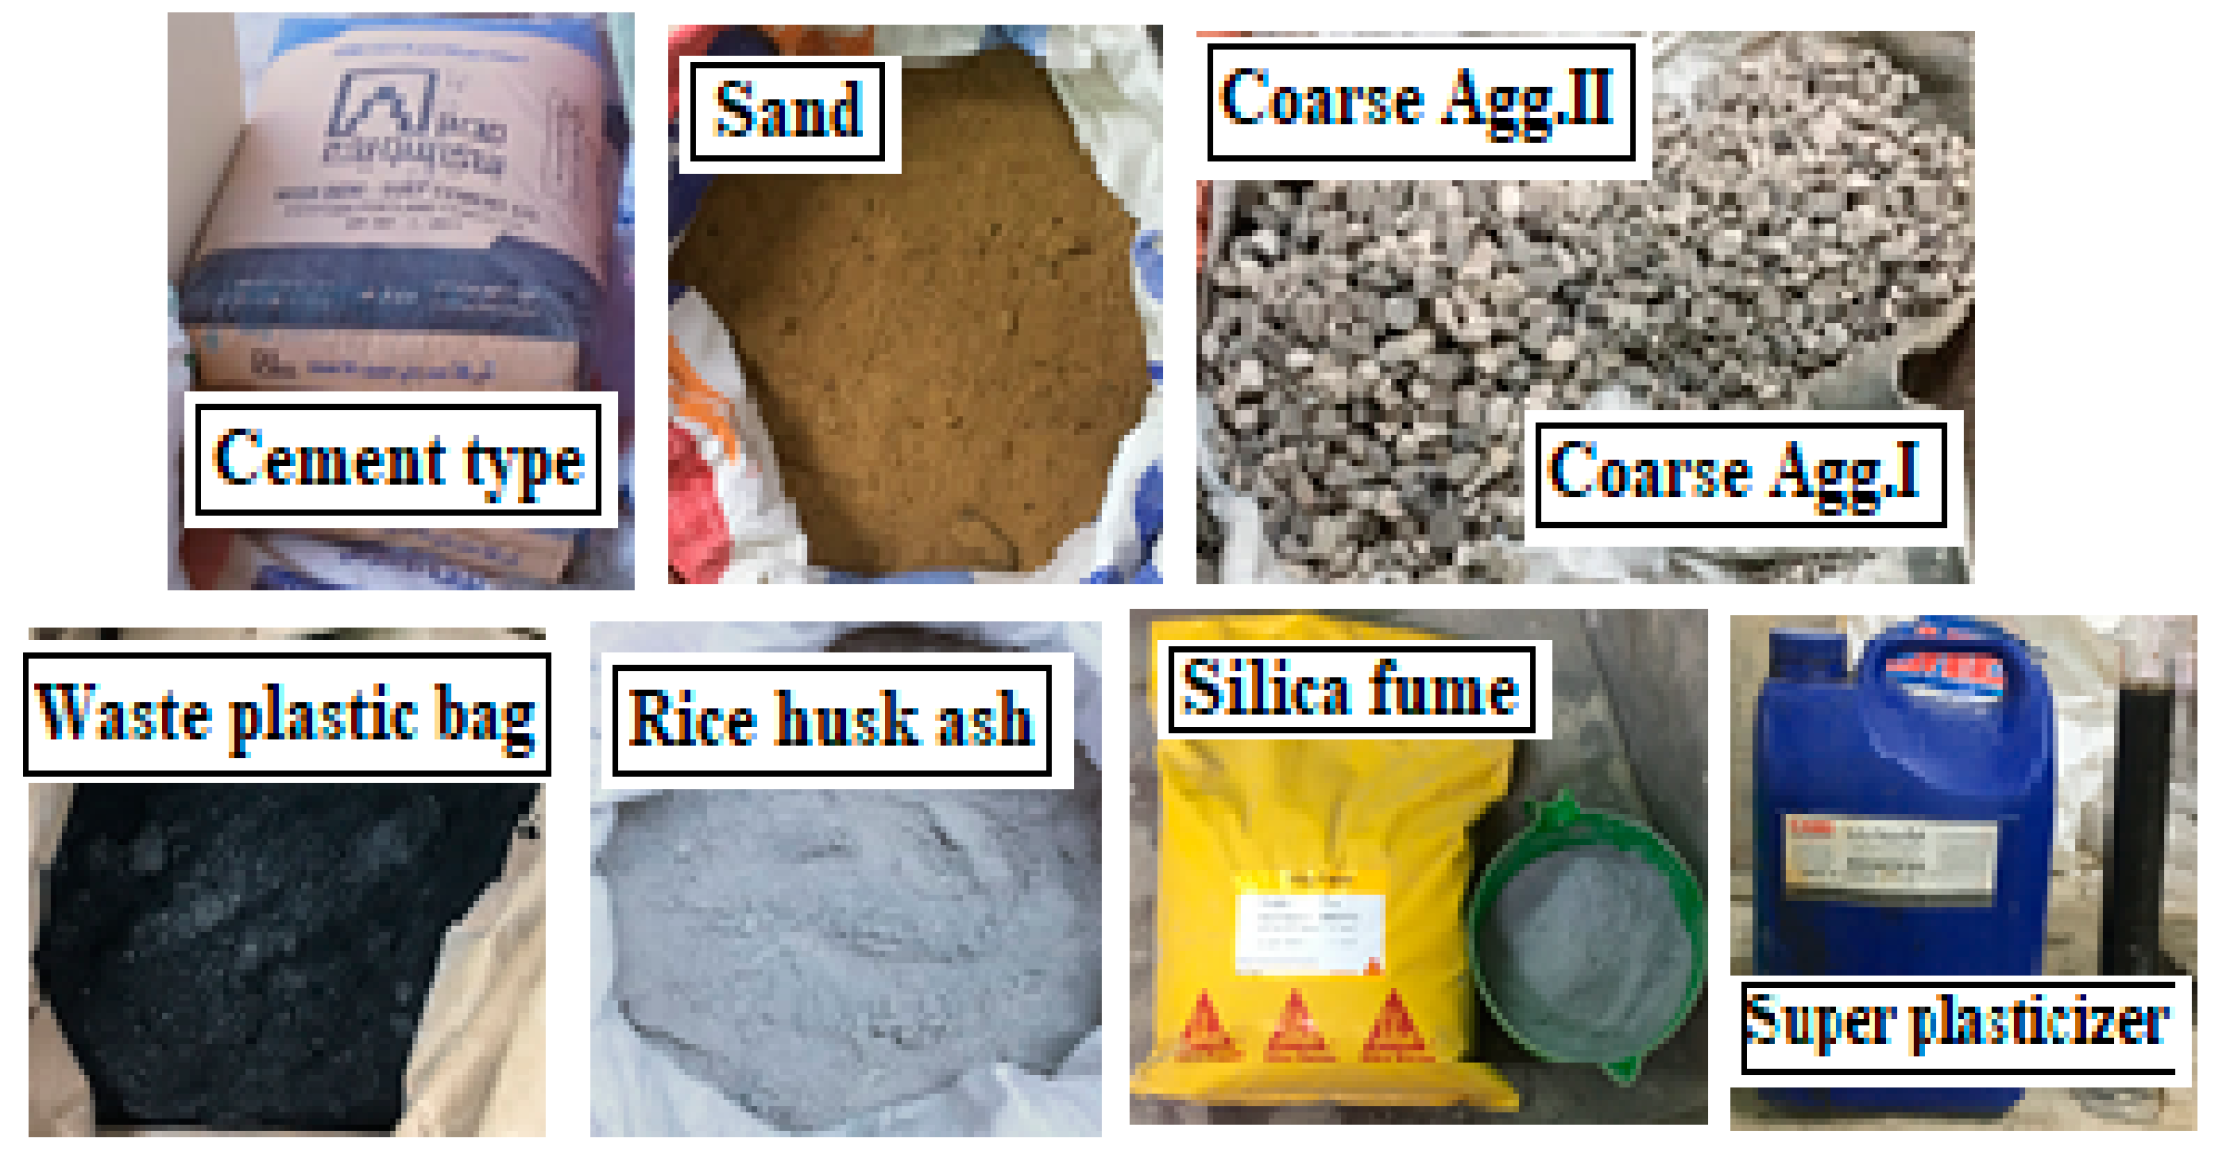
2.1. Materials
2.2. Mixes and Variables
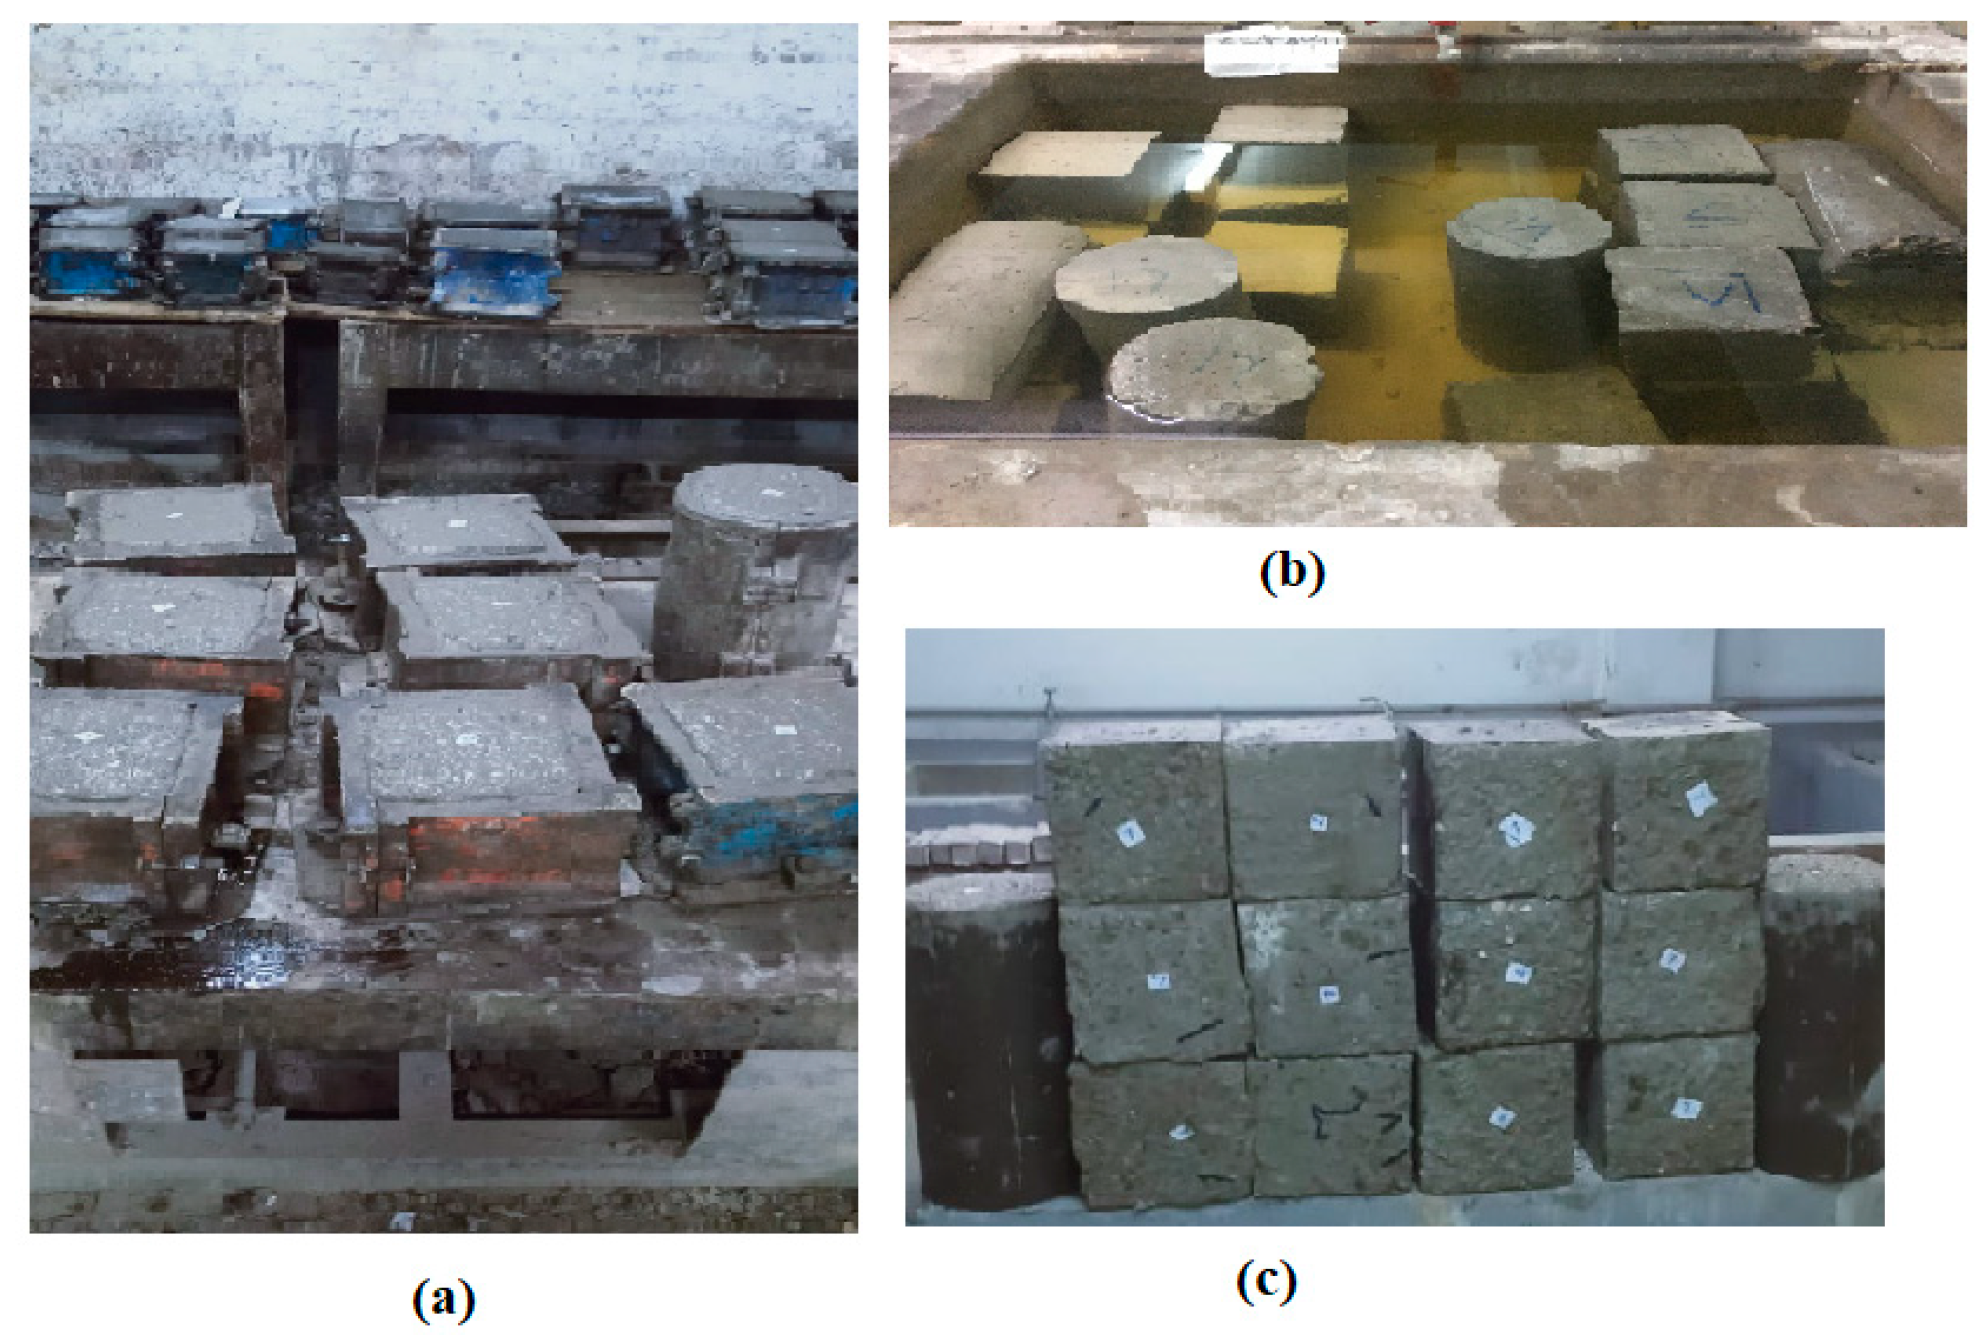
2.3. Test Techniques and Procedures
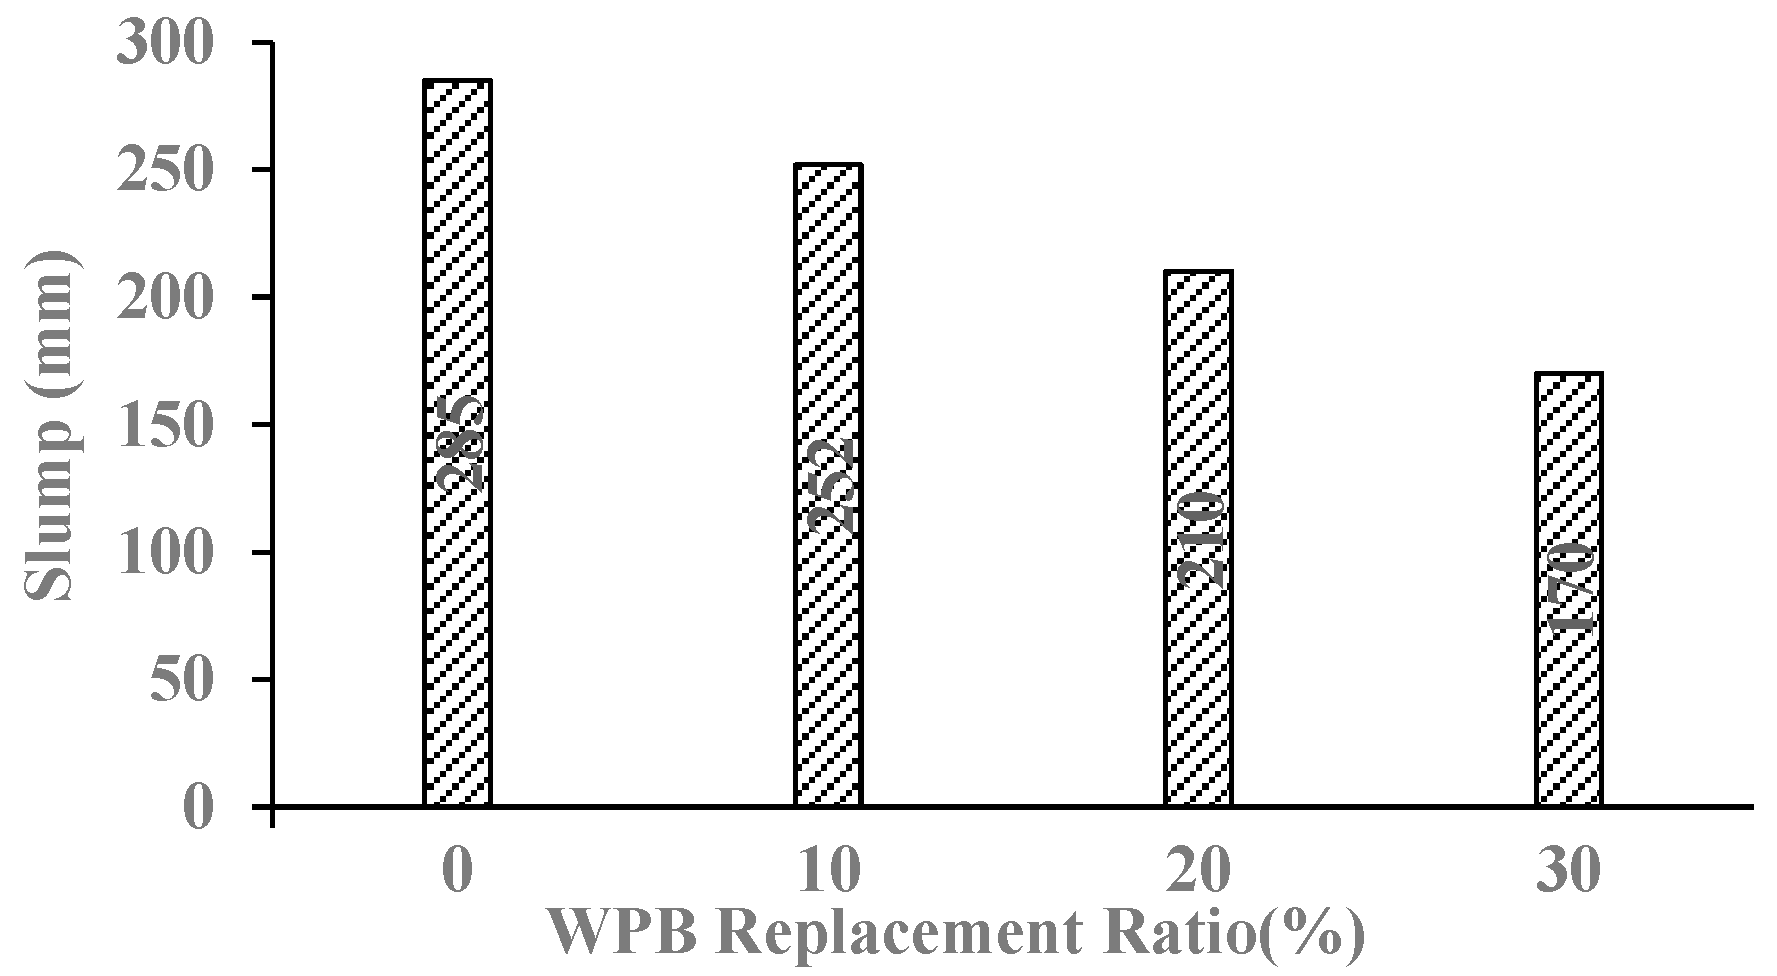
2.3.1. Slump
2.3.2. Unit Weight
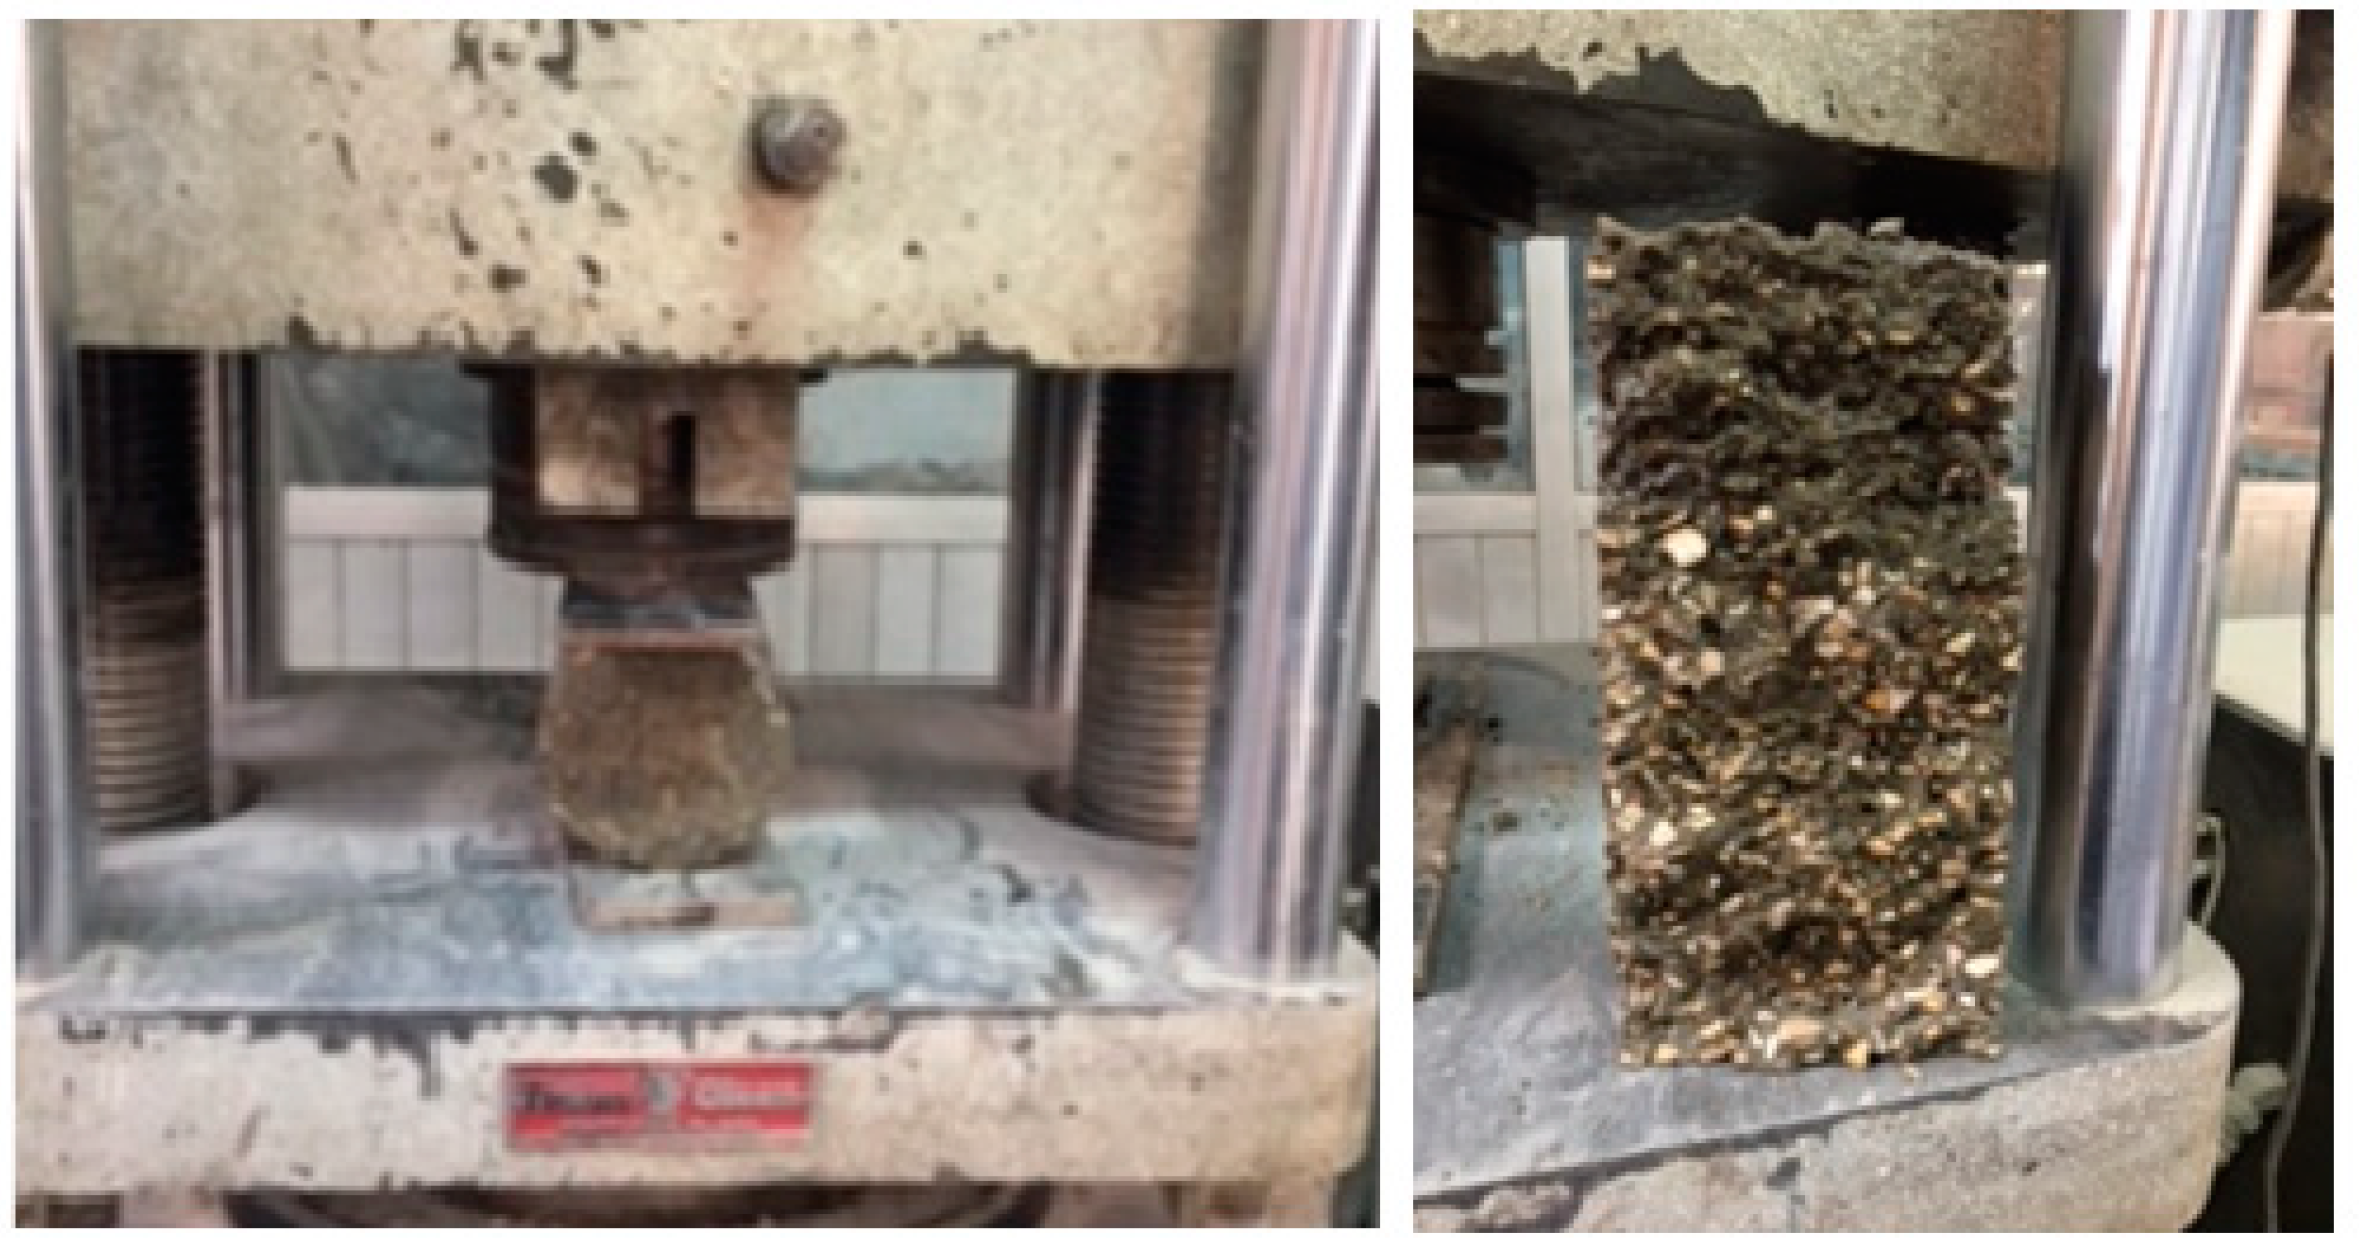
2.3.3. Compressive Strength
2.3.4. Splitting Tensile Strength
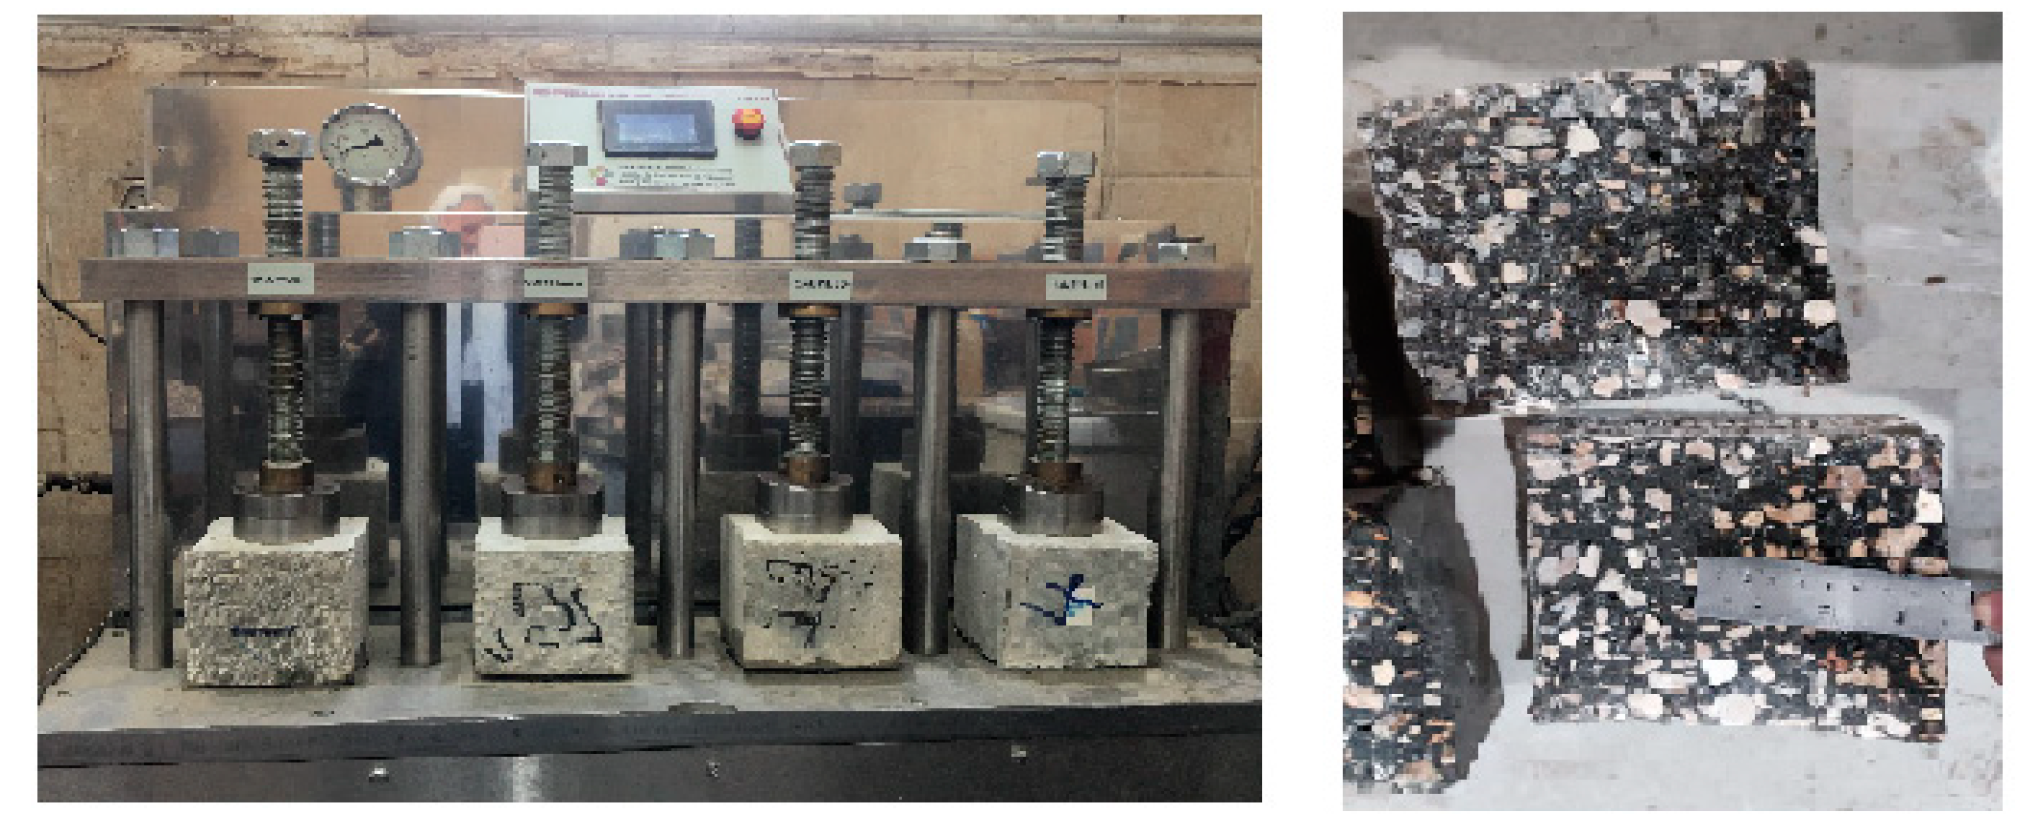
2.3.5. Water Permeability
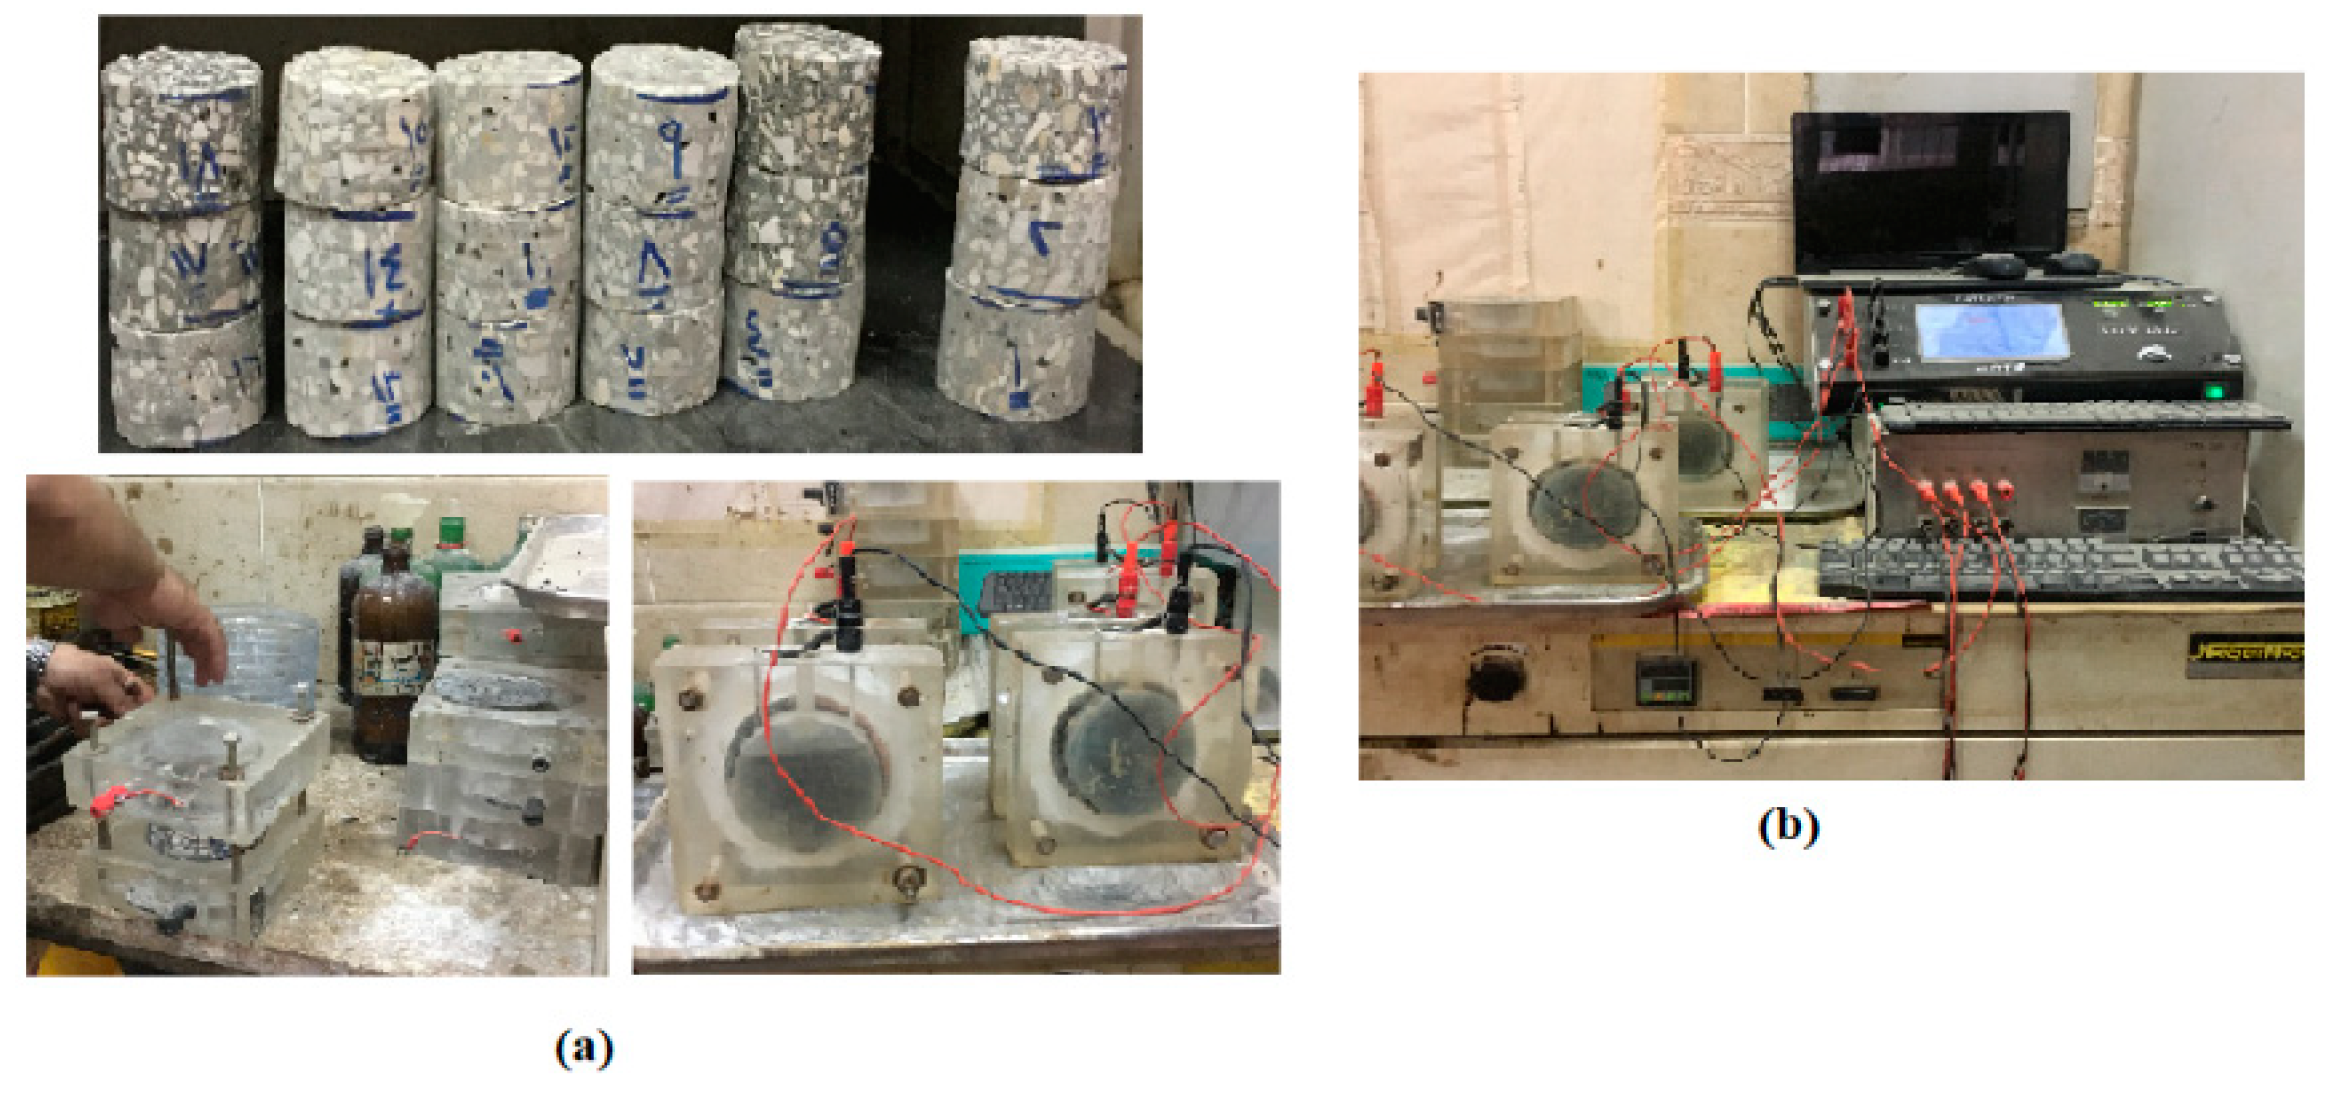
2.3.6. Rapid Chloride Penetration (RCP)
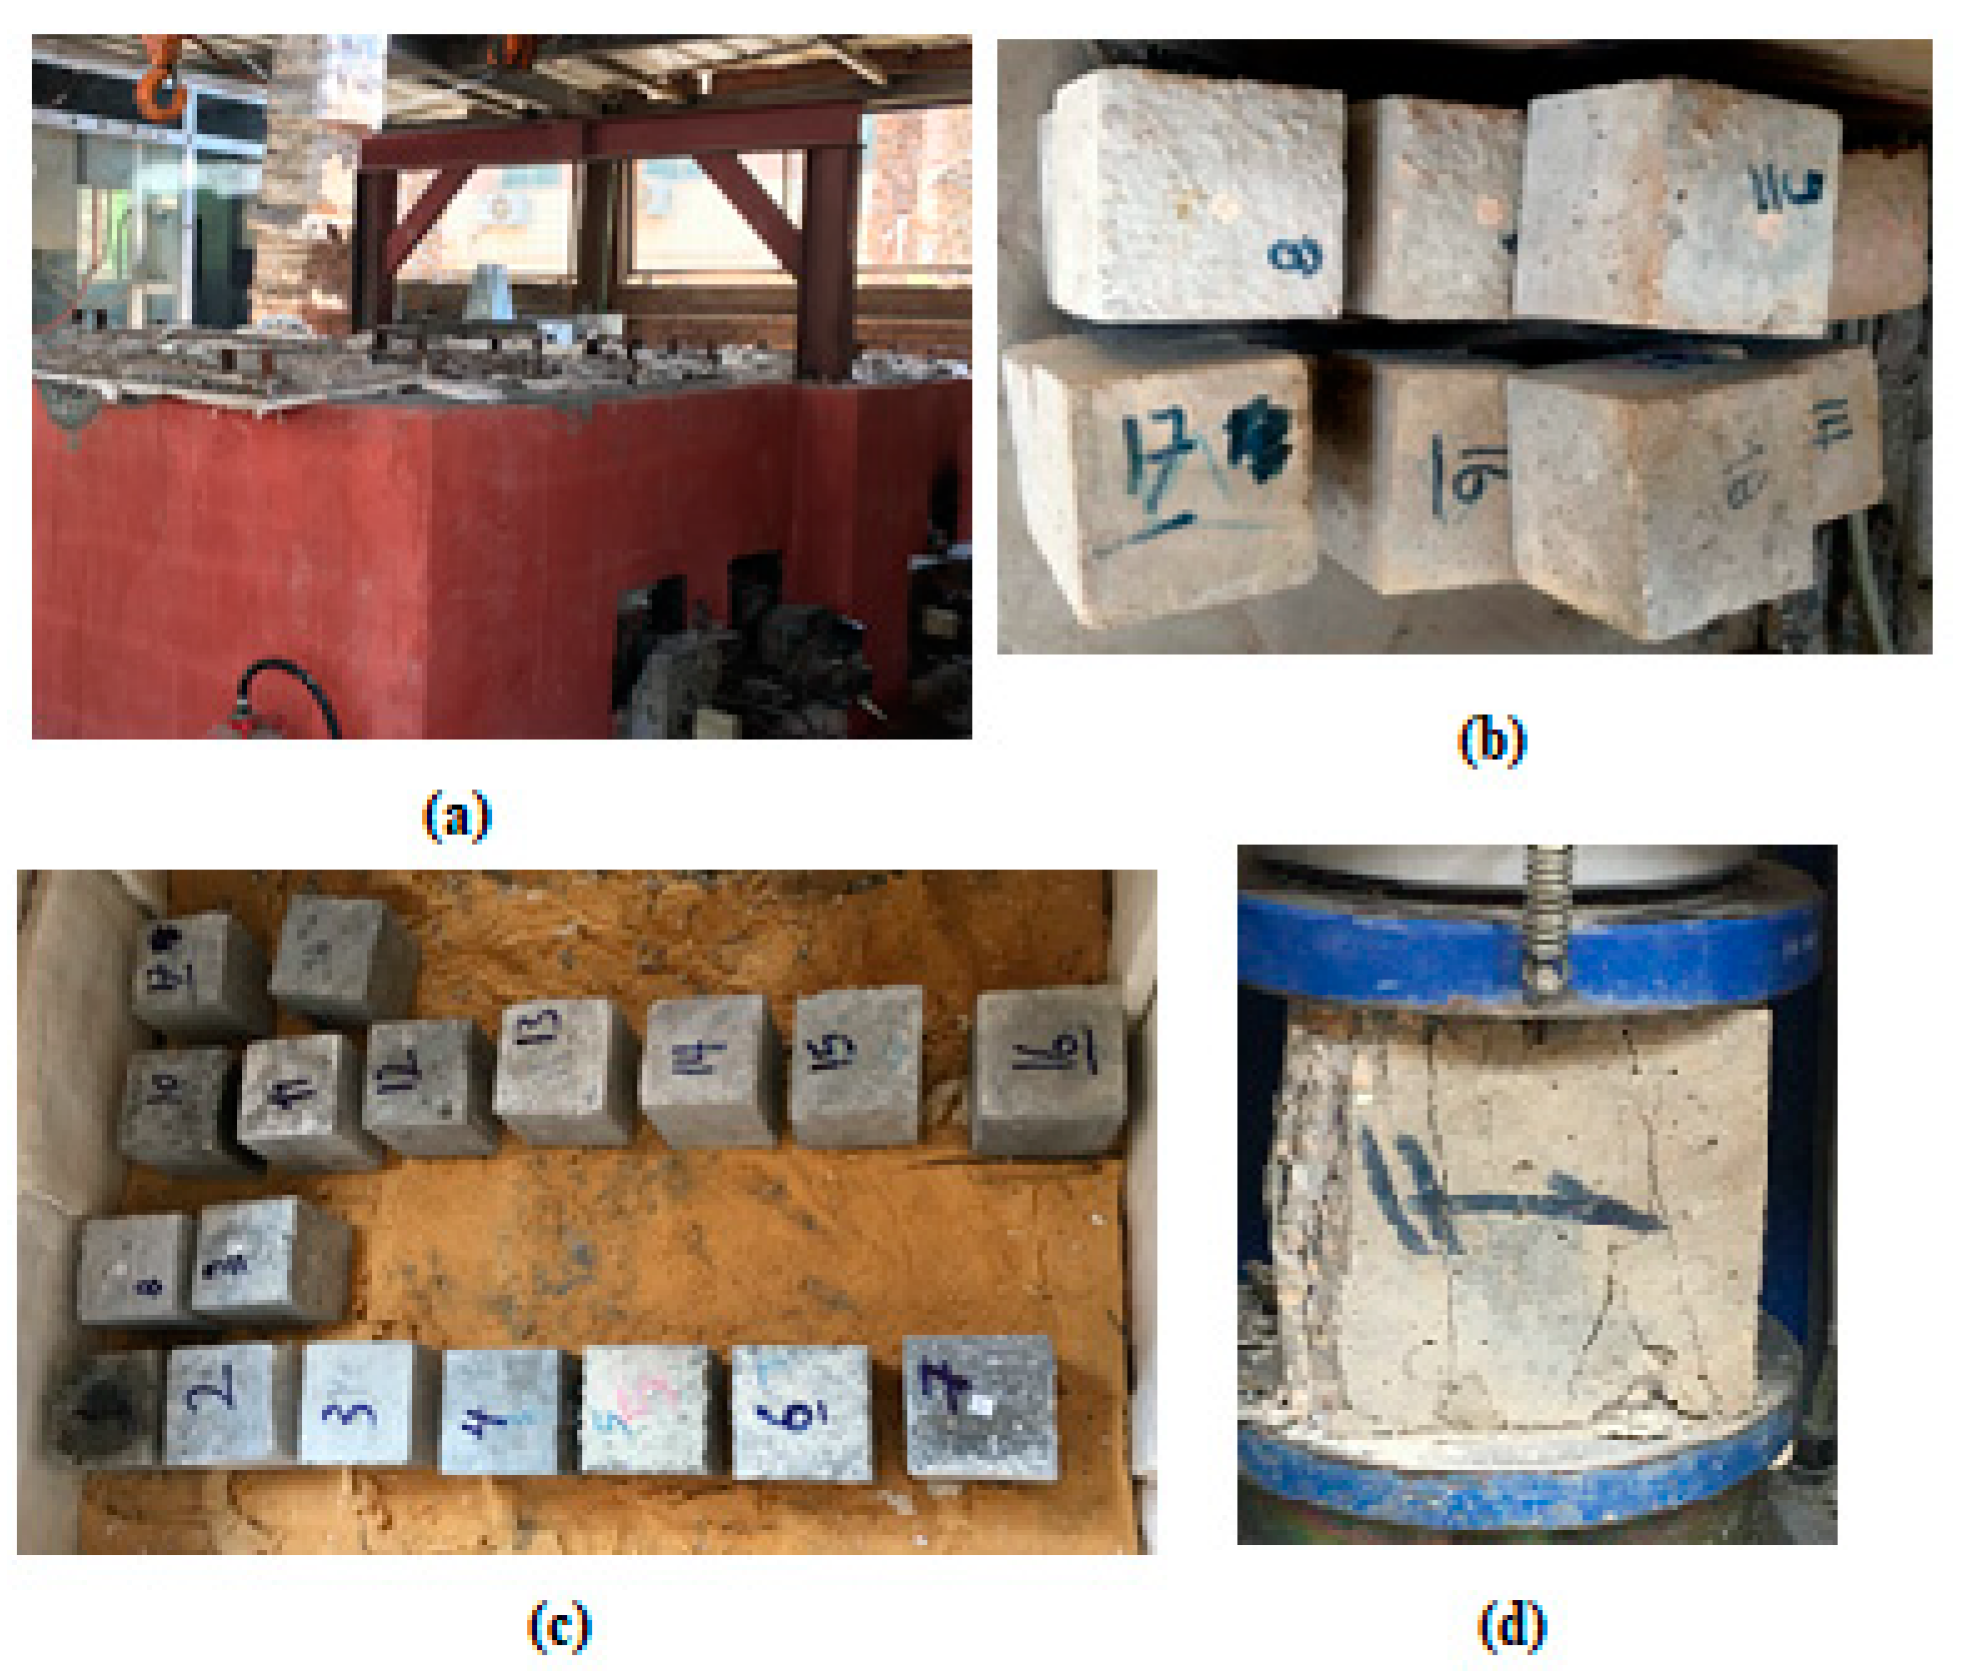
2.3.7. Fire Resistance
3. Experimental Results and Analysis
3.1. Fluidity of Concrete
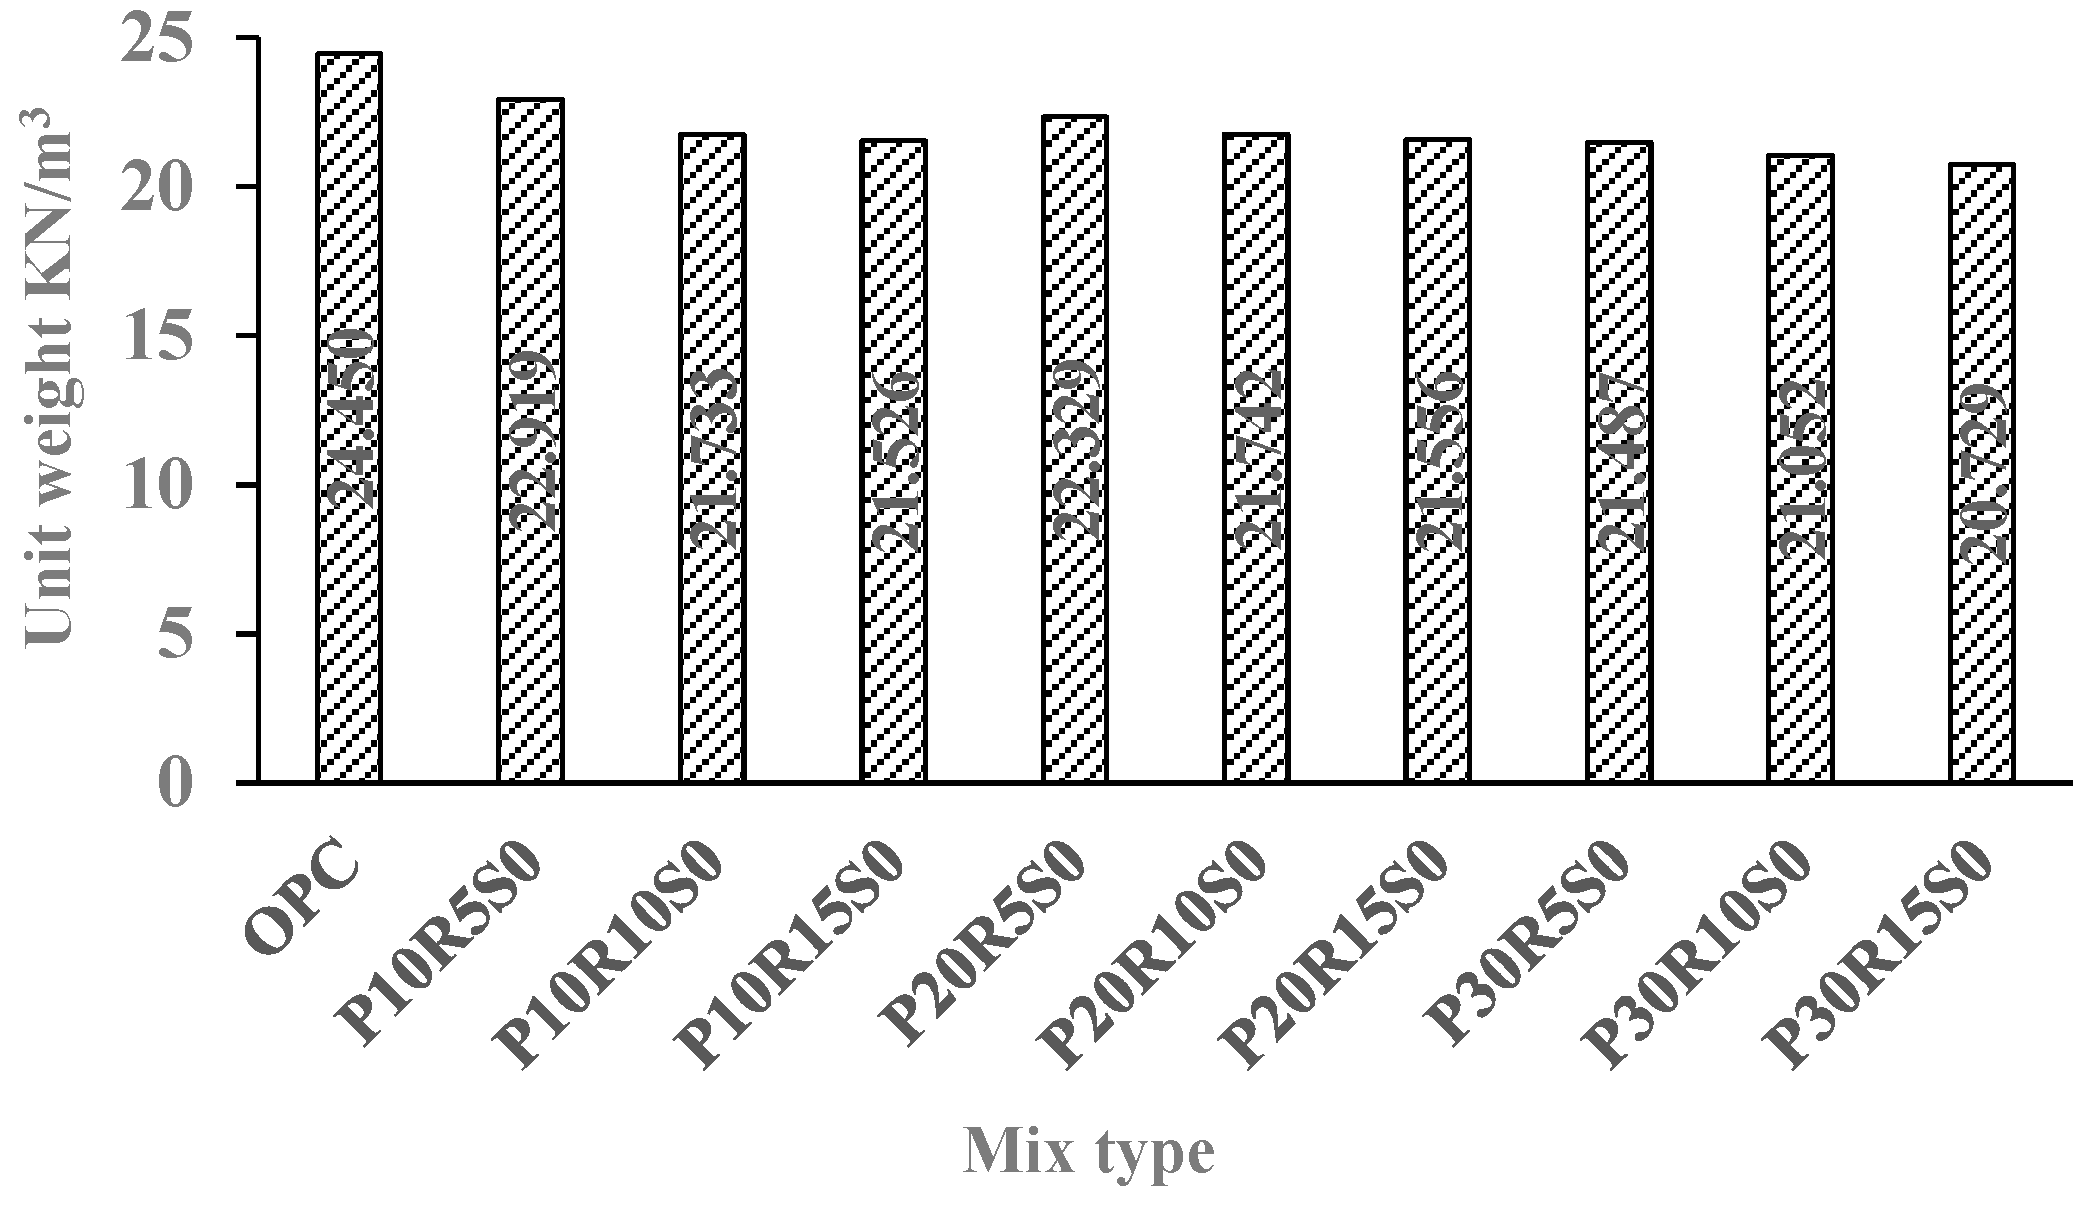
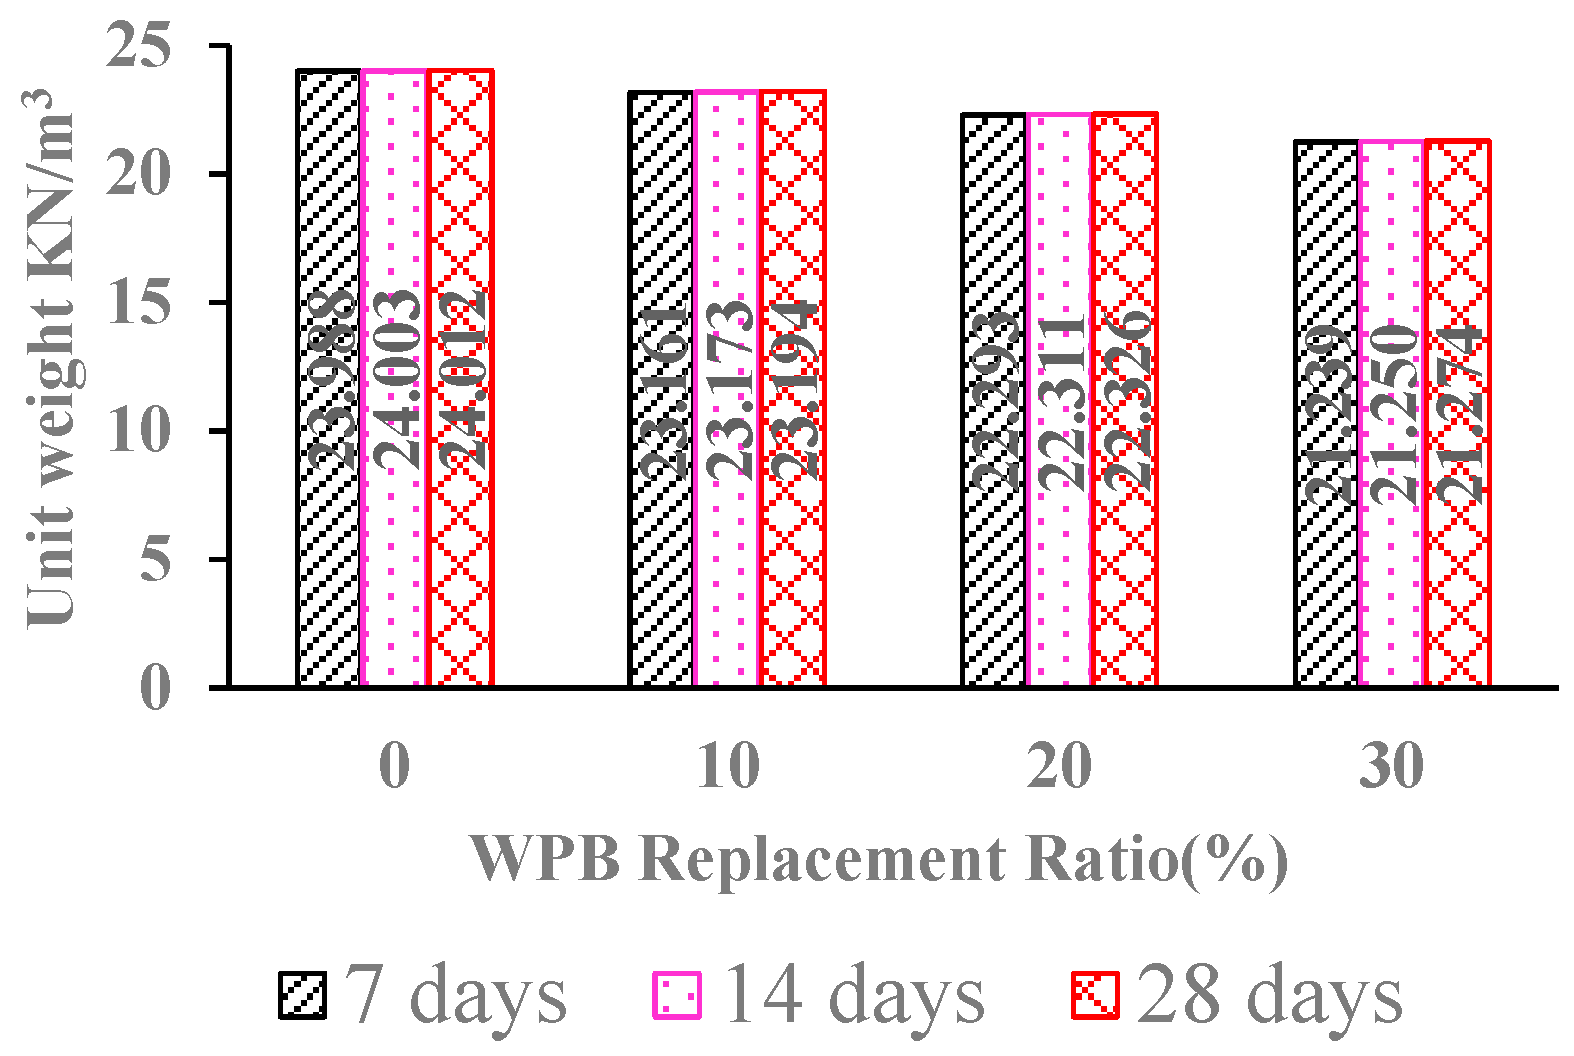
3.2. Unit Weight
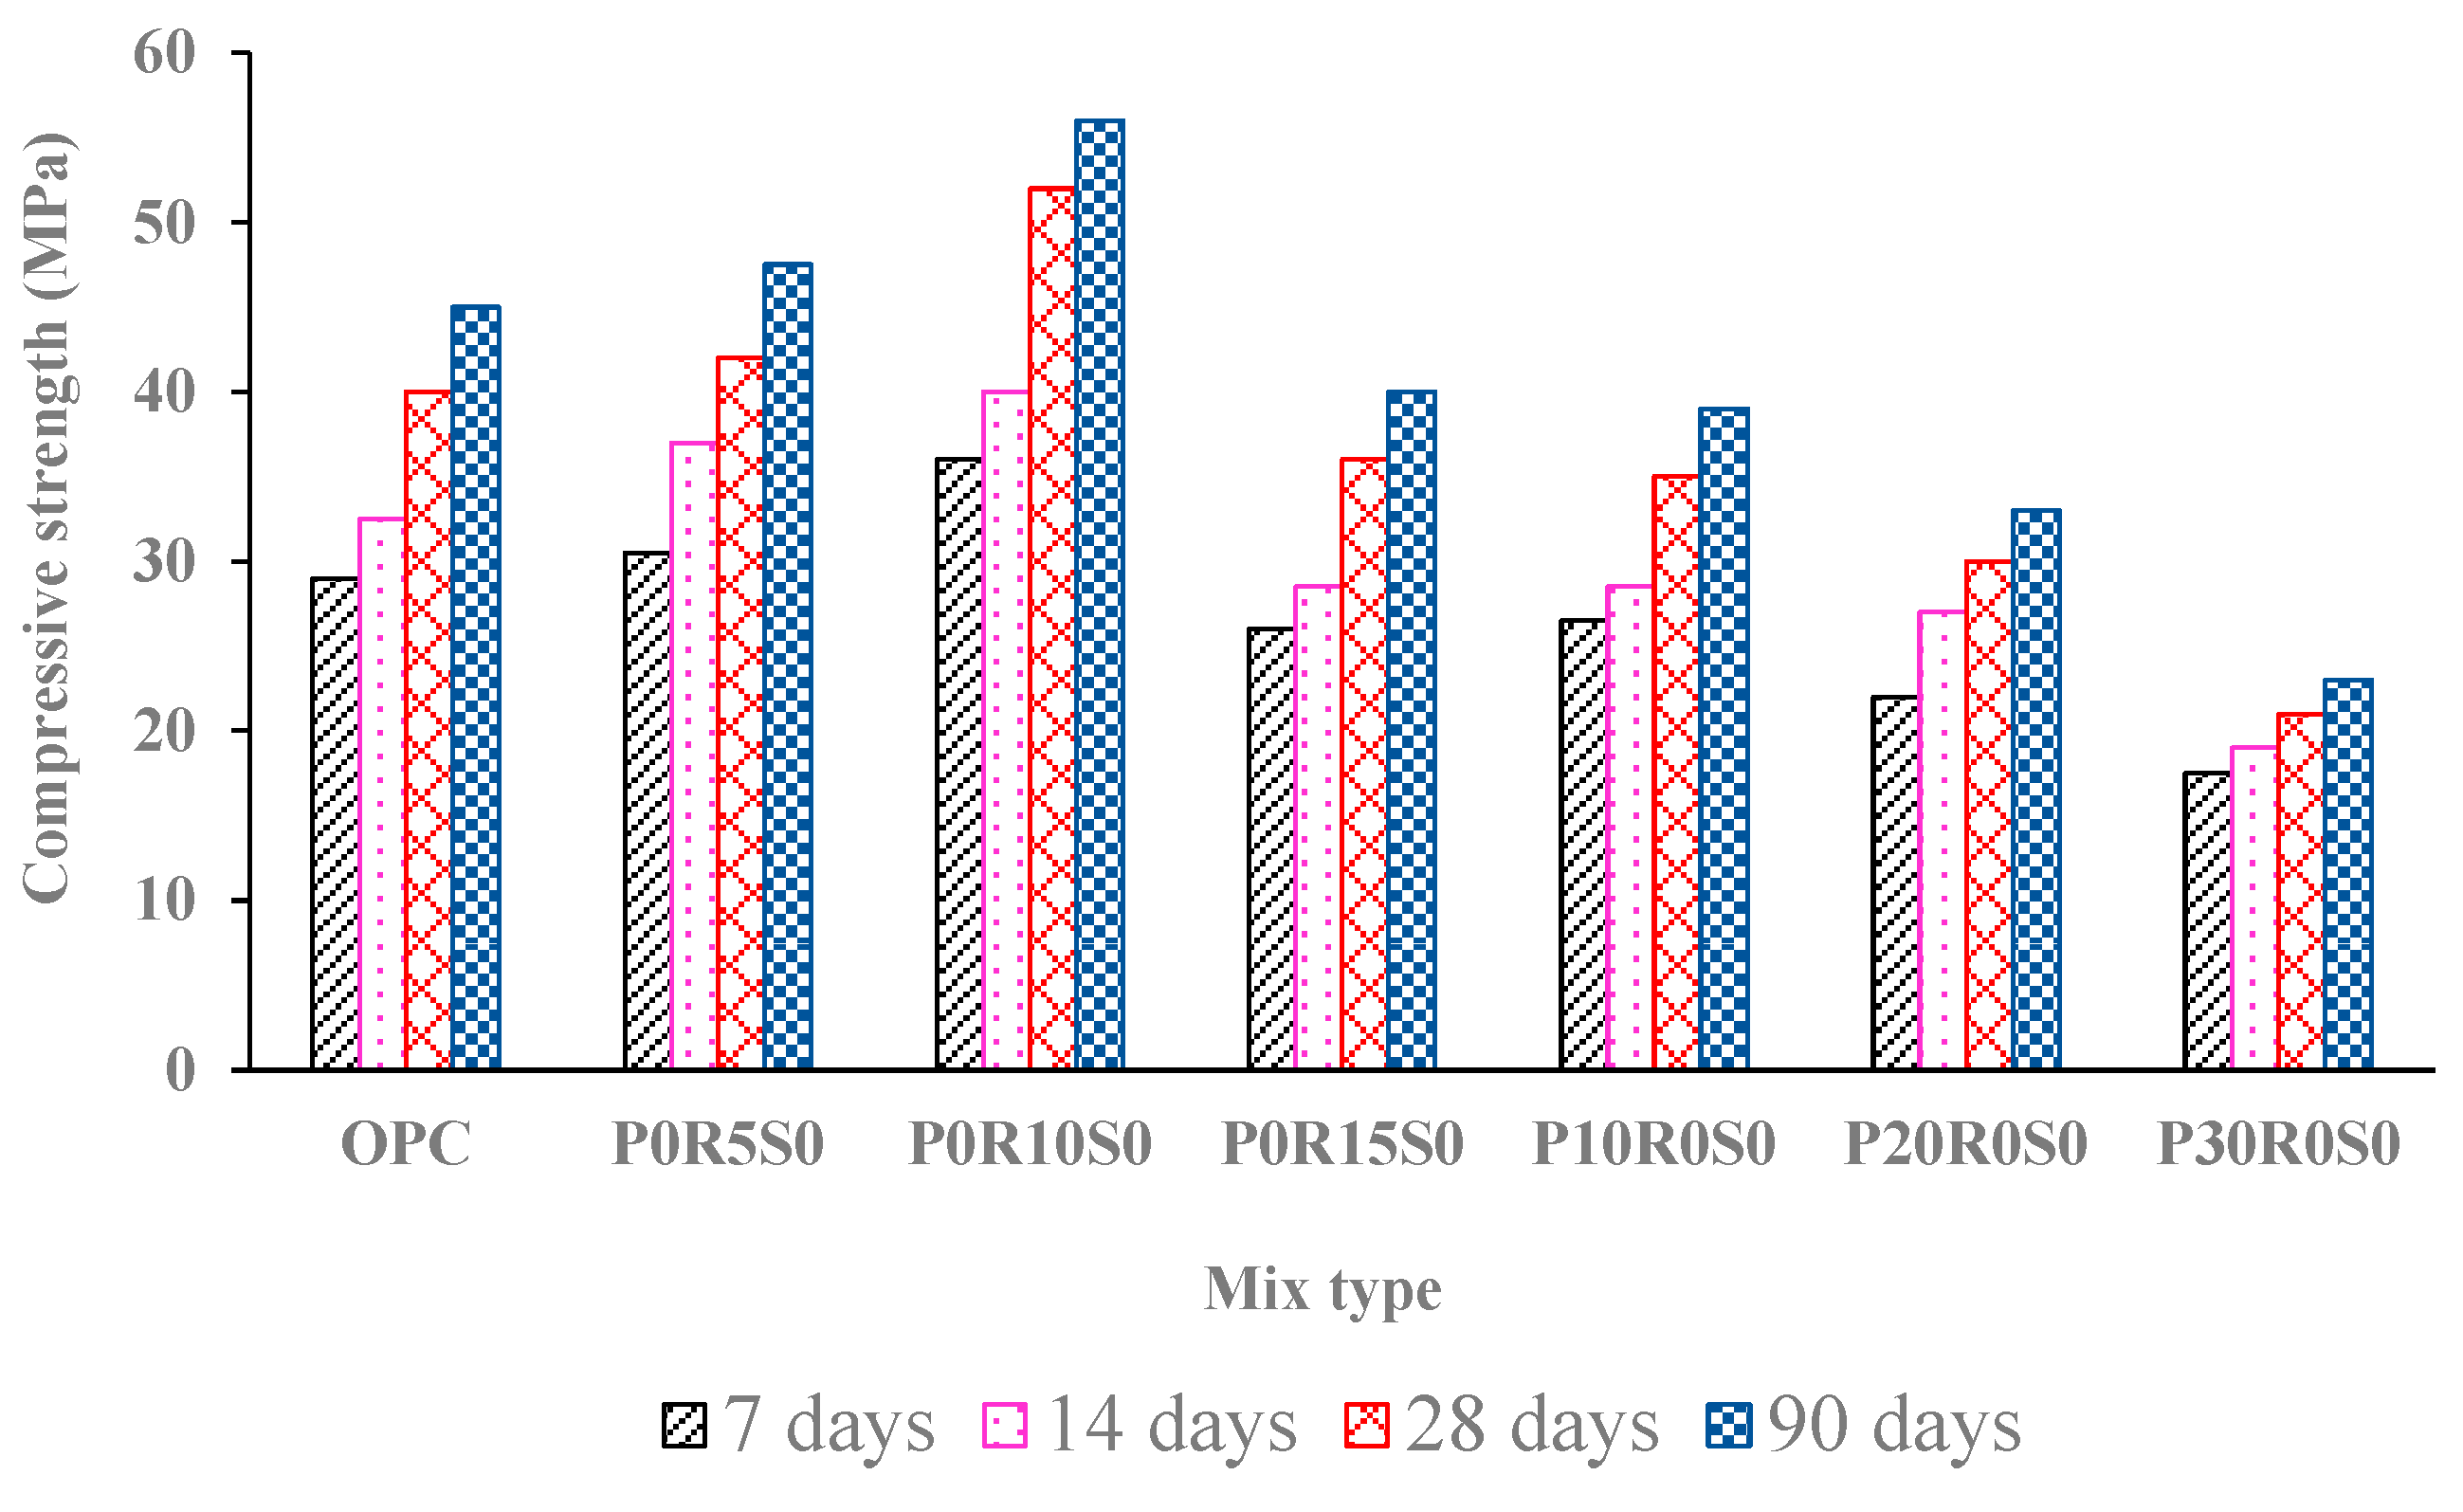
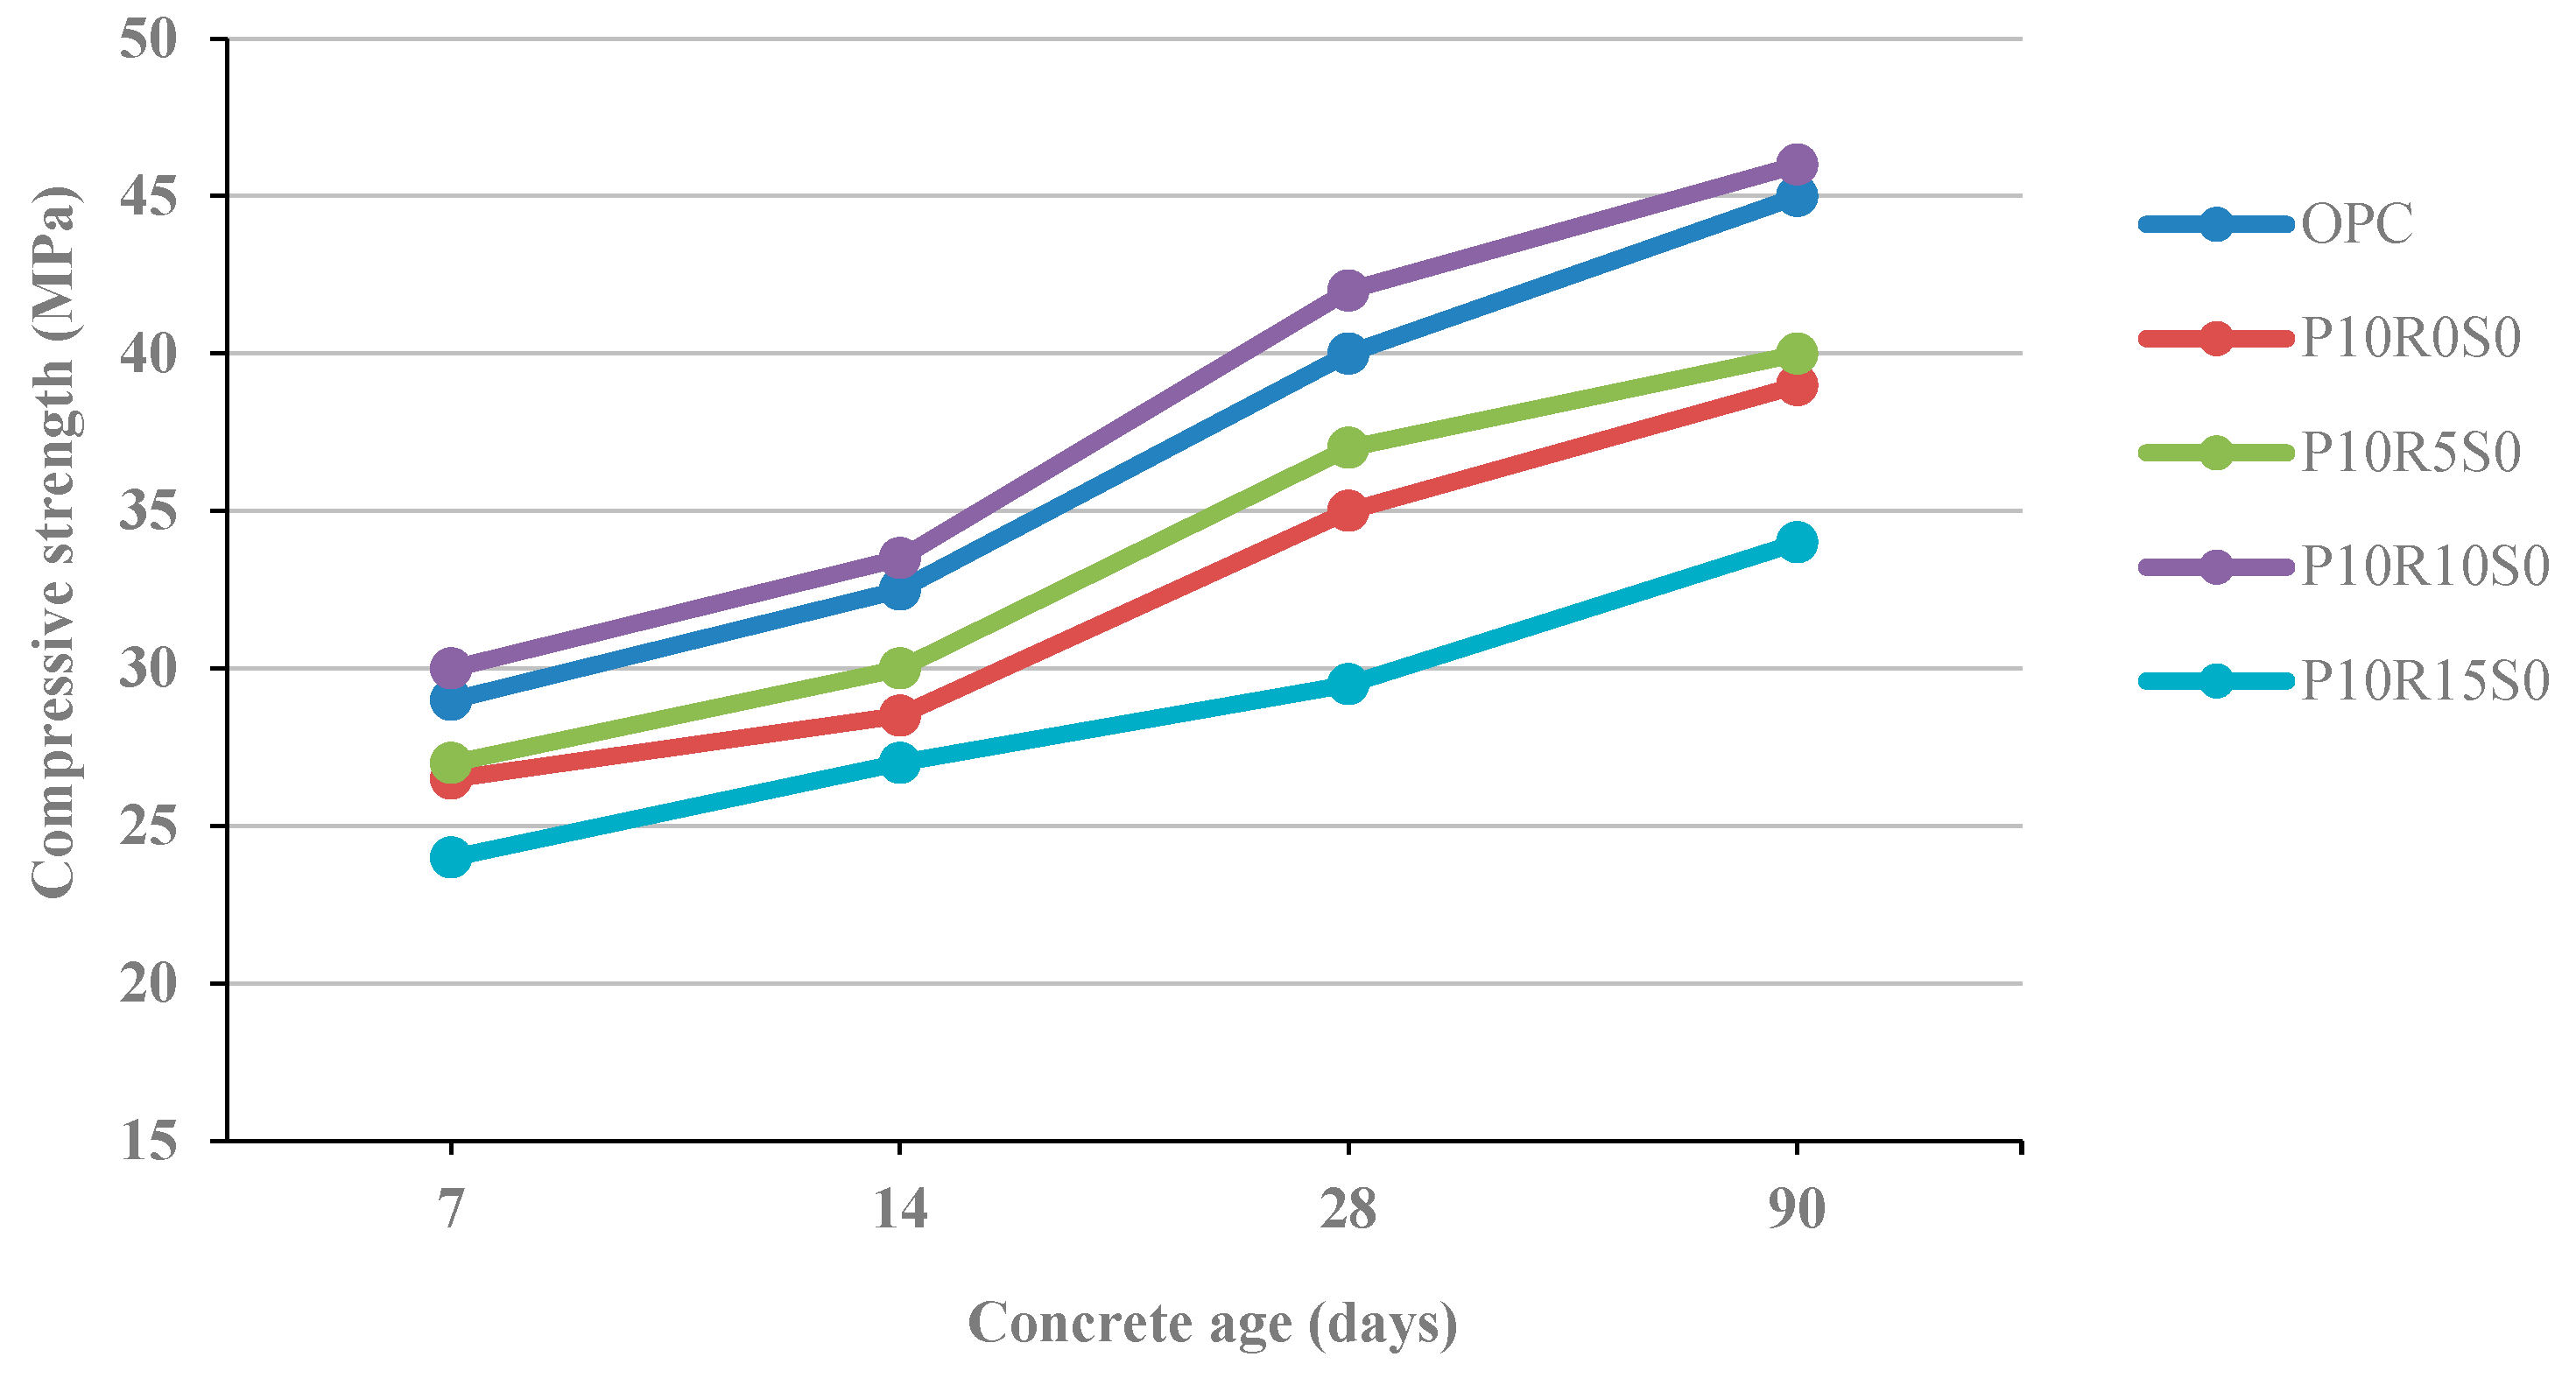
3.3. Compressive Strength
3.4. Splitting Tensile Strength
3.5. Water Permeability
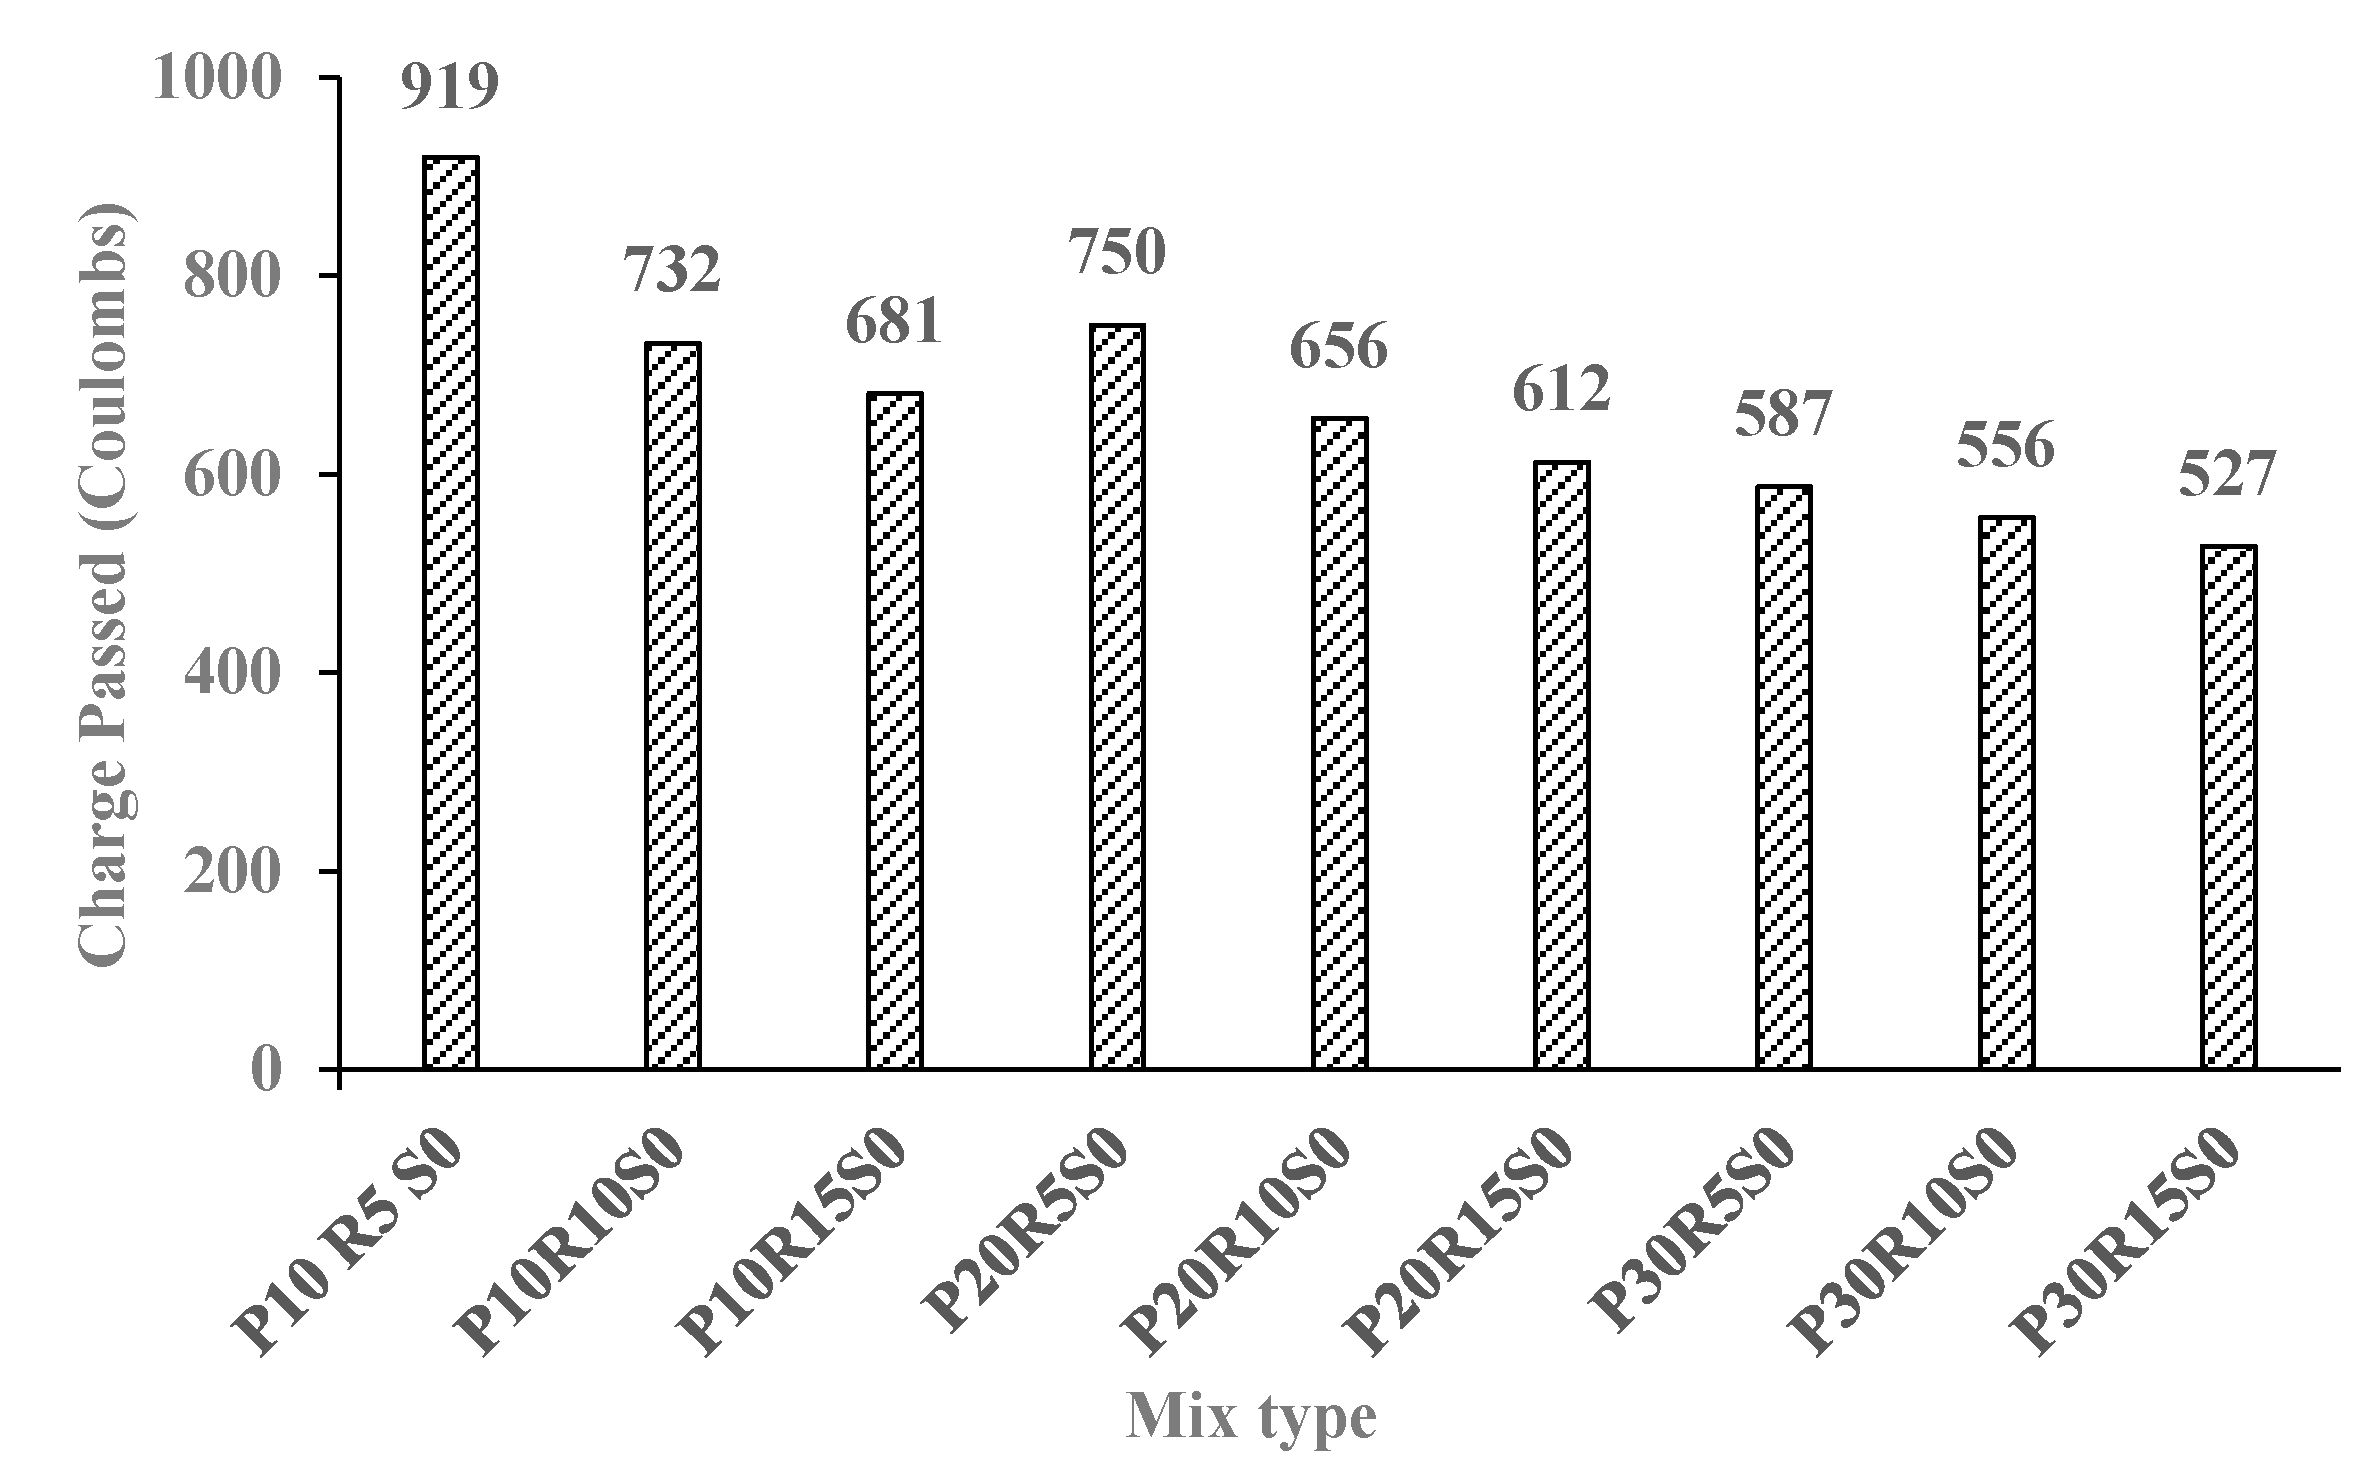
3.6. RCP
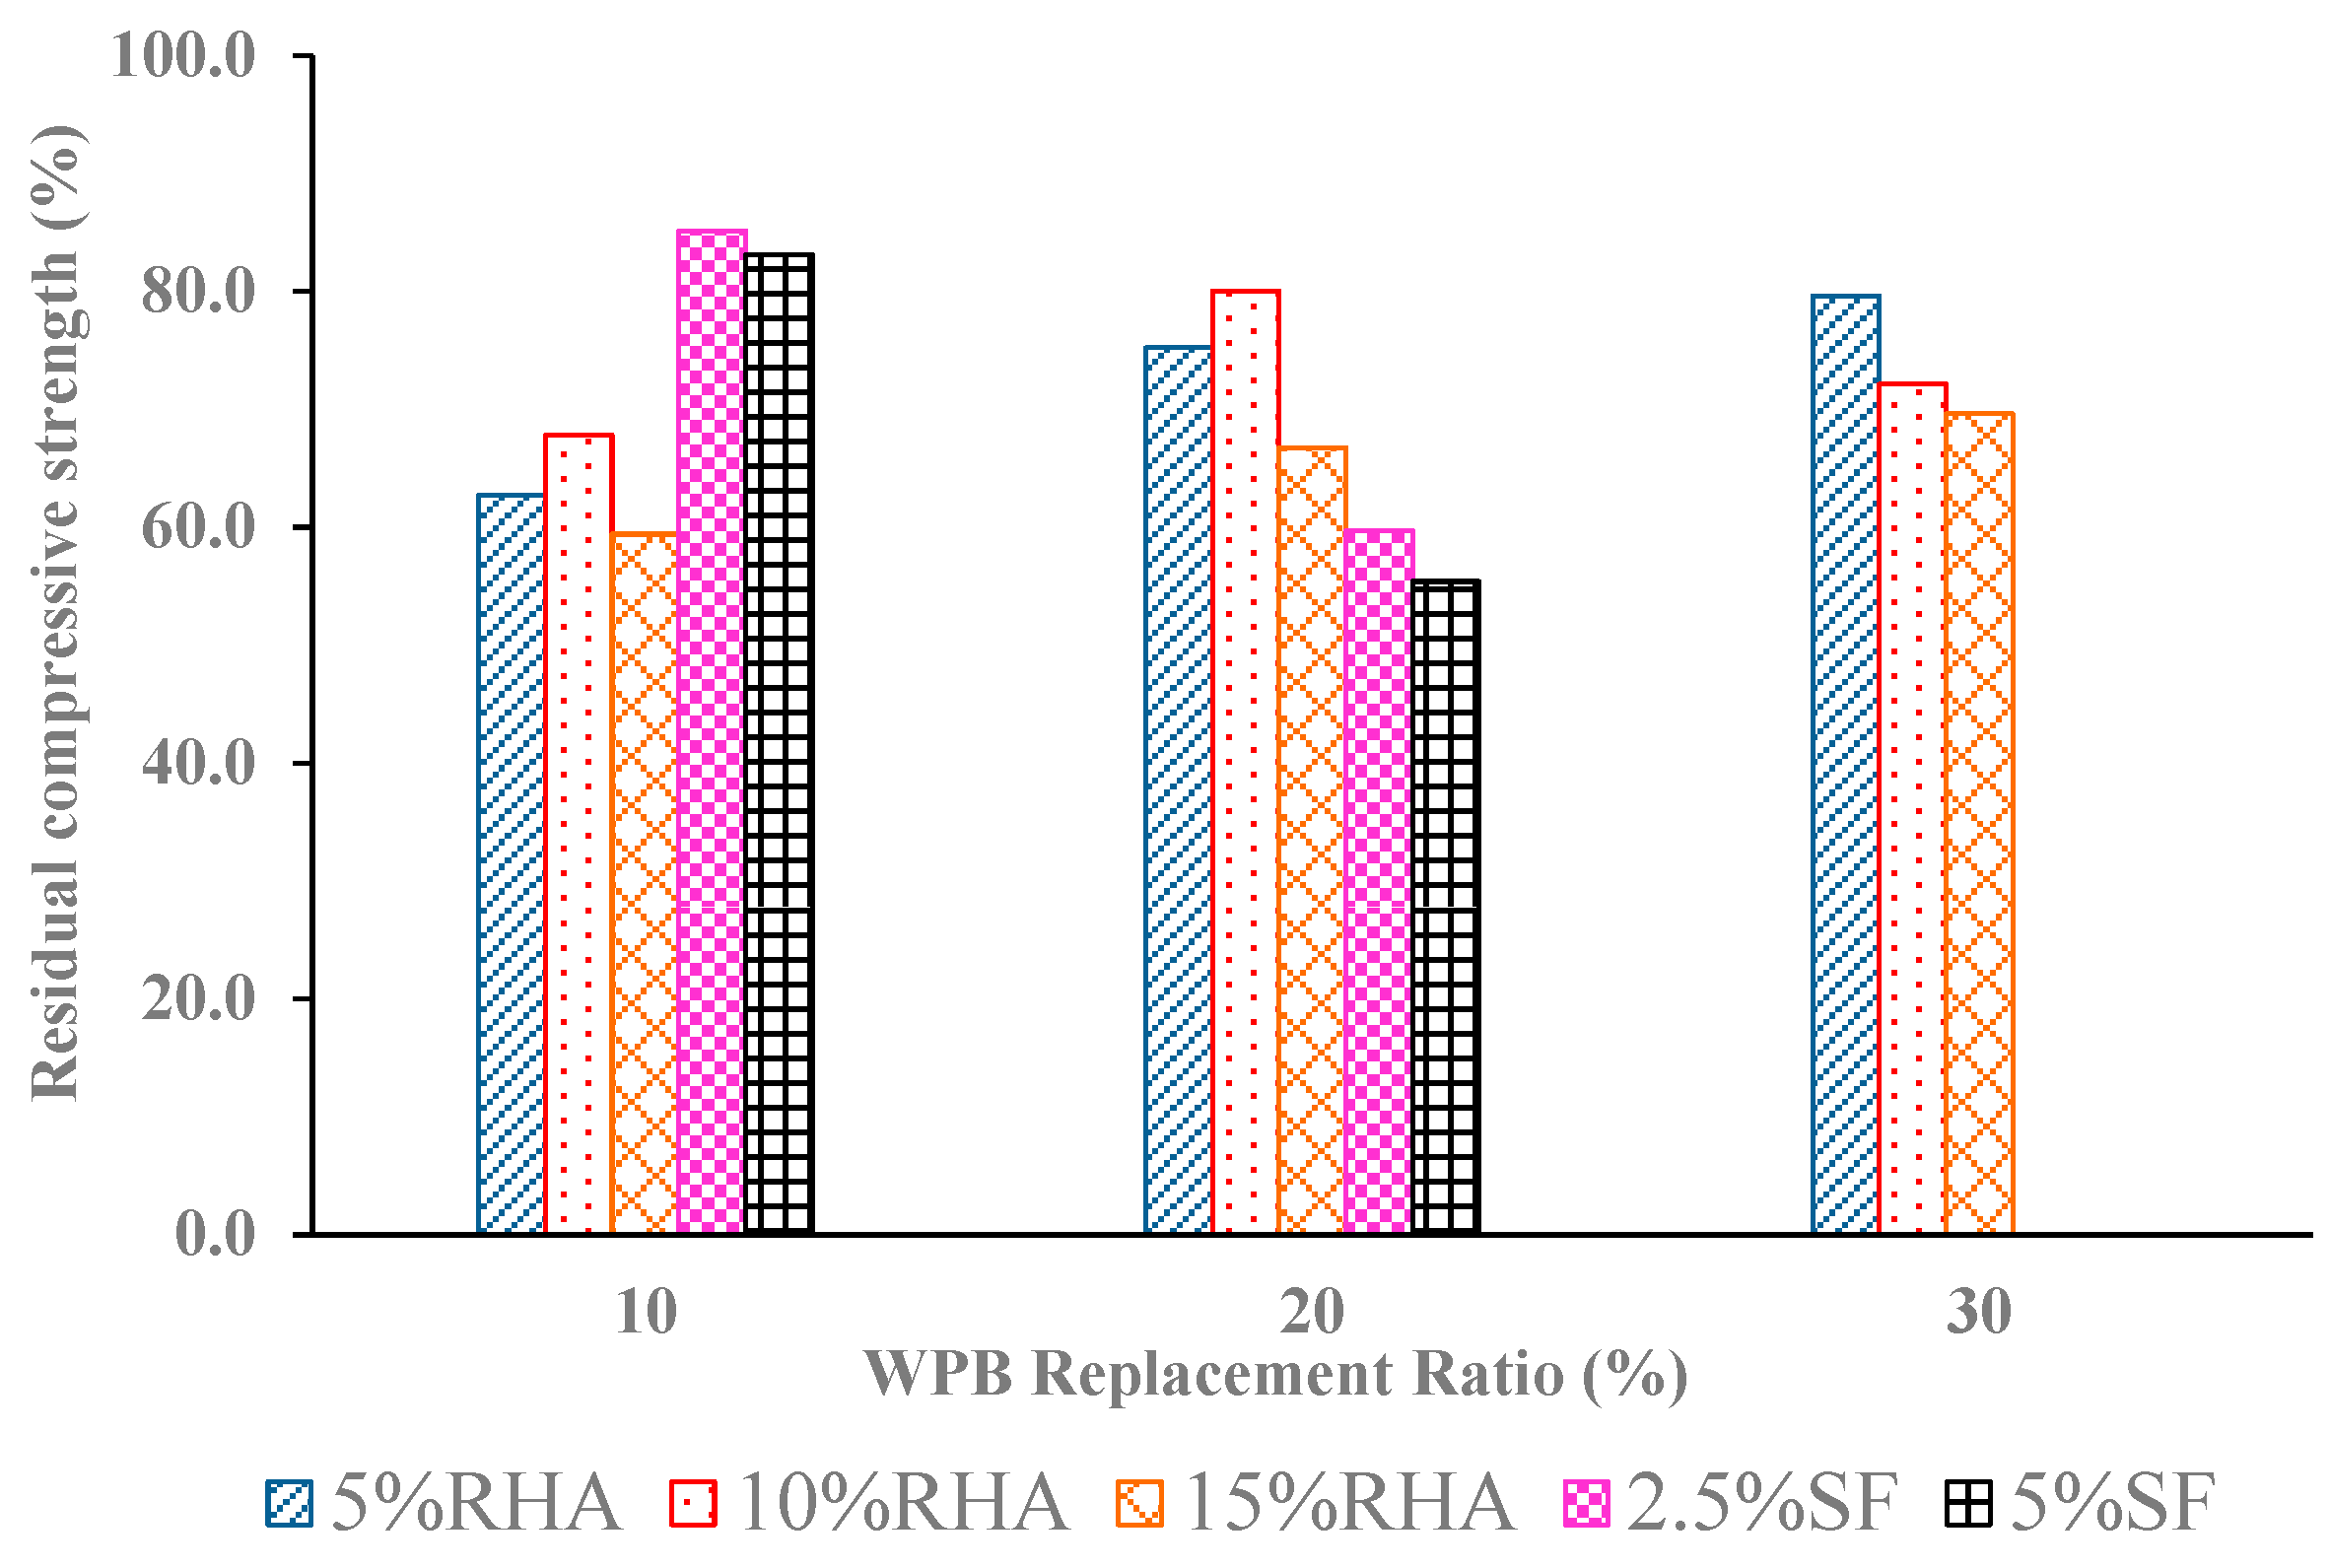
3.7. Fire Resistance
4. Conclusions
- The unit weight of the mixed concrete specimens varied between 24.0 and 20.3 KN/m3. Concrete could be classified as structural lightweight concrete up to a certain amount of WPB in the mixture. The unit weight values of fresh WPBC mixture decreased by 13% and 15% for mixes containing 30% WPB with 5% and 15% RHA replacement ratios, respectively. Mix P30R15S0, having 30% WPB with 15% RHA had the lowest dry unit weight (20.29 Kg/m3) after 28 days of curing.
- The flow-ability of fresh concrete, as noted by slump values, decreased with increasing WPB replacement ratios of 10–30%, which may also have a negative impact on the compressive strength of concrete. The low density and smooth surface of WPB caused segregation and improper cohesiveness, leading to a decline in workability. However, the flow-ability (252–171 mm) is still workable and complies with construction standards. Using RHA in WPBC caused a reduction in concrete workability (205–70 mm), but a slight increase in workability (260–242 mm) was recorded when using SF. Workability can be further enhanced by using suitable super-plasticizer amounts.
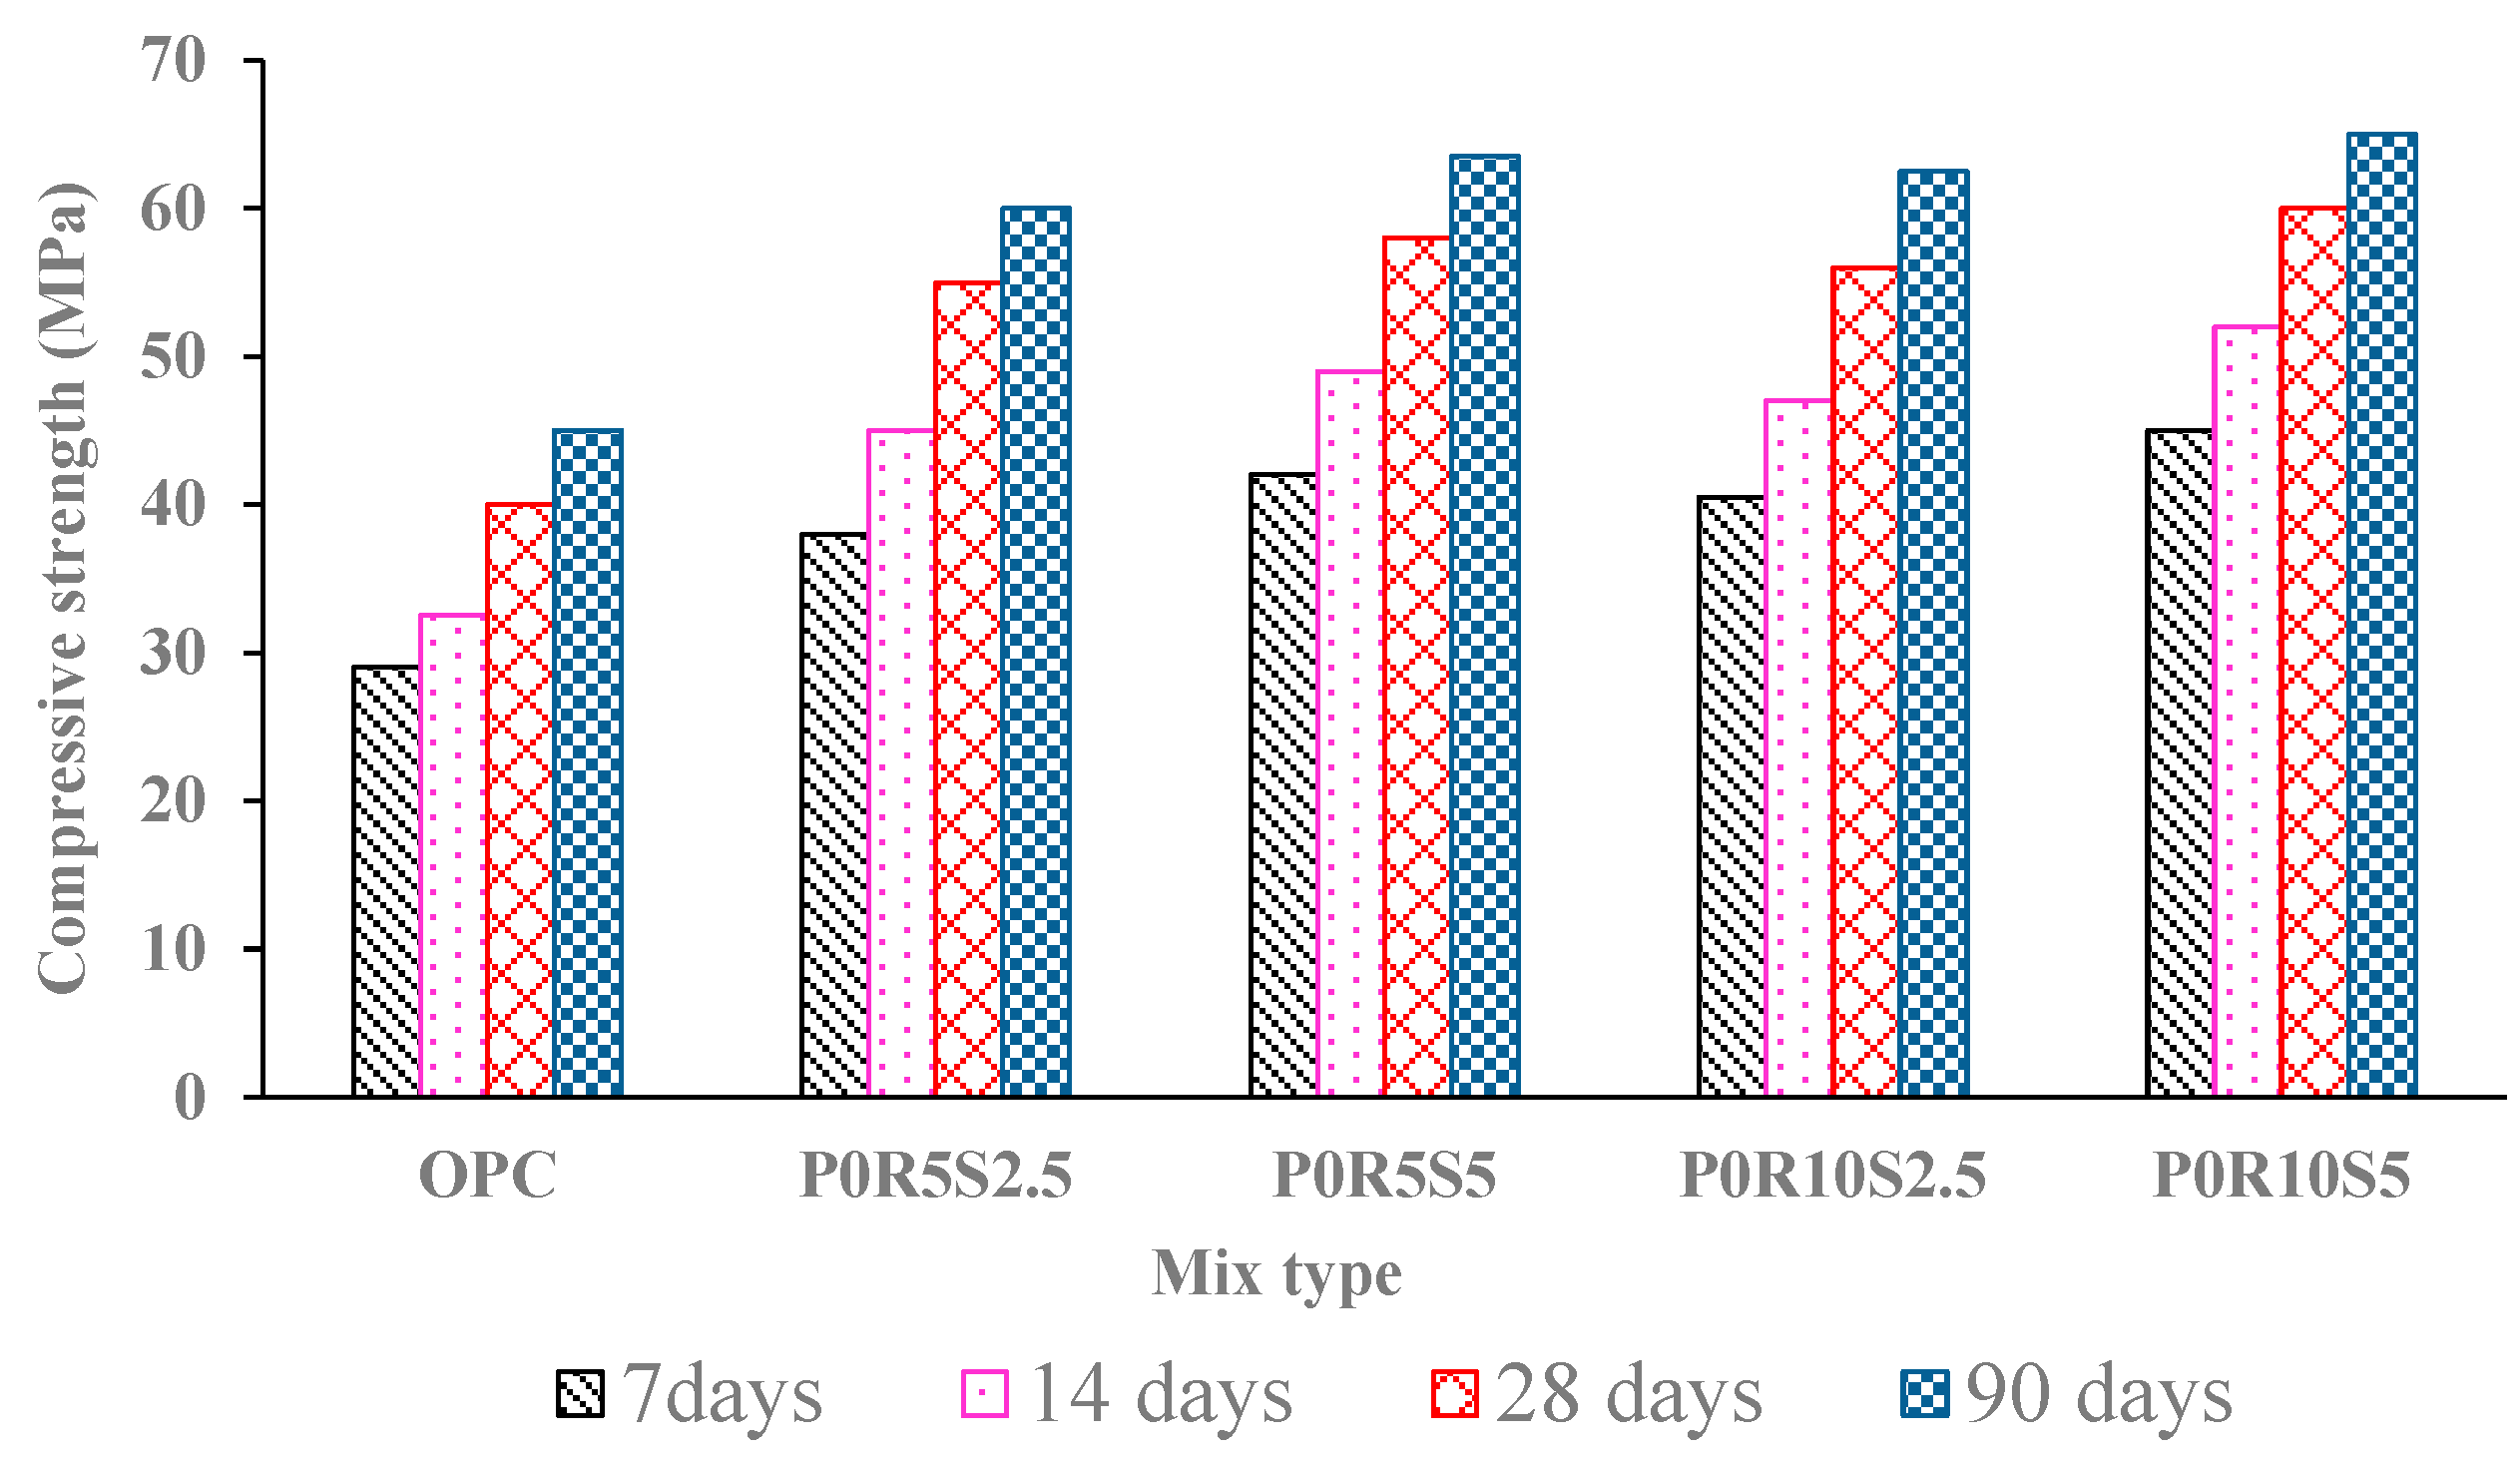
- As the proportion of WPB increased, the compressive strengths decreased but remained close to the reference control mix at 10% WPB. At 28 days, a fall in compressive strength between 13% and 48% for mixes containing 10% and 30% WPB, respectively, was recorded. For the 10% WPB of sand replacement in concrete, the 28-day compressive strength values were still in a reasonable range of 30 MPa. The lower values of WPBC compressive strength compared to control concrete may be attributed to the weaker interface between cement paste and WPB. However, the strength could be enhanced up to 42–37.5 MPa by incorporating RHA at certain replacement amounts or using a suitable mineral admixture such as silica fume. The optimum replacement ratios of WPB and RHA when incorporated together were 10% for both at a cement content of 400 Kg/m3. This mix (P10R10S0) exhibited even higher compressive strength than the control mix (OPC).
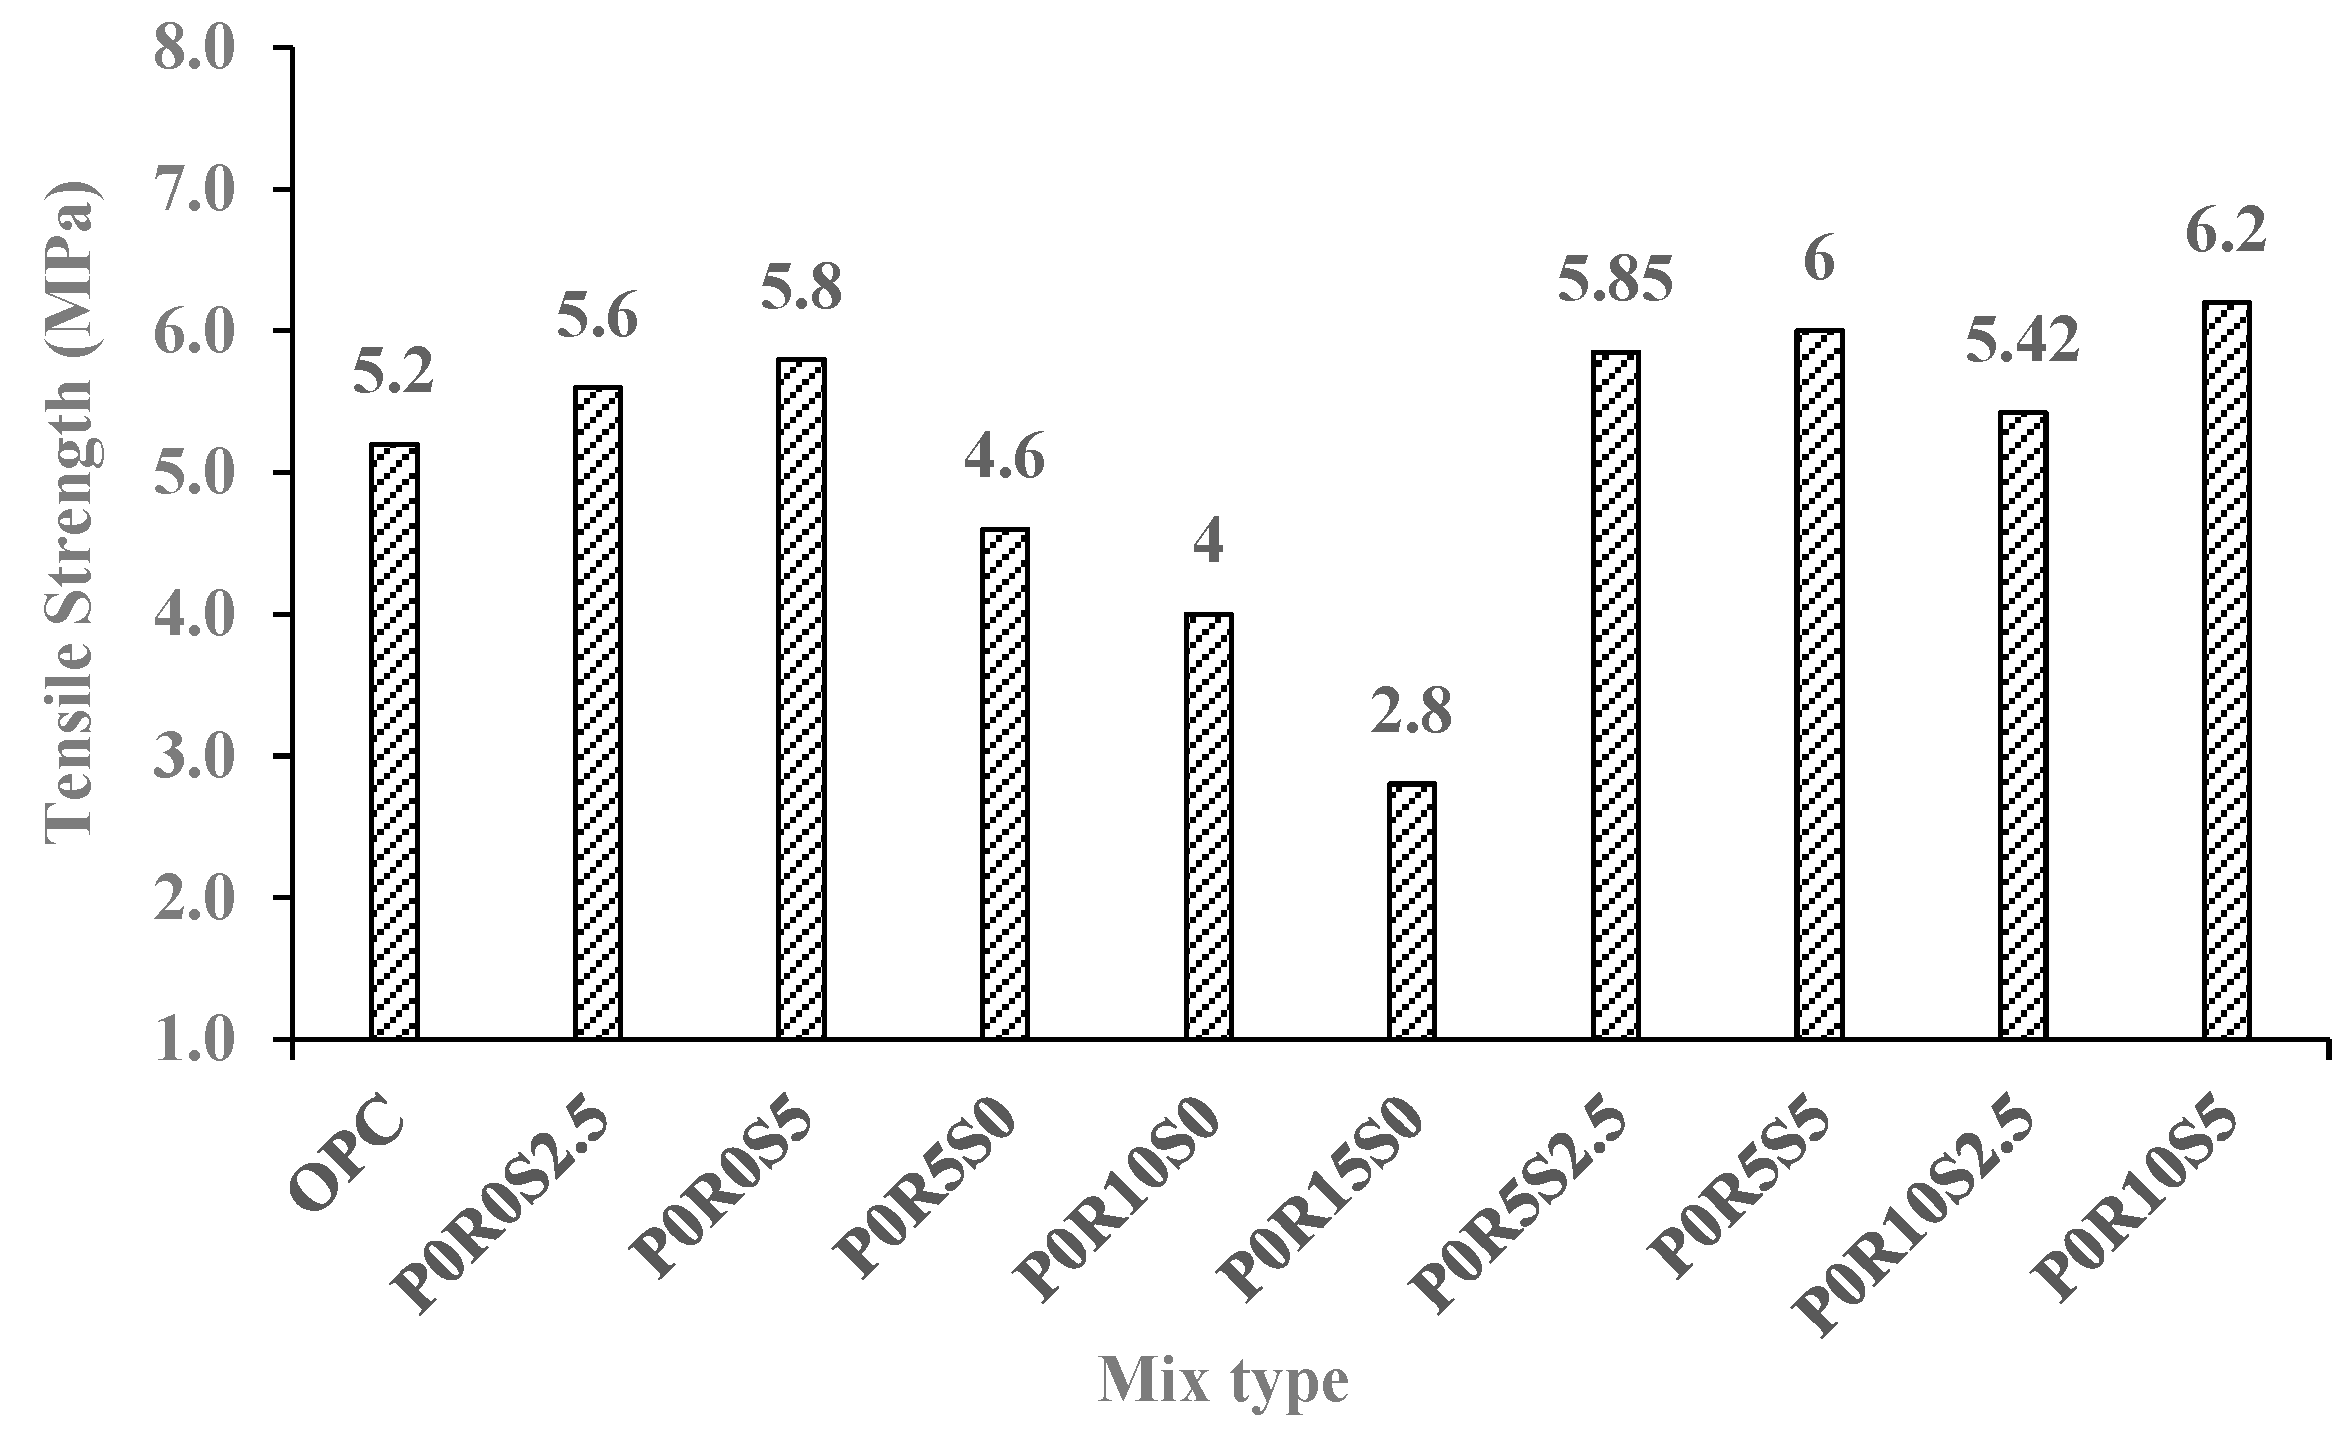
- The splitting tensile strength decreased as the replacement ratio of WPB increased. For replacement levels of 10%, 20%, and 30% WPB, the tensile strength was reduced by 31%, 46%, and 62%, respectively. Meanwhile, incorporating 10% RHA in the WPBC mix with 10% WPB lowered the reduction in tensile strength, which was recorded at 4.3 MPa compared with 5.2 MPa of the control mix, with only a 17% reduction in tensile strength.
- The reduction in tensile strength was more pronounced than the reduction in compressive strength for WPBC mixes, as the tensile strength is more sensitive to the interface bond strength between the cement base and the aggregates. This interface bond is weaker in the case of WPB in comparison with natural sand. This reduction was increased by increasing the WPB content when no pozzolanic admixture (RHA or SF) were used.
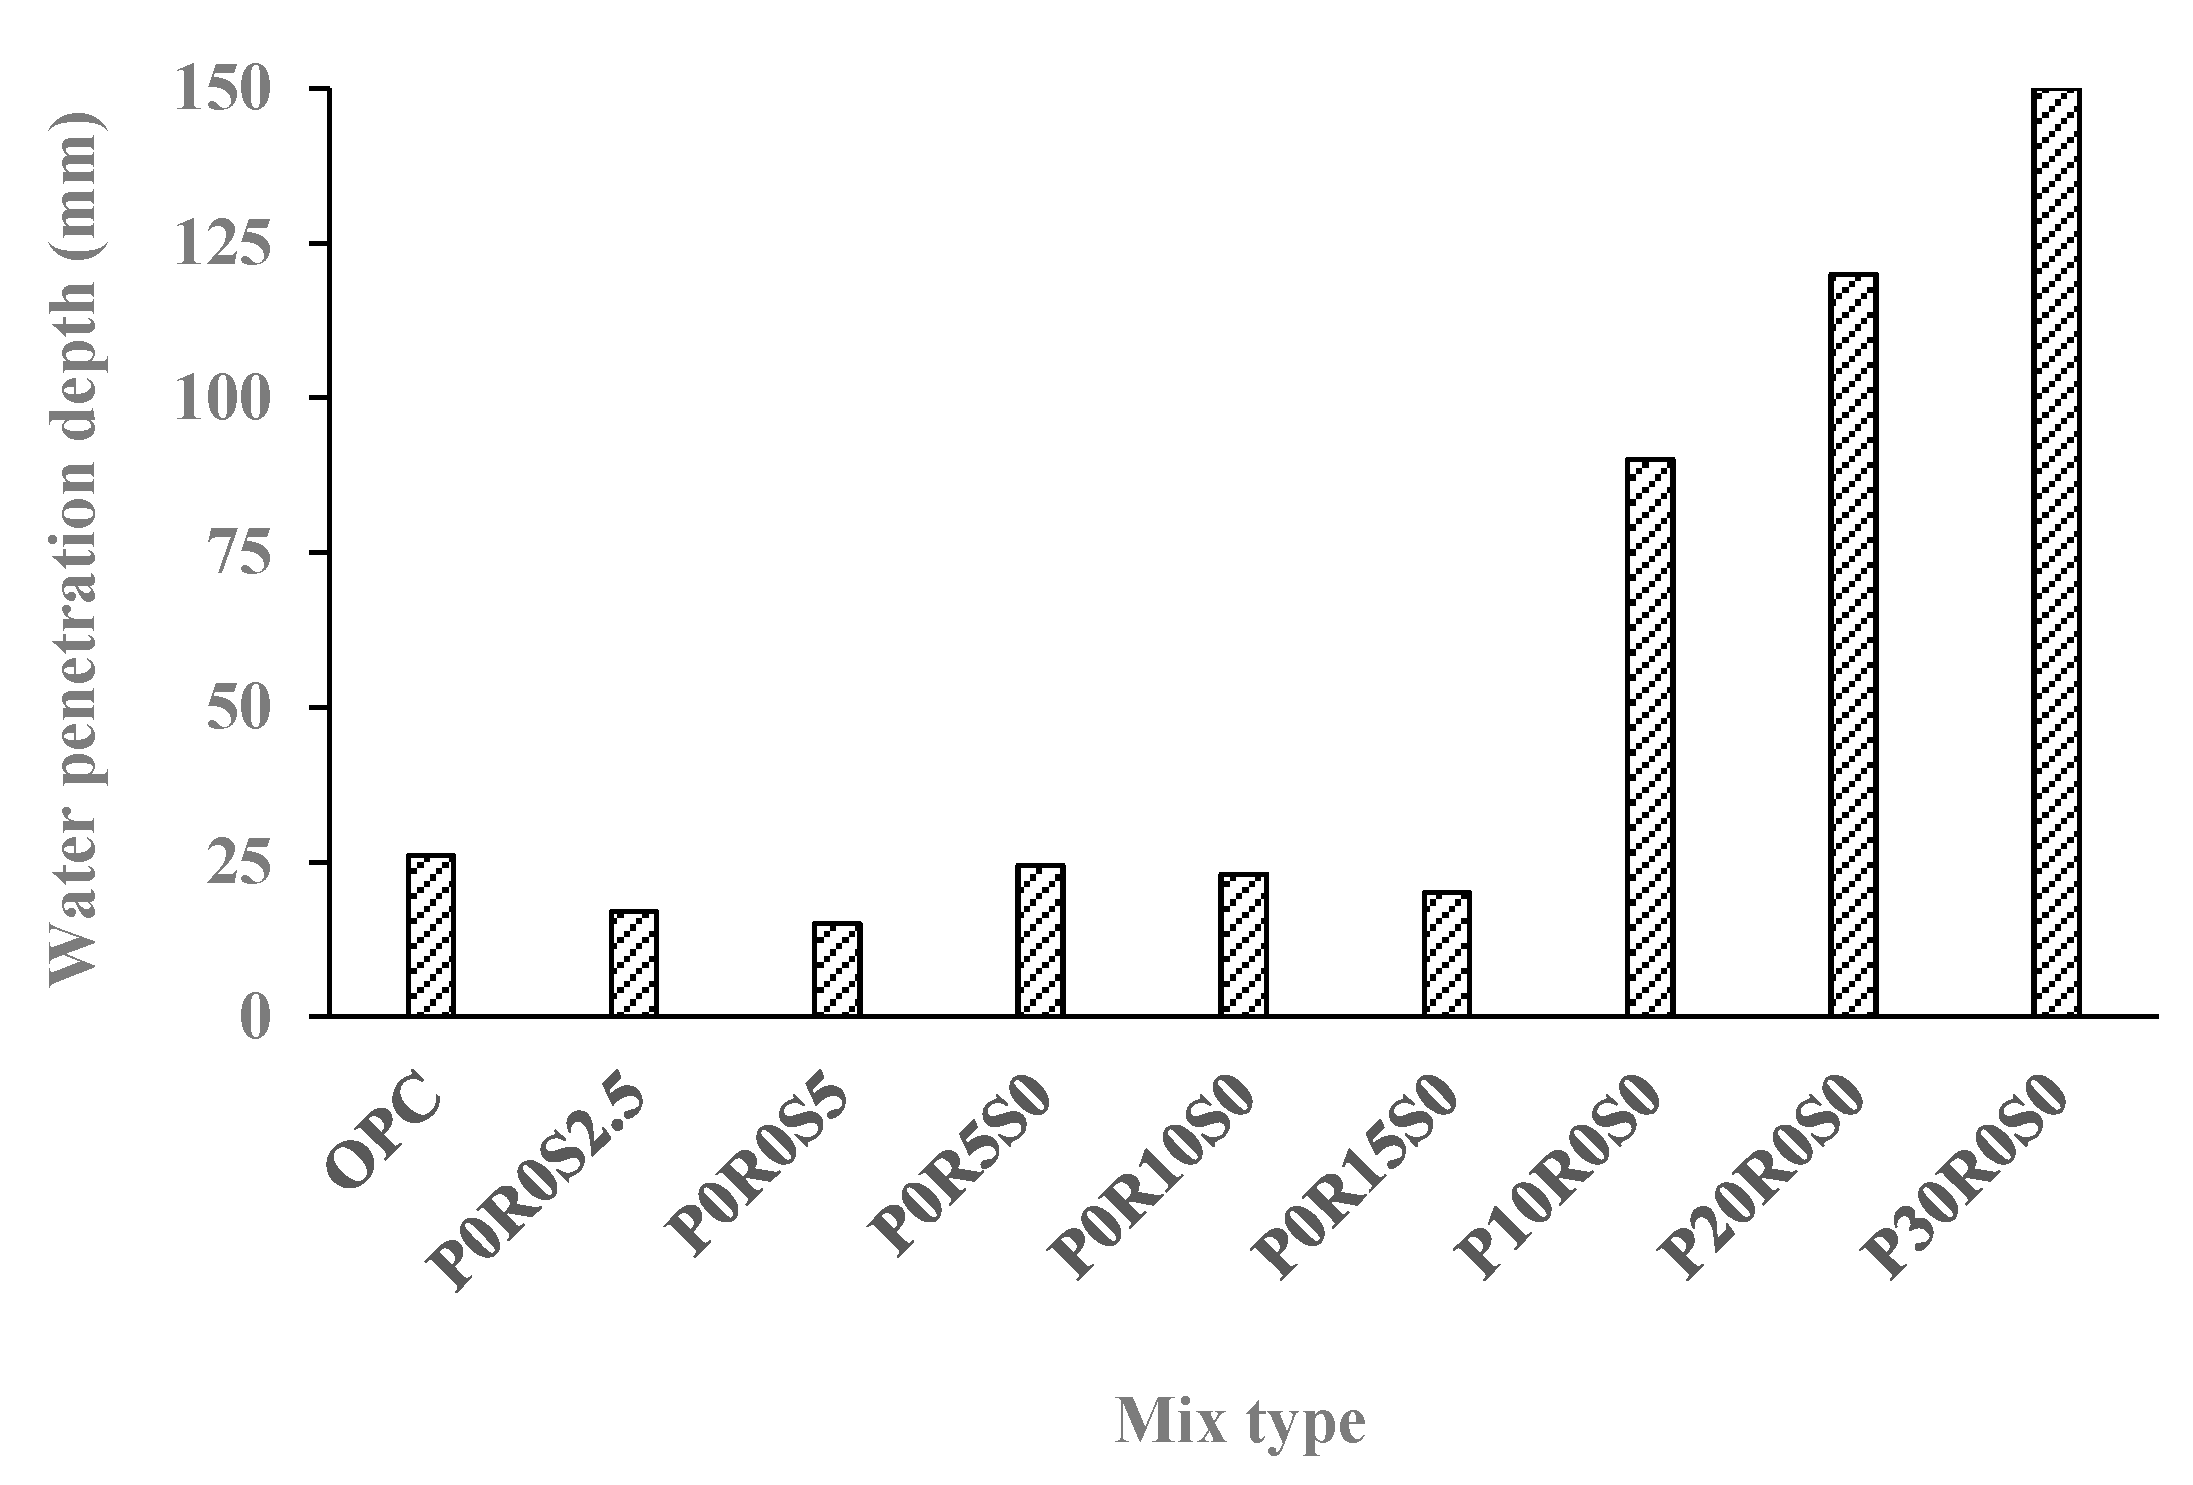
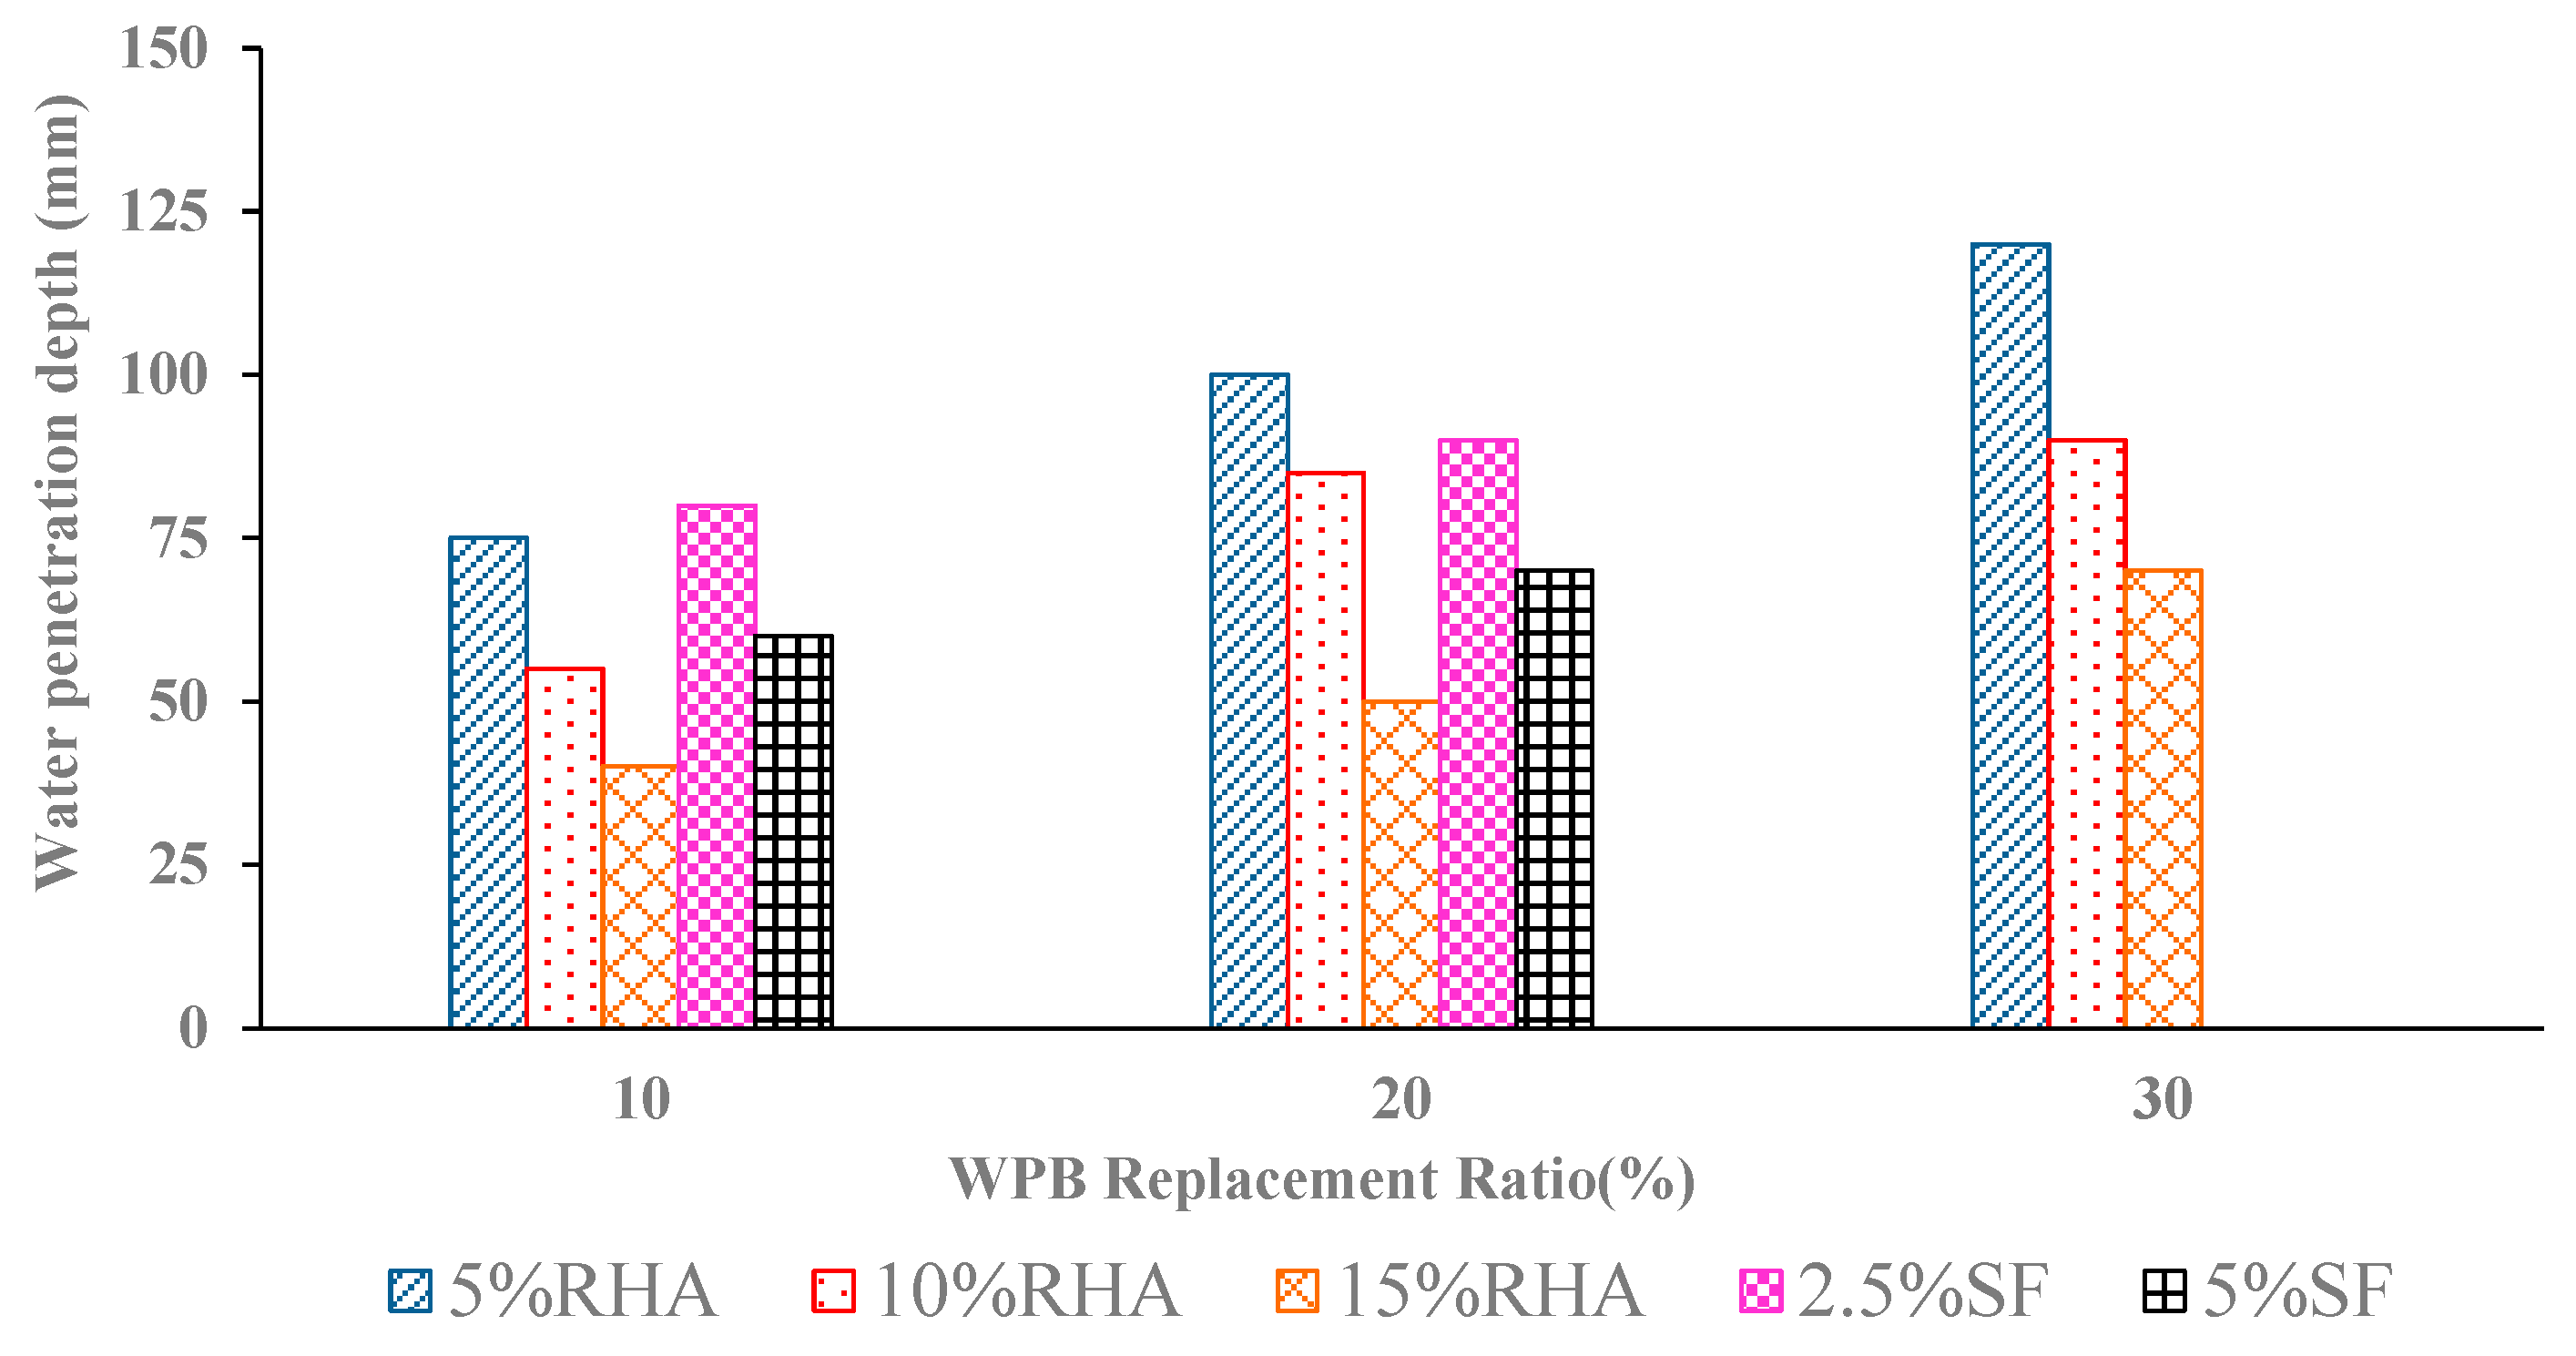
- Increasing the ratio of WPB as fine aggregate replacement increases the water permeability of concrete specimens. Utilizing WPB as a fine aggregate substitution in concrete forms relatively large gaps and voids that increase the water permeability of WPB concrete. Using 10–30% WPB increased the water penetration depth from 90 mm to 150 mm. Meanwhile, using 10% WPB with 15% RHA reduced the permeability of concrete by 55%, measured at a 40 mm water penetration depth.
- Using either RHA or SF as a partial replacement for cement reduced concrete permeability as they both had good pozzolanic action. The reaction of both admixtures, which have active silica and alumina, with the calcium hydroxide present in the cement hydrates created additional calcium silicate and aluminate hydrates that filled the voids in the concrete and reduced permeability.
- The simultaneous replacement of lightweight aggregate and cement by WPB and RHA, respectively, reduced chloride ion penetration. The 10% replacement of RHA had the least chloride penetration. Furthermore, concrete mixes with both RHA and WPB notably had the lowest chloride ion penetration and gave lower values of chloride penetration compared to the reference concrete mix OPC.
- Residual compressive strength values of concrete subjected to elevated temperatures are higher in WPBC mixes than in the reference control concrete mix, up to a 10% replacement ratio in WPB. However, the incorporation of 15% RHA in WPBC mixes with 10%, 20%, and 30% contents exhibited higher residual compressive strengths than the concrete control mix. Strength loss increased as the amount of WPB increased.
Author Contributions
Funding
Data Availability Statement
Conflicts of Interest
References
- Abdel Tawab, O.F.; Amin, M.R.; Ibrahim, M.M.; Abdel Wahab, M.; Abd El Rahman, E.N.; Hassanien, R.H.; Hatem, M.H.; Ghaly, A.E.C. Recycling waste plastic bags as a replacement for cement in production of building bricks and concrete blocks. J. Waste Resour. Recycl. 2020, 1, 202. [Google Scholar]
- Laura Maria Diaz Ospina, M.S. Behavioral analysis of single-use plastic consumption in Cairo. Proc. Int. Conf. Contemp. Aff. Archit. Urban.-ICCAUA 2020, 5, 327–342. [Google Scholar]
- Eva Touhey, M.S. The Influence of Plastic Bag Bans on Pro-Environmental Behaviors in Rhode Island Coastal Communities; University of Rhode Island: South Kingstown, RI, USA, 2019. [Google Scholar]
- Rhian Tough, M.S. Plastic Shopping Bags: Environmental Impacts and Policy Options. Master’s Thesis, Victoria University of Wellington, Wellington, New Zealand, 2007. [Google Scholar]
- Kidie, E. Community’s Perception of Utilization and Disposal of Plastic Bags. Ph.D. Thesis, University of Gondar, Gondar, Ethiopia, 2019. [Google Scholar]
- El Safty, A.M.K. Environmental and health impact of open burning rice straw. Egypt. J. Occup. Med. 2020, 43, 679–708. [Google Scholar]
- Khan, R.; Jabbar, A.; Khan, W. Reduction in environmental problems using rice-husk ash in concrete. Constr. Build. Mater. 2012, 30, 360–365. [Google Scholar] [CrossRef]
- Suhendro, B. Toward green concrete for better sustainable environment. J. Procedia Eng. 2014, 95, 305–320. [Google Scholar] [CrossRef]
- Irin, N.A.; Arju, J.O.; Sakib, F.S.; Ishmam, S.A.S.; Arnob, A.R. A Case Study on Air Pollution in Cement Industry; Bangladesh University: Dhaka, Bangladesh, 2020. [Google Scholar]
- Mudeme, L. Cement Production and Greenhouse Gas Emission: Implications for Mitigating Climate Change. Master’s Thesis, University of Witwatersrand, Johannesburg, South Africa, 2008. [Google Scholar]
- Almeshal, I.; Tayeh, B.A.; Alyousef, R.; Alabduljabbar, H.; Mustafa Mohamed, A. Eco-friendly concrete containing recycled plastic as partial replacement for sand. J. Mater. Res. Technol. 2020, 9, 4631–4643. [Google Scholar] [CrossRef]
- Farzampour, A. Compressive Behavior of Concrete under Environmental Effects. Available online: https://www.intechopen.com/ (accessed on 27 April 2023).
- Chalangaran, N.; Farzampour, A.; Paslar, N.; Fatemi, H. Experimental investigation of sound transmission loss in concrete containing recycled rubber crumbs. Adv. Concr. Constr. 2021, 11, 447–454. [Google Scholar]
- Chalangaran, N.; Farzampour, A.; Paslar, N. Nano Silica and Metakaolin Effects on the Behavior of Concrete Containing Rubber Crumbs. CivilEng 2020, 1, 264–274. [Google Scholar] [CrossRef]
- Mansouri, I.; Shahheidari, F.S.; Hashemi, S.M.A.; Farzampour, A. Investigation of steel fiber effects on concrete abrasion resistance. Adv. Concr. Constr. 2020, 9, 367–374. [Google Scholar]
- Farzampour, A. Temperature and humidity effects on behavior of grouts. Adv. Concr. Constr. 2017, 5, 659–669. [Google Scholar]
- Cn Burak, S.; Gezer, E.; Kocaman, I. Effects of organic waste (rice husk) on the concrete properties for farm buildings. Bulg. J. Agric. Sci. 2011, 17, 40–48. [Google Scholar]
- Ghernouti, Y.; Rabeni, B.; Safi, B.; Chaid, R. Use of recycled plastic bag waste in concrete. J. Int. Sci. Mater. Technol. 2014, 8, 480–487. [Google Scholar]
- Sadiq, M.M.; Khattab, M.R. Literature review on different plastic waste materials use in concrete. J. Emerg. Technol. Innov. Res. 2015, 6, 2349–5162. [Google Scholar]
- Jain, A.; Siddique, S.; Gupta, T.; Sharma, R.K.; Chaudhary, S. Utilization of shredded waste plastic bags to improve impact and abrasion resistance of concrete. Environ. Dev. Sustain. 2020, 22, 337–362. [Google Scholar] [CrossRef]
- Baboo Rai, S.; Tabin, R.; Bhavesh, K.; Duggal, S.K. Study of waste plastic mix concrete with plasticizer. J. ISRN Civ. Eng. 2012, 2012, 469272. [Google Scholar]
- Zahedi, M.; Ramezanianpour, A.A.; Ramezanianpour, A.M. Evaluation of the mechanical properties and durability of cement mortars containing nanosilica and rice husk ash under chloride ion penetration. Constr. Build. Mater. 2015, 78, 354–361. [Google Scholar] [CrossRef]
- Abd El-Hameed, M.; Bakr, M.; Osama, M.; Al Hariri, R.; El Din Amr, A.G.; Ramy, Z.M. A Study on Properties of Self-Compacting Concrete Incorporating Multi-System Blended Mineral Admixtures; University of Benha: Banha, Egypt, 2017. [Google Scholar]
- Javier, A.R.A.; Lopez, N.E.; Juanzon, J.B.P. Compressive strength and chloride penetration tests of modified type IP cement concrete with rice ash. J. Procedia Eng. 2017, 171, 543–548. [Google Scholar] [CrossRef]
- Marakovčić, S.; Bede, N.; Ušić, I. Analysis of chloride penetration into high performance concrete. Pomorski Zbornik 2020, 3, 295–305. [Google Scholar]
- Larissa, D.; Kirchhof, A.L.; Luiz Carlos, P.; Silva, F. Assessment of concrete residual strength at high temperatures using ultrasonic pulse velocity. e-J. Nondestruct. Test. 2015, 20, 1–9. [Google Scholar]
- Pertiwi, N.; Ahmed, I.A.; Anny, S.N. Analysis residual strength of post fire concrete. Asian J. Appl. Sci. 2017, 5, 602–607. [Google Scholar]


| Chemical Composition (%) | |||
|---|---|---|---|
| Constituents | Cement | SF | RHA |
| Fe2O3 | 3.55 | 0.45 | 0.24 |
| CaO | 61.60 | 0.16 | 1.31 |
| MgO | 1.90 | 0.26 | - |
| Al2O3 | 5.20 | 0.25 | 0.51 |
| SiO2 | 19.14 | 96.81 | 87.50 |
| Na2O | 0.45 | 0.14 | 1.22 |
| K2O | 0.20 | 0.28 | 3.31 |
| SO3 | 3.17 | 0.14 | 1.72 |
| CI− | 0.085 | 0.030 | 0.053 |
| LOI | 2.88 | 1.30 | 3.05 |
| Physical Properties | |||
| Specific gravity | 3.15 | 2.40 | 2.05 |
| Blaine (cm2/g) | 3320 | 209,600 | 17,960 |
| Mechanical properties (Compressive strength MPa) | |||
| 2 days | 25.20 | - | - |
| 28 days | 55.10 | - | - |
| Sand | WBP | |
|---|---|---|
| Apparent density (g/cm3) | 1.45 | 0.53 |
| Specific gravity (g/cm3) | 2.56 | 0.87 |
| Visual equivalent (%) | 80 | - |
| Fineness modulus | 2.6 | 2.5 |
| Group | Mix No. | Mix ID | Cementitious Materials | Aggregates | SP % | W/C | ||||
|---|---|---|---|---|---|---|---|---|---|---|
| Cement Kg/m3 | RHA % | SF % | Sand Kg/m3 | Coarse Kg/m3 | WPB % | |||||
| A | M1 | OPC | 400 | 0 | 0 | 600 | 1110 | 0 | 3 | 0.4 |
| M2 | P0R0S2.5 | 390 | 0 | 2.5 | 597.5 | 1109.8 | 0 | 3 | 0.4 | |
| M3 | P0R0S5 | 380 | 0 | 5 | 636 | 1181 | 0 | 3 | 0.4 | |
| M4 | P0R5S0 | 380 | 5 | 0 | 636 | 1181 | 0 | 3 | 0.4 | |
| M5 | P0R10S0 | 360 | 10 | 0 | 633.5 | 1176.5 | 0 | 3 | 0.4 | |
| M6 | P0R15S0 | 340 | 15 | 0 | 631 | 1172 | 0 | 3 | 0.4 | |
| M7 | P10R0S0 | 400 | 0 | 0 | 539.5 | 113.5 | 10 | 3 | 0.4 | |
| M8 | P20R0S0 | 400 | 0 | 0 | 446.8 | 1037.5 | 20 | 3 | 0.4 | |
| M9 | P30R0S0 | 400 | 0 | 0 | 370 | 981.7 | 30 | 3 | 0.4 | |
| B | M10 | P0R5S2.5 | 370 | 5 | 2.5 | 634.7 | 1178.8 | 0 | 3 | 0.4 |
| M11 | P0R5S5 | 360 | 5 | 5 | 6.33.5 | 1176.4 | 0 | 3 | 0.4 | |
| M12 | P0R10S2.5 | 350 | 10 | 2.5 | 632.1 | 1174.2 | 0 | 3 | 0.4 | |
| M13 | P0R10S5 | 340 | 10 | 5 | 631 | 1172 | 0 | 3 | 0.4 | |
| C | M14 | P10R5S0 | 380 | 5 | 0 | 537.6 | 1109 | 10 | 3 | 0.4 |
| M15 | P10R10S0 | 360 | 10 | 0 | 535.3 | 1104.7 | 10 | 3 | 0.4 | |
| M16 | P10R15S0 | 340 | 15 | 0 | 533.5 | 1100.4 | 10 | 3 | 0.4 | |
| D | M17 | P20R5S0 | 380 | 5 | 0 | 473.3 | 1007 | 20 | 3 | 0.4 |
| M18 | P20R10S0 | 360 | 10 | 0 | 445.4 | 1034 | 20 | 3 | 0.4 | |
| M19 | P20R15S0 | 340 | 15 | 0 | 443.8 | 1030 | 20 | 3 | 0.4 | |
| E | M20 | P30R5S0 | 380 | 5 | 0 | 369.4 | 980 | 30 | 3 | 0.4 |
| M21 | P30R10S0 | 360 | 10 | 0 | 368 | 976 | 30 | 3 | 0.4 | |
| M22 | P30R15S0 | 340 | 15 | 0 | 366.5 | 972.3 | 30 | 3 | 0.4 | |
| F | M23 | P10R0S2.5 | 390 | 0 | 2.5 | 538.5 | 1111.3 | 10 | 3 | 0.4 |
| M24 | P10R0S5 | 380 | 0 | 5 | 537.5 | 1109 | 10 | 3 | 0.4 | |
| M25 | P20R0S2.5 | 390 | 0 | 2.5 | 448.1 | 1040.2 | 20 | 3 | 0.4 | |
| M26 | P20R0S5 | 380 | 0 | 5 | 445.2 | 1033.5 | 20 | 3 | 0.4 | |
| Mix Type | Slump | Fresh Unit Weight | Dry Unit Weight | ||
|---|---|---|---|---|---|
| mm | KN/m3 | 7 Days KN/m3 | 14 Days KN/m3 | 28 Days KN/m3 | |
| OPC | 285 | 24.450 | 23.988 | 24.003 | 24.012 |
| P0R0S2.5 | 270 | 24.113 | 23.689 | 23.704 | 23.721 |
| P0R0S5 | 255 | 23.970 | 23.532 | 23.547 | 23.561 |
| P0R5S0 | 190 | 23.443 | 22.996 | 23.016 | 23.037 |
| P0R10S0 | 130 | 23.046 | 22.477 | 22.489 | 22.513 |
| P0R15S0 | 90 | 22.599 | 22.110 | 22.127 | 22.145 |
| P10R0S0 | 252 | 23.665 | 23.161 | 23.173 | 23.194 |
| P20R0S0 | 210 | 22.779 | 22.293 | 22.311 | 22.326 |
| P30R0S0 | 170 | 21.585 | 21.239 | 21.250 | 21.274 |
| P0R5S2.5 | 235 | 23.354 | 22.883 | 22.901 | 22.919 |
| P0R5S5 | 250 | 23.096 | 22.643 | 22.661 | 22.679 |
| P0R10S2.5 | 215 | 22.809 | 22.400 | 22.421 | 22.436 |
| P0R10S5 | 240 | 22.619 | 22.148 | 22.163 | 22.178 |
| P10R5S0 | 205 | 22.919 | 22.436 | 22.453 | 22.465 |
| P10R10S0 | 170 | 21.733 | 21.813 | 21.834 | 22.037 |
| P10R15S0 | 125 | 21.526 | 21.286 | 21.301 | 21.319 |
| P20R5S0 | 185 | 22.329 | 21.852 | 21.870 | 21.887 |
| P20R10S0 | 145 | 21.742 | 21.283 | 21.304 | 21.327 |
| P20R15S0 | 110 | 21.556 | 20.927 | 20.945 | 20.963 |
| P30R5S0 | 120 | 21.487 | 20.871 | 20.889 | 20.904 |
| P30R10S0 | 95 | 21.052 | 20.661 | 20.681 | 20.696 |
| P30R15S0 | 70 | 20.729 | 20.293 | 20.305 | 20.311 |
| P10R0S2.5 | 260 | 22.779 | 22.127 | 22.142 | 22.163 |
| P10R0S5 | 270 | 22.453 | 21.781 | 21.801 | 21.822 |
| P20R0S2.5 | 230 | 22.095 | 21.665 | 21.686 | 21.704 |
| P20R0S5 | 242 | 22.024 | 21.487 | 21.508 | 21.526 |
| Mix Type | Cubic Compressive Strength | fc′/fcu | Cylinder Compressive Strength | ft/fcu | Split Tensile Strength | |||||||||
|---|---|---|---|---|---|---|---|---|---|---|---|---|---|---|
| 7 Days MPa | 14 Days MPa | 28 Days MPa | 90 Days MPa | 28 Days MPa | 28 Days MPa | |||||||||
| Mean | SD * | Mean | SD * | Mean | SD * | Mean | SD * | Mean | SD * | Mean | SD * | |||
| OPC | 29.0 | 1.22 | 32.5 | 1.24 | 40.0 | 1.16 | 45.0 | 1.53 | 0.96 | 38.5 | 1.42 | 7.69 | 5.20 | 1.13 |
| P0R0S2.5 | 34.5 | 1.35 | 43.5 | 1.35 | 51.0 | 1.14 | 55.0 | 1.24 | 0.88 | 45.0 | 1.57 | 7.76 | 5.60 | 1.50 |
| P0R0S5 | 42.0 | 1.30 | 46.0 | 1.05 | 58.0 | 1.06 | 62.0 | 1.00 | 0.84 | 49.0 | 1.42 | 10.36 | 5.80 | 1.27 |
| P0R5S0 | 30.5 | 1.19 | 37.0 | 1.25 | 42.0 | 1.02 | 47.5 | 1.29 | 0.75 | 40.0 | 1.36 | 16.80 | 4.60 | 1.27 |
| P0R10S0 | 36.0 | 1.46 | 40.0 | 1.14 | 52.0 | 1.18 | 56.0 | 1.36 | 0.68 | 42.0 | 1.59 | 31.25 | 4.00 | 1.31 |
| P0R15S0 | 26.0 | 1.38 | 28.5 | 1.32 | 36.0 | 1.29 | 40.0 | 1.27 | 0.69 | 37.0 | 1.61 | 29.62 | 2.80 | 1.34 |
| P10R0S0 | 26.5 | 1.35 | 28.5 | 1.29 | 35.0 | 1.42 | 39.0 | 1.27 | 0.91 | 33.5 | 1.36 | 8.56 | 3.60 | 1.41 |
| P20R0S0 | 22.0 | 1.46 | 27.0 | 1.25 | 30.0 | 1.20 | 33.0 | 1.36 | 0.79 | 28.0 | 1.59 | 8.39 | 2.80 | 1.34 |
| P30R0S0 | 17.5 | 1.36 | 19.0 | 1.07 | 21.0 | 1.32 | 23.0 | 1.35 | 0.83 | 18.5 | 1.15 | 10.00 | 2.00 | 1.13 |
| P0R5S2.5 | 38.0 | 1.19 | 45.0 | 1.23 | 55.0 | 1.15 | 60.0 | 1.49 | 0.85 | 47.0 | 1.75 | 9.40 | 5.85 | 1.20 |
| P0R5S5 | 42.0 | 1.37 | 49.0 | 1.04 | 58.0 | 1.42 | 63.5 | 1.37 | 0.86 | 50.0 | 1.32 | 11.91 | 6.00 | 1.20 |
| P0R10S2.5 | 40.5 | 1.41 | 47.0 | 1.35 | 56.0 | 1.14 | 62.5 | 1.36 | 0.88 | 49.0 | 1.51 | 9.03 | 5.42 | 1.27 |
| P0R10S5 | 45.0 | 1.39 | 52.0 | 1.55 | 60.0 | 1.33 | 65.0 | 1.48 | 0.88 | 53.0 | 1.27 | 11.07 | 6.20 | 1.48 |
| P10R5S0 | 27.0 | 1.14 | 30.0 | 1.47 | 37.0 | 1.16 | 40.0 | 1.35 | 0.71 | 35.0 | 1.44 | 8.75 | 3.91 | 1.27 |
| P10R10S0 | 30.0 | 1.42 | 33.5 | 1.21 | 42.0 | 1.29 | 46.0 | 1.61 | 0.74 | 39.5 | 1.41 | 9.16 | 4.33 | 1.06 |
| P10R15S0 | 23.0 | 1.35 | 25.0 | 1.22 | 28.0 | 1.25 | 33.0 | 1.40 | 0.74 | 31.0 | 1.36 | 8.15 | 3.65 | 1.27 |
| P20R5S0 | 21.0 | 1.27 | 24.5 | 1.25 | 28.0 | 1.06 | 31.0 | 1.50 | 0.78 | 27.0 | 1.50 | 8.21 | 3.17 | 1.56 |
| P20R10S0 | 23.0 | 1.10 | 26.5 | 1.27 | 30.0 | 1.16 | 32.5 | 1.33 | 0.77 | 29.0 | 1.58 | 8.13 | 3.46 | 1.20 |
| P20R15S0 | 18.0 | 1.20 | 20.0 | 1.02 | 23.5 | 1.27 | 25.5 | 1.59 | 0.80 | 24.0 | 1.53 | 7.69 | 2.67 | 1.27 |
| P30R5S0 | 19.0 | 1.10 | 20.5 | 1.23 | 23.0 | 1.26 | 27.0 | 1.51 | 0.93 | 20.0 | 1.42 | 6.00 | 2.26 | 1.27 |
| P30R10S0 | 20.0 | 1.10 | 21.5 | 1.50 | 25.0 | 1.59 | 28.5 | 1.55 | 0.86 | 19.0 | 1.53 | 6.25 | 2.80 | 1.27 |
| P30R15S0 | 12.5 | 1.48 | 16.0 | 1.29 | 18.5 | 1.29 | 23.0 | 1.51 | 0.97 | 16.0 | 1.31 | 8.41 | 1.87 | 1.48 |
| P10R0S2.5 | 27.0 | 1.42 | 29.5 | 1.26 | 36.5 | 1.38 | 40.0 | 1.22 | 0.67 | 34.0 | 1.40 | 8.29 | 4.20 | 1.27 |
| P10R0S5 | 28.0 | 1.36 | 31.0 | 1.19 | 37.5 | 1.17 | 41.5 | 1.42 | 0.66 | 35.5 | 1.29 | 8.10 | 4.52 | 1.13 |
| P20R0S2.5 | 23.0 | 1.41 | 28.0 | 1.48 | 31.0 | 1.32 | 34.5 | 1.59 | 0.78 | 29.5 | 1.34 | 8.44 | 3.28 | 1.34 |
| P20R0S5 | 24.0 | 1.16 | 29.0 | 1.19 | 32.5 | 1.42 | 36.0 | 1.53 | 0.88 | 32.0 | 1.19 | 7.70 | 4.02 | 1.13 |
| Mix Type | Charges | Mix Type | Charges |
|---|---|---|---|
| Coulomb (C) | Coulomb (C) | ||
| OPC | 2750 | P10R5S0 | 919 |
| P0R0S2.5 | 1800 | P10R10S0 | 732 |
| P0R0S5 | 1280 | P10R15S0 | 681 |
| P0R5S0 | 1360 | P20R5S0 | 750 |
| P0R10S0 | 1200 | P20R10S0 | 656 |
| P0R15S0 | 1073 | P20R15S0 | 612 |
| P10R0S0 | 1022 | P30R5S0 | 587 |
| P20R0S0 | 868 | P30R10S0 | 556 |
| P30R0S0 | 626 | P30R15S0 | 527 |
| P0R5S2.5 | 935 | P10R0S2.5 | 978 |
| P0R5S5 | 681 | P10R0S5 | 872 |
| P0R10S2.5 | 646 | P20R0S2.5 | 832 |
| P0R10S5 | 611 | P20R0S5 | 779 |
| Mix Type | Cubic Compressive Strength before Fire Test (MPa) | Residual Cubic Compressive Strength after Fire Test (MPa) | Loss Rate of Cubic Compressive Strength after Fire Test (%) | |
|---|---|---|---|---|
| Mean | SD * | |||
| OPC | 45.0 | 1.10 | 31.0 | 31.1 |
| P0R0S2.5 | 55.0 | 1.07 | 45.2 | 17.8 |
| P0R0S5 | 62.0 | 1.06 | 49.5 | 20.2 |
| P0R5S0 | 47.5 | 1.06 | 37.2 | 21.7 |
| P0R10S0 | 56.0 | 1.05 | 44.3 | 20.9 |
| P0R15S0 | 40.0 | 1.02 | 31.9 | 20.3 |
| P10R0S0 | 39.0 | 1.10 | 35.0 | 10.3 |
| P20R0S0 | 33.0 | 1.19 | 20.2 | 38.8 |
| P30R0S0 | 23.0 | 1.10 | 11.1 | 51.7 |
| P0R5S2.5 | 60.0 | 1.12 | 49.3 | 17.8 |
| P0R5S5 | 63.5 | 1.08 | 56.5 | 11.0 |
| P0R10S2.5 | 62.5 | 1.15 | 36.5 | 41.6 |
| P0R10S5 | 65.0 | 1.06 | 40.9 | 37.1 |
| P10R5S0 | 40.0 | 1.21 | 25.1 | 37.3 |
| P10R10S0 | 46.0 | 1.02 | 31.2 | 32.2 |
| P10R15S0 | 33.0 | 1.04 | 19.6 | 40.6 |
| P20R5S0 | 31.0 | 1.29 | 23.3 | 24.8 |
| P20R10S0 | 32.5 | 1.17 | 26.0 | 20.0 |
| P20R15S0 | 25.5 | 1.12 | 17.0 | 33.3 |
| P30R5S0 | 27.0 | 1.18 | 21.5 | 20.4 |
| P30R10S0 | 28.5 | 1.12 | 23.4 | 17.9 |
| P30R15S0 | 23.0 | 1.36 | 16.0 | 30.4 |
| P10R0S2.5 | 40.0 | 1.35 | 31.5 | 14.9 |
| P10R0S5 | 41.5 | 1.12 | 32.0 | 16.9 |
| P20R0S2.5 | 34.5 | 1.14 | 18.2 | 40.3 |
| P20R0S5 | 36.0 | 1.17 | 18.0 | 44.6 |
Disclaimer/Publisher’s Note: The statements, opinions and data contained in all publications are solely those of the individual author(s) and contributor(s) and not of MDPI and/or the editor(s). MDPI and/or the editor(s) disclaim responsibility for any injury to people or property resulting from any ideas, methods, instructions or products referred to in the content. |
© 2023 by the authors. Licensee MDPI, Basel, Switzerland. This article is an open access article distributed under the terms and conditions of the Creative Commons Attribution (CC BY) license (https://creativecommons.org/licenses/by/4.0/).
Share and Cite
El-Attar, M.M.; Ibrahim, H.H.A.; Darwish, S.F.A. Investigating the Viability of Recycling Rice Husk Ash and Plastic Bag Waste to Enhance Durability of Lightweight Concrete. Buildings 2023, 13, 1350. https://doi.org/10.3390/buildings13051350
El-Attar MM, Ibrahim HHA, Darwish SFA. Investigating the Viability of Recycling Rice Husk Ash and Plastic Bag Waste to Enhance Durability of Lightweight Concrete. Buildings. 2023; 13(5):1350. https://doi.org/10.3390/buildings13051350
Chicago/Turabian StyleEl-Attar, Mohamed M., Hatem H. A. Ibrahim, and Shereen F. A. Darwish. 2023. "Investigating the Viability of Recycling Rice Husk Ash and Plastic Bag Waste to Enhance Durability of Lightweight Concrete" Buildings 13, no. 5: 1350. https://doi.org/10.3390/buildings13051350