Article

Bond Stress Distribution and Bond–Slip Model of Deformed Steel Bars in Iron Tailing Sand Recycled Aggregate Concrete

1
School of Civil Engineering and Architecture, Zhengzhou University of Aeronautics, Zhengzhou 450046, China
2
School of Civil and Transportation, North China University of Water Resources and Electric Power, Zhengzhou 450045, China
*
Author to whom correspondence should be addressed.
Buildings 2023, 13(5), 1176; https://doi.org/10.3390/buildings13051176
Submission received: 7 April 2023 / Revised: 24 April 2023 / Accepted: 26 April 2023 / Published: 28 April 2023
(This article belongs to the Special Issue Low Carbon and Green Materials in Construction)

Abstract

:
In this study, the bond stress distribution and bond–slip model of steel bars and iron tailing sand recycled aggregate concrete (ITRAC) were investigated using central pullout tests on 33 steel bars and ITRAC bonded specimens. The results show three failure modes for the bonded specimens: splitting, pullout, and splitting–pullout. Compared with the maximum bond strength of nature sand concrete (NAC), the maximum bond strength of the iron tailing concrete and ITRAC specimens increased by 23.12% and 6.08–23.96%, respectively. After adding 1% steel fiber, the maximum and residual bond strengths of ITRAC increased by 40.82% and 129.10%, respectively, compared with those of NAC. The maximum bond strength of ITRAC decreased after the configuration of the stirrups. The bond stress distribution characteristics of the ITRAC specimens resembled those of recycled aggregate concrete (RAC). Generally, two bond stress peaks emerged, and the uniformity of the bond stress distribution improved after adding RAC to the iron tailing sand (ITS). The results of the proposed ITRAC bond–slip constitutive model agreed with the test results.

1. Introduction

Annually, a large amount abandoned tailings are produced in mines worldwide. The stacking of tailings occupies a large area of cultivated land and poses safety hazards. With the strengthening, renovation, and demolition of building structures, wasted space and environmental pollution are gradually increasing. Recycled coarse- and fine-aggregate iron tailings are prepared by processing construction waste and are turned into iron tailing sand recycled aggregate concrete (ITRAC). This process can alleviate the ecological and environmental problems caused by the substantial mining of natural sand and gravel [1,2].
Recycled aggregate concrete (RAC) and ITRAC have good mechanical properties. The chief difference between RA (recycled aggregate) and NA (natural aggregate) is that the surface of RA is covered with a layer of old cement paste, which makes the water absorption of RA much higher than that of NA; in addition, the crushing index of RA is higher than that of NA [3,4]. The compressive strength (fcu) of RAC is weaker than that of natural aggregate concrete (NAC), but the splitting tensile strength (ft) of RAC is higher than that of NAC [4]. Iron tailing sand (IT) with a particle size less than 4.75 mm is produced by grinding and sorting iron ore, and its fineness modulus is primarily medium sand and fine sand. The fcu and ft of concrete, prepared by Ali et al. [5], were higher than those of NAC. Hou found that the natural rough and angular texture of ITS improved the bonding ability of the cement and aggregate interface, resulting in a large fcu [6]. Ali et al. [5] studied the replacement of NS by ITS and obtained a contradictory result, that is, 100% replacement of NS by ITS is beneficial to the fabrication of concrete, without any adverse effect on fcu and ft.
Bond properties are fundamental to how steel and concrete work together. The research on the bonding properties of RAC and steel bars is sufficient, but the influence of RA on bonding strength remains unclear. Morohashi et al. [7] pointed out that the bonding strength of RAC made of steel bars and high-quality RA is not different from that of NAC. Pandurangan et al. [8] showed that the bond strength of RCA after acid, mechanical, and heat treatments was 96%, 90%, and 79% of that of NAC, respectively. The tests conducted by Butler et al. [9] showed that the bond strength of NAC specimens exceeded that of the equivalent RAC specimens by 9–19%. Other studies [10,11,12] reported that the bonding properties of steel bars and RAC were lower than those of NAC. Seara-Paz et al. [10] found that the bonding strength of RAC after curing for 28 days was lower than that of ordinary concrete, and it decreased with the increase in RA content. Breccolotti et al. [13] showed that the bond strength between RAC and steel bars decreased with the increase in the replacement rate of RA. The bond strength of RAC was greater than that of NAC; it increased initially, decreased with the increase in the RA substitution rate, and reached its maximum when the substitution rate was 60% [14]. Arezoumandi et al. [15] reported that in the non-split failure mode, the bond strength of recycled aggregate concrete was higher than that of ordinary concrete. When the substitution rate was 50% and 100%, the bond strength increased by 20% and 10%, respectively. Xiao et al. [16] and Prince et al. [17,18] stated that bond strength increased with the RA substitution rate.
Bond strength is also affected by other factors. Wang et al. [19] believed that the higher the RAC strength, the better the bonding performance. Hu et al. showed that reducing the water-cement ratio could increase the fcu and bond strength of RAC [14]. A decrease in protective layer thickness led to a decrease in the bond strength of lap specimens [20]. Meanwhile, increments in the hoop ratio [21] and the diameters of large steel bar [22] improved the bond strength. The bond strength between recycled aggregate concrete and reinforcing bars increased after adding blast furnace slag [23], and graphene nanoplatelets (GnP) considerably improved the bond strength between the steel bars and concrete [24].
Some studies have been conducted on the bonding performance of ITC. Bonding properties are closely related to concrete strength. Shettima et al. showed that the fcu and ft of concrete prepared by ITS were higher than those of NAC [5]. Therefore, the bond properties between the reinforcing bars and ITRAC are different from those of NAC. The experiments performed by Wang et al. [25] indicated that the maximum bond stress of ITC was higher than that of NAC. Using RA led to a decrease in concrete strength, but this loss in strength could be compensated by adding ITS to the concrete [26]. When the tailing content was 20–40%, ITRAC had high mechanical properties and a reasonable microstructure [27], and the addition of ITS considerably improved the mechanical properties of RAC [28].
Although the mechanical and bonding properties of RAC have been well studied, the bonding properties of ITRAC and reinforcing bars, especially the bond–slip model and the spread of bond stress along the bonded section, lack relevant research. Therefore, this work designs and manufactures 33 bonded specimens. Through a center pullout test, the impact of the RA replacement rate, concrete strength, and hoop ratio on ITRAC bond performance is systematically studied. Strain gauges are used to test the bond stress distribution during loading. A bond-slip constitutive model is established based on the test data to provide a basis for finite element analysis.

2. Experimental Program
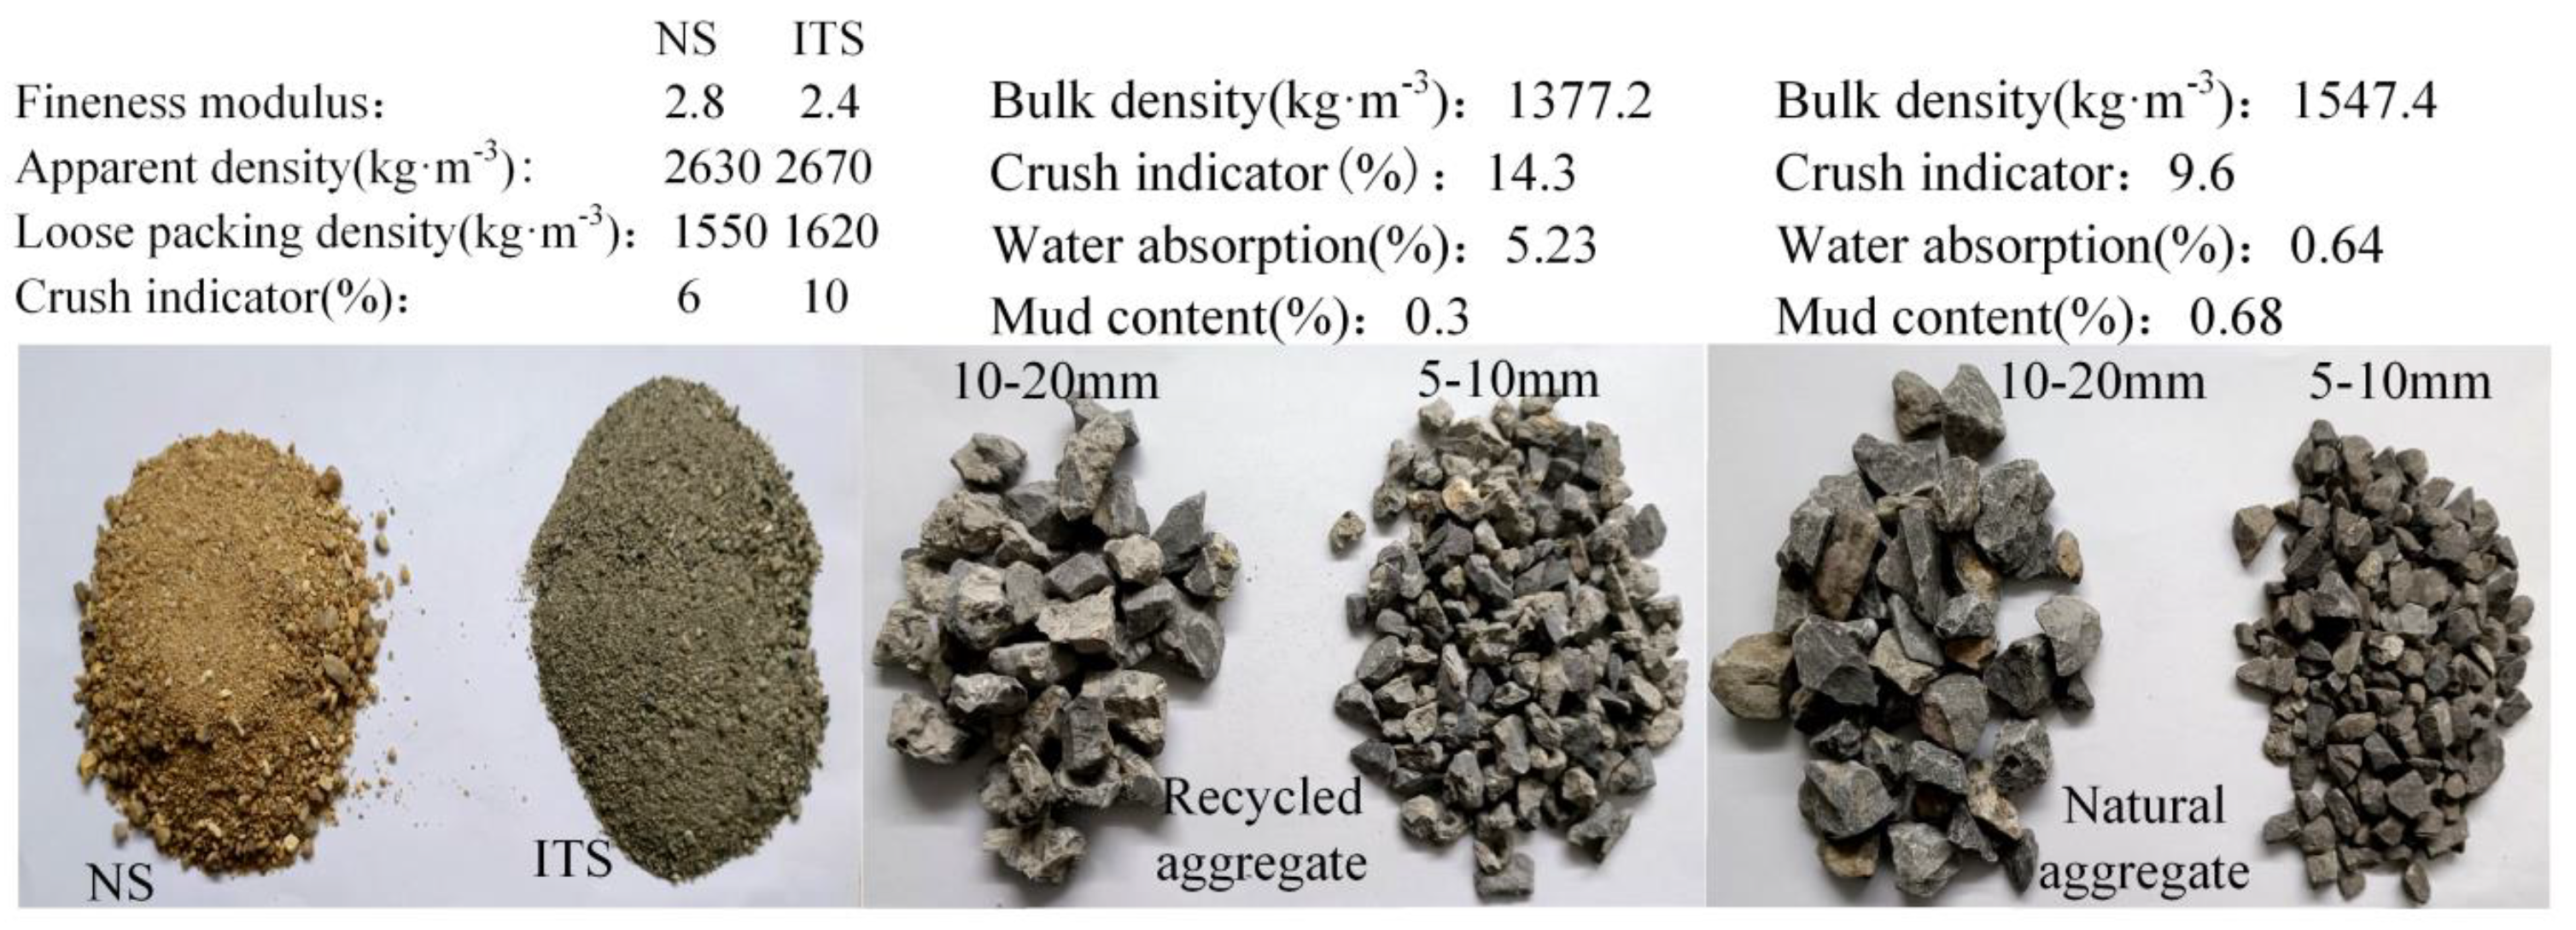
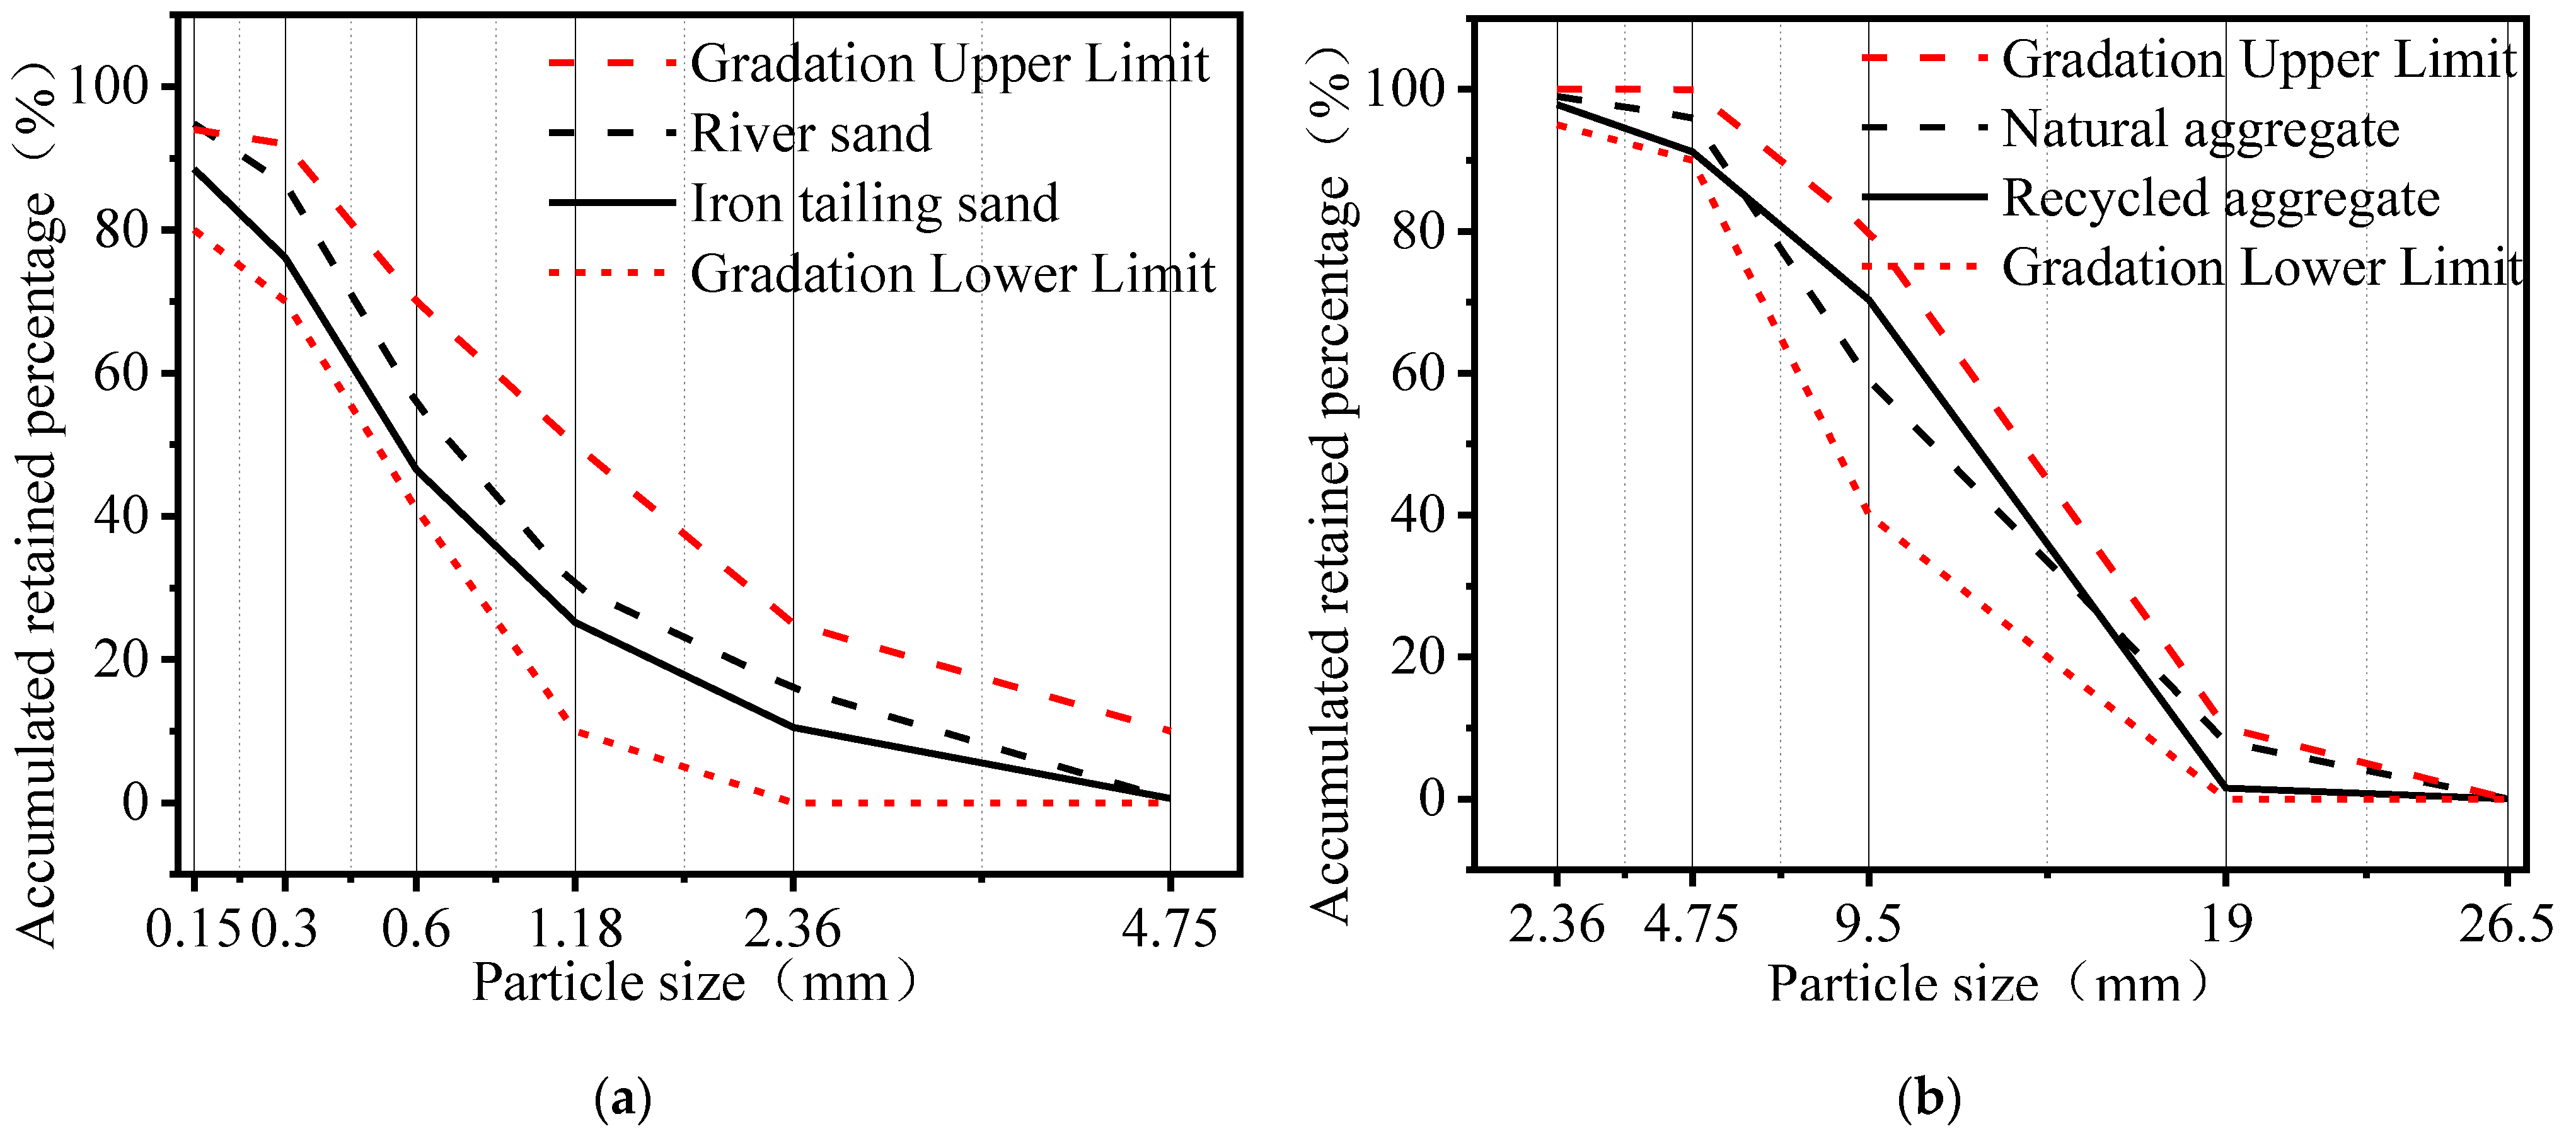
2.1. Materials

The cement employed in this study was P·O 42.5 ordinary Portland cement, and the fine aggregates were ITS with a fineness modulus of 2.4 and NS with a fineness modulus of 2.8, as shown in Figure 1. As shown in Figure 2, the particle size distributions of ITS and NS met the requirements of GB 51032-2014 [29] and GB/T 14684-2022 [30]. RA was obtained from abandoned C40 concrete beams and NA was acquired from crushed limestone. As shown in Figure 2b, the primary coarse aggregate physical indicators were in line with the requirements of GB/T 14685-2011 [31] and GB/T 25177-2010 [32]. The water-reducing rate of the high-efficiency water-reducing agents was 25%.
Deformed HRB400 bars with a diameter of 16 mm were used as the reinforcing bars. Deformed HRB335 reinforcing bars with a diameter of 4 mm were utilized as the stirrup. The vertical steel bars of the lap joint test piece frame used deformed HRB400 reinforcing bars with a diameter of 12 mm. The properties of the steel bars were measured in accordance with GB/T 228.1-2010 (2010), as shown in Table 1.

2.2. Mix Proportion

The mix ratio of ITRAC and RCA was designed in accordance with the JG/T 472-2015 specification, as shown in Table 2. In the table, the number after C indicates the target strength level, the number after R refers to the replacement rate of RA, NS represents natural sand, and SF denotes steel fiber. The content of steel fiber was 1%, and the others were not mixed with steel fiber. The dosage of the water reducer for C60-R50 and C45-R0NS was 1.5%, and the dosage for the rest was 0.8%. The water absorption rate was relatively high due to the cement mortar attached to the surface of RA, so an additional part of water consumption (AW) was used to make RA reach a saturated surface-dry state. This part of water was completely absorbed by the aggregate and did not play a role in improving the fluidity of the mixture. As an example, C45-R50-P0.21 indicates that the fine aggregate of the specimen was ITS, the design strength of the concrete was 45 MPa, the replacement rate of RA was 50%, and the hoop rate was 0.21%.

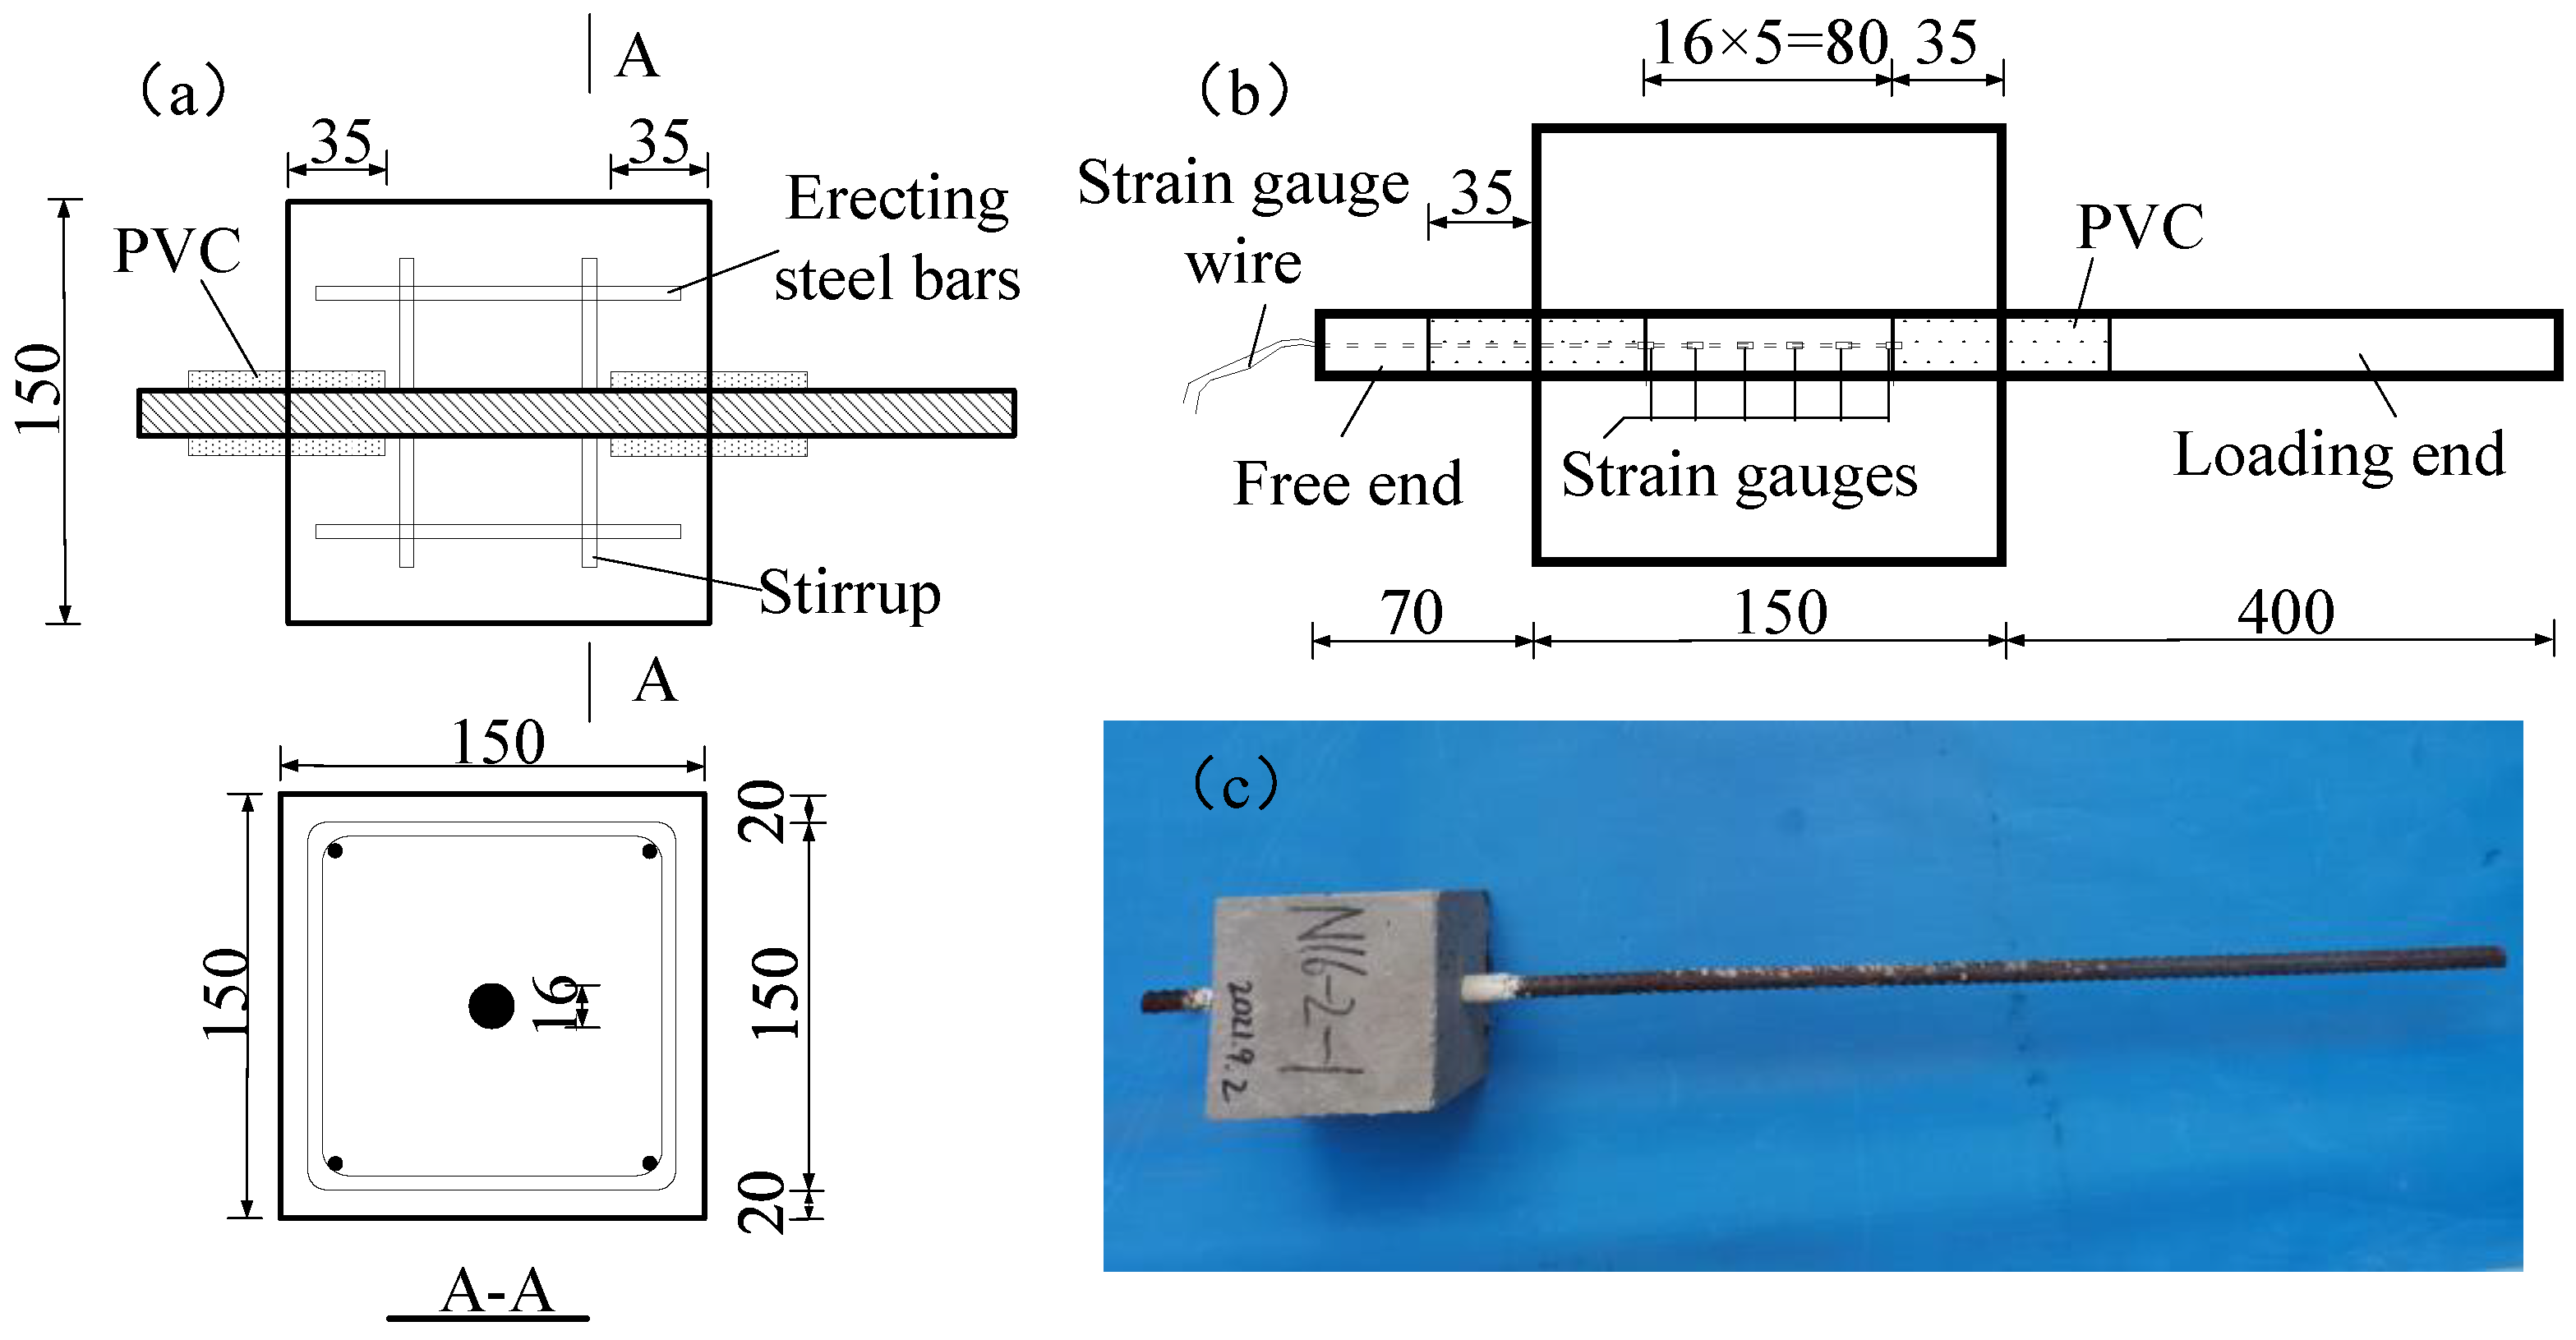
2.3. Preparation of Specimens

Eleven sets of lap joint specimens of steel bars were designed and manufactured for the pullout test, and the unbonded parts were wrapped in polyvinyl chloride pipes. Each set had three specimens. The size of the bonded test piece was 150 mm × 150 mm × 150 mm, and the length of the bonded area was five times the diameter of the reinforcing bar. The steel bar was placed at the center of the specimen section, the bonded area was set in the middle of the specimen, and a 35 mm non-bonded section was reserved at the loading and free ends of the specimen. The size and reinforcement structure of the specimen are given in Figure 3. The main variable parameters in the test were the RA replacement rate (0%, 30%, 50%, and 100%), concrete strength (30, 45, and 60 MPa), and hoop ratio (0%, 0.21%, 0.42%, and 0.84%).
The steel bar strain gauges were arranged by sticking the strain gauges inside the steel bar slots, and the distance between the strain gauges was expressed as d. The positions of the steel bar strain gauges are shown in Figure 3.
Six 100 mm × 100 mm × 100 mm cube specimens were poured using each mixing ratio to test fcu and ft. The specimens were cured for 28 days in a curing room with a relative degree of wetness of 95% and a temperature of 20 °C. The working performance and 28-day mechanical properties of the concrete mixture are shown in Table 3.

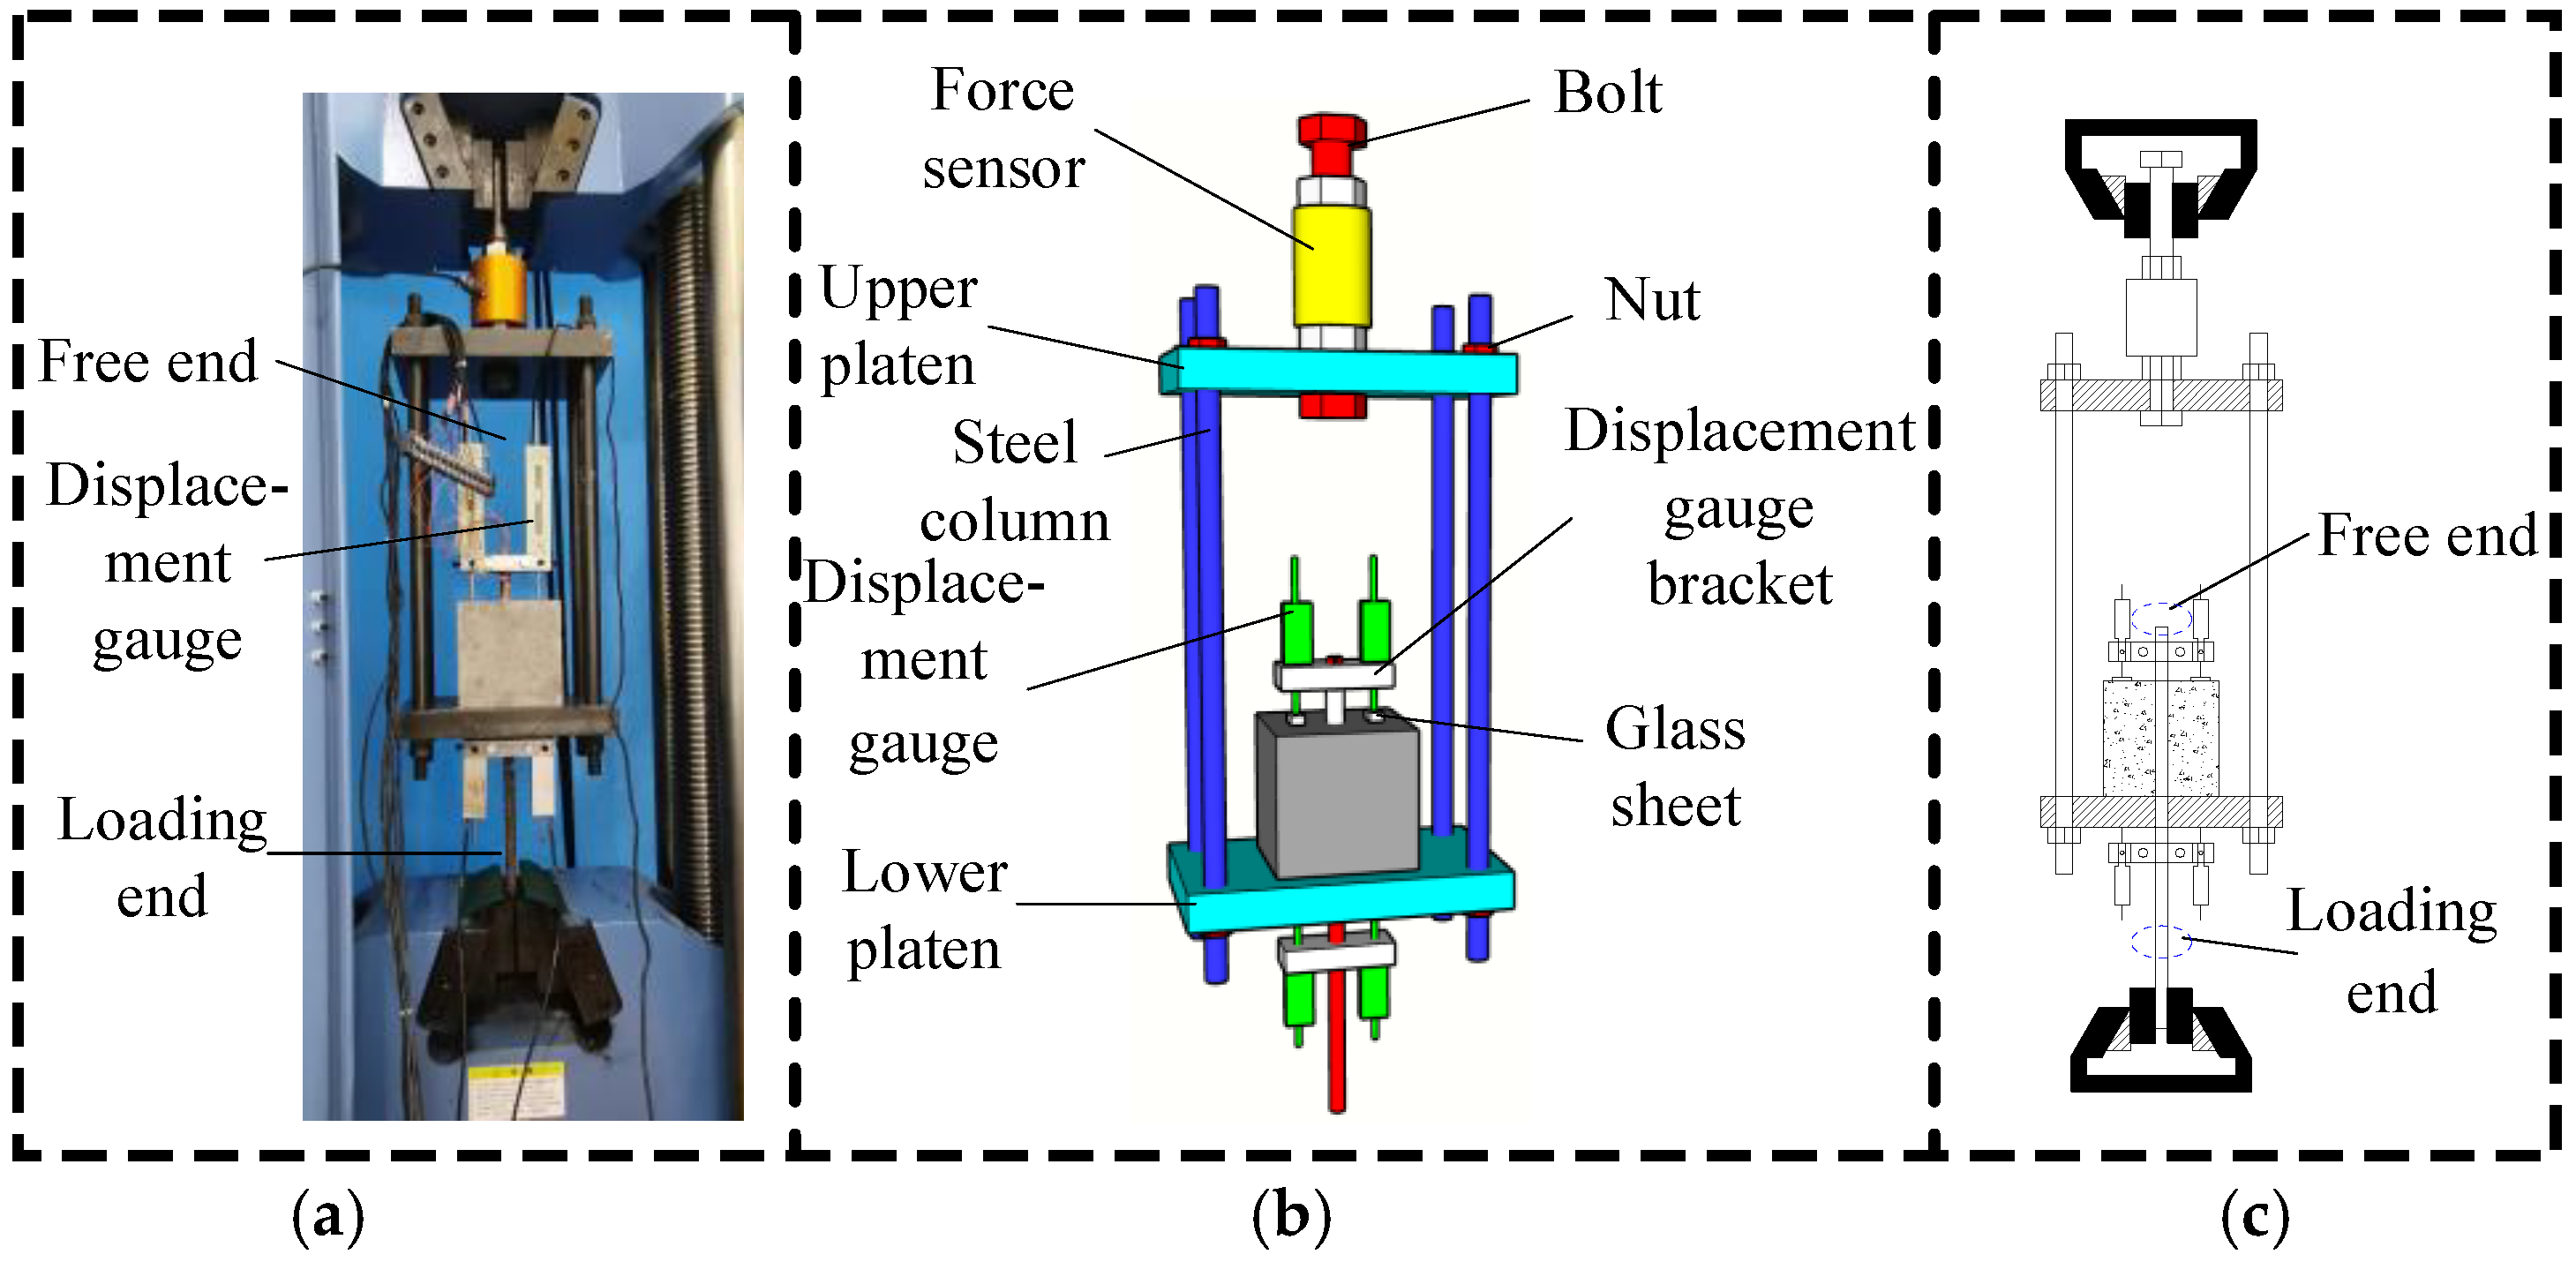
2.4. Loading System and Device

The test loading device is shown in Figure 4. Two displacement sensors were installed at the loading and free ends of the specimen to measure the slippage of the steel bar at the loading and free ends relative to the specimen. The bonding test was performed on a 100t universal tester utilizing displacement control at a loading rate of 0.3 mm/min. The DH3818Y static signal acquisition and analysis system was used for data acquisition.

3. Test Results and Analysis
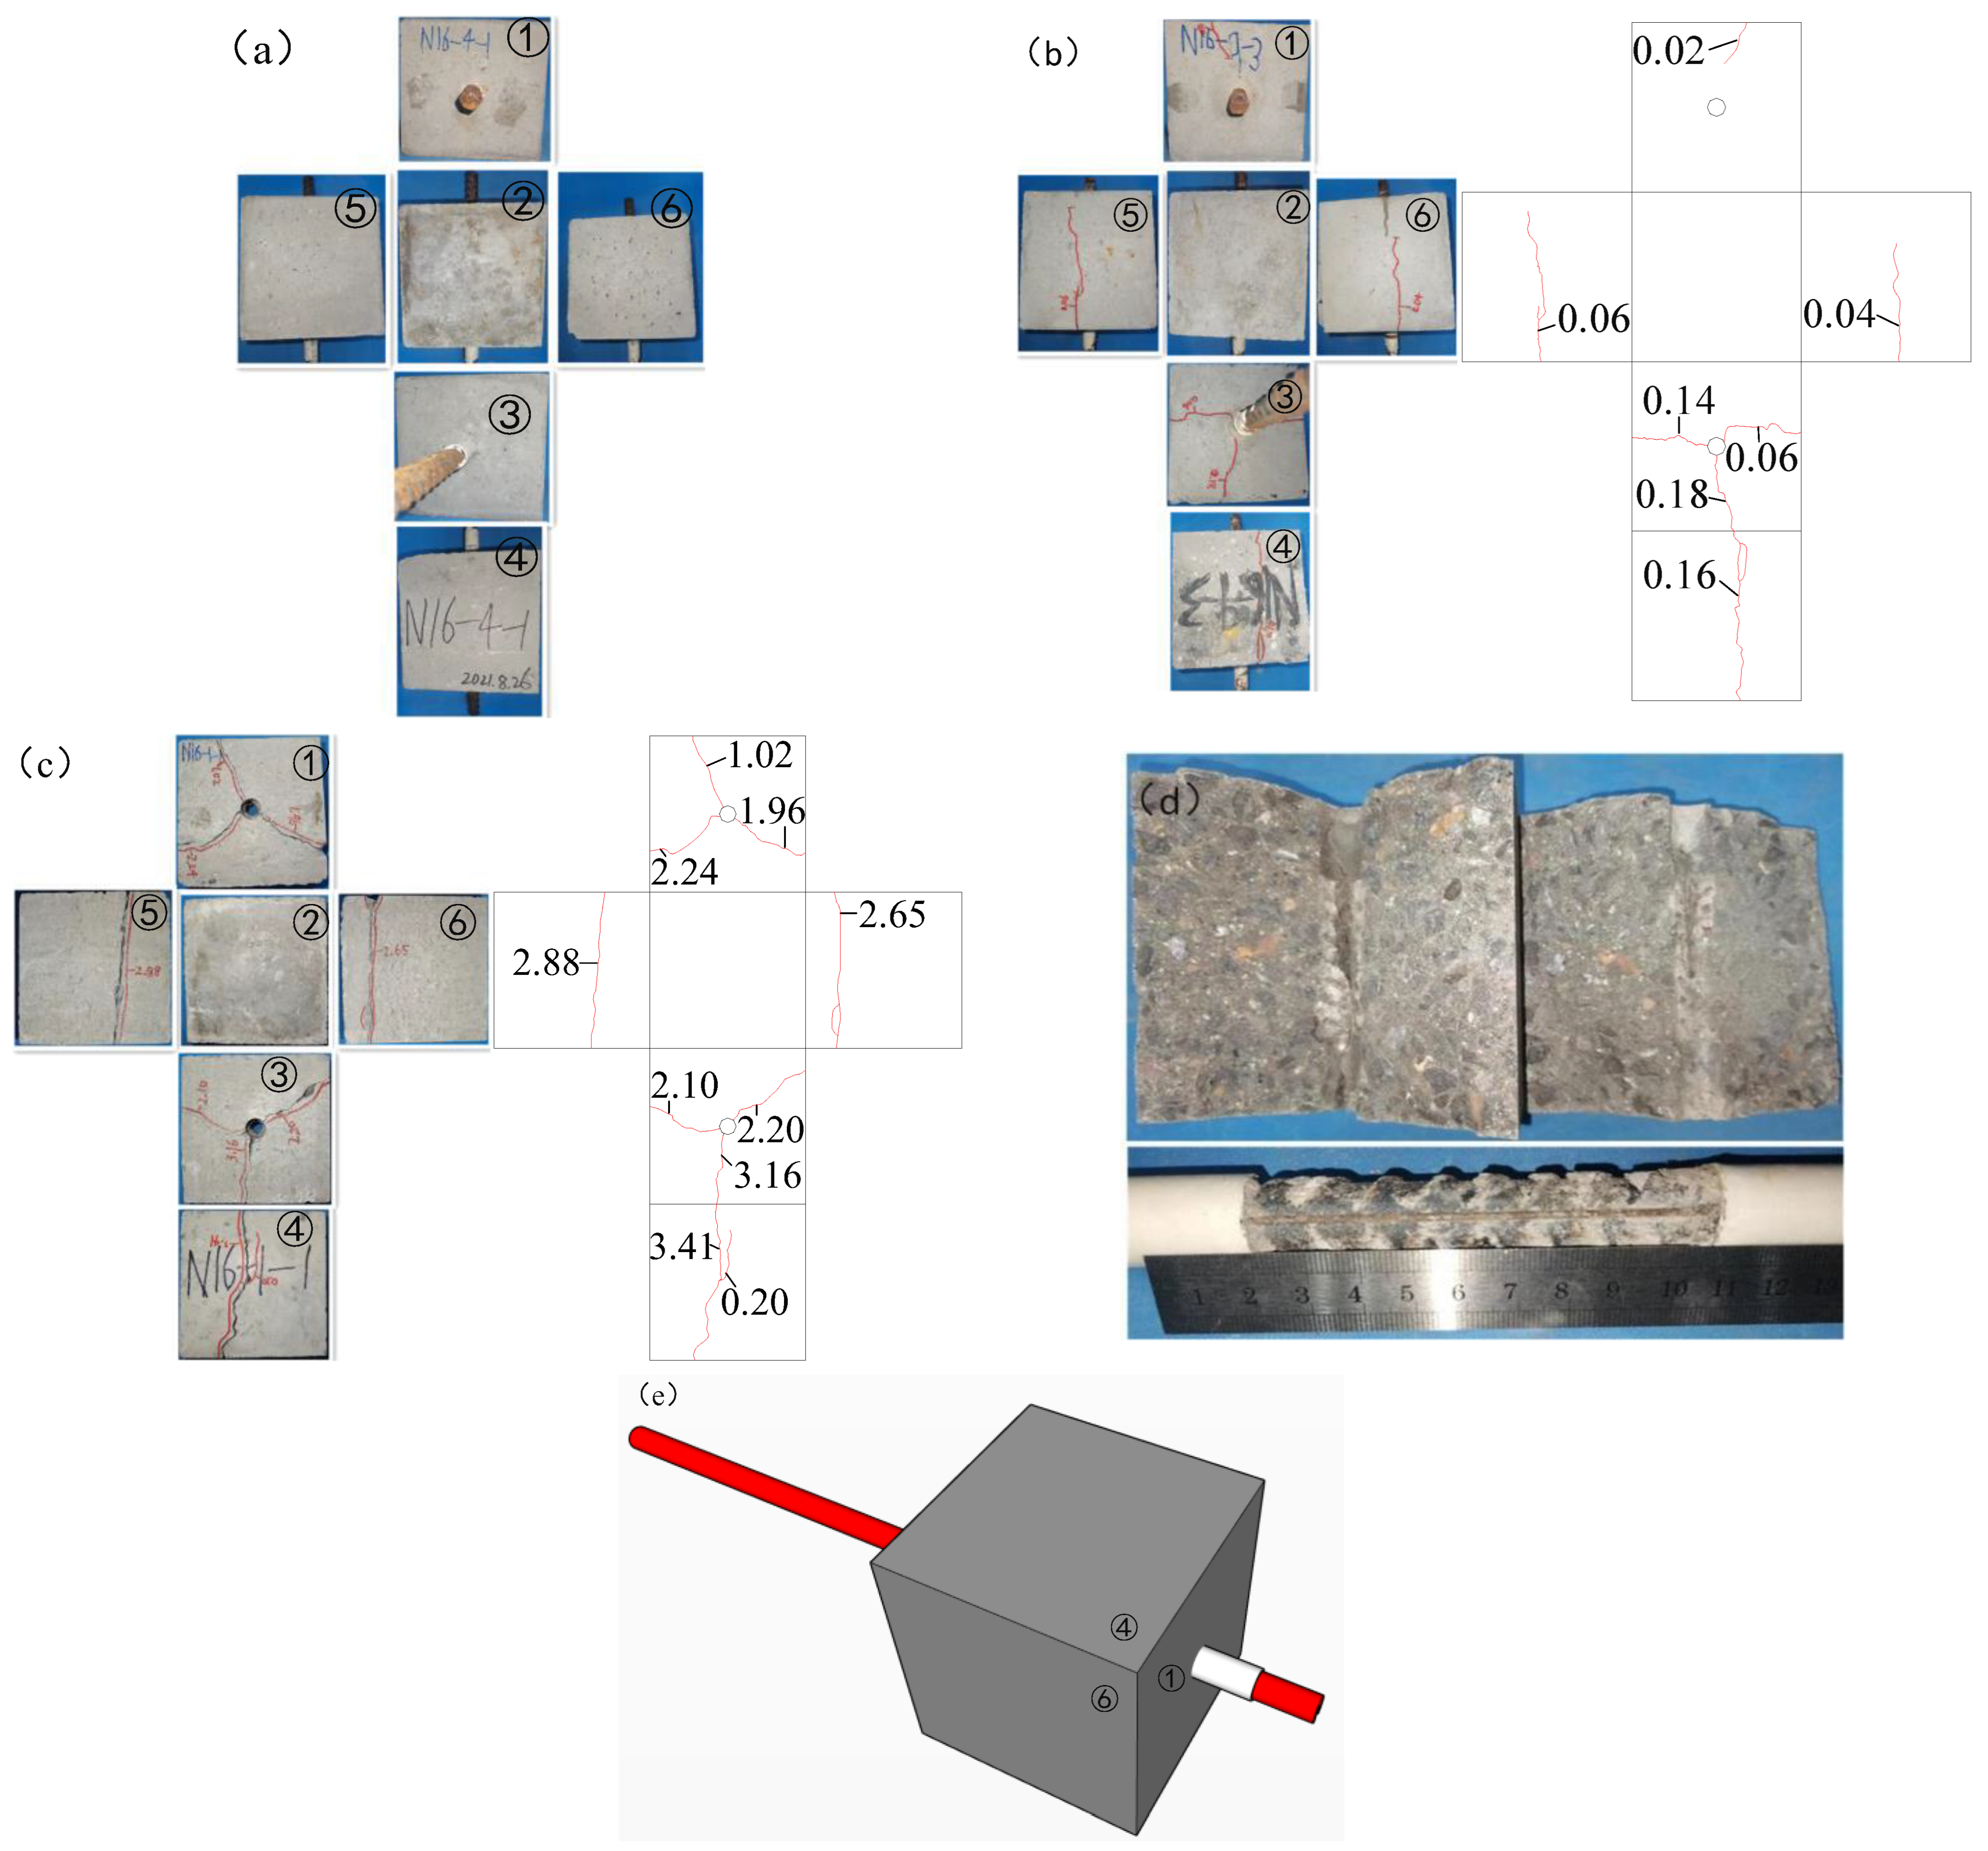
The bond stress between the reinforcement and ITRAC was assumed to be uniformly distributed along the bond length. Formula (1) is used to calculate the bond strength:
τ u = F max π dL
where τu is the average maximum bond strength (MPa), Fmax is the maximum load (kN), d is the diameter of the reinforcing bar (mm), and L is the bond length (mm).

3.1. Failure Mode

Three main failure types appeared in the specimen: pullout failure (Figure 5a), splitting–pullout failure (Figure 5b), and splitting failure (Figure 5c). The surface of the specimen was pulled out and destroyed, and no cracks were found. The splitting failure test specimen had cracks that penetrated the specimen along the reinforcing bar, and the specimen was split into multiple pieces. When the splitting–pullout failure specimen was loaded to the ultimate load, damage emerged in the concrete near the loading end of the reinforcement. As the load increased, cracks appeared on the side of the specimen and the surface where the free end of the steel bar was located, and the width of the crack increased with the increase in the load [33]; however, the crack did not penetrate to the surface of the steel bar, and the specimen was not split. The pieces were not split. The maximum load, maximum bond strength, and damage width of the chief crack measured after loading are shown in Table 3. With the addition of stirrups, specimen C45-R50-P0.21 underwent splitting−pullout failure, and its ultimate bearing capacity was 67.64 MPa (18.14%). No damage was formed on the surface of the specimens with hoop ratios of 0.42% and 0.84%.

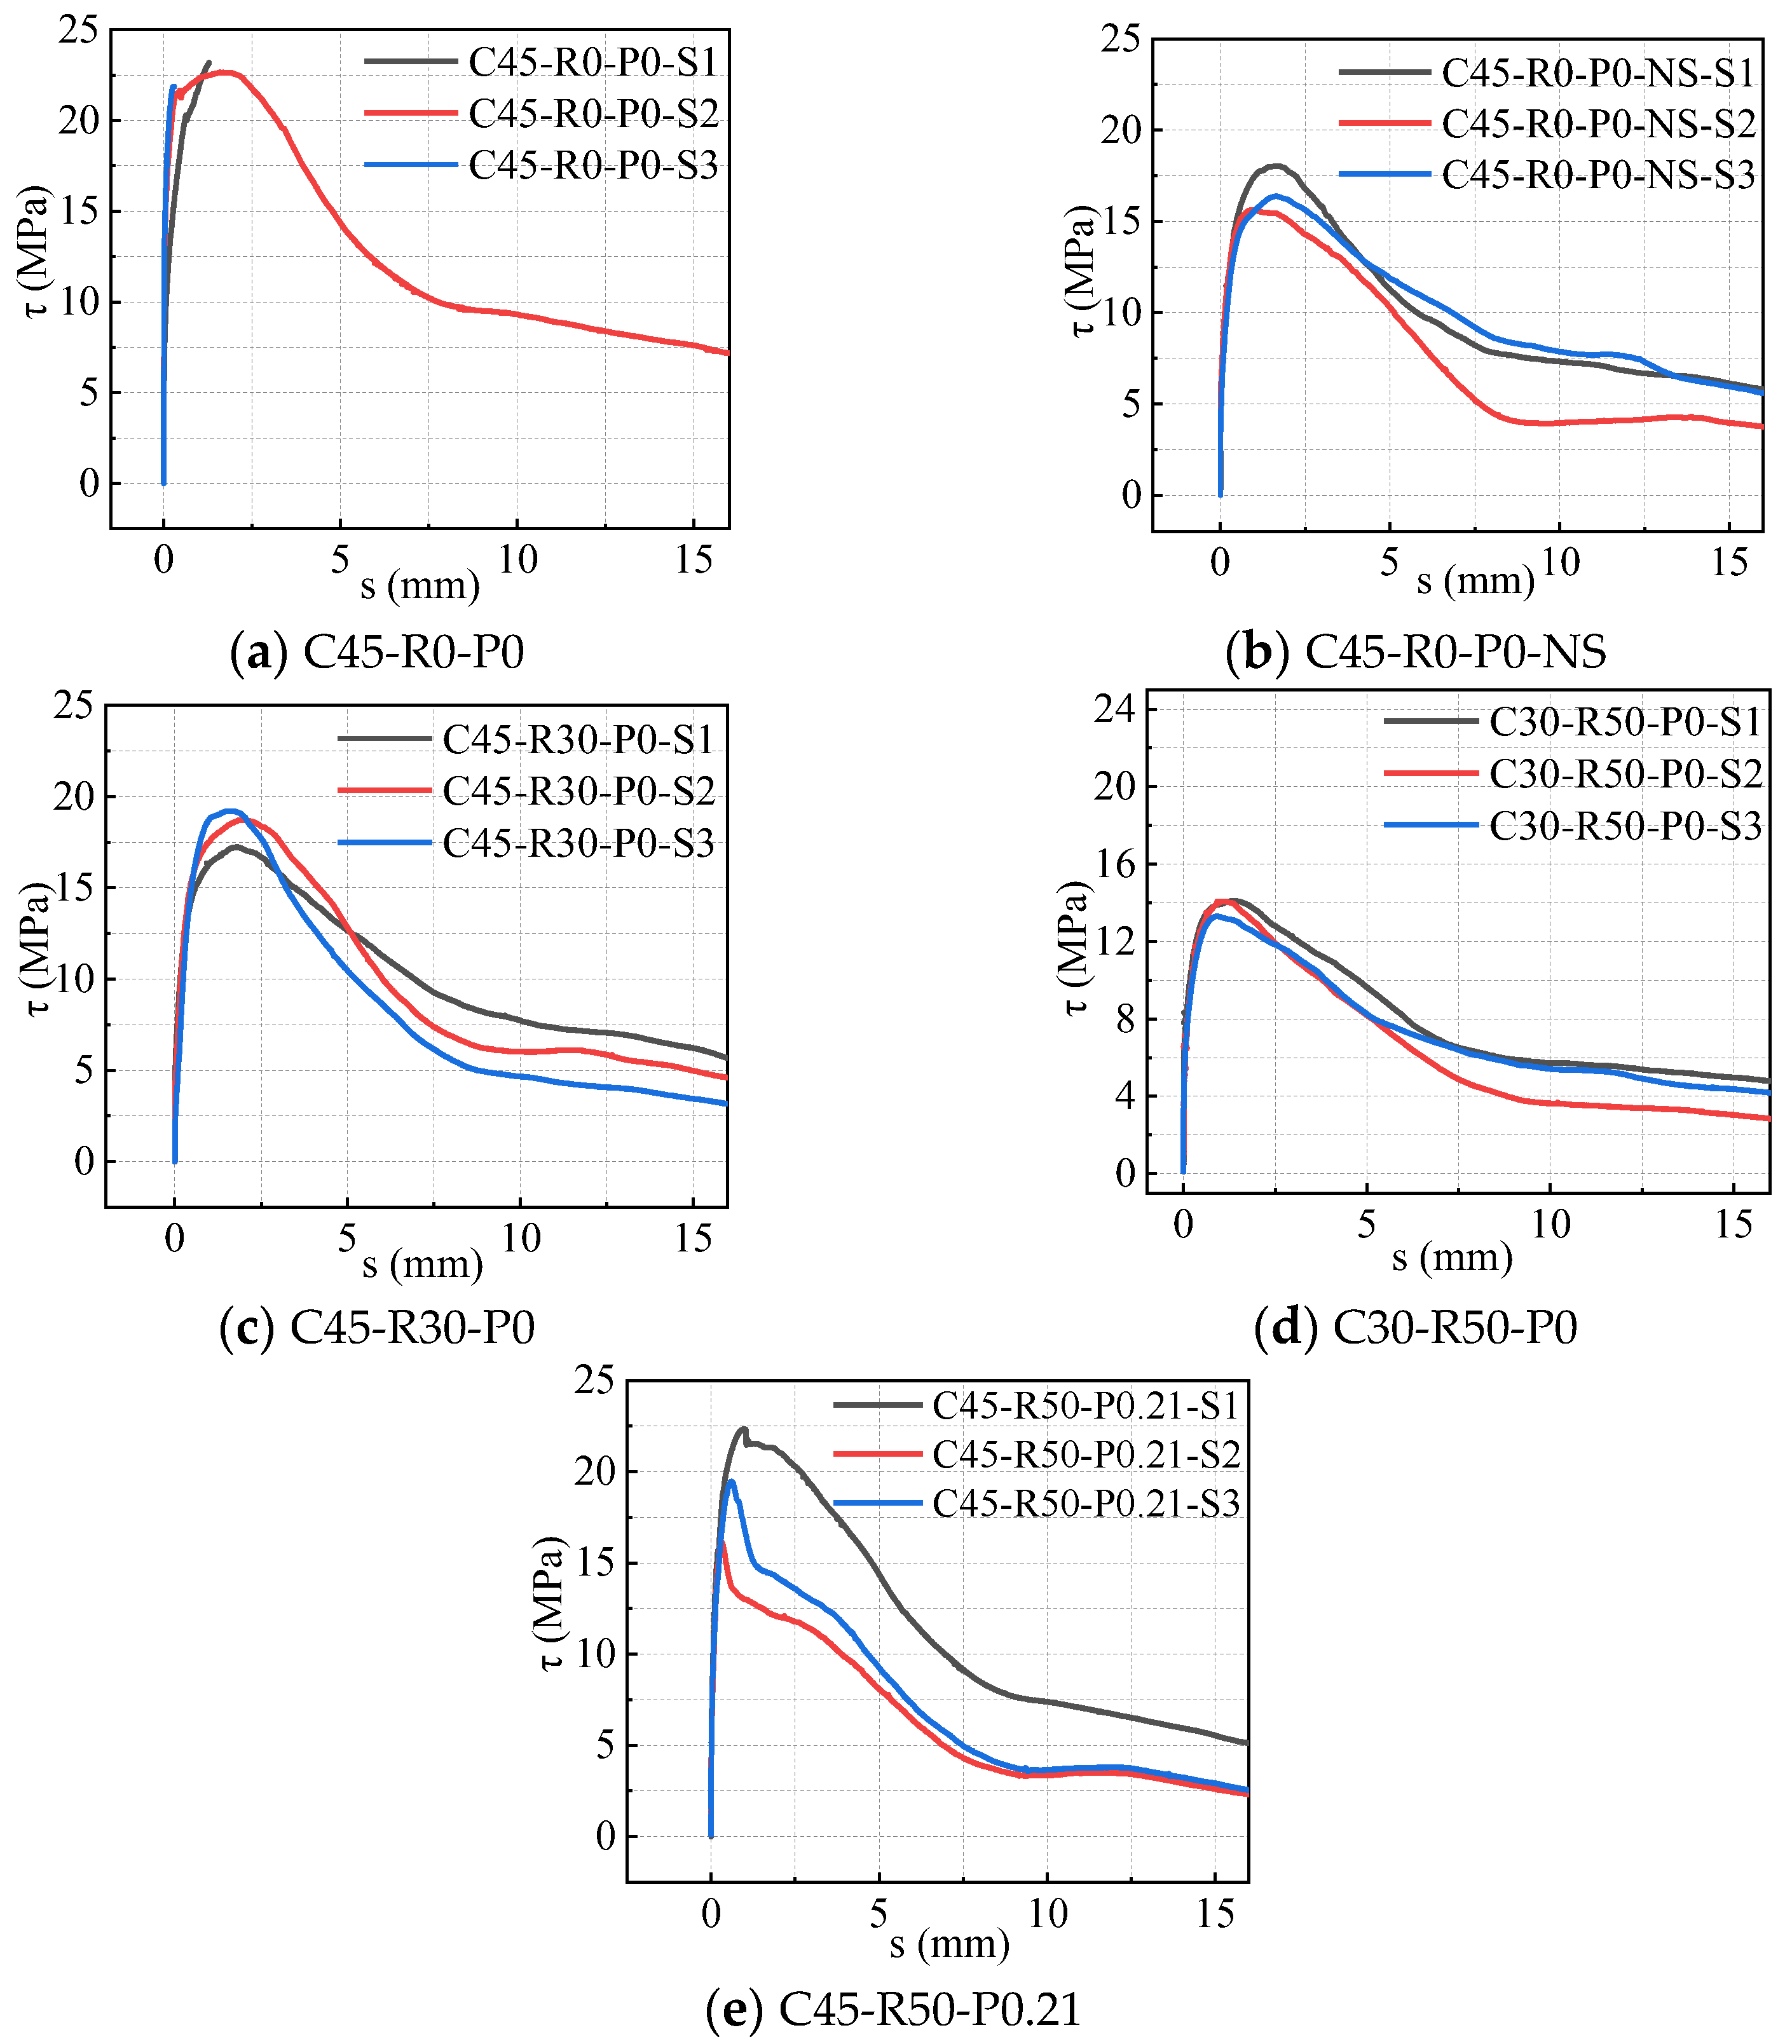
3.2. Bond–Slip Curve

The τ–s of the specimens is shown in Figure 6. Splitting damage was only found in the ascending segment, whereas the splitting–pullout and pullout damage types were found in the ascending, descending, and residual segments.
In the rising stage (0 < s ≤ 0.01 mm), the force and displacement increased slowly, and the force reached a specific value (about 20 kN). This stage showed the effect of chemical cementation. When 0.01 mm < s ≤ su, the slope decreased gradually, the displacement increased rapidly, the force increased slowly, and the power reached the peak load. At this stage, the resistance provided by the concrete between the steel bar ribs played a major role. In the descending stage (su < s ≤ sr), the power decreased rapidly, and the displacement increased quickly. In this stage, the residual mechanical bite force and friction acted together. In the residual area (s > sr), τ–s changed steadily, and the load remained unchanged. Only friction acted in the residual section. For the ITS (C45-R0-P0) concrete specimens, splitting failure occurred after the load reached the peak value, indicating prominent brittle characteristics. For the iron tailing recycled aggregate concrete specimens, the load began to decrease after reaching the peak value and remained stable after the load reached a specific value, until the end of the test. Pullout or splitting–pullout failure occurred. The characteristic points of the bond stress–slip curve are given in Table 3.

3.3. Analysis of the Factors That Affect the Bonding Properties of Ribbed Steel Bars in ITRAC

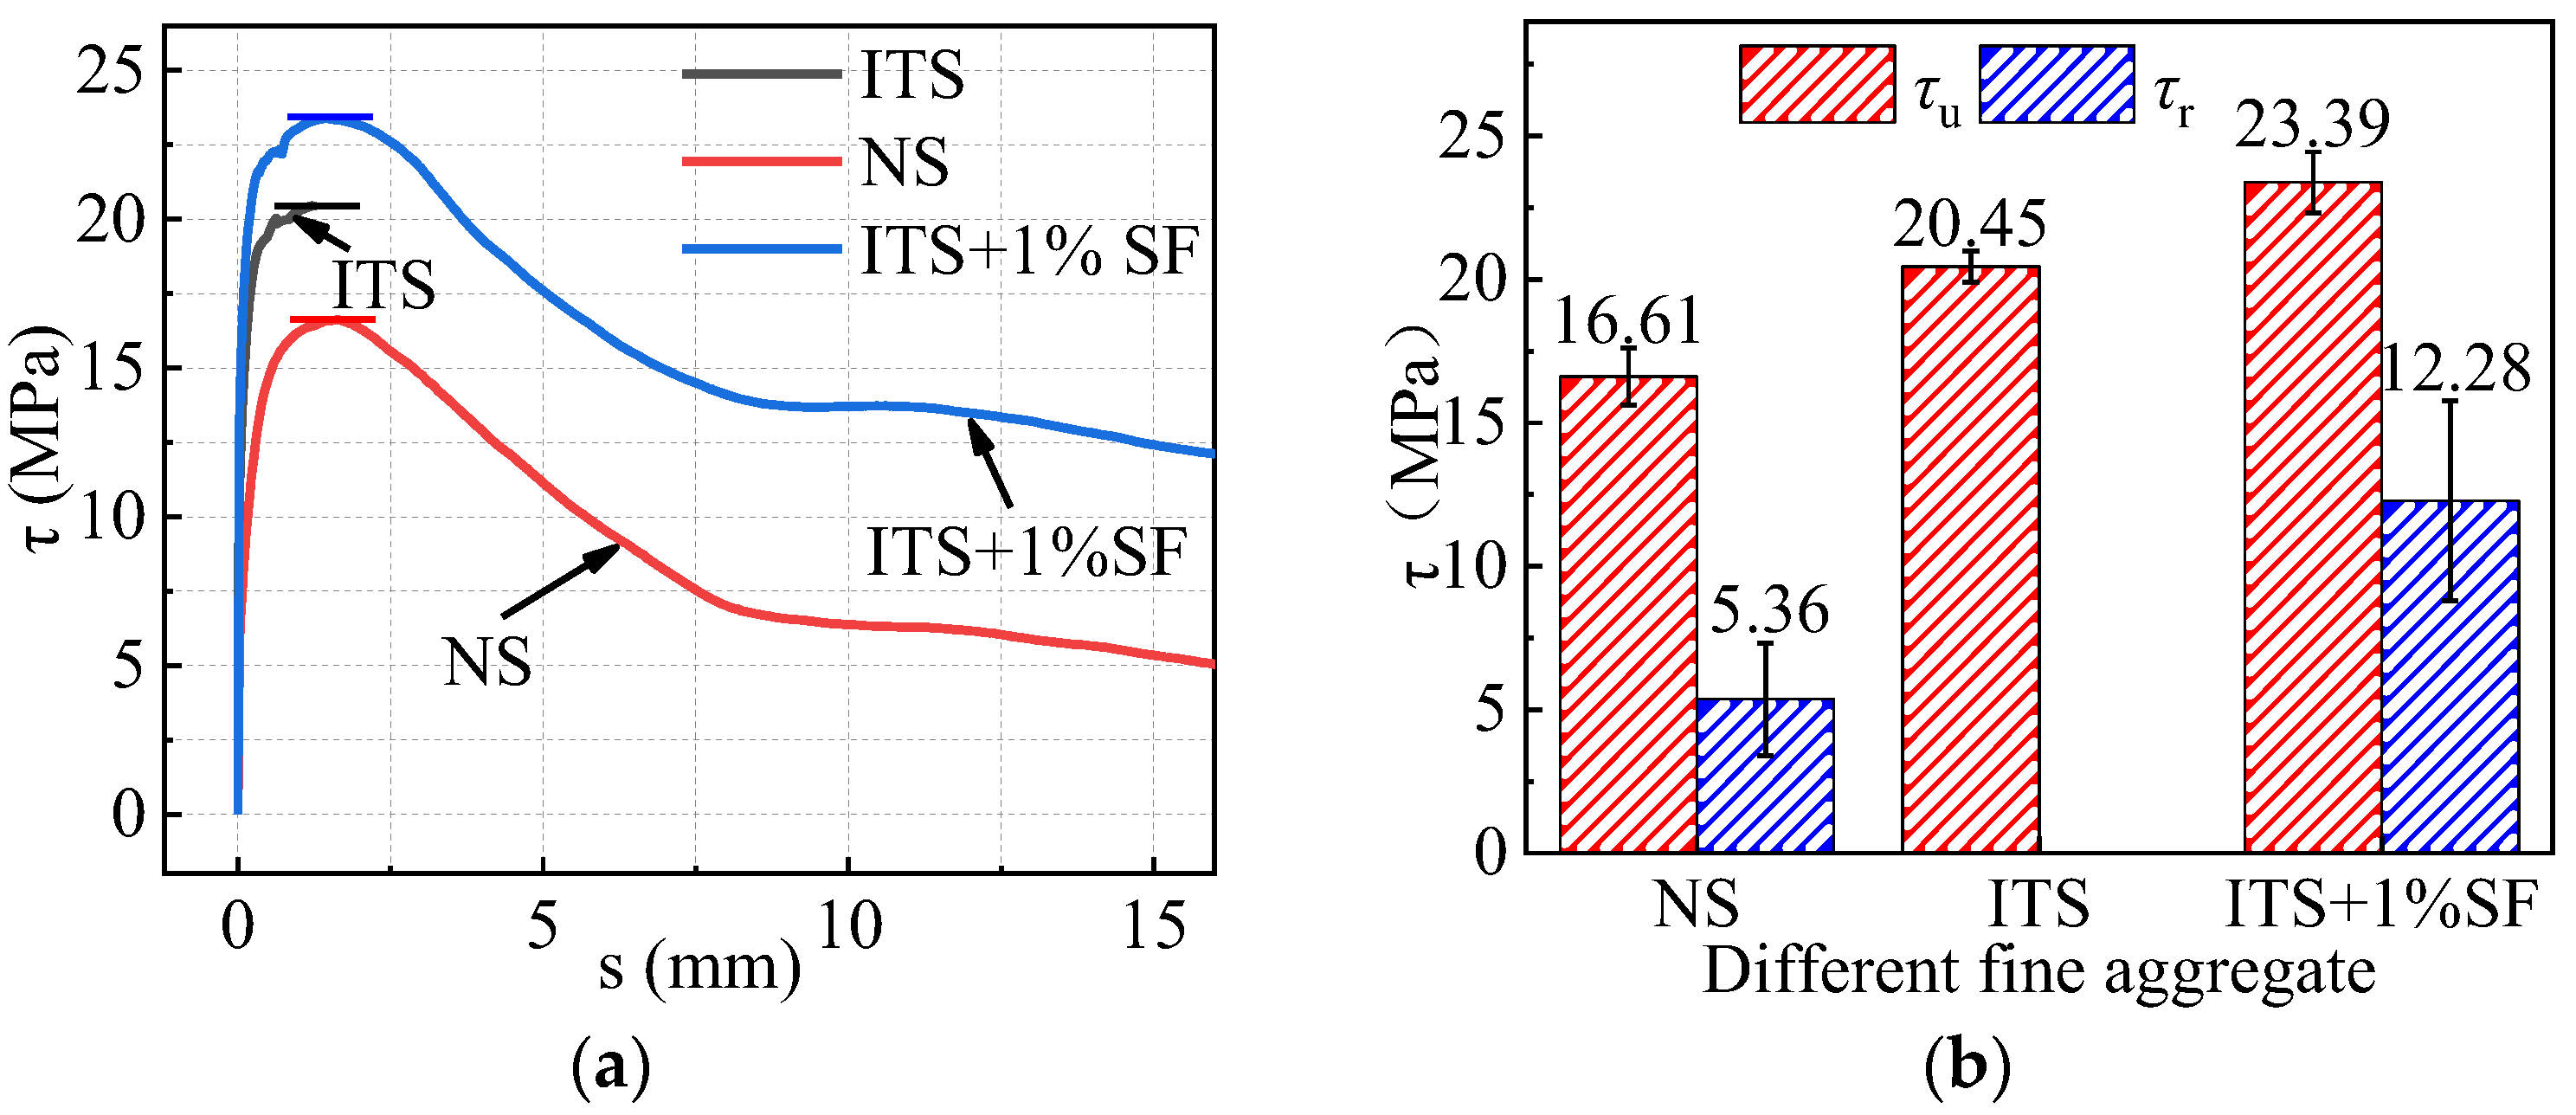
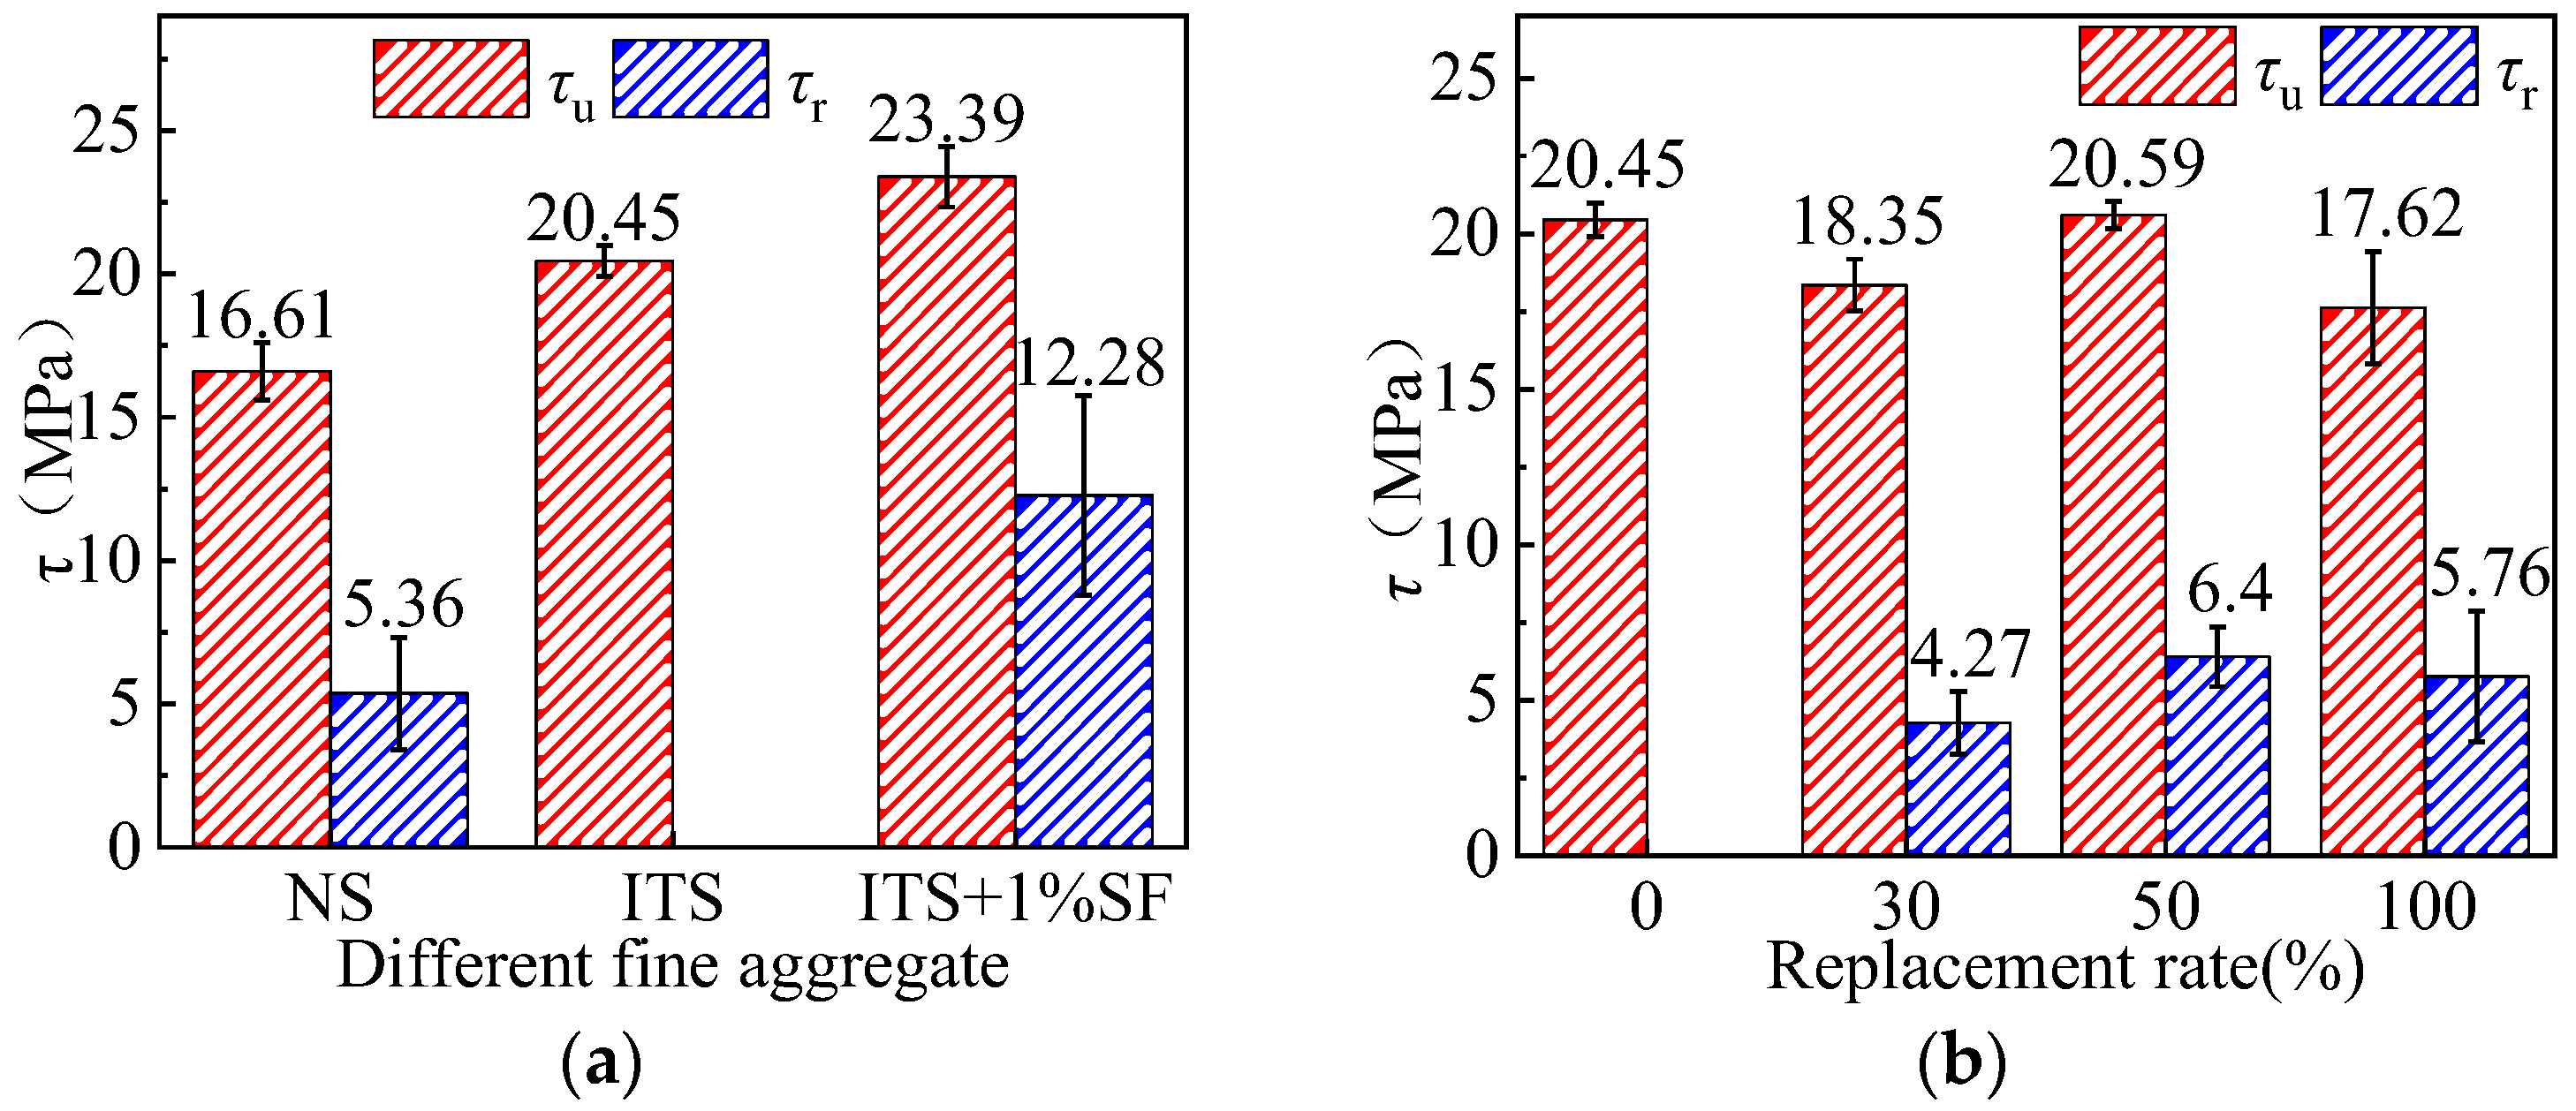
3.3.1. Effect of ITS and Steel Fiber

The effect of fine aggregates and SF on τ–s under the same conditions is presented in Figure 7. Figure 7 and Table 3 show that the fcu of ITC was higher than that of NAC, but its ft was lower than that of NAC. After adding 1% steel fiber to ITC, fcu was slightly improved, and ft was considerably improved. Compared with C45-R0-P0-NS, C45-R0-P0 (the ITS concrete specimen) suffered splitting failure, and its τu increased by 23.12%. The failure type of the steel fiber ITS concrete specimen (C45-R0-P0-SF) was pullout failure, and its τu and τr increased by 40.82% and 129.10%, respectively.
According to NS with ITS, as shown in Table 2, the fcu of concrete increased by 11.39% and ft decreased by 5.15%. Radial cracks were generated inside and swiftly developed to the surface of the specimen, resulting in splitting failure. Given that ITS particles are rough, angular, and have a high internal friction, the fluidity of concrete prepared with tailing sand is worse than that of ordinary concrete, and the concrete easily segregates and bleeds [34], thereby reducing the ft of ITS concrete.
As shown in Table 2 and Table 3, compared with specimen C45-R0-P0, after adding 1% steel fiber, the ft and fcu of concrete increased by 78.73% and 4.51%, respectively. The maximum bond strength increased by 14.38%. Adding steel fiber could prevent the instant cracking of the bonded sample, postpone the internal dehiscence of the concrete, and maintain a high RAC carrying capacity. The bridging effect of SF could sufficiently suppress fissure development in RAC, so the RAC specimens failed in a malleable form over the course of the experiment [12].

3.3.2. Effect of RA Substitution Rate

The impact of different RA displacement rates on the bond stress–slip curve is given in Figure 8. Compared with the C45-R0-P0 specimen, when the content of RA was 30% and 100%, the τu of RAC decreased by 10.27% and 13.84%, respectively; when the content of RA was 50%, the maximum bond strength of RAC increased by 0.68%. Compared with the specimen with an RA content of 30% (C45-R30-P0), when the RA content was 50% and 100%, the residual bond strength increased by 49.88% and 34.89%, respectively. When the content of RA was 50%, the maximum bond strength of ITRAC was nearly the same as that of ITNAC, and the other contents were all lower than those of ITNAC. Therefore, the τu of ITRAC was generally lower than that of ITNAC due to the presence of the original interface transition zone; many microcracks were present on the surface and weakened the mechanical properties of RA, which in turn reduced the bond strength of RAC [12,35]. These experimental results are consistent with the results of the existing literature [8,10], which found that compared with NAC, the τu of RAC specimens was reduced by 40.47% when the RA displacement rate was 72% [8]. Meanwhile, when the RA displacement rate was 20%, 50%, and 100%, the maximum bond strength of the RAC specimens decreased by 9.28%, 16.19%, and 27.37%, respectively [10]. Compared with the NAC specimens in literature [8,10], the decrease in the maximum bond strength of RAC specimens was higher than the test results of this study, because the iron tailings mixed in the recycled aggregate concrete improved the mechanical properties of RAC, thereby improving the maximum bond strength of RAC [26,27,28]. Under the joint action of ITS and recycled aggregate, the bond strength of the ITRAC specimens was higher than that of NAC. Compared with the C45-R0-P0-NS specimens, when the RA content was 30%, 50%, and 100%, the maximum bond strength increased by 10.48%, 23.96%, and 6.08%, respectively. When the content was 30%, the residual bond strength decreased by 20.34%. When the content was 50% and 100%, the residual bond strength increased by 19.40% and 7.46%, respectively.

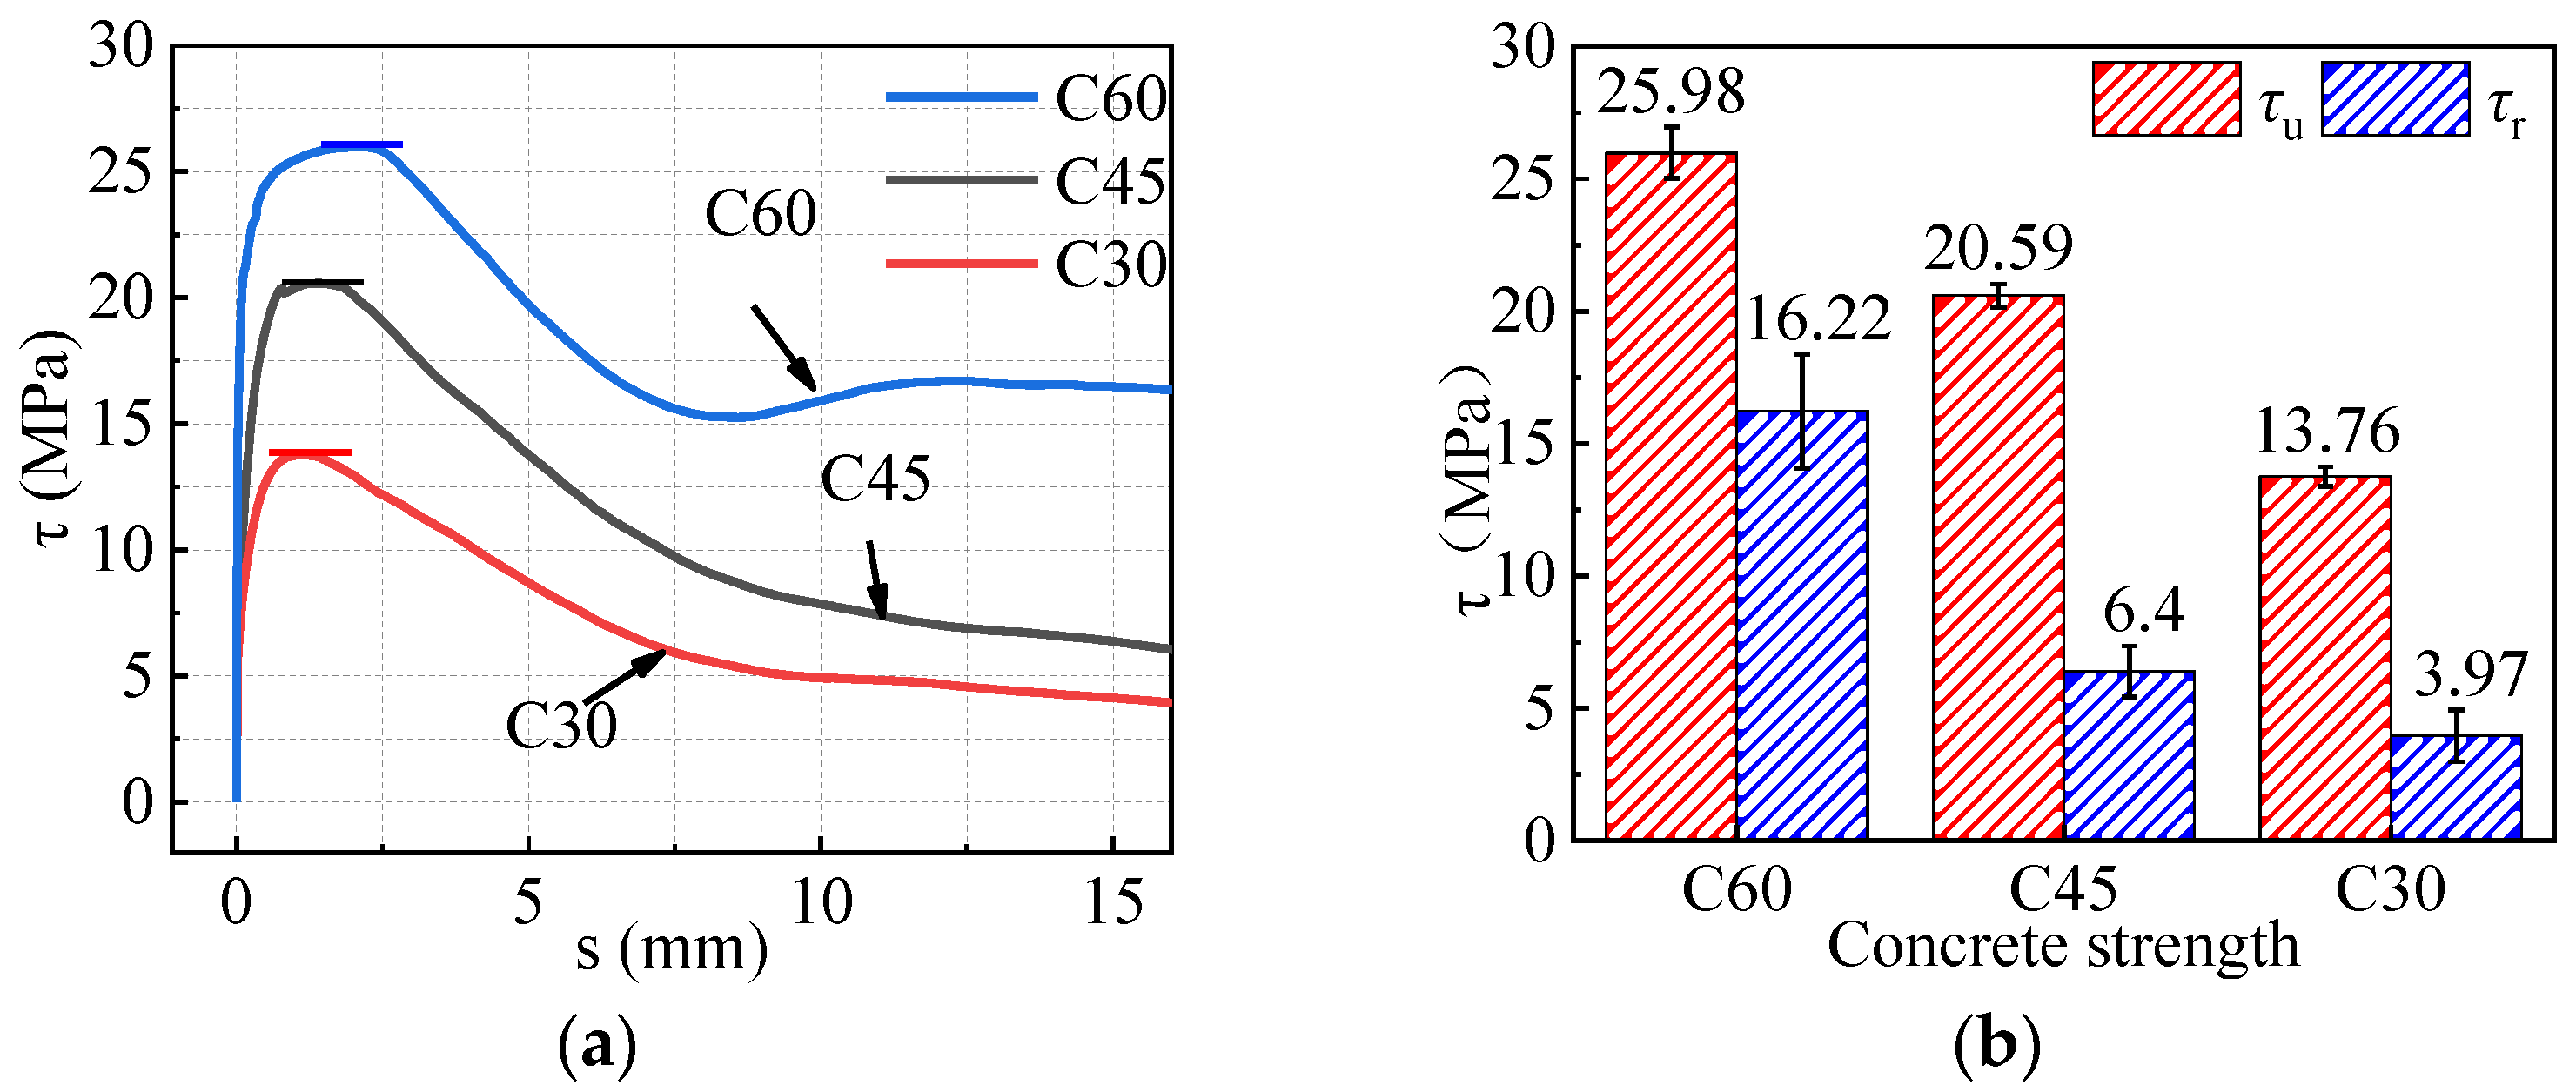
3.3.3. Effect of Concrete Strength

The τ–s of different concrete strengths are presented in Figure 9. The specimens with different concrete strengths were all pullout failures. As the concrete strength increased, τu and τr increased. Specimens C30, C45, and C60 had τu of 13.76, 20.45, and 25.98 MPa, respectively, and τr of 3.97, 6.40, and 16.22 MPa, respectively. Compared with the C30 specimen (C30-R50-P0), τu increased by 48.62% and 88.81% and τr increased by 61.21%, and 308.56%, respectively. The bond strength of the ITRAC specimens increased with the increase in concrete strength, which was consistent with the rule for the bond strength and concrete strength of ordinary concrete [22] and RAC [19,36]. The higher the concrete strength grade, the stronger the compressive and splitting resistance of the specimen, the greater the resistance provided by the concrete between the steel bar ribs, the greater the external work required for bond failure, and the better the bond performance.

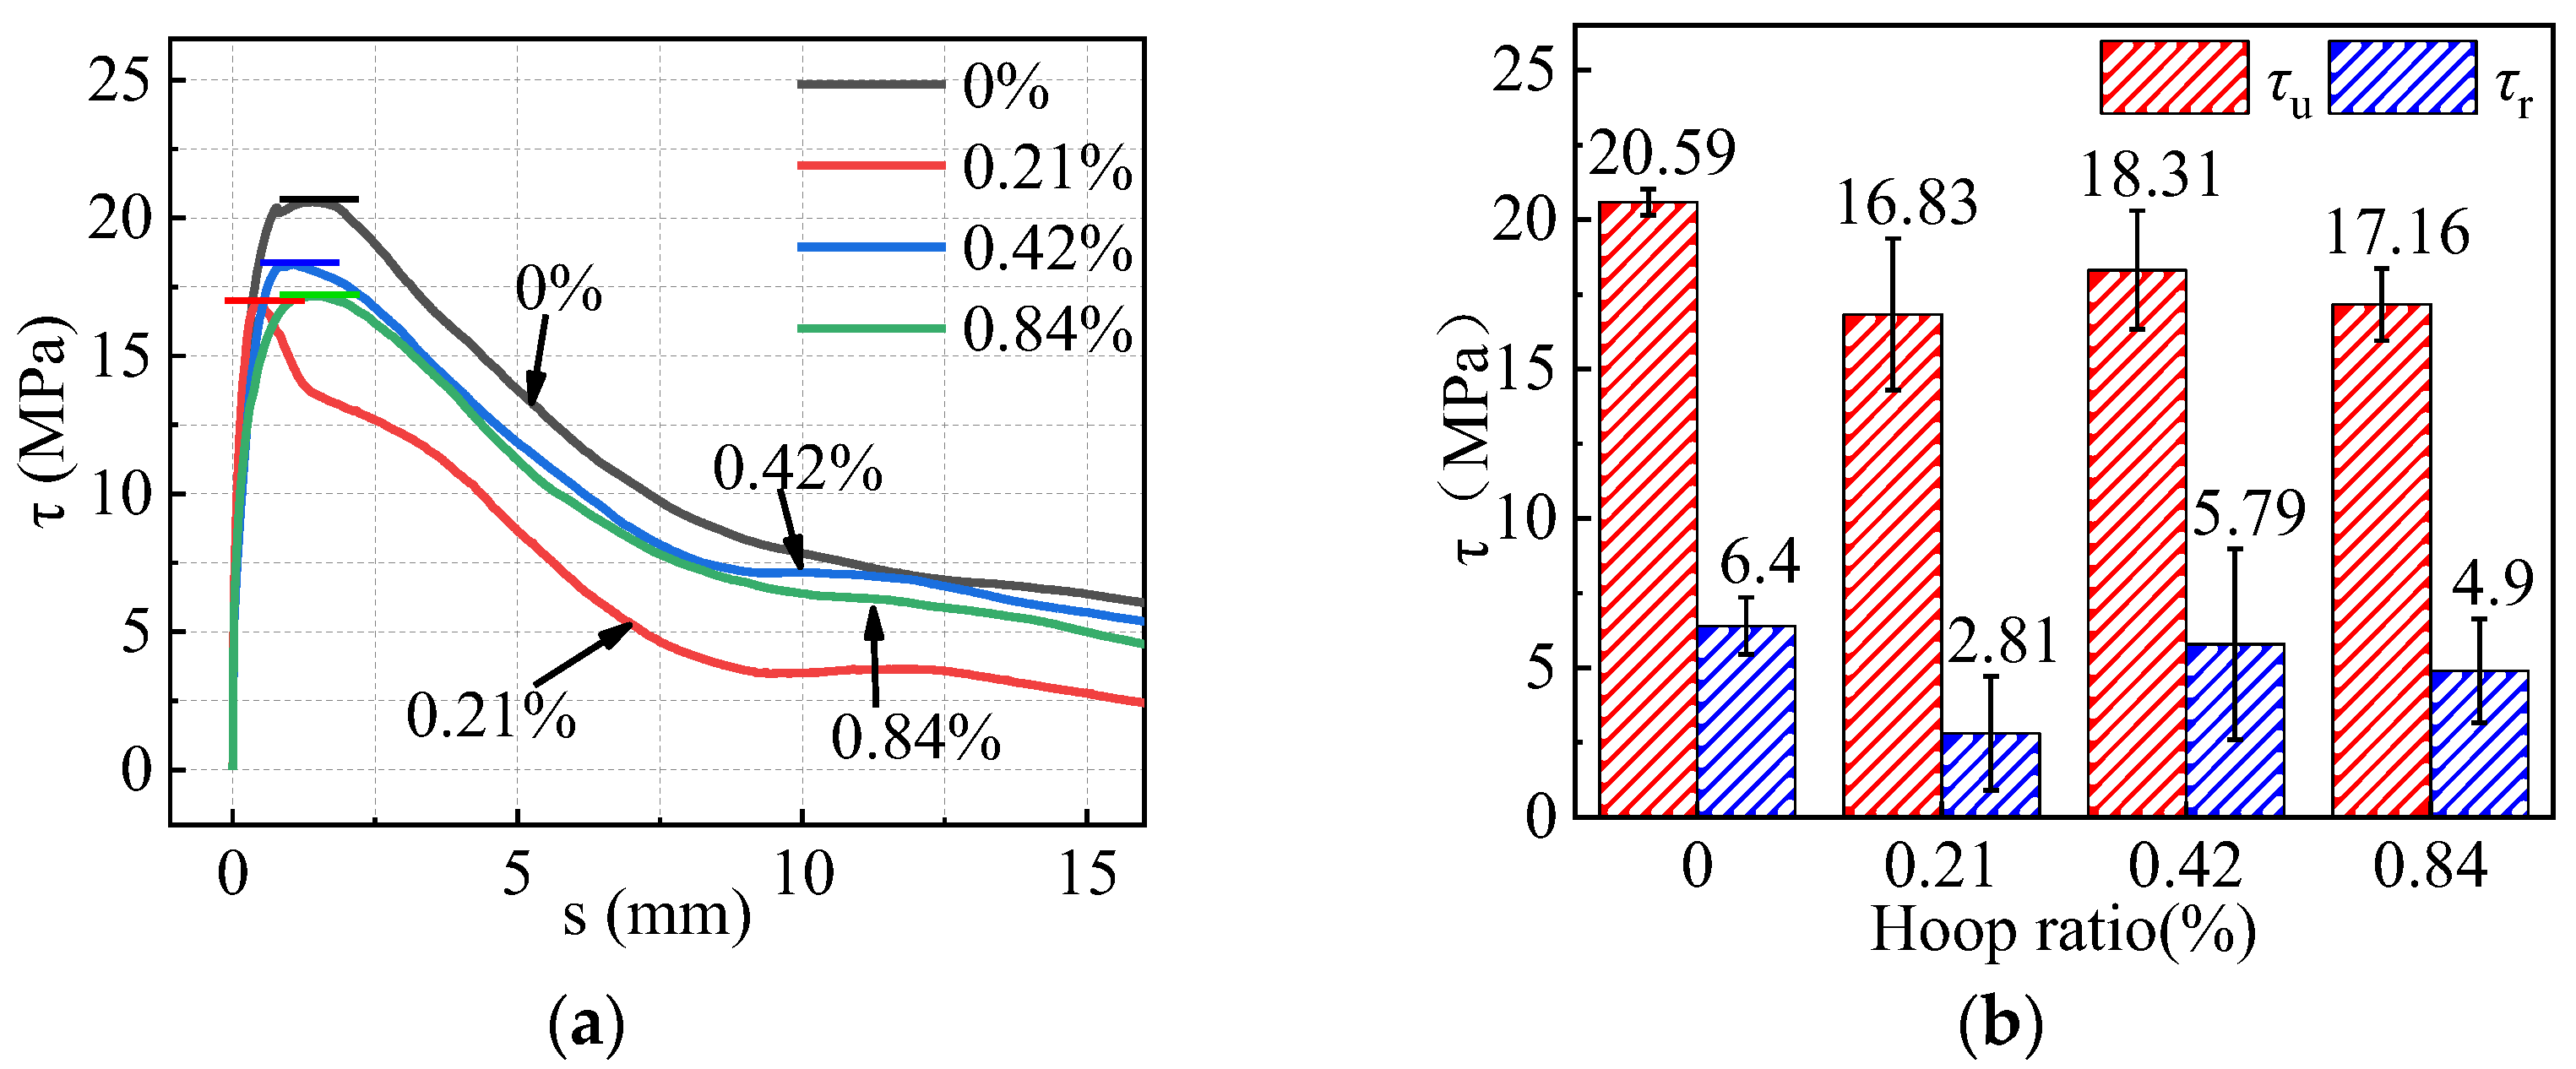
3.3.4. Influence of the Hoop Ratio

The τ–s under distinct hoop ratios are given in Figure 10. As indicated, τu decreased after the stirrups were configured, and the maximum bond strengths were 20.59, 16.83, 18.31, and 17.16 MPa at ratios of 0%, 0.21%, 0.42%, and 0.84%, respectively. Compared with C45-R50-P0, the τu of the bonded specimens with stirrup ratios of 0.21%, 0.42%, and 0.84% decreased by 18.26%, 11.07%, and 16.66%, respectively. This finding was in accordance with the results of the existing literature [36]. This can be explained as follows: the thickness of the protective layer of the specimen was 67 mm, which could provide sufficient gripping force to avoid splitting and damage to the specimen. After the stirrup was arranged, the vibration of the concrete mixture was affected, and the compactness of the concrete decreased. The mechanical properties were reduced, leading to a reduction in the τu of the specimen.
As indicated in Table 3, compared with the specimen with splitting failure (C45-R0-P0), the bond stiffness of the specimens with stirrup ratios of 0.21%, 0.42%, and 0.84% increased by 133.53% and 3.04%, and decreased by 32.22%, respectively. The stirrups improved the toughness of the ITRAC specimen, but when the stirrup ratio was 0.84%, the bond stiffness decreased. This result may be due to the small spacing of the stirrups, which affected the vibration of the concrete mixture and reduced the compactness, resulting in low mechanical properties.

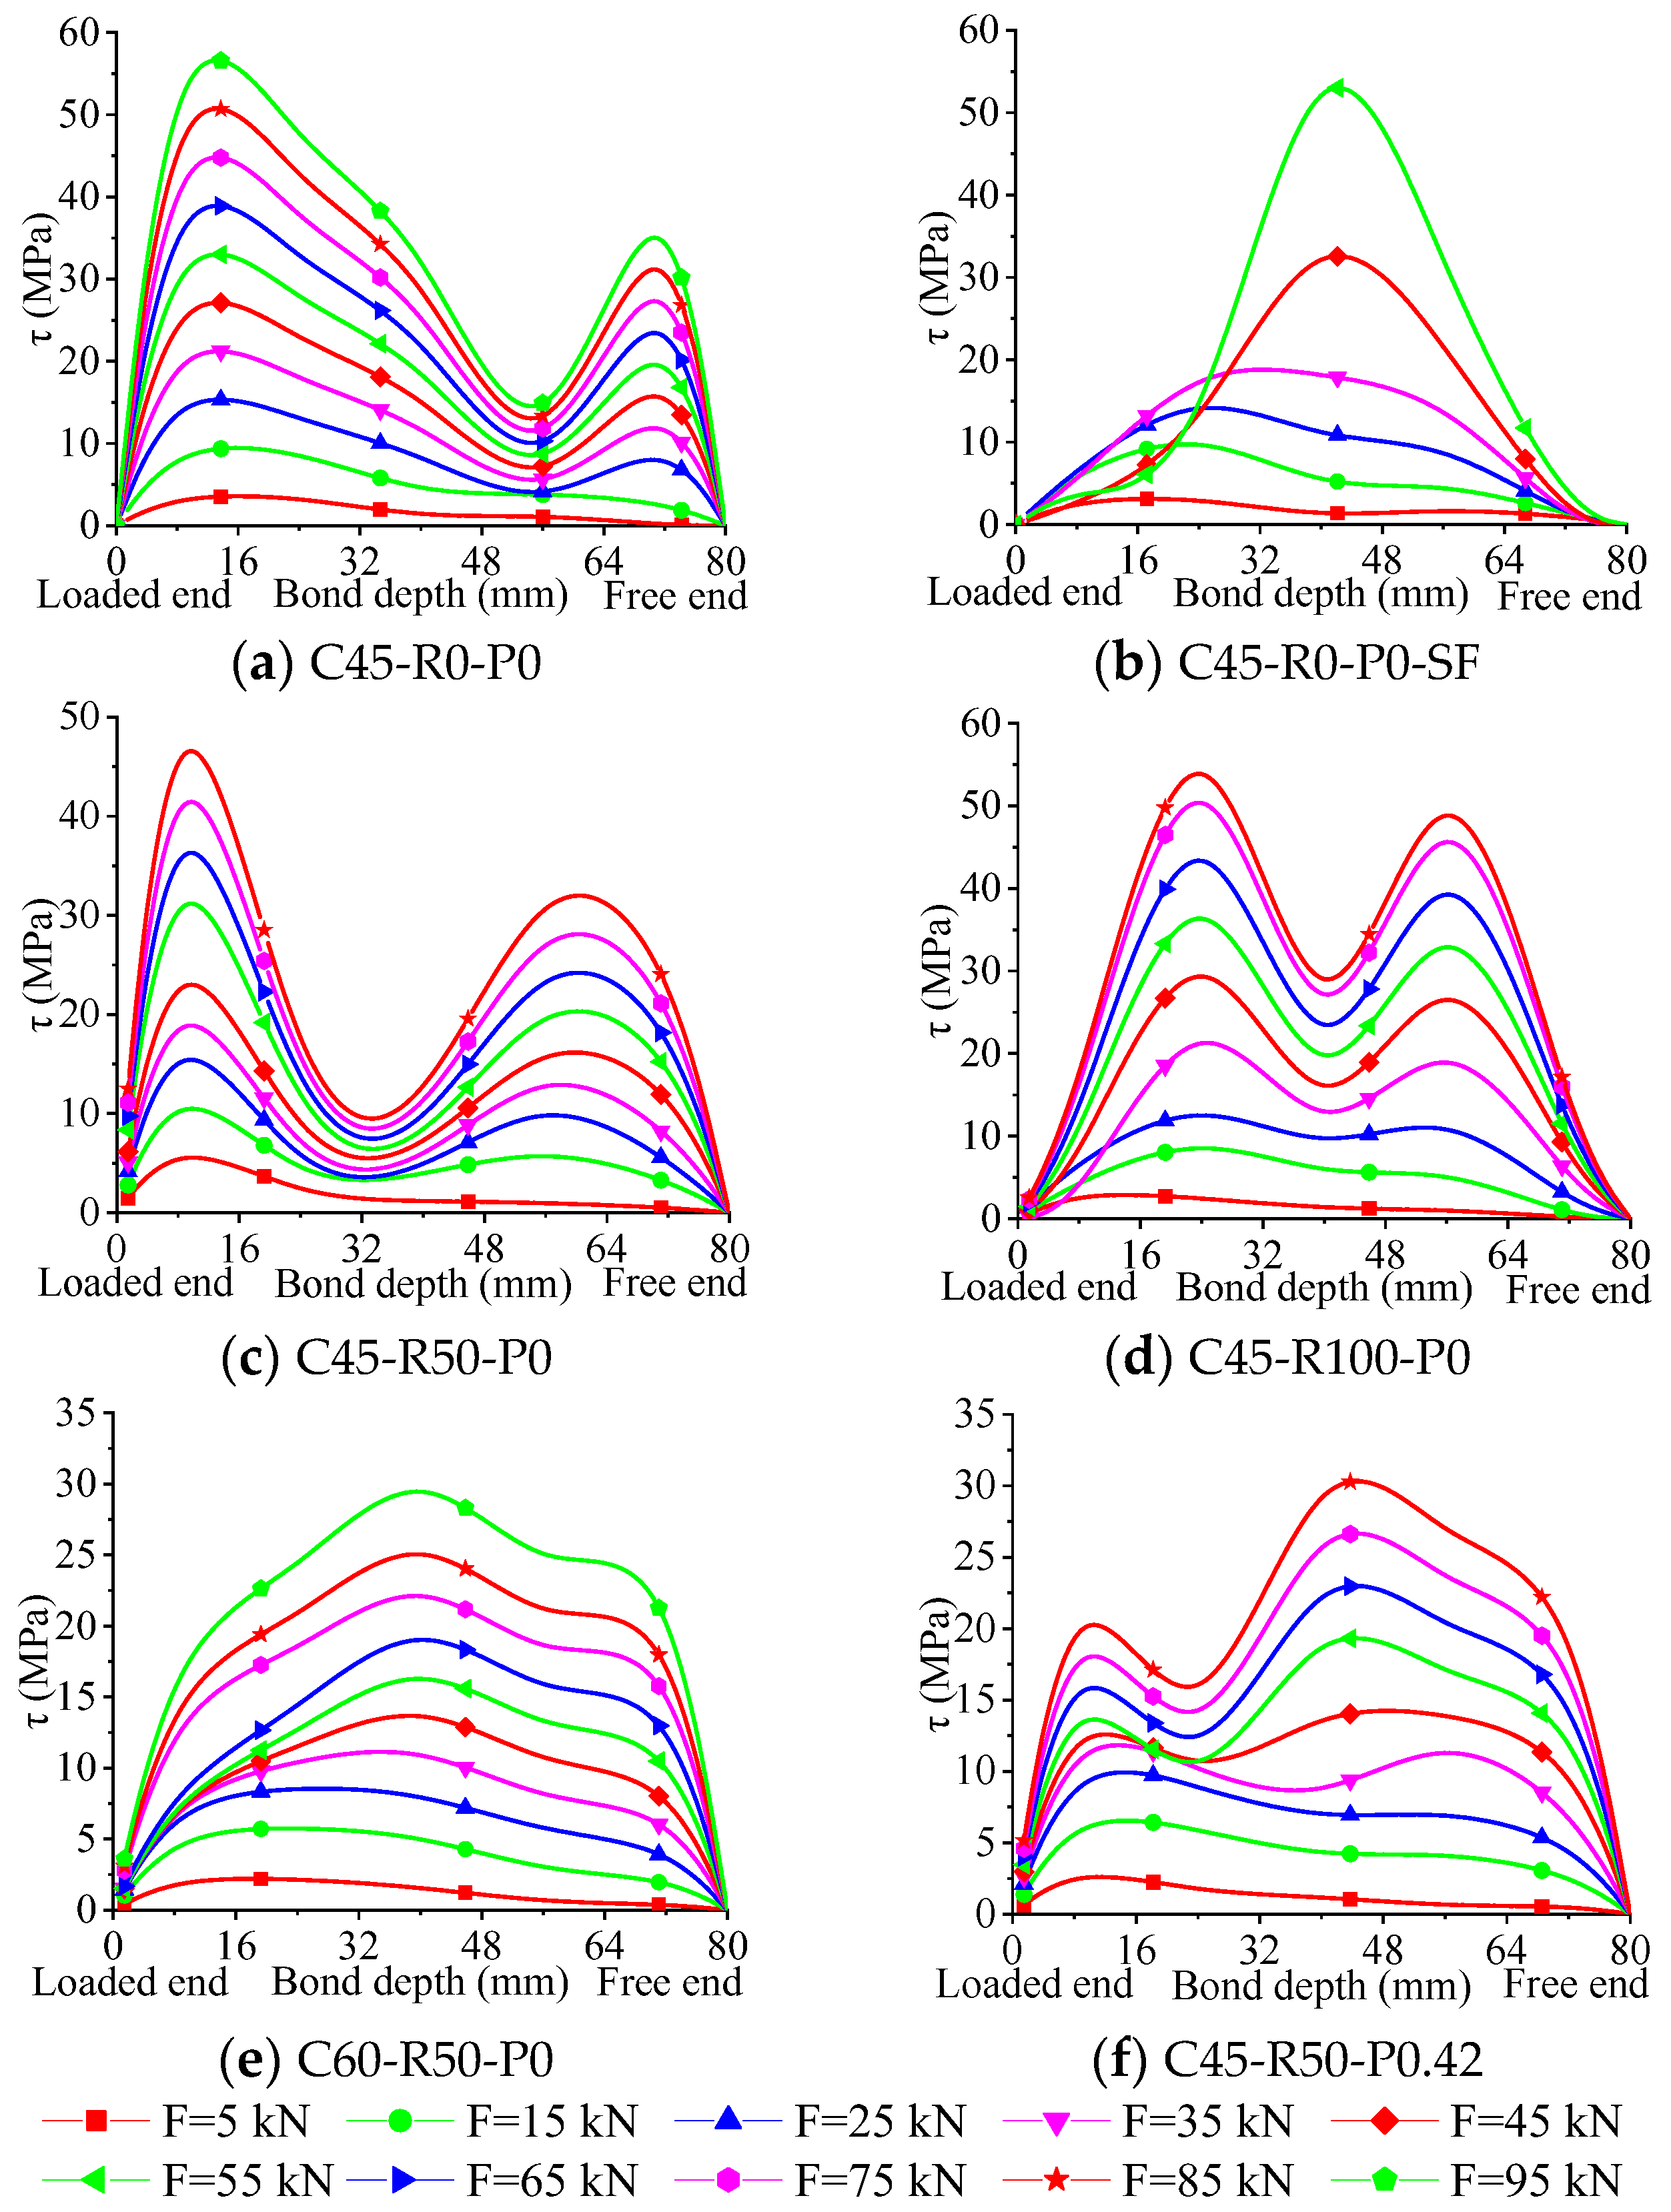
3.4. Spread of Bonded Stress along the Bonded Section

The bond stress distribution diagram of the specimens is presented in Figure 11. The bond stress spread was not tested because the strain gauge failed after the test piece C45-R0-P0-SF was loaded to 55 kN. According to Figure 11, the bond stress distribution curves of the specimens were similar in shape at each loading level, with one or two peak stresses, and the difference between the two peaks at the initial stage of load-on was small. With the increase in load, the maximum peak stress increased rapidly to a significant degree, and the sub-peak stress increased slowly to an extensive degree. After experiencing a specific load, the shape of the distribution curve tended to be stable, and only the closed area between τ(x) and the coordinate axis x gradually increased. Specimens C45-R0-P0-SF and C60-R50-P0 had only one bond stress peak. The other specimens had two bond stress peaks.
The homogenization of the bond stress spread was improved after the recycled aggregate was added to the iron tailing concrete. Specifically, the ratio of the two peaks on the bond stress distribution curve decreased. When the load was 55 kN, the specific values of the maximum peak stress relative to the peak stress of specimens C45-R0-P0, C45-R50-P0, and C45-R100-P0 were 1.69, 1.54, and 1.11, respectively. The uniformity of the bond stress distribution was improved, which was consistent with the experimental results in the literature [37]. The ratio of the maximum peak stress to the second peak stress of the prepared stirrup specimen C45-R100-P0.42 was 1.42, and the uniformity was improved. The increase in strength of RAC or the addition of steel fibers could improve the bond stress distribution. For specimens C45-R50-P0, C60-R50-P0, and C45-R50-P0.42, the average bond stress ratios were 2.28, 1.19, and 1.41, respectively.

3.5. Bond Strength Formula and Bond–Slip Constitutive Relation

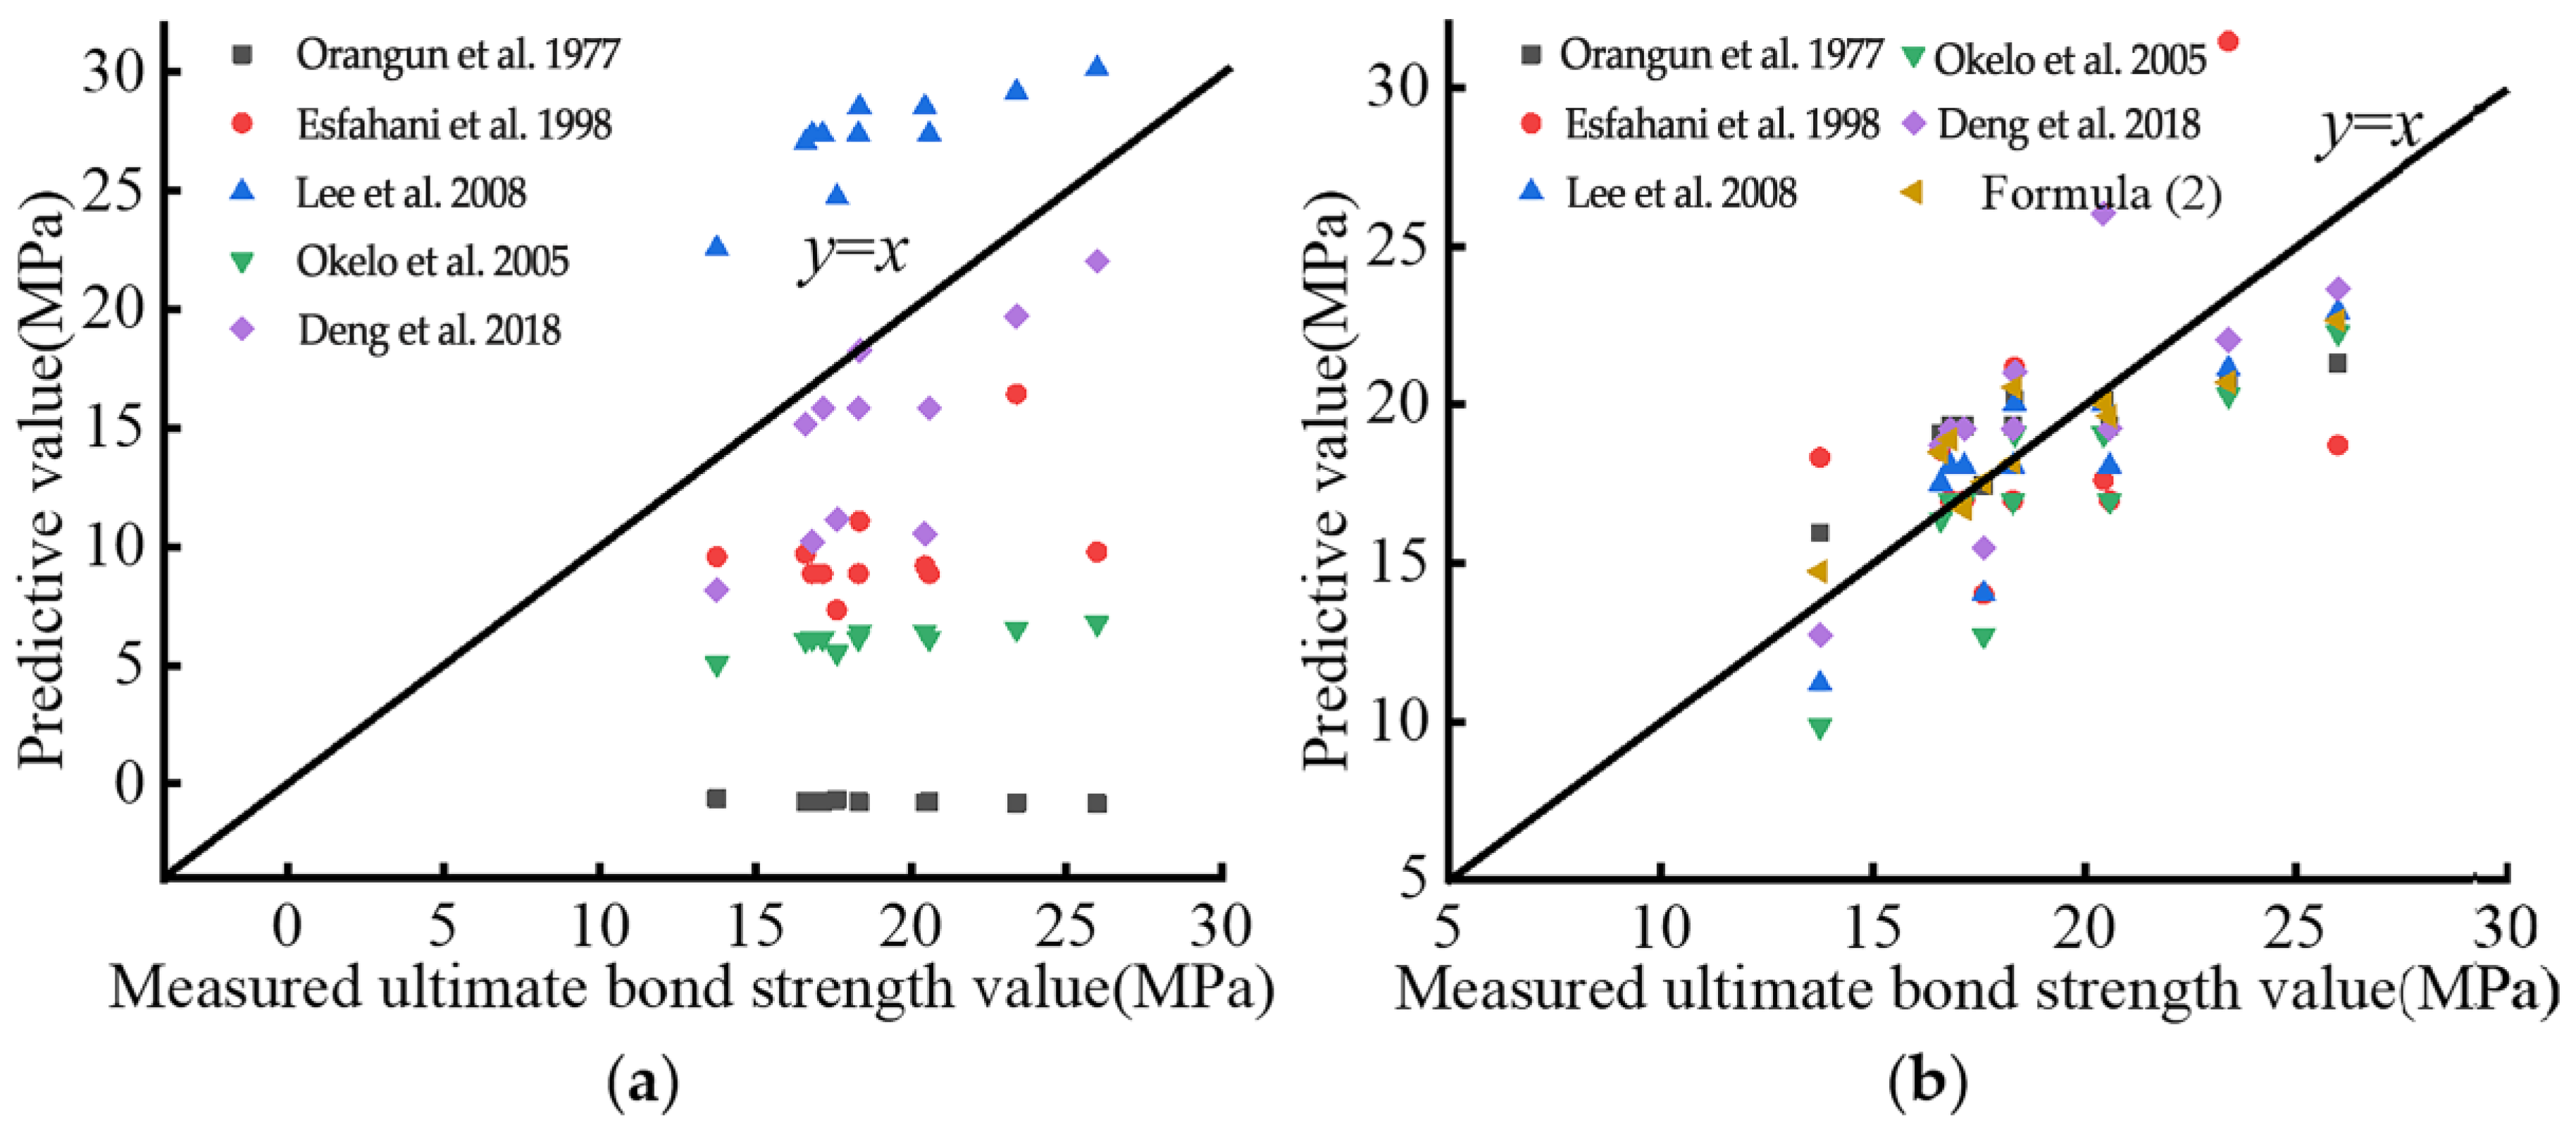
3.5.1. Bond Strength Formula

Previous studies [38,39,40,41,42] have investigated the law of change between bond strength and concrete strength. Table 4 comprehensively considers the bond failure mechanism, concrete type, and other factors, and combines the test data to establish the formula for the law of change between bond strength and concrete strength.
In accordance with the literature [38,39,40,41,42], the calculated bond strength was obtained, and the ratio between it and the measured value is shown in Figure 12a. Considerable distinctions were observed between the two values. Using the test data, the formula proposed in the literature [38,39,40,41,42] was corrected, and the calculated and measured values of the bond strength were compared, as shown in Figure 12b. According to Table 5 and Figure 12b, the data calculated by Deng Mingke had a high degree of agreement with the test data in this study, but the formula had less variables. The data calculated by Orangun CO were slightly less consistent with the experimental data in this study when compared with the data of Deng Mingke, but the formula had many variables. By combining the advantages of the two, a formula for calculating bond strength was established through matching assays from the test data (Formula (2)). The calculation results of Formula (2) were then compared with the experimental results in Table 5. The average specific value of the predicted value for the maximum bond strength relative to the measured bond strength value was 1.007, the standard deviation was 0.085, the correlation coefficient was 0.883, the determining coefficient was 0.91, and the fitting accuracy of Equation (2) was high. Table 5 and Figure 12b show that the calculation results of Formula (2) fit the test data well and can be used to predict the maximum bond strength of ITRAC.
τ u = ( 1 + 0 . 0825 R - 0 . 1813 P - 40 . 4153 D L + 1.9264 c D ) ( f cu ) 0.7432
where R is the displacement rate of RA, P is the stirrup ratio, L is the bonding length, D is the diameter of the bonded reinforcing bar, c is the concrete cover thickness, and fcu is the measured value of the cubic compressive strength.

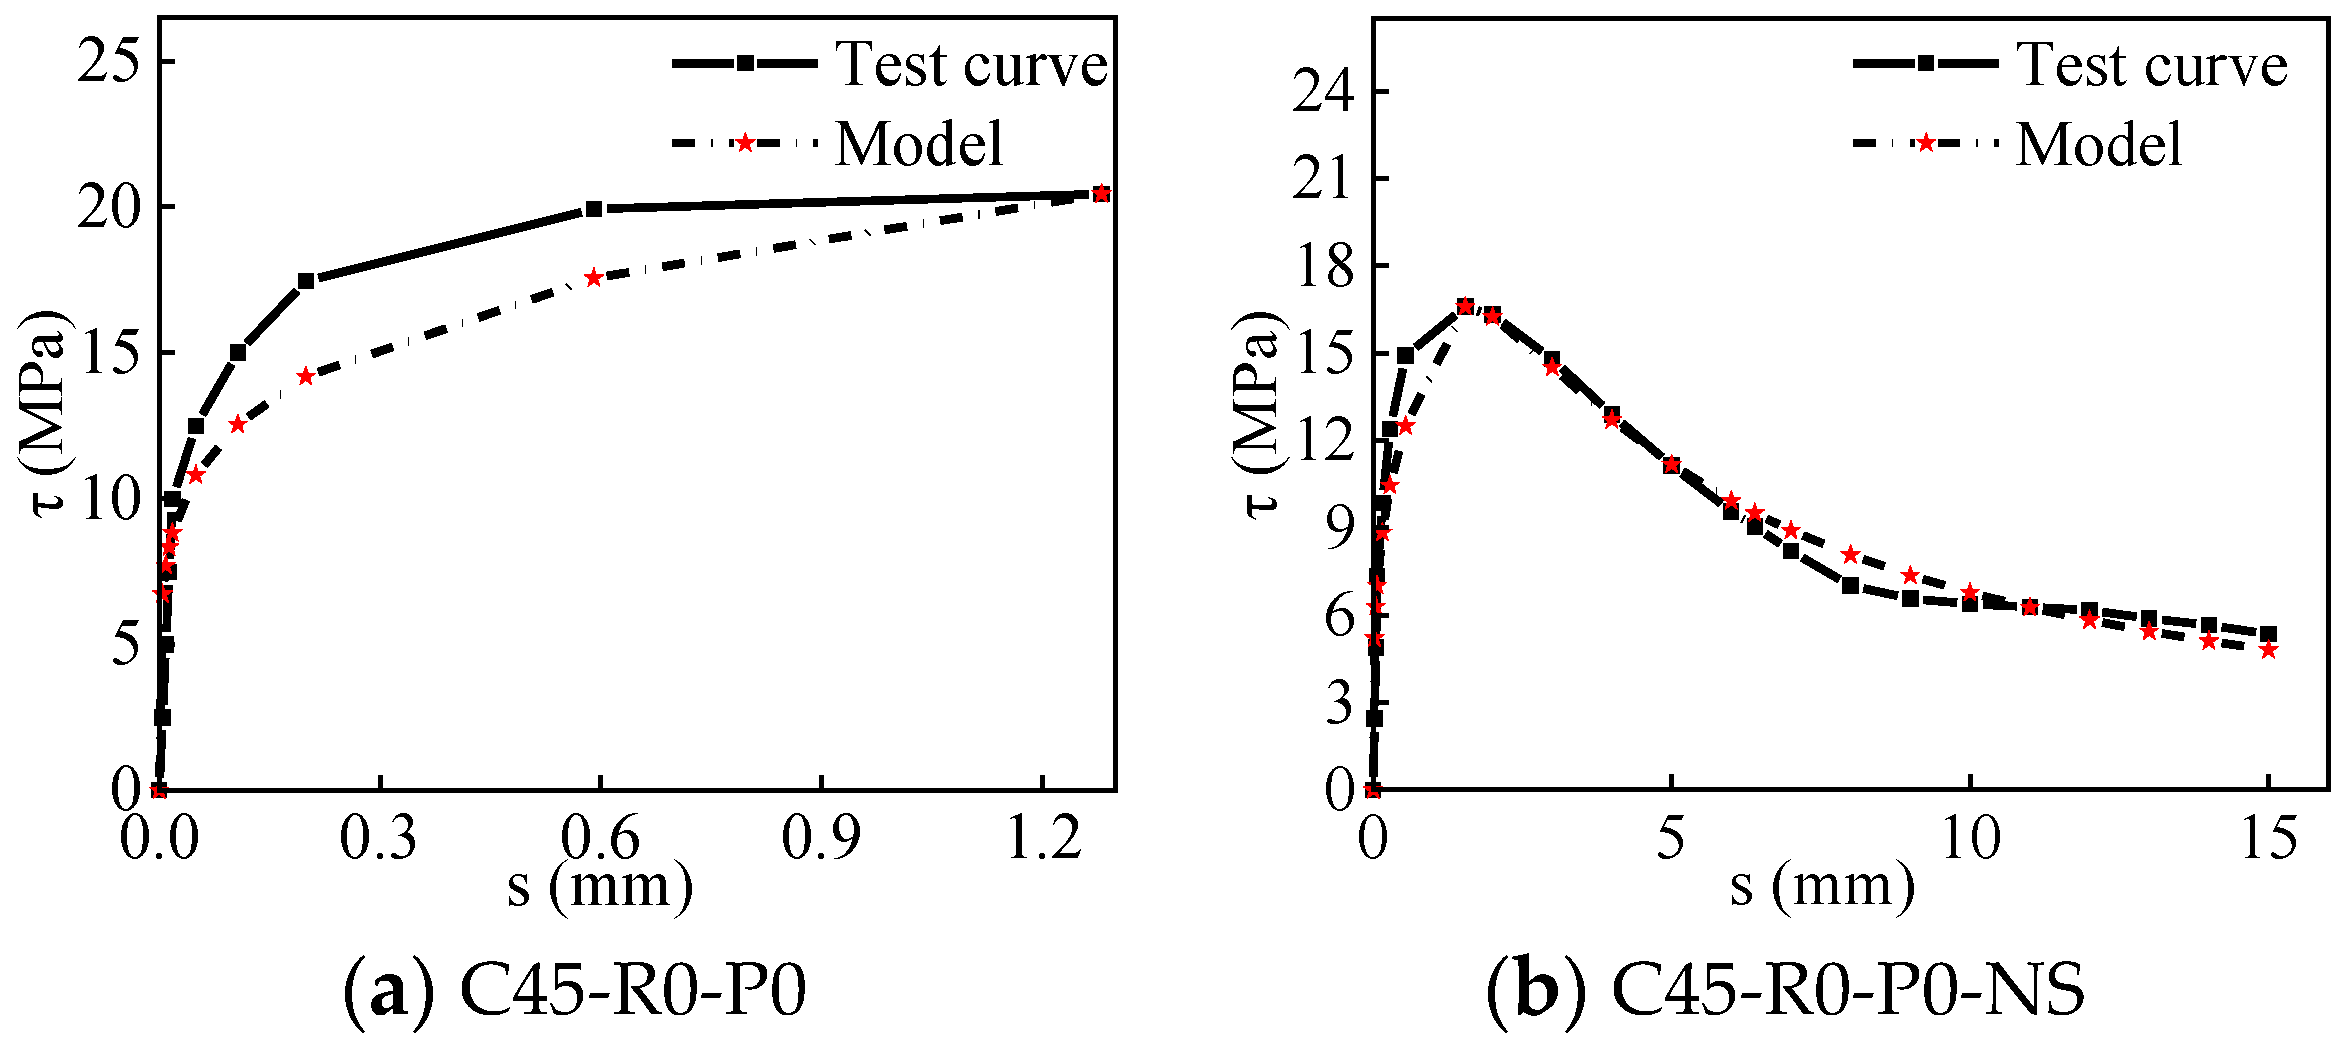
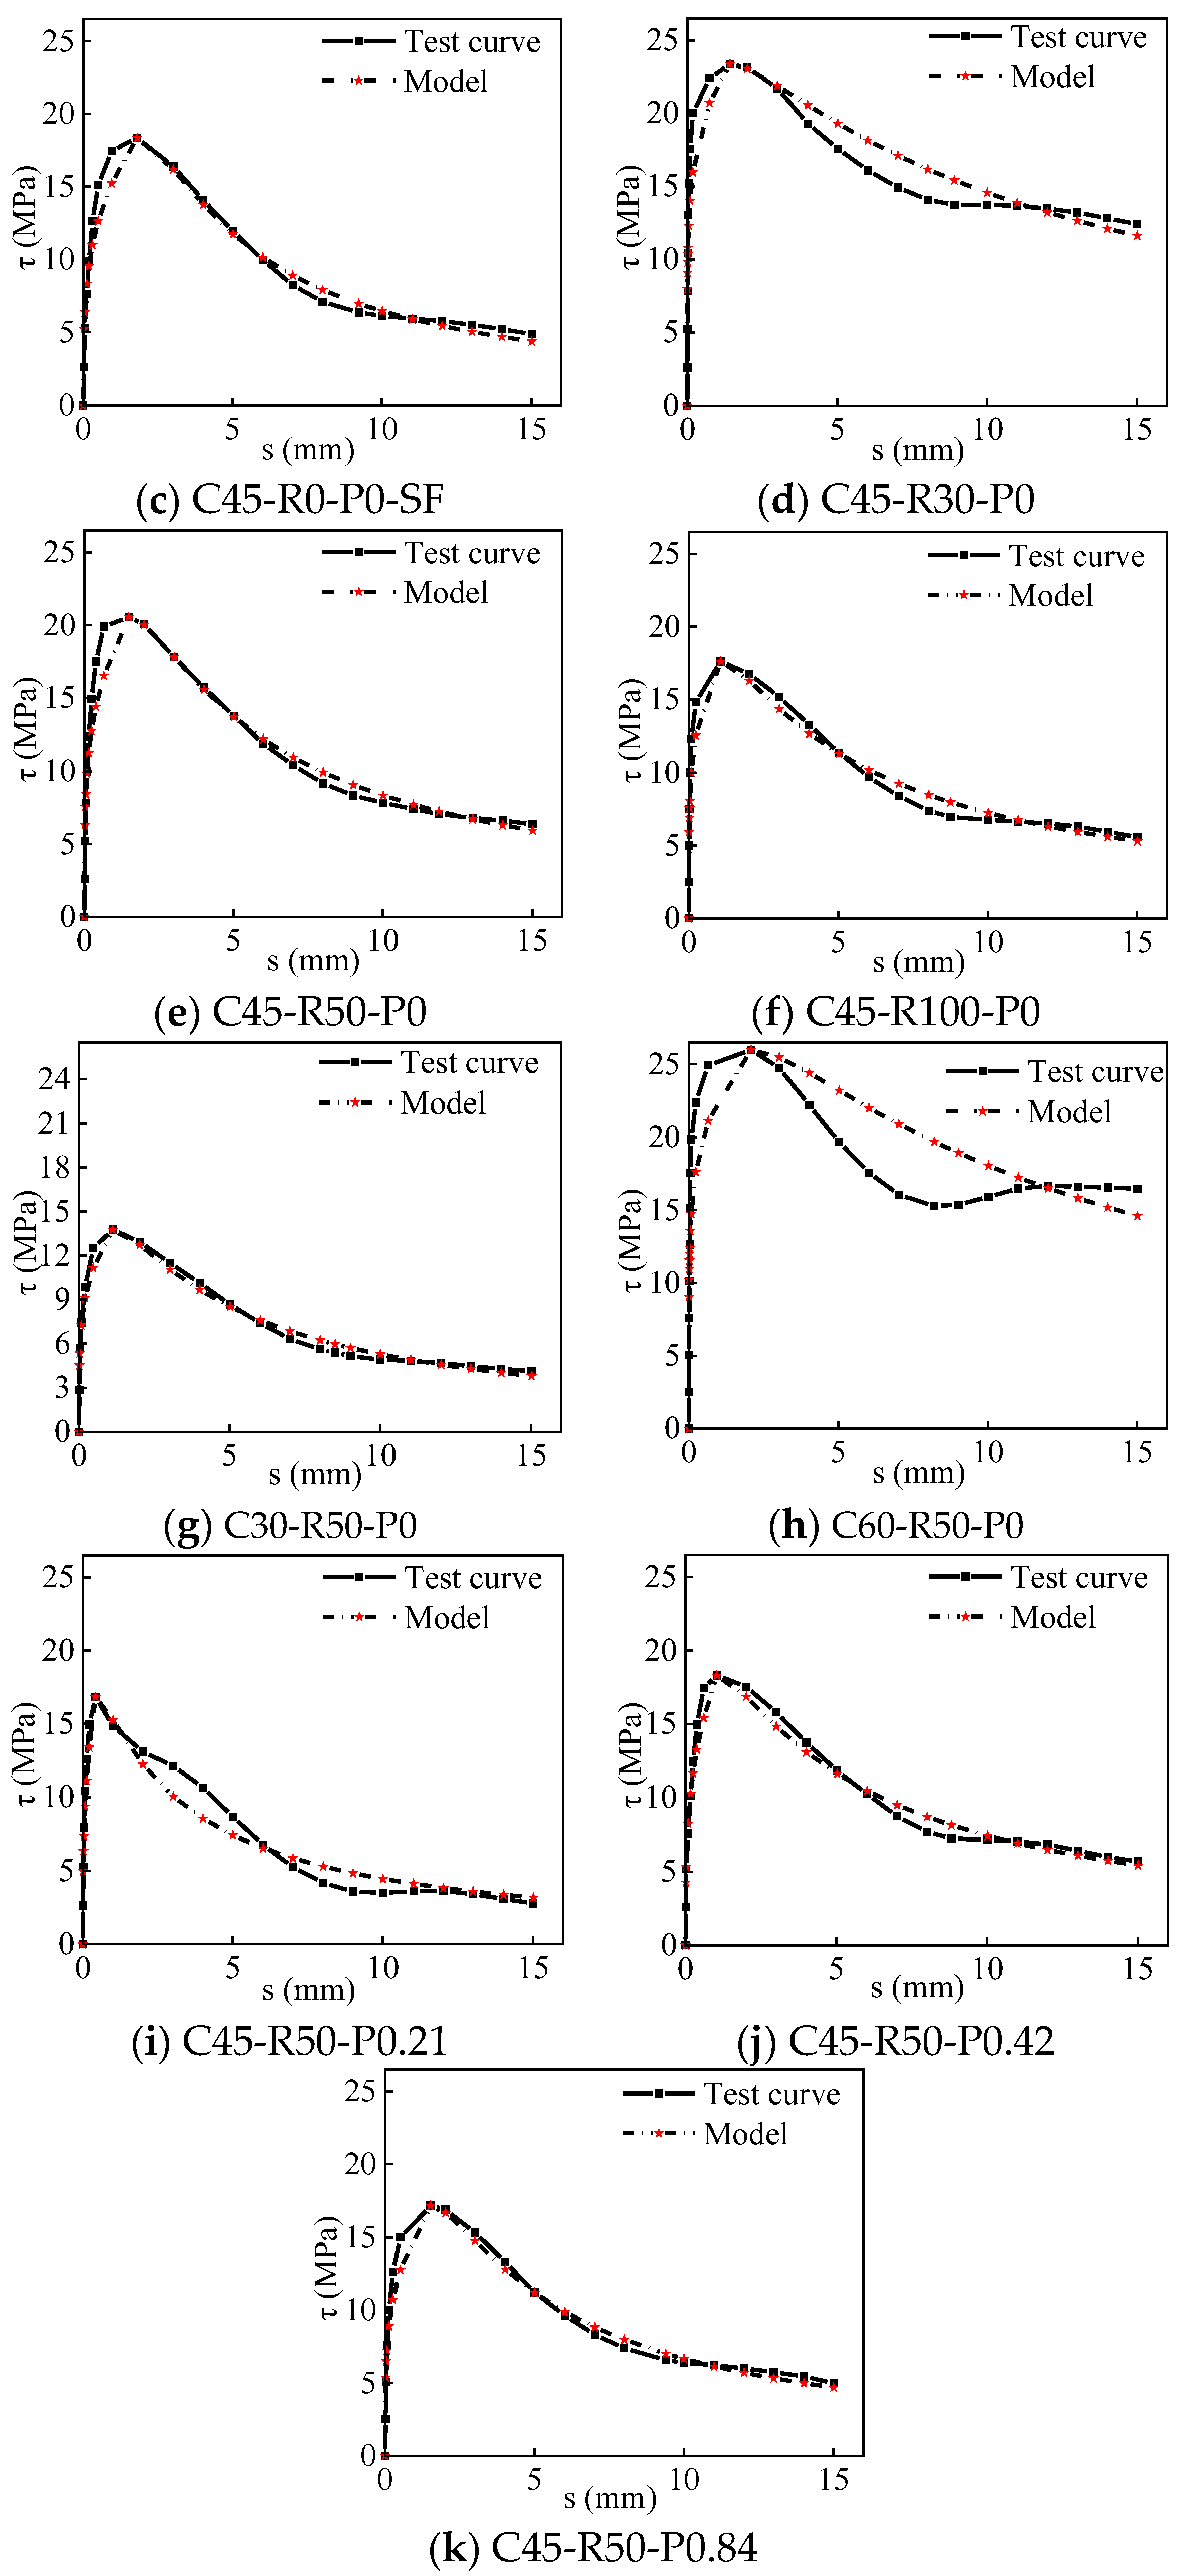
3.5.2. Bond–Slip Constitutive Relation

As indicated in Figure 6, the τ–s of ITRAC and ribbed steel bars can be divided into micro-slip, slip, and residual sections according to the shape and characteristics of τ–s. The bond–slip constitutive relationship between ITRAC and ribbed steel bars can adopt the model shown in Formula (3) [11].
τ = { τ u ( s / s u ) α s s u τ u s / s u b ( s / s u 1 ) 2 + s / s u s > s u
According to the least squares method, the regression model parameter α is 0.7432. As indicated in Figure 13, with the increase in the hoop ratio, the parameter α of the rising section of the model decreased, and the increasing area of τ–s increased slowly, indicating that the configuration of the stirrups, the hoop effect, and the lateral restraint reinforcement effectively prevented the development and enlargement of interior damage, so the damage resistance of the test piece was improved.

4. Conclusions

Eleven groups (33 pieces) of steel bars and ITRAC bonded specimens were tested using central pullout tests, and the impact of parameters such as RA replacement rate, concrete strength, and hoop ratio on the bond of the reinforcing bars in ITRAC was analyzed. By placing strain gauges inside, the distribution law of the bonding stress in the bonding section was studied. The following main conclusions were derived.
After replacing NS with ITS, the specimen changed from pullout failure to splitting failure, and τu increased by 23.12%. After adding 1% steel fiber, pullout failure arose in the specimen, and τu and τr increased by 40.82% and 129.10%, respectively. The specimen (C45-R50-P0.21) suffered splitting–pullout failure. The rest of the ITRAC specimens showed pullout failure.
The maximum bond strength of ITRAC with recycled aggregate contents of 30%, 50%, and 100% was 10.48%, 23.96%, and 6.08% higher than that for NAC, respectively, and the residual bond strength was reduced by 20.34% when the content of RA was 30%. When the content was 50% and 100%, the residual bond strength increased by 19.40% and 7.46%, respectively.
With the increase in concrete strength, the τu and τr of the ITRAC specimens increased. Compared with the τu of the C30 specimens, the τu of the C45 and C60 specimens increased by 48.62% and 88.81%, respectively, and τr increased by 61.21% and 308.56%, respectively.
In comparison with the bonded specimens with stirrup ratios of 0.21%, 0.42%, and 0.84% and without hooping, the τu of the bonded specimens decreased by 18.26%, 11.07%, and 16.66%, respectively.
The bond stress distribution characteristics of the ITRAC specimens resembled those of RAC. C45-R0-P0-SF and C60-R50-P0 exhibited only one bond stress peak, whereas the other specimens had two bond stress peaks. The uniformity of the bonding stress distribution was improved after adding a recycled aggregate to the iron tailing concrete. The preparation of stirrups, addition of steel fibers, and increased strength of concrete increased the uniformity of the bonding stress distribution.
A statistical analysis was conducted based on the test data, and a formula for calculating the τu between ITRAC and steel bars was proposed. The calculation results were in agreement with the test results.
Using iron tailing sand instead of river sand and recycled aggregate instead of natural aggregate can solve the problem of a shortage of natural resources through the consumption of construction waste and industrial waste. The bond performance between recycled aggregate concrete and steel bars in iron tailings is better than that of natural aggregate concrete. It can be used in concrete structural members, increasing the use of construction waste and industrial waste, and reducing carbon emissions.

Author Contributions

Conceptualization, Q.Z. and J.C.; Methodology, Q.Z.; Software, X.S.; Investigation, J.C.; Data curation, Y.H. and X.S.; Writing—review & editing, Q.Z. and J.C.; Visualization, Y.H. and X.S.; Supervision, J.C.; Project administration, Q.Z. and J.C.; Funding acquisition, Q.Z. All authors have read and agreed to the published version of the manuscript.

Funding

The research was funded by the Henan Provincial Science and Technology Research Project, China (Grant No.212102310973, Grant No.222102320116 and No. 222102320219), and the National College Students’ Innovation and Entrepreneurship Training Program in 2022, China (Grant No. 202210485010).

Institutional Review Board Statement

Not applicable.

Informed Consent Statement

Not applicable.

Data Availability Statement

The data that support the findings of this study are available upon request from the authors.

Conflicts of Interest

The authors declare no conflict of interest.

References

  1. Chen, J.; Yuan, Y.; Zhu, Q.; Duan, J. High-temperature resistance of high-strength concrete with iron tailing sand. J. Build. Eng. 2023, 63, 105544. [Google Scholar] [CrossRef]
  2. Zhu, Q.; Yuan, Y.-X.; Chen, J.-H.; Fan, L.; Yang, H. Research on the high-temperature resistance of recycled aggregate concrete with iron tailing sand. Constr. Build. Mater. 2022, 327, 126889. [Google Scholar] [CrossRef]
  3. Bai, G.; Zhu, C.; Liu, C.; Liu, H. Chloride Ion Invasive Behavior of Recycled Aggregate Concrete under Coupling Flexural Loading and Wetting-Drying Cycles. KSCE J. Civ. Eng. 2019, 23, 4454–4462. [Google Scholar] [CrossRef]
  4. Duan, Z.; Poon, C.S. Properties of recycled aggregate concrete made with recycled aggregates with different amounts of old adhered mortars. Mater. Des. 2014, 58, 19–29. [Google Scholar] [CrossRef]
  5. Shettima, A.U.; Hussin, M.W.; Ahmad, Y.; Mirza, J. Evaluation of iron ore tailings as replacement for fine aggregate in concrete. Constr. Build. Mater. 2016, 120, 72–79. [Google Scholar] [CrossRef]
  6. Hou, Y.F. Comparison of Effect of Iron Tailing Sand and Natural Sand on Concrete Properties. Key Eng. Mater. 2014, 599, 11–14. [Google Scholar] [CrossRef]
  7. Morohashi, N.; Sakurada, T.; Yanagibashi, K. Bond Splitting Strength of High–quality Recycled Coarse Aggregate Concrete Beams. J. Asian Arch. Build. Eng. 2007, 6, 331–337. [Google Scholar] [CrossRef]
  8. Pandurangan, K.; Dayanithy, A.; Prakash, S.O. Influence of treatment methods on the bond strength of recycled aggregate concrete. Constr. Build. Mater. 2016, 120, 212–221. [Google Scholar] [CrossRef]
  9. Butler, L.; West, J.; Tighe, S. The effect of recycled concrete aggregate properties on the bond strength between RCA concrete and steel reinforcement. Cem. Concr. Res. 2011, 41, 1037–1049. [Google Scholar] [CrossRef]
  10. Seara-Paz, S.; González-Fonteboa, B.; Eiras-López, J.; Herrador, M.F. Bond behavior between steel reinforcement and recycled concrete. Mater. Struct. 2013, 47, 323–334. [Google Scholar] [CrossRef]
  11. Xiao, J.; Falkner, H. Bond behaviour between recycled aggregate concrete and steel rebars. Constr. Build. Mater. 2007, 21, 395–401. [Google Scholar] [CrossRef]
  12. Gao, D.; Yan, H.; Fang, D.; Yang, L. Bond strength and prediction model for deformed bar embedded in hybrid fiber reinforced recycled aggregate concrete. Constr. Build. Mater. 2020, 265, 120337. [Google Scholar] [CrossRef]
  13. Breccolotti, M.; Materazzi, A. Structural reliability of bonding between steel rebars and recycled aggregate concrete. Constr. Build. Mater. 2013, 47, 927–934. [Google Scholar] [CrossRef]
  14. Hu, J.; Chen, W.; Zhou, C. Experimental study on bonding properties of recycled concrete. J. Harbin Inst. Technol. 2010, 42, 1849–1854. [Google Scholar] [CrossRef]
  15. Arezoumandi, M.; Steele, A.R.; Volz, J.S. Evaluation of the Bond Strengths Between Concrete and Reinforcement as a Function of Recycled Concrete Aggregate Replacement Level. Structures 2018, 16, 73–81. [Google Scholar] [CrossRef]
  16. Xiao, J.; Li, P.; Qin, W. Study on Bond-slip Between Recycled Concrete and Rebars. J. Tongji Univ. 2006, 34, 13–16. [Google Scholar] [CrossRef]
  17. Prince, M.J.R.; Singh, B. Bond behaviour of deformed steel bars embedded in recycled aggregate concrete. Constr. Build. Mater. 2013, 49, 852–862. [Google Scholar] [CrossRef]
  18. Prince, M.J.R.; Singh, B. Bond behaviour of normal- and high-strength recycled aggregate concrete. Struct. Concr. 2015, 16, 56–70. [Google Scholar] [CrossRef]
  19. Wang, B.; Bai, G.; Dai, H.; Wu, S. Experimental And Mechanical Analysis Of Bond-Slip Performance Between Recycled Concrete And Rebar. Eng. Mech. 2013, 30, 54–64. [Google Scholar] [CrossRef]
  20. Cairns, J.; Goodchild, C. Effect of reduced concrete cover on strength of lapped joints. Proc. Inst. Civ. Eng. 2016, 169, 34–45. [Google Scholar] [CrossRef]
  21. Moodi, Y.; Sohrabi, M.R.; Mousavi, S.R. Effects of stirrups in spliced region on the bond strength of corroded splices in reinforced concrete (RC) beams. Constr. Build. Mater. 2019, 230, 116873. [Google Scholar] [CrossRef]
  22. Senthil, K.; Aswa, S.; Aswin, C. Influence of concrete strength and diameter of reinforcing bar on pullout tests using finite element analysis. J. Struct. Eng. Appl. Mech. 2018, 1, 105–116. [Google Scholar] [CrossRef]
  23. Lin, S.-K.; Wu, C.-H. Improvement of Bond Strength and Durability of Recycled Aggregate Concrete Incorporating High Volume Blast Furnace Slag. Materials 2021, 14, 3708. [Google Scholar] [CrossRef]
  24. Ismail, F.I.; Abbas, Y.M.; Shafiq, N.; Fares, G.; Osman, M.; Hussain, L.A.; Khan, M.I. Investigation of the Impact of Graphene Nanoplatelets (GnP) on the Bond Stress of High-Performance Concrete Using Pullout Testing. Materials 2021, 14, 7054. [Google Scholar] [CrossRef]
  25. Wang, Q.; Zhang, Y.; Kang, H.; Dong, L. Experimental research on bond behavior between deformed bars and ferrous mill tailing concrete. J. Xi’an Univ. Of Arch. Tech. 2015, 47, 830–833. [Google Scholar] [CrossRef]
  26. Xu, F.; Wang, S.; Li, T.; Liu, B.; Li, B.; Zhou, Y. Mechanical properties and pore structure of recycled aggregate concrete made with iron ore tailings and polypropylene fibers. J. Build. Eng. 2021, 33, 101572. [Google Scholar] [CrossRef]
  27. Li, T.; Wang, S.; Xu, F.; Meng, X.; Li, B.; Zhan, M. Study of the basic mechanical properties and degradation mechanism of recycled concrete with tailings before and after carbonation. J. Clean. Prod. 2020, 259, 120923. [Google Scholar] [CrossRef]
  28. Xu, F.; Wang, S.; Li, T.; Liu, B.; Li, B.; Zhou, Y. The mechanical properties of tailing recycled aggregate concrete and its resistance to the coupled deterioration of sulfate attack and wetting–drying cycles. Structures 2020, 27, 2208–2216. [Google Scholar] [CrossRef]
  29. GB 51032-2014; Technical Specification for The Application of Iron Tailings Sand Concrete. Part 4: Raw Materials. China Standard Press: Beijing, China, 2014.
  30. GB/T 14684-2022; Construction Sand. Part 6: Skills Requirement. China Standard Press: Beijing, China, 2022.
  31. GB/T 14685-2022; Pebbles and Gravel for Construction. Part 6: Skills Requirement. China Standard Press: Beijing, China, 2022.
  32. GB/T 25177-2010; Recycled Coarse Aggregate for Concrete. Part 5: Requirement. China Standard Press: Beijing, China, 2010.
  33. Chrysanidis, T. Experimental and numerical research on cracking characteristics of medium-reinforced prisms under variable uniaxial degrees of elongation. Eng. Fail. Anal. 2023, 145, 107014. [Google Scholar] [CrossRef]
  34. Cai, J.W.; Zhang, S.B.; Hou, G.X.; Wang, C.M.; Feng, X.X. Effects of Ferrous Mill Tailings as Aggreagtes on Workability and Strength of Concrete. J. Wuhan Univ. Technol. 2009, 31, 104–107. [Google Scholar] [CrossRef]
  35. Xiao, J.; Li, J.; Lan, Y. Research on recycled aggregate concrete—A review. Concrete 2003, 10, 17–20. [Google Scholar]
  36. Gao, D.; Yan, H.; Yang, L.; Pang, Y.; Sun, B. Analysis of bond performance of steel bar in steel-polypropylene hybrid fiber reinforced concrete with partially recycled coarse aggregates. J. Clean. Prod. 2022, 370, 133528. [Google Scholar] [CrossRef]
  37. Li, X. Study on Mechanical Properties of Recycled Aggregate Concrete (I)—Behaviour under Uniaxial Compression. J. Build. Mater. 2007, 10, 598–603. [Google Scholar] [CrossRef]
  38. Orangun, C.O.; Jirsa, J.O.; Breen, J.E. A Reevaulation of Test Data on Development Length and Splices, C. J. Proc. 1977, 74, 114–122. [Google Scholar] [CrossRef]
  39. Esfahani, M.R.; Rangan, B.V. Bond between Normal Strength and High-Strength Concrete (HSC) and Reinforcing Bars in Splices in Beams. J. Struct. J. 1998, 95, 272–280. [Google Scholar] [CrossRef]
  40. Deng, M.; Pan, J.; Liang, X. Experimental study on bond behavior between steel bar and high ductility concrete. J. China Civ. Eng. J. 2018, 51, 19–26. [Google Scholar]
  41. Okelo, R.; Yuan, R.L. Bond Strength of Fiber Reinforced Polymer Rebars in Normal Strength Concrete. J. Compos. Constr. 2005, 9, 203–213. [Google Scholar] [CrossRef]
  42. Lee, J.-Y.; Kim, T.-Y.; Yi, C.-K.; Park, J.-S.; You, Y.-C.; Park, Y.-H. Interfacial bond strength of glass fiber reinforced polymer bars in high-strength concrete. Compos. Part B Eng. 2008, 39, 258–270. [Google Scholar] [CrossRef]
  43. Xiao, J.-Z.; Li, J.; Zhang, C. On relationships between the mechanical properties of recycled aggregate concrete: An overview. Mater. Struct. 2006, 39, 655–664. [Google Scholar] [CrossRef]
Figure 1. Fine and coarse aggregates.
Buildings 13 01176 g001
Figure 2. Screening curves of coarse and fine aggregate: (a) NS and ITS; (b) NCA and RCA.
Buildings 13 01176 g002
Figure 3. Specimen details (unit: mm): (a) specimen size and reinforcement structure; (b) strain gauge position diagram; (c) specimen physical diagram.
Buildings 13 01176 g003
Figure 4. Loading device: (a) physical picture; (b) three-dimensional diagram; (c) floor plan.
Buildings 13 01176 g004
Figure 5. Typical damage pattern (unit: mm): (a) pullout failure (C45-R30-P0-S1); (b) splitting-pullout failure (C45-R50-P0.21-S3); (c) splitting failure (C45-R0-P0-S1); (d) The inner section of the split test block and the surface of the steel bar (C45-R0-P0-S1); (e) The three-dimensional view of the test piece (numbers ①~⑥ are the six faces of the test piece, ①, ③ is the end face, ②, ④ are the upper and lower top and bottom faces, ⑤, ⑥ are the sides).
Buildings 13 01176 g005
Figure 6. Bond–slip curves of the specimen.
Buildings 13 01176 g006
Figure 7. (a) τ–s of different fine aggregates; (b) maximum and residual bond strength of different fine aggregates.
Buildings 13 01176 g007
Figure 8. (a) τ–s of different RCA substitution ratios; (b) maximum and residual bond strength of different RCA substitution ratios.
Buildings 13 01176 g008
Figure 9. (a) τ–s of distinct concrete strengths; (b) maximum and residual bond strength of different concrete strengths.
Buildings 13 01176 g009
Figure 10. (a) τ–s of distinct stirrup ratios; (b) limit and residual bond strength of different hoop ratios.
Buildings 13 01176 g010
Figure 11. Bond stress distribution under different loads.
Buildings 13 01176 g011
Figure 12. Comparison of the tested bond strength values with predicted values: (a) original formula; (b) fitting formula [38,39,40,41,42].
Buildings 13 01176 g012
Figure 13. Comparisons of the model curve and test curve.
Buildings 13 01176 g013aBuildings 13 01176 g013b
Table 1. Mechanical properties of steel bars.
Steel TypeDiameter
(mm)
Yield Load
(kN)
Maximum Load
(kN)
Yield Strength
(MPa)
Maximum Strength
(MPa)
Elongation
(%)
HRB4001693.2129.7463.0645.029.97
HRB4001252.474.3463.0656.531.85
HRB33546.38.1504.0642.014.48
Table 2. ITRAC mix ratio (kg·m−3).
SpecimenR
(%)
Water
(kg)
Cement
(kg)
ITS
(kg)
NCA
(kg)
RCA
(kg)
SF
(kg)
AW(kg)Slump
(mm)
fcu
(MPa)
ft
(MPa)
ft/fcu
C30-R5050166302884540540028.2413236.12.300.064
C45-R00166415839102400020057.72.210.038
C45-R3030166415839717307016.068857.52.660.046
C45-R5050166415839512512026.782353.12.130.040
C45-R10010016641583901024053.5619343.31.760.041
C60-R5050166553783479479025.0523664.42.350.036
C45-R0-NS0166415839102400015051.82.330.045
C45-R0-SF01664158391024078.504160.33.950.066
Table 3. Summary of the test results for the bonded specimens.
Specimen NumberingDS
(MPa)
R
(%)
P
(%)
Fu
(MPa)
τu
(MPa)
Su
(mm)
τr
(MPa)
Sr
(mm)
kW
(mm)
Failure Mode
C45-R0-P0450082.1920.451.2216.764.21PL
C45-R0-P0-NS450066.7116.611.615.368.7210.32BC
C45-R0-P0-SF450094.0123.391.4512.288.8616.13BC
C45-R30-P04530073.7518.351.834.2710.0910.03BC
C45-R50-P04550082.6320.591.396.409.7314.81BC
C45-R100-P045100070.8117.621.105.768.8116.02BC
C30-R50-P03050055.3313.761.123.9710.0012.29BC
C60-R50-P060500104.4725.982.1716.2211.8711.97BC
C45-R50-P0.2145500.2167.6416.830.432.819.3439.140.21PB
C45-R50-P0.4245500.4273.6318.311.065.799.0817.27BC
C45-R50-P0.8445500.8469.0017.161.514.9010.3911.36BC
Note: DS refers to the concrete design strength; R is the replacement rate of recycled aggregate; P is the hoop ratio; Fu is the maximum load; τu and su are the maximum bond strength and related slippage, respectively; τr and sr are the residual bond strength (corresponding to the average stress of the smooth section of the curve) and the corresponding slippage, respectively; W is the maximum crack width; k is the bond stiffness (k = τu/su); PL, BC, and PB refer to splitting failure, pullout failure, and splitting–pullout failure, respectively.
Table 4. Bond strength formula.
AuthorFormulaModified Formula
Orangun et al. [38] τ u = 0.083045 f c 1.2 3 c d + 50 d L τ u = 2.874 f c 2.786 0.4836 c d + 1.233 d L
Esfahani et al. [39] τ u = 8.6 c / d + 0.5 c / d + 5.5 f t τ u = 2.126 c / d 1.979 c / d 3.598 f t
Lee et al. [42] τ u = 4.1 f c 0.5 τ u = 0.1633 f c 1.239
Okelo et al. [41] τ u = 14.70 f c 0.5 d τ u = 1.277 f c 1.411 d
Deng et al. [40]Pullout failure:
τ u = 0.0014 c d + 0.0114 f cu 1.7174
Splitting-pullout failure:
τ u = 0.377 c d + 0.844 f f 0.8098
Pullout failure & split-pullout failure:
τ u = 0.1306 c d + 0.8212 f cu 1.07
Split failure:
τ u = 0.7953 c d + 0.3411 f f 1.078
Note: In the formulas, c is the thickness of the concrete cover, d is the diameter of the steel bar, L is the bonding length, f c is the compressive strength of the cylinder, ft is the splitting tensile strength, and ff is the flexural strength. f c = 0.82 f c u [37] and f f = 0.75 f c u [43].
Table 5. Statistical analysis of the specific values between the calculated and tested values.
Fitting FormulaOrangun [38]Esfahani [39]Lee [42]Okelo [41]Deng [40]Formula (2)
Average value1.0201.0070.9270.8671.0321.007
Mean variance0.1160.2100.1030.1070.1140.089
Standard deviation0.1110.2000.0980.1020.1090.085
Correlation coefficient0.8090.4350.8320.8380.7920.883
Disclaimer/Publisher’s Note: The statements, opinions and data contained in all publications are solely those of the individual author(s) and contributor(s) and not of MDPI and/or the editor(s). MDPI and/or the editor(s) disclaim responsibility for any injury to people or property resulting from any ideas, methods, instructions or products referred to in the content.

