
Effect of Cementitious Material Composition on the Performance of Low-Carbon Foamed Lightweight Soil
Abstract
:1. Introduction
2. Materials and Methods
2.1. Materials
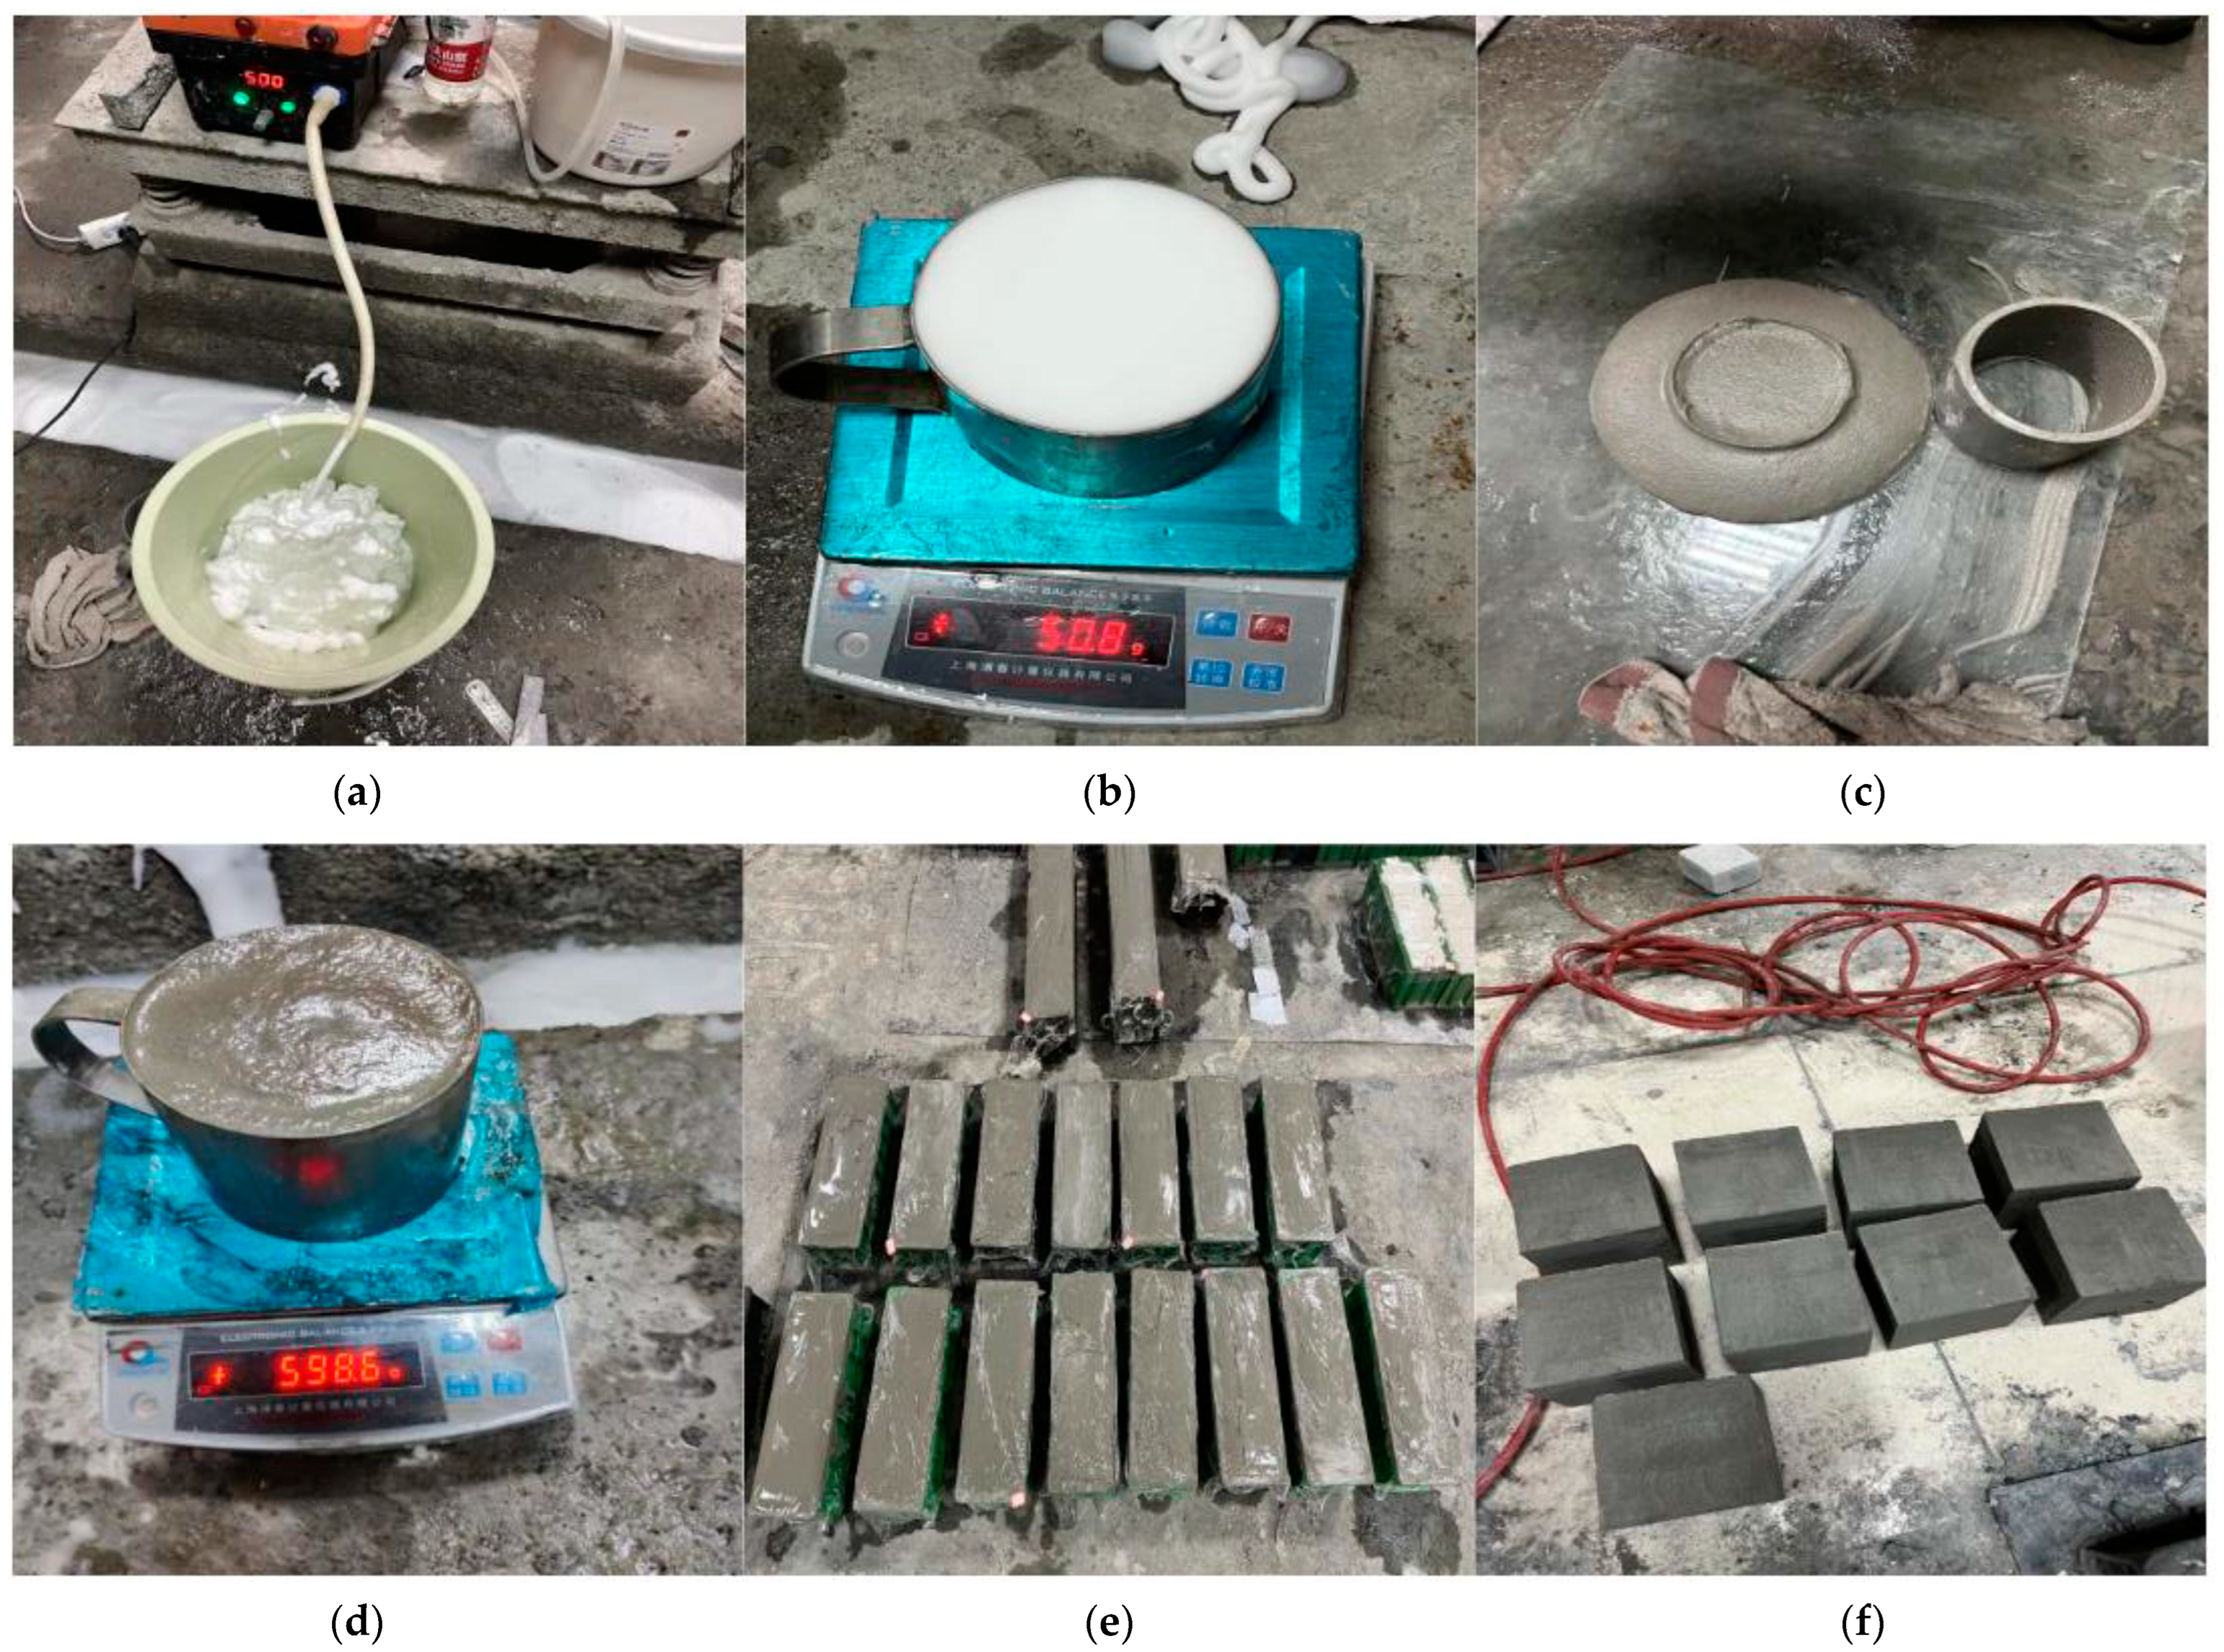
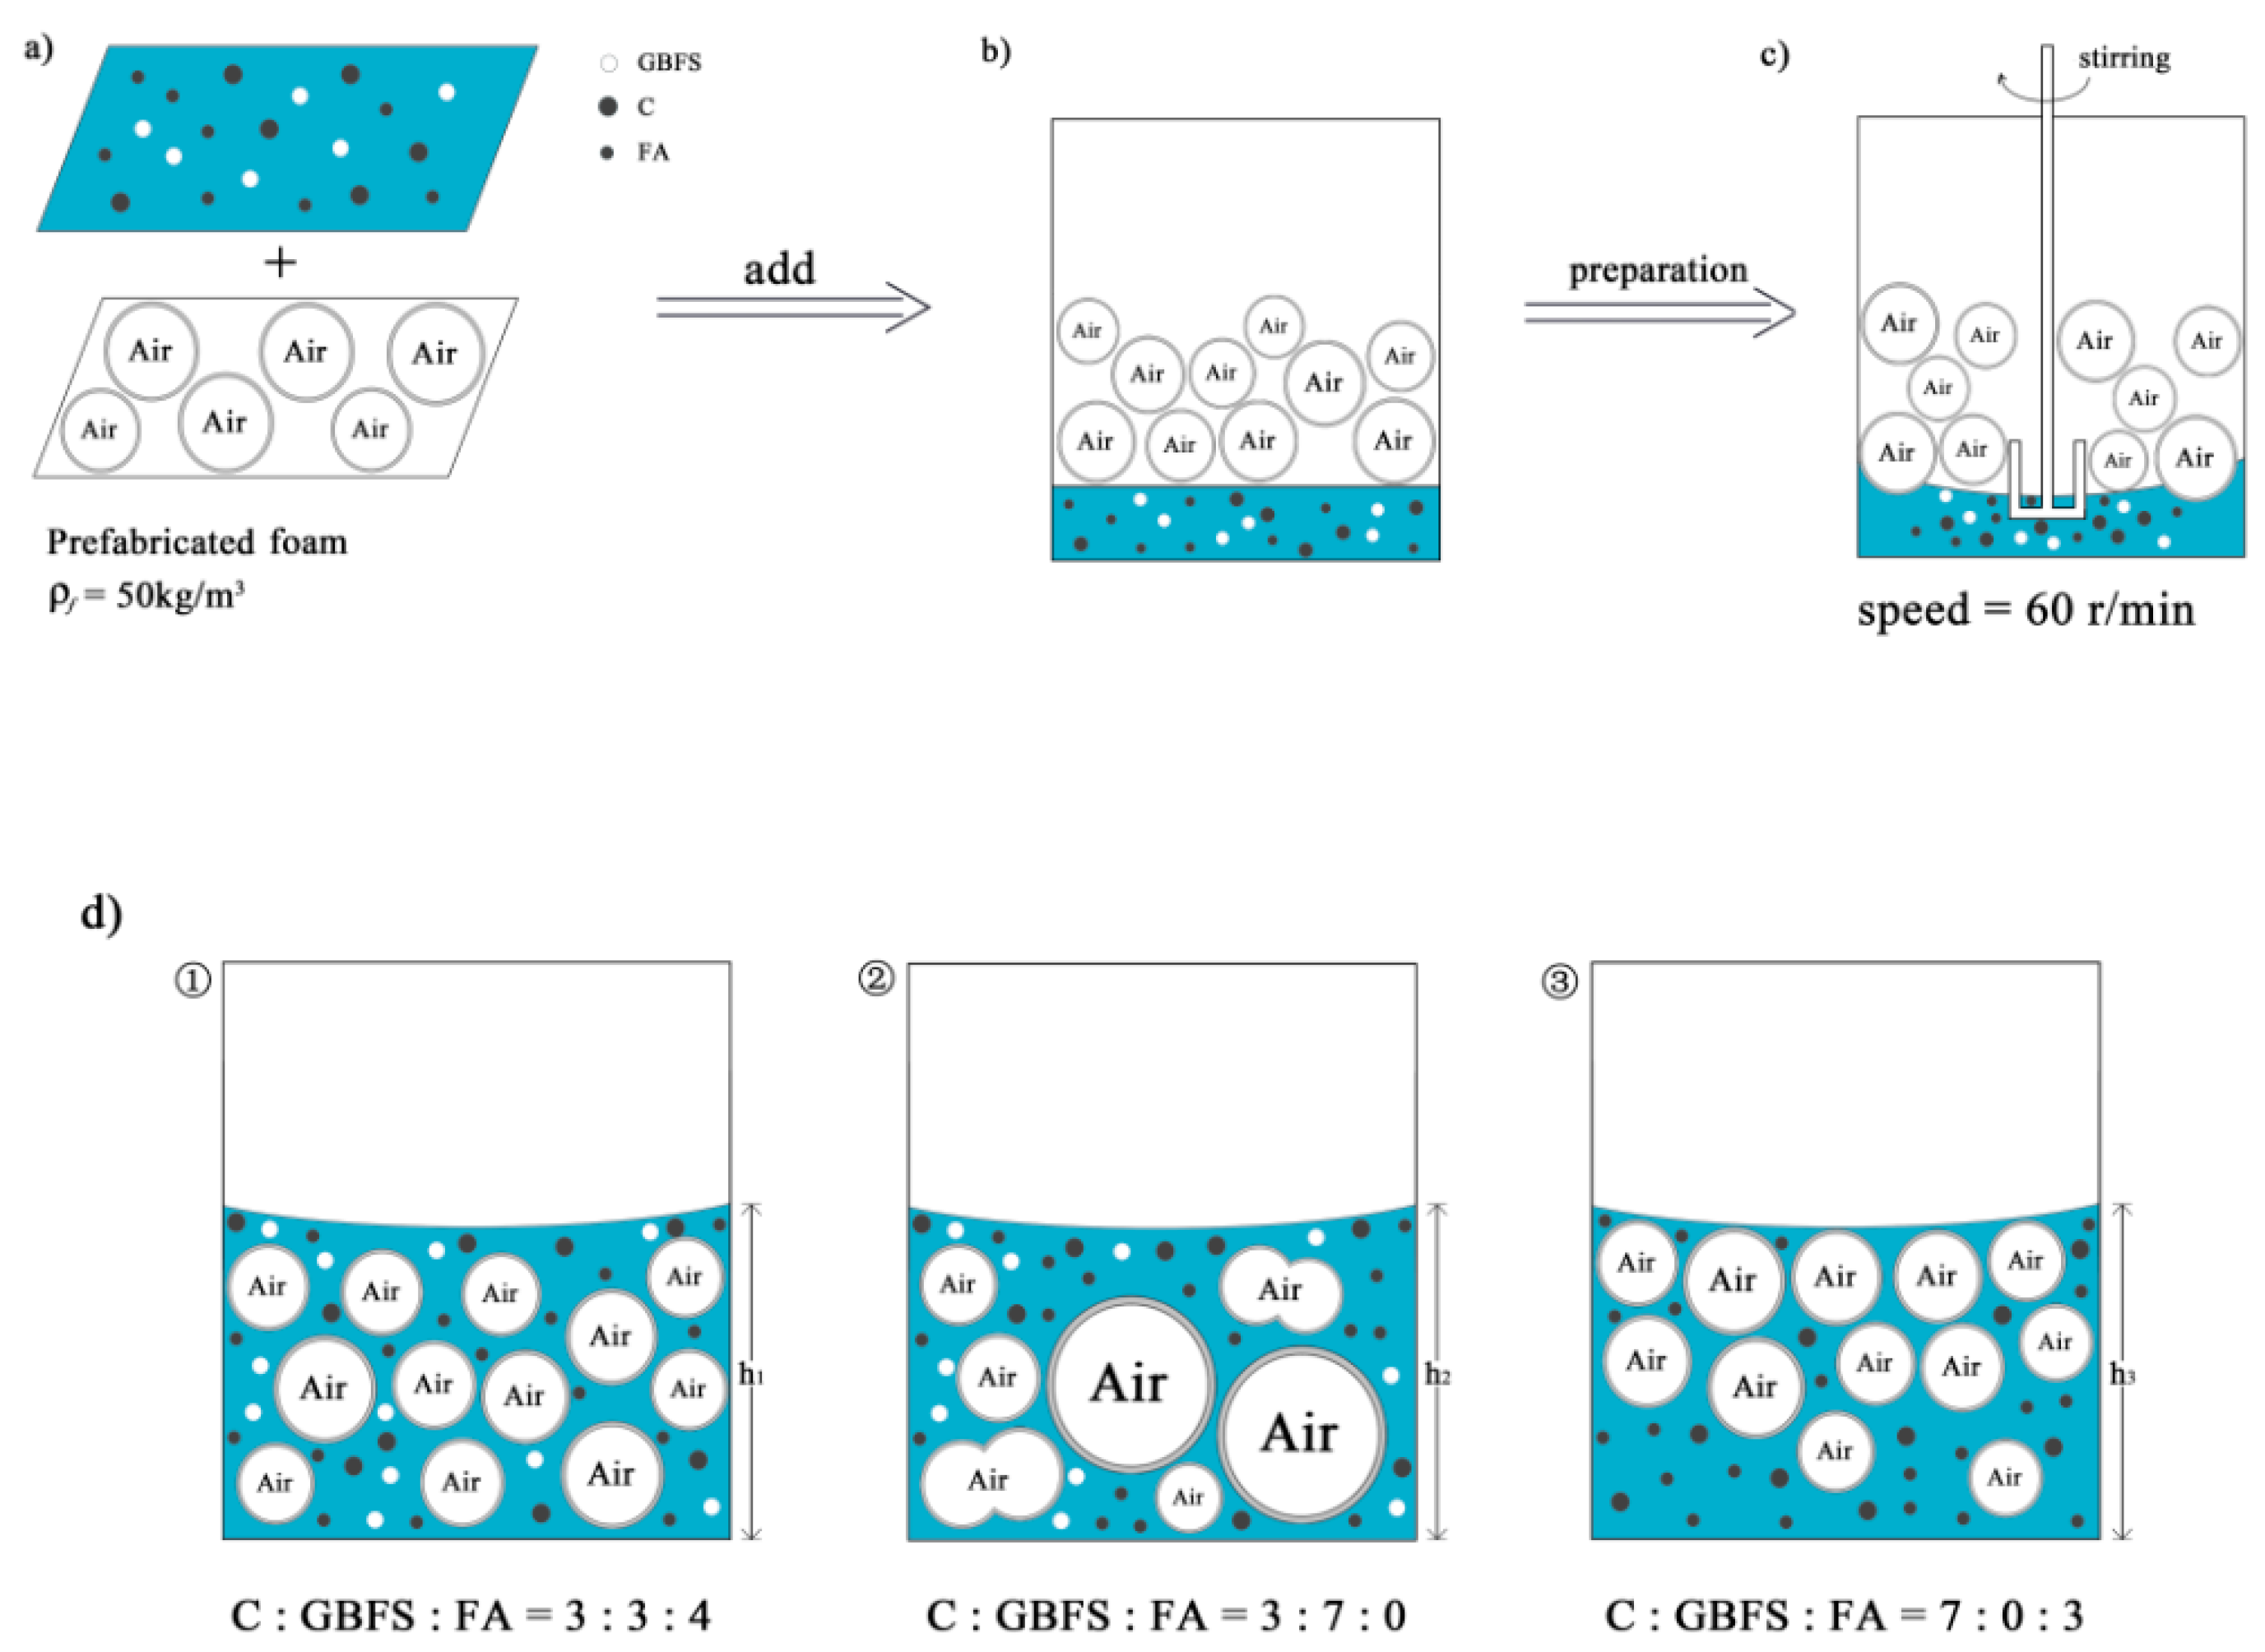
2.2. Sample Preparation
2.3. Mix Designs and Technical Requirements of LCFLS
2.4. Test Methods
2.4.1. Workability Tests
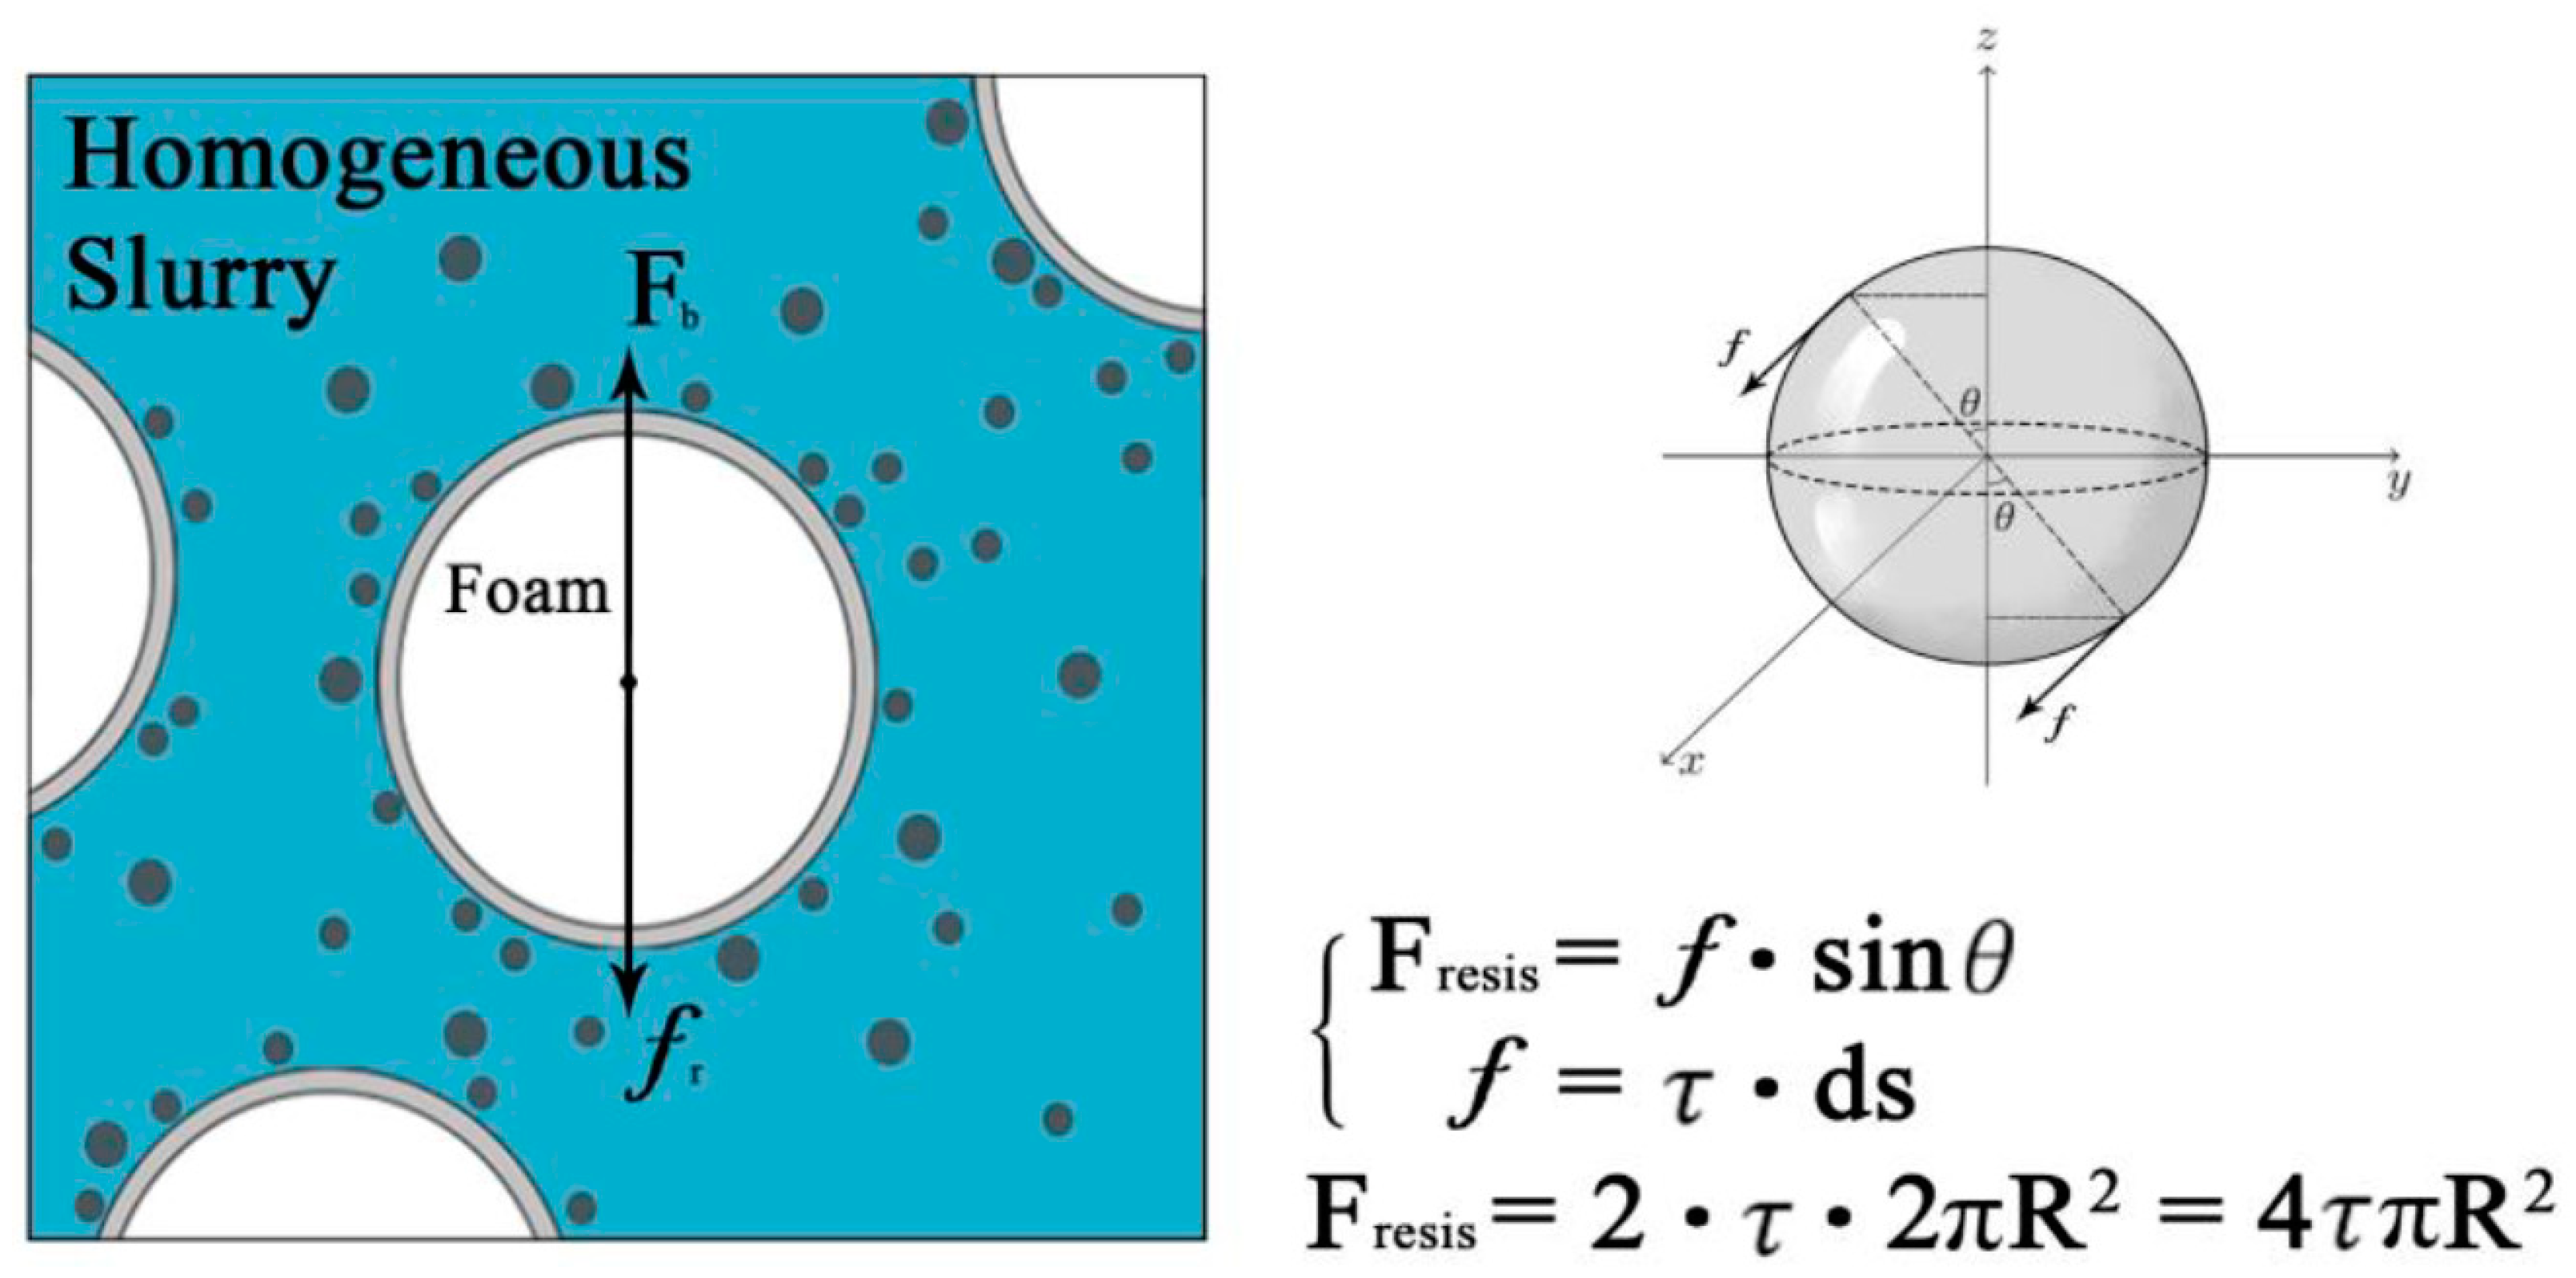
2.4.2. Yield Stress Tests
2.4.3. Mechanical Properties Tests
2.4.4. Hydrate Tests
3. Results and Discussion
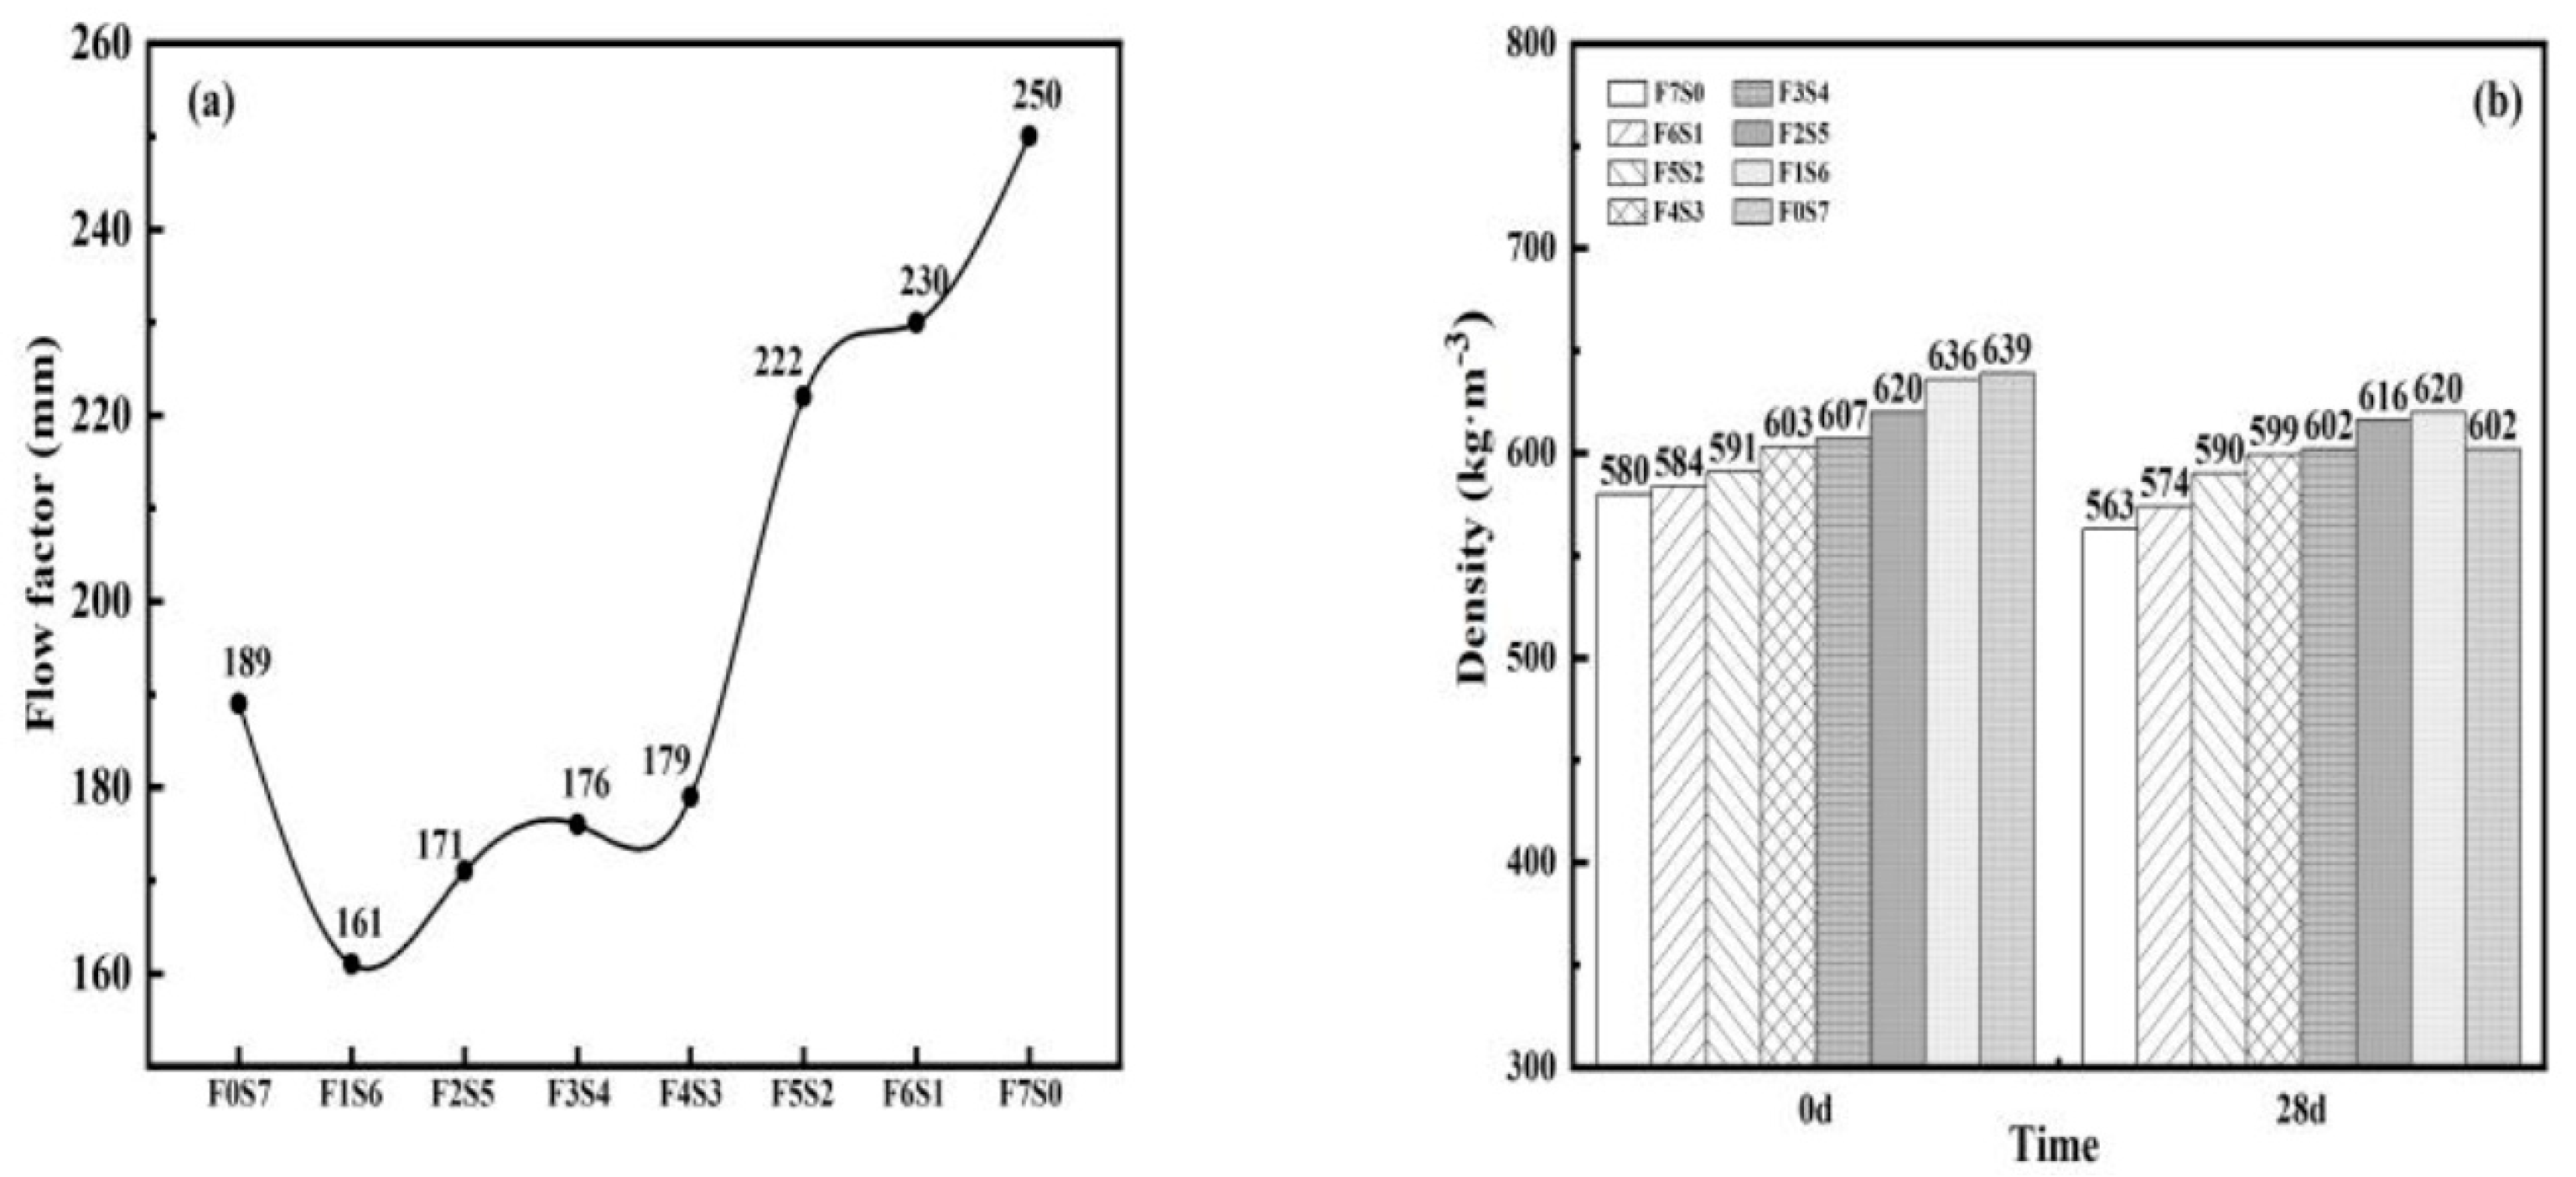
3.1. Flowability and Wet Density of LCFLS
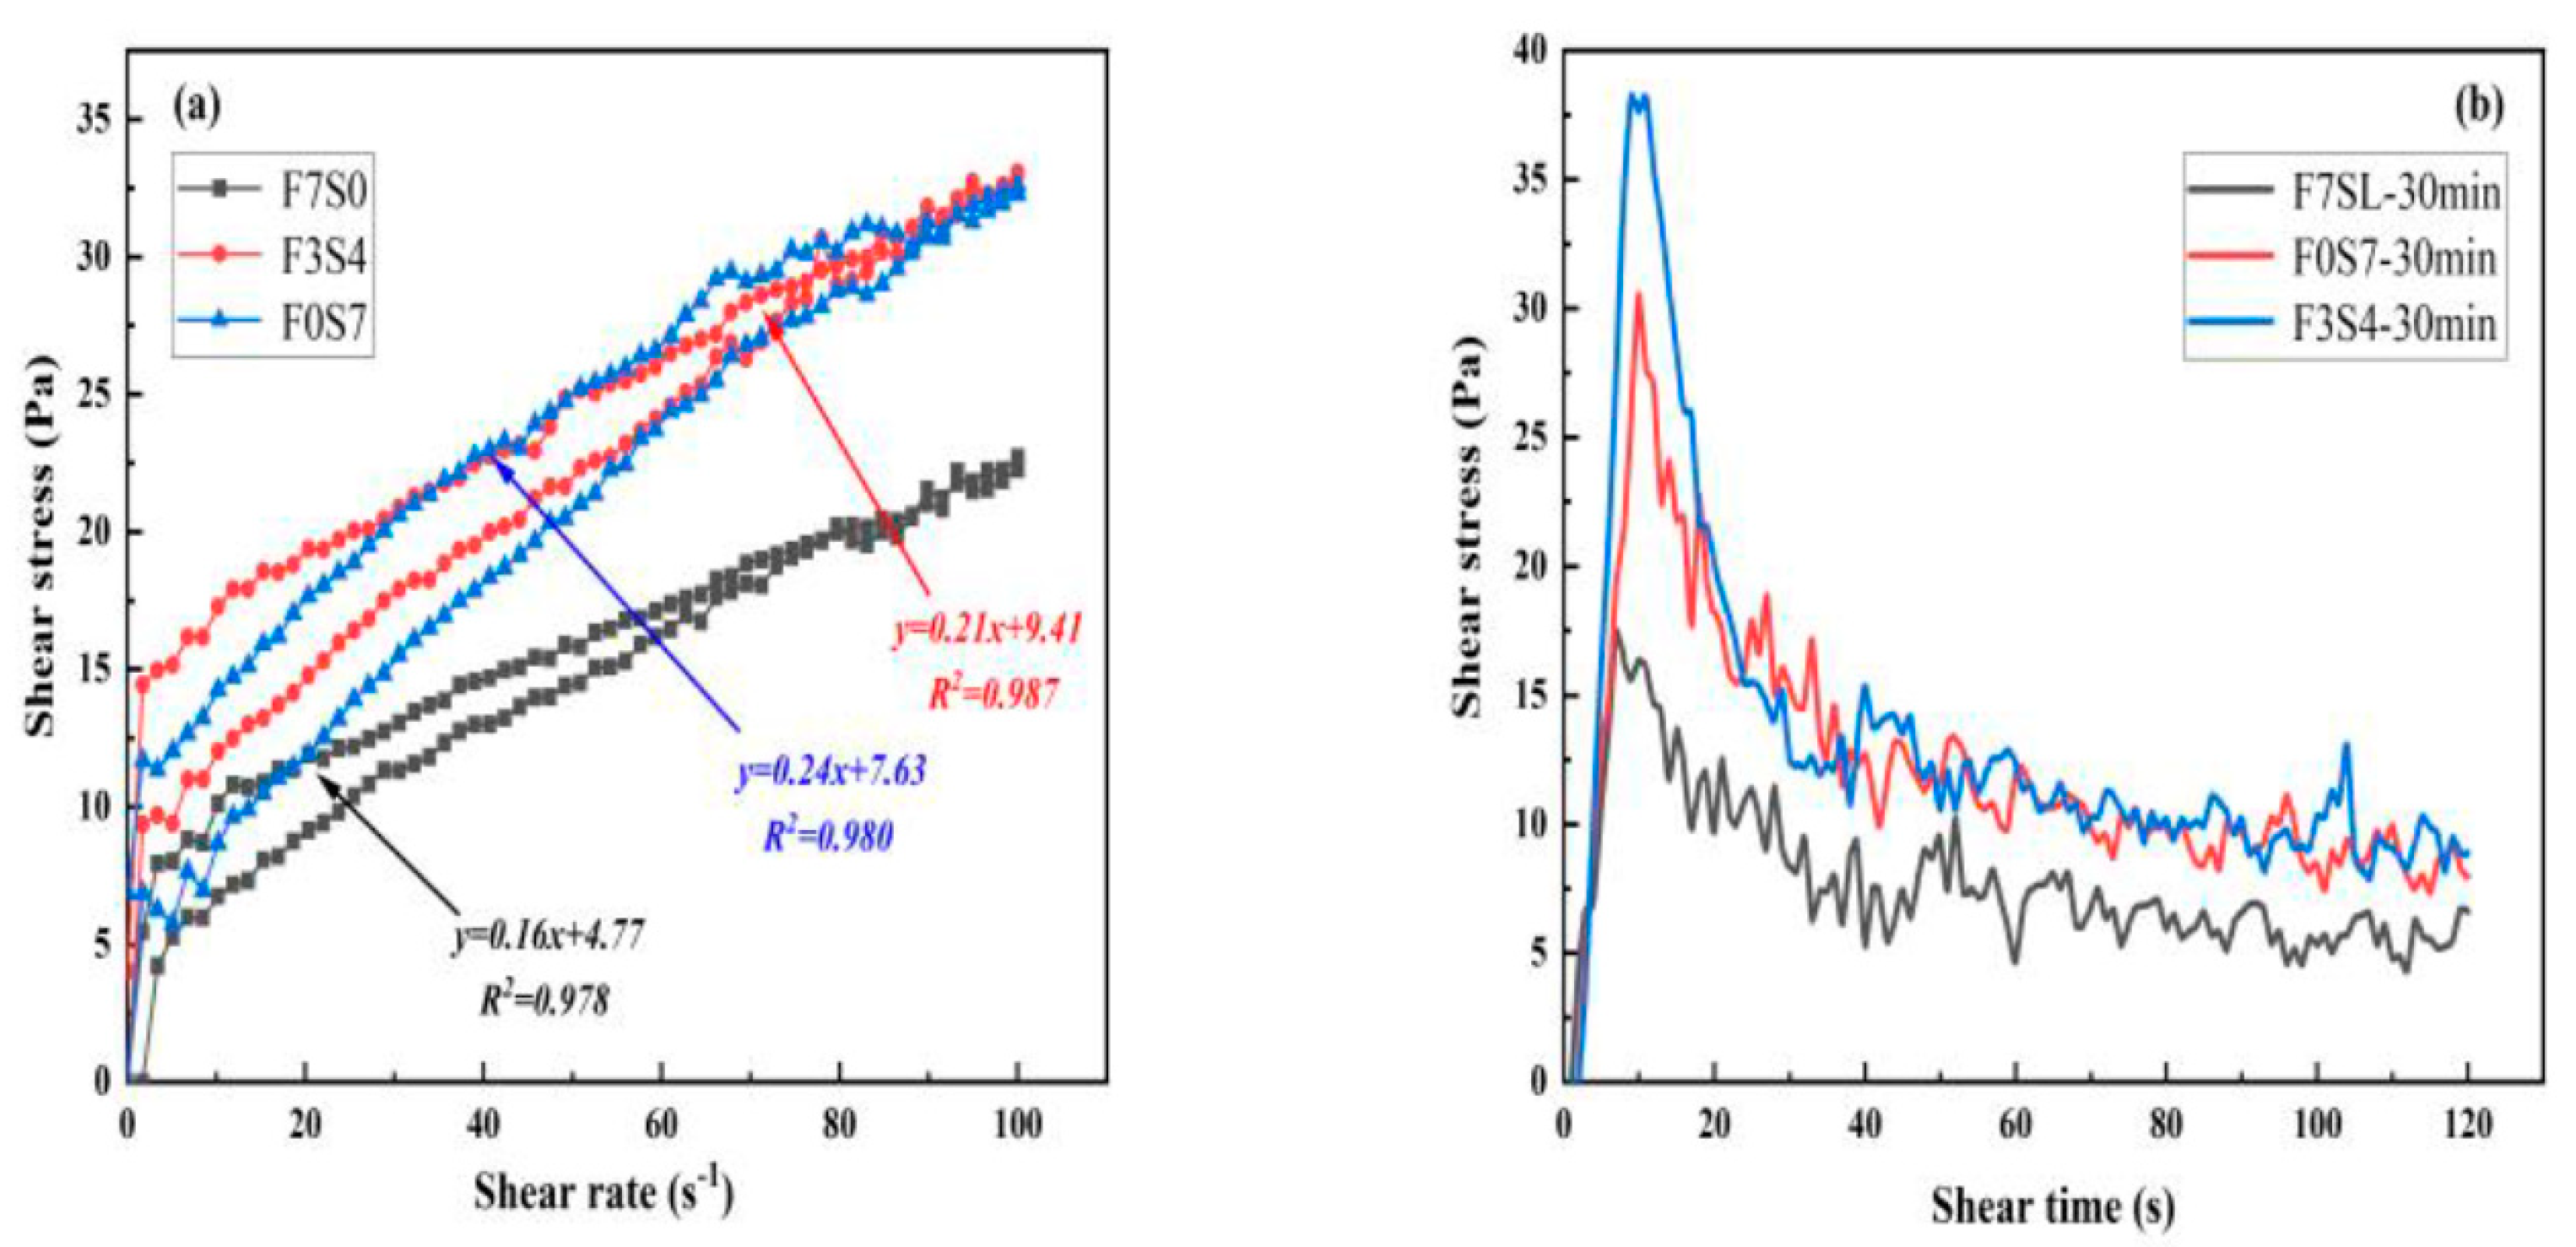
3.2. Rheological Properties of LCFLS
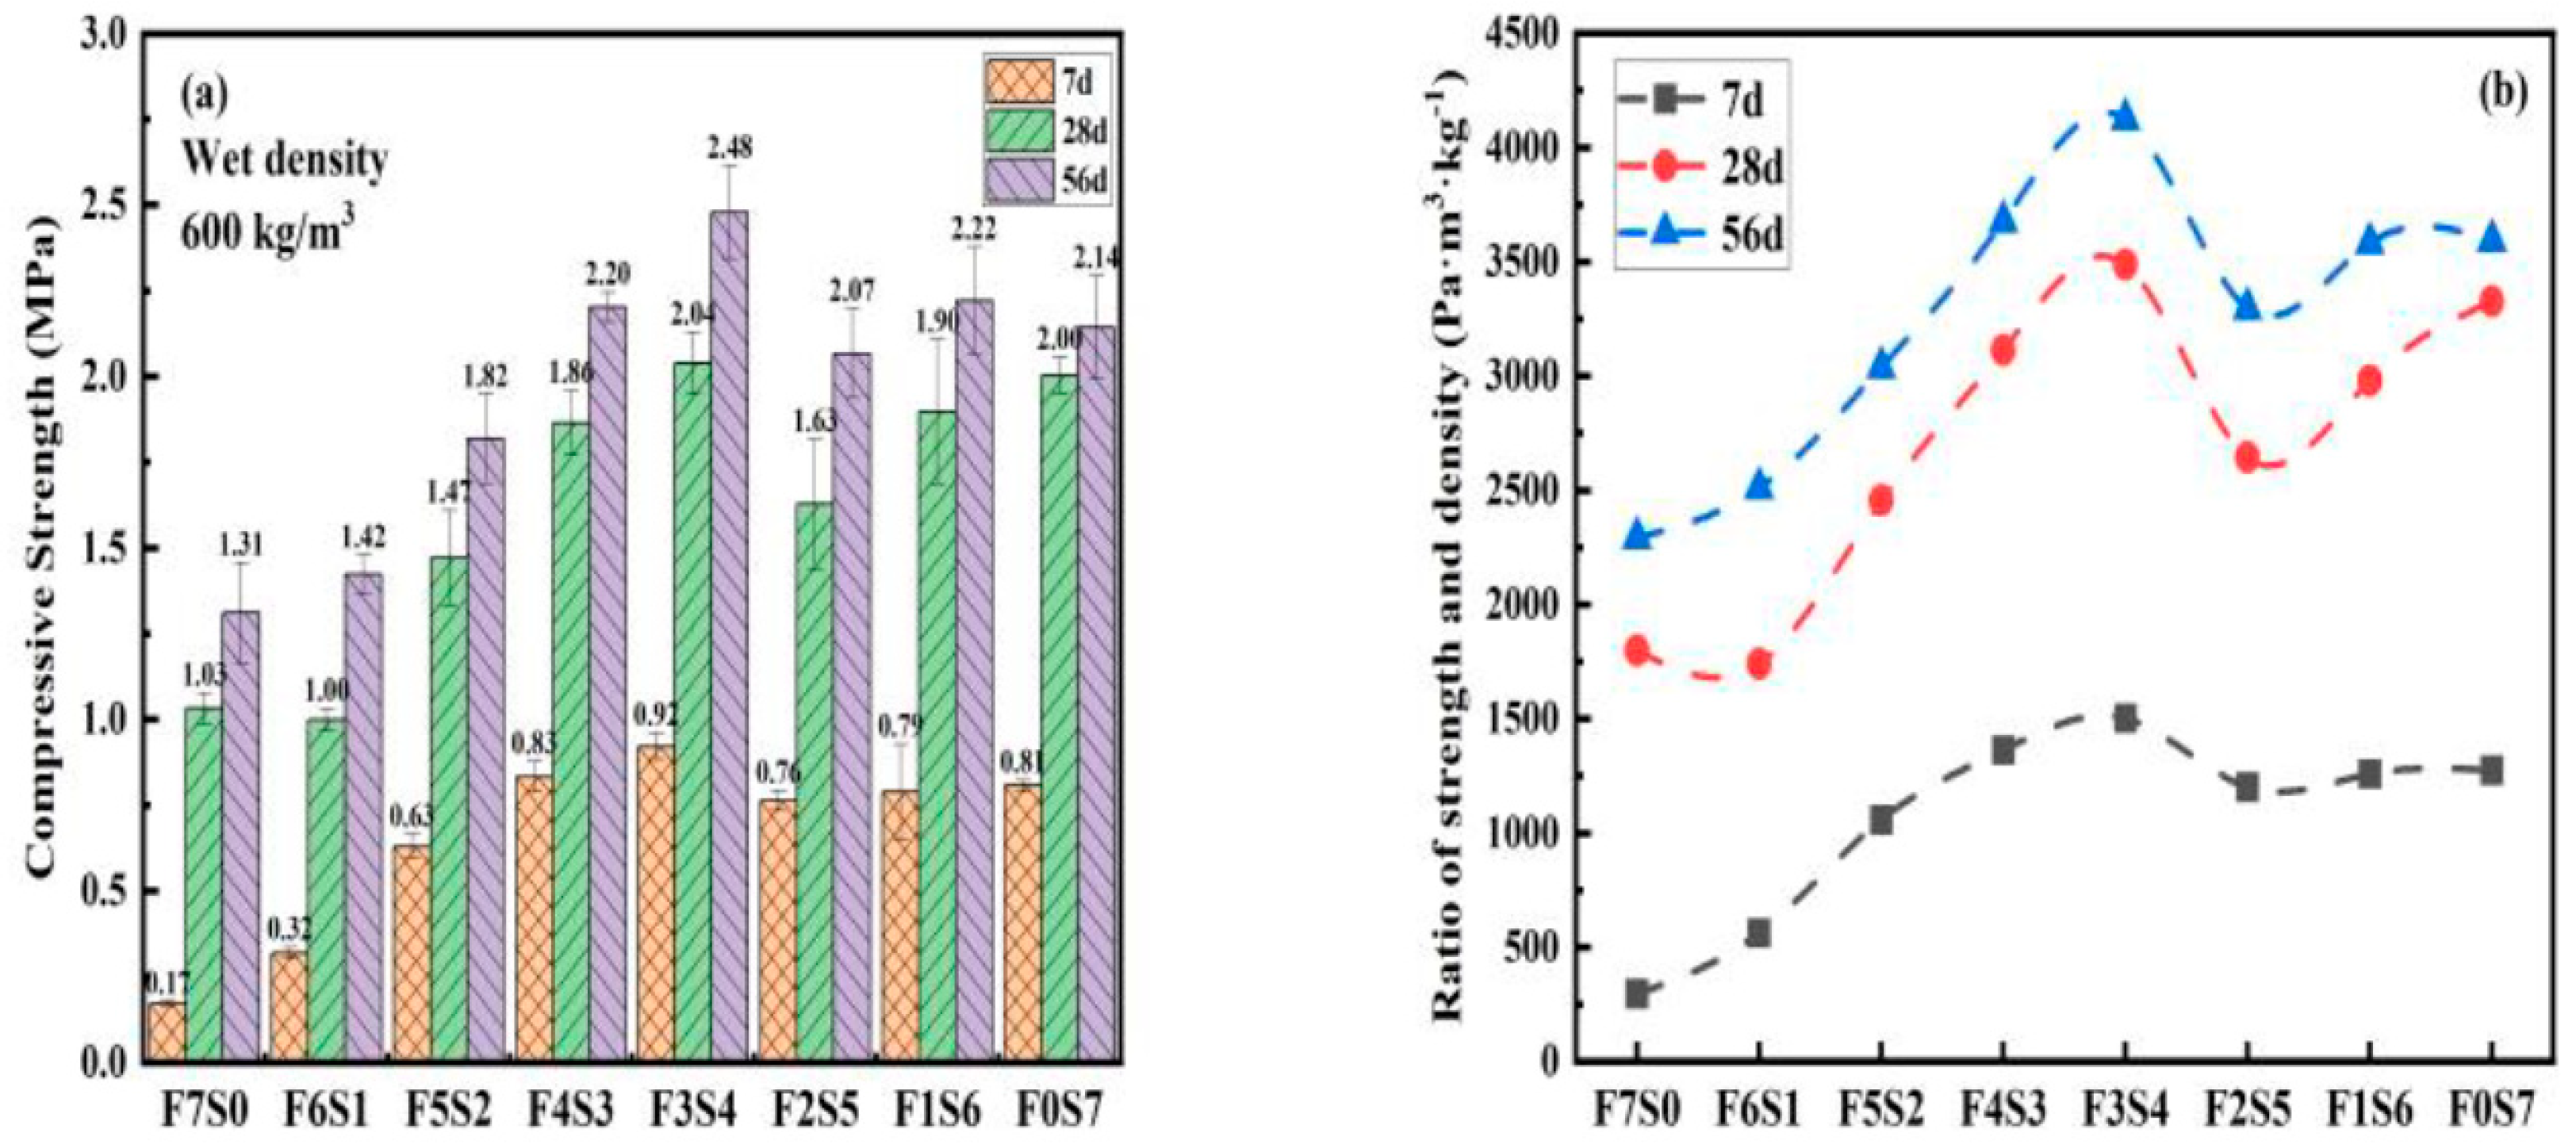
3.3. Compressive Strength of LCFLS
3.4. Hydrate Analysis of LCFLS
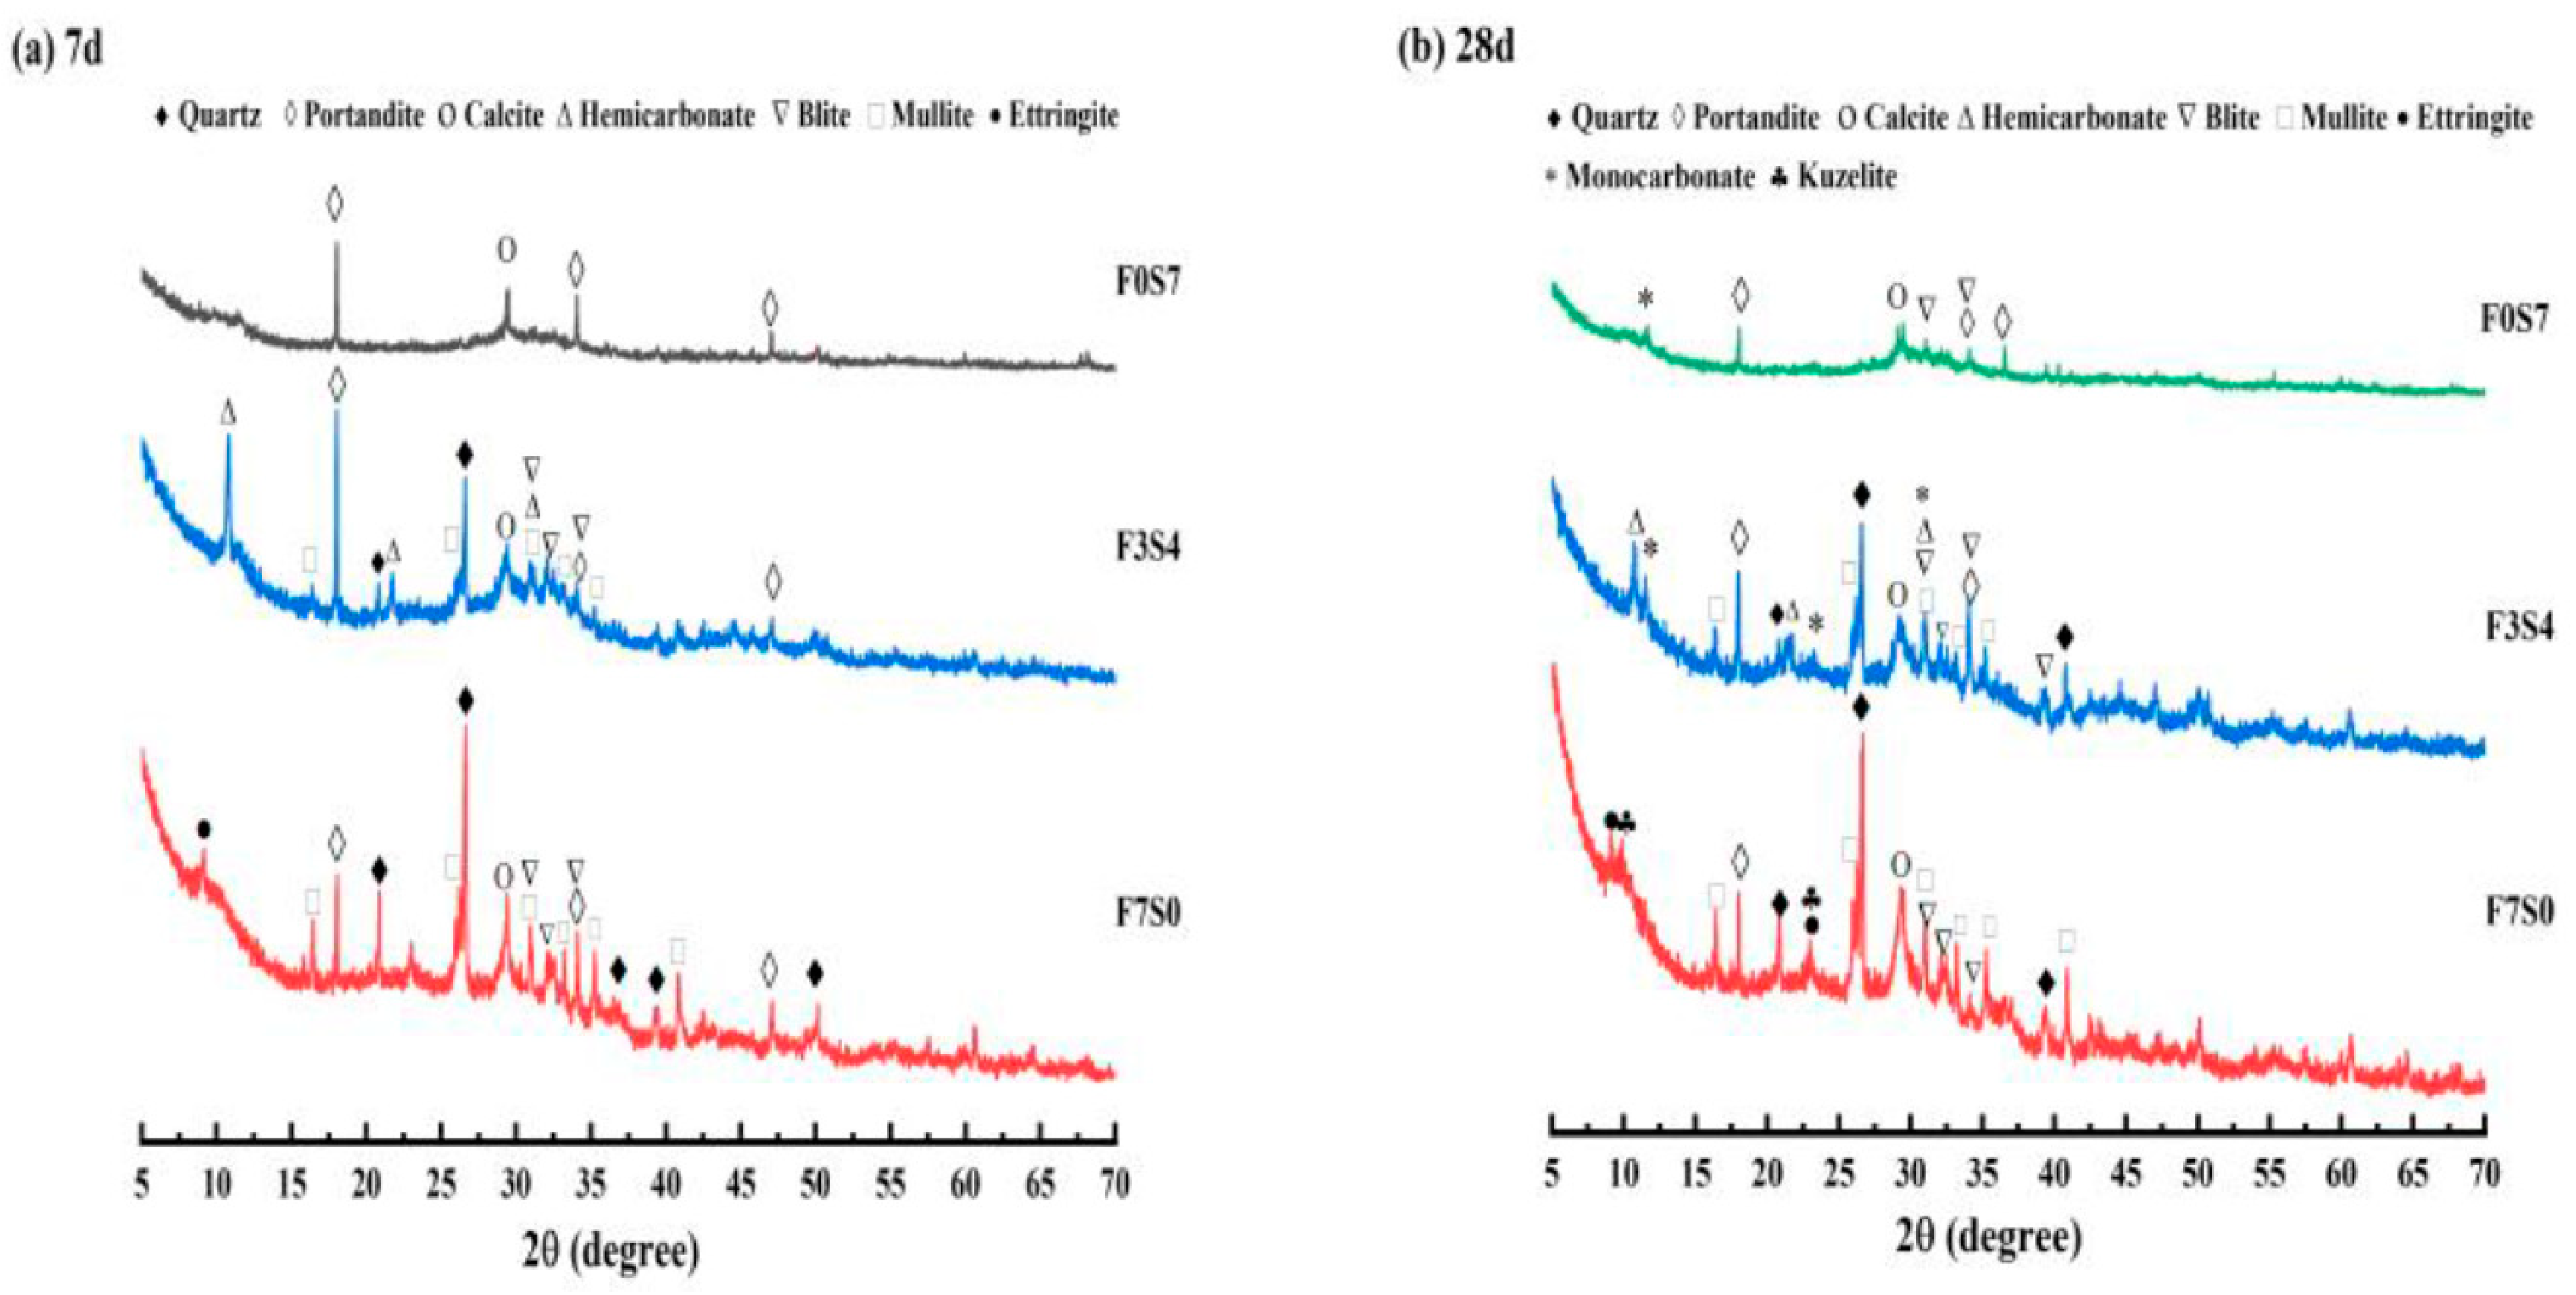
3.4.1. XRD
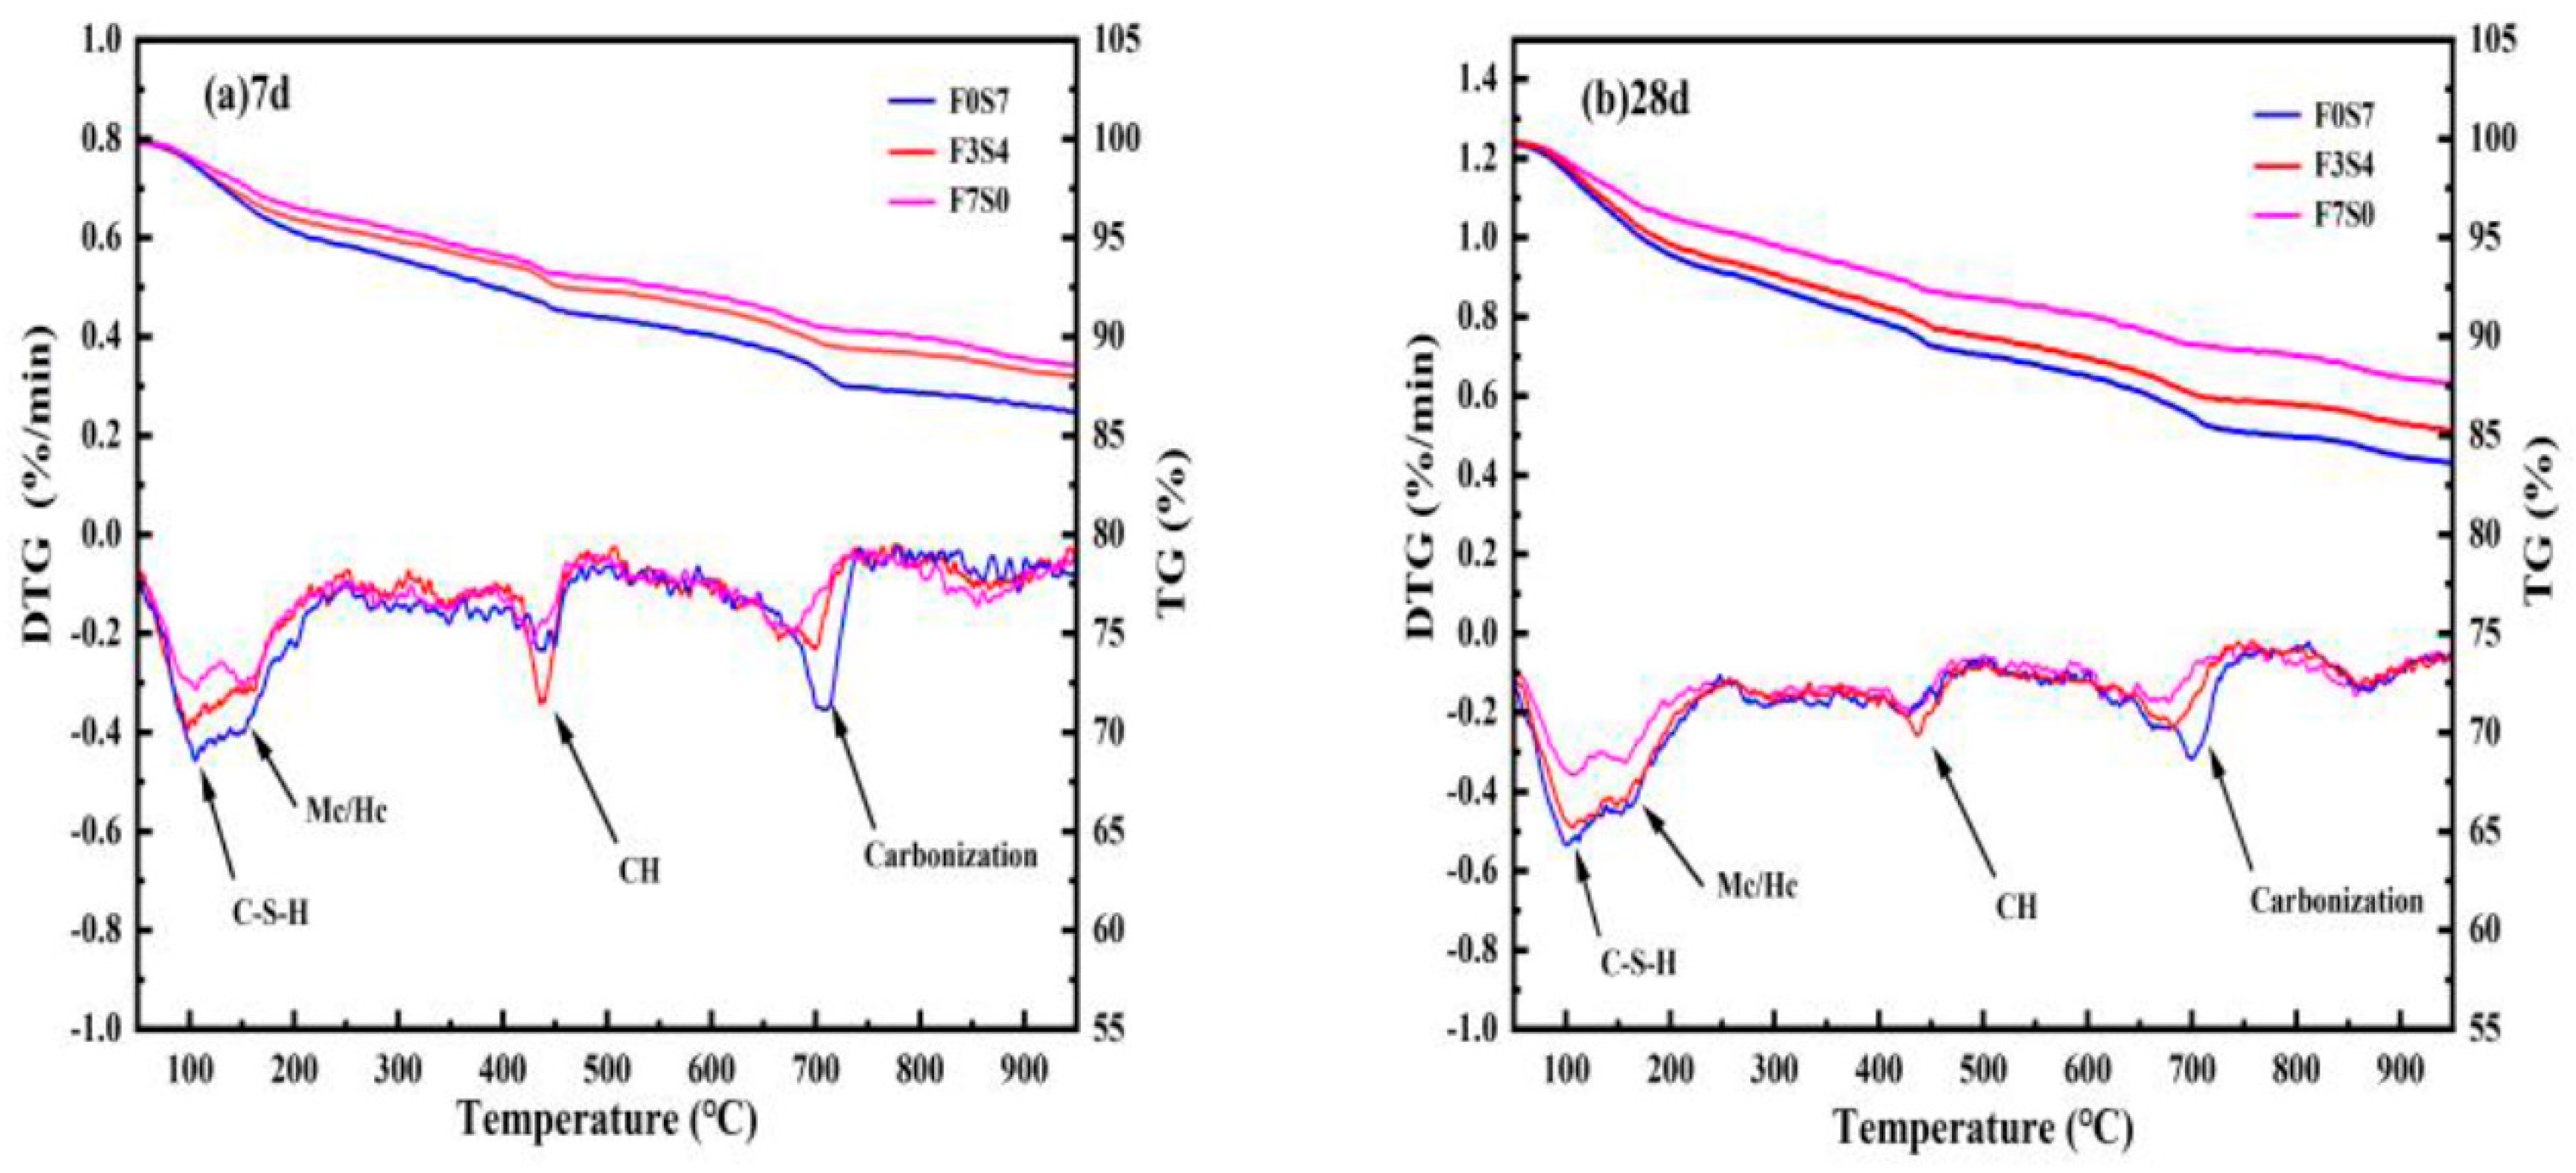
3.4.2. TG–DTG
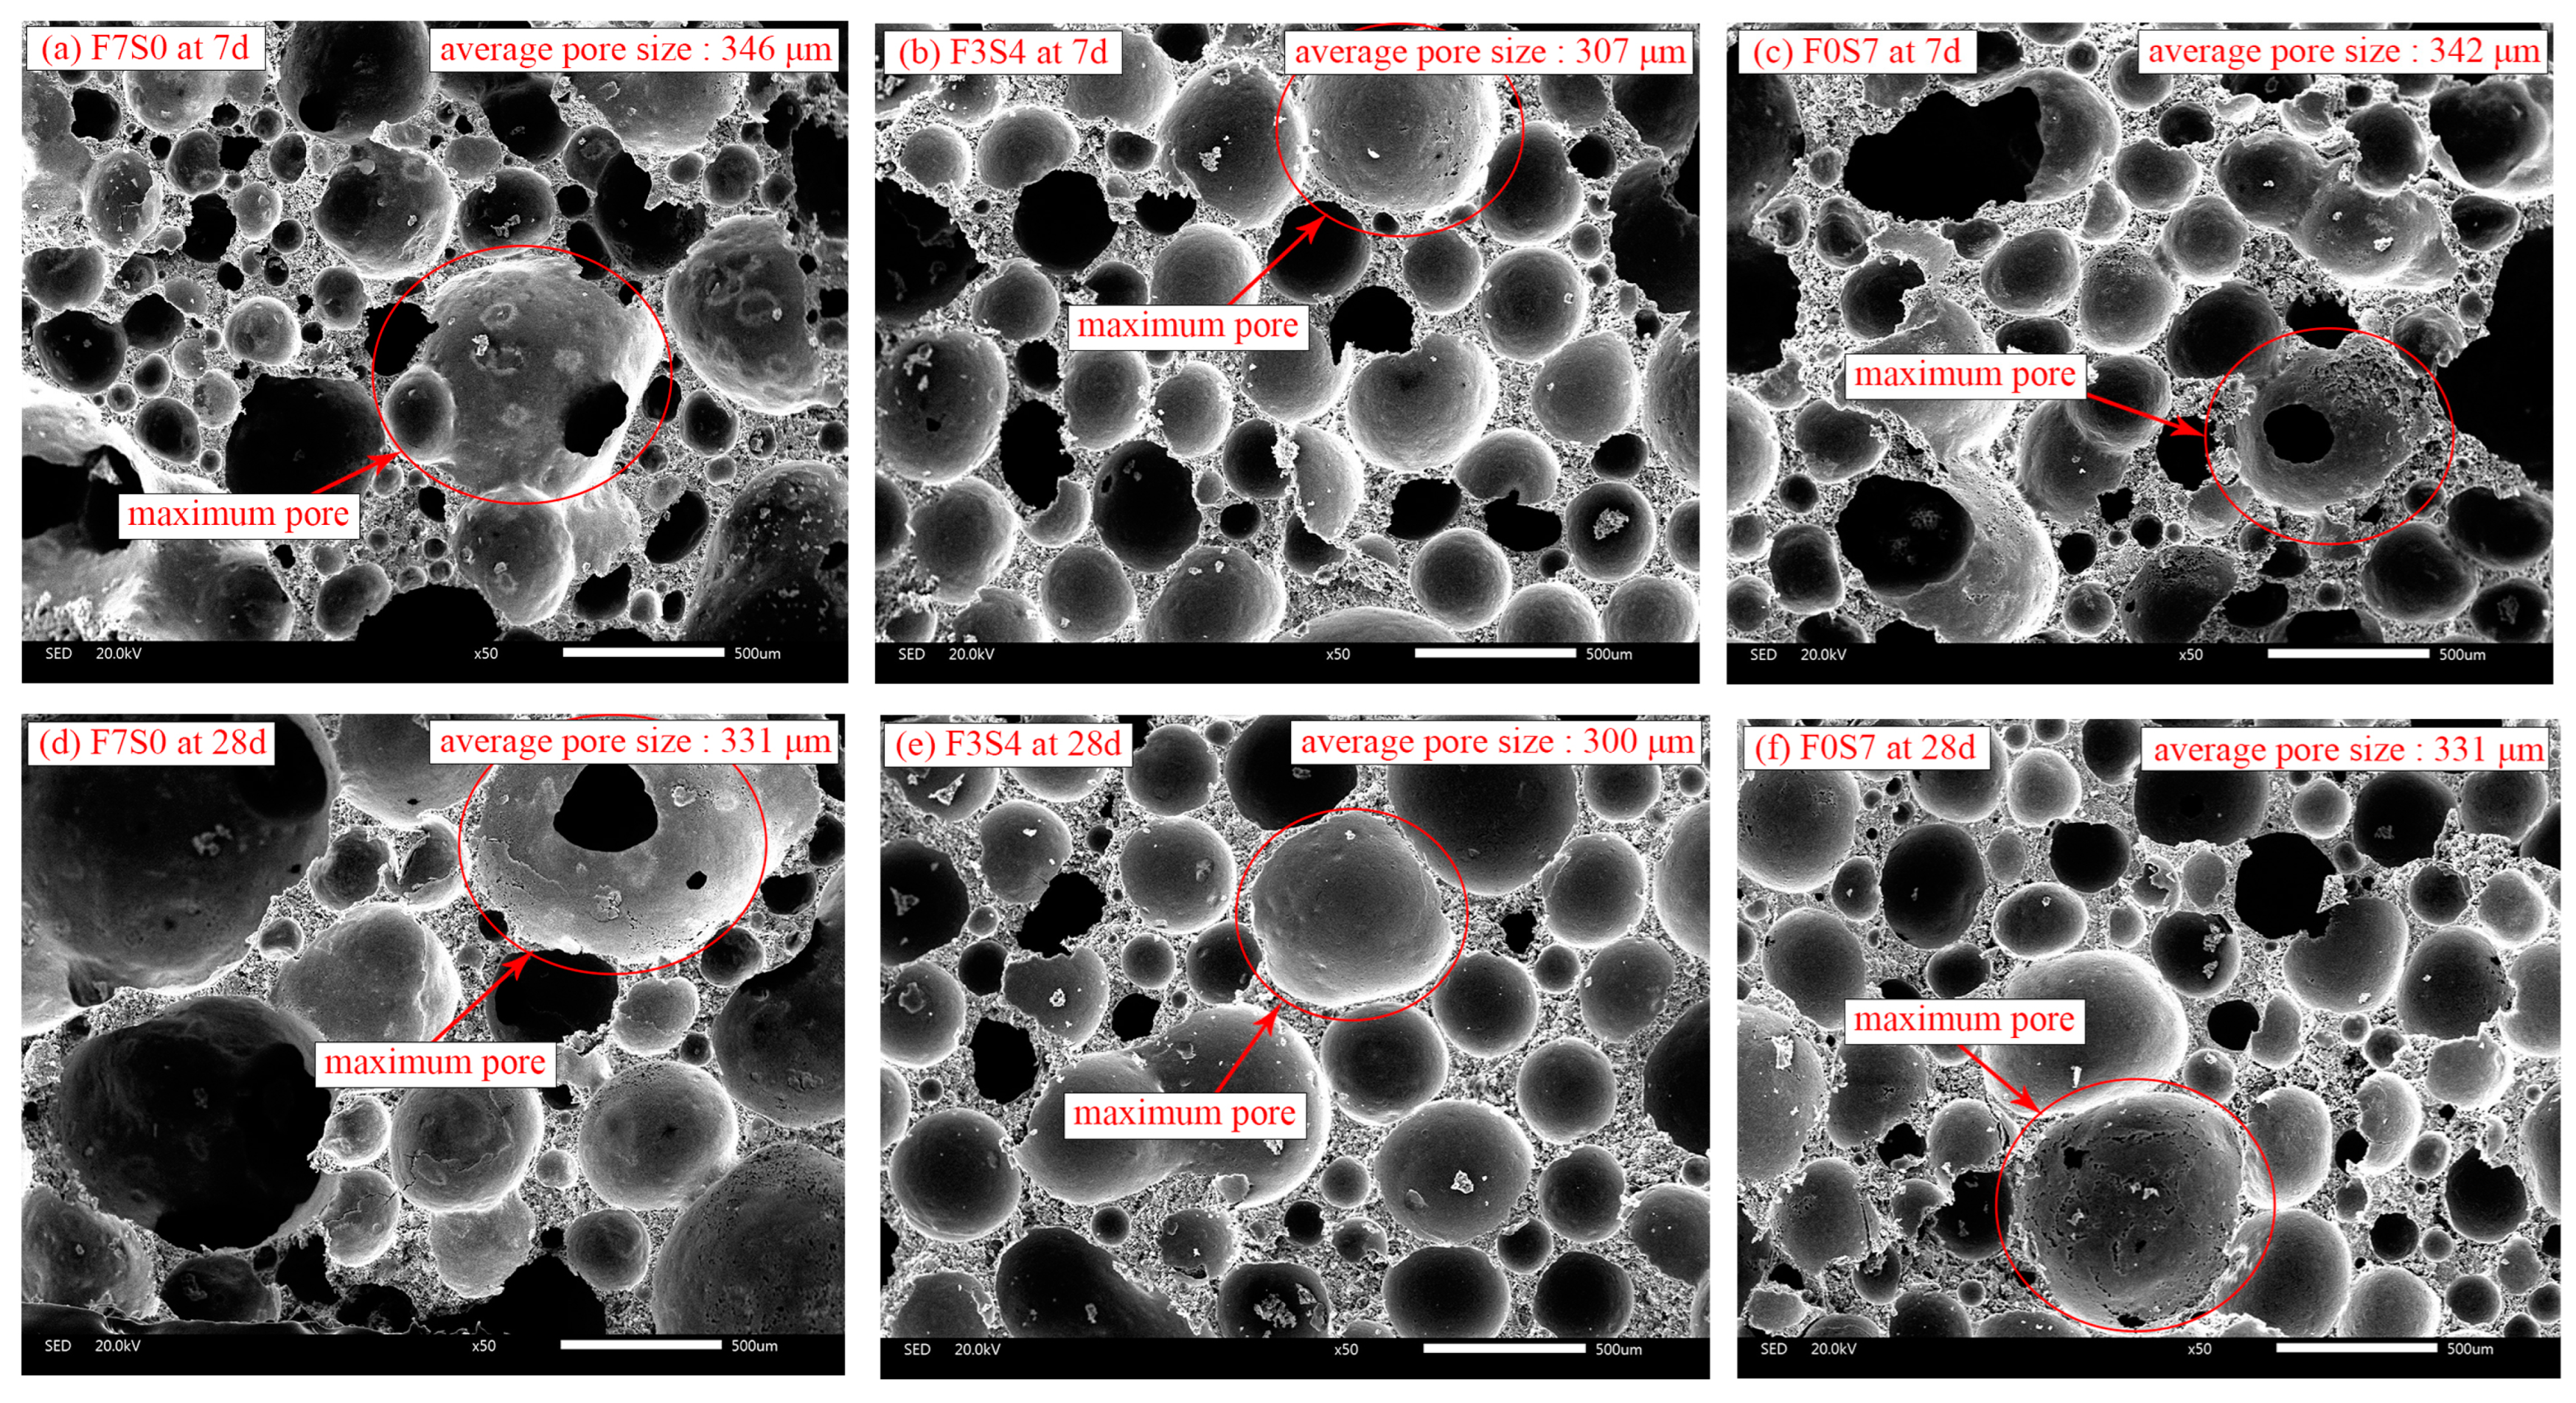
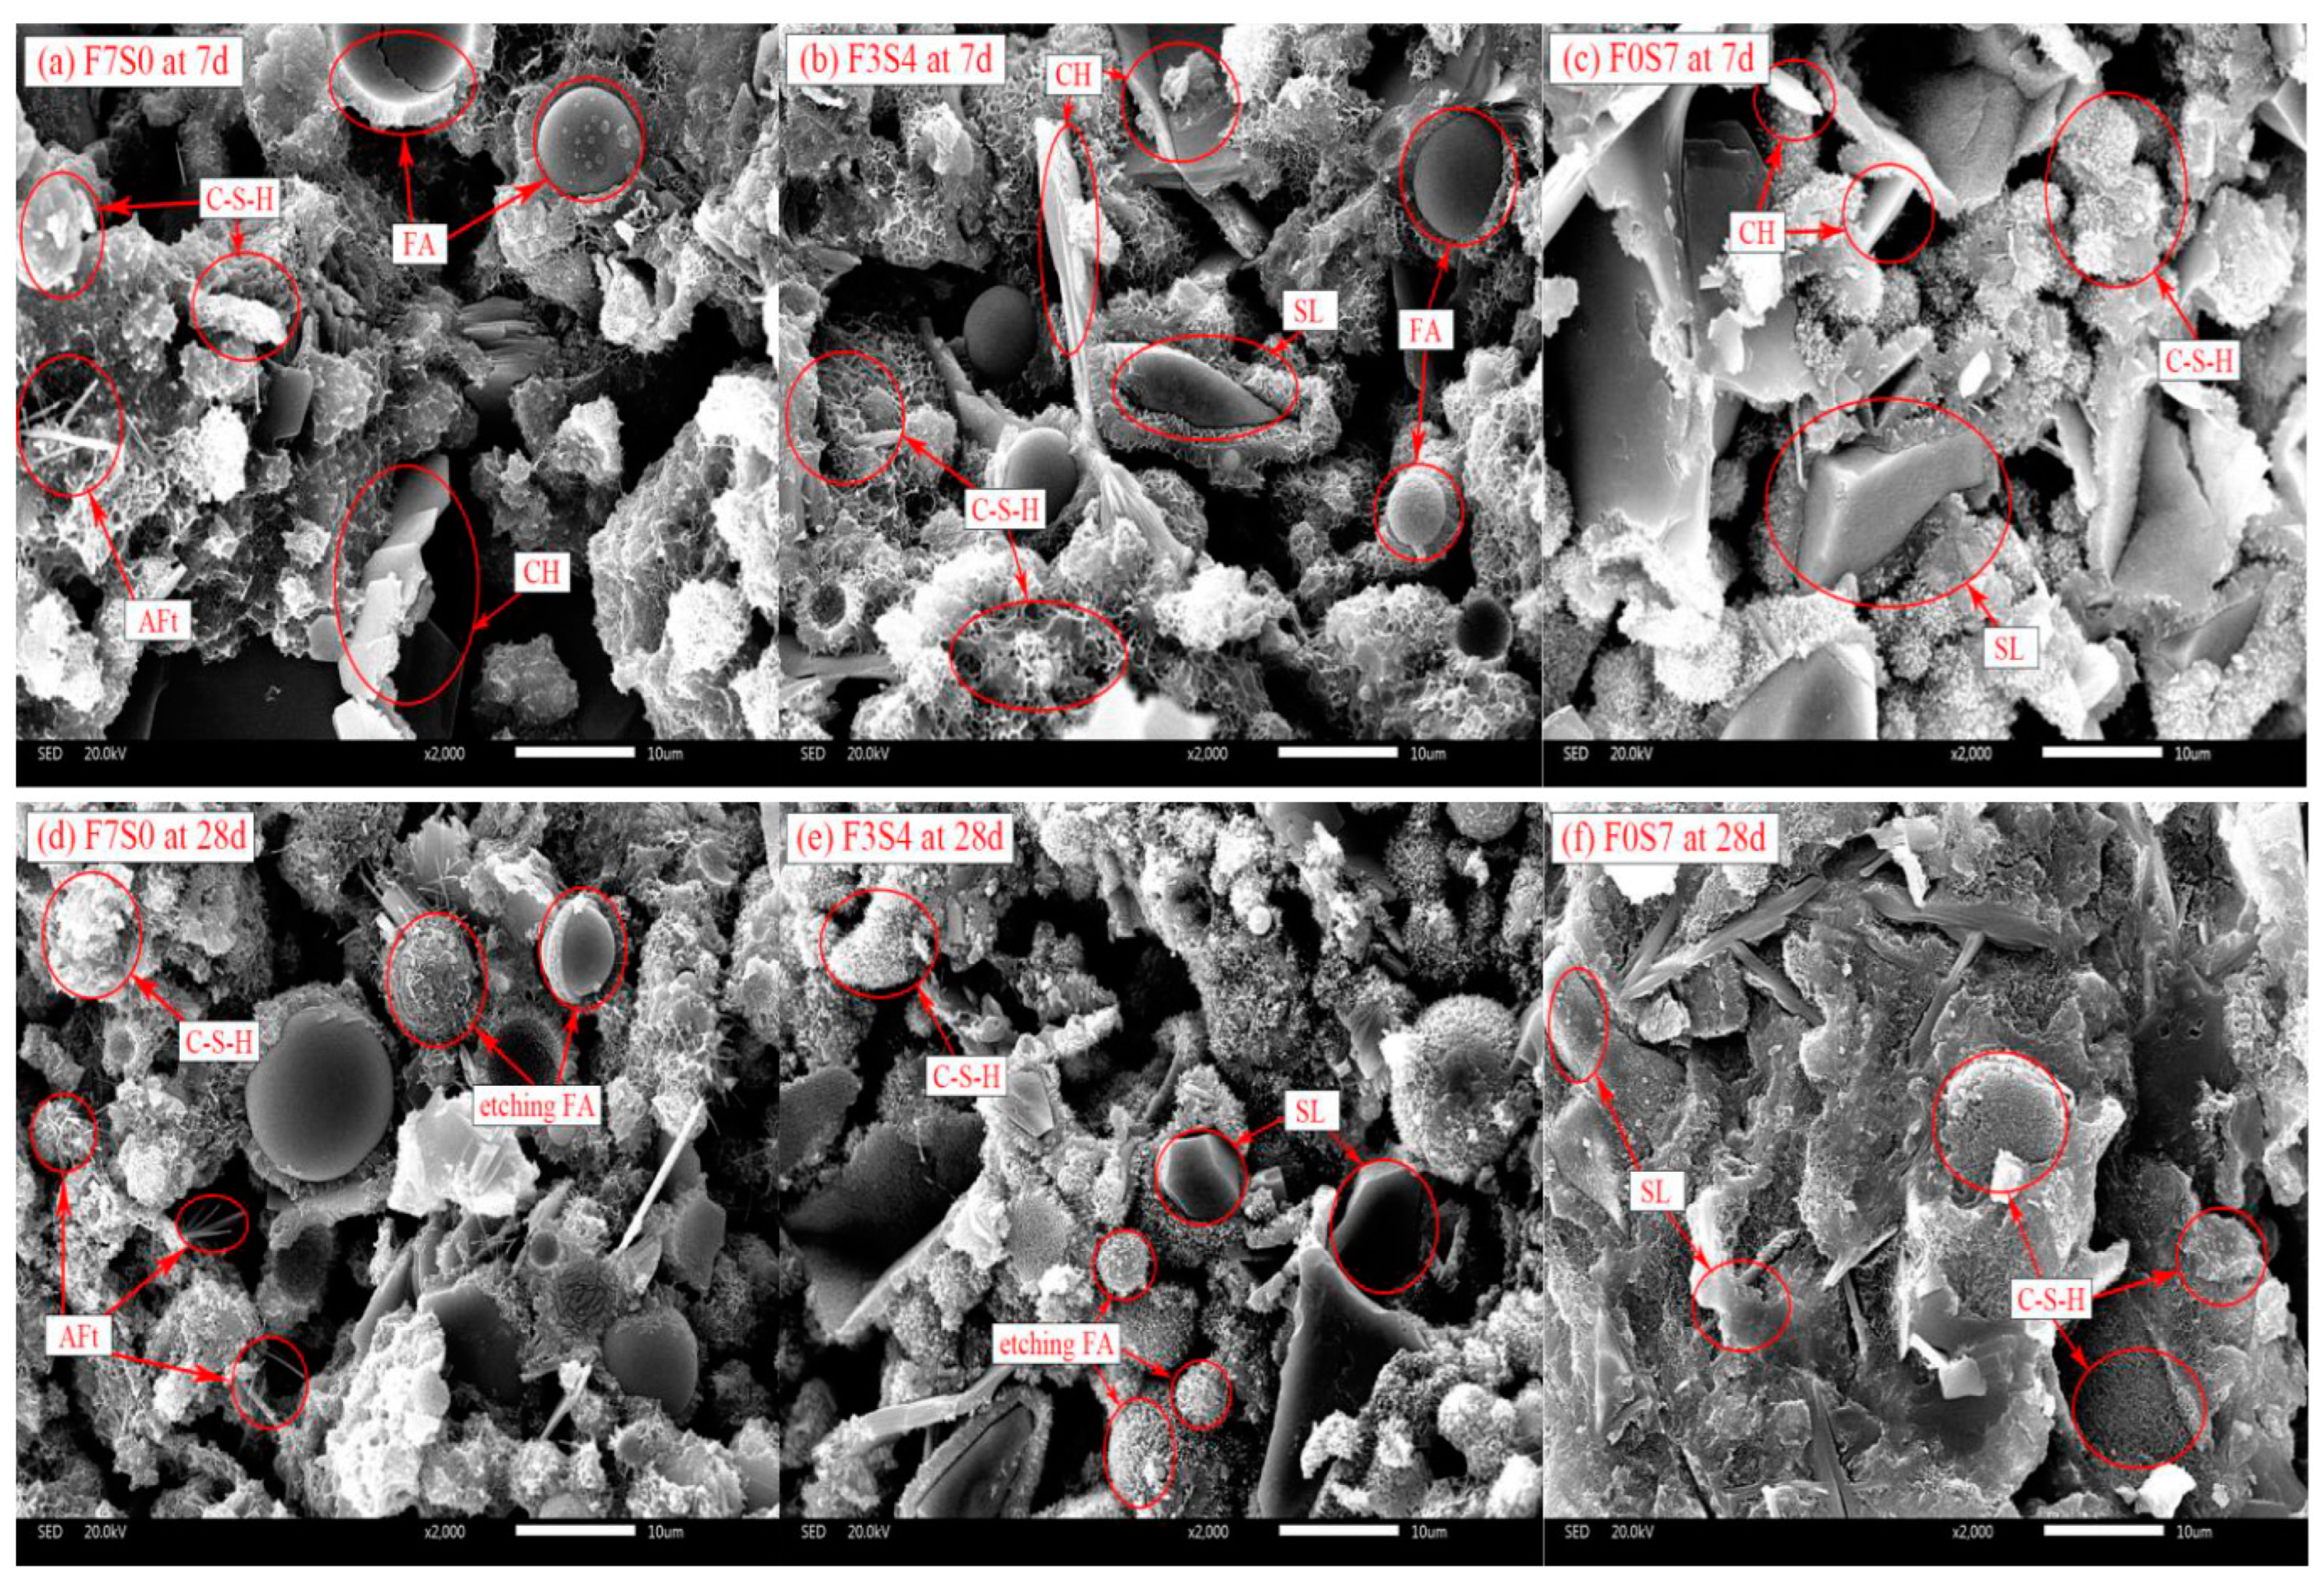
3.4.3. SEM
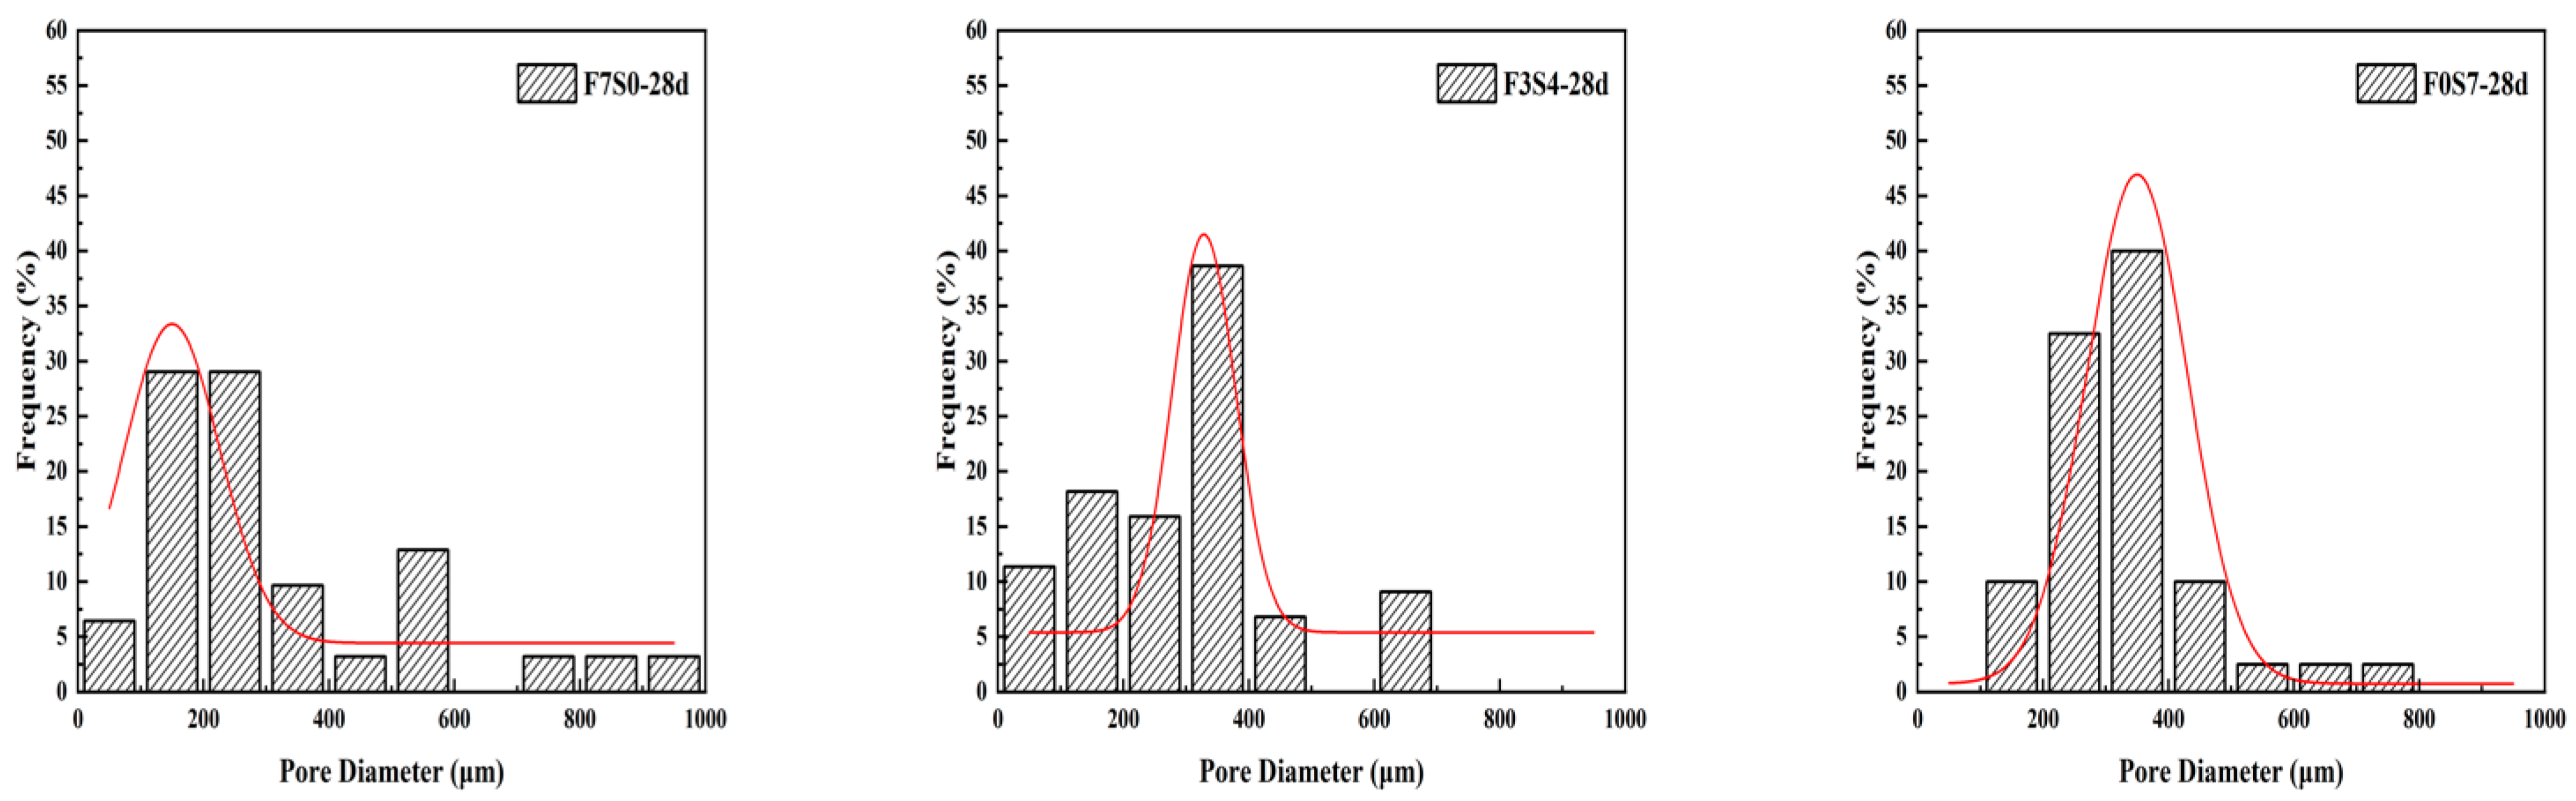
3.5. Stability of LCFLS
3.5.1. Analysis of the Homogeneity of the Freshly Mixed Slurry
3.5.2. Analysis of the Collapse Mechanism during Hardening
4. Conclusions
Author Contributions
Funding
Data Availability Statement
Conflicts of Interest
References
- Shah, S.N.; Yap, S.P. Lightweight foamed concrete as a promising avenue for incorporating waste materials: A review. Resour. Conserv. Recycl. 2021, 164, 105103. [Google Scholar] [CrossRef]
- Narayanan, N.; Ramamurthy, K. Structure and properties of aerated concrete: A review. Cem. Concr. Compos. 2000, 22, 321–329. [Google Scholar] [CrossRef]
- Amran, Y.M.; Farzadnia, N. Properties and applications of foamed concrete: A review. Constr. Build. Mater. 2015, 101, 990–1005. [Google Scholar] [CrossRef]
- Youssef, M.B.; Neji, J. Upscaling the elastic stiffness of foam concrete as a three-phase composite material. Cem. Concr. Res. 2018, 110, 13–23. [Google Scholar] [CrossRef] [Green Version]
- Ortiz, O.; Sonnemann, G. Sustainability in the construction industry: A review of recent developments based on LCA. Constr. Build Mater. 2009, 23, 28–39. [Google Scholar] [CrossRef]
- Huang, J.J.; Su, Q. Experimental study on use of lightweight foam concrete as subgrade bed filler of ballastless track. Constr. Build Mater. 2017, 149, 911–920. [Google Scholar] [CrossRef]
- Watabe, Y.; Noguchi, T. Site-investigation and geotechnical design of D-runway construction in Tokyo haneda airport. Soils Found. 2011, 51, 1003–1018. [Google Scholar] [CrossRef] [Green Version]
- Kikuchi, Y.; Mizutani, T.A. The effect of air foam inclusion on the permeability and absorption properties of light weight soil. Soils Found. 2011, 51, 151–165. [Google Scholar] [CrossRef] [Green Version]
- Kearsley, E.P.; Wainwright, P.J. The effect of high fly ash content on the compressive strength of foamed concrete. Cem. Concr. Res. 2001, 31, 105–112. [Google Scholar] [CrossRef]
- Liu, H.; Wang, H. Preparation and Performance Study of Large Volume Foamed Lightweight Soil for an Intelligent Networked Vehicle Test Site. Materials 2022, 15, 5382. [Google Scholar] [CrossRef]
- Zhang, Z. Geopolymer foam concrete: An emerging material for sustainable construction. Constr. Build. Mater. 2014, 56, 113–127. [Google Scholar] [CrossRef]
- Qing, J.G.; Jie, W.Z. The effects of pozzolanic powder on foam concrete pore structure and frost resistance. Constr. Build. Mater. 2019, 208, 135–143. [Google Scholar]
- Hang, M.Y.; Ran, Y. Influence of mineral admixtures on properties of foam concrete. Bull. Chin. Ceram. Soc. 2018, 37, 1480–1486. [Google Scholar]
- Kearsley, E.P.; Wainwright, P.J. The effect of porosity on the strength of foamed concrete. Cem. Concr. Res. 2002, 32, 233–239. [Google Scholar] [CrossRef]
- Jones, M.R.; McCarthy, A. Heat of hydration in foamed concrete: Effect of mix constituents and plastic density. Cem. Concr. Res. 2006, 36, 1032–1041. [Google Scholar] [CrossRef]
- Falliano, D.; Ricciardi, G. Experimental investigation on the compressive strength of foamed concrete: Effect of curing conditions, cement type, foaming agent and dry density. Constr. Build. Mater. 2018, 165, 735–749. [Google Scholar] [CrossRef]
- Jiang, J.; Yang, Y. Facile preparation and hardened properties of porous geopolymer-supported zeolite based on swelled bentonite. Constr. Build. Mater. 2019, 228, 117040. [Google Scholar] [CrossRef]
- Ma, B.; Tan, H. Effect of triisopropanolamine on compressive strength and hydration of cement-fly ash paste. Constr. Build. Mater. 2018, 179, 89–99. [Google Scholar] [CrossRef]
- Dhasindrakrishna, K.; Pasupathy, K. Effect of yield stress development on the foam-stability of aerated geopolymer concrete. Cem. Concr. Res. 2020, 138, 106233. [Google Scholar] [CrossRef]
- Blandine, F.; Olivier, P. Optimal cement paste yield stress for the production of stable cement foams. Cem. Concr. Res. 2019, 120, 142–151. [Google Scholar]
- Hoang, M.T.; Perrot, C. Solid films and transports in cellular foams. J. Appl. Phys. 2012, 112, 054911. [Google Scholar] [CrossRef] [Green Version]
- Roussel, N.; Brumaud, C. The origins of thixotropy in fresh cement pastes. Cem. Concr. Res. 2012, 42, 148–157. [Google Scholar] [CrossRef]
- China Association for Engineering Construction Standardization. Technical Specification for Cast-In-Situ Foamed Lightweight Soil: CECS 249:2008; China Planning Press: Beijing, China, 2008. [Google Scholar]
- Long, L.; Chi-sun, P. Rheology behavior of one-part alkali activated slag/glass powder (AASG) pastes. Constr. Build. Mater. 2020, 258, 120381. [Google Scholar]
- State Administration for Market Regulation. Test Methods of Autoclaved Aerated Concrete: GB/T 11969-2020; Standards Press of China: Beijing, China, 2020. [Google Scholar]
- Wei, S.; Yi, D. Influence of coarse fly ash on the performance of foam concrete and its application in high-speed railway roadbeds. Constr. Build. Mater. 2018, 170, 153–166. [Google Scholar]
- Font, A.; Soriano, L. Salt slag recycled by-products in high insulation alternative environmentally friendly cellular concrete manufacturing. Constr. Build. Mater. 2020, 231, 117114. [Google Scholar] [CrossRef]
- Zhao, W.H. Study on the Structural Performances and Construction Technologies of Foamed Concrete Subgrade of High-Speed Railway. Ph.D. Thesis, Southwest Jiaotong University, Chengdu, China, 2018. [Google Scholar]
- Panesar, D.K. Cellular concrete properties and the effect of synthetic and protein foaming agents. Constr. Build. Mater. 2013, 44, 575–584. [Google Scholar] [CrossRef]
- Li, B. Study on the Mechanism of Hydration and Structural Evolution of Slag Cement Modified with Keggin-Al13. Ph.D. Thesis, Wuhan University of Technology, Wuhan, China, 2020. [Google Scholar]
- Weerdt, K.D.; Haha, M.B. Hydration mechanisms of ternary Portland cements containing limestone powder and fly ash. Cem. Concr. Res. 2011, 41, 279–291. [Google Scholar] [CrossRef]


| Density/(kg/m3) | Specific Surface Area/(m2/kg) | Soundness of Cement/mm | Setting Time/min | Flexural Strength/MPa | Compressive Strength/MPa | |||
|---|---|---|---|---|---|---|---|---|
| Initial | Final | 3 d | 28 d | 3 d | 28 d | |||
| 3100 | 340 | 2 | 170 | 235 | 5.6 | 8.7 | 28.1 | 50.4 |
| Material | CaO | SiO2 | Al2O3 | Fe2O3 | MgO | SO3 | K2O | Na2O | TiO2 | LOI |
|---|---|---|---|---|---|---|---|---|---|---|
| Cement | 60.11 | 20.92 | 5.76 | 3.24 | 1.15 | 2.86 | 0.88 | 0.14 | 0.31 | 4.17 |
| Granulated Blast Furnace Slag | 39.92 | 31.23 | 14.12 | 0.78 | 7.34 | 2.23 | 0.61 | 0.72 | 0.76 | −0.29 |
| Fly Ash | 0.44 | 57.64 | 21.49 | 6.52 | 1.77 | 0.37 | 3.42 | 0.12 | 0.93 | 6.85 |
| No. | Cementitious Material Systems | Water | Foam | ||
|---|---|---|---|---|---|
| PC | GBFS | FA | |||
| F0S7 | 105 | 245 | 0 | 227.5 | 32.2 |
| F1S6 | 105 | 210 | 35 | 227.5 | 32.2 |
| F2S5 | 105 | 175 | 70 | 227.5 | 32.2 |
| F3S4 | 105 | 140 | 105 | 227.5 | 32.2 |
| F4S3 | 105 | 105 | 140 | 227.5 | 32.2 |
| F5S2 | 105 | 70 | 175 | 227.5 | 32.2 |
| F6S1 | 105 | 35 | 210 | 227.5 | 32.2 |
| F7S0 | 105 | 0 | 245 | 227.5 | 32.2 |
| Item | Flowability (mm) | Wet Density (kg/m3) | 7 d Compressive Strength (MPa) | 28 d Compressive Strength (MPa) |
|---|---|---|---|---|
| Standard value | 160–180 | 550–650 | ≥0.5 | ≥1.0 |
| Temperature Range | F7S0 | F3S4 | F0S7 | |
|---|---|---|---|---|
| 7 d | at 50–200 °C (%) | 3.3301 | 3.8531 | 4.5568 |
| at 400–500 °C (%) | 1.1679 | 1.4288 | 1.4625 | |
| at 650–750 °C (%) | 1.0139 | 1.4330 | 1.9891 | |
| CH content (%) | 6.5066 | 8.2840 | 9.3578 | |
| 28 d | at 50–200 °C (%) | 3.8200 | 5.2288 | 5.6405 |
| at 400–500 °C (%) | 1.2730 | 1.6070 | 1.6765 | |
| at 650–750 °C (%) | 1.1868 | 1.4461 | 2.0801 | |
| CH content (%) | 7.2294 | 9.0386 | 10.3906 |
| Average Diameter (μm) | Mean Value (μm) | ||
|---|---|---|---|
| F7S0 | 338 | 298 | 147 |
| F3S4 | 303 | 327 | 101 |
| F0S7 | 336 | 350 | 161 |
Disclaimer/Publisher’s Note: The statements, opinions and data contained in all publications are solely those of the individual author(s) and contributor(s) and not of MDPI and/or the editor(s). MDPI and/or the editor(s) disclaim responsibility for any injury to people or property resulting from any ideas, methods, instructions or products referred to in the content. |
© 2023 by the authors. Licensee MDPI, Basel, Switzerland. This article is an open access article distributed under the terms and conditions of the Creative Commons Attribution (CC BY) license (https://creativecommons.org/licenses/by/4.0/).
Share and Cite
Shen, C.; Liu, H.; Wan, H.; Li, J.; Liu, P.; He, Q.; Xuan, J. Effect of Cementitious Material Composition on the Performance of Low-Carbon Foamed Lightweight Soil. Buildings 2023, 13, 759. https://doi.org/10.3390/buildings13030759
Shen C, Liu H, Wan H, Li J, Liu P, He Q, Xuan J. Effect of Cementitious Material Composition on the Performance of Low-Carbon Foamed Lightweight Soil. Buildings. 2023; 13(3):759. https://doi.org/10.3390/buildings13030759
Chicago/Turabian StyleShen, Cong, Hao Liu, Huiwen Wan, Jixin Li, Peng Liu, Qiqing He, and Jiaqi Xuan. 2023. "Effect of Cementitious Material Composition on the Performance of Low-Carbon Foamed Lightweight Soil" Buildings 13, no. 3: 759. https://doi.org/10.3390/buildings13030759