Article

Experimental Investigation of Compound Effect of Flexural and Torsion on Fiber-Reinforced Concrete Beams

1
Department of Civil Engineering, College of Engineering, University of Babylon, Babylon 51002, Iraq
2
Civil Engineering Department, University of Technology, Baghdad 10066, Iraq
3
Department of Civil Engineering, Ohio University, Athens, OH 45701, USA
*
Author to whom correspondence should be addressed.
Buildings 2023, 13(5), 1347; https://doi.org/10.3390/buildings13051347
Submission received: 24 March 2023 / Revised: 20 April 2023 / Accepted: 18 May 2023 / Published: 21 May 2023
(This article belongs to the Special Issue Structural Health Monitoring of Buildings, Bridges and Dams)

Abstract

:
Fiber-reinforced concrete is widely acknowledged for its ability to resist cracking effectively and limit its propagation. By preventing cracks from spreading, the addition of fiber composites to concrete can enhance its extensibility and tensile strength, not only at the initial point of cracking but also at its maximum capacity. Additionally, the fibers in fiber-reinforced concrete are capable of binding the matrix, even when exposed to significant cracking. However, there is limited information available about the behavior of fiber-reinforced concrete under a bending moment combined with torsion. This study aims to investigate the structural behavior of fiber-reinforced concrete members subjected to a bending moment with a torsion to moment ratio equal to 1. Synthetic and steel fibers of 1.0% content with different lengths (19, 35, and 55 mm for synthetic fiber and 13 mm for straight and hook steel fibers) were mixed with concrete mixtures to examine the effects of fiber lengths and types on the concrete beam performance. Test results indicated that the fiber-reinforced concrete beams showed higher cracking moments than the normal-strength concrete beam. The steel fiber with a hooked configuration reinforced beam showed increased moment capacity and total torsional toughness higher than that of the straight steel fiber-reinforced beam. The synthetic fiber of a 55 mm length reinforced beam exhibited the highest first-crack and ultimate moment values among other tested beams. The test results were compared with past research models for the moment capacity of beams under the compound effect of bending and torsion and we modified these values with another factor that represented the fiber length influence on beam capacity, as suggested in past research. The comparison between the ultimate moment of the test results and the moment predicted from the modified past research model presented a good correlation.

1. Introduction

Beams are essential for the structural stability of many buildings and other structures, such as bridges [1,2,3,4,5]. Concrete beams are made from reinforced concrete, steel, or composite materials designed to bear external loads. Moreover, beams serve as supports for slabs, walls, columns, and other structural elements, facilitating the transfer of loads to the supporting columns. Researchers and engineers remain concerned about the torsional load in concrete components such as curved girders and eccentrically loaded beams. Hence, designing concrete structural members to withstand torsion is a crucial task. The torsion of a beam that can lead to a failure is caused mainly by the development of tensile stresses developed under the condition of pure shear, which arise initially due to the torsion action [6]. Furthermore, the spandrel beams that may be used in constructed buildings, eccentrically loaded beams that are usually utilized in multi-deck bridges, and box girder bridges are examples of the most likely constructions to have beam elements that are exposed to torsion force and require a particular design to resist such forces and enhance their strength performance [1,7,8,9].
Concrete is generally a brittle material that cannot resist high tensile strength without adding fibers [10]. In recent years, studies have incorporated synthetic and steel fibers into the concrete mixture to improve its ductility and tensile strength, thereby producing a less fragile material than traditional concrete [11]. Torsional action on reinforced concrete beams does not occur alone, but, in some cases, the torsional force may take over the structural behavior affecting the element [12]. Yang et al. [9] reported limitations in reinforced concrete beams subject to pure torsion forces, regardless of their strength classification. Bernardo and Lopes [13] conducted a test on high-strength concrete beams to observe the ductility of the beams; results showed low performance of the specimens, despite altering the reinforcement ratio to its narrowest limit. Ju and Kim [14] argued that the shape of beams has become slenderer and more irregular when compared to past research, and this requires a further investigation into the design of structural elements, taking into consideration the various types of loads, with torsion being one of them. In a contrasting experiment, Baker [15] concluded that high-strength concrete beams were inferior to normal-strength concrete (NSC) beams when it came to the ductility of the element by showing more cracks. Therefore, researchers in the engineering and production fields have increased their focus on enhancing the performance of beams against torsion to comprehend and enhance the strength of reinforced concrete beams [12].
Multiple authors have investigated the torsion performance of reinforced concrete beams under a pure torsion load only. Ju et al. [14] noted that structural beams that were designed based on the design code from the America Concrete Institute (ACI) [16] were observed to record unsatisfactory torsional member strengths. Chiu et al. [8] conducted a study to investigate and experimentally analyze the crack pattern, maximum crack width at the service load level, torsional strength, torsional ductility, and post-cracking reserve strength of solid and hollow cross-sections of high-strength concrete and NSC beams. The study also explored several parameters, such as the volumetric ratio of torsional reinforcements, concrete compressive strength, and cross-section aspect ratio. The study concluded that the post-cracking strength reserve of the tested beams was influenced by the ratio of transverse to longitudinal reinforcement factors and the total amount of torsional reinforcement used. Additionally, the authors noted that an increase in the aspect ratio of the beam cross-section resulted in reduced cracking and ultimate strength. Moreover, different theoretical equations have been suggested to evaluate the cracking torque and ultimate torque of fiber-reinforced concrete beams under a pure torsion load by Hassan et al. [17,18].
Analytical and experimental investigations have been conducted in the literature to examine normal-strength concrete beams’ combined bending and torsional strength [19]. Moreover, other researchers have focused on experimental studies of high-strength reinforced concrete structures under combined loading [20]. Leung and Schnobrich [19] discussed extending the diagonal compression field theory to study the post-cracking behavior of reinforced concrete sections subjected to combined axial force, biaxial bending, and torsion. Results showed that the combined bending and torsion of rectangular and slab sections determined the moment/curvature and torsion/twist responses when subjected to combined loadings for normal-strength concrete. Santhakumar et al. [21], Rahal and Collins [2], and Martin [22] proposed a mathematical formula to determine the maximum moment that reinforced concrete beams can withstand when subjected to combined bending and torsion. Onsongo [23] and Mardukhi [24] experimentally studied the compound effect of bending and torsion of normal-strength concrete beams. Travush et al. [20] investigated crack propagation and deformation in high-strength steel fiber-reinforced concrete beams with round cross-sections under combined bending and torsion. However, minimal experimental data and no equations are currently available for the design of fiber-reinforced concrete beams utilizing synthetic or steel fibers subjected to combined bending and torsion loads. Moreover, the ACI, Eurocode, and British Specifications (BS) do not provide any details related to fiber-reinforced concrete beam design with synthetic and steel fibers under combined bending and torsion loads. The aim of this study is to investigate how various types of fibers impact the beam characteristics of fiber-reinforced concrete (FRC) subjected to combined bending and torsion, specifically in terms of cracking and failure criteria, as well as the cracking and ultimate moments of the FRC beam.

2. Experimental Program

The main aims of the research were to investigate the material and structural characteristics in terms of the influence of different types of fibers (synthetic and steel fibers) on the structural behavior of RC beams under compound bending and torsion. Both synthetic and steel fibers were added to the concrete mix in a dosage of 1% of the total volume, along with other components used in the concrete mixture. Three lengths of synthetic fiber were used (19, 35, and 55 mm). On the other hand, two types of steel fiber of 13 mm in length, with the same aspect ratio of 65, were added to the concrete mix (straight and hook).

2.1. Materials

In this study, Portland cement, crushed coarse aggregate (14 mm maximum size), and local natural sand were used. In accordance with IQS No. 5/1984 [25] standard, a chemical analysis of the Portland cement was conducted, and the results are listed in Table 1. In contrast, Table 2 shows the physical properties of the Portland cement. Table 3 and Table 4 list the grading of the physical and chemical properties of the fine aggregate following the IQS No. 5/1984 [25] and IQS No. 45/1984 [26] standards, respectively. In addition, for the coarse aggregate analysis, Table 5 and Table 6 list the physical and chemical properties following the IQS No. 5/1984 [25] and IQS No. 45/1984 [26] standards, respectively.
Additionally, fibers were incorporated into the mixture to improve the concrete’s mechanical properties and enhance the structural beams’ performance. The properties of synthetic (STH), straight steel (SSF), and hook steel (HSF) fibers are listed in Table 7 and shown in Figure 1. Synthetic fibers are made from copolymer materials typically derived from petrochemicals. Steel fibers are made from steel, primarily composed of iron and with varying amounts of carbon, manganese, silicon, sulfur, and phosphorus. Generally, steel fibers used to reinforce concrete have a composition of at least 95% iron, with carbon and other elements comprising the remaining 5%.

2.2. Concrete Mixes

A total of six concrete mixtures were prepared and mixed, which are listed in Table 8. The control mix used in the study was the NSC mix, and the other five mixes contained 1% fiber content with different types and lengths (19 mm STH, 35 mm STH, 55 mm STH, SSF, and HSF), namely STH-19, STH-35, STH-55, SSF-13, and HSF-13, respectively. In order to avoid the formation of fiber balls in the concrete mix, the fiber was included after mixing all other concrete materials, to ensure the even distribution of the fiber throughout the mix. To prepare the samples for casting, water with a pH value of 6 was used in the concrete mix and cured specimens. The NSC and FRC mixes were formulated to achieve the same compressive strength by maintaining a fixed fiber quantity of synthetic and steel fibers in each mix. This was done to investigate the effect of fiber length and type on the concrete’s mechanical properties and torsional characteristics.

2.3. Specimen Preparation

For the hardened mechanical properties of every mix design, three samples of each mix were set following the standards for each test requirement. Cylinders and prisms were cast for the concrete splitting tensile strength (ASTM C496/C496M [27]) and concrete flexural strength (ASTM C78/C78M [28]), respectively. Moreover, cubs were prepared for the compressive strength (EN, B.-12390-2 [29]). In order to obtain the best distribution and prevent fibers from rolling into balls during the mixing of the concrete components, especially for the STH-35 and STH-55 mixes, the fibers were added after other concrete constituents.
In order to examine the compound effect of the flexural and torsional performance of FRC beams with different fiber types, 5 FRC beams were cast (see Figure 2), along with one NSC beam as a control beam. Specimen identification names are listed in Table 9. The dimensions of the tested beams were 100 × 150 × 1500 mm, width × depth × length. Along with the fibers, all beams were reinforced with 2-Ø10 mm steel bars as a longitudinal reinforcement for both the top and bottom layers. In the transverse direction, Ø5 mm steel bars were used as stirrups at 60 mm (see Figure 2). To prevent shear failure at the ends of the beams, the tested beams were reinforced with Ø5 mm bars at 50 mm on each end. In accordance with ASTM A615/A615M [30], the yield stress of 462 MPa for the Ø10 mm bar and 437 MPa for the Ø5 mm bar was obtained.

2.4. Test Procedure

After the curing period ended, the samples underwent testing to determine their compressive strength at 28 days, in accordance with the EN, B.-12390-2 [29] standard. To do this, 15 cm cubes were subjected to a hydraulic compressive machine with a 1600 kN capacity. The specimens were also subjected to the splitting tensile test and flexural strength test used following the ASTM C496/C496M-17 [27] and ASTM C78/C78M-18 [28] standards, respectively. The six beams were tested in a specifically constructed test frame for the function of applying bending and torsion. The essential element of the test loading frame was used for loading and restraining. Figure 3b shows a concrete beam positioned onto a hydraulic compression testing machine with a maximum capacity of 670 kN. A hemispherical bearing was used on the top of the steel beam to center it and eliminate any load eccentricity during the testing process. The beams were supported on simple supports at 75 mm from both ends, which permitted the beam to rotate about the center. The combined action of torsion–bending was obtained using two steel arms attached to the middle third of the tested beam at two opposite points, with dimensions that gave equal bending and torque (T/M = 1). This setup ensured that the stresses on the middle third of the tested beam were purely in the torsional and flexural modes. Additionally, two dial gauges with a 10 cm distance between them were fixed at the end of the beam on the left and right to identify the torque-angular twist angle. These two dial gages served to gauge the uplift and down values. At every load interval, the rotating angle readings were recorded. In addition to these dial gages, another dial gage was applied at the mid-span to identify the bending moment–deflection, as shown in Figure 3.

3. Results and Discussion

3.1. Mechanical Properties

Once the beams and other specimens were cast, they were cured in accordance with the standards set out in ASTM C192/C192M [31]. After 24 h, the specimens were removed from their molds and submerged in water for a period of 28 days. Following this, they were removed from the water and preserved for another 28 days, in accordance with ASTM C192/C192M-02 [31], until the day of testing. The average values of the compressive strength of cubes, cylinders, and prisms were determined for each concrete mix, as shown in Figure 4 and listed in Table 10. Additionally, the brittleness ratios were calculated for each mix by dividing the compressive strength by the flexural strength.
In Table 10, the results of the compression, tensile, and flexural strengths tests for the control NSC mix and other mixes with fibers are listed. The NSC strengths were 31.41, 2.73, and 3.55 MPa for compression, tensile, and flexural, respectively. However, the addition of the fibers in the concrete mixture significantly impacted the compression, tensile, and flexural strength results, especially for the tension and flexural strength. The degree of the effect of the fiber on the hardened concrete’s properties was relative to the fiber length included in the concrete mixture, regardless of whether we used fiber, steel, or synthetic. This may have been related to the failure mechanism (pull out), which depends on the bond strength between the concrete mix and fibers related to the fiber length and shape. The tensile strength improved by 19%, 25%, 35%, 37%, and 21% for the STH-19, STH-35, STH-55, SSF-13, and HSF-13 mixes compared to the NSC mix.
Previous research has indicated that adding fibers to concrete mixes can reduce the brittleness and improve the ductility [8,10,13]. Table 10 shows that both types of fibers decreased the brittleness of the concrete by approximately 20% compared to the NSC mix. Among the different types of fibers, the specimens with synthetic fibers measuring 55 mm in length showed the best performance.

3.2. Analysis of the Experimental Results of Tested Beams

3.2.1. Torsional and Flexural Behavior

In order to evaluate the efficiency of the fibers’ type, length, and shape, the data recorded for the period of the tests are analyzed. Table 11 lists a summary of the results with respect to the torsional characteristics for all the tested beams. Table 11 shows the various schemes versus the torsional crack and its angle of twist, the ultimate torque and the corresponding angle of twist, and the initial torsional stiffness. It should be highlighted that all types of fibers used significantly influenced the behavior in both strength and ductility. The ductility index is the ratio of the angle of twist at the ultimate torque (ϴu) to the angle of twist at elastic torque (ϴe). On the other hand, Table 11 lists a summary of the results with respect to the flexural characteristics for all the tested beams. The table shows the various schemes versus the cracking moment and its deflection, the ultimate moment capacity and the corresponding deflection, and the initial flexural stiffness. The flexural ductility index is the ratio of the deflection at the ultimate moment (Δu) to the deflection at the elastic moment (Δe)
It should be noted that the effect of adding fibers to the concrete mix on the flexural and torsional strengths considerably improved the beam performance compared to the B-NC beams. Moreover, Table 11 and Table 12 show that the impact of fibers on the torsional stiffness and torsional ductility was more significant compared with the flexural stiffness and flexural ductility. This resulted from the enhancement in the tensile strength, on which the torsional behavior depends.
Figure 5 and Figure 6 illustrate the comparisons of the end-beam torque–rotation and moment–midspan deflection curves between the B-NC, B-SSF-13, B-HSF-13, B-STH-19, B-STH-35, and B-STH-5 beams, respectively. The comparisons of the torsional and flexural behaviors between the B-NC, B-STH-19, B-STH-35, and B-STH-5 beams are shown in Figure 5a and Figure 6a. Moreover, Figure 5b and Figure 6b present the comparisons of the torsional and flexural behaviors between the B-NC, B-SSF-13, and B-HSF-13 beams. The obtained figures provide information on the cracking, ultimate, and failure torque, along with the corresponding twists and initial torsional stiffness. Both the moment versus midspan deflection and torque versus angle of rotation behaviors show an almost linear relationship until the torque and bending moment reach 3 kNm. After this, there is a significant deviation from linearity, and cracks are observed. As the specimen approaches failure, the nonlinear curves become more noticeable. As shown in Figure 5 and Figure 6, adding both types of fibers to the concrete beams improves the flexural and torsional behaviors compared to the NSC beams. This improvement is a result of the increment in the tensile strength of FRC specimens. It should be noted that adding 1% of steel and synthetic fibers to the concrete mixture improves the flexural and torsional strengths of the beams.

3.2.2. Torsional and Flexural Toughness

Toughness is typically defined as the amount of energy that can be absorbed by a material. In the case of FRC, there are different standards and methods in measuring its flexural and torsional toughness, such as the toughness model for torsion presented by Okay and Engin [12] and ASTM C1018 [32]. Figure 7 shows the different parts of the torque–rotation curve, which include the pre-cracking torsional toughness (P-I), the cracked toughness before reaching ultimate torque (P-II), and the post-cracking toughness (P-III). The areas under the curve for each of these parts represent the energy absorbed by the concrete, which is known as torsional toughness. The initial torsional stiffness can also be obtained using the torque–rotation linear curve, as shown in Figure 7.
Figure 8 presents a comparison between the NSC and FRC beams. The results show that the three toughness measures of FRC beams are higher than those of NSC beams, suggesting that the FRC beams exhibit some strain-hardening behavior, while the NSC beams show softening behavior. In the case of FRC beams, the toughness indices (part II and part III) are related to the fiber shape and type, i.e., the hook steel FRC beam shows higher values than the straight steel FRC beam. Moreover, synthetic FRC beams show higher toughness indices than steel FRC beams.
An evaluation method of the flexural toughness based on ASTMC1018 [32] was conducted. The diagram in Figure 9 illustrates the procedure and computations. The ratios of the area under the load–vertical deflection curve, which are equal to 3, 5.5, 10, and 15.5 times the first-crack deflection, divided by the area up to the first-crack deflection, are used to calculate the indices I5, I10, I20, and I30. In a linear elastic and brittle material, all indices would be equal to 1. However, for an elastic–ideal plastic material, I5, I10, I20, and I30 should be greater than or equal to 5, 10, 20, and 30, respectively. The results of the flexural model are presented in Figure 9; the flexural toughness indices of the four parts were calculated from Figure 9 and are depicted in Table 13.
Here,
I 5 = A 2 + A 1 A 1
I 10 = A 3 + A 2 + A 1 A 1
I 20 = A 4 + A 3 + A 2 + A 1 A 1
I 30 = A 5 + A 4 + A 3 + A 2 + A 1 A 1

3.2.3. Cracking Pattern and Failure Modes

All cracks started and propagated at the tested parts of the beams (mid-third). The first cracks were vertical at the bottom fiber, similar to flexural cracks, as shown in Figure 10a. With a load increase, the cracks started to incline in the same way as torsional cracks at a 45 ± 5-degree inclination angle along the length of the beams, as shown in Figure 10a. Figure 10b depicts the cracking pattern initiated from the mid-span and propagated at an inclination angle of 45 ± 5 degrees along the beam’s length. During the experiment, it was observed that the torsional cracks started to widen, and new cracks were propagated in the tested area. At the mid-third of the beam, diagonal cracks appeared on all sides, as shown in Figure 10c.
The first crack in the B-NC beam occurred at 1 kNm torque, and it failed when the torque moment reached 3.4 kNm, which is lower than the torque moments of the FRC beams. Figure 11a illustrates the crack patterns at the failure stage for the B-NC specimen, which propagated in an inclined path of around 450 in the tested area of the specimen. These cracks were wider on one side than the other, as a result of variation in the stresses on these sides. Moreover, the top cover of the tested portion of the beam was spread horizontally at the post-ultimate load stage near the failure load and showed ductile behavior due to the influence of steel reinforcement. The ultimate torque moment of steel FRC beams B-SSF-13 and B-HSF-13 with respect to the B-NC specimen was increased by 14.71% and 23.53%, respectively. Figure 11b,c display the crack patterns of the steel FRC beams B-SSF-13 and B-HSF-13, where the first noticeable cracks occurred at the mid-span of the tested beams B-SSF-13 and B-HSF-13 at torque moments of 1.1 and 1.2 kNm, respectively. The failure of the B-SSF-13 and B-HSF-13 beams occurred as the applied torque reached 3.9 and 4.2 kNm, respectively, which is higher than the ultimate torque moment of the B-NC beam by about 14% and 20%, respectively.
Figure 12a–c show the crack patterns at the failure stage of the synthetic fibers (B-STH-19, B-STH-35, and B-STH-55, respectively), where their first detectable cracks appeared at torque moments of about 1.2, 1.3, and 1.3 kNm at the mid-third of the tested beam, respectively. The B-STH-19, B-STH-35, and B-STH-55 tested beams failed at a torsional moment of 4.4, 4.5, and 4.6 kNm, respectively, with an increase in the ultimate moment capacities of 29.41%, 32.35%, and 35.29% compared to the B-NC beam. The crack patterns of the synthetic beams were widely scattered along the tested parts of the beams as the load increased. The failure criteria for the specific fiber-treated samples showed a similar pattern. The addition of fibers to the beams led to different failure modes compared to the control beams, as the fibers hindered the propagation of cracks in the concrete. This effect of the fibers improved the crack control mechanism and ductility of the beams in the post-cracking stage. Moreover, the improvement in the first-crack and ultimate strength of the beams varied depending on the length and configuration of the fibers used.

3.3. Estimating Ultimate Strength

The ultimate strength of the beam under combined bending and torsion was reduced significantly compared with beams under bending only in Santhakumar et al. [21] and Martin [27]. Santhakumar et al. [21] suggested an interaction diagram between the ratio of the flexural strength of the beams under combined bending and torsion (Mu.c) and the flexural strength under bending only (Mu.b) (Mu.c/Mu.b) with respect to the ratio between torque and bending (T/M). This interaction diagram was limited to a T/M ratio rounded between 0.2 and 1. The percentage reduction in the ultimate strength of the concrete beams was found to be 43.2%. Depending on the T/M ratio in the present study (1), the value of Mu.c/Mu.b = 0.57.
Martin’s research [22] presented three theoretical general interaction equations that show the analytical relationship between the ultimate moments of a concrete member under torsion and bending, considering two modes of failure. The first mode, known as Mode 1, occurs when the compression region is at the top of the cross-section, and the compressive strength of the concrete fails under the combined effect of direct and shear stresses caused by torsion. Tensile cracks also appear at the bottom of the member due to the action of the bending moment, and the steel at the bottom of the cross-section is in the tension zone. An alternative criterion for failure in Mode 1 is the yielding of the longitudinal steel under the combined action of direct stress due to the bending moment and shear stress due to the torsional moment.
The second mode of failure, Mode 2, happens when the compression zone is located at the side of the section, and the failure is due to the tensile strength of the concrete. The first crack appears on the side of the beam’s cross-section, and the load capacity does not increase beyond the first-crack value but slowly decreases as more cracks develop. In estimating the ultimate strength, it appears reasonable to consider the beam as a plain concrete beam. However, based on the crack pattern observed in the tested beams in this study, Mode 1 is more suitable.
As can be noticed in Table 14, Santhakumar et al.’s [21] test result indicates better performance than Martin [22]; however, there are still some deviations between the experimental and predicted moments. Hence, Santhakumar et al.’s [21] and Martin’s [22] techniques to estimate the ultimate moment strength might not be valid due to underestimating and over-conservative results as these techniques are performed for NSC beams. In order to include the fiber length’s impact on the moment capacity of FRC beams, the Expand Increase factor of the FRC beams with different fiber types and lengths, which was proposed by Hassan et al. [17], is suggested, as shown below.
E . I . F = ( 1 + L f 60 ) 1 3
M u   m o d i f i e d = M u . c 1   ( 1 + L f 60 ) 1 3
where Mu modified is the moment capacity of the FRC beam, Mu.c1 is the moment capacity calculated by Santhakumar et al. [21], and L f is the length of the fiber in (mm).
Observing the error for each technique used in the study to estimate the ultimate moment strength, variability was noted among the methods. The error was 0–13%, 29–40%, and 0–12% for Santhakumar et al. [21] and Martin [22] and the modified technique of Hassan et al. [17], respectively. These values for samples are small in comparison with the values reported. Since the fiber plays a significant role in improving concrete’s flexural and torsional performance, we recommend further experimental and theoretical research to evaluate the designed FRC beams under the compound effect of bending and torsion.

4. Summary and Conclusions

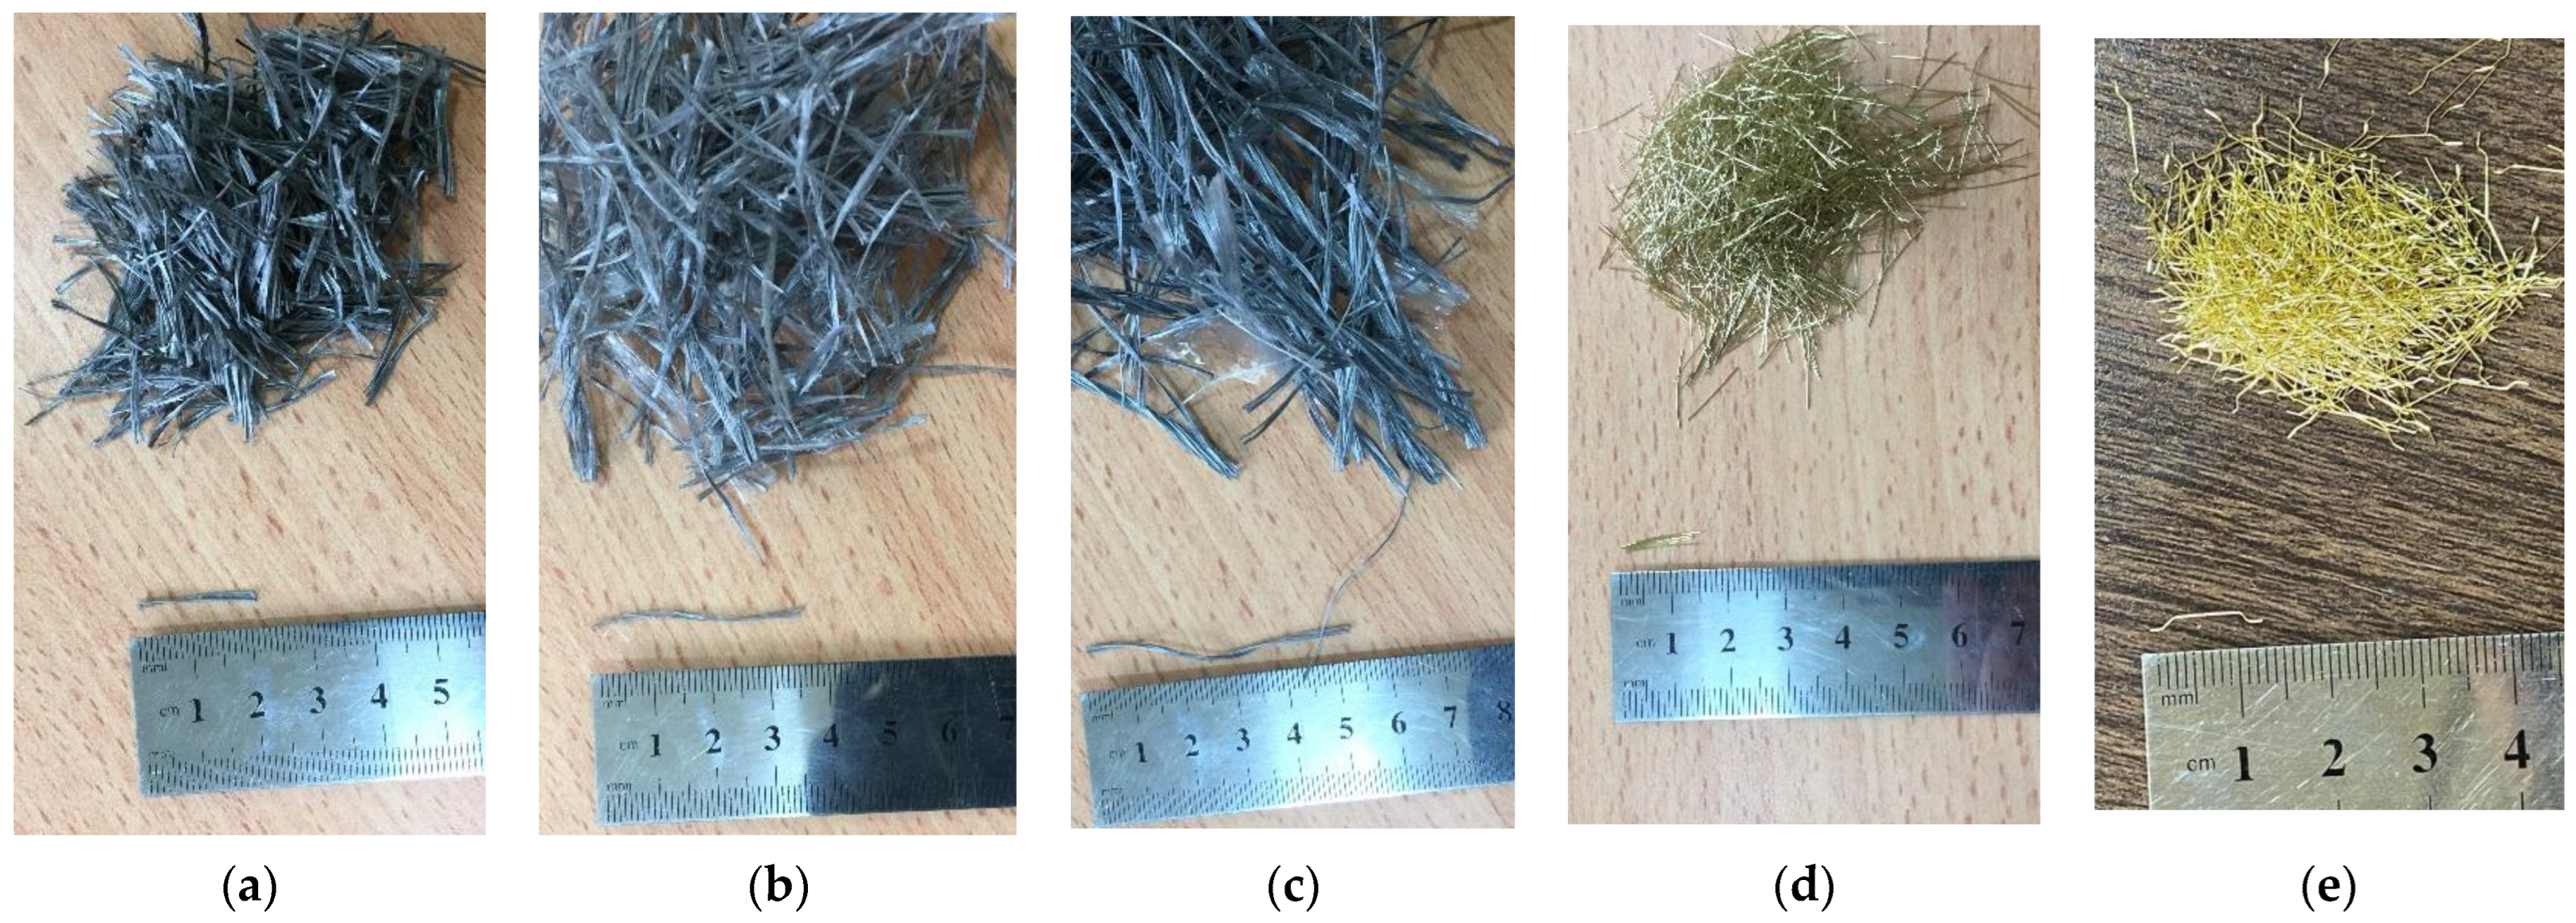
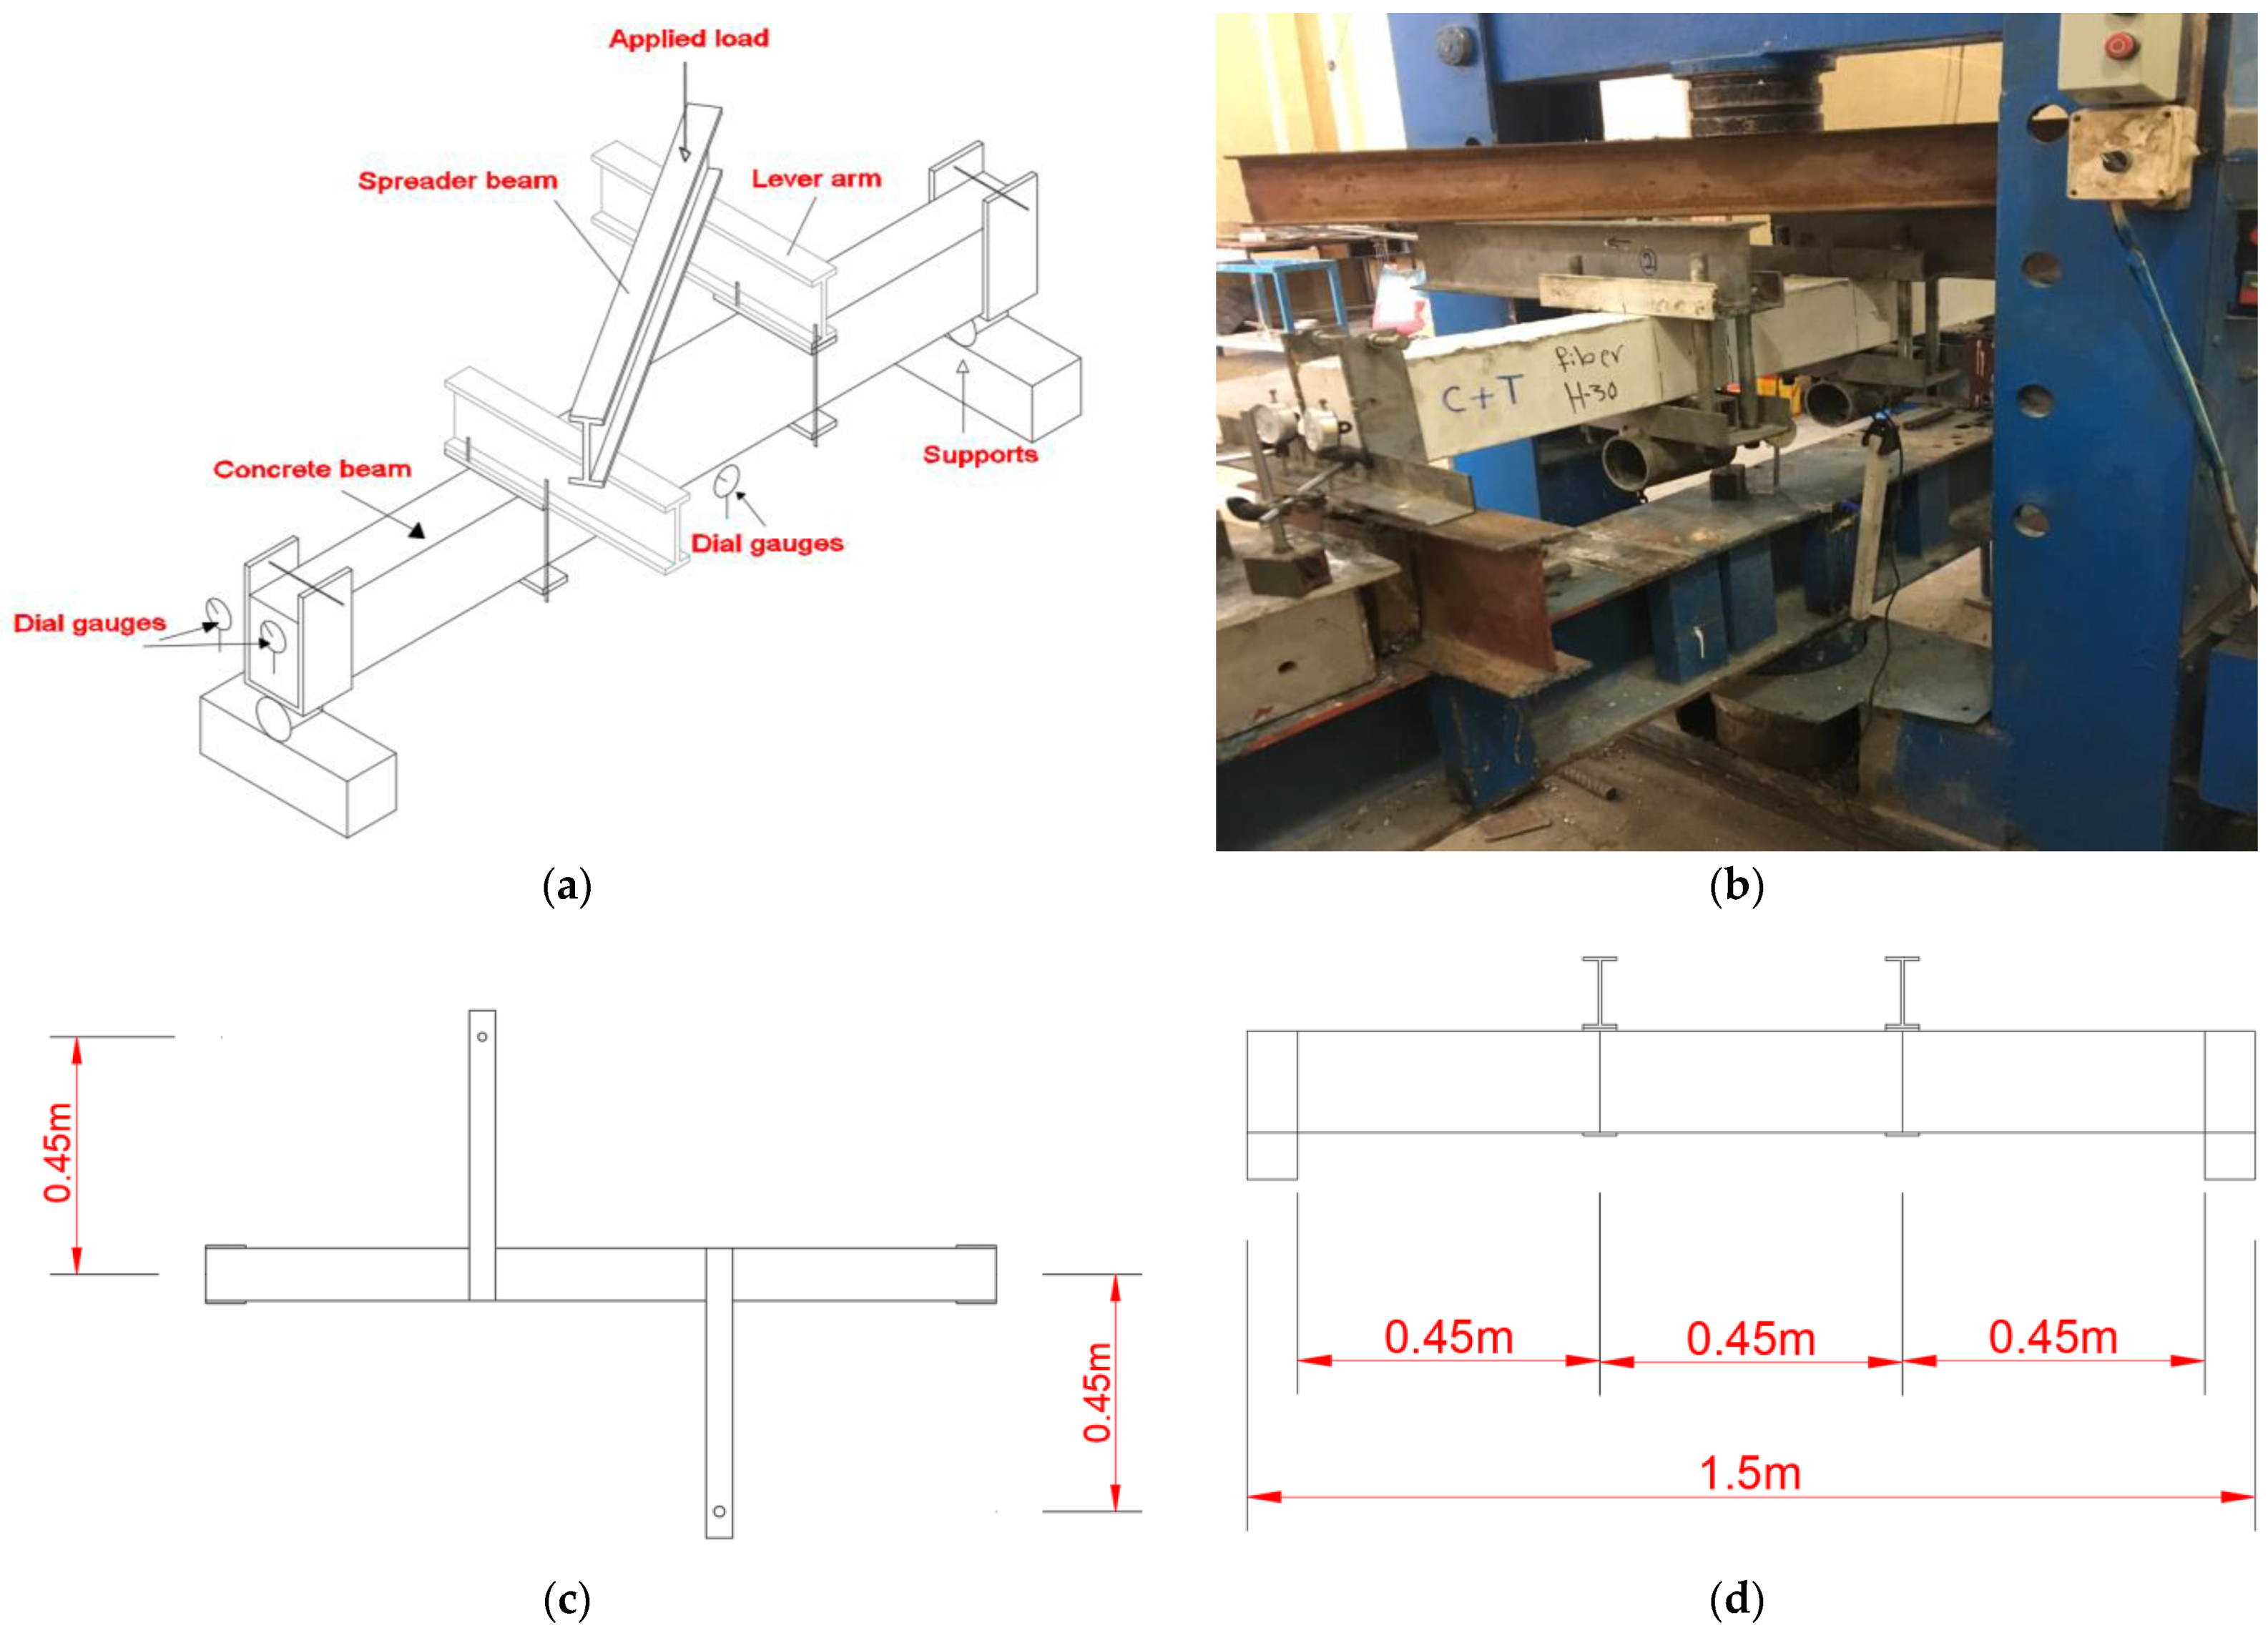
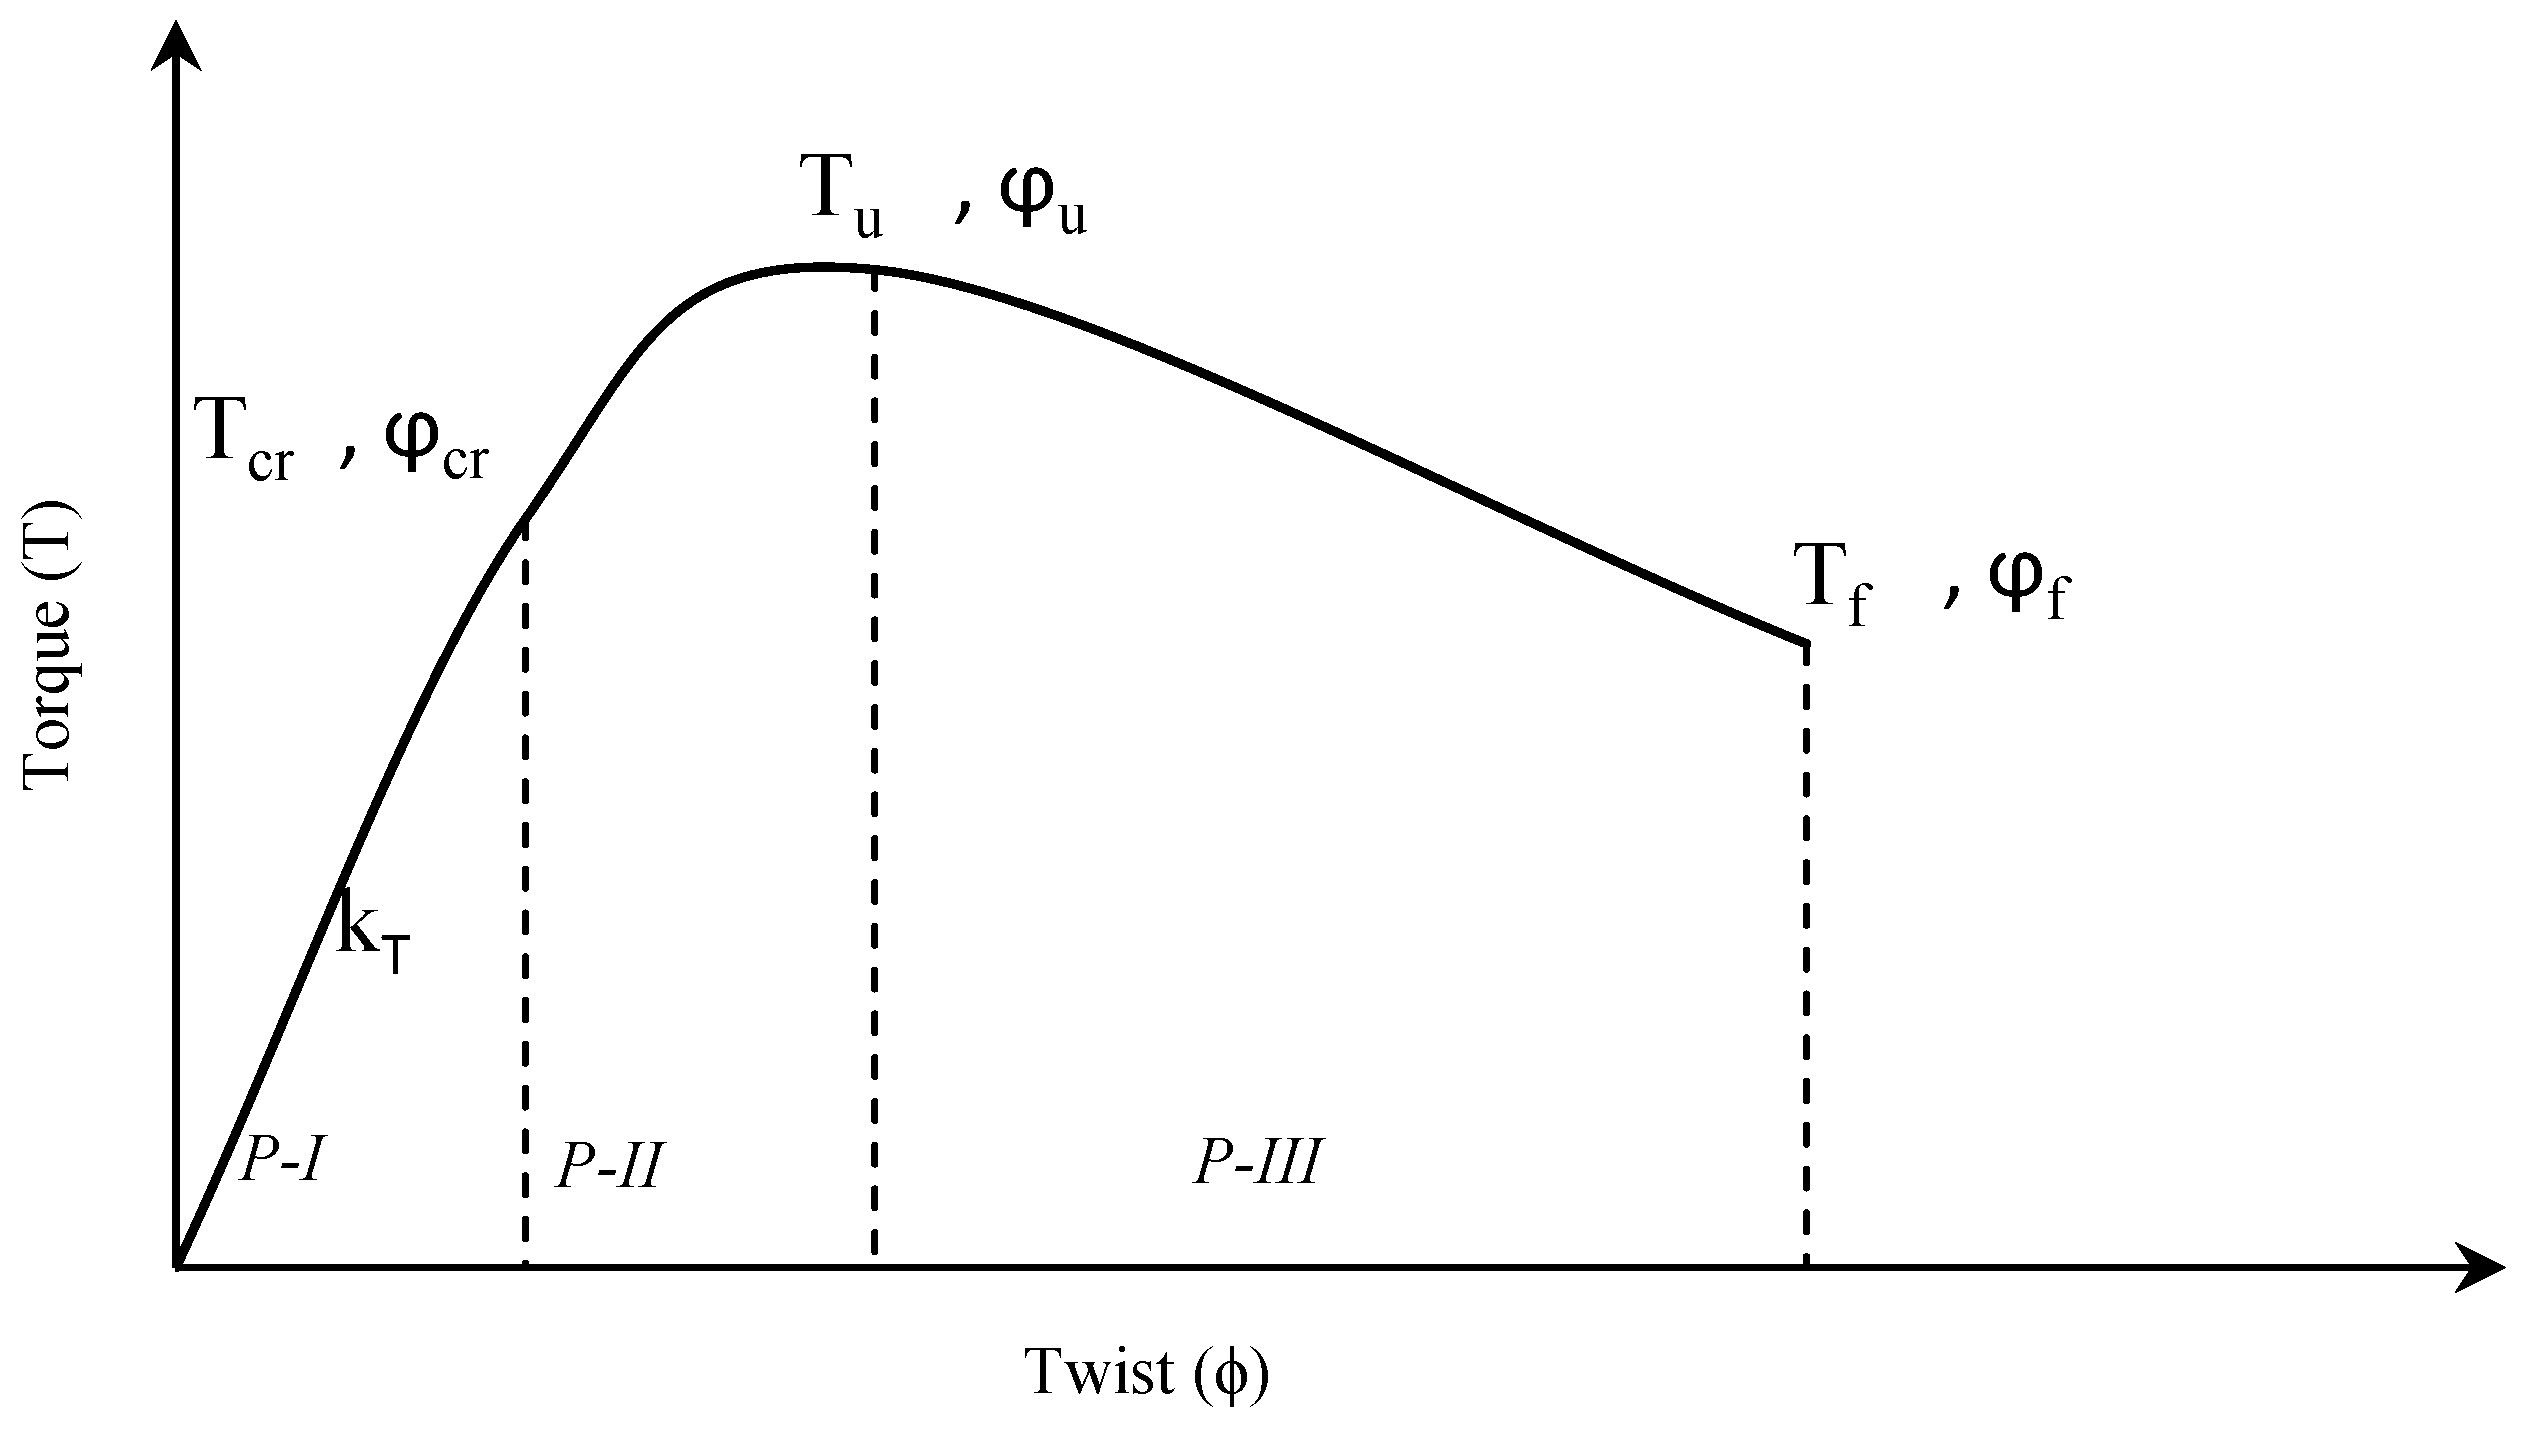
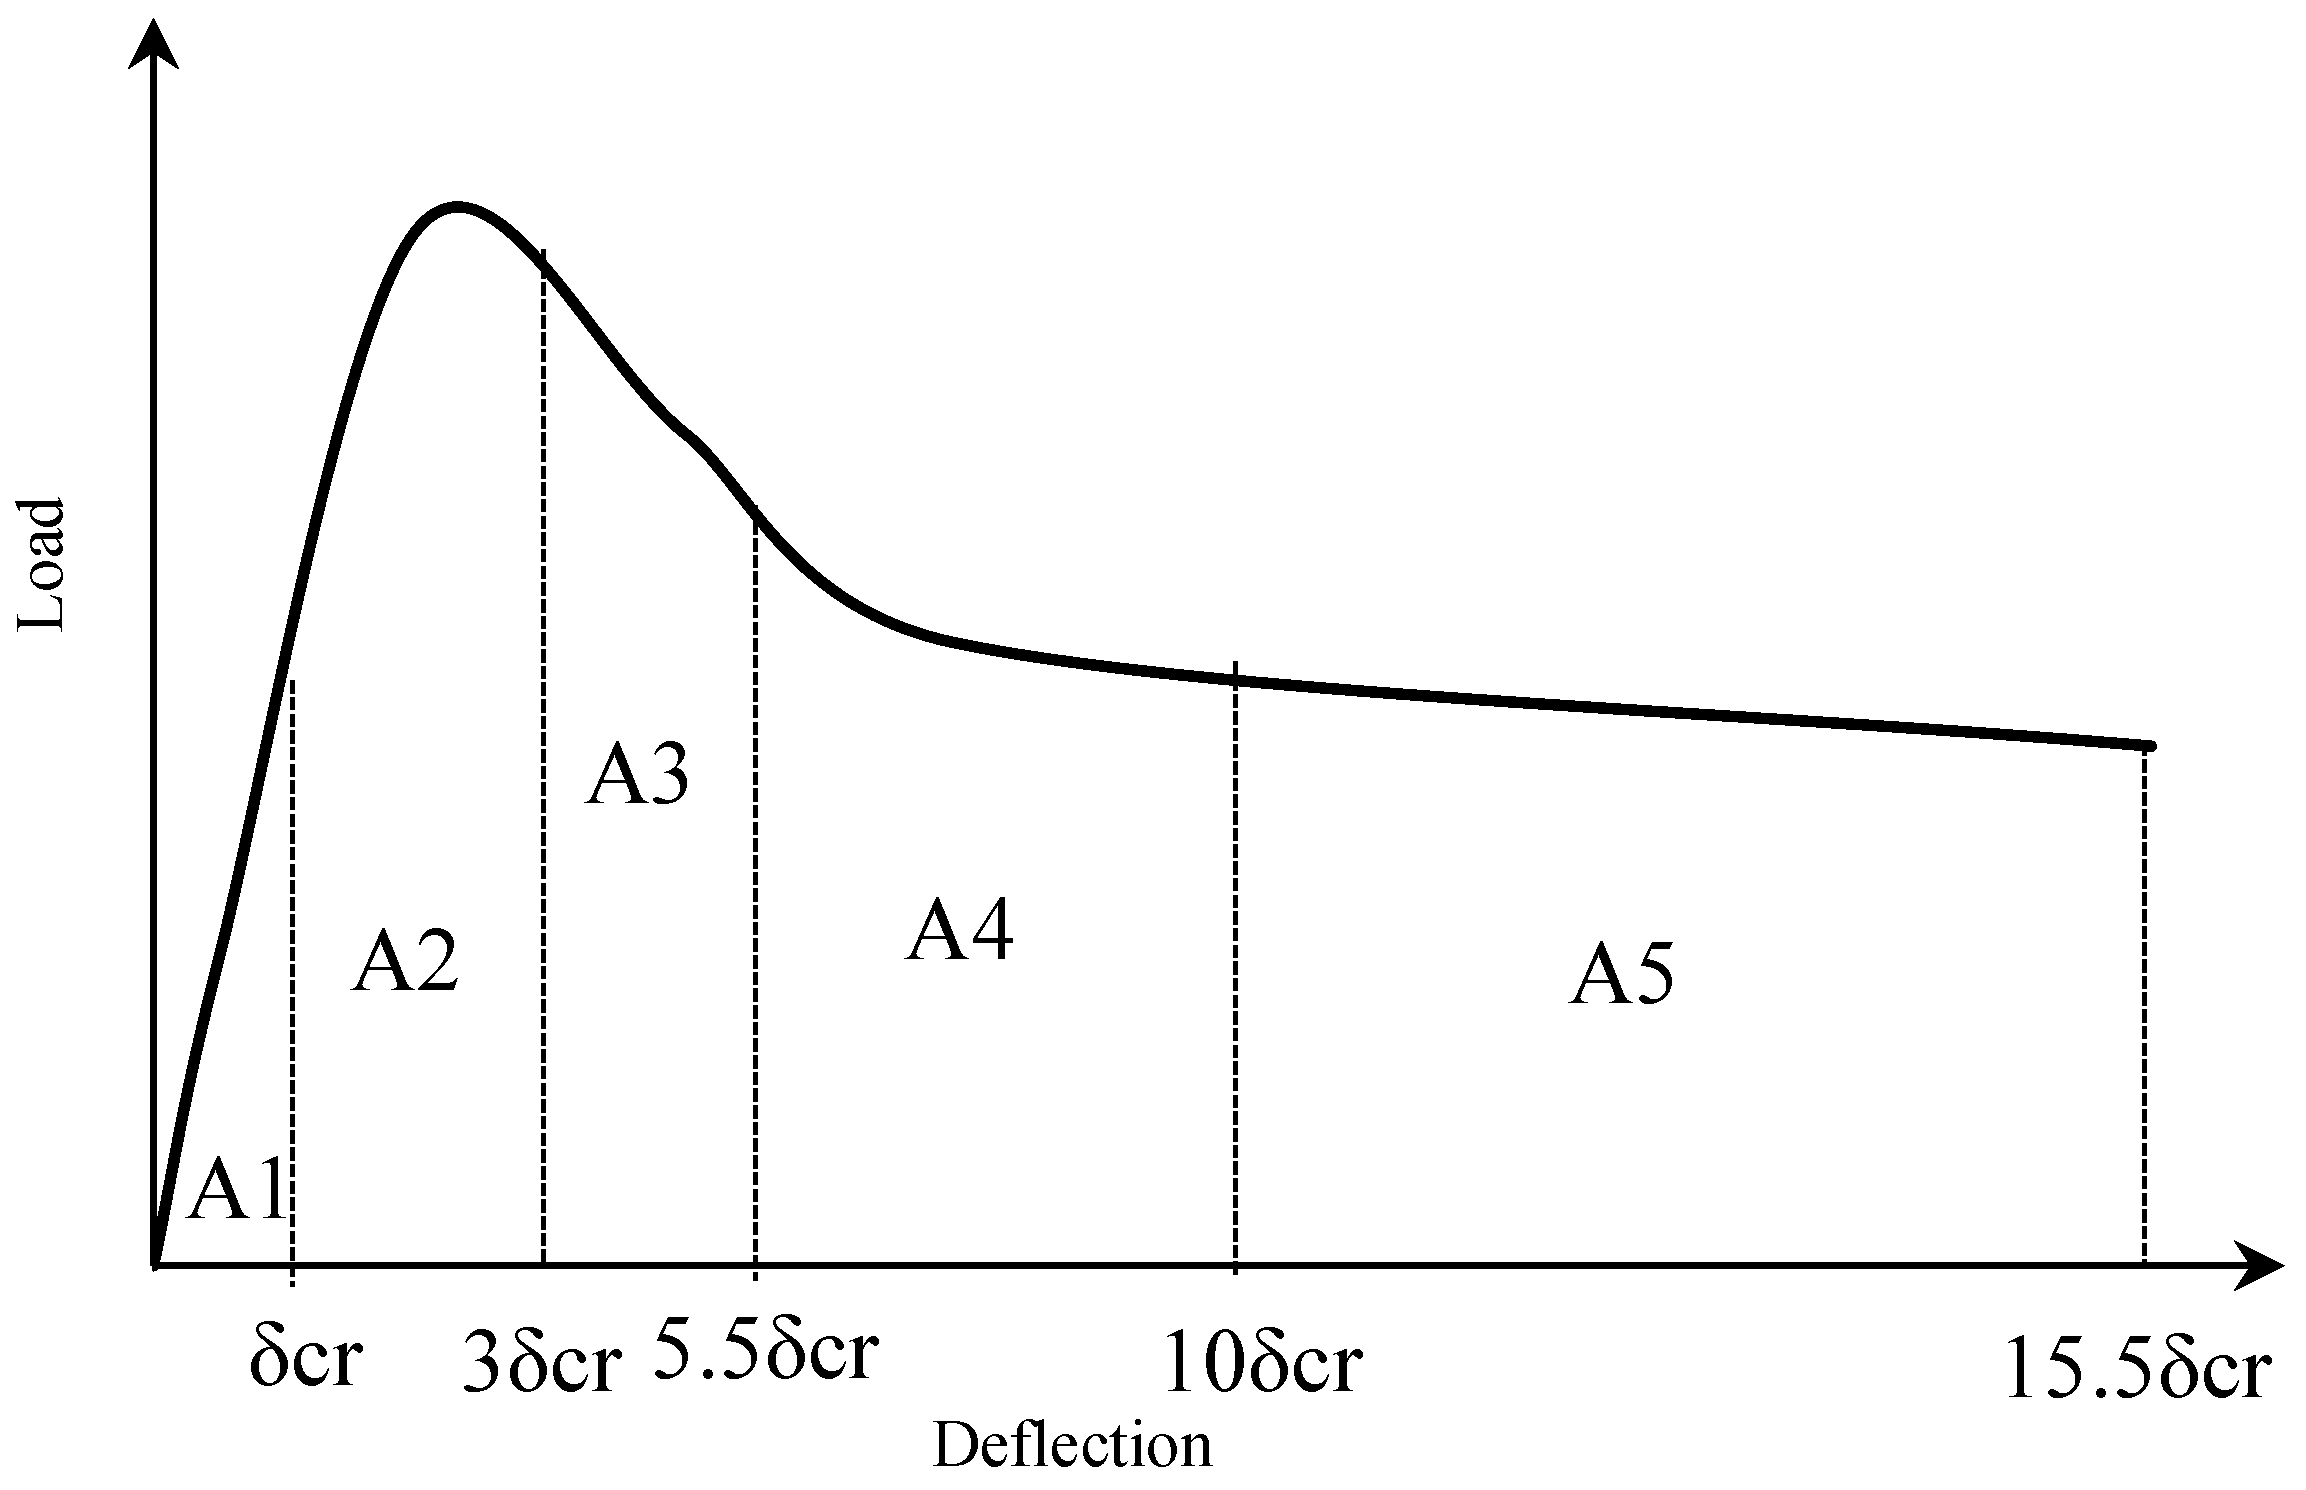
This study examined the effects of adding synthetic and steel fibers to concrete mixes, which can enhance the material’s flexural, tensile, and compressive strengths. The research aimed to assess the performance of FRC beams under both flexural and torsional loads, considering various types and lengths of fibers used. The compound flexural and torsional test was employed to measure the cracking, ultimate, and failure moments, along with corresponding twists and deflections, for the FRC beams. Based on the findings of the tested beams in this study, certain conclusions can be drawn:
  • Incorporating fibers into the concrete mixture leads to changes in its behavior, increasing the tensile and compressive strengths of the concrete. The extent of improvement in the concrete behavior resulting from adding fibers is directly related to the length of the fibers.
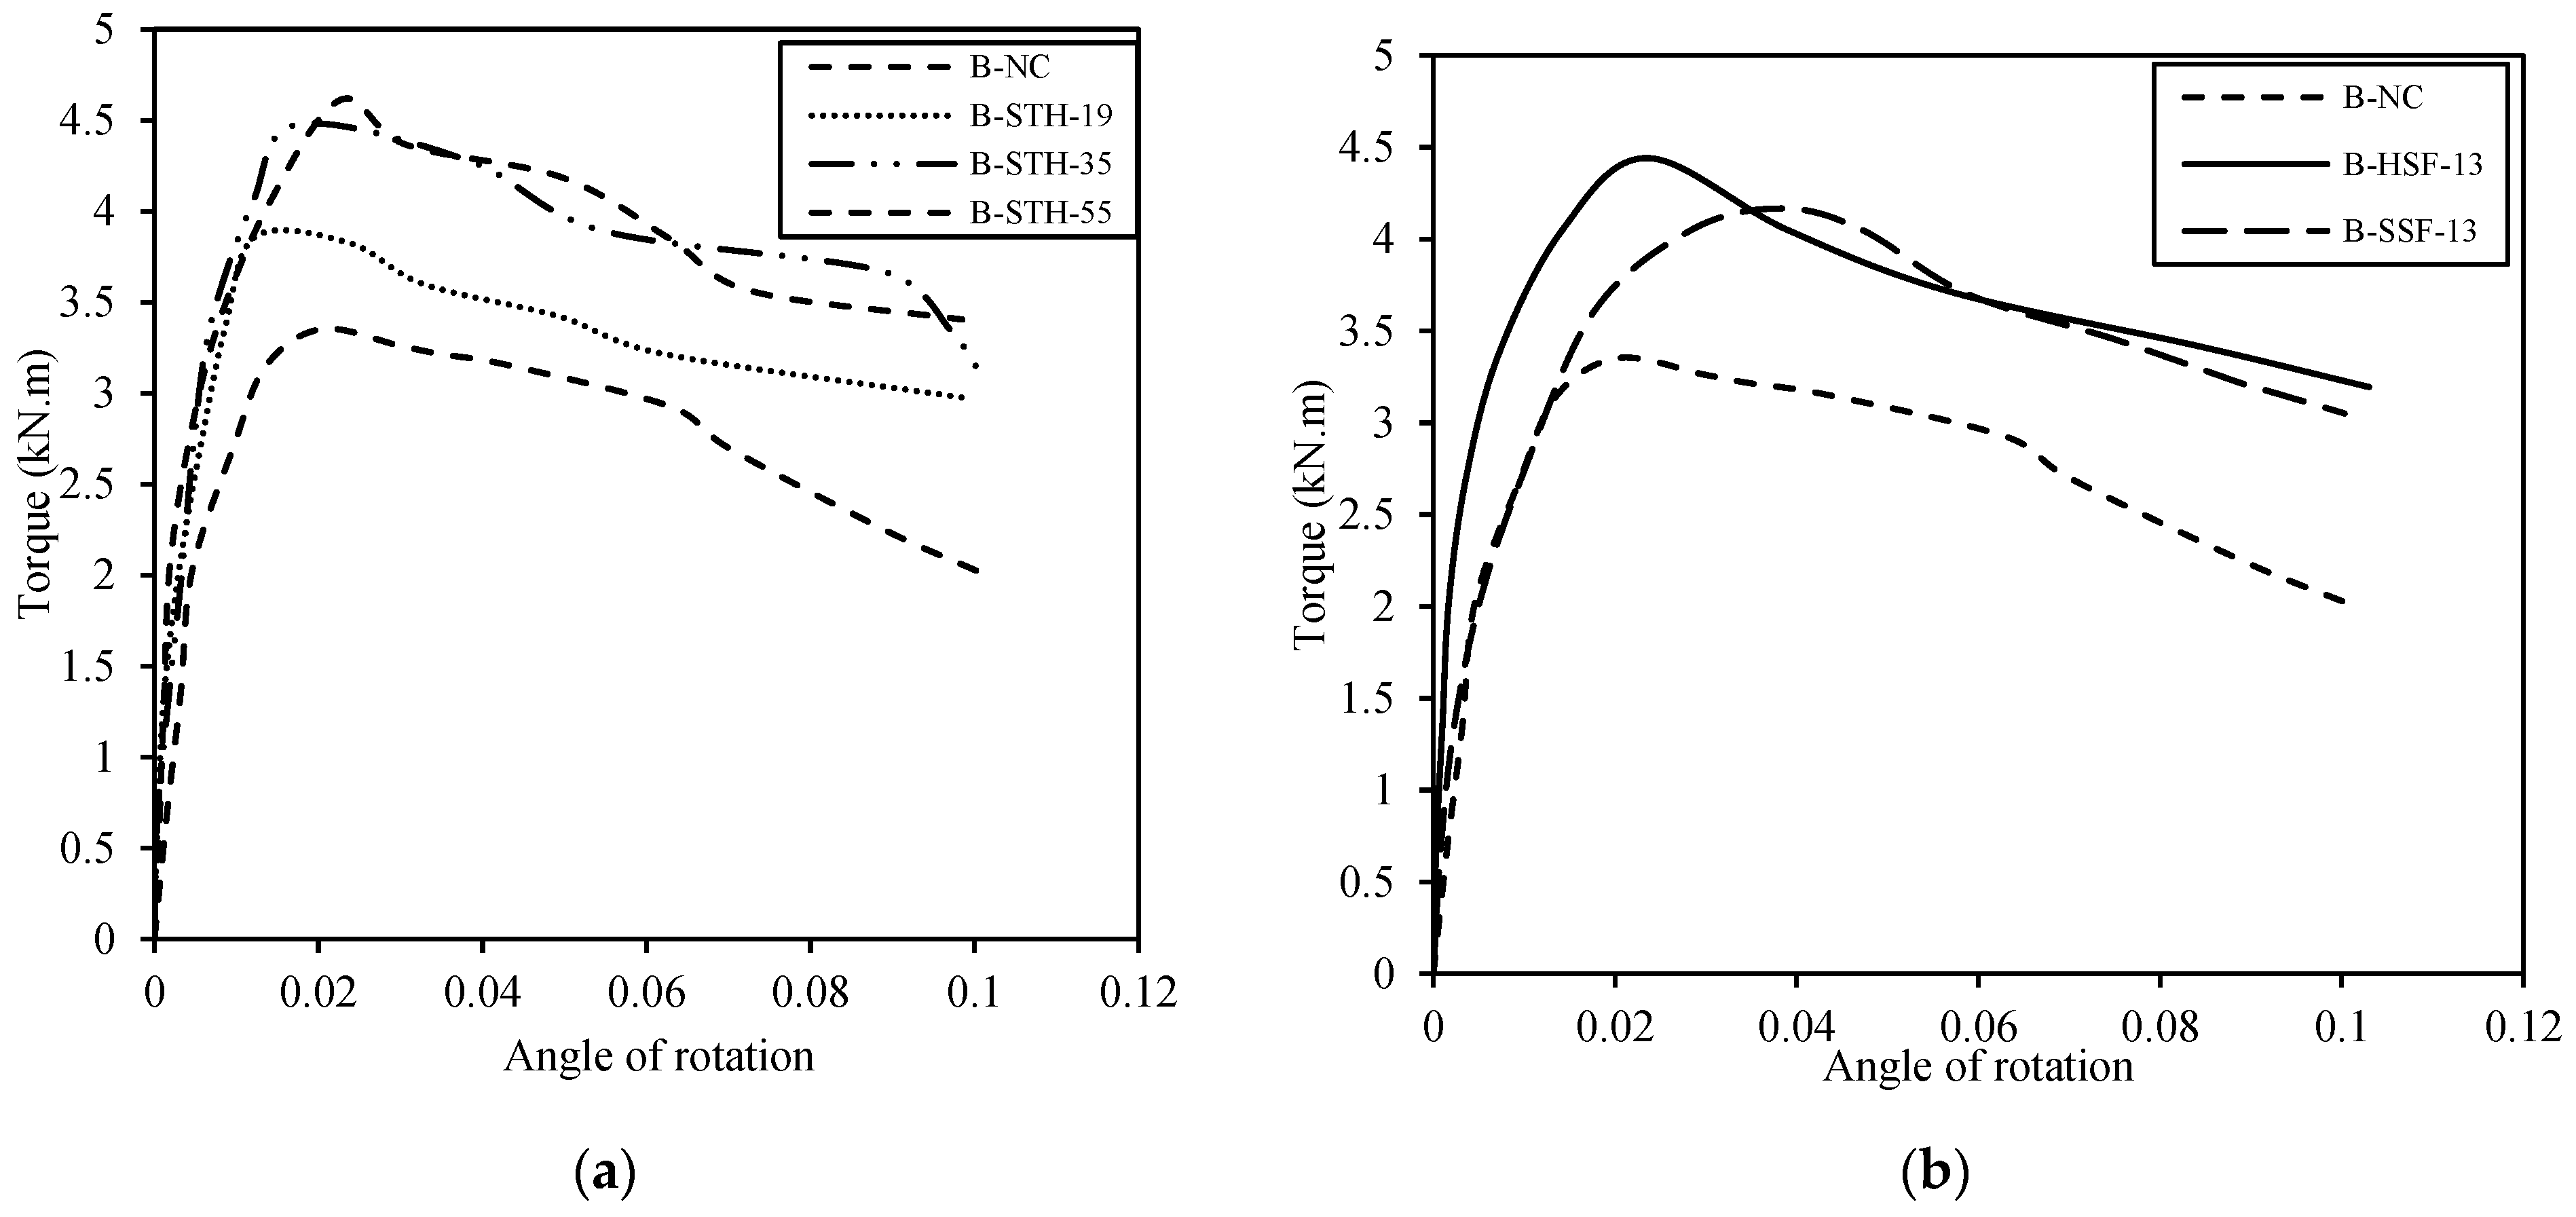
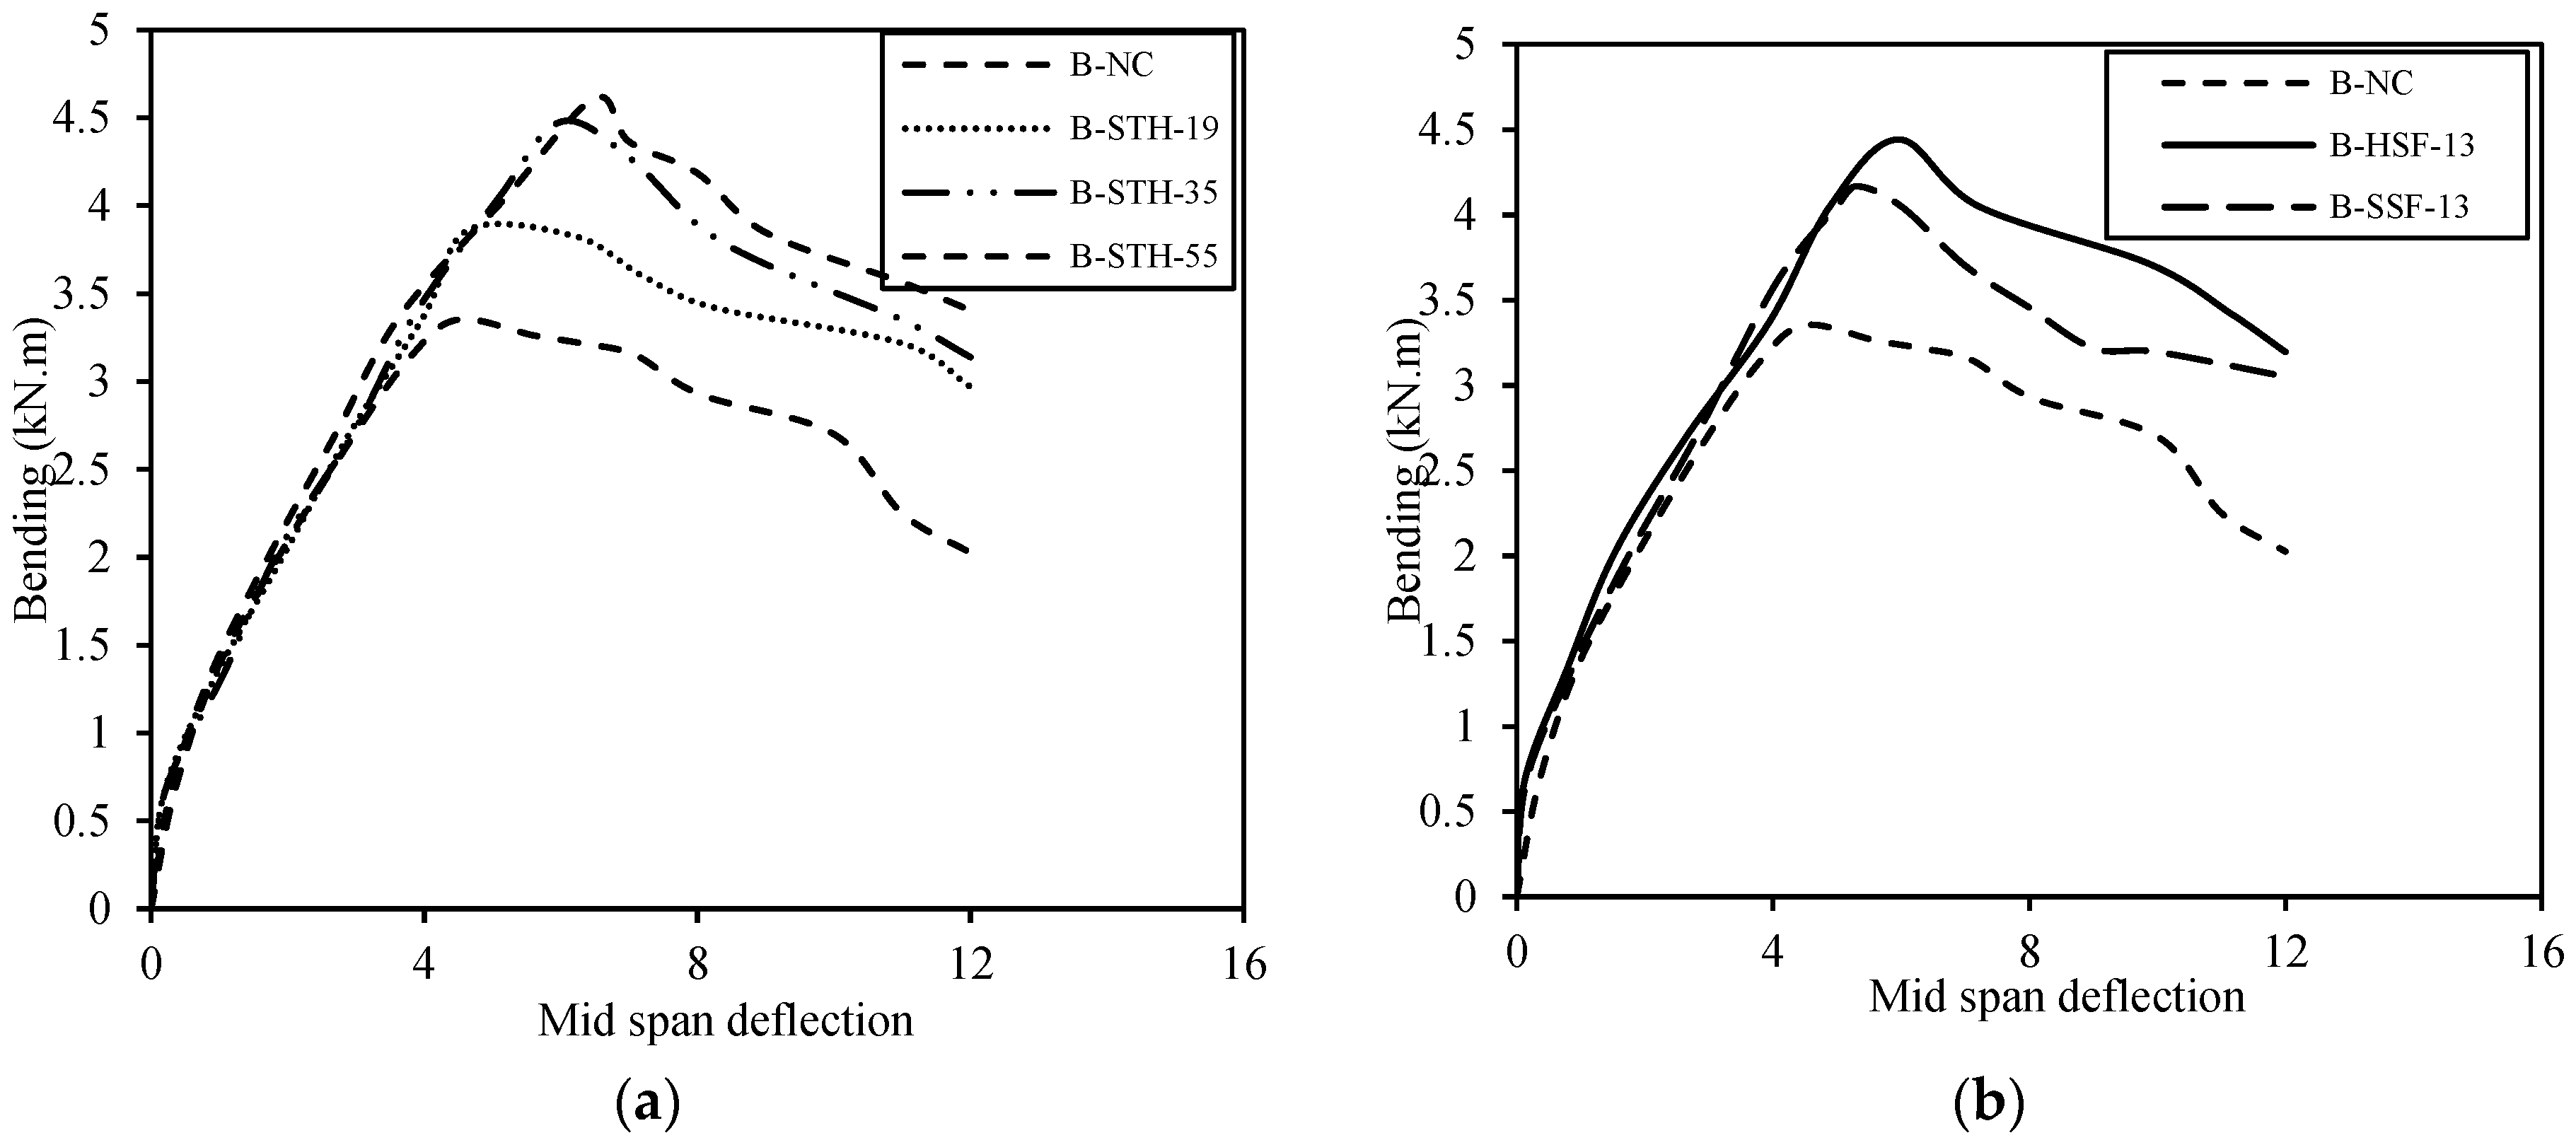
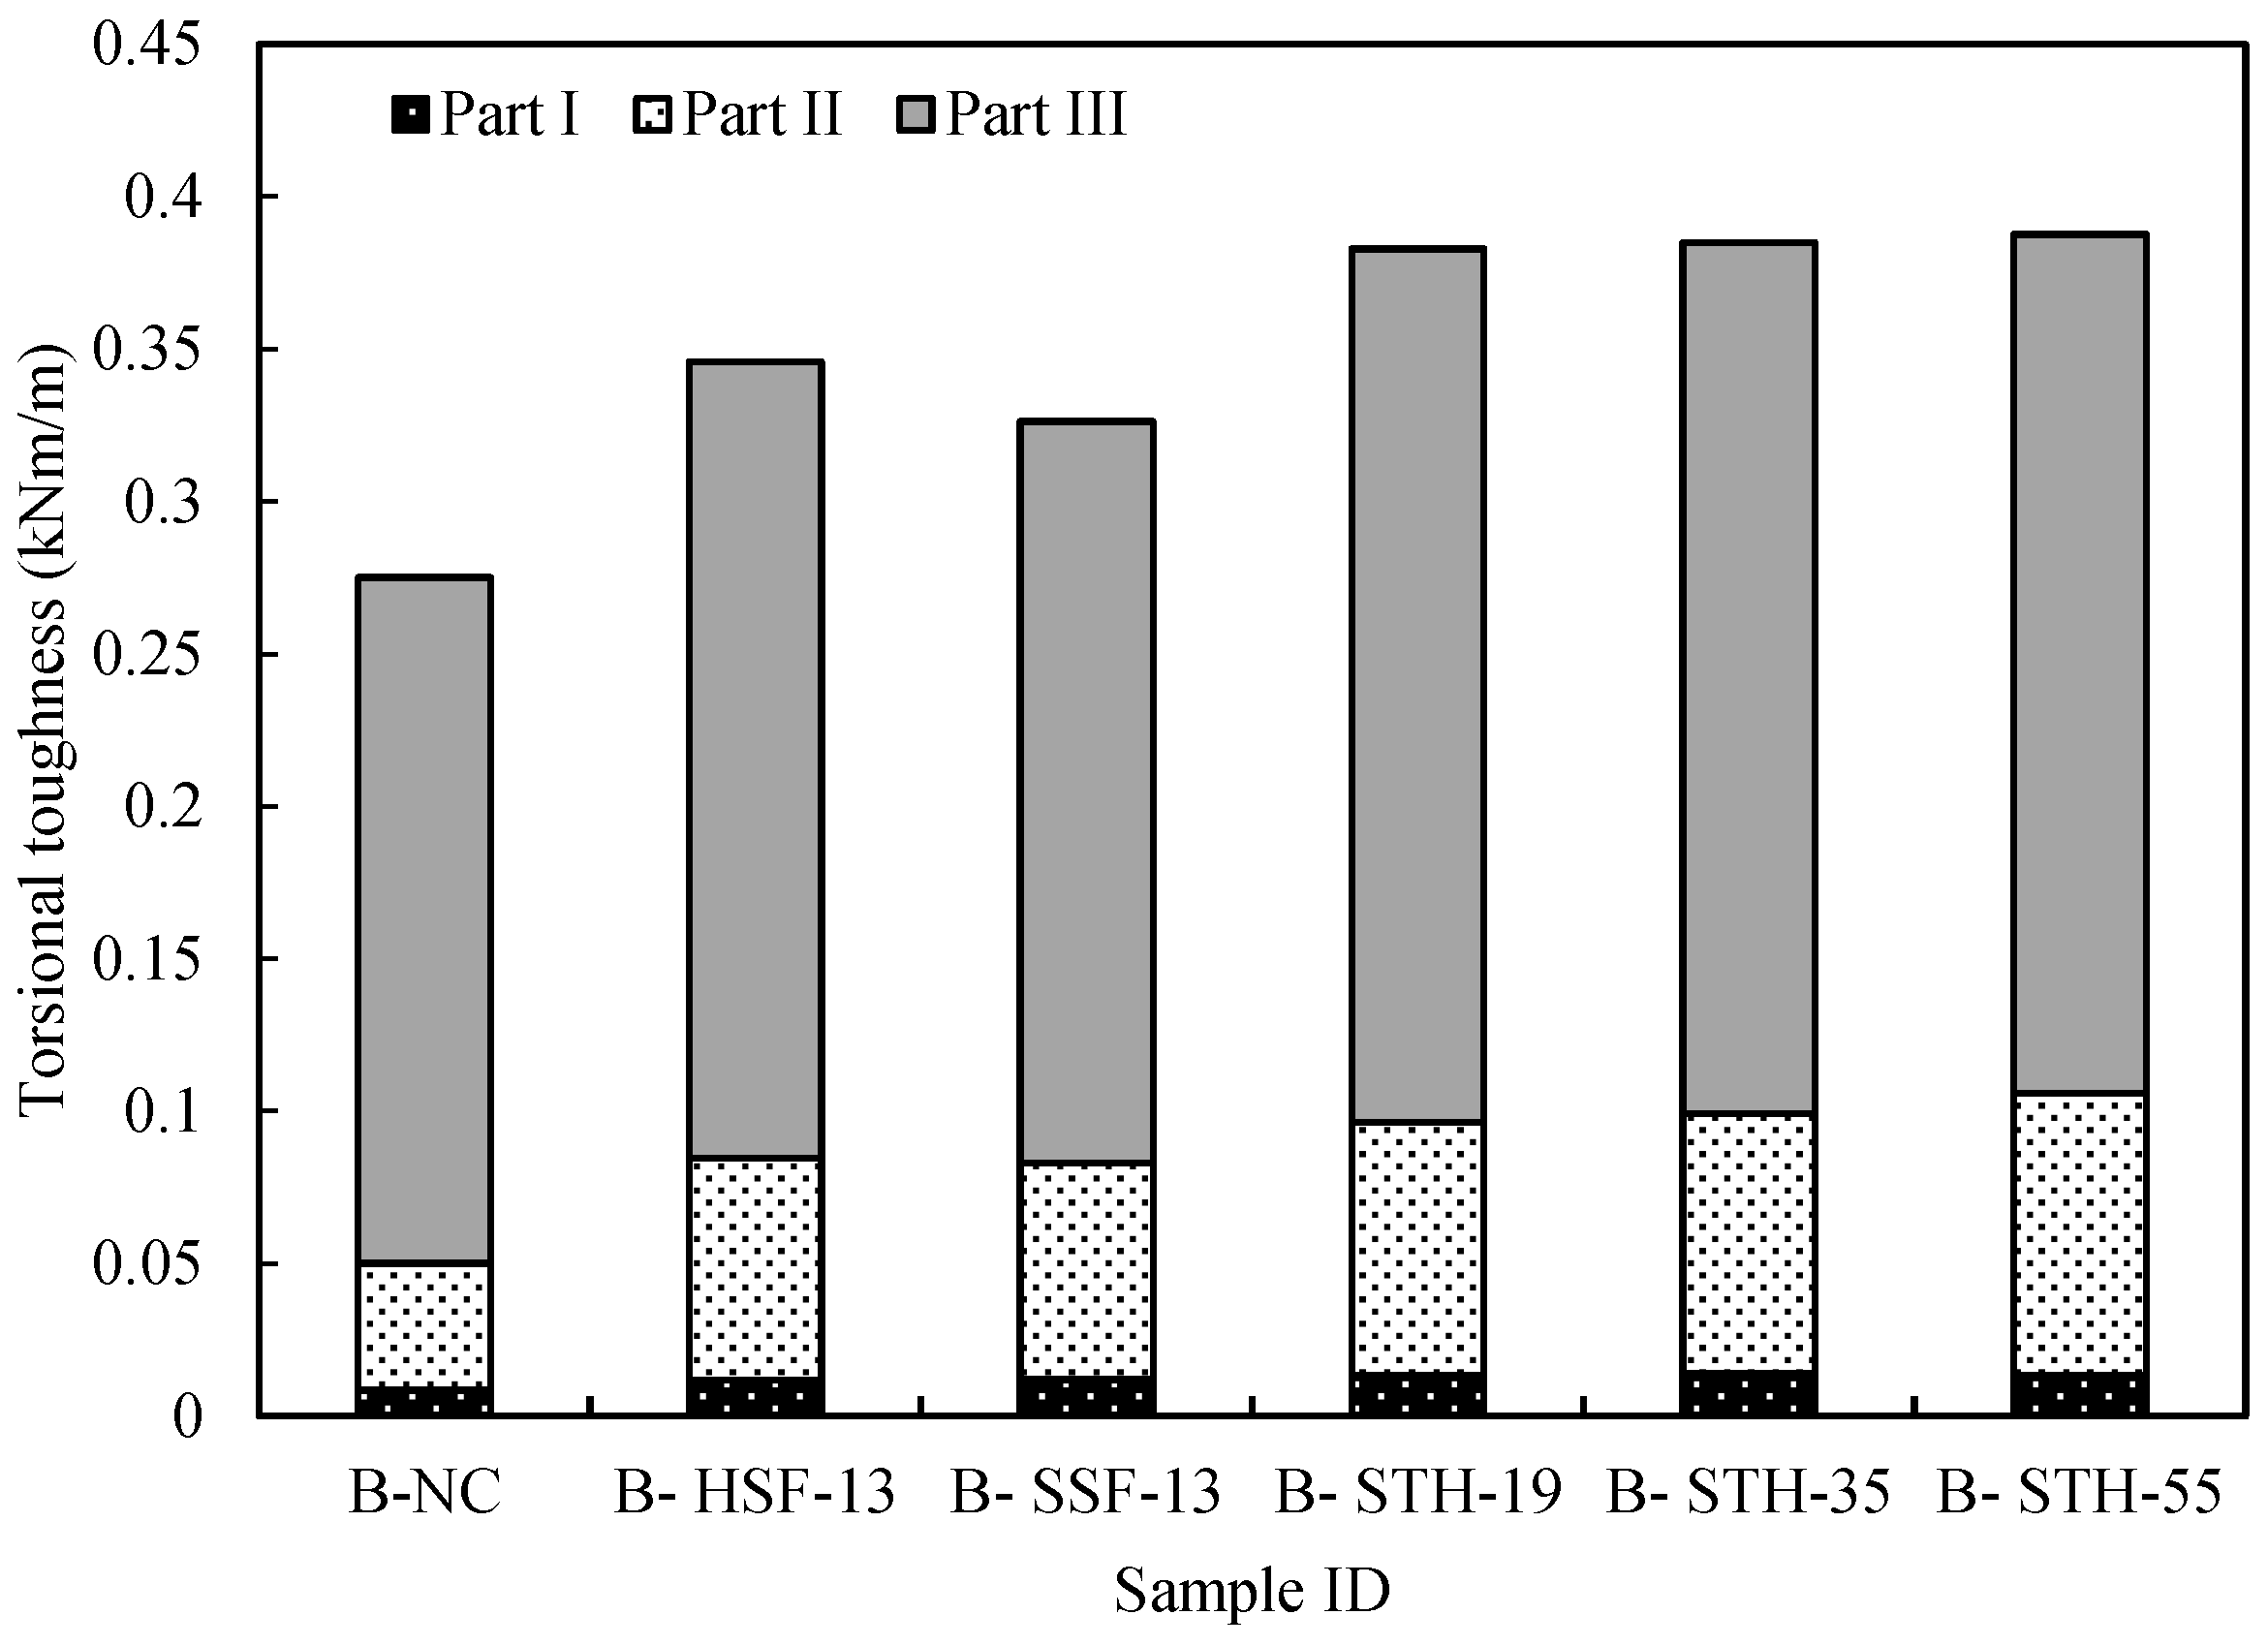
  • The addition of synthetic and steel fibers in the concrete mix enhances the torsional and flexural toughness of the beams, and the degree of enhancement is proportional to the fiber length. The B-STH-55 beam had a maximum increase of 106% in the total flexural toughness at the ultimate load stage in I30 compared to the B-NC beam.
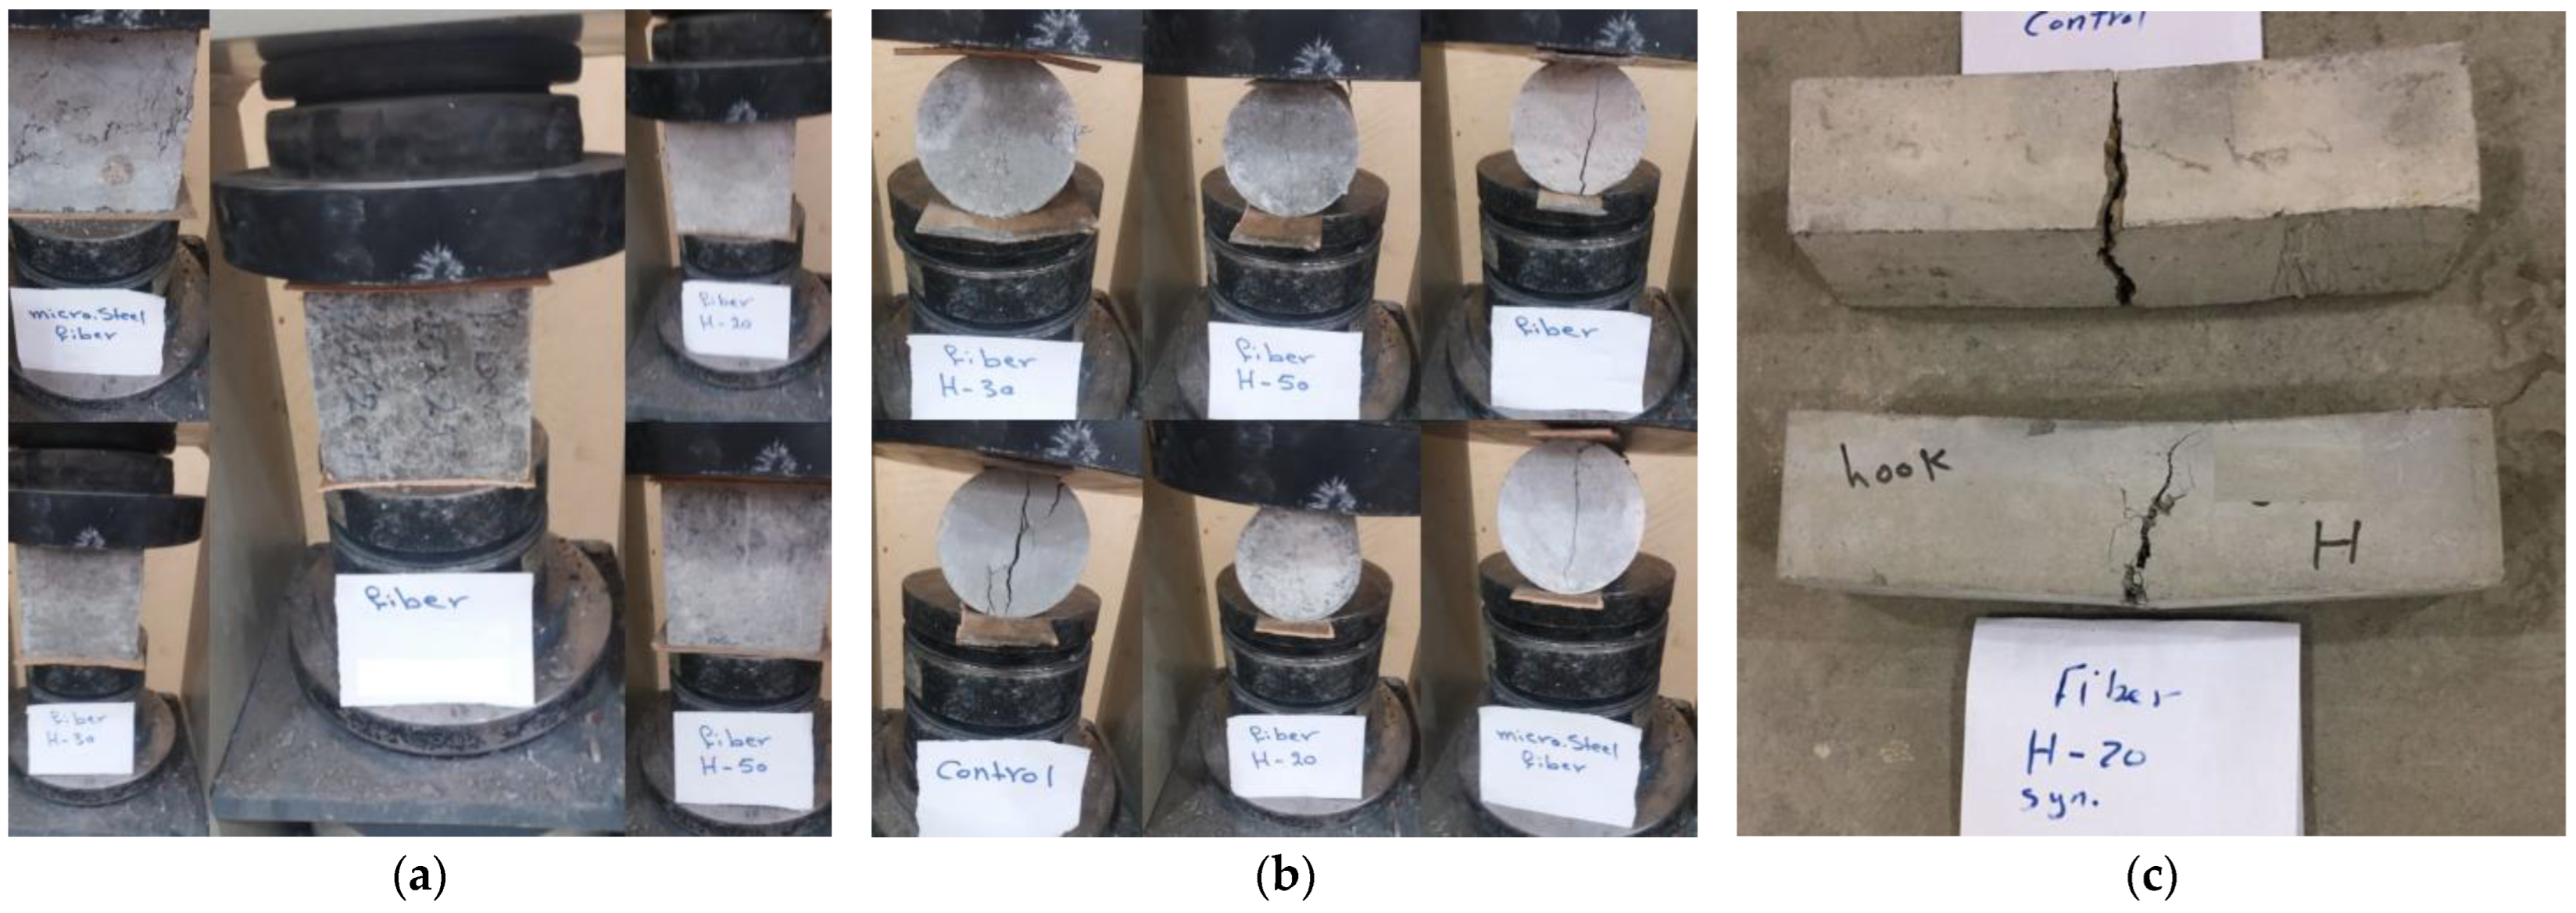
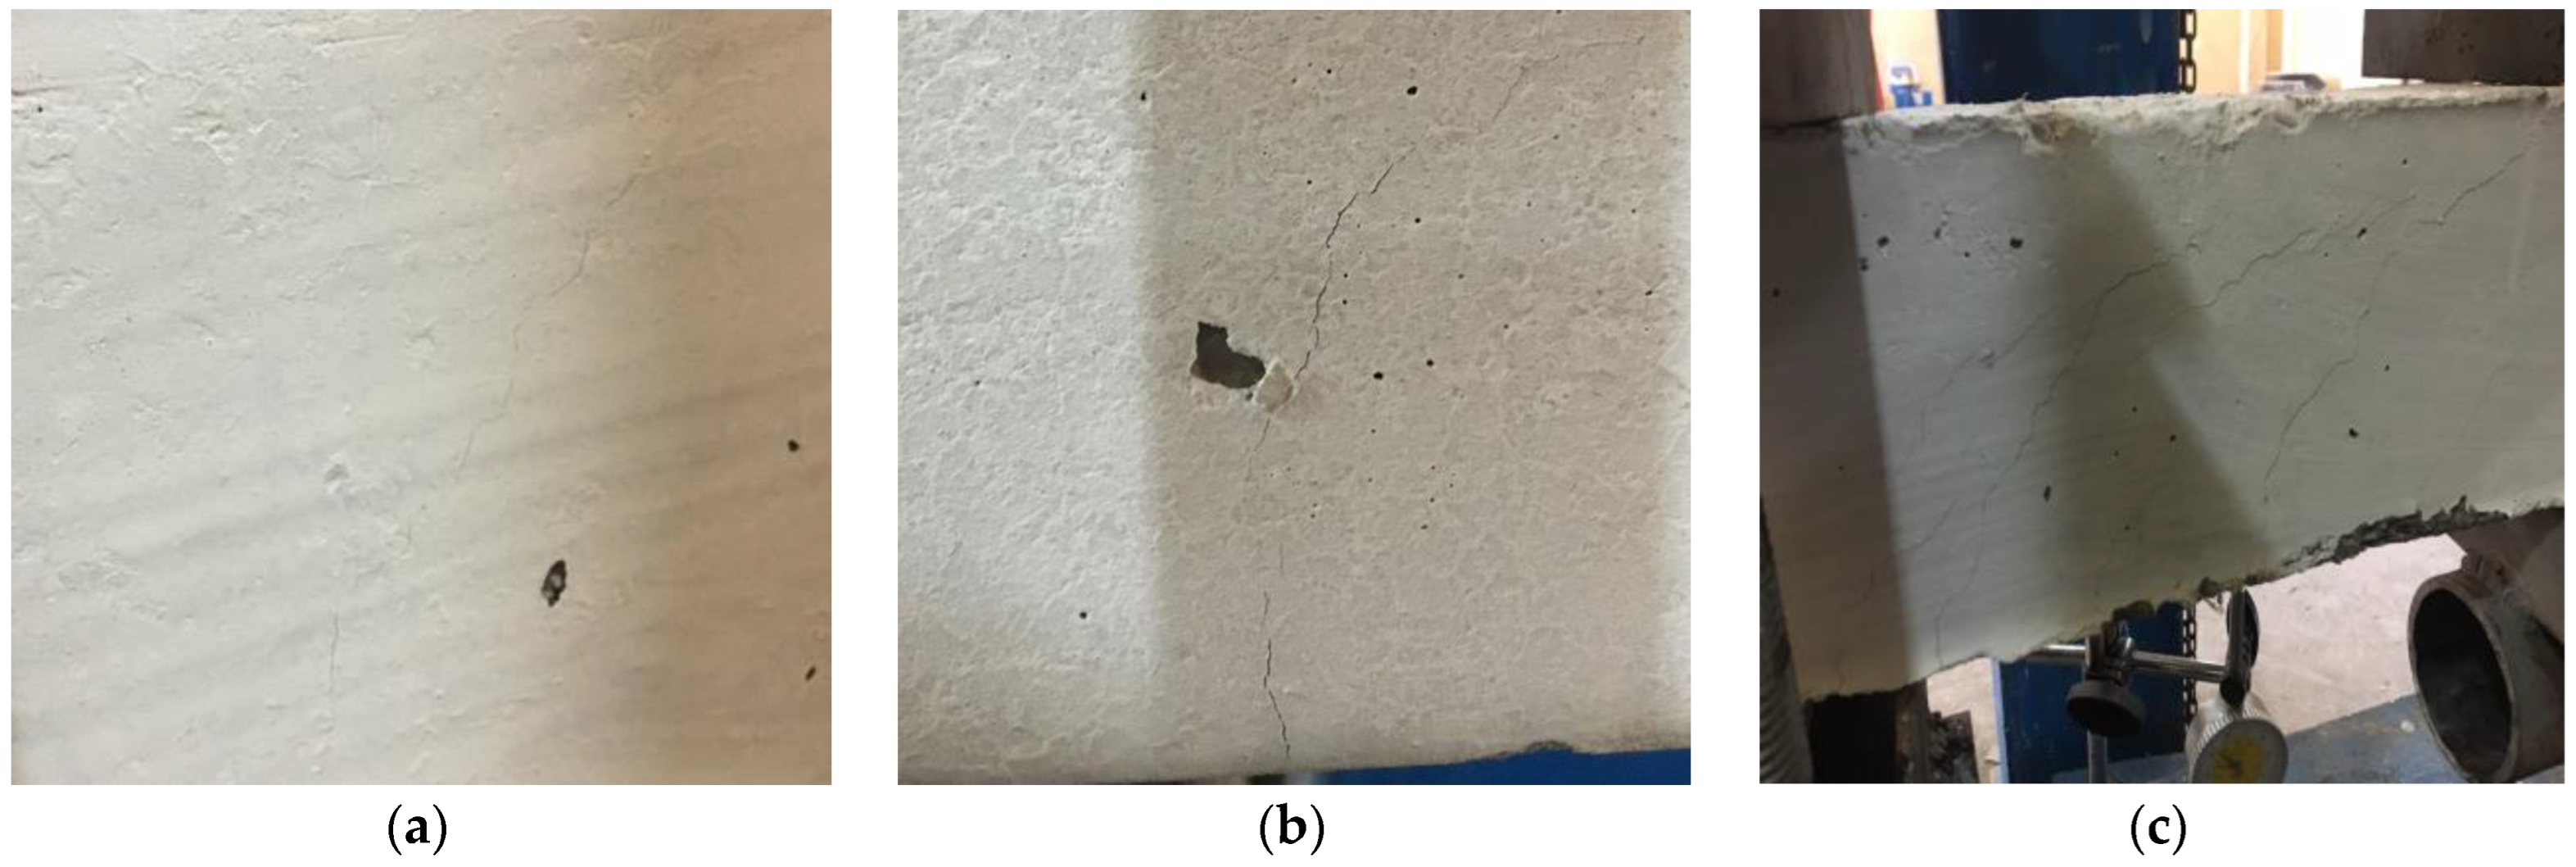
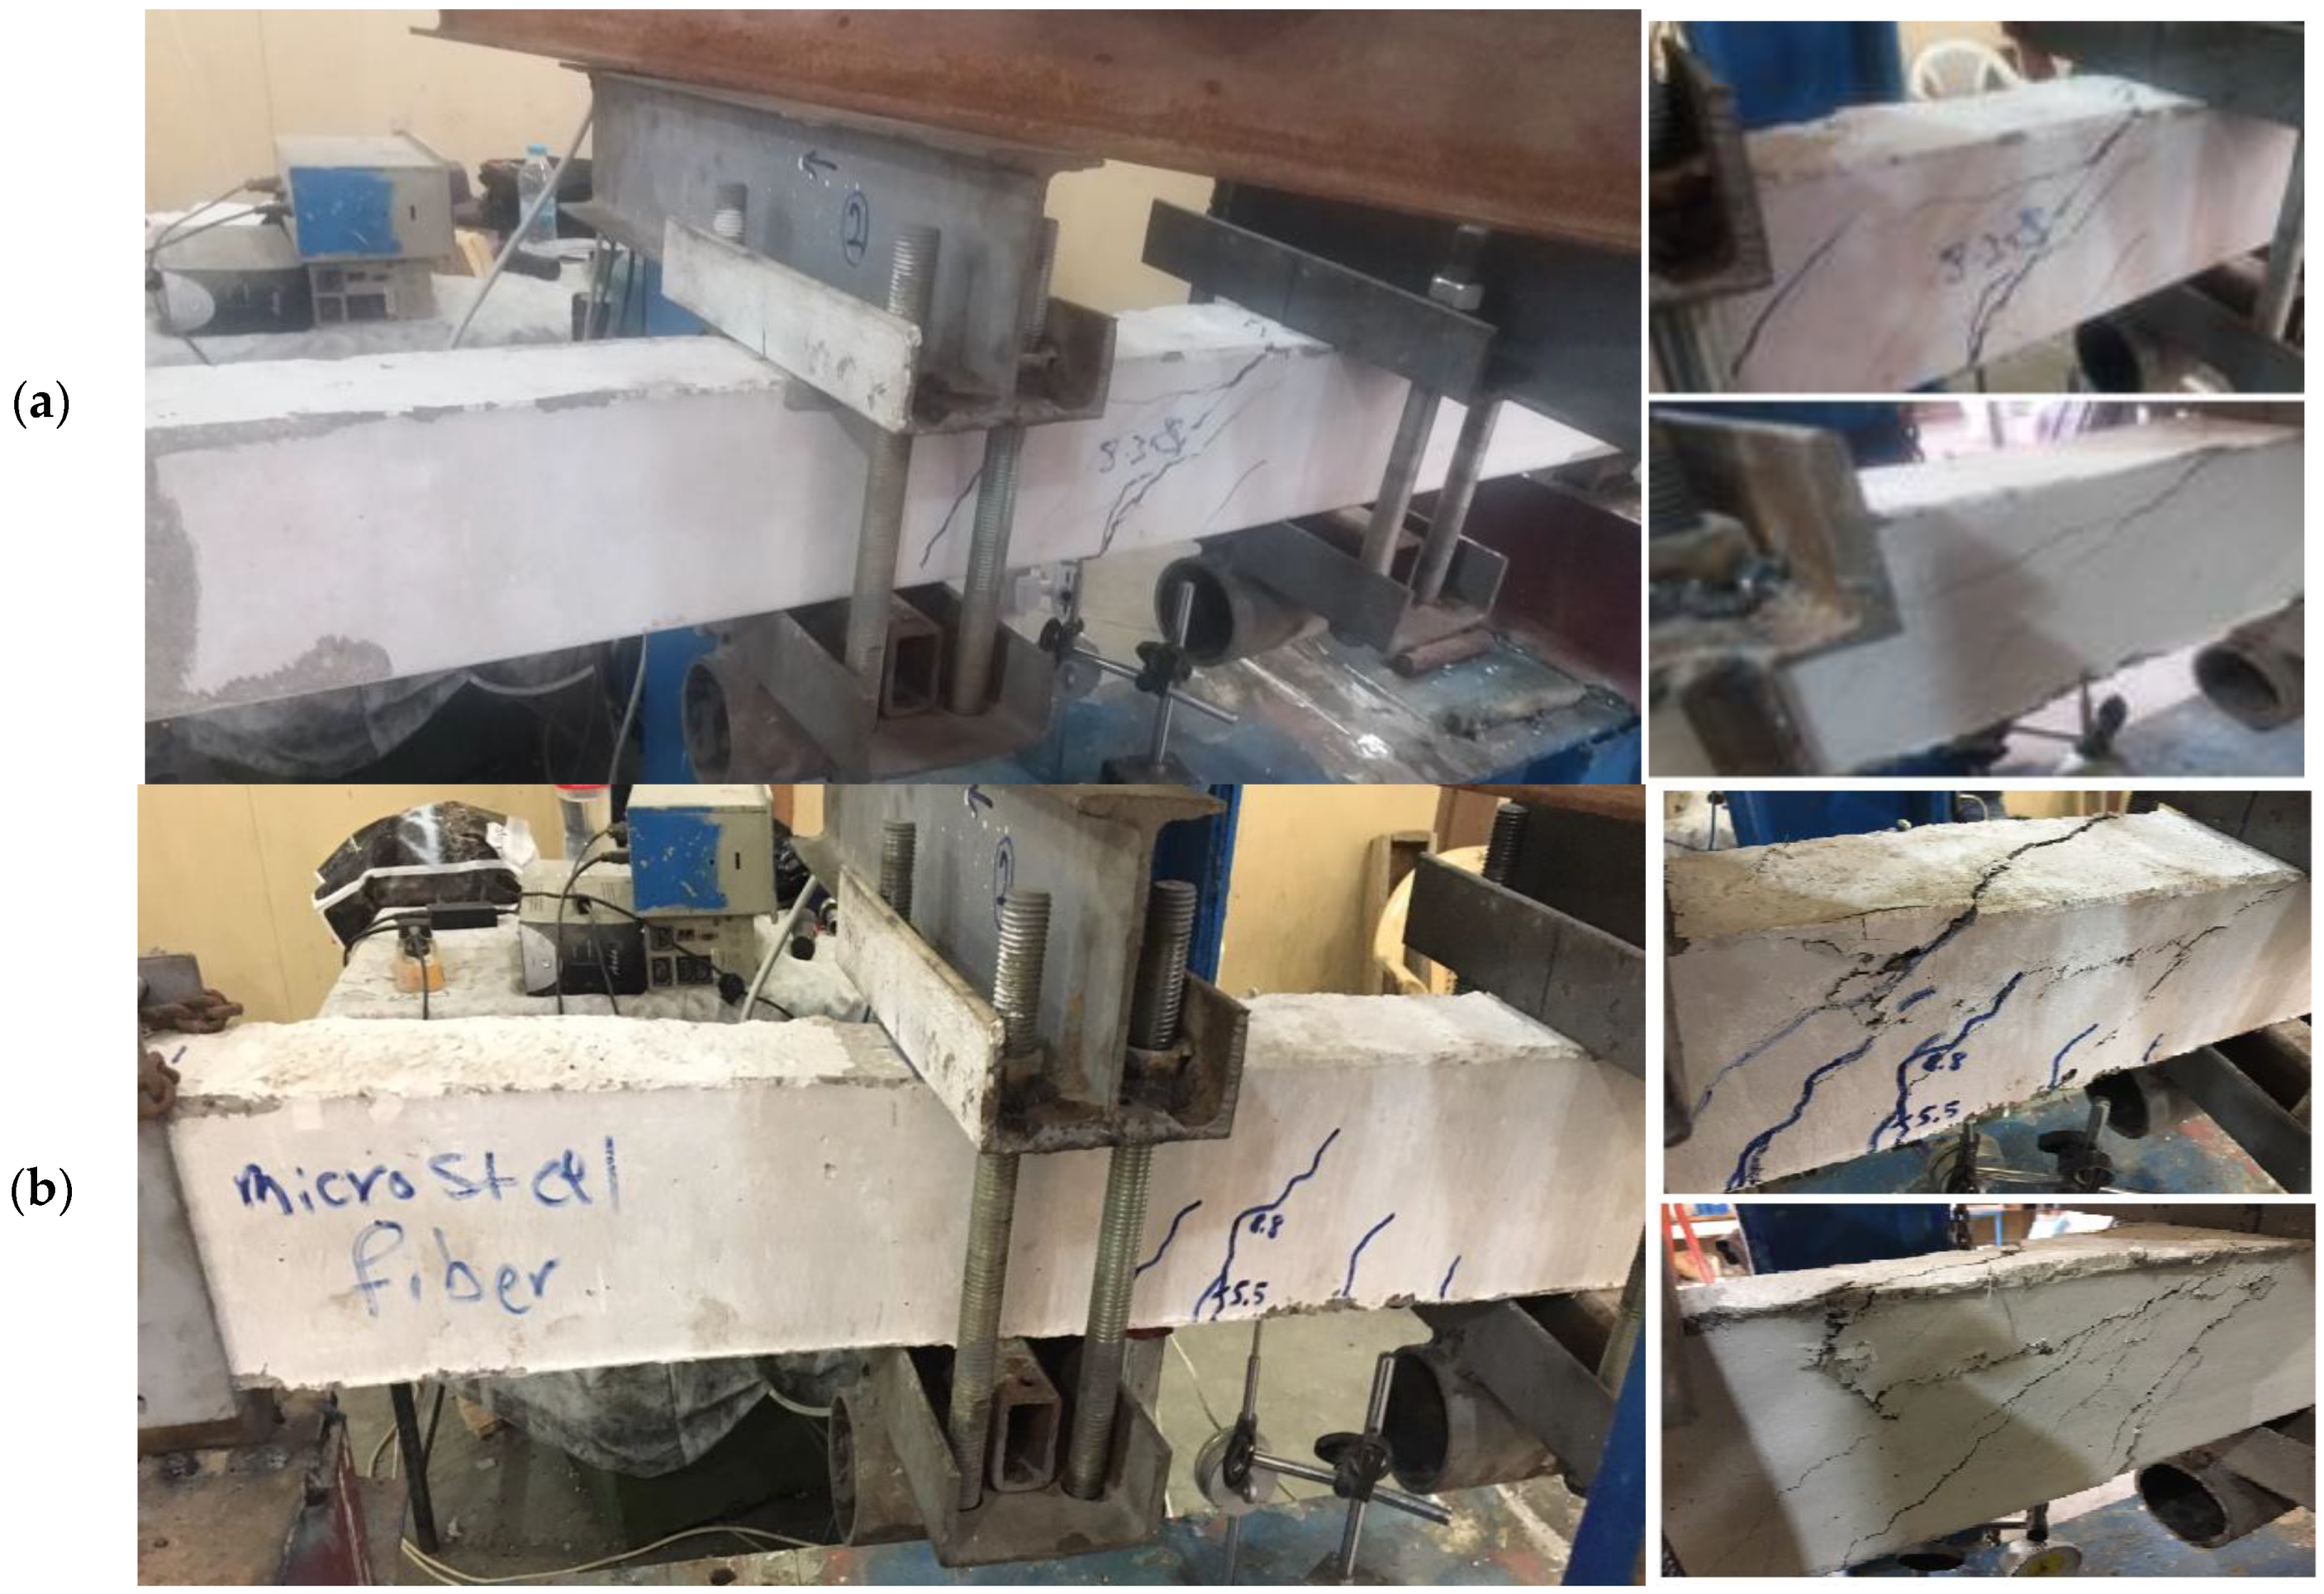
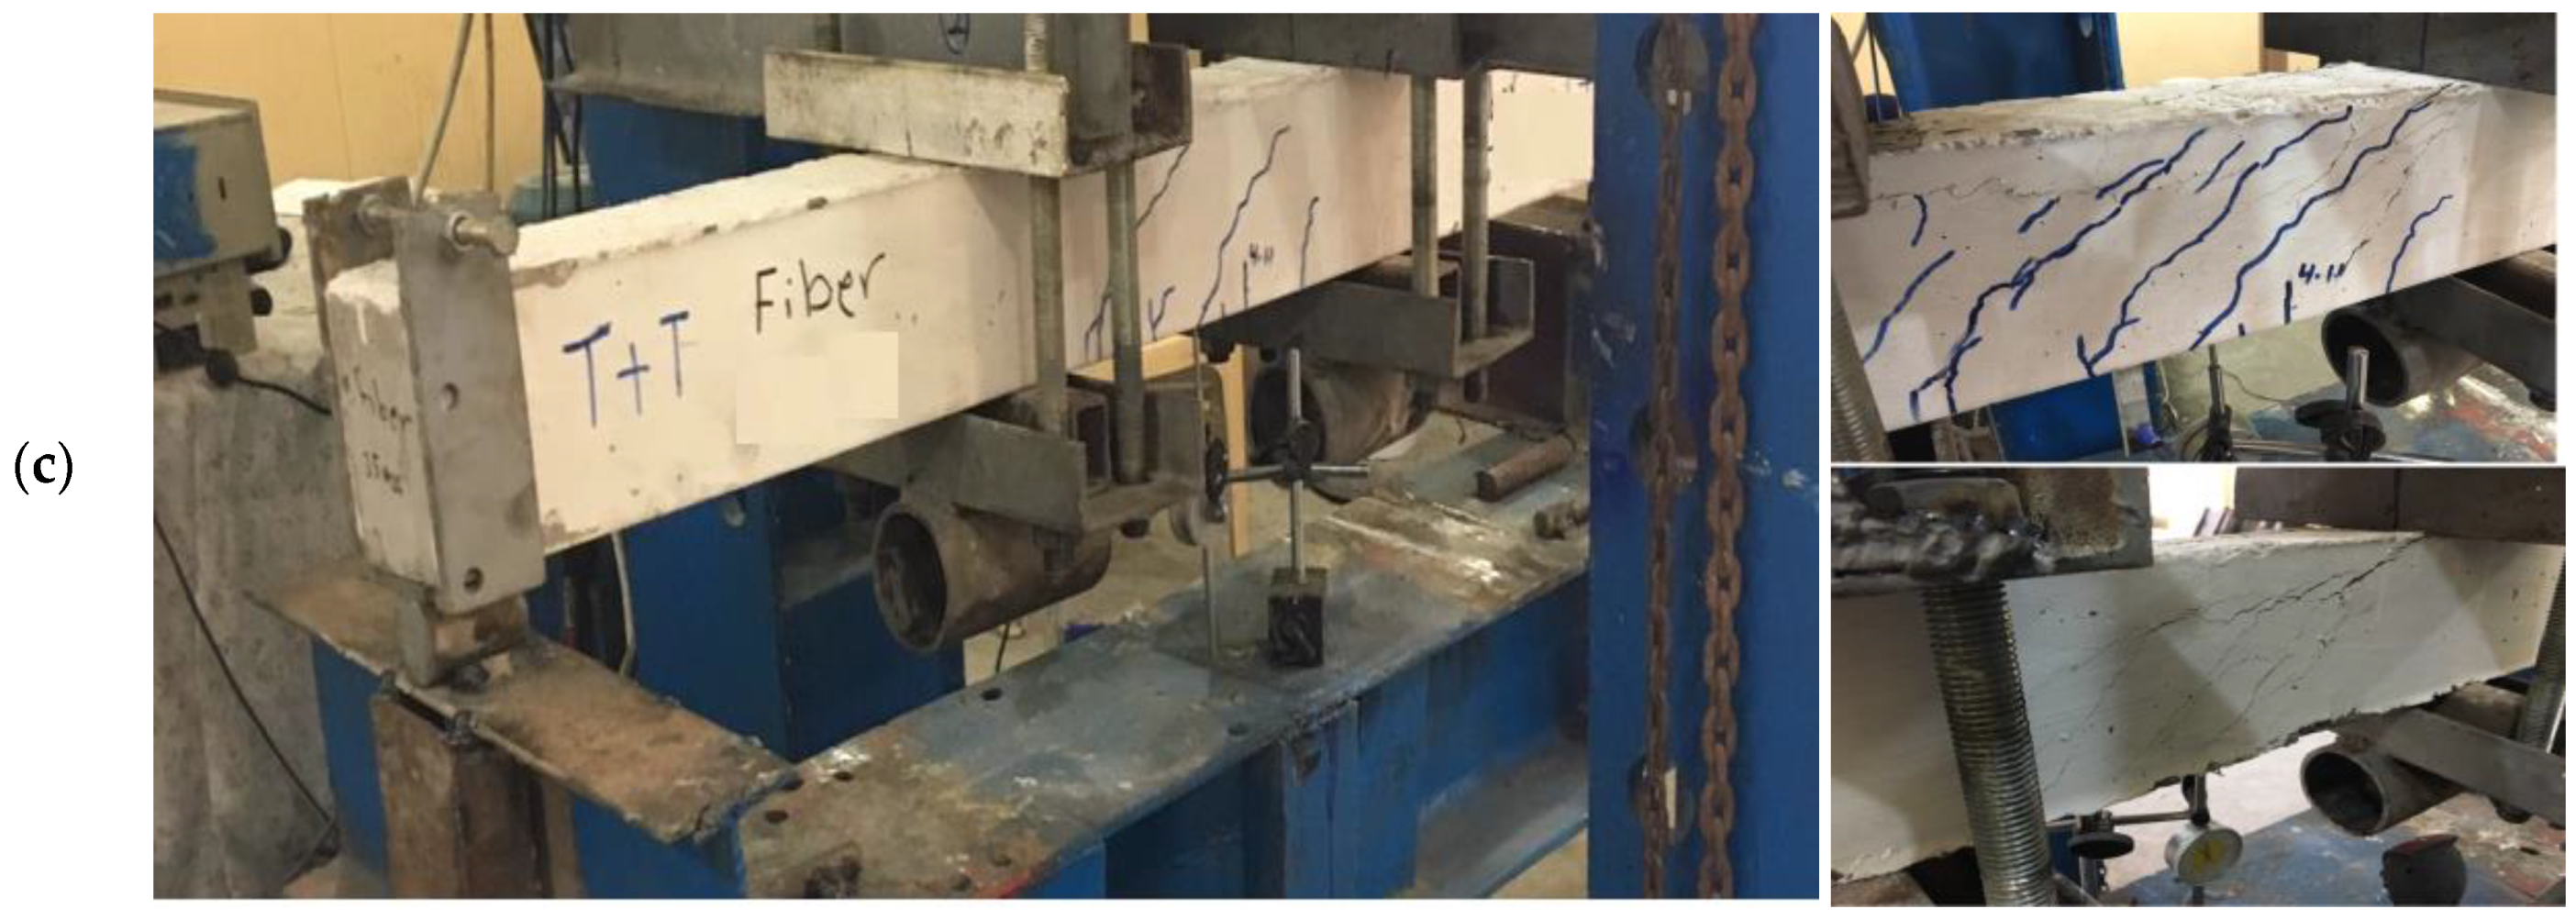
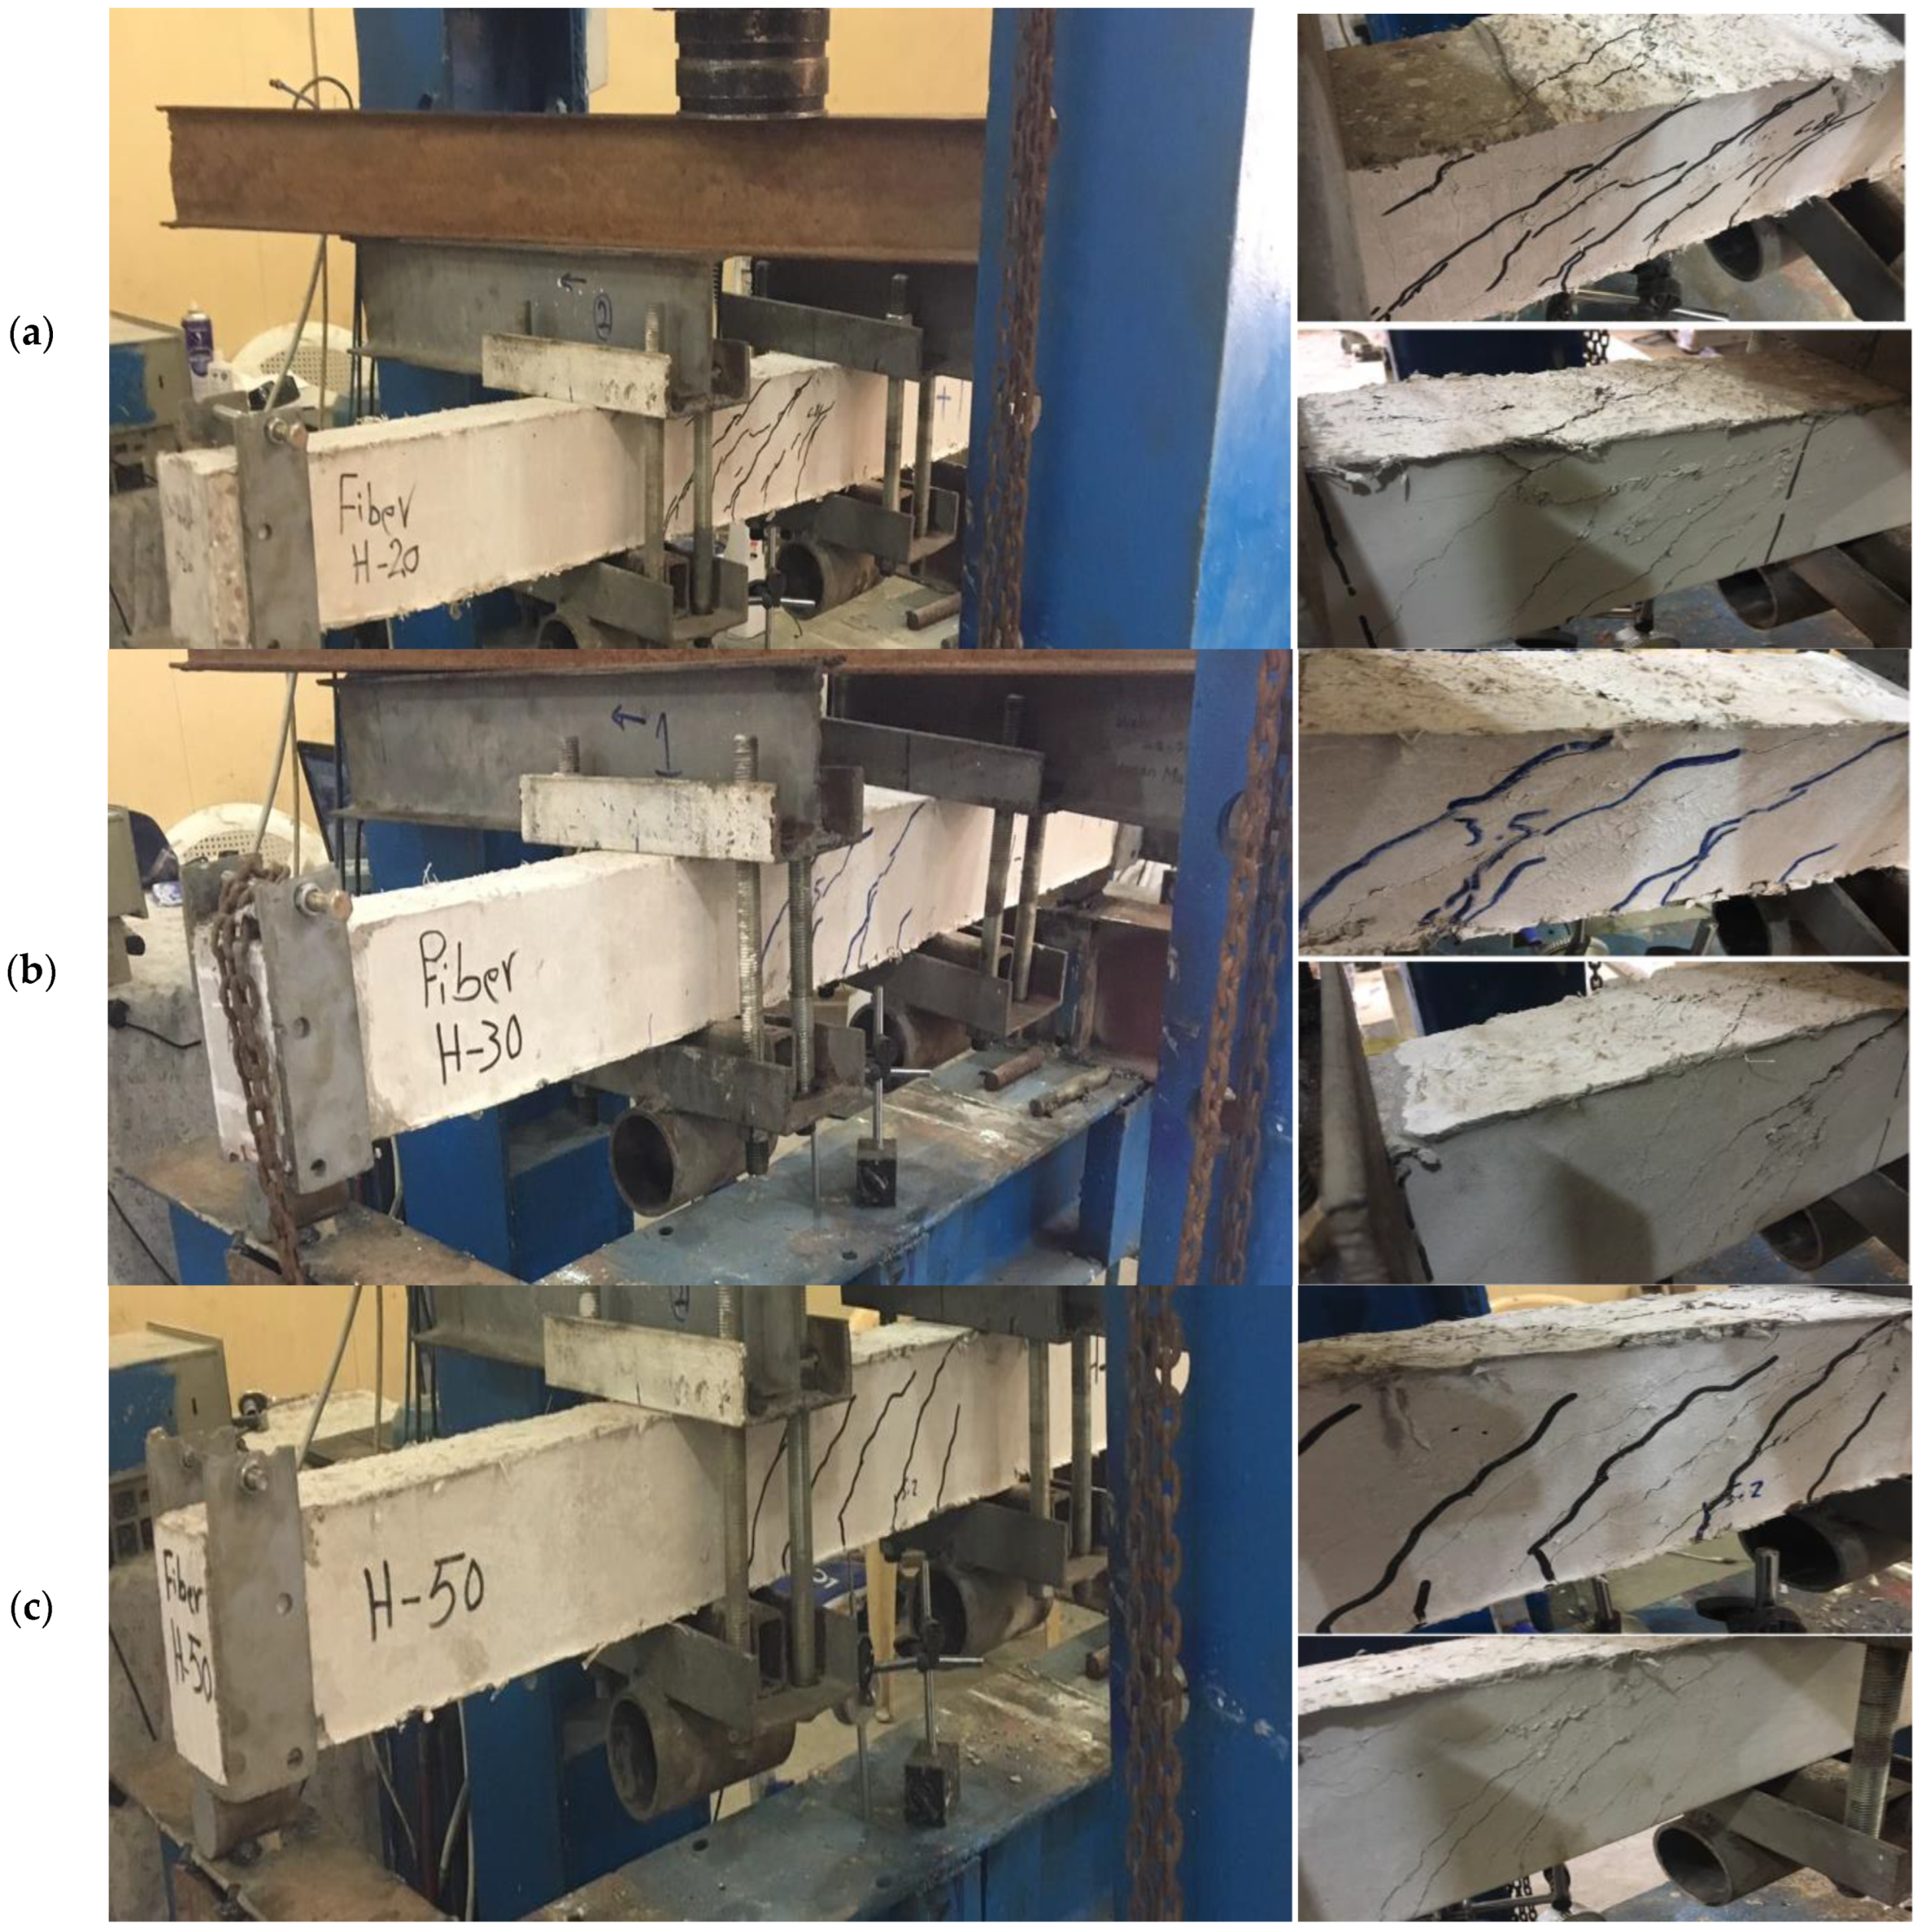
  • The NSC beams and FRC beams exhibited different crack patterns because the fibers acted as bridges and limited the propagation of cracks in the concrete. The improvement in the first-crack moment was found to be directly related to the length of the fiber used.
  • The inclusion of synthetic fibers in the concrete mixture resulted in a significant increase in the pre-cracking and post-cracking ductile areas compared to other types of fibers. Hence, it is recommended to incorporate synthetic fibers with a length of 55 mm into the concrete mixture, as this fiber had a considerable impact.
  • The beams reinforced with hooked steel fibers also showed good performance at a fiber dosage of 1%, as opposed to the straight micro-steel FRC beam.
  • The correlation between the experimental and predicted moment capacity of the FRC beams was good when the effect of the fiber presented in this study was compared with previous techniques to estimate the moment capacity.

Author Contributions

Conceptualization, N.H.A.-S. and R.F.H.; methodology, N.H.A.-S. and R.F.H.; formal analysis, M.H.J. and N.S.M.; investigation, H.H.H. and R.F.H.; resources, M.H.J. and H.H.H.; data curation, R.F.H. and M.H.J.; writing—original draft preparation, H.H.H. and R.F.H.; writing—review and editing, H.H.H. and N.S.M.; supervision, N.H.A.-S. and R.F.H.; project administration, R.F.H. All authors have read and agreed to the published version of the manuscript.

Funding

This research received no external funding.

Data Availability Statement

The data presented in this study are available on request from the corresponding author.

Conflicts of Interest

The authors declare no conflict of interest.

References

  1. Rahal, K.N. Torsional strength of reinforced concrete beams. Can. J. Civ. Eng. 2000, 27, 445–453. [Google Scholar] [CrossRef]
  2. Rahal, K.N.; Collins, M.P. Combined torsion and bending in reinforced and prestressed concrete beams. ACI Struct. J. 2003, 100, 157–165. [Google Scholar]
  3. Collura, D.; Nascimbene, R. Comparative Assessment of Variable Loads and Seismic Actions on Bridges: A Case Study in Italy Using a Multimodal Approach. Appl. Sci. 2023, 13, 2771. [Google Scholar] [CrossRef]
  4. Prakash, S.; Li, Q.; Belarbi, A. Behavior of circular and square reinforced concrete bridge columns under combined loading including torsion. ACI Struct. J. 2012, 109, 317–328. [Google Scholar]
  5. Kawashima, K.; Tirasit, P. Effect of nonlinear seismic torsion on the performance of skewed bridge piers. J. Earthq. Eng. 2008, 12, 980–998. [Google Scholar] [CrossRef]
  6. Rao, T.D.G.; Seshu, D.R. Torsion of steel fiber reinforced concrete members. Cem. Concr. Res. 2003, 33, 1783–1788. [Google Scholar] [CrossRef]
  7. Alabdulhady, M.Y.; Sneed, L.H.; Carloni, C. Torsional behavior of RC beams strengthened with PBO-FRCM composite—An experimental study. Eng. Struct. 2017, 136, 393–405. [Google Scholar] [CrossRef]
  8. Chiu, H.J.; Fang, I.K.; Young, W.T.; Shiau, J.K. Behavior of reinforced concrete beams with minimum torsional reinforcement. Eng. Struct. 2007, 29, 2193–2205. [Google Scholar] [CrossRef]
  9. Yang, I.H.; Joh, C.; Lee, J.W.; Kim, B.S. Torsional behavior of ultra-high performance concrete squared beams. Eng. Struct. 2013, 56, 372–383. [Google Scholar] [CrossRef]
  10. Daugevičius, M.; Valivonis, J. Concrete and Reinforced Concrete Elements Strengthened with HPFRCC. KSCE J. Civ. Eng. 2018, 22, 2961–2969. [Google Scholar] [CrossRef]
  11. Al-Baghdadi, H.M.; Al-Merib, F.H.; Ibrahim, A.A.; Hassan, R.F.; Hussein, H.H. Effects of Coarse Aggregate Maximum Size on Synthetic/Steel Fiber Reinforced Concrete Performance with Different Fiber Parameters. Buildings 2021, 11, 158. [Google Scholar] [CrossRef]
  12. Okay, F.; Engin, S. Torsional behavior of steel fiber reinforced concrete beams. Constr. Build. Mater. 2012, 28, 269–275. [Google Scholar] [CrossRef]
  13. Bernardo, L.; Lopes, S. Torsion in High-Strength Concrete Hollow Beams: Strength and Ductility Analysis. ACI Struct. J. 2009, 106, 39–48. [Google Scholar]
  14. Ju, H.; Lee, D.H.; Kim, K.S. Minimum torsional reinforcement ratio for reinforced concrete members with steel fibers. Compos. Struct. 2019, 207, 460–470. [Google Scholar] [CrossRef]
  15. Rasmussen, L.J.; Baker, G. Torsion in Reinforced Normal and High-Strength Concrete Beams—Part 2: Theory and Design. ACI Struct. J. 1995, 92, 149–156. [Google Scholar] [CrossRef]
  16. ACI (American Concrete Institute). Building Code Requirements for Structural Concrete and Commentary; ACI 318R-11; ACI (American Concrete Institute): Farmington Hills, MI, USA, 2014. [Google Scholar]
  17. Hassan, R.F.; Al-Salim, N.H.; Mohammed, N.S.; Hussein, H.H. Experimental study and theoretical prediction on torsional strength with different steel fiber reinforced concretes and Cross-Section areas. Eng. Struct. 2022, 251, 113559. [Google Scholar] [CrossRef]
  18. Hassan, R.F.; Jaber, M.H.; Al-Salim, N.H.; Hussein, H.H. Experimental research on torsional strength of synthetic/steel fiber-reinforced hollow concrete beam. Eng. Struct. 2020, 220, 110948. [Google Scholar] [CrossRef]
  19. Leung, M.B.; Schnobrich, W.C. Reinforced concrete beams subjected to bending and torsion. J. Struct. Eng. 1987, 113, 307–321. [Google Scholar] [CrossRef]
  20. Travush, V.I.; Karpenko, N.I.; Kolchunov, V.I.; Kaprielov, S.S.; Demyanov, A.I.; Bulkin, S.A.; Moskovtseva, V.S. Results of experimental studies of high-strength fiber reinforced concrete beams with round cross-sections under combined bending and torsion. Struct. Mech. Eng. Constr. Build. 2020, 16, 290–297. [Google Scholar] [CrossRef]
  21. Santhakumar, R.; Dhanaraj, R.; Chandrasekaran, E. Behaviour of retrofitted reinforced concrete beams under combined bending and torsion: A numerical study. Electron. J. Struct. Eng. 2007, 7, 1–7. [Google Scholar] [CrossRef]
  22. Martin, L.H. Torsion and bending in longitudinally reinforced concrete beams. Build. Sci. 1973, 8, 339–350. [Google Scholar] [CrossRef]
  23. Onsongo, W.M. The Diagonal Compression Field Theory for Reinforced Concrete Beams Subjected to Combined Torsion, Flexure, and Axial Load. Ph.D. Thesis, Department of Civil Engineering, University of Toronto, Toronto, ON, Canada, 1978; p. 246. [Google Scholar]
  24. Mardukhi, J. The Behavior of Uniformly Prestressed Concrete Box Beams in Combined Torsion and Bending. Master’s Thesis, Department of Civil Engineering, University of Toronto, Toronto, ON, Canada, 1974; p. 73. [Google Scholar]
  25. Iraqi Specification Standards IQS No. (5); Portland Cement. Central Agency for Standardization and Quality Control, Planning Council: Baghdad, Iraq, 1984. (In Arabic)
  26. Iraqi Specification Standards IQS No. (45); Aggregate from Natural Sources for Concrete and Construction. Central Agency for Standardization and Quality Control, Planning Council: Baghdad, Iraq, 1984. (In Arabic)
  27. ASTM C496/C496M-17; Standard Test Method for Splitting Tensile Strength of Cylindrical Concrete Specimens. ASTM International: West Conshohocken, PA, USA, 2017.
  28. ASTM C78C78M-18; Standard Test Method for Flexural Strength of Concrete (Using Simple Beam with Third-Point Loading). ASTM International: West Conshohocken, PA, USA, 2018.
  29. EN B. 12390-2, 2009; Testing Hardened Concrete. Making and Curing Specimens for Strength Tests. British standard, 1-12.BS EN 12390:2009. BSI: London, UK, 2009.
  30. ASTM A615/A615M-12; Standard Specification for Deformed and Plain Carbon-Steel Bars for Concrete Reinforcement. ASTM International: West Conshohocken, PA, USA, 2012.
  31. ASTM Designation C192/C192M-02; Making and Curing Concrete Test Specimens in Laboratory. Annual Book of ASTM Standards. American Society for Testing and Materials: Philadelphia, PA, USA, 2002; Volume 4.02.
  32. ASTM C1018; Standard Test Method for Flexural Toughness and First Crack Strength of Fiber Reinforced Concrete. ASTM Standards for Concrete and Mineral Aggregates, V.04.02, Standard Designation C1018. ASTM International: West Conshohocken, PA, USA, 1989; p. 7.
Figure 1. Types of fibers. (a) 19 mm STH, (b) 35 mm STH, (c) 55 mm STH, (d) SSF, and (e) HSF.
Buildings 13 01347 g001
Figure 2. (a) Reinforcement details and (b) steel cage inside the mold.
Buildings 13 01347 g002
Figure 3. (a) Beam setup, along with a sketch of the test details; (b) tested beam in machine test; (c) top view, and (d) side view.
Buildings 13 01347 g003
Figure 4. (a) Compression, (b) splitting tensile strength, and (c) flexural specimens.
Buildings 13 01347 g004
Figure 5. Torque–rotation angle plots of (a) synthetic FRC and control beams and (b) steel FRC and control beams.
Buildings 13 01347 g005
Figure 6. Moment–deflection plots of (a) synthetic and control beams and (b) steel FRC and control beams.
Buildings 13 01347 g006
Figure 7. Toughness model for torsion [12].
Buildings 13 01347 g007
Figure 8. Torsional toughness.
Buildings 13 01347 g008
Figure 9. Estimate diagram for flexural toughness of ASTM C1018 [32] method.
Buildings 13 01347 g009
Figure 10. (a) First crack, (b) inclination of crack, and (c) additional cracks.
Buildings 13 01347 g010
Figure 11. Flexural and torsional failure modes of (a) B-NC, (b) B-SSF-13, and (c) B-HSF-13.
Buildings 13 01347 g011aBuildings 13 01347 g011b
Figure 12. Flexural and torsional failure modes of (a) B-STH-19, (b) B-STH-35, and (c) B-STH-55.
Buildings 13 01347 g012
Table 1. Chemical analysis of the cement.
Compound CompositionChemical CompositionPercentage by WeightLimits of IQS No. 5/1984 [25]
Lime OxideCaO61.8-
Silica DioxideSiO219.68-
Alumina OxideAl2O33.3-
Iron OxideFe2O34.16-
Lime Saturation FactorLSF0.9720.66–1.02
Magnesia OxideMgO0.23≤5.00%
Tricalcium AluminateC3A1.707-
Sulfate TrioxideSO32.45≤2.5% if C3A ≤ 5%
Loss on IgnitionLOI2.8≤2.8% if C3A > 5%
Insoluble ResidueIR0.59≤1.50%
Table 2. Physical properties of the cement.
Physical PropertiesTest ResultsLimits of IQS No. 5/1984 [25]
Fineness (Blaine) (m2/kg)260≥230
Time of setting (Vicat) (minute)Initial time110≥45
Final time316≤600
Compressive strength for cement paste cube mold (50 mm) (MPa)3 days19.07≥15
7 days30.23≥23
Table 3. Grading of fine aggregate.
Sieve Size (mm)Passing %Limits of IQS No. 5/1984 [25] for Zone (2)
10100100
4.7598.290–100
2.3687.175–100
1.1872.555–90
0.644.835–59
0.311.68–30
0.151.30–10
Table 4. Physical and chemical properties of fine aggregate.
Physical PropertiesTest ResultsLimits of IQS No. 45/1984 [26]
Material finer than 75 μm (sieve no. 200) (%weight)4.2≤5.00%
Sulfate content0.1≤0.50%
Table 5. Grading of coarse aggregate.
Sieve Size (mm)Passing %Limits of IQS No. 5/1984 [25] for Zone (2)
20100100
1499.1290–100
9.579.8250–85
4.759.20–10
Table 6. Physical and chemical properties of coarse aggregate.
PropertyTest Results (%)Limits of IQS No. 45/1984 [26]
Sulfate content (SO3)0.04≤0.1%
Material finer than 75 μm (sieve no. 200)0.2≤3%
Table 7. Characteristics of fibers, as listed by the manufacturer.
FeatureSynthetic FiberSteel Fiber (Straight and Hook)
Length19 mm35 mm55 mm13 mm
Diameter0.35 mm0.35 mm0.35 mm0.2 mm
Tensile strength (MPa)570–660570–660570–660<2100
Modulus of elasticity (GPa)4.74.74.7200
Specific gravity0.90.90.97.8
ColorGrayGrayGrayGolden
Table 8. Concrete mix designs.
MaterialMix ID
NSCSTH-19STH-35STH-55SSF-13HSF-13
Water/cement ratio0.460.460.460.460.460.46
Fiber type-SyntheticSyntheticSyntheticStraight steelHook steel
Length of fiber (mm)-1935551313
Cement (kg/m3)460460460460460460
NSG (kg/m3)675675675675675675
Fiber dosage % by volume011111
Coarse aggregate (kg/m3)112511251125112511251125
Table 9. Sample details.
Sample IDDetails
B-NCNo fiber
B-SSF-13Straight steel fiber (13 mm)
B-HSF-13Hook steel fiber (13 mm)
B-STH-19Synthetic fiber (19 mm)
B-STH-35Synthetic fiber (35 mm)
B-STH-55Synthetic fiber (55 mm)
Table 10. Mechanical properties of hardened concrete mixes.
Mix IDCompressive Strength (MPa)COV %Diff. (%)Tensile Strength (MPa)COV %Diff. (%)Flexural Strength (MPa)COV %Diff. (%)Brittleness Ratio
NSC31.416.2%0%2.734.7%0%3.558.2%0%8.85
STH-1933.863.7%11%3.423.0%25%4.923.5%39%6.88
STH-3535.488.5%13%3.682.9%35%5.143.3%45%6.90
STH-5536.796.2%17%3.745.3%37%5.447.4%53%6.76
SSF-1334.554.7%10%3.243.5%19%4.894.1%38%7.07
HSF-1335.085.7%12%3.313.7%21%5.024.8%41%6.99
Table 11. Test results of the torsional behavior of specimens.
Sample IDCracking Torque (Tcr)Ultimate Torque (Tf)Initial Torsional Stiffness (k) (kNm/rad)Torsional Ductility Index ϴu/ϴe
Torque (kNm)TC %Angle (rad)Torque (kNm)TC %Angle (rad)
B-NC10.00%0.0023.40.00%0.0204500.004.72
B-SSF-131.220%0.0024.223.53%0.0384600.006.7
B-HSF-131.110%0.00183.914.71%0.00354611.117.4
B-STH-191.330%0.00214.532.35%0.0238619.057.2
B-STH-351.330%0.00184.635.29%0.00227722.227.7
B-STH-551.220%0.00184.429.41%0.0018666.678.2
Torque change (TC) = Diff/TorqueCon × 100%; ϴu is the angle of twist at the ultimate torque; ϴe is the angle of twist at elastic torque.
Table 12. Test results of the flexural behavior of specimens.
Sample IDCracking Moment (Tcr)Ultimate Moment (Tf)Initial Flexural Stiffness (k) (kNm/m)Flexural Ductility Index Δue
Moment (kNm)MC %Deflection (mm)Moment (kNm)MC %Deflection (mm)
B-NC10.00%0.53.40.00%4.52000.002.4
B-SSF-131.110%0.513.914.71%5.652156.862.5
B-HSF-131.220%0.474.223.53%5.32553.192.4
B-STH-191.220%0.544.429.41%5.962222.222.7
B-STH-351.330%0.554.532.35%5.412363.642.4
B-STH-551.330%0.574.635.29%6.12280.702.5
Moment change (MC) = Diff/Moment Con × 100%; Δu is deflection at the ultimate moment; Δe is deflection at the elastic moment.
Table 13. Toughness indices for flexural behavior of tested beams.
Sample IDToughness Index
I5I10I20I30I5 %I10 %I20 %I30 %
B-NC3.769.615.6820.40.000.000.000.00
B-SSF-134.416.422.836.817.0270.8345.4180.39
B-HSF-137.217.625.638.891.4983.3363.2790.20
B-STH-195.619.225.638.248.94100.0063.2787.25
B-STH-357.221.628.241.691.49125.0079.85103.92
B-STH-558.222.429.142.2118.09133.3385.59106.86
% of change (I) = Diff/ICon × 100.
Table 14. Comparison between the experimental and calculated ultimate moments.
Beam IDM expMu.c1 [21]Mu.c1/MexpMu.c2 [22]Mu.c2/MexpMu.c3 ModifiedMu.c3/Mexp
B-NC3.43.51.092.40.713.51.12
B-SSF-133.93.91.002.70.694.21.08
B-HSF-134.23.90.932.70.644.21.00
B-STH-194.43.90.892.70.614.41.00
B-STH-354.540.892.70.604.61.02
B-STH-554.640.872.90.634.71.02
R2 = 0.836R2 = 0.771R2 = 0.941
Disclaimer/Publisher’s Note: The statements, opinions and data contained in all publications are solely those of the individual author(s) and contributor(s) and not of MDPI and/or the editor(s). MDPI and/or the editor(s) disclaim responsibility for any injury to people or property resulting from any ideas, methods, instructions or products referred to in the content.

