Article

Research on Carbon Emission of Prefabricated Structure in China

1
College of Civil Engineering, Hunan University, Changsha 410082, China
2
Hunan Provincial Key Laboratory on Damage Diagnosis for Engineering Structures, College of Civil Engineering, Hunan University, Changsha 410082, China
*
Author to whom correspondence should be addressed.
Buildings 2023, 13(5), 1348; https://doi.org/10.3390/buildings13051348
Submission received: 15 April 2023 / Revised: 17 May 2023 / Accepted: 18 May 2023 / Published: 21 May 2023

Abstract

:
The comparison of carbon emissions between prefabricated and traditional cast-in-place construction methods in actual example buildings has yielded inconsistent results due to the difficulty in accounting for design parameter uncertainty. Additionally, the carbon-reduction capacity of prefabricated structures remains a topic of debate. This paper investigates the carbon emission reduction capacity of prefabricated concrete frame structures compared to traditional cast-in-place structures, with a focus on addressing design parameter uncertainty. A quantitative model of carbon emissions is established using the subproject quota method and PKPM-PC software. The study evaluates the impact of design parameters, such as slab span and seismic requirements, and calculation parameters, such as carbon emission factor and transport distance, on carbon emissions. The results indicate that prefabricated structures with a higher assembly rate exhibit a stronger emission reduction capacity, mainly due to lower demands for labor and mechanical energy consumption. The study also highlights that prefabricated structures with smaller slab spans and higher seismic requirements have lower carbon emission reduction capacities and can produce greater carbon emissions than cast-in-place structures. Furthermore, the appropriate carbon emission factor for the material used in prefabricated structures is crucial for achieving reliable carbon reduction rates. Finally, the study emphasizes the importance of considering transport as a small but significant factor in structural comparison, as changes in transport distance can significantly impact results.

1. Introduction

Carbon emissions from the construction sector represent a critical source of greenhouse gases. Buildings alone generate 36% of global energy consumption and 39% of global CO2 emissions during construction and operation [1]. It is urgent to reduce carbon emissions from buildings. Prefabricated construction is becoming a leading trend in the development of the construction industry, thanks to its unique advantages. Industrialized production processes have increased the accuracy of building components, leading to minimal waste generation, and a significant reduction in construction process complexity [2]. Prefabricated buildings can be constructed at a faster pace, effectively reducing the risk of schedule overruns [3]. Prefabricated building components are produced on assembly lines, thereby reducing labor costs, standardizing production and construction, and simplifying the construction process. Currently, the new prefabricated construction area in China exceeds 740,000,000 m2, accounting for 24.5% of the new construction area [4].
Numerous studies have investigated the environmental impact of prefabricated buildings, including their energy consumption and greenhouse gas emissions. Tumminia [5] explores the environmental impact of a prefabricated building module in Messina, which uses renewable energy technologies and causes emissions of 1.5 t of CO2-e/m2, consumes 29.2 GJ/m2 of primary energy over its lifetime and achieves the goal of a net zero energy building. Teng [6] studied the carbon emissions of a typical 30-storey prefabricated public housing building in Hong Kong at the materialization stage, and showed that the use of low-carbon concrete, such as replacing ordinary silicate cement with blast furnace slag cement and fly ash, can significantly reduce carbon emissions. Ding [7] developed a carbon emission measurement system for the materialization phase of prefabricated houses, applied to a prefabricated project in Shenzhen, China, showing that the total carbon emission per unit volume of all prefabricated components was 764.87 kg/m3, 20.11% lower than that of cast-in-place parts. Jin [8] critically reviews the literature on research conducted on the environmental performance of prefabricated buildings, revealing that the dominant approach is life cycle assessment (LCA) and mostly using components as functional units to systematically analyze the carbon emissions and energy consumption of assembled residential buildings.
The comparative benefits of prefabrication for reducing GHG emissions in buildings have been analyzed by many researchers who have conducted building-to-building comparisons of real cases. Wang’s study in Japan [9] and Wen’s study in Malaysia [10] demonstrated lower carbon emissions for precast concrete structures compared to cast-in-place structures. However, Tumminia’s [5] and Bonamente’s [11] studies in Italy reported higher carbon emissions for precast concrete structures. In Chinese building research, Li [12] and Zhou [13] support the idea that prefabricated buildings reduce carbon emissions, while Han [14] maintains the opposite. The prefabrication rate has been identified as a crucial parameter for prefabricated buildings. Pons [15] and Mao [16] found that a higher prefabrication rate leads to a greater reduction in carbon emissions, whereas Du [17] and Wang [18] discovered that a higher assembly rate results in more carbon emissions.
Many studies have performed parameter sensitivity analyses to understand their impact on carbon emission results. Quale [19] estimates uncertainties in on-site waste generation, transport distances, and on-site temporary heating for concrete buildings. Dodoo [20] estimates uncertainties in material transport, insulation material, building lifespan, and steel recycling for timber buildings. Omar [21] studied the sensitivity of carbon emissions from concrete buildings to price fluctuations of raw materials in product manufacturing and reduced their impact by extending the boundaries of process methods. Hamidul [22] found the overall contributions of the whole life cycle impacts have increased significantly due to design life of a building. While low maintenance scenarios show up to 6%, transportation distance scenarios show a negligible difference.Transportation distance scenarios show a negligible difference, which is consistent with Dodoo [20]. It can be seen that the research on carbon emission reduction capacity of prefabricated structures focuses on its sensitivity to calculation parameters but neglects the consideration of design parameters.
It is crucial to comprehensively consider uncertainty and variability factors associated with carbon emission assessments to reduce uncertainty and enable more accurate emission estimates and decisions [23,24]. For the widely used method based on the comparative analysis of carbon emissions of real cases, it is difficult to conduct sensitivity analysis for the design parameters because they are not uniform. The carbon emission calculations for the materialization phase of actual buildings are usually derived from final accounts and construction records, which means the carbon emission calculations for buildings are often carried out after the completion of the project, and the resulting carbon emission evaluation results for existing buildings are not suitable as a basis for the selection of new buildings. Based on this, this paper proposes to construct a carbon emission measurement method for the materialization phase of prefabricated structures, using PKPM-PC software for modelling, and systematically investigating the carbon emission reduction capacity of prefabricated structures under different design parameters. The carbon emission model based on subproject quotas established in this paper can advance the calculation to the structural design stage, which is conducive to the ex ante control of engineering carbon emission reduction. In addition, by constructing a comprehensive carbon emission factor database based on subproject quotas, we can greatly reduces the workload of designers who would otherwise need to recalculate carbon emissions based on quotas.

2. Method

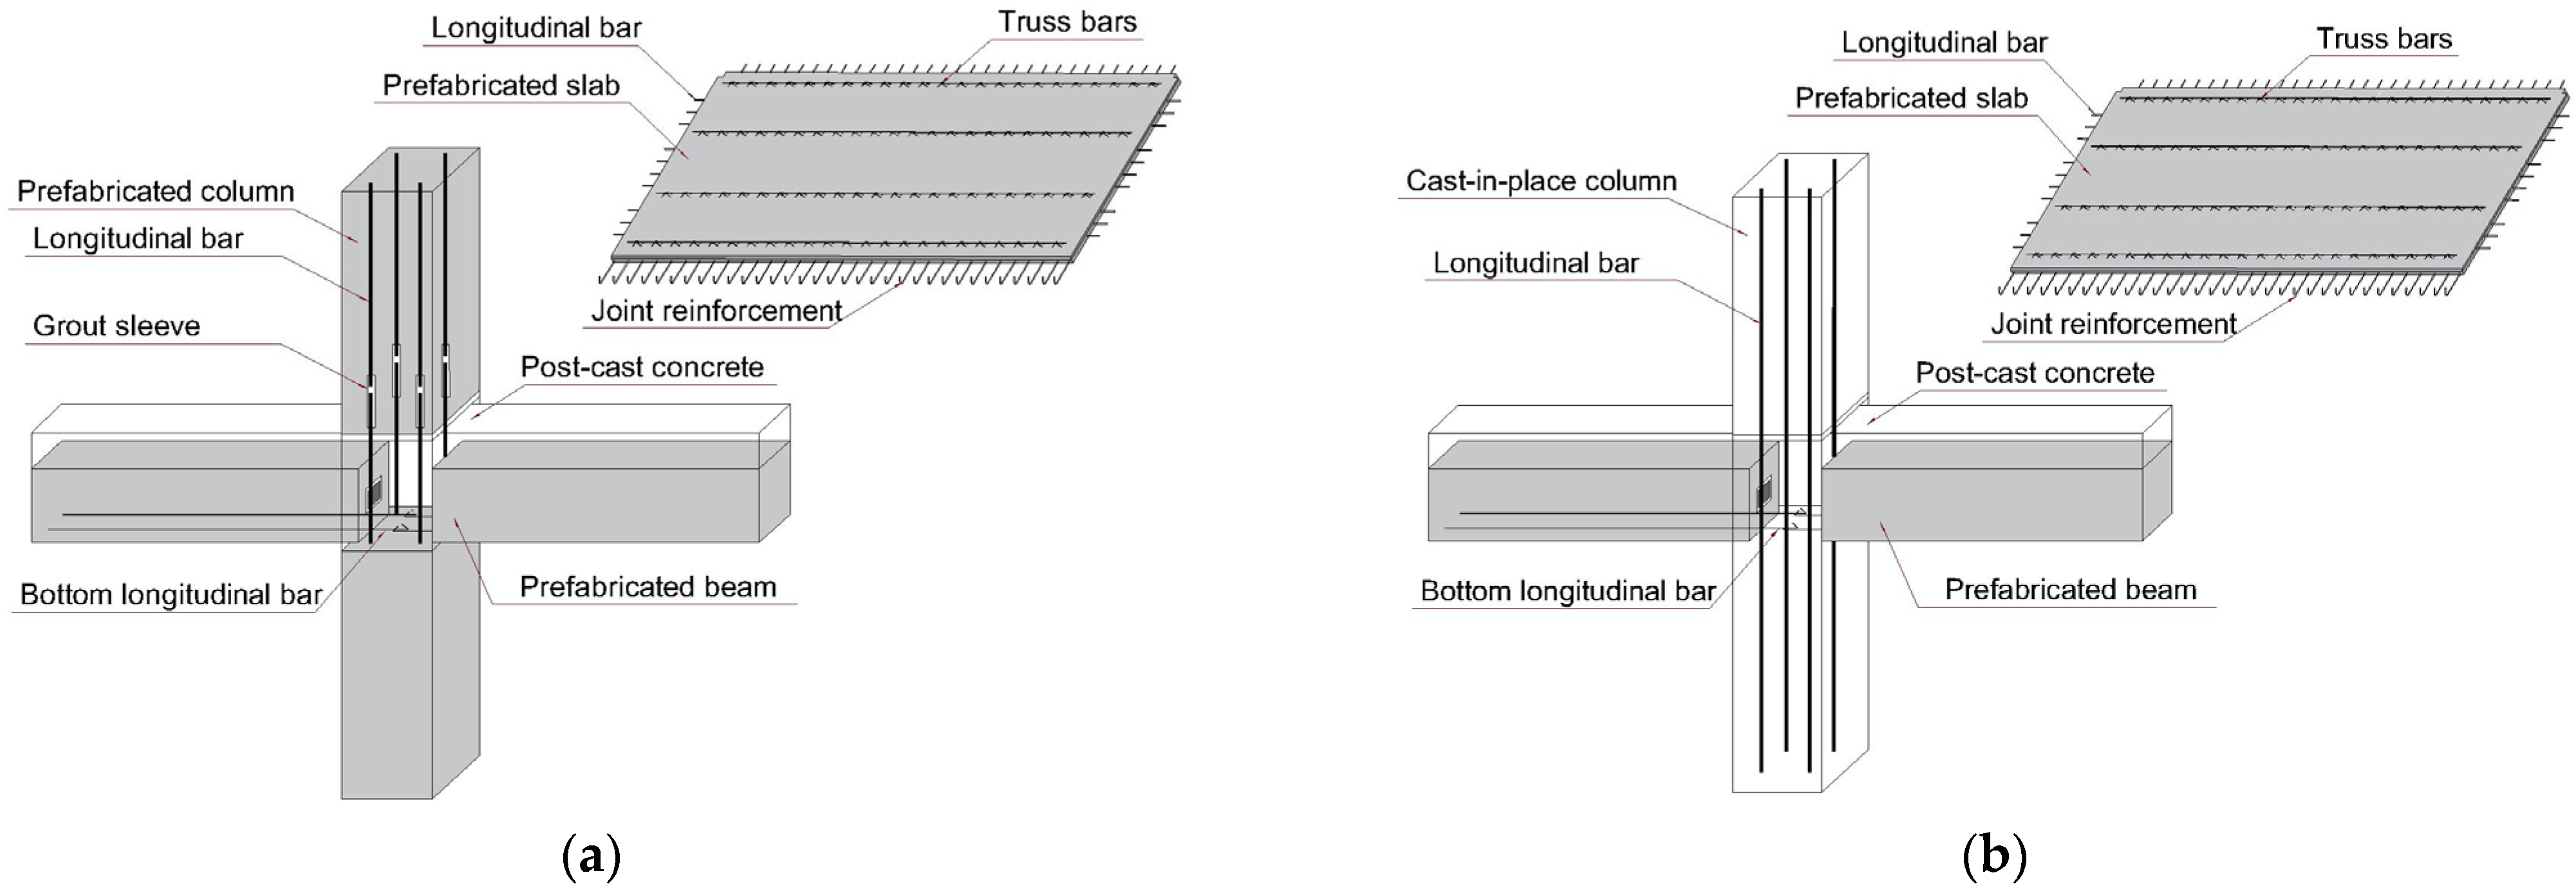
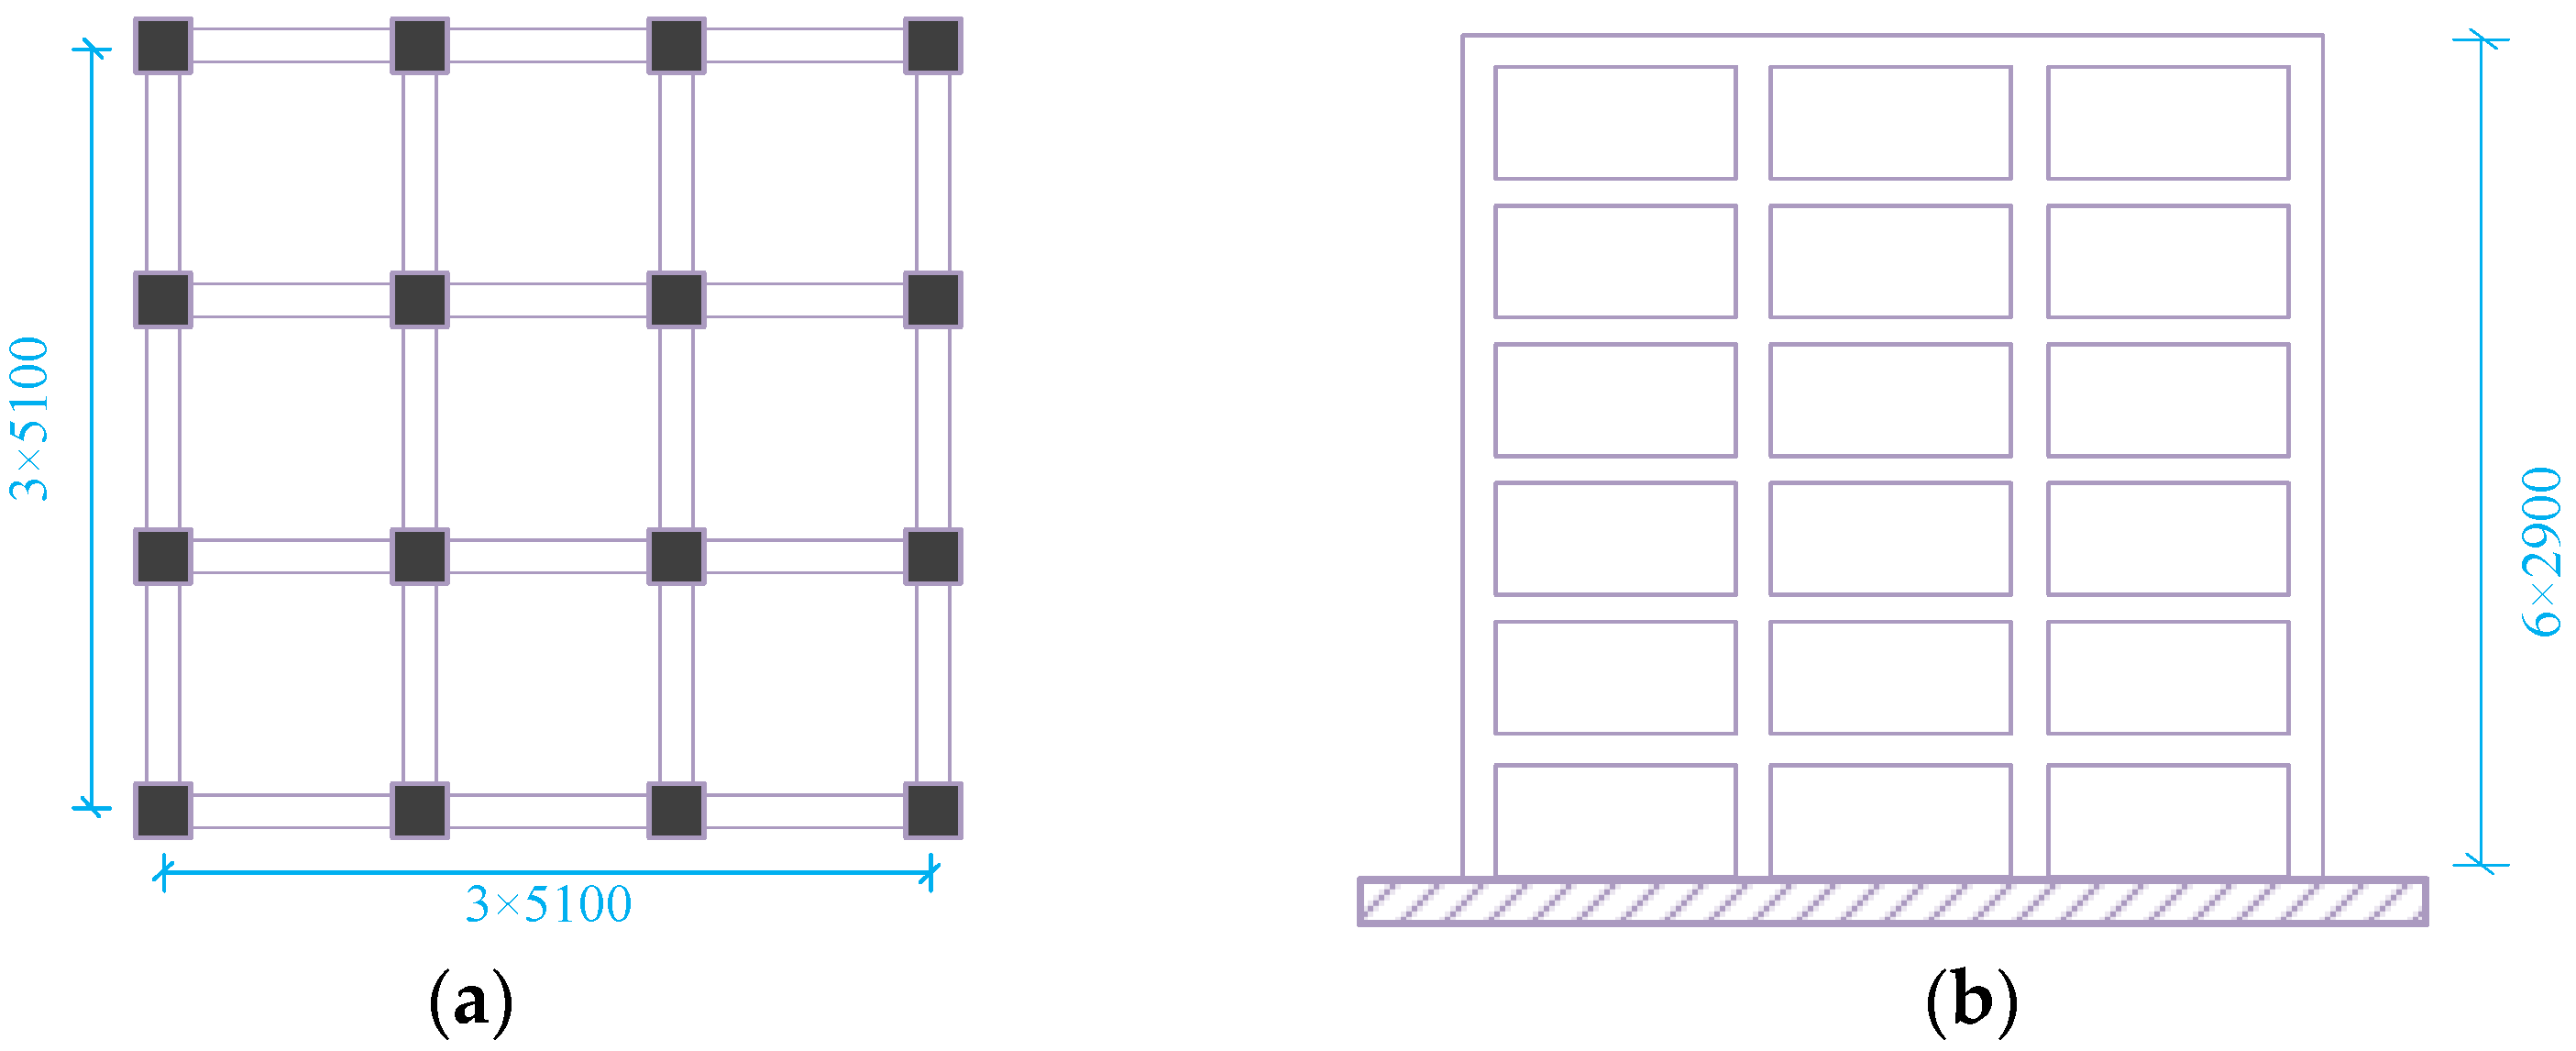
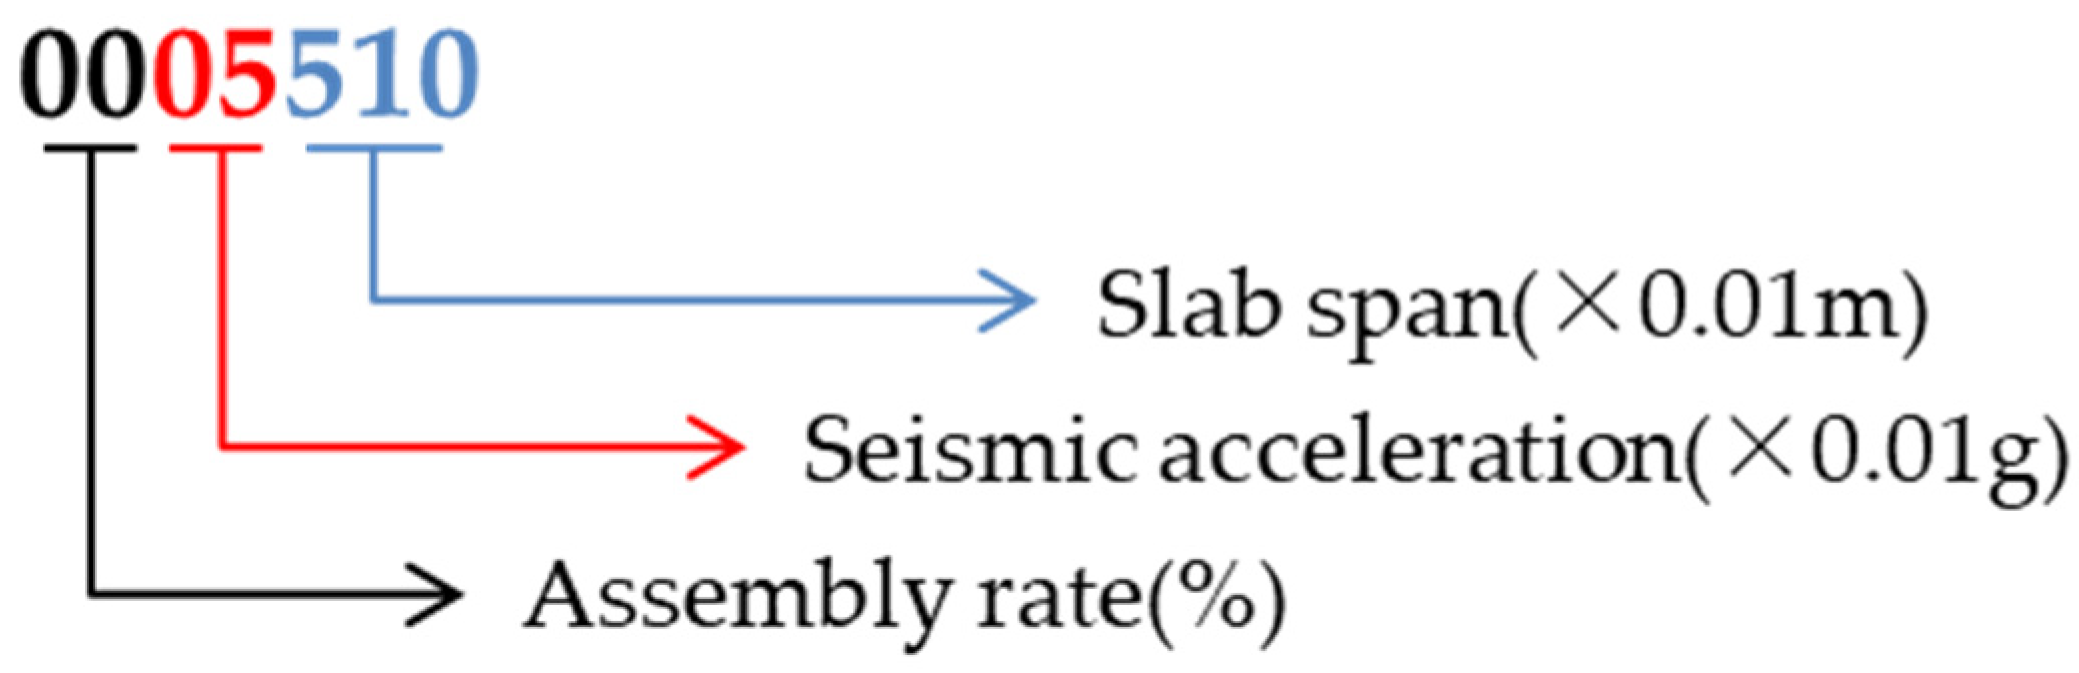
2.1. Structural Design

In this study, the design parameters of the prefabricated integrated concrete frame structure and the cast-in-place structure were kept consistent using BIM-based PKPM-PC software. The control group was set up as the cast-in-place structure to compare the carbon emission reduction capacity of the prefabricated structure. The design followed the “Technical Regulations for Prefabricated Concrete Structures” [25]. According to the “Uniform Standard for Reliability Design of Building Structures” in China [26], the service life of the structure in this paper is set as 50 years. The loads were taken from “Load Codes for Building Structures” [27]. The seismic fortification intensity was 6 degrees with an earthquake acceleration of 0.05 g. The building materials used were HRB400 grade longitudinal reinforcement, HPB300 stirrup, and C40 concrete.
This study investigates the carbon reduction capabilities of two distinct assembly rate structures by designing two prefabricated structures with assembly rates of 50% and 80%, respectively. Figure 1 illustrates the prefabricated components used in the structures. For the 80% assembly rate structure, all beams, slabs, and columns are prefabricated, whereas in the 50% assembly rate structure, only beams and slabs are prefabricated, and columns are cast-in-place. The prefabricated columns in the 80% assembly rate structure are connected using semi-grouting sleeves, while the embedded lifting parts comprise round-head hanging nails and embedded anchor bolts. The sleeve and embedded part dimensions were obtained from the attachment library of the BIM-based PKPM-PC software utilized for modeling and design. The steel bars at the bottom of the composite beam are anchored with curved hooks, with straight hooks serving as the embedded lifting part. The laminated slab is a steel truss composite slab, with the truss hanging point as its embedded part. Figure 2 displays the plan and elevation layouts of the structure, respectively, with a height of 17.4 m and a total of six layers, each with a standard height of 2.9 m.

2.2. Carbon Emission Estimation during the Materialization Phase

The primary purpose of calculating carbon emissions is to compare the carbon emissions of each phase process involved in a building’s life cycle, enabling the formulation of targeted carbon reduction measures. In order to compare the carbon emissions of different buildings, standardizing carbon emissions at each phase based on functional units is necessary. The building area is the most commonly used quantifier for carbon emissions. The standard unit for carbon emissions per unit of floor area is kilograms of carbon dioxide equivalent per square meter (kgCO2-e/m2). This unit expresses the total amount of greenhouse gases emitted per square meter of floor space, including CO2, CH4, N2O, PFCs, HFCs, and SF6. The use of this unit facilitates the comparison of carbon emissions across various buildings, while also serving as an indicator to evaluate the environmental sustainability of a building. Adopting a standardized approach for measuring and comparing carbon emissions during the various phases of a building’s life cycle is essential to identify and implement effective strategies to reduce carbon emissions and mitigate the environmental impact of the construction industry.
Studying the carbon emissions of buildings first requires defining the carbon emission measurement boundary. The life cycle of a building product is usually divided into five phases: production, transport, construction, operation, and demolition. The first three phases are called the building materialization phase [28,29]. The difference between prefabricated and cast-in-place buildings is mainly in construction methods [30]. Therefore, the study’s boundary is the building’s materialization phase.
There exist numerous methodologies for assessing the environmental influence of buildings [31].The subproject-based quota method was utilized in this study to estimate the comprehensive emission coefficient of the relevant subprojects [32]. This calculation method offers several advantages, including the ability to calculate carbon emissions based on building components, which allows designers to adopt more targeted carbon reduction measures. Additionally, because the specification’s bill of quantities is consistent, this approach can effectively reduce errors and omissions in the calculation process that may result from excessive statistical work. To obtain carbon emission source data, the “building construction and decoration engineering consumption quota” [33] and “consumption quota of prefabricated construction works” [34] were consulted. These references provide the consumption of labor, energy, materials, and construction machinery required for unit sub-projects, which served as an important basis for this study’s data. Since this study focuses on the concrete main frame, only the sub-projects related to the reinforced concrete works in the quotas were included in the analysis. Given the significant number of materials involved, turnover materials were excluded from the calculation, except for the wooden formwork used for cast-in-place members, which was included in the calculation due to its relatively small turnover cycle.
Figure 3 illustrates the primary emission sources during the production, transportation, and construction of prefabricated structures. The calculation units for the required subprojects include concrete, reinforcement, hoops, formwork, pre-built parts, vertical transportation, scaffolding, and over-height subprojects, which are typically considered as 10 m3, 1 t, 1 t, 100 m2, 1 pc, 1 day, 100 m2, and 100 m2, respectively. The relevant construction quotas were used to obtain the energy, material, machinery, and labor consumption per unit subproject. The comprehensive carbon emission coefficients of each phase per unit subproject were obtained by multiplying the corresponding carbon emission source consumption by the emission factors, as shown in Table 1. The comprehensive carbon emission factor of the materialization phase of the subproject was then determined by summing each phase, as shown in Equation (1). Finally, the carbon emission of the materialization phase was calculated by multiplying the corresponding subproject work volume, as shown in Equation (2).
E F i j = E F P , i j + E F T , i j + E F C , i j
E = i , j ( E F i j × Q i j ) / s
where EFij, EFP,ij, EFT,ij and EFC,ij are, respectively, the comprehensive carbon emission coefficients in the materialization, production, transport, and construction phases of the j-th subdivisional work of the i-th subproject; E is carbon emission during the materialization phase. Qij is the engineering quantity j-th subdivisional work of the i-th subproject; s is the area.

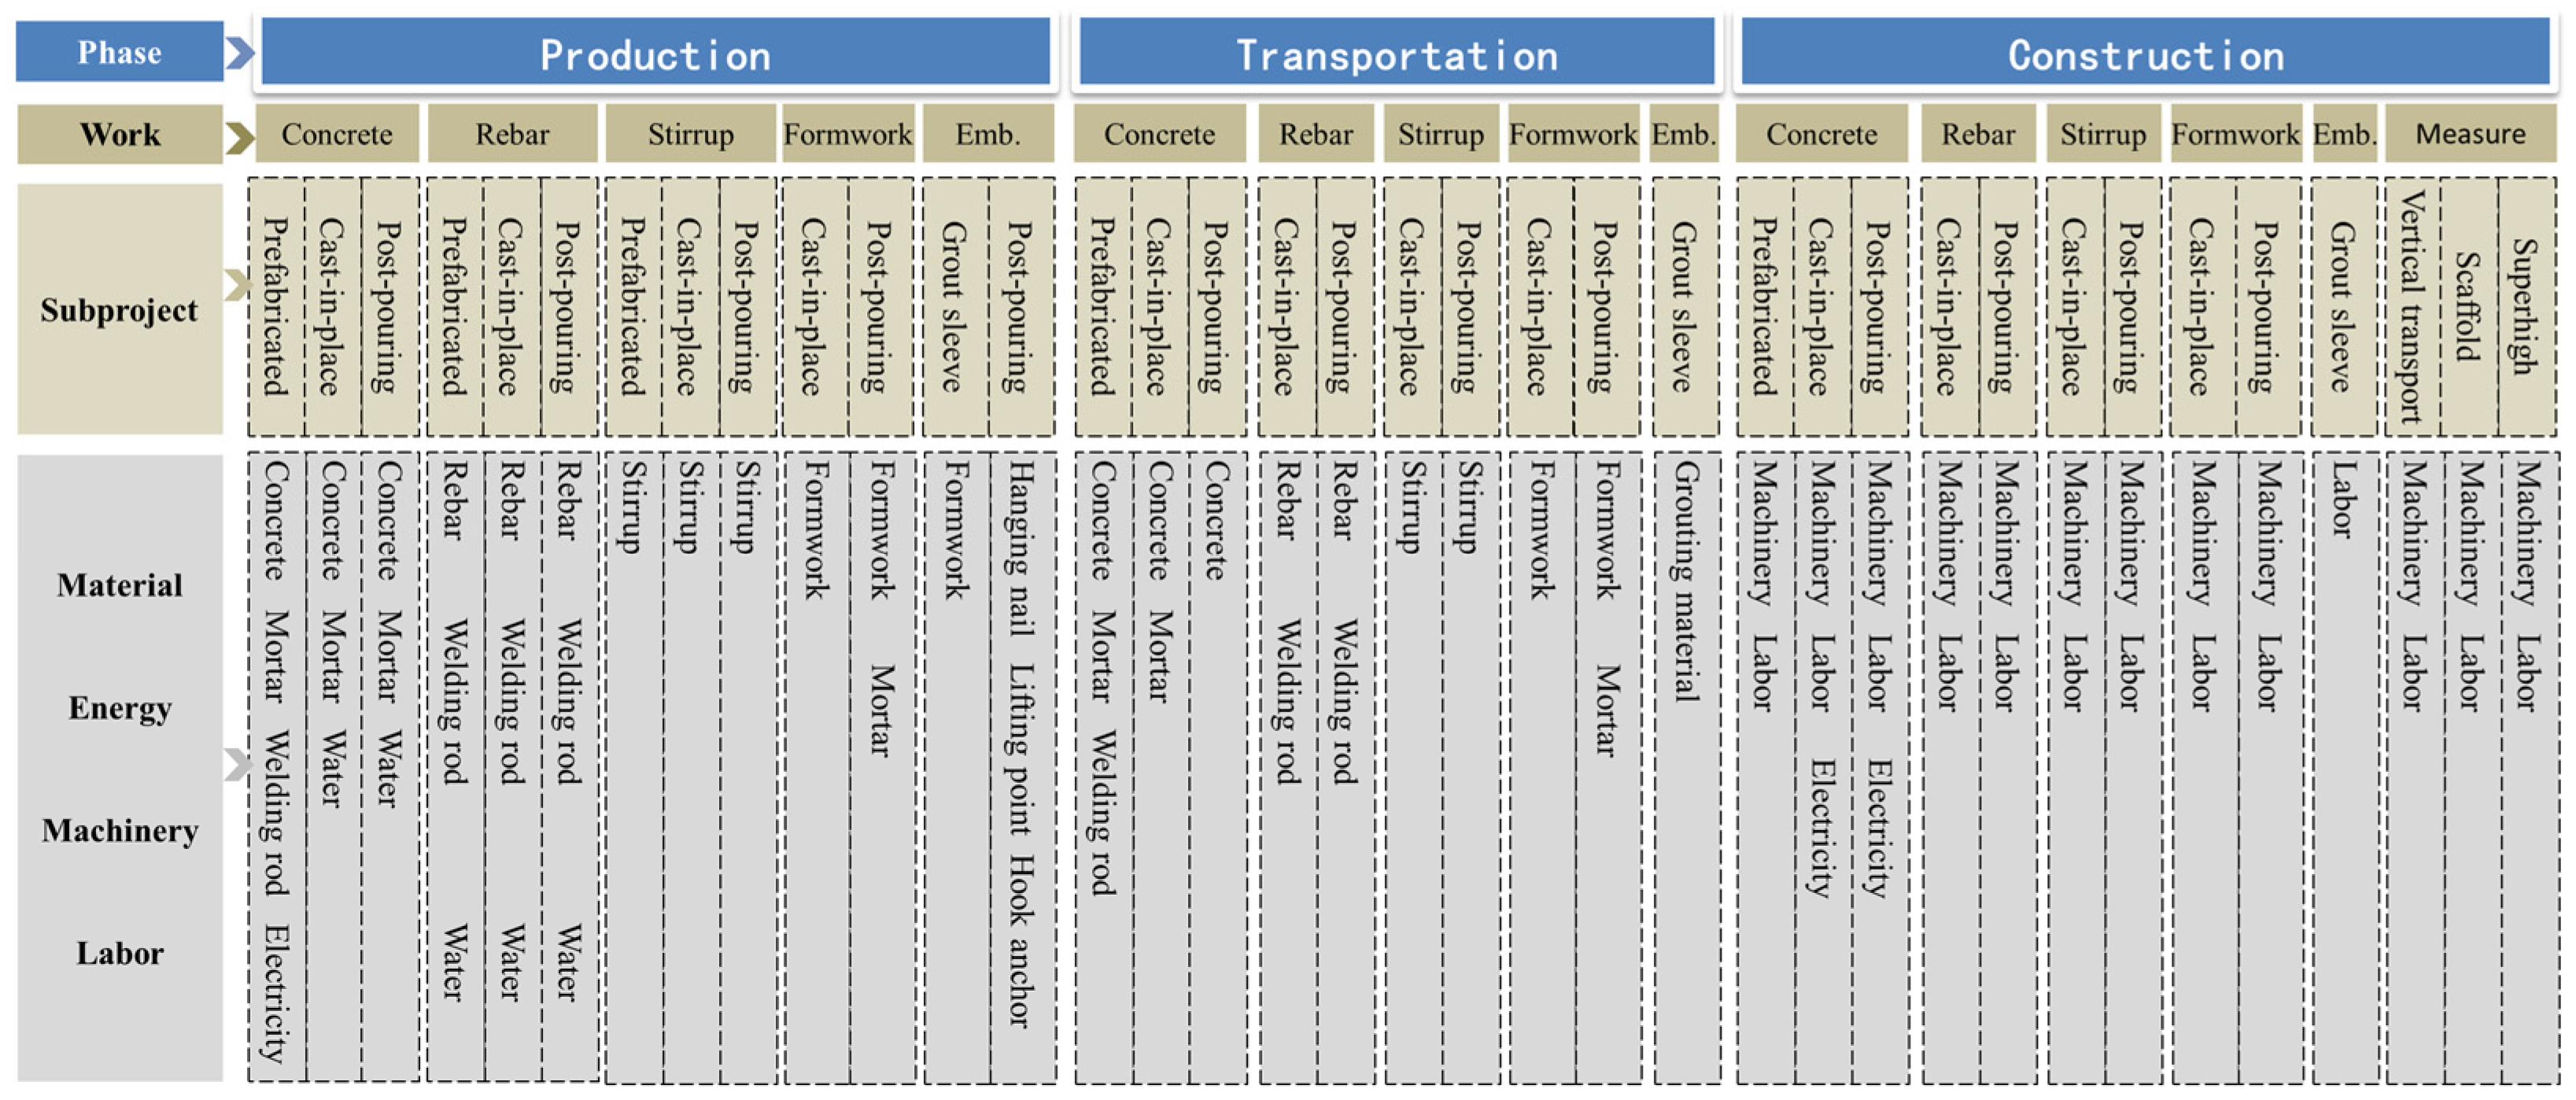
2.2.1. Production Phase

The production phase of prefabricated buildings is a significant source of carbon emissions. It can be divided into two parts: carbon emissions from the extraction and processing of the main raw materials and carbon emissions from the processing of raw materials, such as concrete and rebar, into prefabricated components, along with their energy consumption. On the other hand, cast-in-place construction only includes carbon emissions from the extraction and processing of raw materials. The quantities of each subproject are obtained from the PKPM-PC design software. To calculate the comprehensive carbon emission factor for each subproject in the production phase, the amount of material and energy contained in each subproject is multiplied by the corresponding carbon emission factor, as shown in Equation (3). (The comprehensive carbon emission coefficients of subprojects in the production stage is shown in Table 1). Next, the comprehensive carbon emission factor is multiplied by the amount of work in the corresponding subproject to obtain the carbon emissions of each subproject during the production phase. Finally, the carbon emissions of all subprojects are added together to obtain the total carbon emissions during the production phase, as shown in Equation (4).
E F P , i j = m , e ( E F P , i j m × Q P , i j m + E F P , i j e × Q P , i j e )
E P = i , j ( E F P , i j × Q i j ) / s
where EFP,ijm and EFP,ije represent the carbon emission factor of the m-th material and e-th energy of the j-th subdivisional work of the i-th subproject in the production phase, respectively; and where QP,ijm and QP,ije represent the consumption of the m-th material and e-th energy of the j-th subdivisional work of the i-th subproject in the production phase, respectively.
Emission factors were collected and collated, with preference given to data from “Construction Carbon Emission Calculation (GB/T 51366-2019)” [35]. Missing values were filled in with the average values from relevant literature that conform to Chinese production process regulations. The carbon emission factor of materials that cannot be retrieved can be calculated according to their components. To calculate the carbon emission factor of the grout, the specific gravity of the grout’s constituents and their corresponding carbon emission factors are multiplied and added. For example, suppose the grout’s constituents are cement, sand, and water, with a ratio of 1:1:0.27 [36]. In that case, the carbon emission factor of each constituent is multiplied by its weight and then added together to obtain the carbon emission factor of the grout. The mass of an embedded part can be calculated by multiplying its dimensions and the density of the constituent materials. Once the mass is determined, it can be multiplied by the carbon emission factor of the corresponding material to obtain the carbon emission factor of the individual embedded part. The carbon emission factors of energy and material obtained according to the above principles are shown in Table 2.

2.2.2. Transportation Phase

The carbon emissions of the precast material in the transport phase are generated by the energy consumption of the transport machinery as the prefabricated components are transported from the prefabricated plant to the site. Carbon emissions in the transport phase of cast-in-place or post-cast materials are generated by the energy consumption of the transport vehicle as the materials are transported from the raw material processing plant to the site. To calculate the carbon emissions in the transport phase, the following steps are taken:
  • Allocate appropriate transport vehicles for each material involved in the subproject.
  • Determine the transportation distance of the materials, with an average distance of 50 km for the design area.
  • Estimate the carbon emission per kilometer per unit material based on the transport vehicle capacity and fuel consumption data.
  • Multiply the carbon emission per kilometer per unit material by the corresponding transportation distance, considering the return coefficient of empty car K = 1.67 [42], to obtain the transportation carbon emission factor of each material. The transportation carbon emission factor of each material are shown in Table 3.
  • Multiply and add the carbon emission factors of all materials transportation involved in the subproject with the quantity of materials to obtain the comprehensive emission coefficient of the subproject in the transport phase, as shown in Equation (5) (the comprehensive carbon emission coefficients of subprojects in the transportation stage are shown in Table 1).
  • Multiply and add the comprehensive emission coefficient of all subprojects and the engineering quantity to obtain the final total carbon emissions in the transport phase, as shown in Equation (6).
E F T , i j = m ( E F T , i j m × Q T , i j m )
E T = i , j ( E F T , i j × Q i j ) / s
where EFT,ijk and QT,ijk represent the carbon emission factor and consumption of the m-th material of the j-th subdivisional work of the i-th subproject in the transport phase, respectively.

2.2.3. Construction Phase

During construction, carbon emissions are primarily generated by energy, machine consumption and worker activity. The calculation process involves several steps. First, the machine shift and workdays of each subproject are obtained from quota data. Second, carbon emission factors are collected and calculated for machine shifts and labor. Data from the “Standard for Building Carbon Emission Calculation” [35] is preferred for energy consumption involved. In contrast, data from the “National Unified Construction Machinery Platform and Shift Cost Quota 2017” are adopted for missing values. The carbon emission factors of machinery are shown in Table 4. The carbon emission factor of labor is 6.61 kgCO2-e/work day [12]. Third, the carbon emission factors of all machinery and labor involved in each subproject are multiplied and added to the corresponding quota quantity to obtain the comprehensive emission coefficient of each subproject in the construction phase, as shown in Equation (7) (the comprehensive carbon emission coefficients of subprojects in the construction stage are shown in Table 1). Finally, the comprehensive emission coefficient of all subprojects and the engineering quantity are multiplied and added to obtain the final total carbon emission in the construction phase, as shown in Equation (8).
E F C , i j = e , m _ , l ( E F C , i j e × Q C , i j e + E F C , i j m _ × Q C , i j m _ + E F C , i j l × Q C , i j l )
E C = i , j ( E F C , i j × Q i j ) / s
where EFC,ije, EFC,ijm_, and EFC,ijl represent the carbon emission factor of the e-th energy, m_-th machine, and l-th labor of the j-th subdivisional work of the i-th subproject in the construction phase, respectively; and where QC,ije, QC,ijm_, and QC,ijl represent the consumption of the e-th energy, m_-th machine, and l-th worker activity of the j-th subdivisional work of the i-th subproject in the construction phase, respectively.

3. Results

In order to investigate the reasons behind these emissions, it is essential first to identify the types of prefabricated components used for each assembly rate. For structures with an 80% assembly rate, the prefabricated components include columns, beams, and slabs. In comparison, structures with a 50% assembly rate only use prefabricated beams and slabs. Further details of these combinations can be seen in Table 5. More details of the quantities of each subproject are listed in Appendix A.

3.1. Carbon Emission Results for Each Phase of Materialization

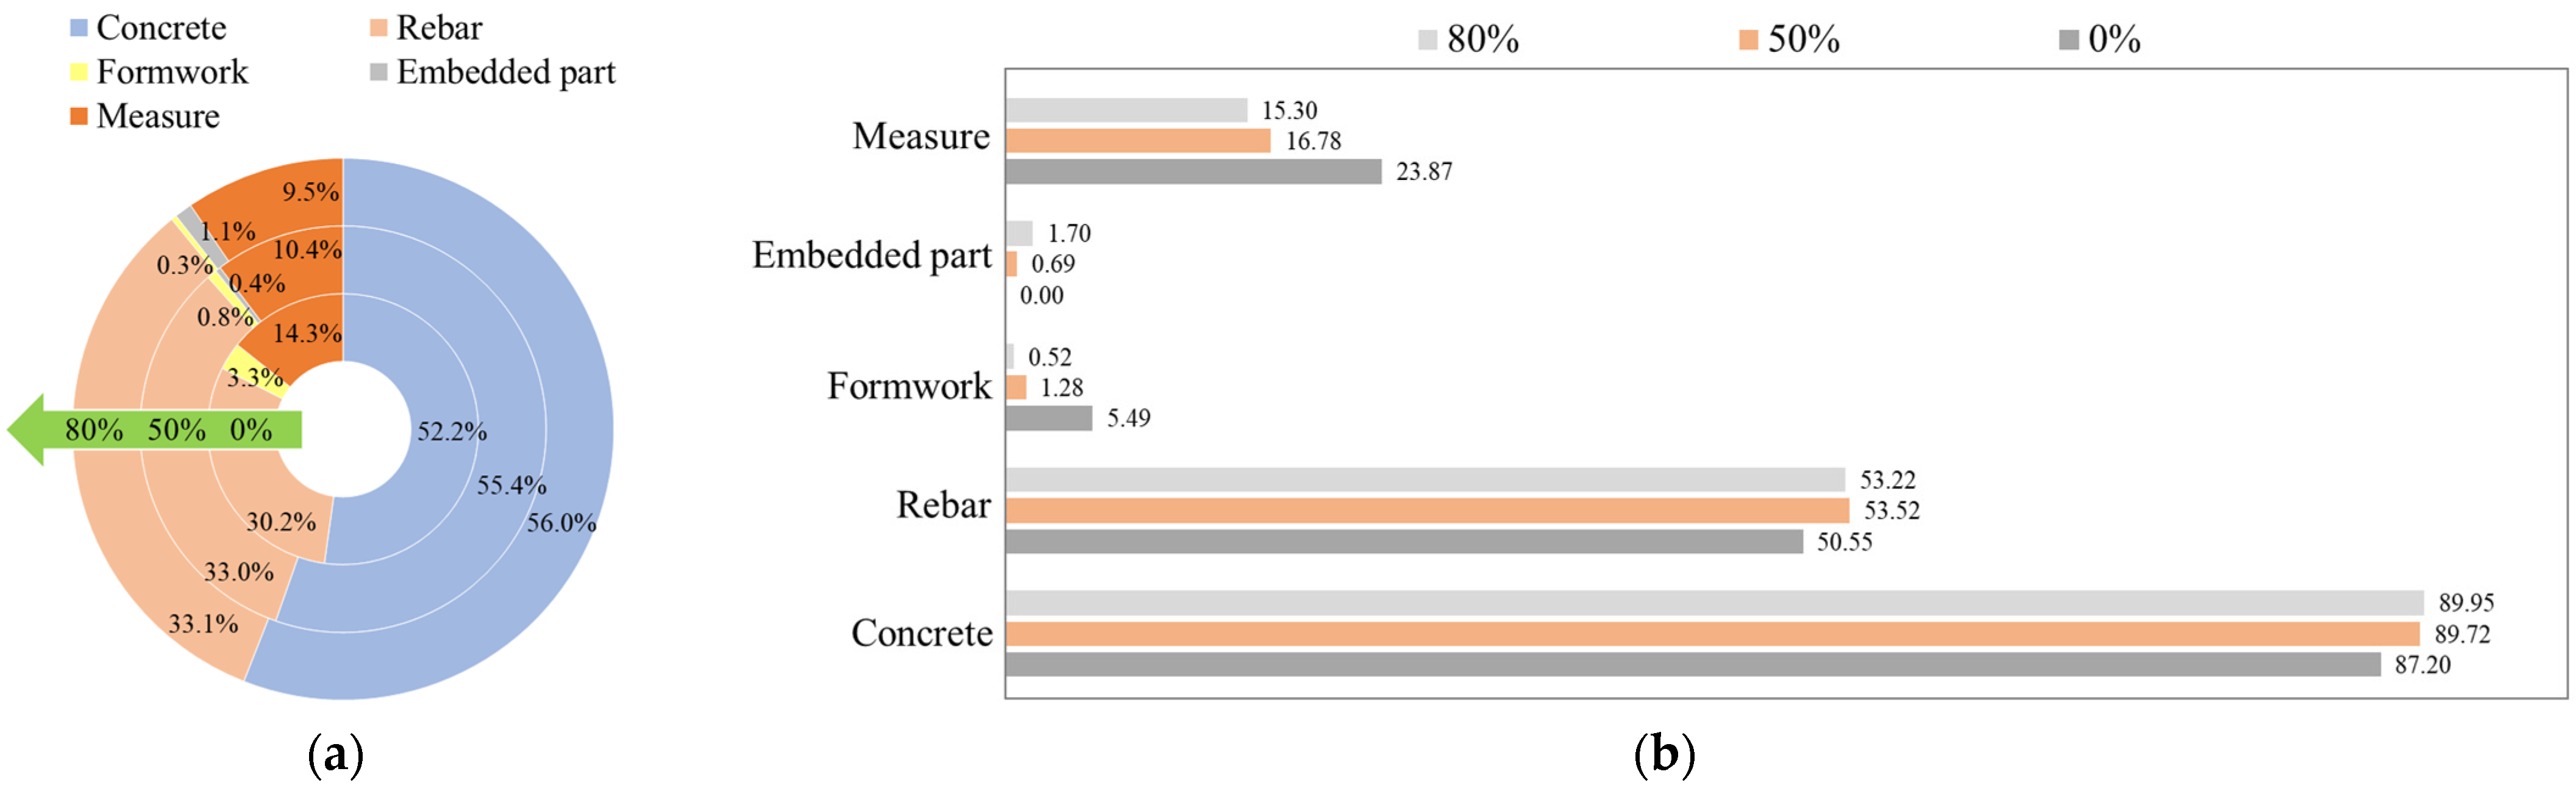
3.1.1. Production Phase

The quota-based carbon emission analysis method allows for a detailed examination of the individual components that contribute to the large carbon emissions in the production phase of prefabricated structures. Table 6 displays the subproject carbon emissions of each component during the production phase. The carbon emissions generated during the production phase of the prefabricated column, beam, and slab members are all higher than those of cast-in-place members. In particular, the difference in emissions is most significant between prefabricated and cast-in-place slabs. This is because precast components are produced in processing plants, and the processing of concrete and steel to form components consumes energy and increases carbon emissions, which is consistent with Table 6 showing that carbon emissions of precast concrete and rebar are greater than those of cast-in-place components. Additionally, using prefabricated components for the demolding and lift embedded parts contributes to higher carbon emissions. The utilization of reinforcement connection sleeves further increases carbon emissions in prefabricated columns compared to cast-in-place columns. Finally, using truss reinforcement in laminated slabs leads to approximately 4.5 kgCO2-e/m2 more carbon emissions than cast-in-place slabs, which is the primary reason why prefabricated slab generate higher carbon emissions during production when compared to cast-in-place slab.
Figure 4 illustrates the relationship between the carbon emissions generated during the production phase of structures and their assembly rates. The findings suggest that prefabricated structures generate higher carbon emissions during production than cast-in-place structures. Specifically, structures with 50% and 80% assembly rates exhibit a 3.6% and 4.3% increase in carbon emissions during production, respectively, compared to cast-in-place structures. The increase in the assembly rate of prefabricated structures has little impact on carbon emissions during the production phase, mainly because the design structure increases the assembly rate by increasing the proportion of prefabricated columns, and the analysis of the components above shows that the increase in carbon emissions from prefabricated columns is small compared to cast-in-place columns. For prefabricated structures with assembly rates of 50% and 80%, the carbon emissions generated by processing energy consumption in the prefabricated components factory are 1.5 kgCO2-e/m2 and 2.0 kgCO2-e/m2, accounting for 1.1% and 1.4% of the total production stage carbon emissions, respectively. Therefore, it can be seen that carbon emissions generated by materials in the production stage are the main contribution. In order to reduce carbon emissions in the production stage, it is key to reduce carbon emissions generated by materials.

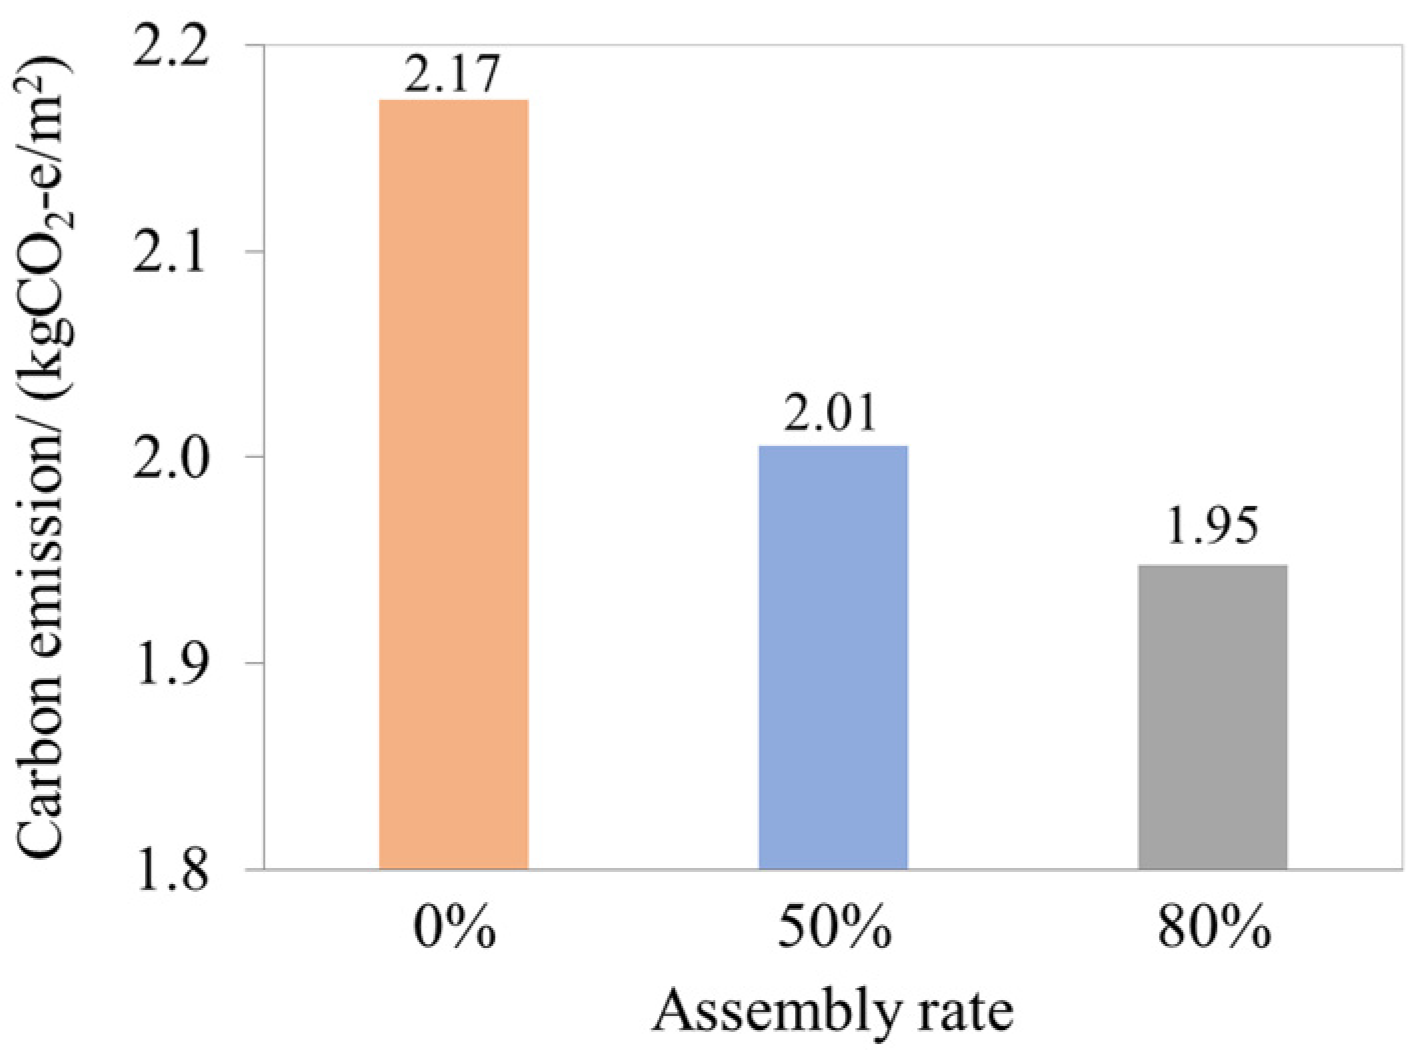
3.1.2. Transportation Phase

Similar to the production phase, individual components that contribute to significant carbon emissions during the transportation phase of prefabricated structures can be examined in detail. Table 7 illustrates that the transportation of prefabricated column, beam, and slab members produces lower carbon emissions than their cast-in-place counterparts. This is due to the greater capacity of the precast trucks compared to the trucks used in cast-in-place concrete. Moreover, the prefabricated rebars in the prefabricated components are transported together to the site without double counting of their carbon emissions, which produces less carbon emissions than the independent transportation of cast-in-place steel bars. In addition, the use of less formwork in prefabricated components also reduces energy consumption during formwork transportation. Both cast-in-place and precast concrete account for more than 96% of the total carbon emissions of each component during the transportation phase, so improvements to precast trucks are expected to significantly reduce carbon emissions during the prefabricated transportation phase, such as the use of clean energy and increased vehicle capacity.
Figure 5 presents the carbon emissions associated with the transportation phase of structures with different assembly rates. The results indicate that the transportation phase of prefabricated structures generates lower carbon emissions than cast-in-place structures. Furthermore, the data shows that structures with 50% and 80% assembly rates exhibit a 7.4% and 10.1% decrease in carbon emissions during transportation, respectively, compared to cast-in-place structures. The increase in the assembly rate from 50% to 80% was achieved by adding precast columns, which have a smaller concrete volume than slabs and beams. From the above analysis, it can be seen that the carbon emission of precast components in the transportation stage is smaller than that of cast-in-place structures, which is mainly caused by concrete engineering. Therefore, increasing the assembly rate by adding precast columns has no obvious effect on improving the carbon emission reduction ability of prefabricated structures in the construction stage.

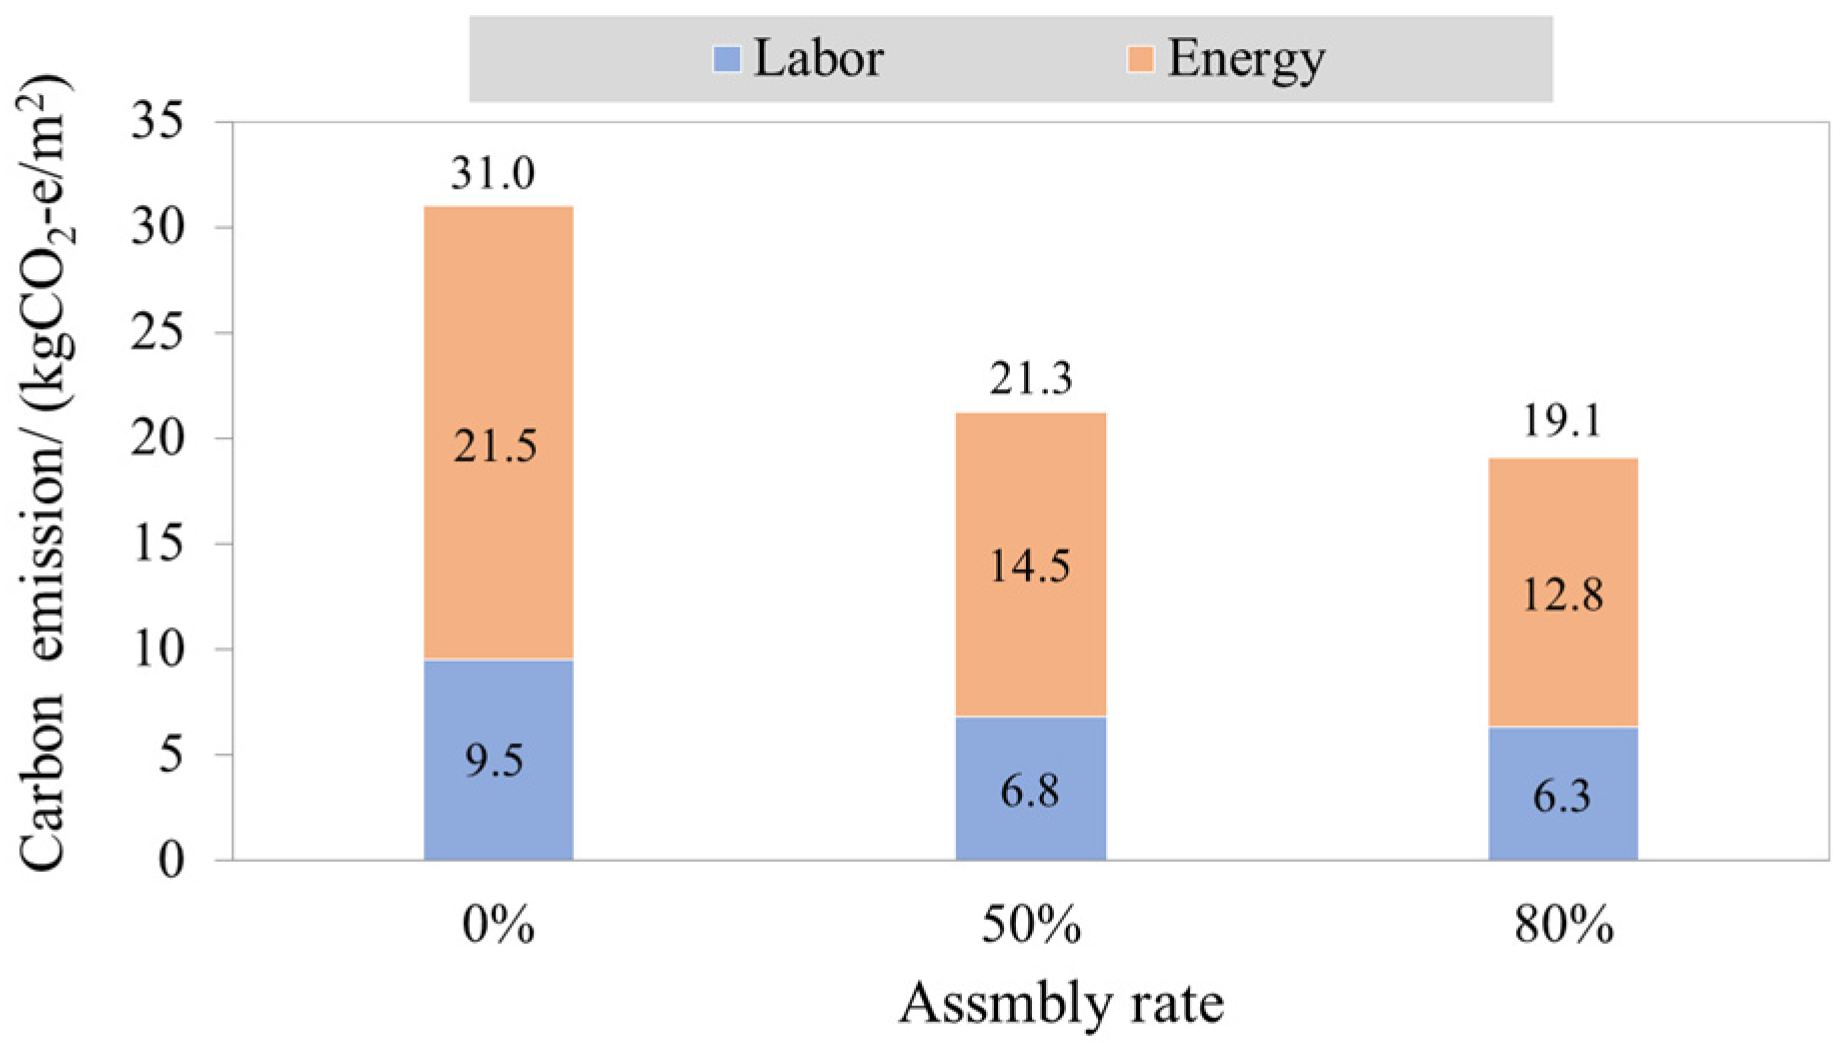
3.1.3. Construction Phase

The carbon emission sources in the construction phase have been introduced, which are labor, energy, and machinery, respectively. Since carbon emissions from mechanical construction are generated by energy consumption, the sources are redivided into labor and energy in the construction phase, as shown in Figure 6. The results show that the higher the assembly rate, the lower the carbon emissions during construction. Specifically, prefabricated structures with 50% and 80% assembly rates produce 31.3% and 38.4% lower carbon emissions than cast-in-place structures, respectively. The lower energy consumption of construction machinery is the primary reason for the reduced carbon emissions during the construction phase of prefabricated structures, accounting for approximately 68% of the total carbon emissions. Moreover, reduced labor is another factor contributing to the lower carbon emissions during the construction phase, accounting for about 32% of the total carbon emissions. In this paper, the assembly rate was increased from 50% to 80% by adding prefabricated columns, which are more difficult to construct than prefabricated slabs and beams and require more labor and mechanical energy consumption. Therefore, the improvement of assembly rate has no obvious effect on the improvement of carbon emission reduction ability in the construction stage of prefabricated structures.
The causes of the relatively low carbon emissions in the construction phase of prefabricated structures are examined at the sub-project level. The analysis presented in Table 8 highlights that vertical transportation is the primary factor contributing to reducing carbon emissions. Prefabricated rebars for prefabricated structures are already processed in prefabricated processing plants, while operations such as welding for cast-in-place structures at the construction site increase energy and labor to produce more carbon emissions. Moreover, the prefabricated structure requires less formwork, leading to a decrease in the amount of labor and machinery required to support the formwork. However, the concrete work required for the prefabricated structure is higher than that for cast-in-place structures due to the adoption of a prefabricated monolithic construction mode of wet connection in this study. This leads to a greater amount of labor required for the installation of prefabricated components and post-cast concrete construction, resulting in an increase in carbon emissions from the concrete works of prefabricated structures relative to cast-in-place structures.

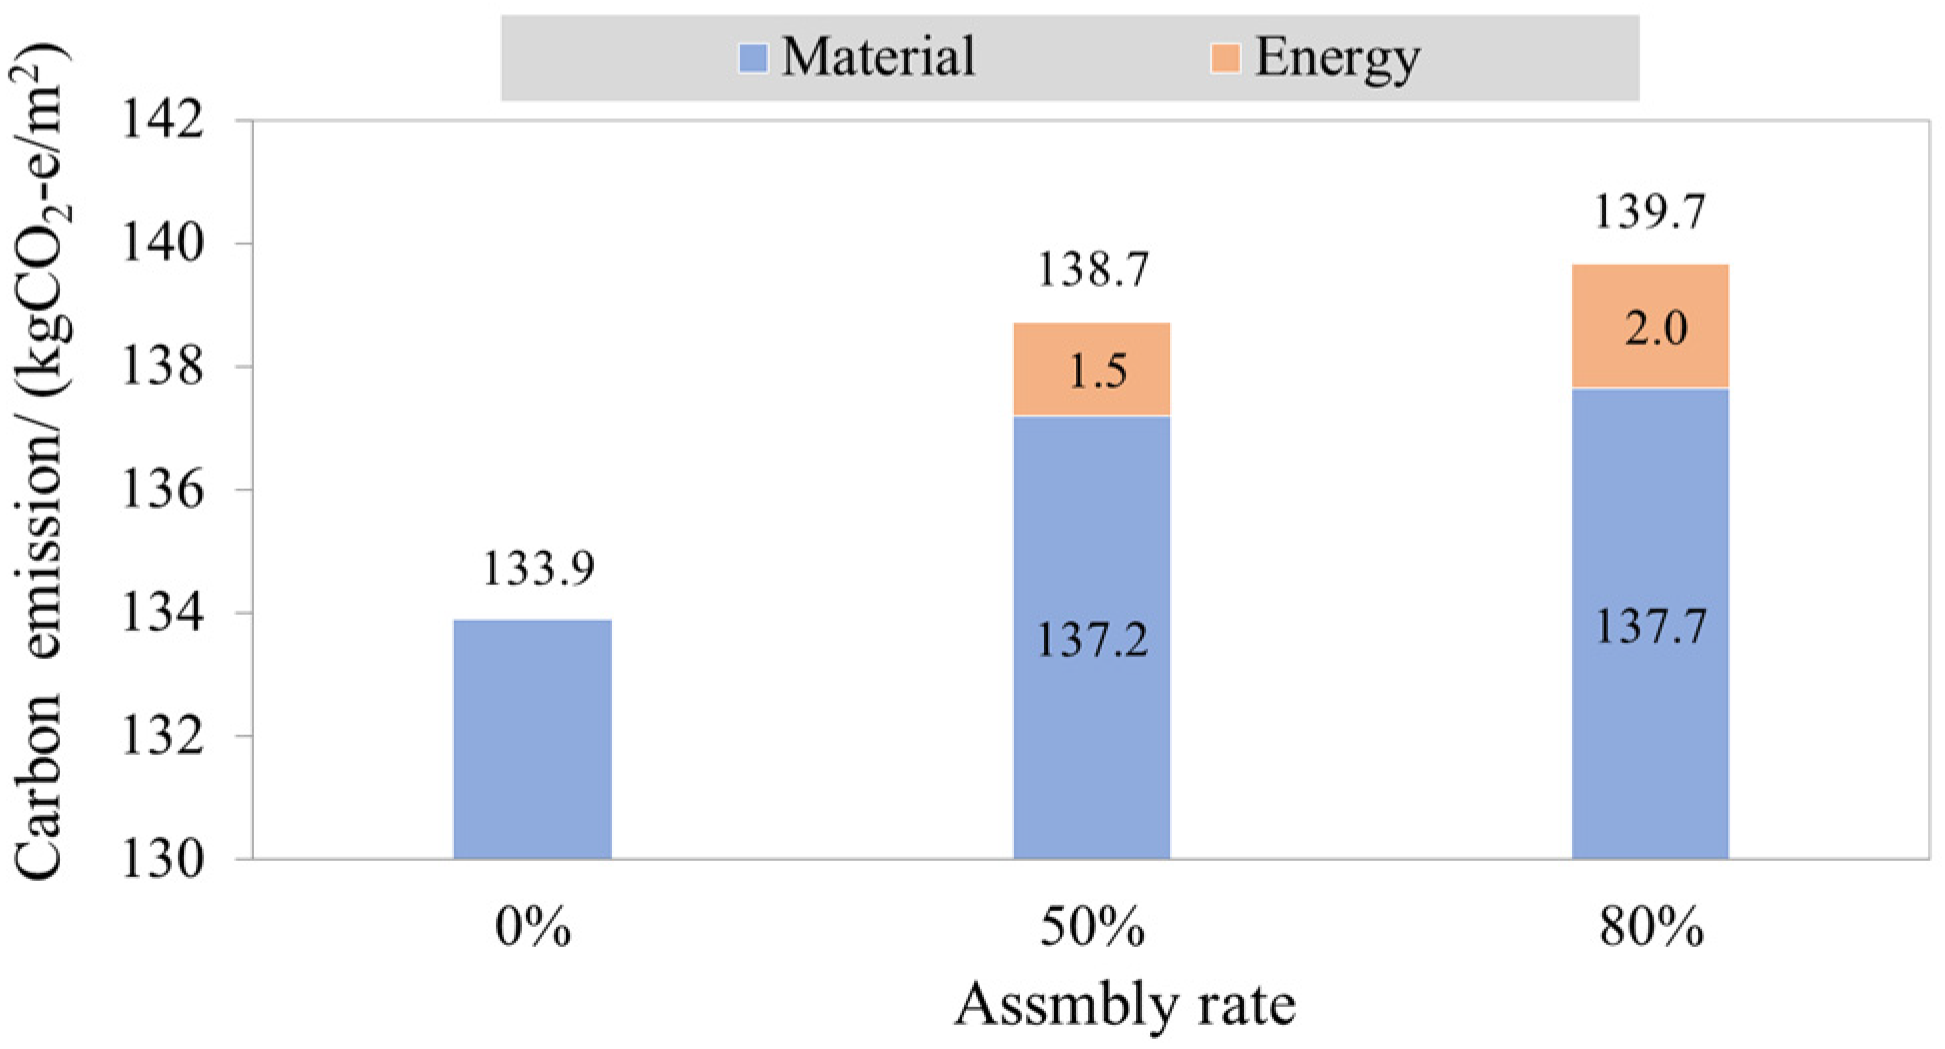
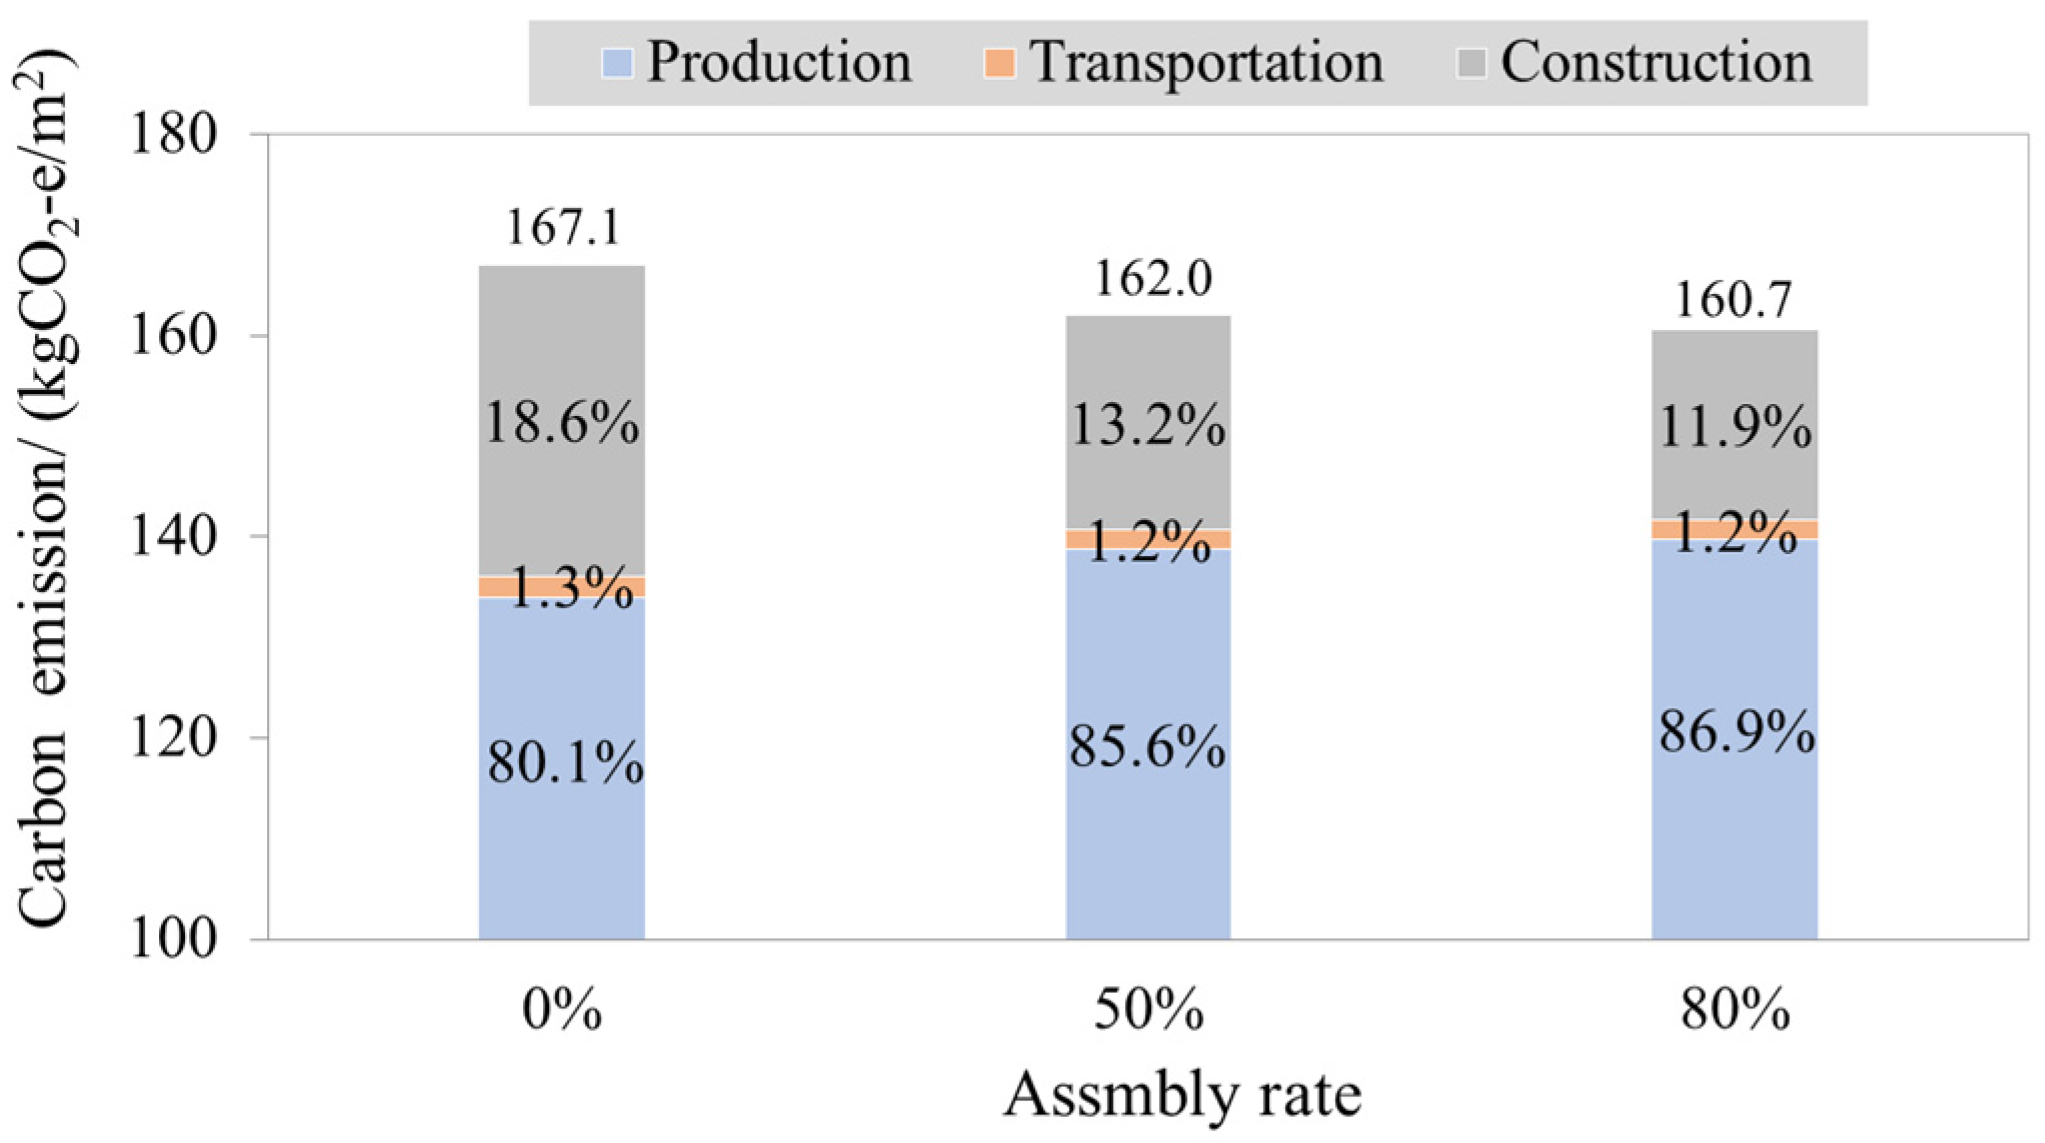
3.1.4. Overall Materialization Phase

Figure 7 presents the overall carbon emissions during the materialization phase, which show a slight decrease in emissions with an increase in assembly rate. The reduction in emissions is modest, with a 3.1% decrease observed for the 50% assembly rate structure and a 3.8% decrease observed for the 80% assembly rate structure. These results indicate increasing the assembly rate does not significantly improve the carbon emission reduction ability during the materialization phase of the prefabricated structure. The production phase always has the highest carbon emissions for both cast-in-place and prefabricated structures, accounting for more than 80% of the total emissions. As the assembly rate increases, the proportion of carbon emissions in the production phase increases from 80.1% to 86.9%. The transportation phase shows a slight decrease in carbon emissions proportion from 1.3% to 1.2% on average, while the construction phase exhibits a reduction from 18.6% to 11.9% on average. Hence, to optimize the construction process of prefabricated structures, the most potential for emission reduction lies in the production phase.
Continuing the analysis of subprojects’ carbon emissions in the materialization phase, Figure 8a (ordered from the inner to outer circle by increasing assembly rate) shows that there are differences in the proportion of subproject of prefabricated structures and cast-in-place structures, but the specific assembly rate of prefabricated structures has little influence on the proportion. The primary driver of carbon emissions is concrete works, accounting for approximately 52–56%. Rebar works account for about 30–33%, followed by measure works, accounting for about 10–14%. The proportion of formwork and embedded works for prefabricated structures is less than 1%, while the proportion of formwork for cast-in-place structures is around 3%. Figure 8b illustrates that, as the assembly rate increases, the carbon emissions of formwork and measure work decrease, while the carbon emissions of embedded parts increase. Additionally, the carbon emissions of concrete and reinforcement in prefabricated structures are significantly higher than those in cast-in-place structures. Still, their impact on specific assembly rates (50% and 80%) is minimal. As previously analyzed, higher concrete carbon emissions in prefabricated structures are mainly due to energy consumption during prefabricated component processing, installation of prefabricated components during construction, and higher post-cast concrete labor. Higher carbon emissions from reinforcement in prefabricated structures are due to the setting of laminated slab truss reinforcement during the production phase. To enhance the carbon reduction capacity of prefabricated structures based on a wet-connected assembly monolithic construction mode, adopting the all-precast dry connection method is recommended, as it would reduce carbon emissions from post-concrete labor. Moreover, developing and enhancing laminated slab forms could significantly enhance the carbon reduction potential of prefabricated structures.

4. Discussion

4.1. Calculate Parameter Sensitivity Analysis

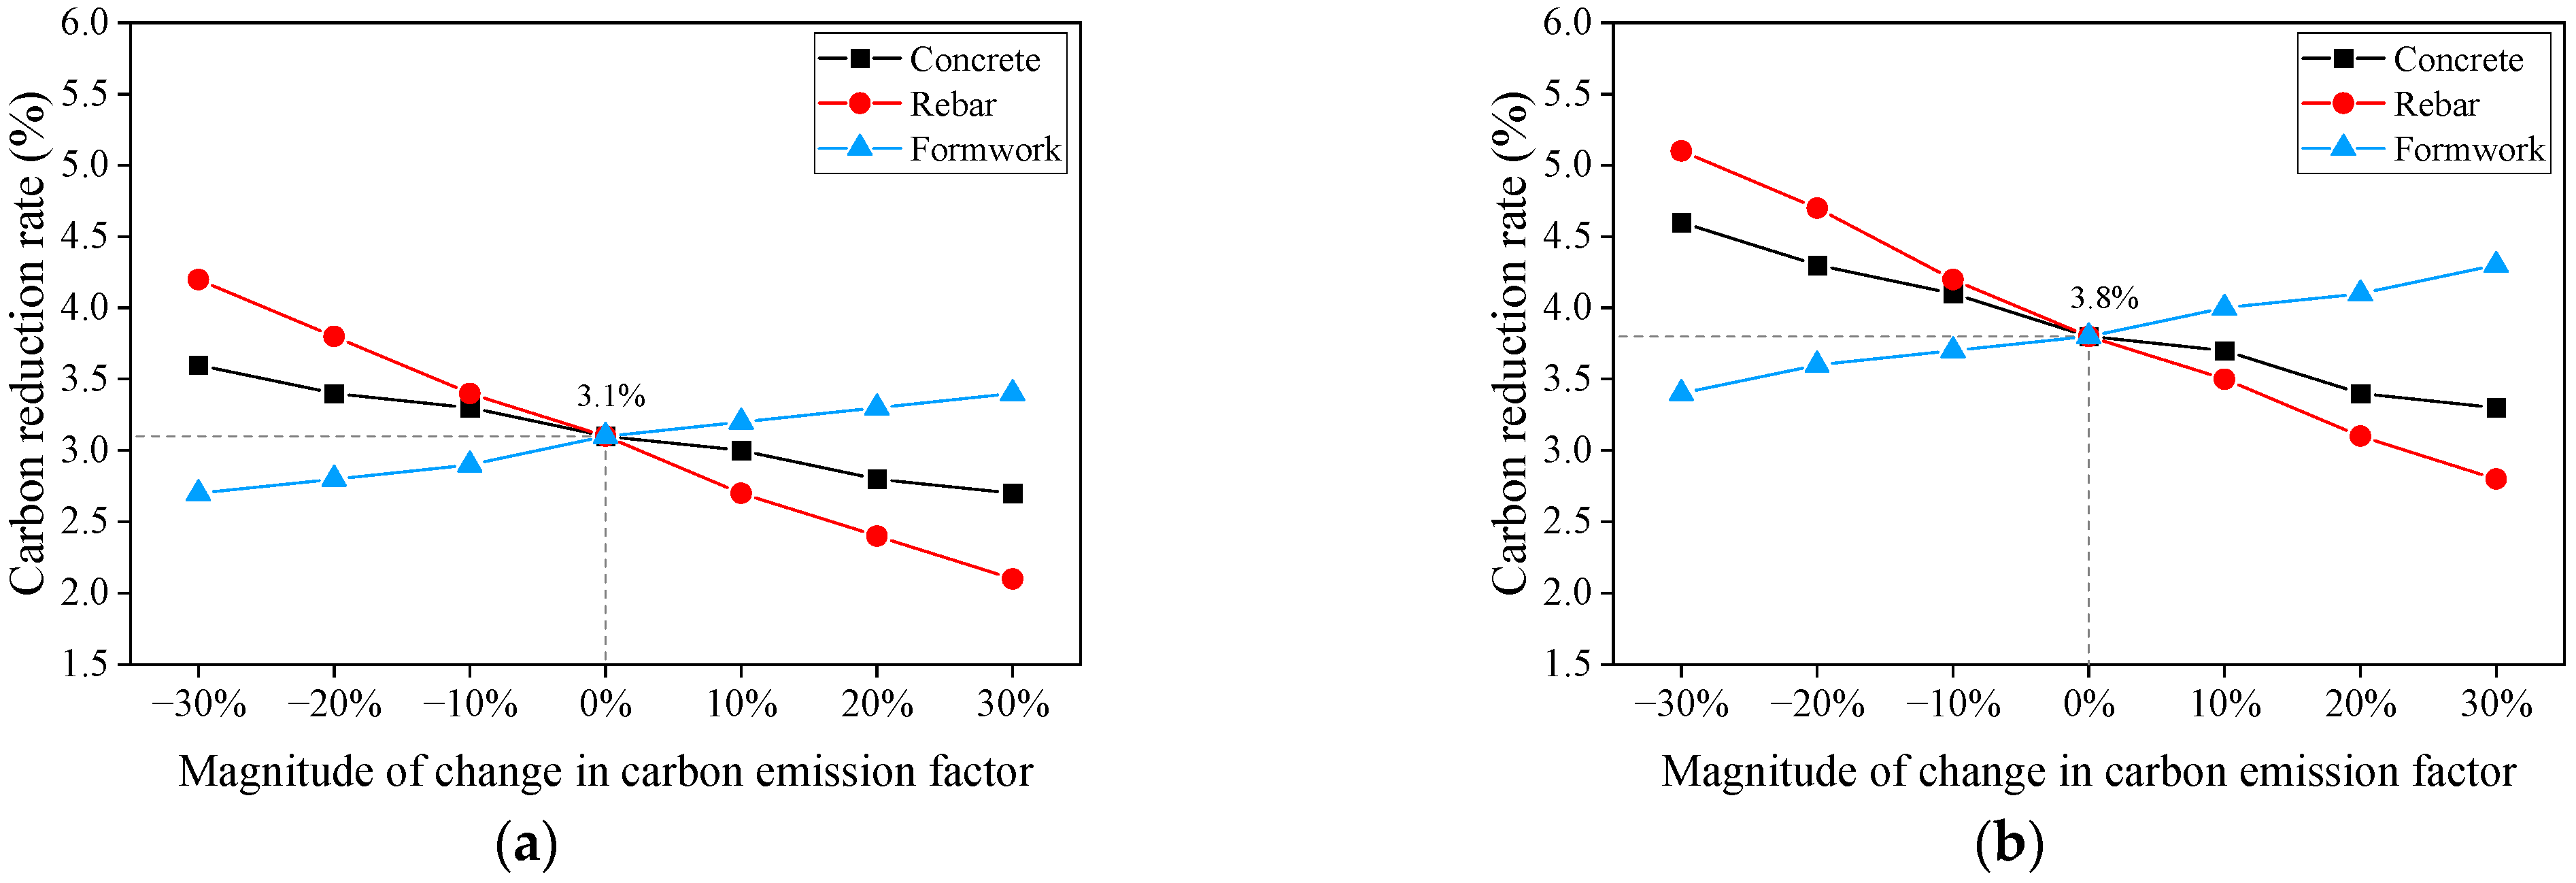
4.1.1. Material Carbon Emission Factor Sensitivity Analysis

The above analysis shows that the production stage is the main contributor to the carbon emission of the structure, and the material in it is the main contributor to the carbon emission of the production stage. To enable designers to take targeted emission reduction measures, sensitivity analysis was performed by changing the carbon emission factors of concrete, reinforcement, and formwork by ±10%, ±20%, and ±30%, and analyzing their impact on the carbon emissions of the prefabricated structures in the materialization phase, as shown in Figure 9 (Values of ±10%, ±20%, and ±30% represent low, medium, and high scenario of uncertainty, as in Ebrahimi’s view [43]). The results show that the sensitivity of the carbon emission reduction capacity of prefabricated structures with different assembly rates to carbon emission factors of various materials tends to be consistent. The carbon reduction rate of prefabricated structures decreases as the carbon emission factors of concrete and reinforcement increase, but the effect on formwork is opposite. This is mainly because with the increase in the carbon emission factor of materials, carbon emissions of cast-in-place and prefabricated structures increase simultaneously, and the gap between them is almost stable. The carbon emission of concrete and rebar engineering of prefabricated structures is greater than that of cast-in-place structures, that is, the molecular value used to calculate the carbon reduction rate of prefabricated structures is always positive. On the contrary, the carbon emission of formwork of prefabricated structures is less than that of cast-in-place structures, that is, the molecular value used to calculate the carbon reduction rate of prefabricated structures is always negative. The denominator of the calculation of emission reduction rate is a positive value that increases with the carbon emission factor of materials. Therefore, compared with the carbon emission factor of rebar and concrete, the carbon emission factor of formwork has opposite results on the carbon emission reduction ability of prefabricated structures. Note that although the increase in the carbon emission factor of the formwork can increase the carbon emission reduction capacity of the prefabricated structure, it does not mean that the carbon emission of the prefabricated structure can be reduced through this measure, but it has an impact on the reliability of the calculated carbon emission reduction rate.
In addition, this section only analyses the sensitivity of individual variables; the combined effect of inconsistent values of carbon emission factors for multiple materials used in calculations by different scholars can exacerbate the scattered results of carbon reduction rate calculations for assembled structures.

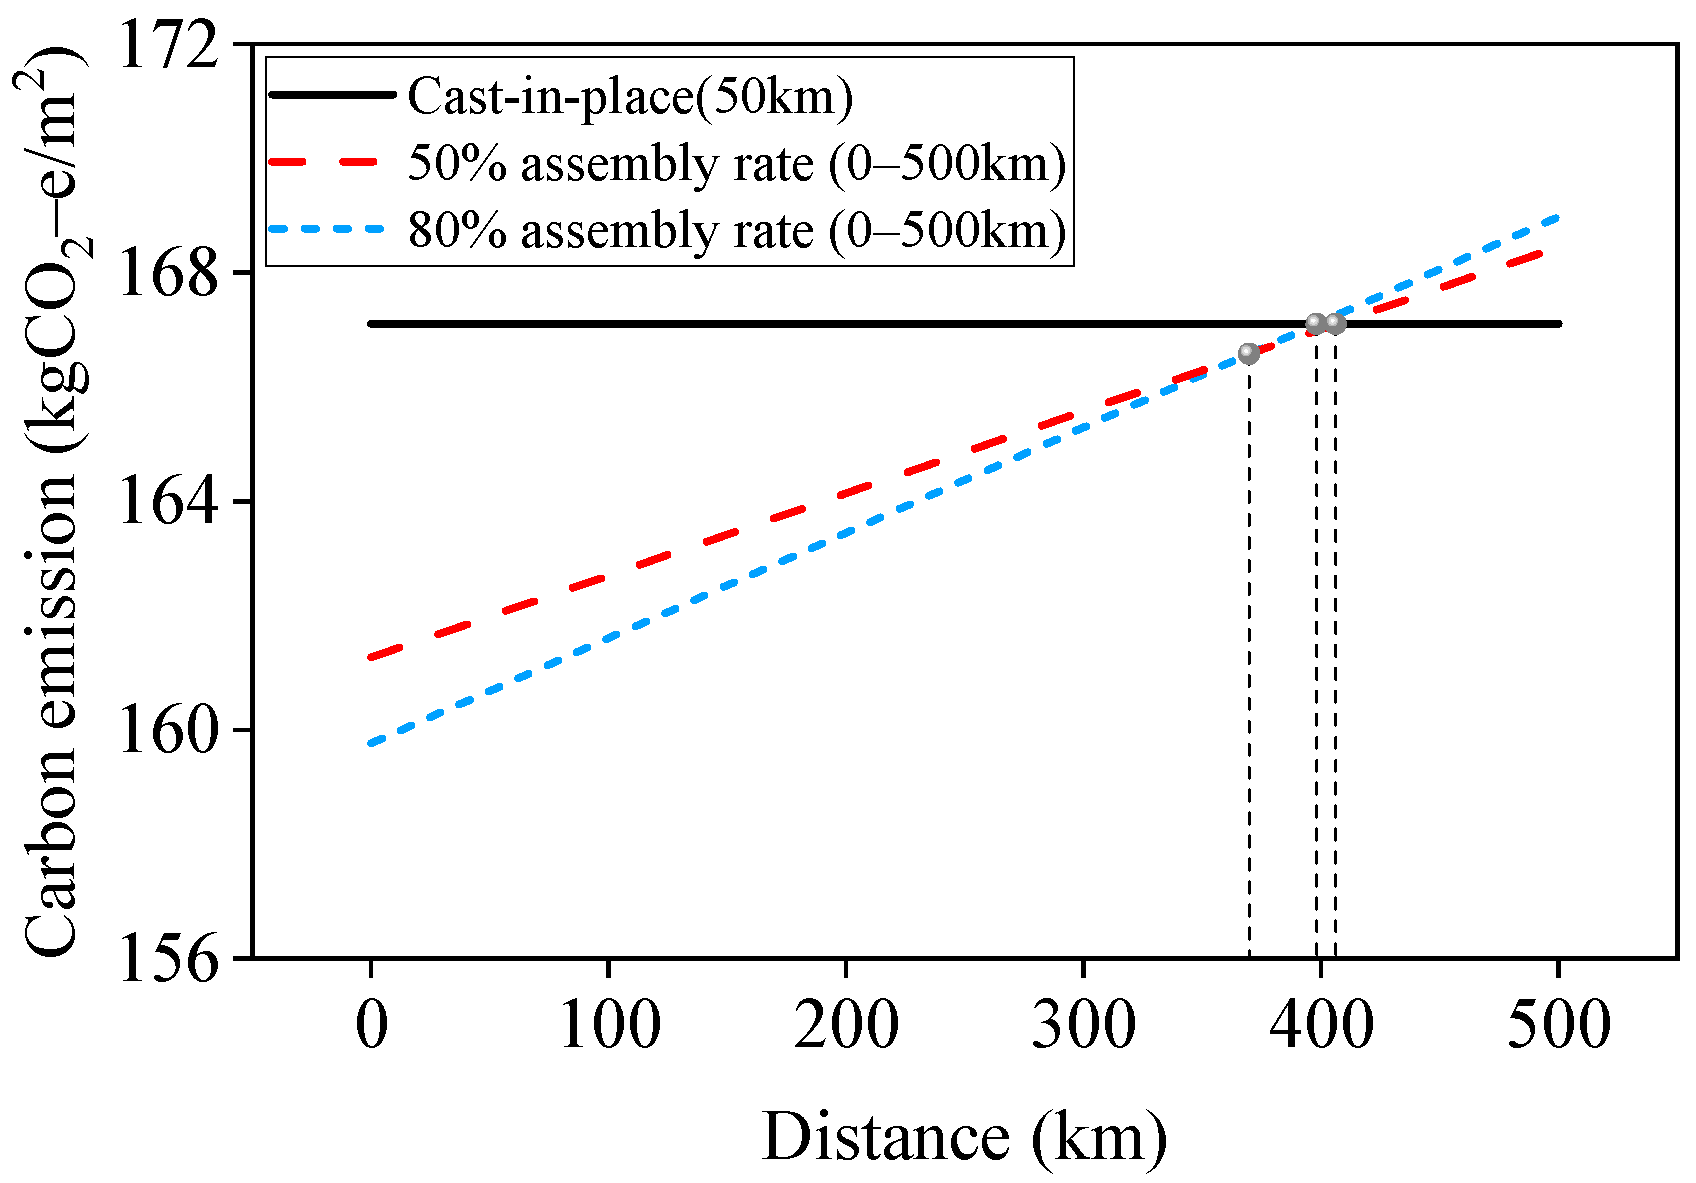
4.1.2. Material Transportation Distance Sensitivity Analysis

The preceding analysis assumed a fixed transportation distance of 50 km for prefabricated components. However, due to the uneven distribution of prefabricated component factories across different regions, we varied the transportation distance from 0 km to 500 km to assess its impact on the carbon reduction potential of prefabricated structures. Figure 10 displays the sensitivity results of transportation distance on the carbon emissions of prefabricated structures, revealing that carbon emissions increased as transportation distance increased. Notably, when the transportation distance of prefabricated components was 370 km, the carbon emissions of the structure with an 80% assembly rate surpassed that of the structure with a 50% assembly rate. Furthermore, at a transportation distance of 398 km, the carbon emissions of the structure with an 80% assembly rate exceeded those of the cast-in-place structure. At a transportation distance of 406 km, the carbon emissions of the structure with a 50% assembly rate were higher than those of the cast-in-place structure. This suggests that designers must consider the location of prefabricated component factories and the distance between the construction site and these factories when selecting prefabricated structures. It may be more beneficial to use prefabricated structures in regions where prefabricated component factories are located nearby. Cast-in-place structures may be a better option for regions with excessive transportation distances. In a related study, Wang [18] analyzed the carbon emissions of a 6-story frame structure and found that when the relative transportation distance ratio of prefabricated components and cast-in-place materials exceeded nine times, structures with high prefabrication rates led to increased carbon emissions. This result is consistent with our findings.
Although transportation emissions account for only approximately 1% of total carbon emissions during the materialization phase, the transportation distance can significantly affect results when comparing optimal structural choice and should not be overlooked.

4.2. Sensitivity Analysis of Design Parameters

For prefabricated concrete structures, different structural design parameters affect the amount of work for each subproject. Qualitative or quantitative portrayal of these effects is necessary for carbon emission-based structure comparison. Based on this, the previous paper discusses the sensitivity of carbon emission reduction capability of prefabricated structures to design parameters for a frame structure with 80% assembly rate.

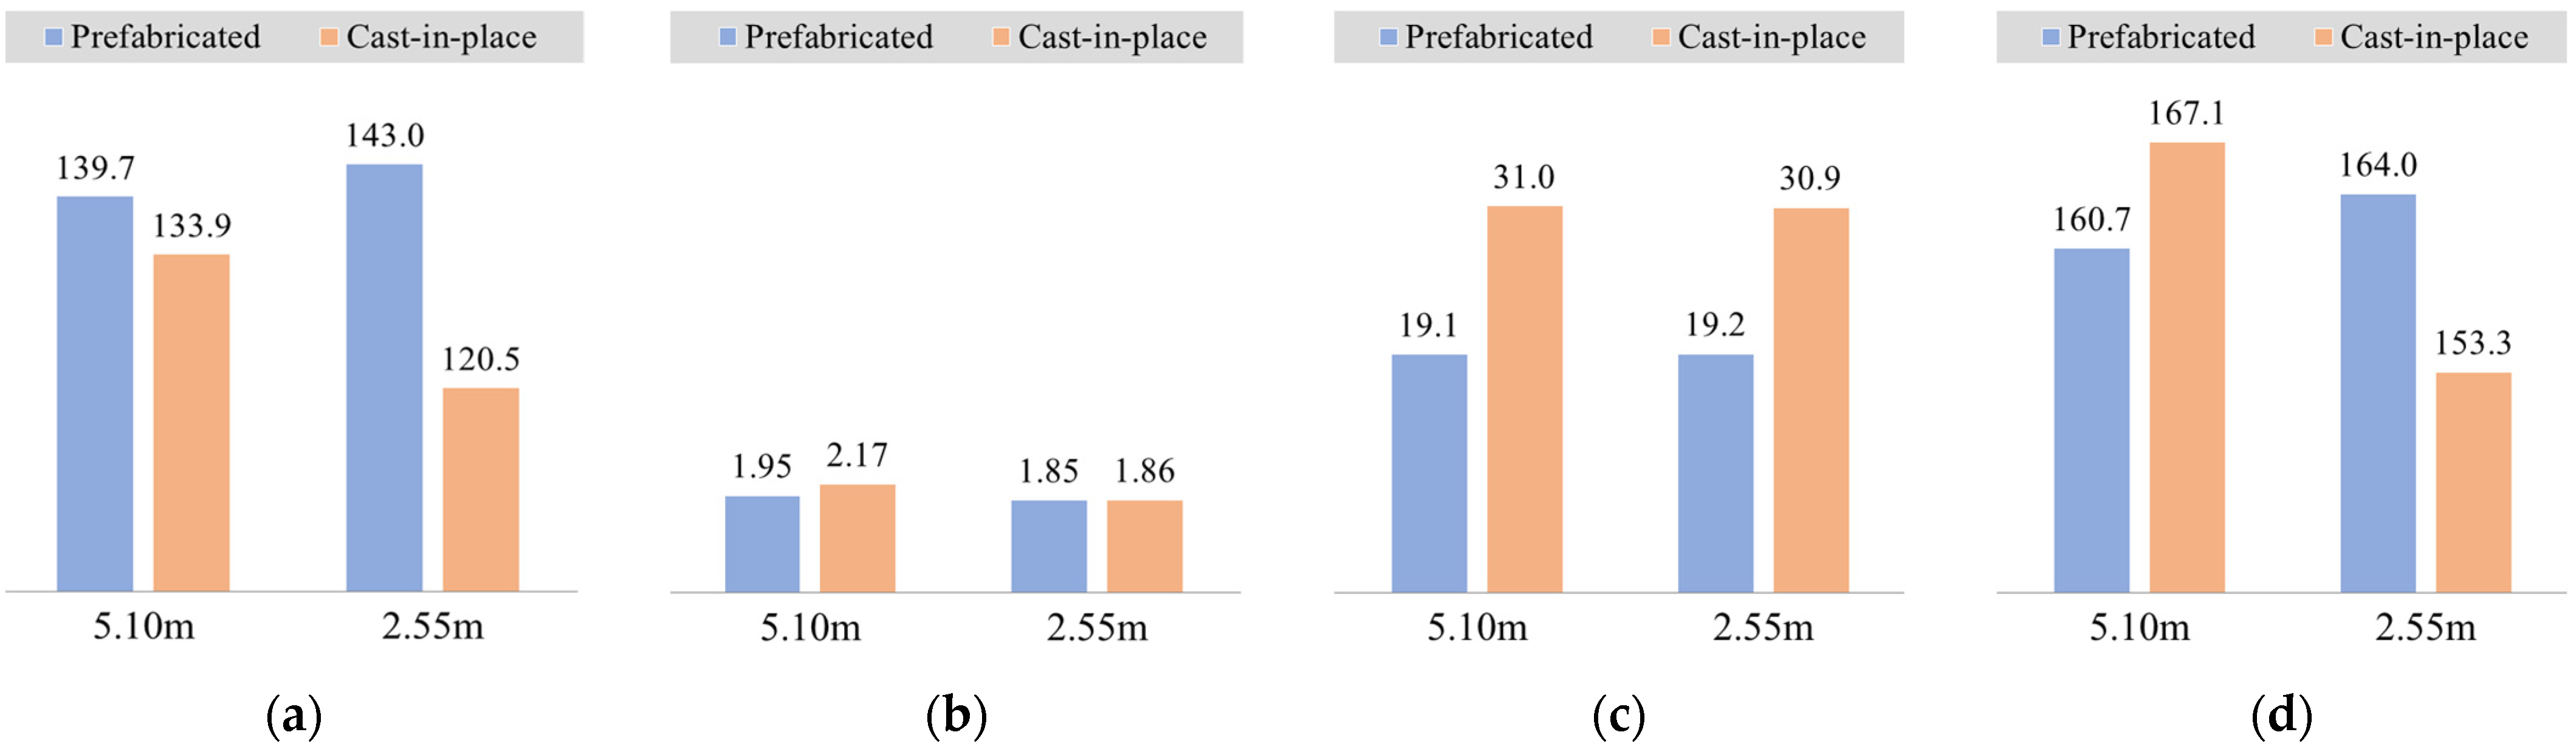
4.2.1. Slab Span Sensitivity Analysis

The minimum slab thickness requirements for cast-in-place and laminated slabs differ, with a minimum thickness of 100 mm for cast-in-place slabs and 130 mm for laminated slabs. Laminated slabs can be designed based on the thickness and reinforcement of cast-in-place slabs. When conducting carbon emission comparison studies of cast-in-place and prefabricated structures, previous research has typically selected larger slab spans (as with the 5.1 m slab span structure used in the previous analysis), resulting in identical slab thickness and concrete volume for cast-in-place and laminated slabs. However, for smaller spans, the relative concrete volume of the slab changes due to the difference in minimum thickness requirements between cast-in-place and laminated slabs. Unfortunately, existing studies have not quantitatively analyzed the impact of slab span changes on carbon emissions. Therefore, in this study, we investigate the effect of halving the slab span (to 2.55 m) by adding secondary beams on the carbon emission reduction capacity of prefabricated structures.
Figure 11 presents the sensitivity results of carbon emissions for each phase of materialization with respect to slab span. Figure 11a specifically illustrates the sensitivity results of the production phase to slab span. As depicted, the carbon emission of prefabricated structure increases with the reduction in slab span, because the thickness of composite slabs decreases from 150 mm to 130 mm with the addition of secondary beams. The carbon emission reduction caused by the reduction in the concrete volume of composite slabs is less than the increment of carbon emission caused by the increase in concrete volume and reinforcement quantity caused by the increase in secondary beams. The carbon emission of the prefabricated structure with a 2.55 m slab span is 2.3% higher than that of the prefabricated structure with a 5.1 m slab span. In contrast, the reduction in slab span reduces the carbon emission of the cast-in-place structure because the thickness of cast-in-place slabs decreases from 150 mm to 100 mm with the addition of secondary beams. The reduction in carbon emission caused by the reduction in concrete volume of cast-in-place slabs is far less than the increment of carbon emission caused by the increase in concrete volume and reinforcement quantity caused by the increase in secondary beams. The carbon emission of the cast-in-place structure with a 2.55 m slab span is 10.0% lower than that of the cast-in-place structure with a 5.1 m slab span. Additionally, the carbon emission reduction rate of the prefabricated structure with a 5.1 m slab span is −4.3%, while that of the prefabricated structure with a 2.55 m slab span is −18.6%. These findings indicate that the carbon emission reduction rate of the production phase of small-span prefabricated structures is lower.
The sensitivity results of the transport phase structure to slab span are illustrated in Figure 11b. It is evident that both the cast-in-place and prefabricated structures with a 2.55 m slab span exhibit smaller carbon emissions compared to those with a 5.1 m slab span, with reductions of 14.3% and 5.1%, respectively. As can be seen from the previous analysis of the transport phase of the structure, the energy consumed in transporting the concrete is the main source of carbon emissions during the transport phase. The reduction in slab span results in a smaller concrete volume for both cast-in-place and assembled structures, with a greater reduction in concrete volume due to the thinner cast-in-place slab thickness, resulting in a greater reduction in carbon emissions from the final slab span for cast-in-place structures. The carbon emission reduction rate for the prefabricated structure with a 5.1 m slab span is 10.1%, while that for the prefabricated structure with a 2.55 m slab span is merely 0.4%. This implies that the carbon reduction rate of the transportation phase for small slab span prefabricated structures is comparatively lower.
The sensitivity results of the construction phase structure to the slab span are presented in Figure 11c. It is observed that the carbon emissions of the prefabricated structure with a 2.55 m slab span are slightly higher than those of the prefabricated structure with a 5.1 m slab span, with an increase of 0.3%. On the other hand, the carbon emissions of the cast-in-place structure with a 2.55 m slab span are lower than those of the cast-in-place structure with a 5.1 m slab span, with a reduction of 0.4%, indicating a minor impact. From the previous analysis, it is clear that carbon emissions due to measure works are the main source of carbon emissions during the construction phase and are the most significant difference in carbon emissions between cast-in-place and assembled structures. As the measure works are mainly related to the area and construction duration of the building, which in turn is related to the floor area and assembly rate, the change in slab span has no effect on the carbon emissions from the measure works, thus making the carbon emissions from the construction phase of cast-in-place and assembled structures less sensitive to the slab span. The carbon emission reduction rate of the prefabricated structure with a 5.1 m slab span is 38.4%, while the carbon emission reduction rate of the prefabricated structure with a 2.55 m slab span is 38.0%. Thus, the carbon reduction rate of the construction phase of the small slab span prefabricated structure is lower, but the reduction rate is only slightly lower.
The sensitivity analysis of the overall materialization phase structure to the slab span is presented in Figure 11d. The results show that the carbon emissions of the prefabricated structure with a 2.55 m slab span are greater than the prefabricated structure with a 5.1 m slab span, with an increase of 2.0%. On the other hand, the carbon emissions of the cast-in-place structure with a 2.55 m slab span are smaller than that of a 5.1 m slab span, with a reduction of 8.3%. The carbon emission reduction rate of the 5.1 m slab span prefabricated structure is 3.8%, while the carbon emission reduction rate of the 2.55 m slab span prefabricated structure is −7.0%. Therefore, the carbon reduction rate of the total materialization phase of the prefabricated structure with a small slab span is about 10.8% lower, indicating that smaller slab spans increase carbon emissions instead of reducing them.
It is suggested that cast-in-place structures can reduce carbon emissions by increasing secondary beams to lower the slab thickness, and the effect is significant. However, this approach does not apply to prefabricated structures due to minimum slab thickness limitations.

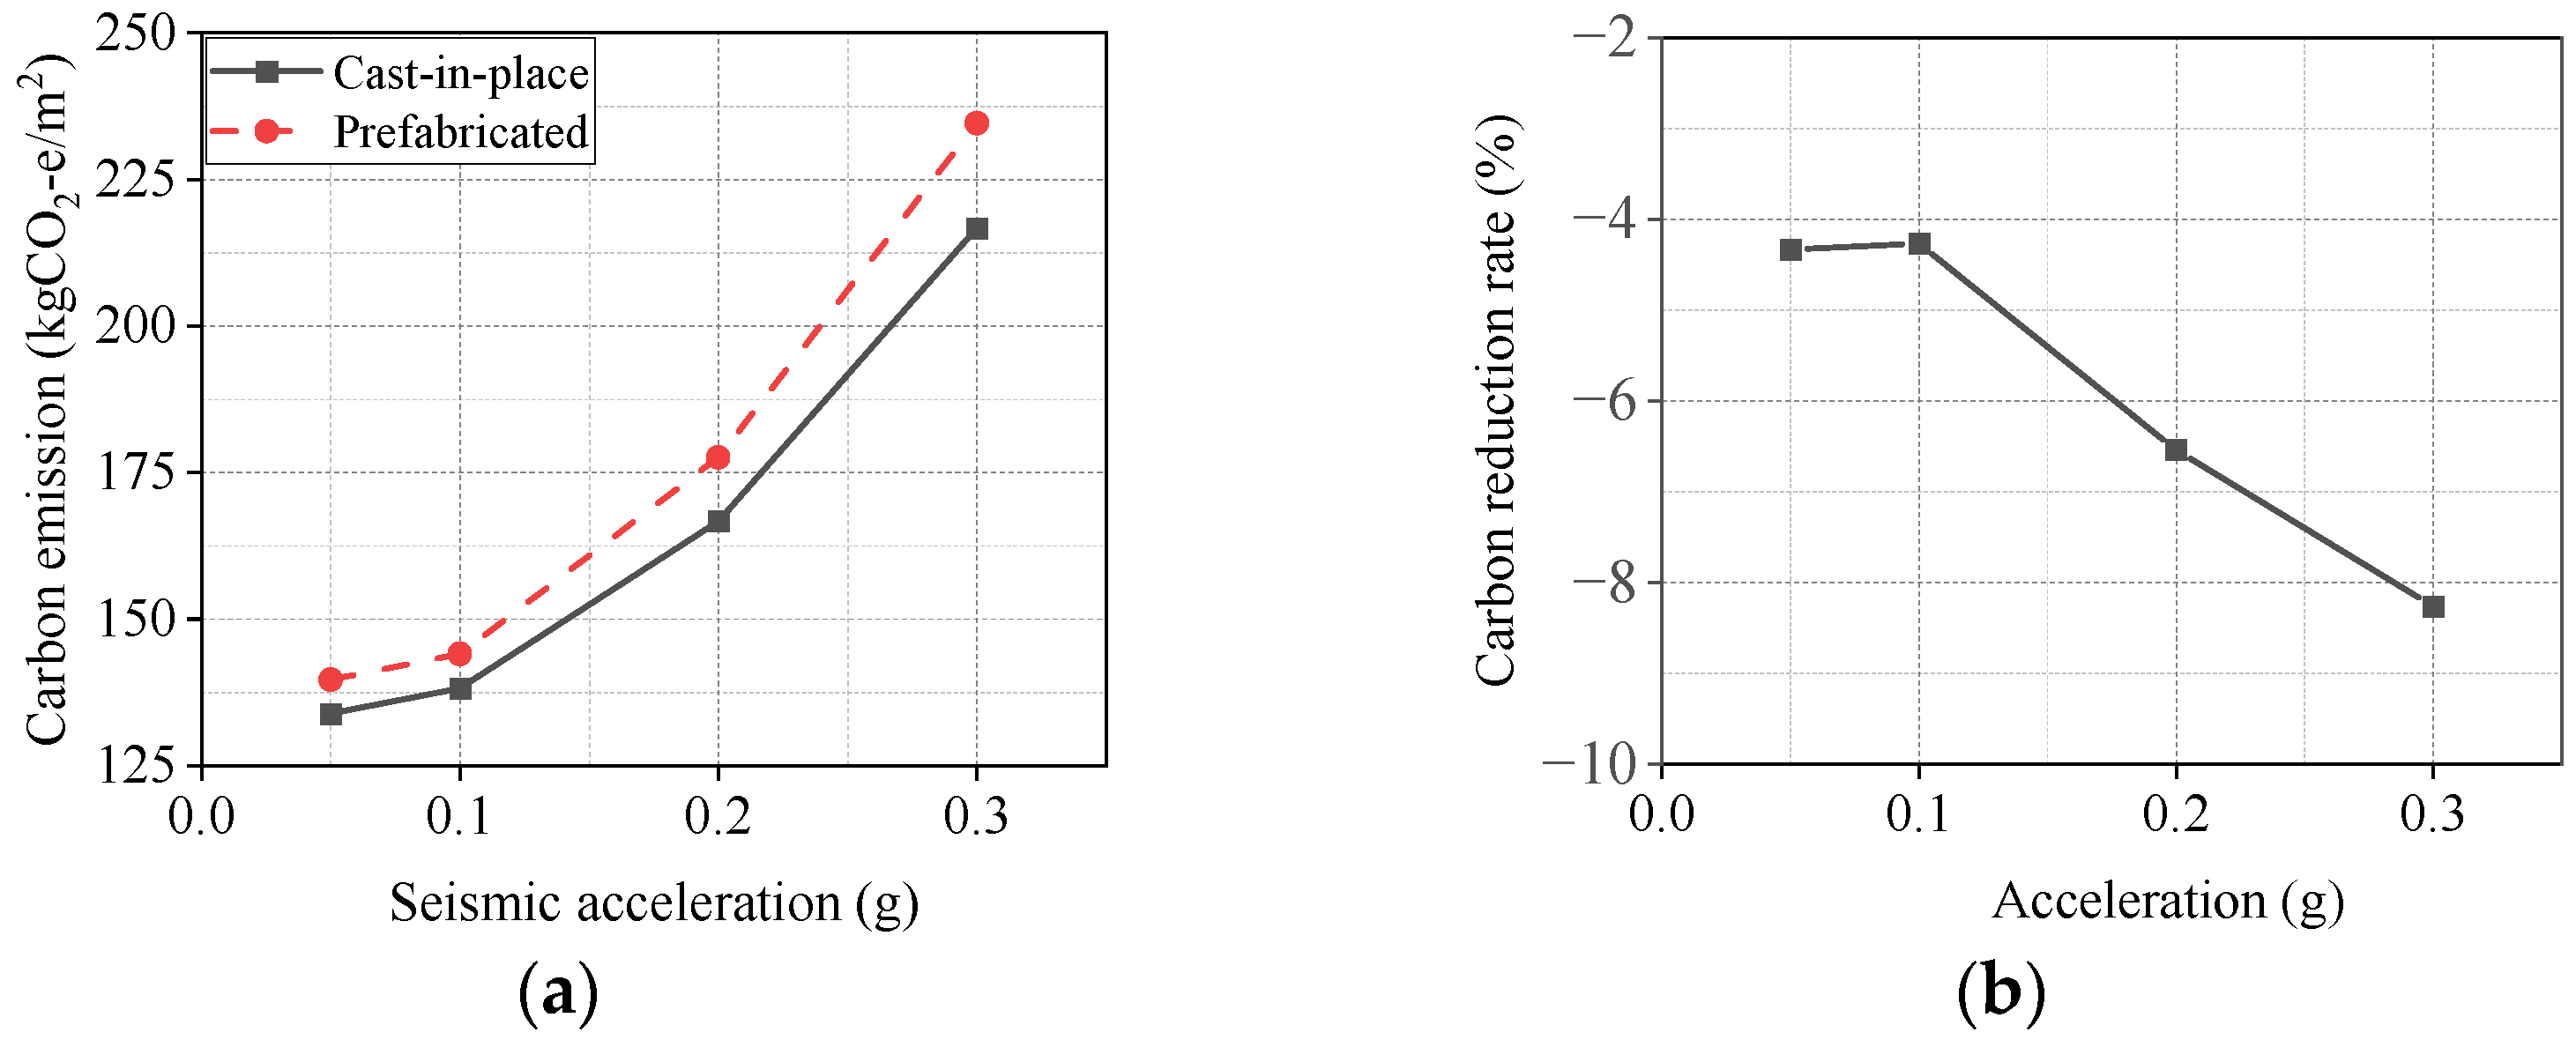
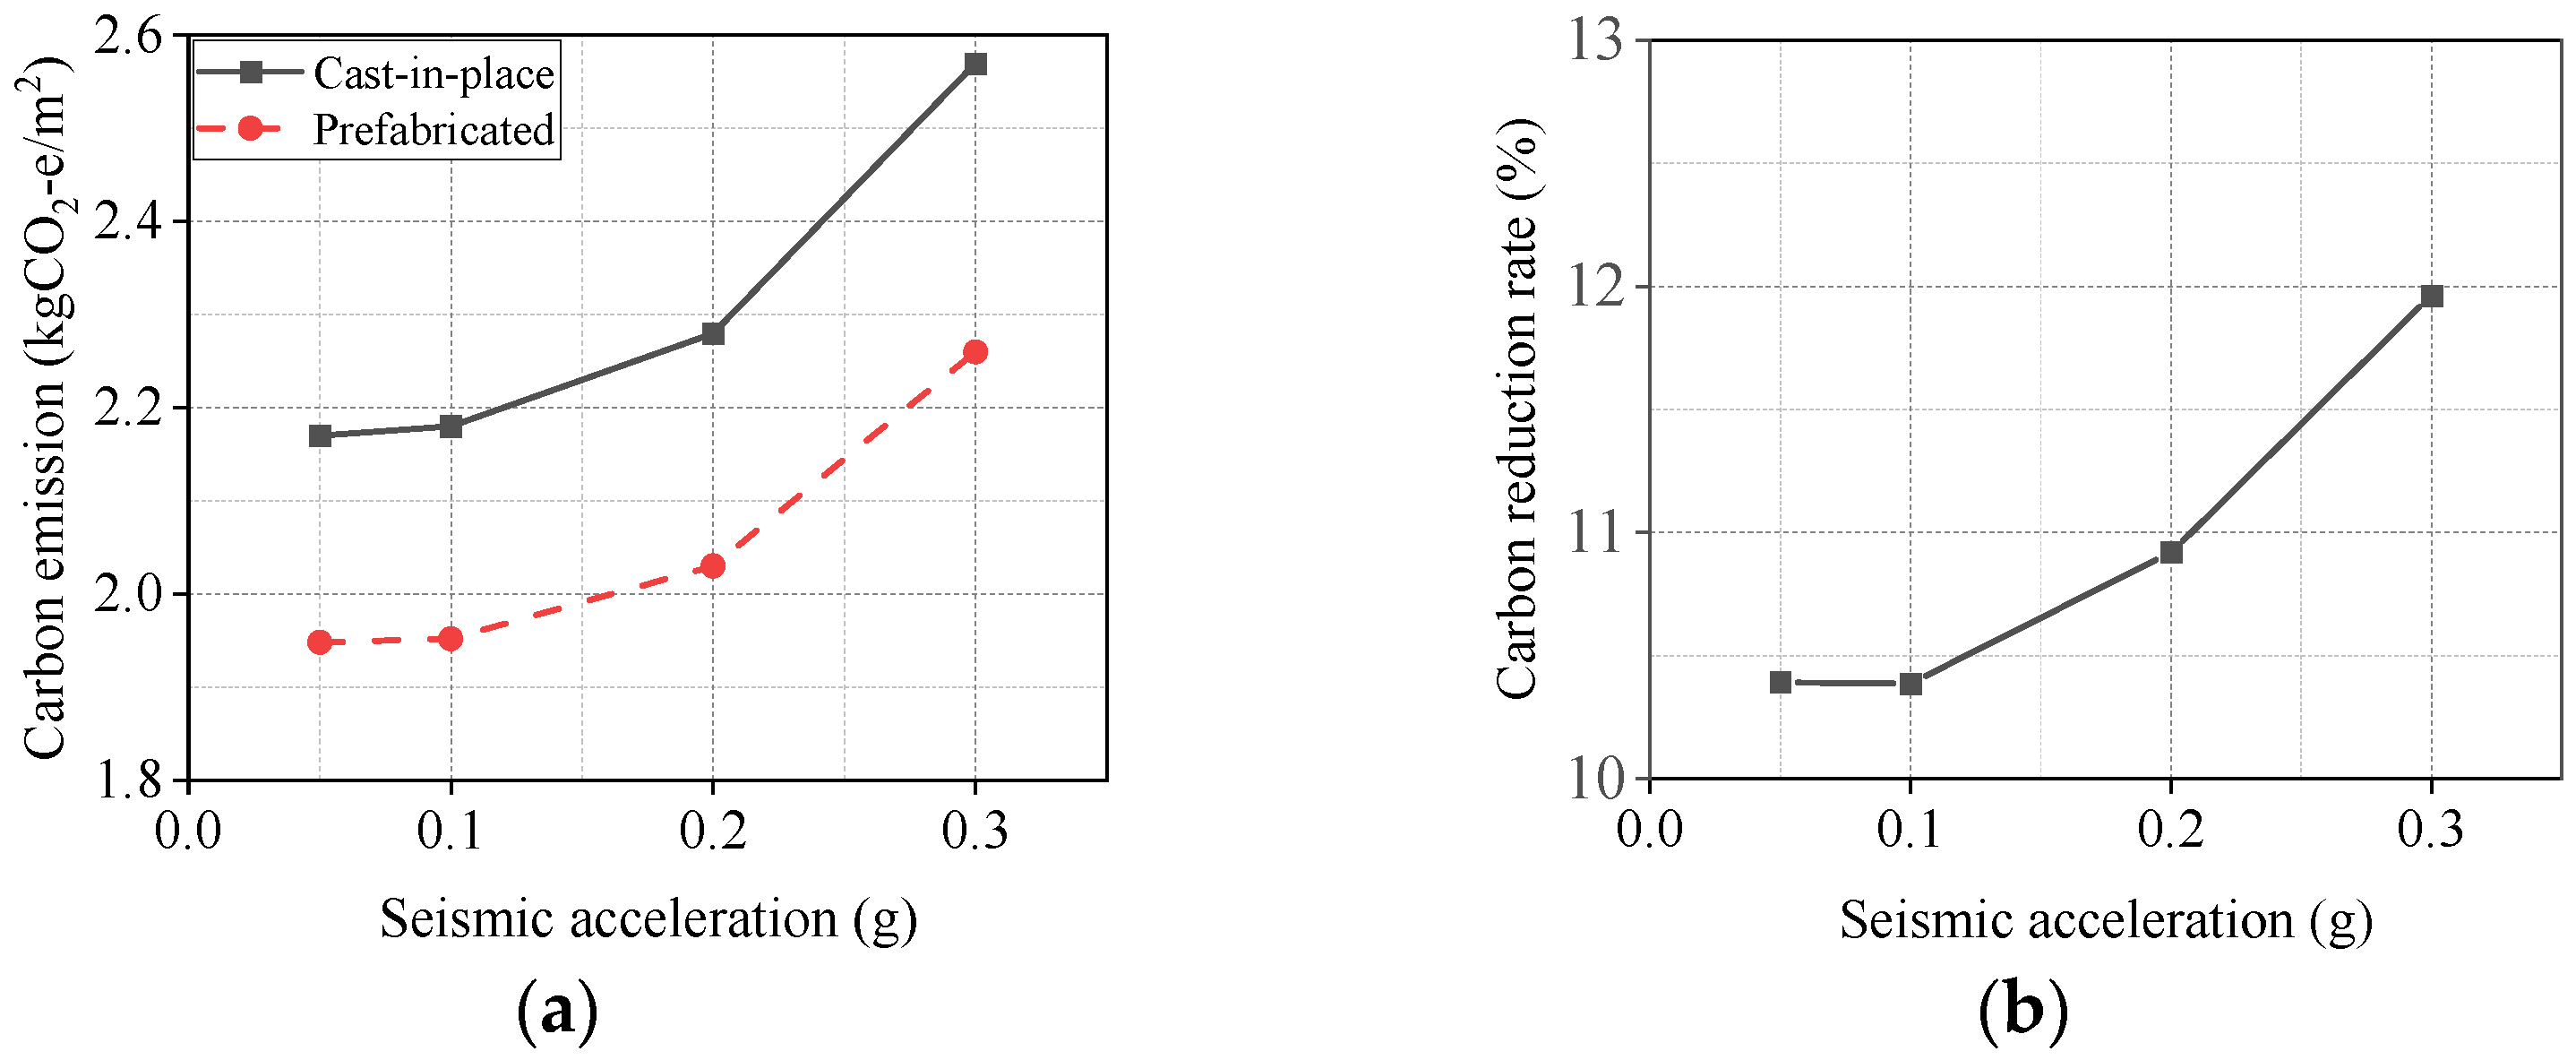
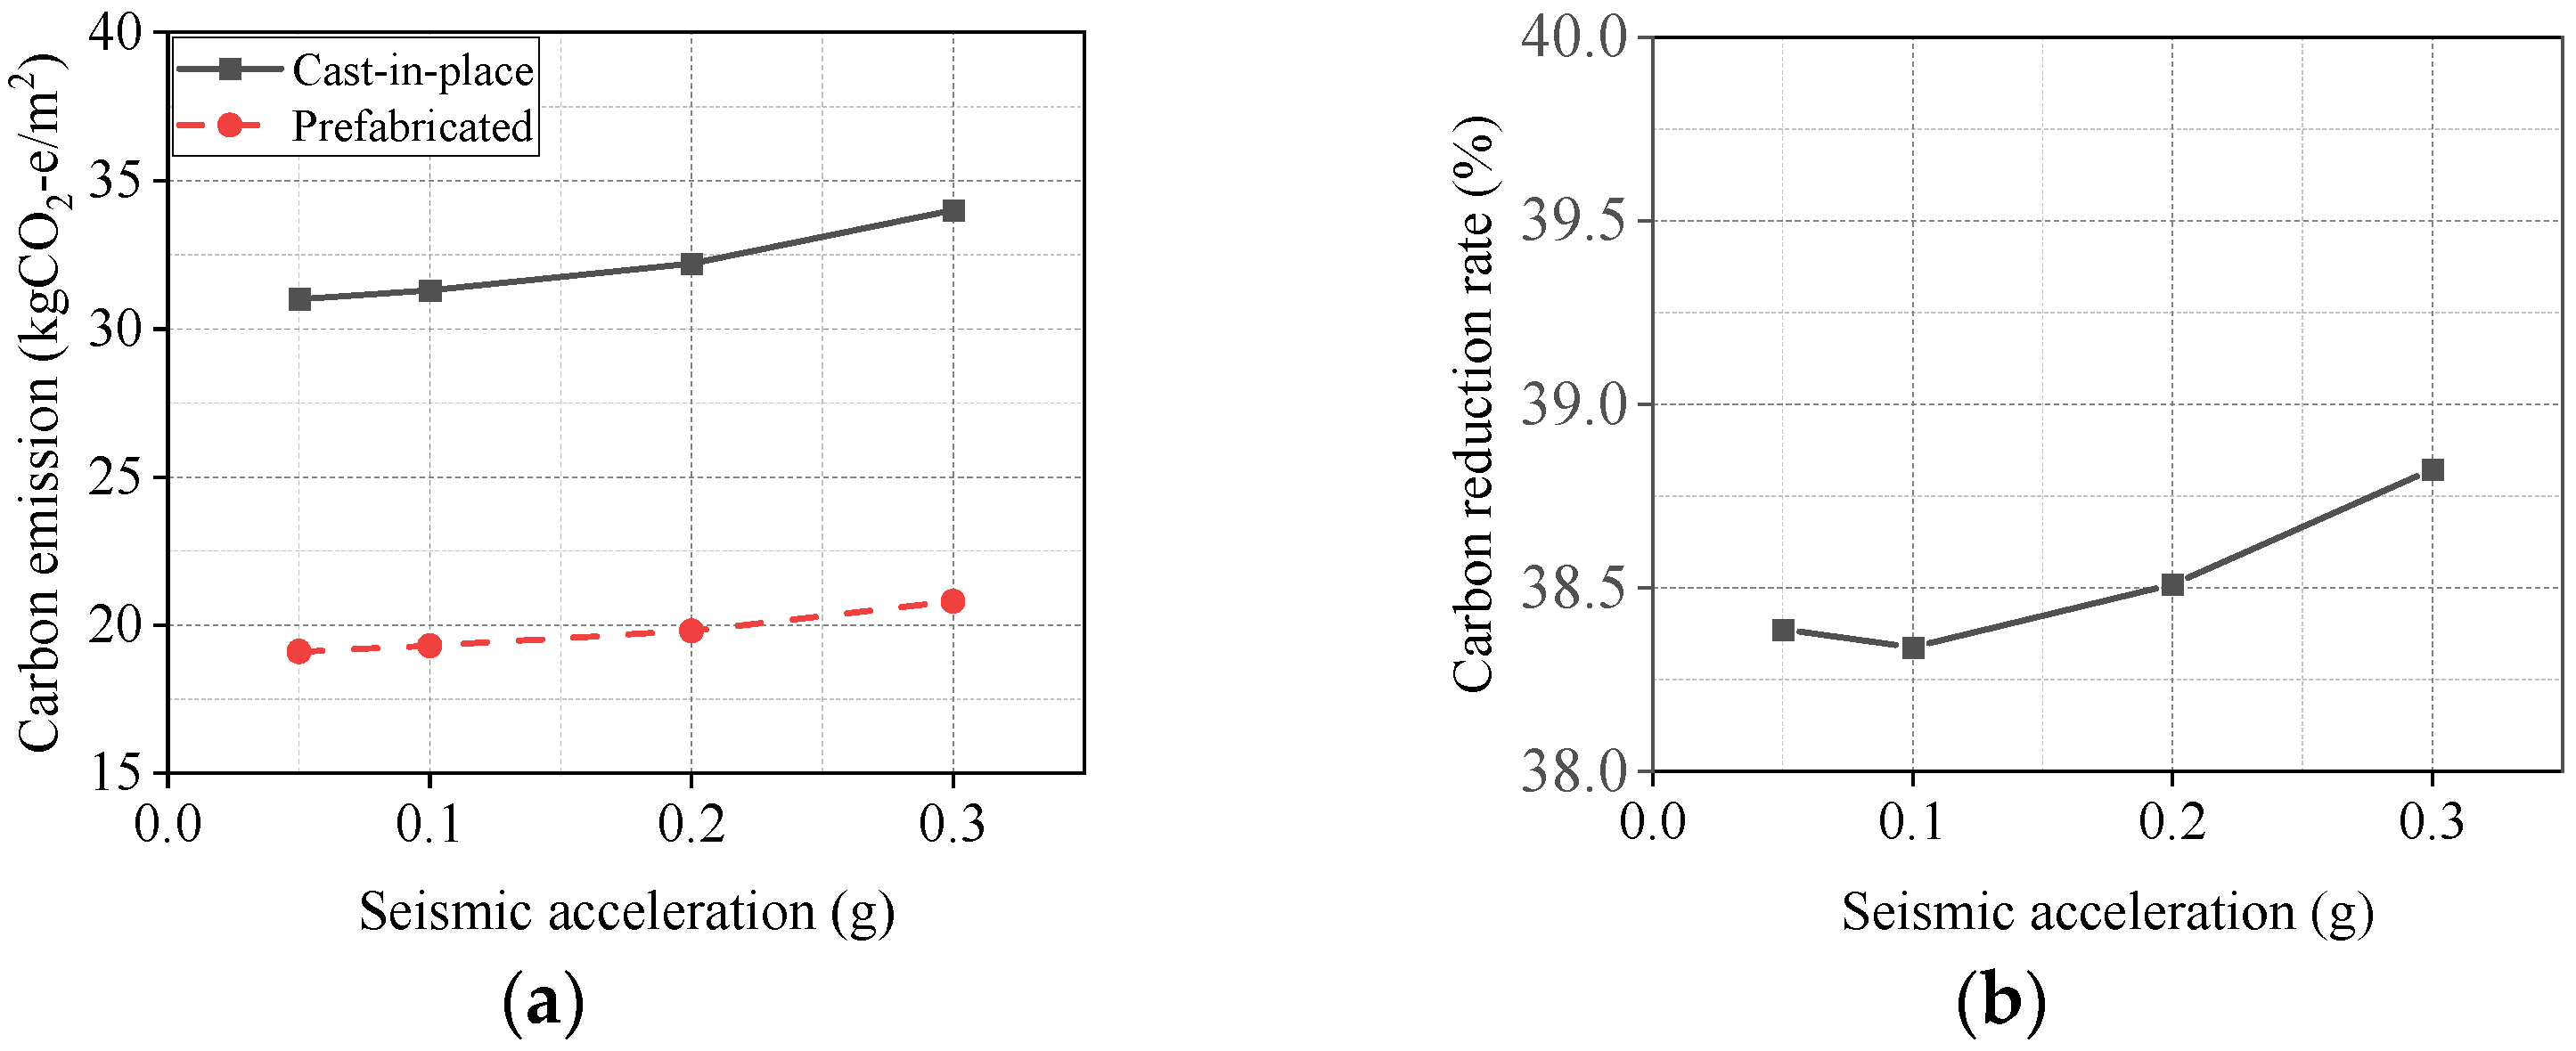
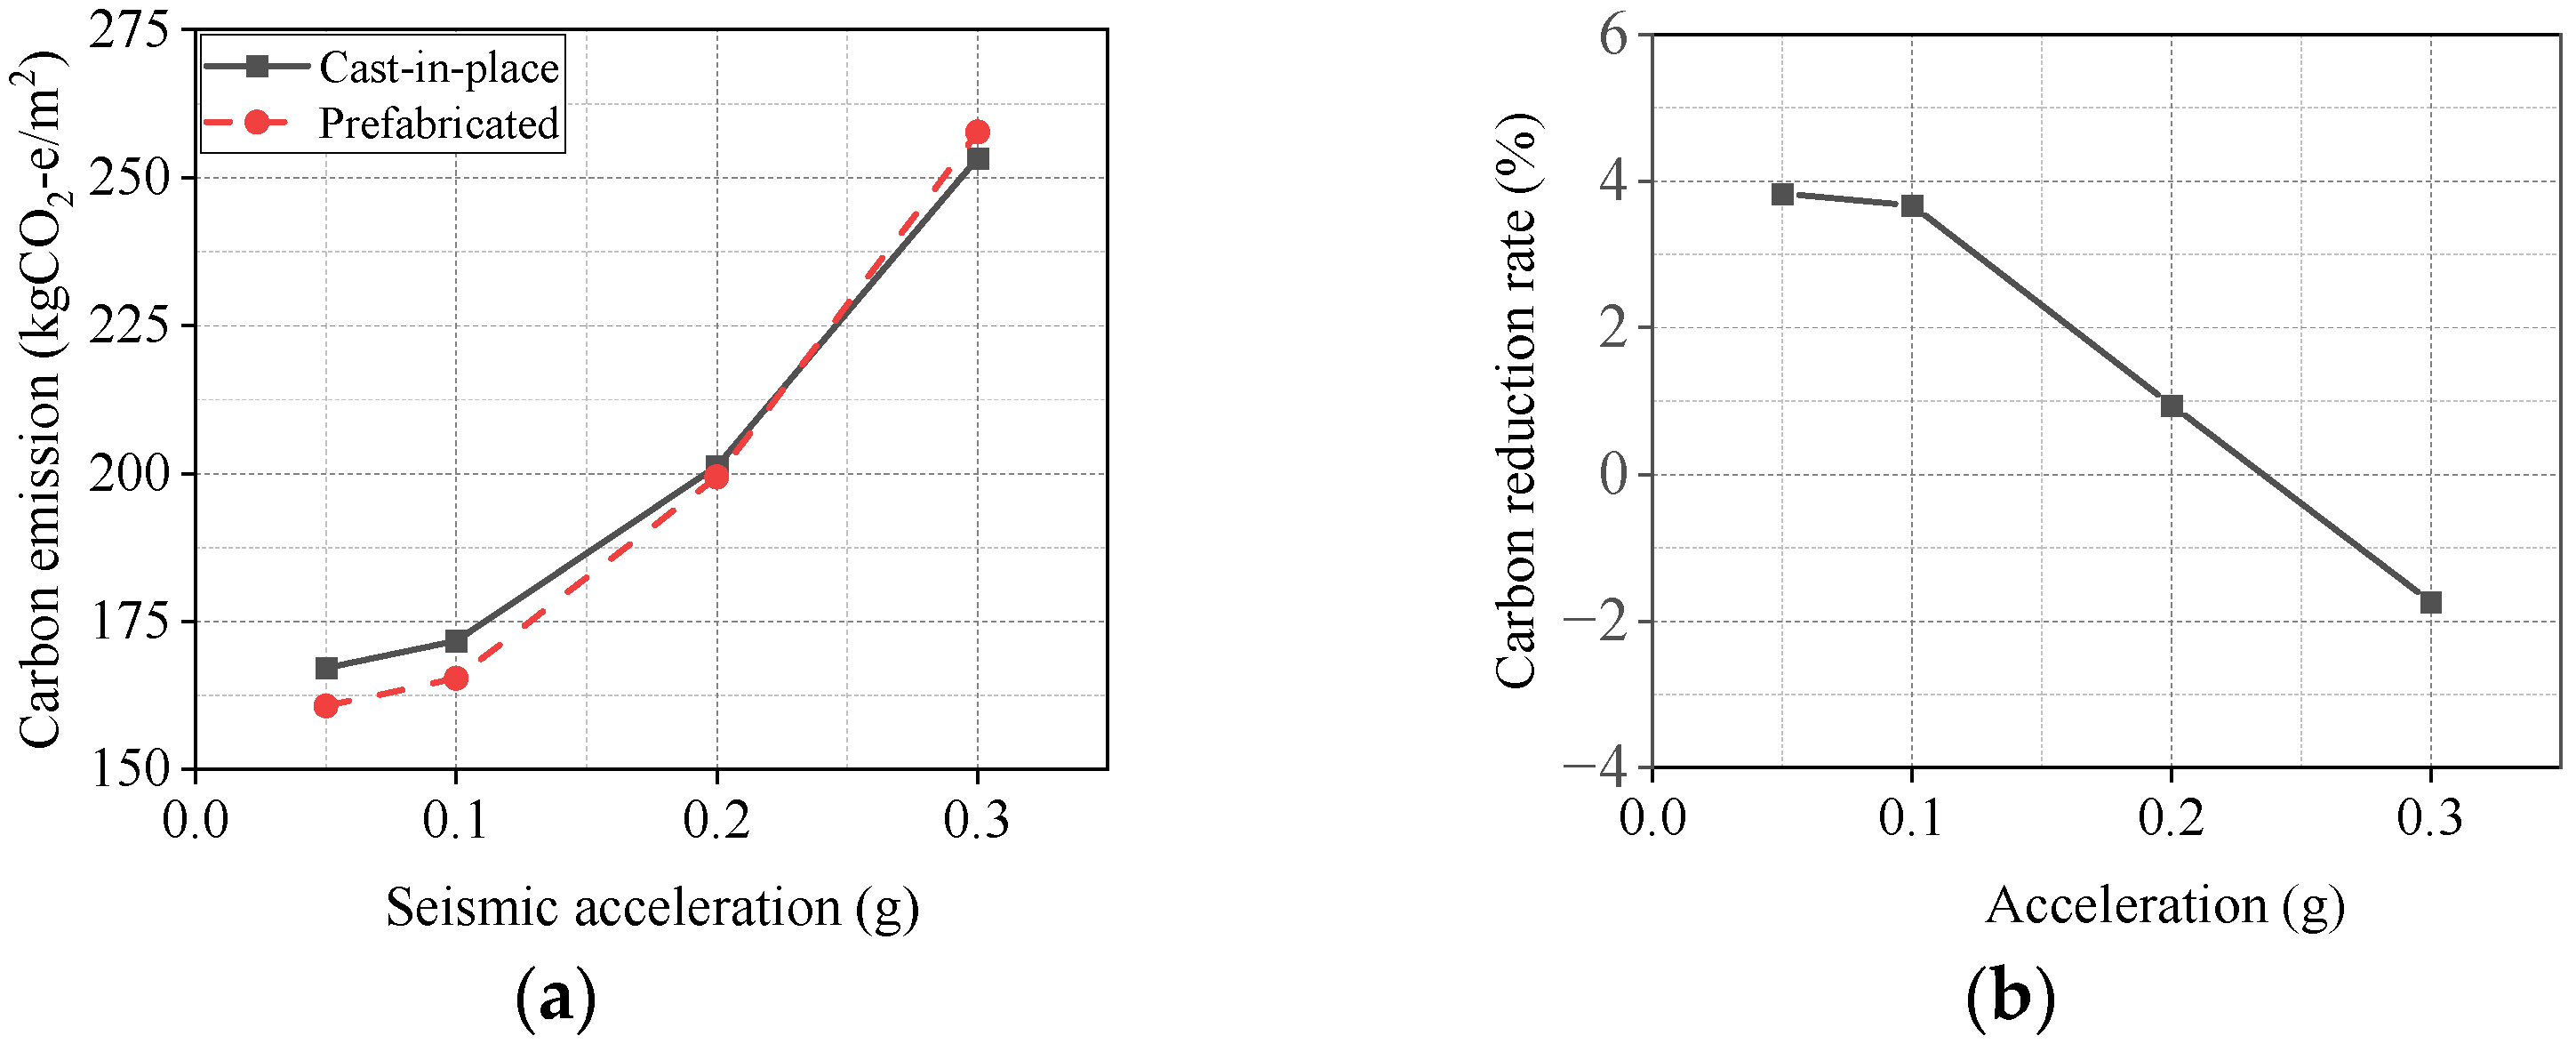
4.2.2. Sensitivity Analysis of Seismic Requirements

The conclusion obtained in the previous section that prefabricated structures have the ability to reduce emissions is based on the fact that the structure is at a seismic intensity of six degrees with a seismic acceleration of 0.05 g. As the seismic requirements increase, it will lead to a rise in the amount of concrete and reinforcement, which will cause a change in the carbon emissions of cast-in-place and prefabricated structures. Since the relative degree of change in carbon emissions of prefabricated and cast-in-place structures is unclear, this subsection investigates the sensitivity of structural carbon emissions to seismic requirements using seismic acceleration as an indicator.
The present study investigated the sensitivity of structural carbon emissions and prefabricated emission reduction rates to seismic requirements during the production phase. The results are presented in Figure 12, demonstrating that both prefabricated structures and control cast-in-place structures exhibit an exponential increase in carbon emission values as the seismic acceleration increases Figure 12a. This is because the increase in seismic acceleration requires the structure to increase its lateral stiffness to meet the seismic requirements, which is usually achieved by increasing the cross-sectional area and reinforcement of the beams and columns, thus making the carbon emissions of the structure larger. In Figure 12b, the carbon emission reduction rate of prefabricated structures gradually decreases with increasing seismic acceleration, from −4.3% at 0.05 g to −8.3% at 0.3 g (negative values indicate an increase in carbon emissions of prefabricated structures). In order to meet the load bearing capacity requirements of the prefabricated structure beam-column joints, more rebar is usually required; the higher the seismic requirements, the more reinforcement is allocated relative to the cast-in-place structure. As the seismic requirements increase, the principle of reinforcement allocation for prefabricated beams and columns (small number and large diameter) will cause prefabricated elements to consume more reinforcement compared to cast-in-place elements, and the higher number of reinforcement connection sleeves in prefabricated columns will further increase the carbon emissions of assembled structures.
Figure 13 displays the sensitivity results of the carbon emissions of the transport phase structure and the reduction rate of the prefabricated structure to seismic requirements. As demonstrated in Figure 13a, the carbon emissions of both prefabricated and control cast-in-place structures increase with the rise in seismic acceleration. This is because the increase in seismic acceleration increases the volume of concrete and the amount of reinforcement, resulting in more material being transported and thus greater carbon emissions during the transport phase. As depicted in Figure 13b (positive values indicate that the carbon emissions of prefabricated structures are smaller), prefabricated structures consistently exhibit lower carbon emissions than cast-in-place structures, and their carbon emission reduction rate steadily increases with the escalation in seismic acceleration, from 10.4% at 0.05 g to 12.0% at 0.3 g. As prefabricated rebar is transported to site with the prefabricated components, there is no double counting of its carbon emissions, whereas cast-in-place rebars needs to be counted separately. Increased seismic acceleration results in a larger amount of rebar, so cast-in-place structures generate more carbon emissions due to the need to transport cast-in-place rebar.
The sensitivity results of the structural carbon emission values during the construction phase and the reduction rate of the prefabricated structure to seismic requirements are presented in Figure 14. It is observed that the carbon emission values of both prefabricated and cast-in-place structures increase progressively with increasing seismic acceleration, but the increase is small, as shown in Figure 14a. This is because the change in seismic requirements does not affect the carbon emissions of the measure work, the main source of carbon emissions during the construction phase. The amount of concrete, rebar, formwork, and embedded parts increased, resulting in a slight increase in carbon emission in the construction phase. On the other hand, as displayed in Figure 14b, the carbon emission of the prefabricated structure is consistently lower than that of the cast-in-place structure. Additionally, the overall carbon reduction rate of the prefabricated structure increases with increasing seismic acceleration, with a small reverse decrease at 0.1 g. This phenomenon can be attributed to the fact that the carbon emission coefficient of the prefabricated concrete construction phase is significantly smaller than that of cast-in-place concrete. The total amount of concrete used at 0.1 g is the same as that used at 0.05 g, resulting in a relatively smaller reduction in carbon emissions due to prefabricated concrete. Overall, the carbon emission reduction rate of the prefabricated structure increases from 38.4% at 0.05 g to 38.8% at 0.3 g.
The results of the sensitivity analysis for the carbon emissions of the total materialization phase structure and the reduction rate of the prefabricated structure to seismic requirements are presented in Figure 15. The carbon emission values of both the prefabricated structure and the control cast-in-place structure increase with increasing seismic acceleration and exhibit an exponential growth trend Figure 15a. The carbon emission reduction capacity of the prefabricated structure gradually decreases as the seismic acceleration increases, with the carbon emission of the prefabricated structure starting to increase when the seismic acceleration exceeds 0.2 g. The carbon reduction capacity of the prefabricated structure decreases from 3.8% at 0.05 g to −1.7% at 0.3 g, with a reduction rate decrease of 5.5% (Figure 15b).The change in seismic requirements mainly affects the concrete and rebar subprojects. The difference in rebar quantity of prefabricated and cast-in-place structures is the main reason for the change of carbon emission reduction capacity of the prefabricated structure by seismic requirements.
Therefore, to fully utilize the carbon reduction potential of prefabricated structures, it is essential to consider the seismic requirements of the structure, particularly during the design and planning phases. This study provides useful insights for policymakers, engineers, and designers to make informed decisions when selecting the appropriate construction methods and materials. In addition, it highlights the need for further research to explore ways to enhance the seismic resistance of prefabricated structures without compromising their carbon reduction potential.

5. Conclusions

The study aimed to evaluate the carbon emission reduction capability of prefabricated monolithic concrete frame structures with two assembly rates using a carbon emission measurement method for the materialization phase of prefabricated structures. A sensitivity analysis of relevant calculation and design parameters was conducted, and the following conclusions were drawn:
Since the production phase’s carbon emission share is higher with a higher assembly rate, reducing carbon emissions in the production phase should be a priority to optimize the construction process of prefabricated structures. Although the proportion of carbon emissions from the transportation phase is small, the transportation distance can significantly affect the results of structural comparison and should not be ignored. The lower carbon emissions in the construction phase of prefabricated structures are primarily due to construction machinery consuming less energy, accounting for about 68% of the total carbon emissions, compared to 32% for labor.
While a higher assembly rate leads to smaller total materialization phase carbon emissions, the reduction rate is low. The increase in assembly rate is insignificant in improving prefabricated structures’ carbon reduction ability. Concrete and rebar projects are the focus of carbon emission reduction, accounting for about 53% and 34% of carbon emissions, respectively. However, the accuracy of the carbon emission factors of collected materials affects the reliability of prefabricated structures’ carbon emission reduction rates.
Prefabricated structures with small slab spans lost their emission reduction ability compared with large slab spans. Cast-in-place structures are more likely to reduce carbon emissions for small slab span structures. As the seismic acceleration increases, the carbon emission reduction capacity of the prefabricated structure gradually becomes smaller. When the seismic acceleration exceeds 0.2 g, the prefabricated structure loses its carbon emission reduction capacity and begins to increase carbon emission instead.

6. Limitations and Future Outlook

This paper investigates the carbon reduction capability of prefabricated structures, represented by assembled monolithic concrete frame structures, with certain limitations, as different structural forms have various design and construction requirements. To further validate the soundness of the results, other structural forms, such as framed shear wall structures and shear wall structures, and assembled forms, such as fully prefabricated assembled structures, need to be further investigated. The carbon emission factors used in this paper do not take into account the differences in their recycling performance, as there is no uniform standard for determining the recycling factors for cast-in-place and fabricated structures. In the future, the carbon emissions of prefabricated structures can be discussed after material recovery has been obtained through on-site enquiries at the factory. The results of this paper show that changes in design parameters mainly affect the concrete volume and reinforcement quantity of members, and that the comprehensive carbon emission factors for subprojects collated in this paper can be used to carry out optimal design of structural sections based on carbon emissions to further reduce carbon emissions.

Author Contributions

Methodology, Y.H. and A.W.; software, A.W.; investigation, A.W.; data curation, A.W.; writing—original draft preparation, Y.H. and A.W.; writing—review and editing, Y.H.; funding acquisition, Y.H. All authors have read and agreed to the published version of the manuscript.

Funding

This research was funded by the Natural Science Foundation of Hunan Province, China (no. 2020RC5005 and No. 2020JJ2003).

Data Availability Statement

The data presented in this study are available on request from the corresponding author.

Conflicts of Interest

The authors declare no conflict of interest.

Appendix A

In order to facilitate the statistics of the quantities of each structural subproject, the working condition numbering diagram of different design parameters is shown in Figure A1. The statistical quantities of each structural subproject are shown in Table A1, Table A2 and Table A3. The carbon emissions of each phase of the structure can be obtained by multiplying the engineering quantity of each structural subproject by the comprehensive carbon emission coefficient of the corresponding subproject.
Figure A1. Schematic diagram of working condition numbering.
Buildings 13 01348 g0a1
Table A1. Subproject quantity statistics of cast-in-place structure.
WorkSubprojectUnit00055100010510002051000305100005255
ConcreteCast-in-placeColumnm344.5244.5256.484.2444.52
Beam91.3891.3890.4298.28109.50
Slab186.60186.60186.60186.60119.22
RebarCast-in-place≤10 mmkg12,576.9012,576.9012,576.9013,041.009130.68
≤18 mm8989.8711,358.166332.24559.5011,814.51
≤25 mm0.000.0017,342.0942,714.430.00
StirrupCast-in-place≤10 mmkg5238.305238.307369.4210,169.646126.54
FormworkCast-in-placeColumnm2445.44445.44501.12612.48445.44
Beam851.04851.04851.04894.961091.88
Slab1459.621459.621459.621459.621441.26
MeasureVertical transport day190.00190.00190.00190.00190.00
Scaffoldm21404.541404.541404.541404.541404.54
Table A2. Subproject quantity statistics of prefabricated structure with assembly rate of 50%.
WorkSubprojectUnit5005510
ConcreteCast-in-placeColumnm344.50
PrefabricateBeam61.01
Slab70.56
Post pouringComposite beam and slab146.42
RebarCast-in-place≤18kg2530.21
Prefabricate≤109970.66
≤183525.64
Post pouring≤105275.86
≤182934.02
StirrupCast-in-place≤10kg2452.74
Prefabricate≤102705.47
Post pouring≤1080.09
FormworkCast-in-placeColumnm2445.44
Post pouringComposite beam and slab115.67
Embedded partHookpiece288
Lifting point648
MeasureVertical transport day130.50
Scaffoldm21404.54
Table A3. Subproject quantity statistics of prefabricated structure with assembly rate of 80%.
WorkSubprojectUnit80055108010510802051080305108005255
ConcretePrefabricateColumnm337.3337.3347.2469.1237.33
Beam61.0161.0160.3768.9569.37
Slab70.5670.5670.5270.3972.43
Post pouringBeam-column joint7.207.209.1615.137.20
Composite beam and slab146.42146.42146.13145.07122.68
RebarPrefabricate≤10 mmkg9970.669970.669970.669970.669902.30
≤18 mm6055.856313.87949.370.007868.42
≤25 mm0.000.0014506.6031426.20626.02
Post pouring≤10 mm5275.865275.865275.866204.124640.46
≤18 mm2934.025154.524342.511118.944951.75
≤25 mm0.000.006264.6714890.8280.60
StirrupPrefabricate≤10 mmkg4505.174505.175855.907832.185167.24
Post pouring≤10 mm733.13733.131419.472807.74669.98
FormworkPost pouringBeam-column jointm230.2430.2438.8862.4030.24
Composite beam and slab115.67115.67115.67115.6725.70
Embedded partGrout sleevepiece7687689121728768
Hook288288288288396
Lifting point648648648648972
Hanging nail192192192192192
Anchor384384384384384
MeasureVertical transport day117.50117.50117.50117.50117.50
Scaffoldm21404.541404.541404.541404.541404.54

References

  1. IEA. Global Status Report for Buildings and Construction 2019. License: CC BY 4.0. IEA, Paris, France. Available online: https://www.iea.org/reports/global-status-report-for-buildings-and-construction-2019 (accessed on 15 April 2023).
  2. Li, C.Z.; Hong, J.; Xue, F.; Shen, G.Q.; Xu, X.; Mok, M.K. Schedule risks in prefabrication housing production in Hong Kong: A social network analysis. J. Clean. Prod. 2016, 134, 482–494. [Google Scholar] [CrossRef]
  3. Yang, Q.B.Z. Prefabricated Construction Development Bottleneck and Countermeasures Research. J. SHENYANG JIANZHU Univ. Nat. Sci. Ed. 2015, 17, 156–159. (In Chinese) [Google Scholar]
  4. List of Replicable Experiences for Prefabricated Building Development. 2022. Available online: http://www.gov.cn/zhengce/zhengceku/2022-12/03/content_5730064.htm (accessed on 15 April 2023).
  5. Tumminia, G.; Guarino, F.; Longo, S. Life cycle energy performances and environmental impacts of a prefabricated building module. Renew. Sustain. Energy Rev. 2018, 92, 272–283. [Google Scholar] [CrossRef]
  6. Teng, Y.; Pan, W. Systematic embodied carbon assessment and reduction of prefabricated high-rise public residential buildings in Hong Kong. J. Clean. Prod. 2019, 238, 117791. [Google Scholar] [CrossRef]
  7. Ding, Z.; Liu, S.; Luo, L. A building information modeling-based carbon emission measurement system for prefabricated residential buildings during the materialization phase. J. Clean. Prod. 2020, 264, 121728. [Google Scholar] [CrossRef]
  8. Jin, R.; Hong, J.; Zuo, J. Environmental performance of off-site constructed facilities: A critical review. Energy Build. 2020, 207, 109567. [Google Scholar] [CrossRef]
  9. Wang, H.; Zhang, Y.; Gao, W. Life Cycle Environmental and Cost Performance of Prefabricated Buildings. Sustainability 2020, 12, 2609. [Google Scholar] [CrossRef]
  10. Wen, T.J.; Siong, H.C.; Noor, Z.Z. Assessment of embodied energy and global warming potential of building construction using life cycle analysis approach: Case studies of residential buildings in Iskandar Malaysia. Energy Build. 2015, 93, 295–302. [Google Scholar] [CrossRef]
  11. Bonamente, E.; Cotana, F. Carbon and Energy Footprints of Prefabricated Industrial Buildings: A Systematic Life Cycle Assessment Analysis. Energies 2015, 8, 12685–12701. [Google Scholar] [CrossRef]
  12. Li, X.J.; Lai, J.Y.; Ma, C.Y. Using BIM to research carbon footprint during the materialization phase of prefabricated concrete buildings: A China study. J. Clean. Prod. 2021, 279, 123454. [Google Scholar] [CrossRef]
  13. Zhou, F.; Ning, Y.; Guo, X.; Guo, S. Analyze Differences in Carbon Emissions from Traditional and Prefabricated Buildings Combining the Life Cycle. Buildings 2023, 13, 874. [Google Scholar] [CrossRef]
  14. Han, Q.; Chang, J.; Liu, G.; Zhang, H. The Carbon Emission Assessment of a Building with Different Prefabrication Rates in the Construction Stage. Int. J. Environ. Res. Public Health 2022, 19, 2366. [Google Scholar] [CrossRef] [PubMed]
  15. Pons, O.; Wadel, G. Environmental impacts of prefabricated school buildings in Catalonia. Habitat Int. 2011, 35, 553–563. [Google Scholar] [CrossRef]
  16. Mao, C.; Shen, Q.; Shen, L.; Tang, L. Comparative study of greenhouse gas emissions between off-site prefabrication and conventional construction methods: Two case studies of residential projects. Energy Build. 2013, 66, 165–176. [Google Scholar] [CrossRef]
  17. Du, Q.; Pang, Q.; Bao, T. Critical factors influencing carbon emissions of prefabricated building supply chains in China. J. Clean. Prod. 2021, 280, 124398. [Google Scholar] [CrossRef]
  18. Wang, S.; Sinha, R. Life Cycle Assessment of Different Prefabricated Rates for Building Construction. Buildings 2021, 11, 552. [Google Scholar] [CrossRef]
  19. Quale, J.D.; Eckelman, M.J.; Williams, K. Construction Matters: Comparing Environmental Impacts of Building Modular and Conventional Homes in the United States. J. Ind. Ecol. 2012, 16, 243–253. [Google Scholar] [CrossRef]
  20. Dodoo, A.; Gustavsson, L.; Sathre, R. Lifecycle carbon implications of conventional and low-energy multi-storey timber building systems. Energy Build. 2014, 82, 194–210. [Google Scholar] [CrossRef]
  21. Omar, W.M.S.W.; Doh, J.H.; Panuwatwanich, K. Assessment of the embodied carbon in precast concrete wall panels using a hybrid life cycle assessment approach in Malaysia. Sustain. Cities Soc. 2014, 10, 101–111. [Google Scholar] [CrossRef]
  22. Islam, H.; Zhang, G.; Setunge, S. Life cycle assessment of shipping container home: A sustainable construction. Energy Build. 2016, 128, 673–685. [Google Scholar] [CrossRef]
  23. Geisler, G.; Hellweg, S.; Hungerbühler, K. Uncertainty Analysis in Life Cycle Assessment (LCA): Case Study on Plant—Protection Products and Implications for Decision Making. Int. J. Life Cycle Assess. 2005, 10, 192.1–192.3. [Google Scholar] [CrossRef]
  24. Marland, E.; Cantrell, J.; Kiser, K.; Marland, G.; Shirley, K. Valuing uncertainty part I: The impact of uncertainty in GHG accounting. Carbon Manag. 2014, 5, 35–42. [Google Scholar] [CrossRef]
  25. MHURD-PRC. Technical Regulations for Prefabricated Concrete Structures, Beijing, 2014. Available online: https://www.mohurd.gov.cn/gongkai/zhengce/zhengcefilelib/202002/20200221_244041.html (accessed on 17 February 2023). (In Chinese)
  26. MHURD-PRC. Uniform Standard for Reliability Design of Building Structures, Beijing, 2018. Available online: https://www.mohurd.gov.cn/gongkai/zhengce/zhengcefilelib/201903/20190315_239764.html (accessed on 17 February 2023). (In Chinese)
  27. MHURD-PRC. Chinese Load Code for the Design of Building Structures, GB 50009-2012. 2012. Available online: https://gb50009.readthedocs.io/zh/latest/index.html (accessed on 17 February 2023). (In Chinese)
  28. Pakdel, A.; Ayatollahi, H.; Sattary, S. Embodied energy and CO2 emissions of life cycle assessment (LCA) in the traditional and contemporary Iranian construction systems. J. Build. Eng. 2021, 39, 102310. [Google Scholar] [CrossRef]
  29. Luo, L.; Chen, Y. Carbon emission energy management analysis of LCA-Based fabricated building construction. Sustain. Comput. Inform. Syst. 2020, 27, 100405. [Google Scholar] [CrossRef]
  30. Chen, T.Y.; Burnett, J.; Chau, C.K. Analysis of embodied energy use in the residential building of Hong Kong. Energy 2001, 26, 323–340. [Google Scholar] [CrossRef]
  31. Nardi, I.; Lucchi, E. In Situ Thermal Transmittance Assessment of the Building Envelope: Practical Advice and Outlooks for Standard and Innovative Procedures. Energy 2023, 16, 3319. [Google Scholar] [CrossRef]
  32. Zhang, X.; Zhang, X. A subproject-based quota approach for life cycle carbon assessment at the building design and construction stage in China. Build. Environ. 2020, 185, 107258. [Google Scholar] [CrossRef]
  33. MHURD-PRC. Consumption Quota for Building and Decoration Engineering, 2015. Available online: https://www.mohurd.gov.cn/gongkai/zhengce/zhengcefilelib/201503/20150311_220456.html (accessed on 17 February 2023). (In Chinese)
  34. MHURD-PRC. Wastage Quota of Prefabricated Building, TY 01-01(01)-2016. 2016. Available online: http://www.gov.cn/xinwen/2016-12/27/content_5153581.htm (accessed on 17 February 2023). (In Chinese)
  35. MHURD-PRC. Standard for Building Carbon Emission Calculation, GB/T 51366-2019. 2019. Available online: https://www.mohurd.gov.cn/gongkai/zhengce/zhengcefilelib/201905/20190530_240723.html (accessed on 17 February 2023). (In Chinese)
  36. Bin, H. Preparation and Application Research of Sleeve Grouting Material for Assembly Building. Master’s Thesis, Southeast University, Nanjing, China, 2017. (In Chinese). [Google Scholar]
  37. Luyuan, Y. Measurement of Carbon Footprint in Materialization Stage of Precast Concrete. Master’s Thesis, Southeast University, Nanjing, China, 2017. [Google Scholar]
  38. Yuanxue, G. Assessment Methodology and Empirical Analysis of Embodied Carbon Footprint of Bbuilding Construction. Master’s Thesis, Tsinghua University, Beijing, China, 2012. (In Chinese). [Google Scholar]
  39. Yu, W. Whole Life Cycle Carbonemissions Researchofindustrialized Precastconstruction. Ph.D. Thesis, Southeast University, Nanjing, China, 2016. (In Chinese). [Google Scholar]
  40. Wang, J. Calculation and Analysis of Life Cycle CO2 Emission of Chinese Urban Residential Communities. Master’s Thesis, Tsinghua University, Beijing, China, 2009. (In Chinese). [Google Scholar]
  41. Zhang, X.; Zhang, X. Sustainable design of reinforced concrete structural members using embodied carbon emission and cost optimization. J. Build. Eng. 2021, 44, 102940. [Google Scholar] [CrossRef]
  42. CAO, X.; MIAO, C.Q.; PAN, H.T. Comparative Analysis and Research on Carbon Emission of Prefabricated Concrete and Cast-in-Place Building Based on Carbon Emission Model. 2021. Available online: https://kns.cnki.net/kcms2/article/abstract?v=3uoqIhG8C44YLTlOAiTRKibYlV5Vjs7iJTKGjg9uTdeTsOI_ra5_XT-kQ3a9Fttxez6AJ4_NF3a0WOb_p_lZjf5HnRzs1ny8&uniplatform=NZKPT&src=copy (accessed on 17 February 2023). (In Chinese).
  43. Ebrahimi, K. Construction Techniques for Lowering Embodied GHGs: A Review of Prefabrication and 3D Printed Concrete Mix Designs. Master’s Thesis, University of Toronto, Toronto, ON, Canada, 2021. [Google Scholar]
Figure 1. Components diagram of prefabricated concrete structure: (a) 80% assembly rate; (b) 50% assembly rate.
Buildings 13 01348 g001
Figure 2. Layouts of the structure: (a) plan; (b) elevation (unit: mm).
Buildings 13 01348 g002
Figure 3. Carbon emission inventory of different subprojects (emb. stands for the embedded part).
Buildings 13 01348 g003
Figure 4. Carbon emissions of structures with different assembly rates during the production phase.
Buildings 13 01348 g004
Figure 5. Carbon emissions of structures with different assembly rates during the transportation phase.
Buildings 13 01348 g005
Figure 6. Carbon emissions of structures with different assembly rates during the construction phase.
Buildings 13 01348 g006
Figure 7. Carbon emissions of structures with different assembly rates during the materialization phase.
Buildings 13 01348 g007
Figure 8. Carbon emission of each subproject: (a) proportion; (b) value (data unit: kgCO2-e/m2).
Buildings 13 01348 g008
Figure 9. Sensitivity of carbon emission reduction rate to carbon emission factor of materials for prefabricated structures: (a) 50% assembly rate; (b) 80% assembly rate.
Buildings 13 01348 g009
Figure 10. Sensitivity of carbon emission to transport distance of prefabricated component.
Buildings 13 01348 g010
Figure 11. Sensitivity of carbon emissions to slab span at different phases: (a) production; (b) transportation; (c) construction; (d) materialization (unit in the figure: kgCO2-e/m2).
Buildings 13 01348 g011
Figure 12. Sensitivity of carbon emission and reduction rate to seismic requirement in production phase: (a) carbon emission; (b) carbon reduction rate.
Buildings 13 01348 g012
Figure 13. Sensitivity of carbon emission and reduction rate to seismic requirement in transportation phase: (a) carbon emission; (b) carbon reduction rate.
Buildings 13 01348 g013
Figure 14. Sensitivity of carbon emission and reduction rate to seismic requirement in construction phase: (a) carbon emission; (b) carbon reduction rate.
Buildings 13 01348 g014
Figure 15. Sensitivity of carbon emission and reduction rate to seismic requirement in materialization phase: (a) carbon emission; (b) carbon reduction rate.
Buildings 13 01348 g015
Table 1. The comprehensive carbon emission coefficient of each subproject at each phase.
WorkSubprojectUnitSpecificationCoefficient (kgCO2-e/Unit)
EFPEFTEFCEF
Concrete
(C40)
Cast-in-place10 m3Column3681.298.070.63849.7
Beam3654.890.342.93788.0
Slab3654.790.344.93789.9
Post pouring10 m3Beam-column joint3672.790.8209.43972.9
Composite beam and slab3673.090.864.83828.5
Prefabricate10 m3Column3766.079.461.93907.4
Beam3726.076.7109.33911.9
Slab3851.076.8177.04104.8
Rebar
(HRB400)
Cast-in-place1 t≤10 mm2444.02.5202.42648.9
≤18 mm2537.42.6160.82700.7
≤25 mm2520.02.6102.72625.2
Post pouring1 t≤10 mm2444.02.5207.42653.9
≤18 mm2537.42.6165.12705.1
≤25 mm2520.02.6105.72628.2
Prefabricate1 t≤10 mm2438.00.00.02438.0
≤18 mm2554.30.00.02554.3
≤25 mm2528.00.00.02528.0
Stirrup
(HPB300)
Cast-in-place1 t≤10 mm2386.82.4125.12514.3
>10 mm2398.52.464.42465.3
Post pouring1 t≤10 mm2386.82.4130.62519.8
>10 mm2398.52.473.12474.0
Prefabricate1 t≤10 mm2492.80.00.02492.8
>10 mm2453.40.00.02453.4
FormworkCast-in-place100 m2Column144.11.4142.7288.2
Beam144.11.4121.3266.8
Slab144.11.4139.4284.9
Post pouring100 m2Beam-column joint449.95.2278.7733.8
Composite beam and slab268.52.9167.6439.0
Embedded partGrout sleeve1 pieced = 16, 18 mm1.50.00.11.7
d = 20 mm1.90.00.22.1
d = 22 mm2.30.00.22.5
d = 25 mm2.70.00.22.9
MeasureVertical transport1 day6- Story00158.9158.9
Scaffold100 m26- Story00237.5237.5
EP, ET, EC and E in the table represent the comprehensive carbon emission coefficient of the production, transportation, construction, and total materialization phases of the subproject, respectively. The scaffold data in the table is for the cast-in-place frame. The prefabricated concrete frame structure needs to be multiplied by the adjustment factor of 0.85. Since the number of layers studied in this paper is 6, there is no need to calculate the carbon emissions generated by ultra-high construction.
Table 2. Carbon emission factors of energy and material.
Energy and MaterialFactorMaterialFactor
Diesel oil [12,37,38,39]3.40 * kgCO2-e/kgSteel [35] 2.05 kgCO2-e/kg
Electric power [37,38,39]0.75 * kgCO2-e/kWhBar [35]2.34 kgCO2-e/kg
Cement (P.I.52.5) [37,38,39]1.14 * kgCO2-e/kgSand [35]2.51 kgCO2-e/t
Cement (P.O.42.5) [37,38,39]1.00 * kgCO2-e/kgWater [35]0.618 kgCO2-e/t
Cement (P.S.32.5) [37,38,39]0.74 * kgCO2-e/kgWelding rod [36]20.5 kgCO2-e/kg
C30 concrete [38,40,41]279.10 * kgCO2-e/m3Timber formwork [41]5.84 kgCO2-e/m2
C35 concrete [38,40,41]319.20 * kgCO2-e/m3Dry-mixed mortar [12]220 kgCO2-e/m3
C40 concrete [38,40,41]361.80 * kgCO2-e/m3Ready-mixed mortar [40]450 kgCO2-e/m3
C50 concrete [38,40,41]420.40 * kgCO2-e/m3Grout0.325 + kgCO2-e/kg
Hanging nail0.33 + kgCO2-e/pieceGrout sleeve(d = 16, 18 mm)1.34 + kgCO2-e/piece
Lifting point0.52 + kgCO2-e/pieceGrout sleeve(d = 20 mm)1.62 + kgCO2-e/piece
Hook2.20 + kgCO2-e/pieceGrout sleeve(d = 22 mm)2.00 + kgCO2-e/piece
Anchor0.04 + kgCO2-e/pieceGrout sleeve(d = 25 mm)2.43 + kgCO2-e/piece
* in the table represents the average value of references; + represents the value calculated by material composition.
Table 3. The transportation carbon emission factor of each material.
MaterialUnitTransport VehicleCapacityFuel Consumption
/(L/100 km)
Factor
/(kgCO2-e/Unit)
Prefabricate concretem3Prefabricated transport vehicle12.50407.631
Premixed concretem3Concrete carrier12.00458.943
Welding rod,
grout material
tMotorlorry (1.5 t)1.501219.078
Mortarm3Motorlorry (1.5 t)0.831234.341
Timber formworkm2Motorlorry (5 t)694.44170.058
RebartMotorlorry (40 t)40.00402.385
Table 4. The carbon emission factor of machine (Unit: kgCO2-e/shift).
MachineFactorMachineFactor
Concrete spreader17.332Concrete pump truck 75 m3/h285.158
Dry mortar pot mixer21.354Welding rod drying box 45 × 35 × 45 cm35.018
Autocrane 5 t103.87Electric single barrel fast winch 5 kN11.010
Bar straightener 40 mm8.913Self-raising tower crane 400 kN m123.068
Bar cutter 40 mm24.043Self-raising tower crane 800 kN m126.701
Bar bender 40 mm9.587Single cage construction elevator 1 t 75 m31.698
DC arc welder 2 kV A70.106Double cage construction elevator 2 × 1 t 100 m61.313
Butt welder91.378Woodworking circular sawing machine17.976
Electroslag welder110.103Electric multistage centrifugal pump 50 mm34.454
Ac arc welder 32 kV A72.301Electric multistage centrifugal pump 100 mm135.120
Table 5. Types of components of structures with different assembly rates.
Assembly RateColumnBeamSlab
PrefabricatedCast-in-PlacePrefabricatedCast-in-PlacePrefabricatedCast-in-Place
0%
50%
80%
Table 6. Subproject carbon emissions of each component during the production phase.
ComponentsCarbon Emissions of Each Subproject/(kgCO2-e/m2)
ConcreteRebarFormworkEmbedded PartTotal
ColumnCast-in-place11.78.70.520.9
Prefabricated11.98.90.10.921.8
BeamCast-in-place23.816.40.941.1
Prefabricated24.116.60.00.541.2
SlabCast-in-place48.622.01.572.1
Prefabricated49.726.50.20.276.6
Table 7. Subproject carbon emissions of each component during the transportation phase.
ComponentsCarbon Emissions of Each Subproject/(kgCO2-e/m2)
ConcreteRebarFormworkEmbedded PartTotal
ColumnCast-in-place0.3110.0090.0050.32
Prefabricated0.2580.0010.0010.0060.27
BeamCast-in-place0.5880.0170.0090.61
Prefabricated0.5290.0060.0000.53
SlabCast-in-place1.2000.0220.0151.24
Prefabricated1.1360.0090.0021.15
Table 8. Subproject carbon emissions of each structure during the construction phase.
Assembly RateCarbon Emissions/(kgCO2-e/m2)
ConcreteRebarFormworkEmbedded PartVertical TransportationScaffolding
0%1.13.42.60.021.52.4
50%2.31.60.60.014.82.0
80%2.31.20.20.113.32.0
Disclaimer/Publisher’s Note: The statements, opinions and data contained in all publications are solely those of the individual author(s) and contributor(s) and not of MDPI and/or the editor(s). MDPI and/or the editor(s) disclaim responsibility for any injury to people or property resulting from any ideas, methods, instructions or products referred to in the content.

