Article

Application of New Modified Genetic Algorithm in Inverse Calculation of Strong Source Location

School of Mining Engineering, North China University of Science and Technology, Tangshan 063210, China
*
Author to whom correspondence should be addressed.
Atmosphere 2023, 14(1), 89; https://doi.org/10.3390/atmos14010089
Submission received: 6 December 2022 / Revised: 28 December 2022 / Accepted: 29 December 2022 / Published: 31 December 2022

Abstract

:
With the rapid development of intelligent systems, the application of genetic algorithms to quickly and accurately determine the location of hazardous gas leaks is of great practical significance. To further improve the convergence efficiency and stability of the inverse calculation, a new improved genetic algorithm (NMGA) is designed on the basis of the improved genetic algorithm (MGA). The adaptive crossover rate and mutation rate change with the evolution algebra to guide the development trend of good gene genetics and change the genetic crossover ratio of parents and children in the culler’s gene pool to avoid damaging the good group genes by introducing bad genes. This study modified the adaptive crossover rate and mutation rate that change with the evolutionary generations to guide the development of good gene inheritance. Meanwhile, this study changed the genetic crossover ratio of parent and offspring in the elimination gene pool to avoid the introduction of unfavorable genes and the destruction of excellent group genes. Through the calculation simulation of the new improved genetic algorithm (NMGA) in Matlab and the quantitative and qualitative comparative analysis with the MGA statistical results, it is shown that NMGA can improve the slow convergence speed of MGA by reducing the number of iterations on the premise of ensuring the stability of MGA and the accuracy of the inverse calculation. The results indicated that the convergence rate and stability of NMGA greatly improved its convergence efficiency, inverse calculation accuracy, and stability, thereby providing powerful decision-making data for rapid emergency rescue work for sudden light gas leakage accidents.

1. Introduction

The leakage of toxic and harmful light gas is concealed, rapid, and hazardous. Once leakage occurs, it can bring serious harm to people and the social ecological environment. To reduce the harm of toxic and harmful light gas leakage, it is crucial to determine its leakage location in time.
Currently, combining intelligent algorithms and environmental monitoring data with atmospheric diffusion models to establish inverse calculation models is the main method to lock the potential location of leakage [1]. The artificial intelligence optimization algorithm does not need to know the mechanism of the leakage diffusion model nor need to calculate the gradient information of the objective function. It has received extensive attention from researchers in the inverse calculation of gas leakage sources. Thomson et al. [2] combined a simulated annealing algorithm and random search algorithm to generate source intensity and location. Zheng et al. [3] established the objective function by using the matching degree of the simulation data and monitoring data, and they used the Gaussian model as the gas diffusion model. The pattern search algorithm inversely calculates the strength and location of the leak source in a timely and accurate manner. However, the parameter settings of the simulated annealing algorithm, random search algorithm, and pattern search algorithm are greatly affected by anthropic factors and have great randomness. To solve this problem, Zhang [4] combined the particle swarm algorithm with the simplex search algorithm. Wang [5] and Zhang [6] combined the genetic algorithm and the simplex search algorithm to inversely calculate the location and intensity of leakage sources. The results show that the application of the hybrid simplex algorithm can effectively reduce the influence of the initial value selection on the stability of the optimal solution and improve the calculation accuracy of the leakage source location and intensity. However, the combination of different algorithms increases the complexity of the algorithm. Reich et al. [7] repeatedly trained and optimized a three-layer forward feedback artificial neural network with the pre-measured SO2 data to analyze the leakage source parameters in detail. However, because the artificial neural network algorithm is affected by the amount of prior data and its adaptability to the scene is limited, it is not suitable for the inverse calculation of the emergency gas leakage position of the current situation. The essence of genetic algorithms is to simulate the process of hybridization and reproduction between natural creatures, continually generate new individuals, continually expand the population, and continually expand the scope of optimization. Therefore, changing the crossover operator or mutation operator to increase population diversity becomes the key to expanding the search ability of the genetic algorithm. Fan Qingwu et al. [8] proposed a directed crossover genetic operator, which can speed up the optimization speed to a certain extent by optimizing and controlling the crossover position of cross offspring; Cui Shanshan [9] obtained two improved genetic algorithms with high optimization accuracy by optimizing crossover and mutation operators of genetic algorithm, but their convergence efficiency needs to be further improved. Of course, in recent years, many experts and scholars have also carried out optimization research on selection operators, but the optimization results have room for further improvement to some extent. Haupt et al. [10] used the genetic algorithm to directly optimize the observation and prediction data. They confirmed that the genetic algorithm variational method is more accurate in inversely calculating the leakage source location and source intensity. Zhang et al. [11] designed a new crossover criterion by introducing the elimination gene pool. Meanwhile, they introduced heuristic information with reference to the particle swarm algorithm. In addition, they strengthened the local search in the convergence region to modify the genetic algorithm (Modified Genetic Algorithm, MGA), which further improved the accuracy and efficiency of strong-source inverse calculation. However, the crossover rate and mutation rate of the MGA algorithm adopted fixed parameters of the standard genetic algorithm (SGA), which led to a slow convergence speed and poor stability of the algorithm. Although the diversity of the population was improved by adding the elimination gene pool, in the cross-inheritance stage, the ratio (0.7:0.3) of the individual genes in the parent population and those in the elimination gene pool population were adopted for cross inheritance. In this case, unfavorable genes were introduced into the elimination gene pool, which polluted the excellent genes and led to poor stability of the algorithm. In view of this, an improved genetic algorithm called NMGA (New Modified Genetic Algorithm, NMGA) was designed and implemented. The adaptive crossover rate and mutation rate were built in this study. In addition, the crossover method of the individual genes in the parent population and those in the elimination gene pool were changed in this study. This further improved the convergence efficiency and stability of the MGA algorithm and provided effective emergency decision-making data for hazardous and light gas leakage accident sites.

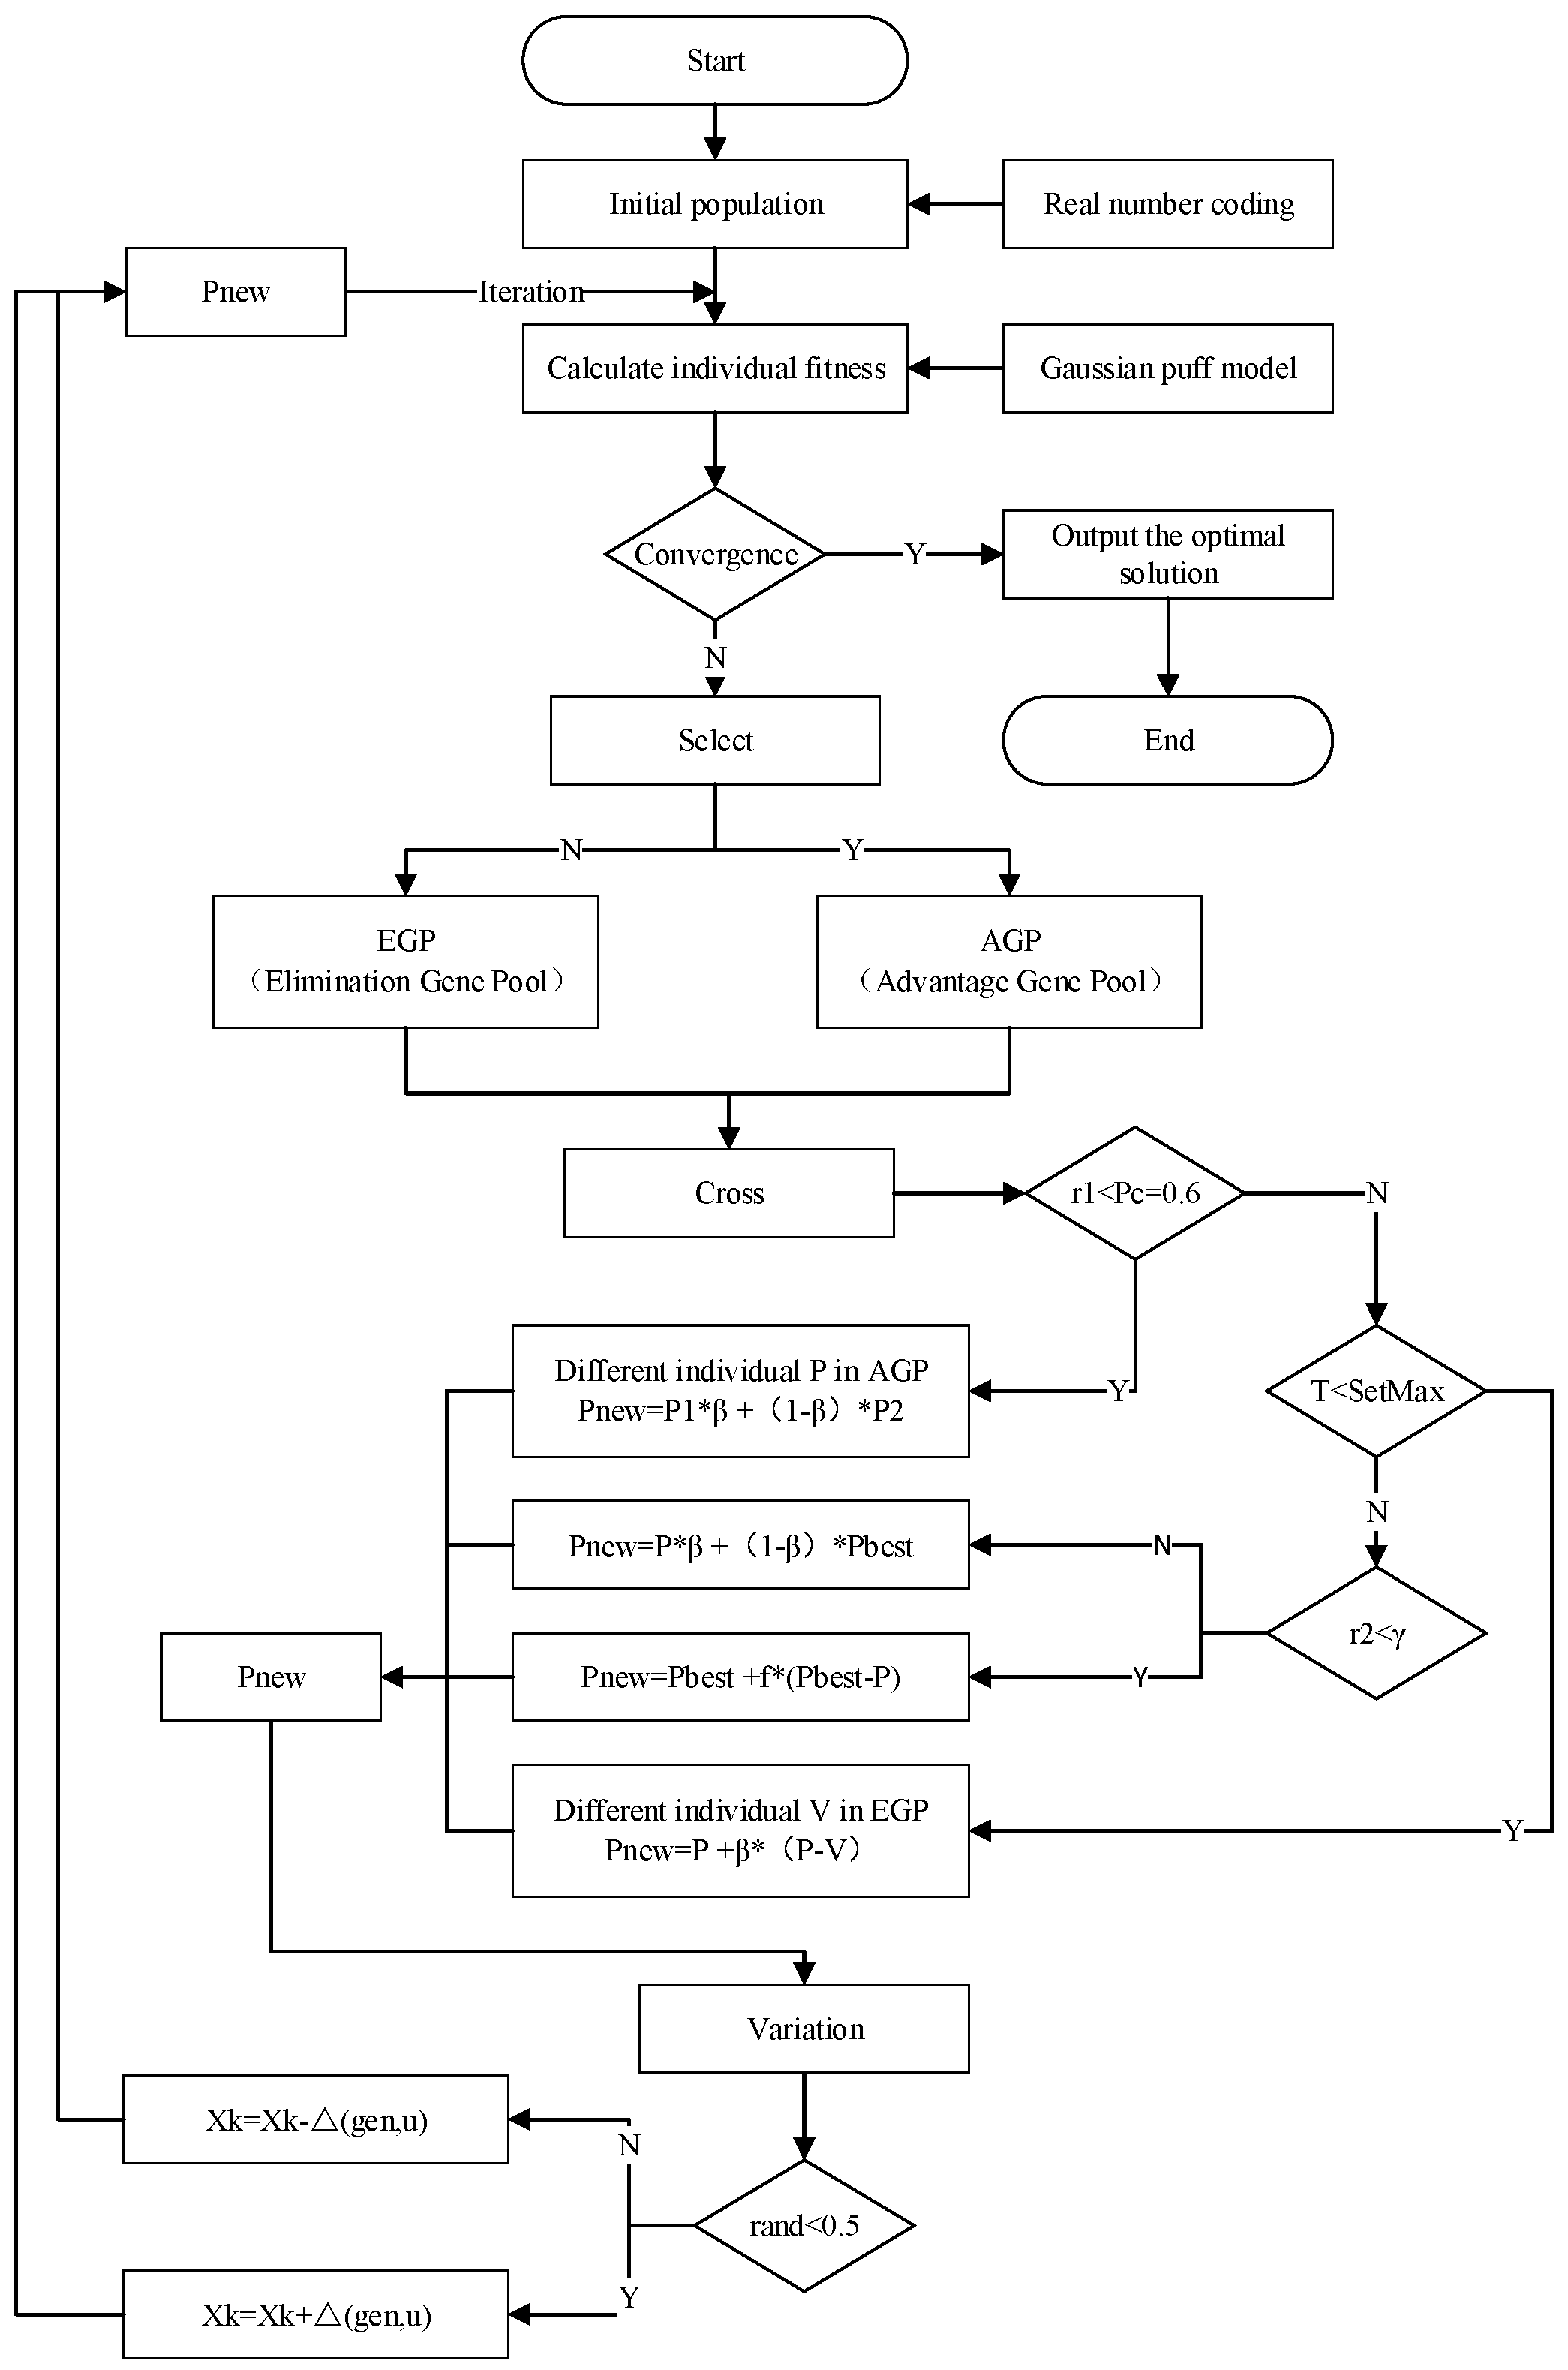
2. Improved Design of the Genetic Algorithm

A Genetic Algorithm [12] (GA) is a direct optimization algorithm based on the genetic mechanism of “survival of the fittest”. The order of the genetic structure sequence is individual evaluation, selection, crossover, and mutation.

2.1. Initial Population Generation

Many encoding methods can be used by a genetic algorithm to optimize function problems [13]. Different encoding methods are used according to the difficulty in the implementation of specific problems. Among them, real number coding has high precision and fast calculation efficiency [14], and it can avoid the Hamming cliff problem caused by binary coding [15]. Hence, this study adopts real number coding to ensure calculation accuracy. In this case, it is assumed that the value range of the gene value at the individual X k of the population is [ U m i n k , U m a x k ] . The random numbers p i c k ~ U ( 0 , 1 ) are generated. Then, the gene X_k can be obtained by the linear interpolation shown in Formula (1).
X k = U m i n k p i c k ( U m a x k U m i n k )

2.2. Selection Operation

The genetic algorithm follows the principle of “survival of the fittest” in the selection stage, and its selection results directly lead to the loss of genetic diversity in the population [16,17]. The traditional roulette wheel selection operator selects individuals randomly, which is not conducive to the development of population diversity, resulting in premature and slow search speed of the algorithm [18]. To address this issue, this study adopted the tournament selection operator [19] with better performance, which passes the best individual to the next generation while satisfying the diversity of the population individuals. The specific operation steps of the tournament selection strategy are as follows:
(1) Determine the number of individuals selected each time (k).
(2) Randomly select k individuals from the population to form a group. Record the position number of the current population. Store the individual number with the best fitness value in the current group into the index array.
(3) Repeat step (2) until the number of individuals in the index population meets the requirement.
(4) According to the number in index array, the selected individuals are stored in the advantage gene pool (AGP). The numbered individuals that do not appear in the index group are stored in the elimination gene pool (EGP).

2.3. Improvement of Crossover Operator

In reference [11], the addition of the elimination gene pool to MGA increased the population diversity to a certain extent. However, in the cross-inheritance stage, the inheritance was in a cross-proportional manner with a maternal inheritance rate of 0.7 and an individual gene inheritance rate of 0.3 in the elimination gene pool population. This is quite likely to introduce unfavorable genes in the elimination gene pool at the genetic stage and destroy the excellent group genes, leading to poor stability of the algorithm. In this study, to reduce the introduction of unfavorable genes in the elimination gene pool, the individual genes in the parent population and the individual genes in the elimination gene pool were cross-inherited at a ratio of 1:0.3 to improve the stability of MGA. The specific operation steps are as follows:
(1) Randomly select i different individuals P i (i = 1, 2) from the AGP pool in the selection stage. Generate random numbers r 1 ~ U ( 0 , 1 ) . Record the crossover rate as P c and the maternal inheritance rate as β. If r 1 < P c , then P i still performs crossover operations following the traditional crossover method of GA. The way of crossover is shown in Formula (2). If r 1 P c , then go to step (2).
P n e w _ i = β P i + ( 1 β ) P i
(2) Record the current genetic generation as T. Set the upper limit of the optimal point stagnation generation as SetMax. If T < SetMax, then go to step (3); otherwise, go to step (4).
(3) Randomly select i different individuals V i (i = 1, 2) from the EGP pool in the selection stage and perform crossover operations with P i .
P n e w _ i = P i + β ( P i V i )
(4) Generate random numbers r 2 ~ U ( 0 , 1 ) . Record the following rate as γ . If r 2 < γ , the following process is performed; otherwise, the active search process is performed, where P b e s t is the current optimal individual, P i is the current genetic individual, P n e w _ i is the updated individual, and f is a random number such that f ~ N ( 0 , 1 ) .
P n e w _ i = { P b e s t + f ( P b e s t P i )   r 2 < γ β P i + ( 1 β ) P b e s t   r 2 > γ
(5) Repeat steps (1)–(4) until the number of individuals in the population meets the requirement.

2.4. Mutation Operator

The mutation operator expands the search range of the algorithm by changing the individual genes of the population to overcome the local convergence and cause the algorithm to have global convergence [20,21]. To effectively retain excellent individuals in the later stage of the algorithm, a non-uniform mutation operator [22] was adopted in this study. It is assumed that the value range of the gene value at the mutation point X k is [ U m i n k , U m a x k ] . The random numbers r a n d ~ U ( 0 , 1 ) are generated. Then, the new gene X k is determined by Formula (5).
X k = { X k + Δ ( g e n , U m a x k X k )   r a n d < 0.5 X k Δ ( g e n , X k U m i n k )   r a n d > 0.5
where u represents ( U m a x k X k ) and ( X k U m i n k ) ; Δ ( g e n , u ) represents a random number that conforms to a non-uniform distribution within [ 0 , u ] . As the evolutionary generation gen increases, Δ ( g e n , u ) gradually approaches 0. The calculation of Δ ( g e n , u ) is shown in Formula (6):
Δ ( g e n , u ) = u ( 1 r ( 1 g e n / m a x g e n ) b )
where r conforms to a uniform distribution r   ~ U ( 0 , 1 ) ; maxgen represents the maximum evolved generation; and b is the system parameter (b = 2 in this study) that determines the degree of dependence of random number perturbation on evolved generation gen.

2.5. Improvement of Crossover Rate and Mutation Rate

In the genetic algorithm, crossover and mutation operators [23] are the key factors for algorithm evolution, convergence, and stability. The crossover operator improves the global search ability of the genetic algorithm by realizing the genetic recombination among different individuals of the population to obtain excellent individuals [24]. The mutation operator expands the search range of the algorithm by changing the individual genes of the population, and it overcomes the local convergence to cause the algorithm to have global convergence. The value of the crossover rate directly affects the genetic diversity of the population [25]. The greater the crossover rate, the richer the population diversity, and the faster the generation of new individuals, but the greater the possibility that excellent individuals are destroyed. On the contrary, for a small crossover rate, it is difficult to generate new individuals, causing the search process to stagnate. The mutation rate largely determines whether the global optimal solution can be searched. The smaller the mutation rate is, the less likely it is to generate new individual structures, thus decreasing the diversity of the population. If the mutation rate is too large, the genetic algorithm can become a pure random search algorithm [26]. According to the Darwinian evolution theory [27], the population concentration mode in the initial stage of the algorithm is dominated by individuals with low fitness. Thus, this study used a larger crossover rate and a smaller mutation rate to improve the search speed and population diversity. In the later stage of the algorithm, the population concentration mode develops towards high fitness. At this time, by reducing the crossover rate and increasing the mutation rate, the diversity of the population can be increased to prevent the algorithm from falling into the local extreme value. Inspired by the non-uniform mutation operator that changes the length of Δ ( g e n , u ) in the evolutionary generation progresses in reference [22], the crossover rate Pc and mutation rate Pm are designed as follows:
P c = P 1 ( 1 g e n / m a x g e n ) b
P m = P 2 ( 1 + g e n / m a x g e n ) b
where P1 represents the initial crossover rate; P2 represents the initial mutation rate (P1 = 0.6, and P2 = 0.01 in this study); gen represents the current evolving generation number; maxgen represents the total evolution generation number of the algorithm; and b is the system parameter (b = 2 in this study). On the basis of this improvement, with the progress of evolution, the crossover rate Pc can gradually decrease, while the mutation rate Pm can gradually increase.

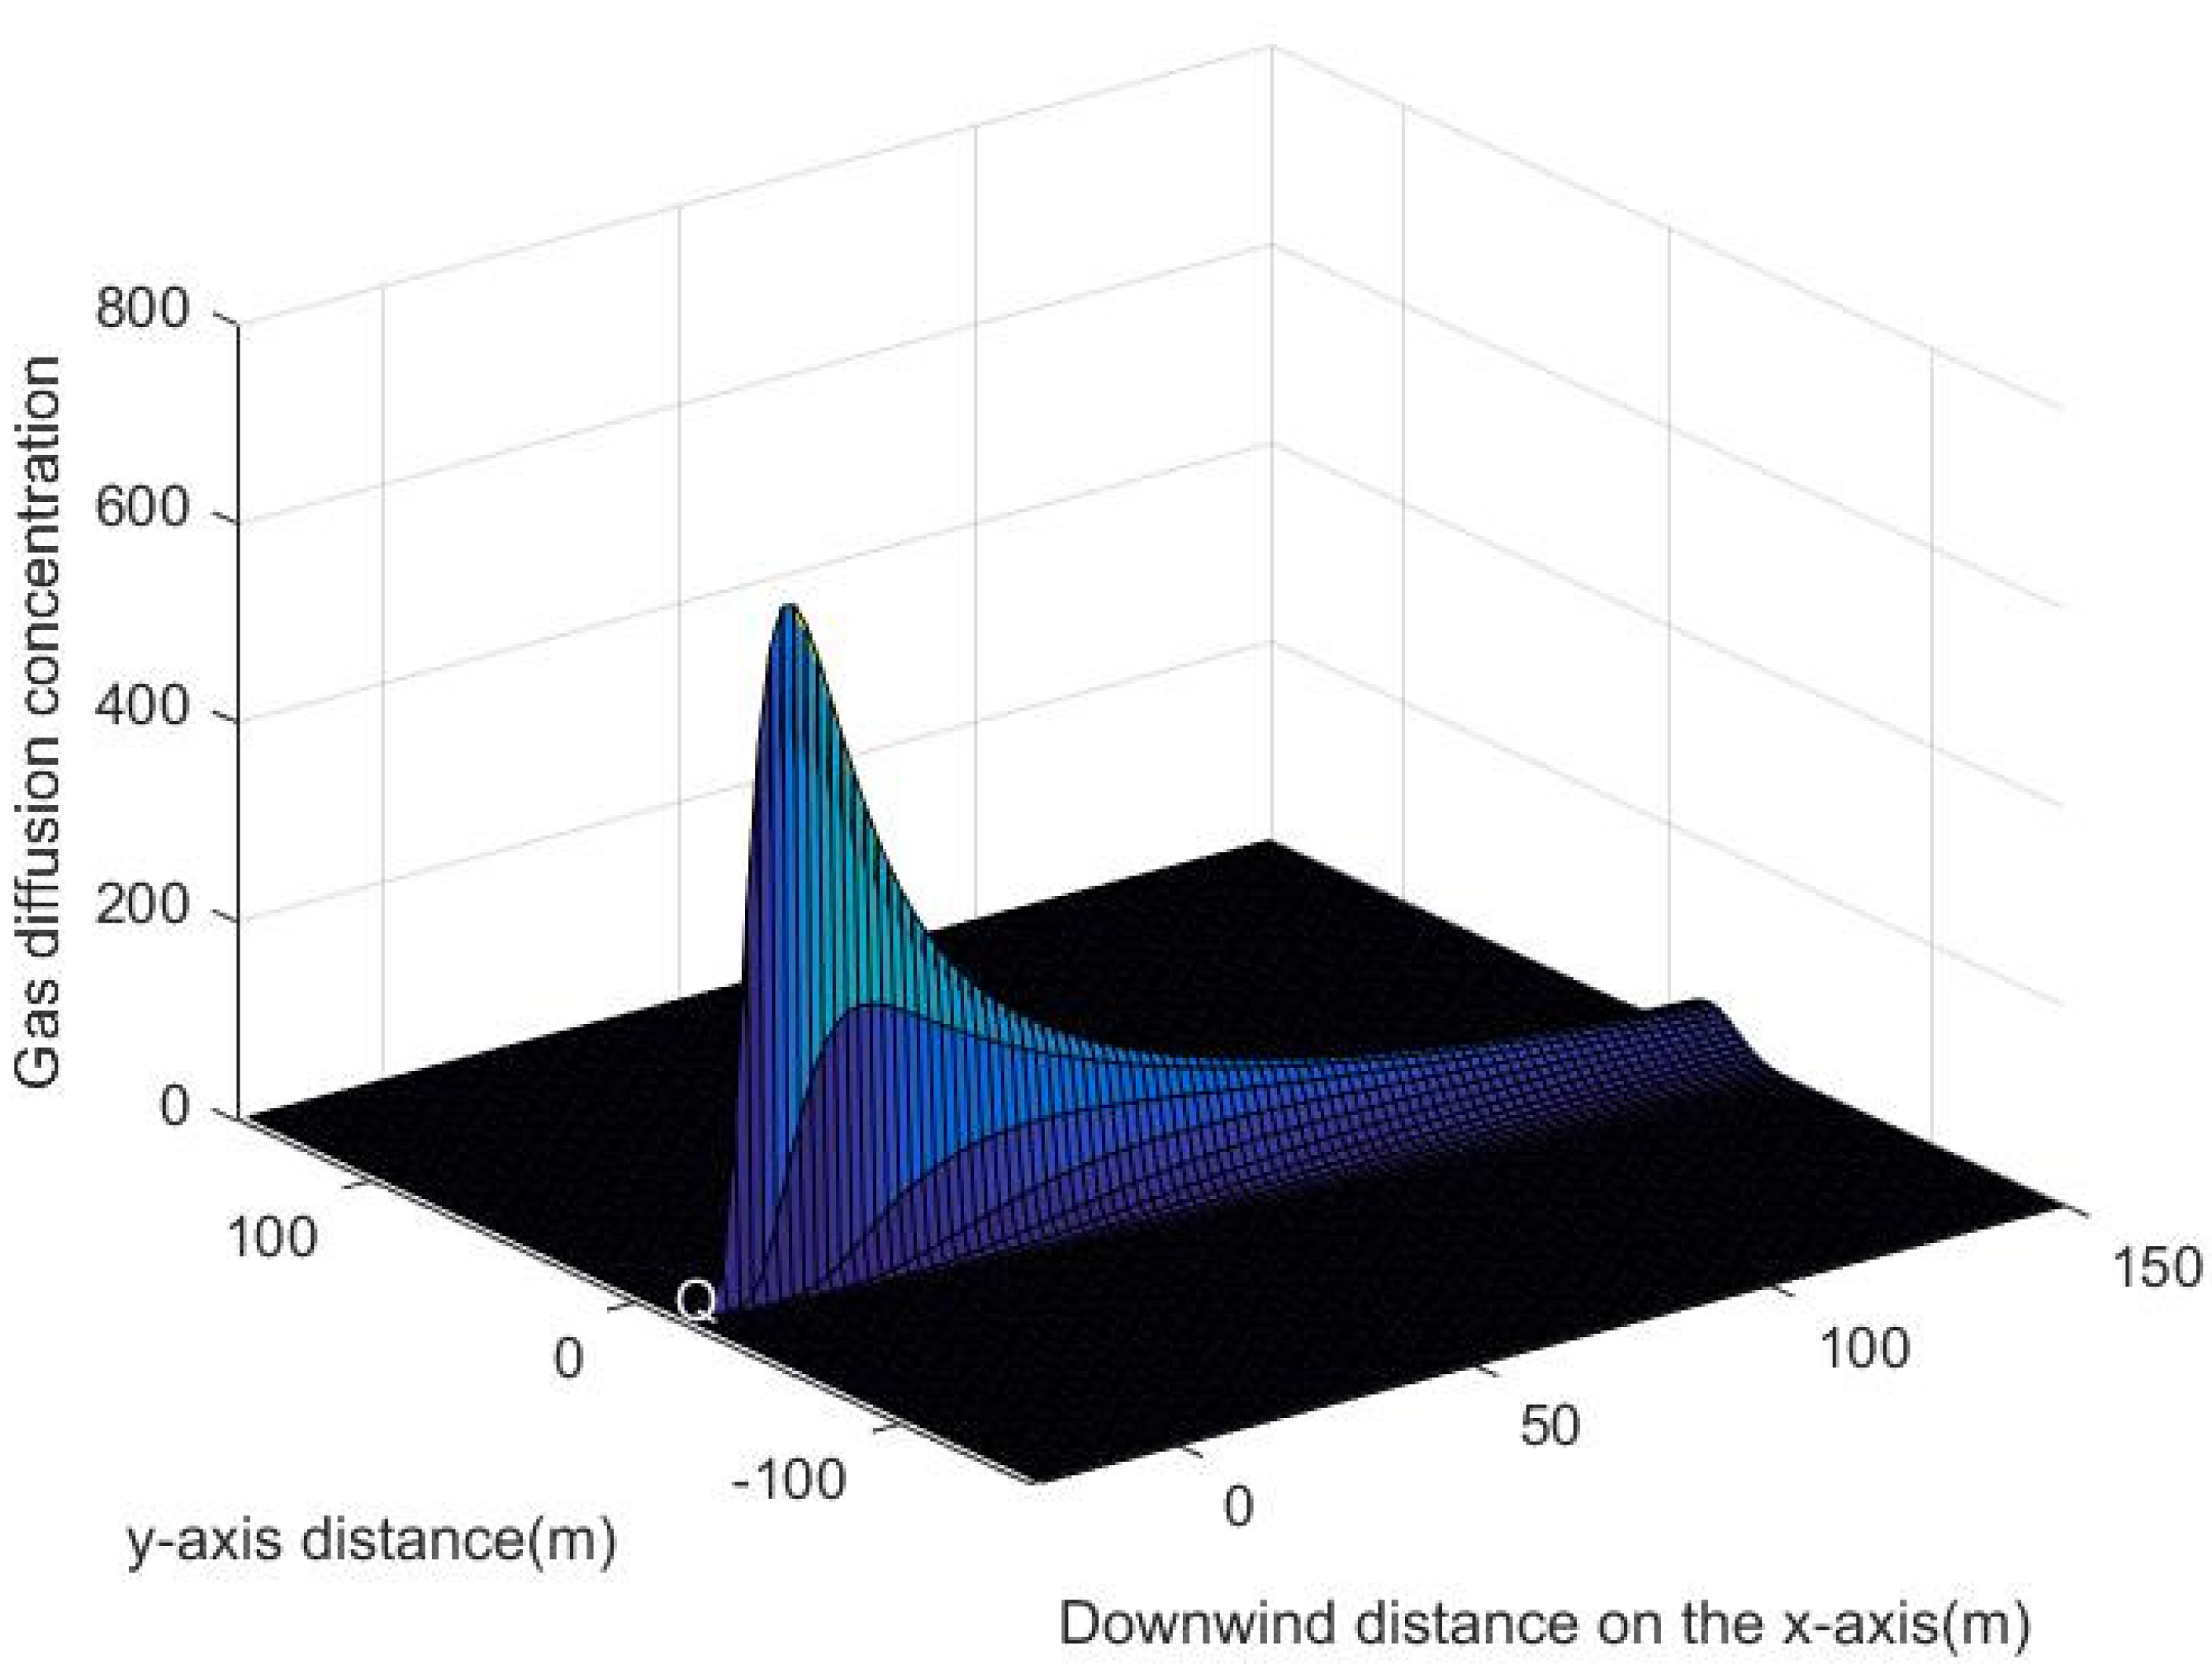
3. Simulation of Continuous Leakage of Single-Point Gas Source in 3D Space

According to the above improved algorithm, a technology roadmap is designed. The specific implementation process is shown in Figure 1.
In the early research, various gas diffusion models have been established to predict the gas diffusion process. Among these models, the Gaussian model [28,29] is suitable for the diffusion of non-heavy gases. It is currently the most widely used method for simulating gas concentration distribution, and it is also specified by the National Environmental Quality Assessment Standard [30]. Therefore, the Gaussian plume model of the continuous point source leakage scene was selected as the prior model in this study.
C ( x , y , z ) = Q 0 2 π μ σ y σ z e x p [ ( y y 0 ) 2 2 σ y 2 ] · { e x p [ ( z + H e ) 2 2 σ z 2 ] + e x p [ ( z H e ) 2 2 σ z 2 ] }
where C ( x , y , z ) is the gas concentration predicted by the model at the downwind; Q 0 is the leakage intensity (unit: g/s); μ is the wind speed (unit: m/s); He is the effective height of the leakage point; and σ y and σ z respectively represent diffusion coefficients of crosswind and vertical direction and have a certain correlation with the atmospheric stability. The level of atmospheric stability is divided into six levels, which are respectively represented by A (strong instability), B (instability), C (weak instability), D (neutral), E (relatively stable), and F (stable).
Meanwhile, a process coordinate system was established, where the x-axis (0 m, 1000 m) is parallel to the wind direction, and the y-axis (−500 m, 500 m) is perpendicular to the wind direction. Under the process coordinate system, it is assumed that the weather conditions at this time have few clouds. In addition, to simulate continuous leakage scenes of single-point sources in a 3D space, it was assumed that the leakage source intensity = 15,178.32 g/s; the height of leakage point was Hr = 2 m; the atmospheric stability was E-level; and the average wind speed μ = 2.0 m/s. Considering the actual safety, the coordinate origin of the simulated leakage scene was moved to the left by 25 m and up by 16 m. Then, the position of the coordinate origin became (x = −25, y = 16) (Figure 2). The location of emission source is Q in Figure 2. The atmospheric stability E-level diffusion coefficient was determined by the Pasquill–Gifford [31] model diffusion coefficient equation.

4. Case Application and Analysis

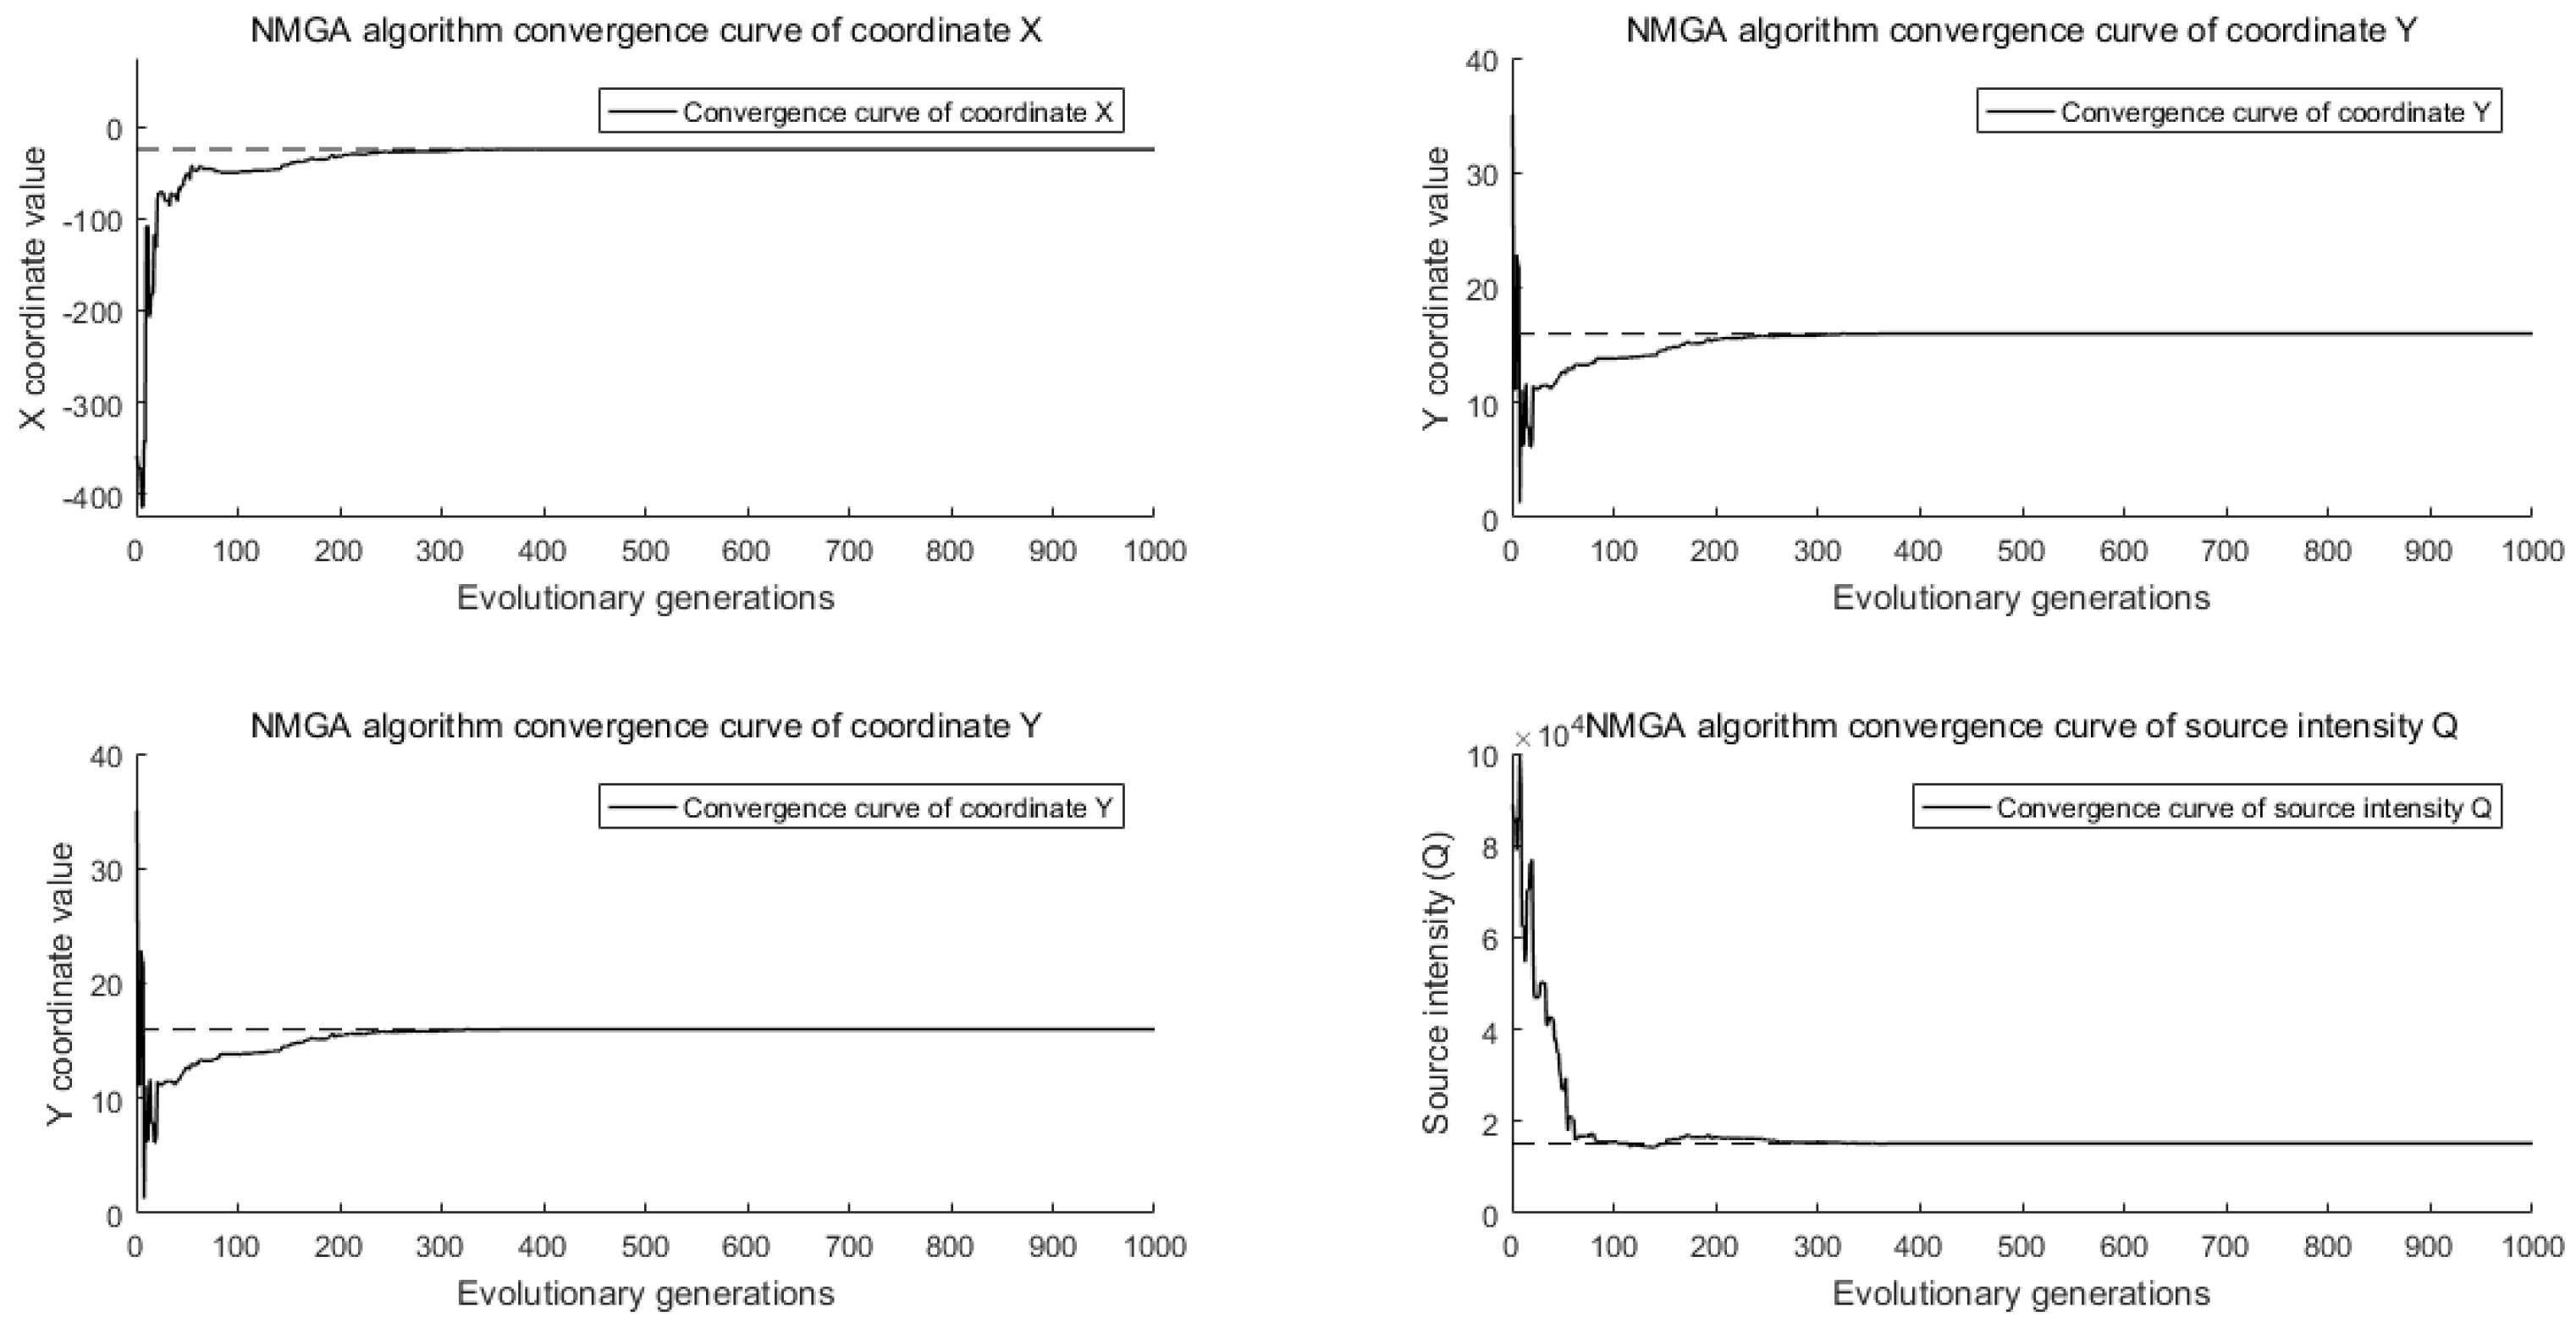
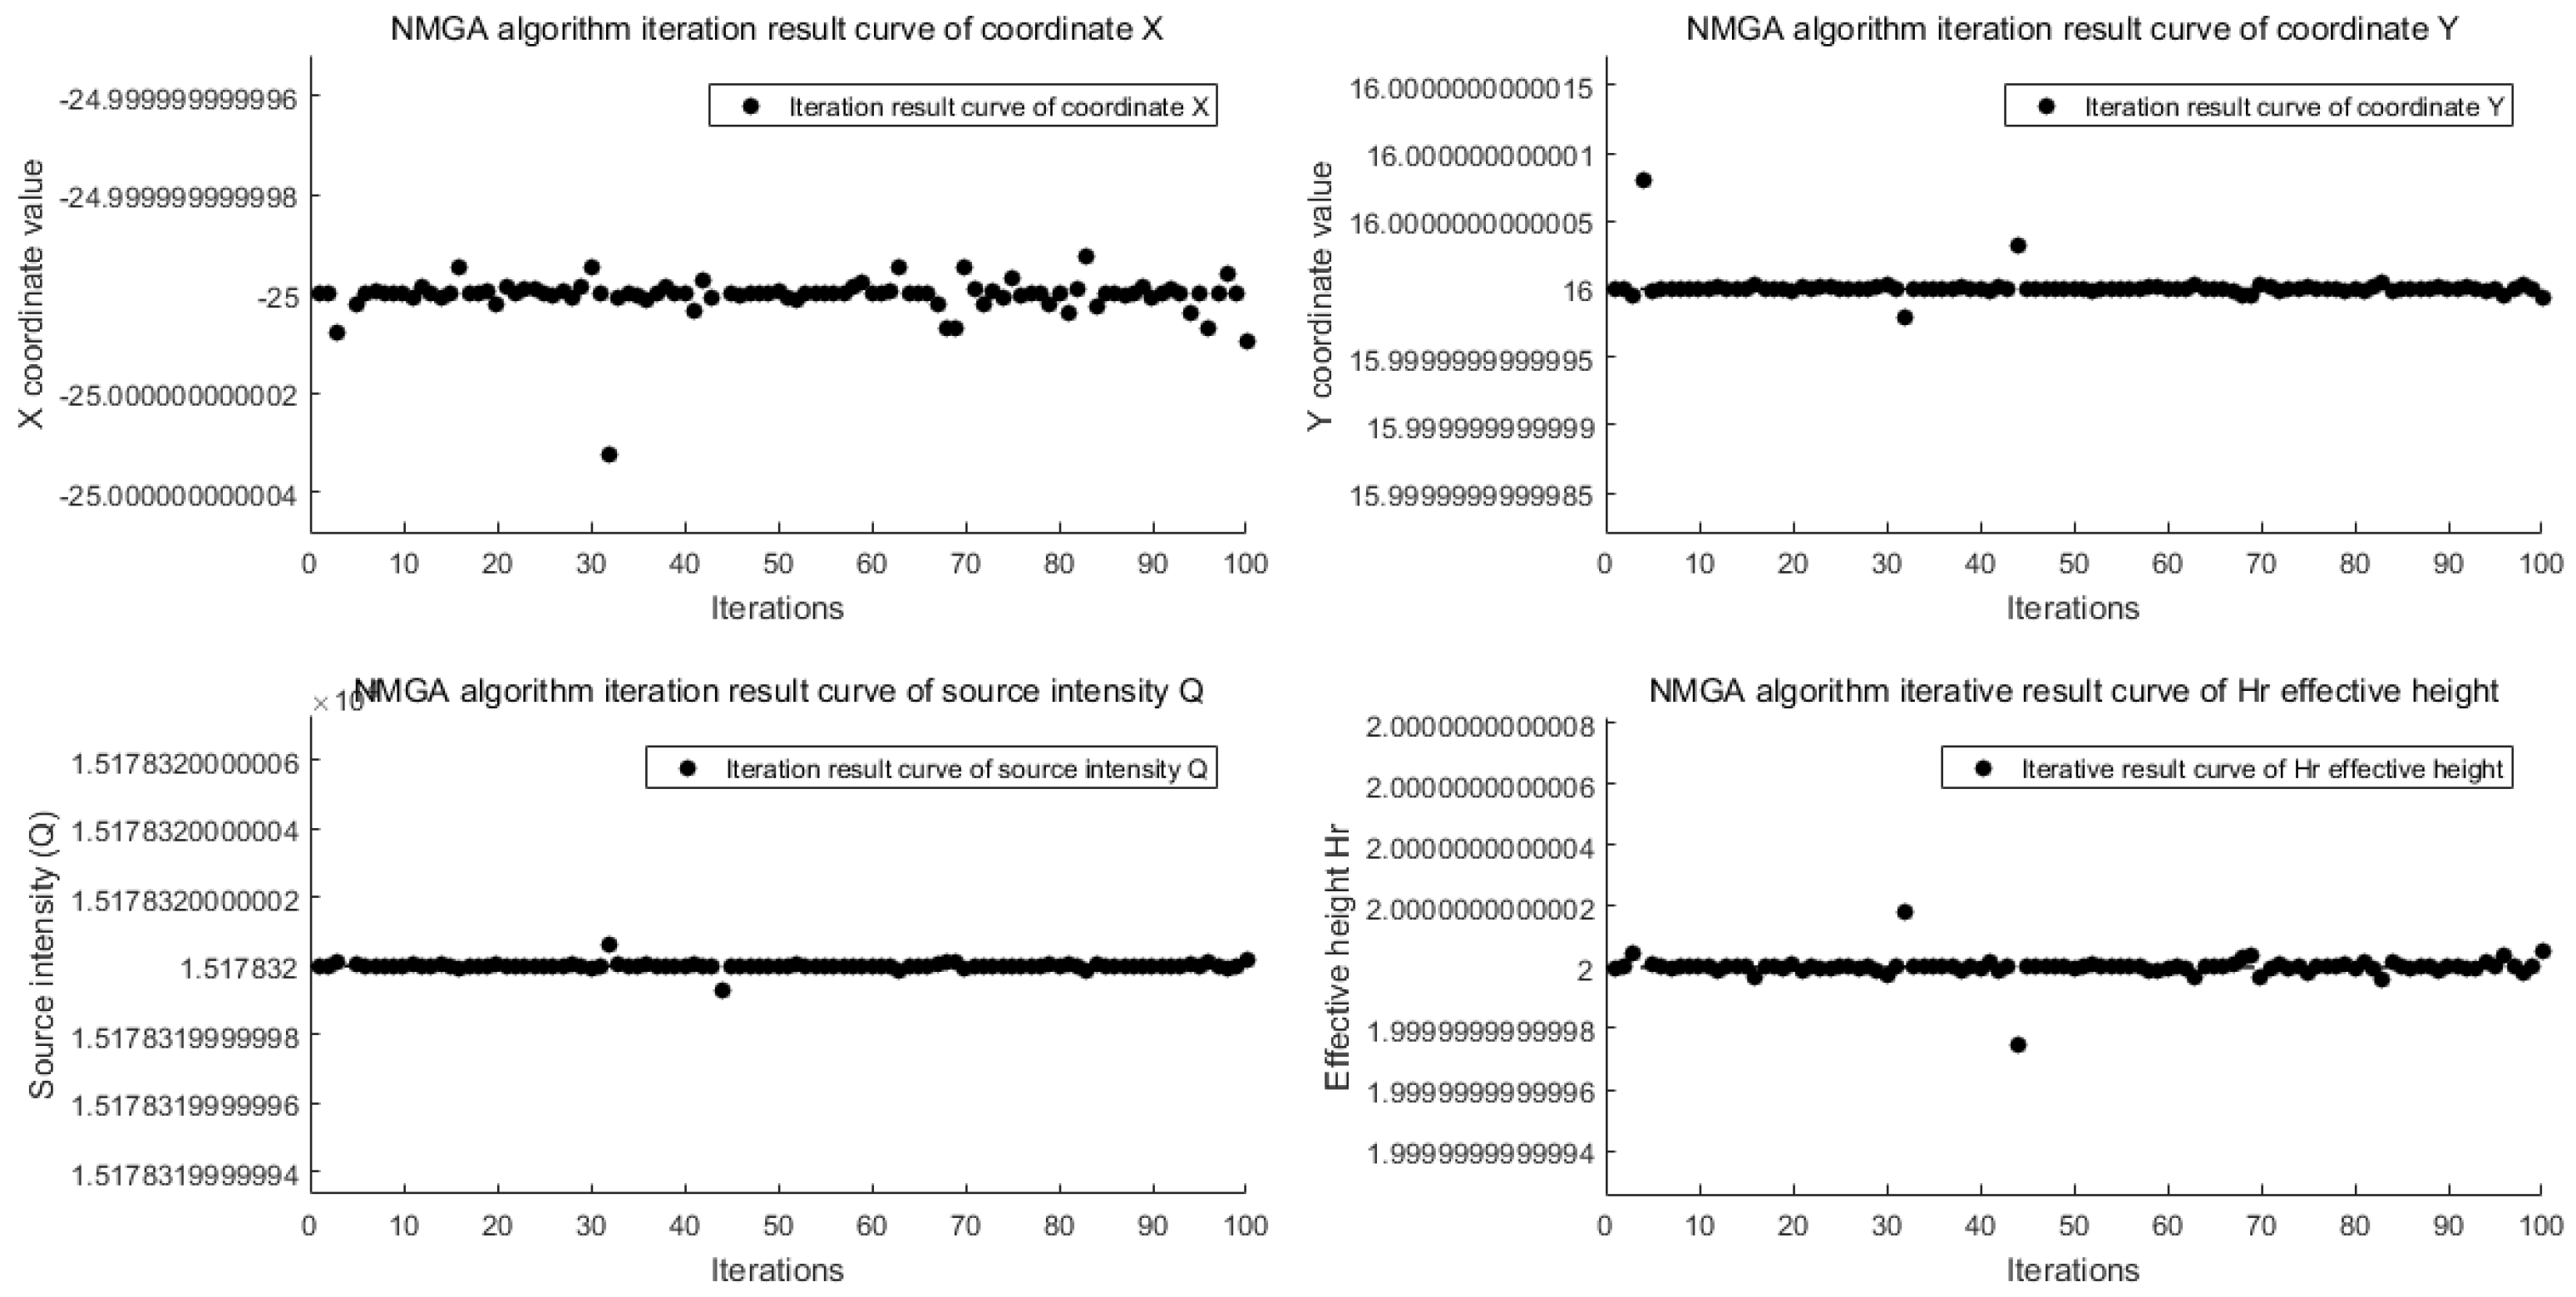
4.1. Implementation of Modified Genetic Algorithm

To increase the richness of the estimated information, a grid of sensors with a figure-eight distribution was established to obtain monitoring data. It was assumed that C o b s i and fixed C c a l i are the observed concentration and predicted concentration of the i-th measurement point, respectively. Then, the objective function to be optimized for the source intensity inverse calculation is expressed as:
m a x f o b j = 1 / i = 1 n ( C o b s i C c a l i ) 2
where n is the total number of sensors; C c a l i is obtained via Formula (9). With this objective function, the NMGA was calculated and simulated in Matlab to obtain the inverse calculation results of the strong source location, source intensity leakage rate, and effective height.
Reference [11] demonstrated that MGA can break through the limitation of population size, and small populations can also contribute to excellent results. Hence, independent experiments were conducted in this study using different operation generations with fixed population sizes. Reference [11] built a leak scenario for continuous leakage of a single-point source in a two-dimensional space. The fixed parameters, including the crossover rate P c = 0.6 , maternal inheritance ratio β = 0.7, the following rate γ = 0.5 , and the upper limit of optimal point update stagnation generation number SetMax = 20 were used for the inverse calculation of the source intensity location and source intensity by the new crossover genetic algorithm MGA. On the basis of the population number of 100 and generation number of 2000, 100 independently replicated experiments were conducted to obtain the position (x, y) and the mean, standard deviation, and relative error of source intensity leakage rate Q. The statistical data are listed in Table 1 in the MGA column.
Meanwhile, in this study, the leakage scene for the continuous leakage of a single-point source in a 3D space was constructed. The fixed parameters, including the dynamic crossover rate P c , the mutation rate P m , the maternal inheritance ratio β = 0.7, the following rate γ = 0.5, and the upper limit of optimal point update stagnation generation number SetMax = 20 were used for the inverse calculation of the source intensity position, source intensity, and effective height by the NMGA algorithm. In addition, 100 independent repeated experiments were performed on 100 × 1000 (population number × generation number) and 100 × 500 to obtain the position (x, y) and the mean, standard deviation, and relative error of source intensity leakage rate Q and effective height H. The results are listed in Table 1 in the NMGA column.

4.2. Comparative Analysis

(1) Time complexity
The time complexity of the MGA and NMGA algorithms is expressed in Formula (11)
T ( M G A ) =   M × ( T s e l e c t + T Elimination + T cross + T m u t a t i o n ) = O ( N × M )
where N represents the population number, and M represents the generation number; T s e l e c t , T Elimination , T cross , and T m u t a t i o n represent the selection, elimination, crossover, and mutation stages, respectively.
MGA and NMGA have the same time complexity. However, MGA adds genetic generation to improve the computation performance and the accuracy of inverse calculation results. This approach increases the computation cost and violates the time limit principle. The NMGA algorithm shows good inverse calculation accuracy, and it converged in approximately 300 generations (Figure 3).
(2) Error analysis
As listed in Table 1, when the population size is fixed, 100 rounds of inverse calculation of the MGA (2000 generations) and NMGA algorithms (1000 generations and 500 generations) were independently run. By comparing their relative errors, it was found that the relative error of the NMGA inverse calculation results was much smaller than that of the MGA inverse calculation results, showing good inverse calculation accuracy. Figure 4 presents the absolute error graph of the inverse calculation of the source intensity position, leakage rate, and effective height of the NMGA algorithm for 100-round independent repeated experiments. It can be seen that the results of the NMGA algorithm fluctuated around its true value with a quite small absolute error, showing excellent stability.
(3) Statistical significance test
From the standard deviation of the inverse calculation results: the standard deviation of NMGA was distributed with 10−9, indicating that NMGA is better than MGA. Even when the number of iterations of NMGA is one-half and one-quarter that of MGA, the standard deviation of NMGA is also smaller and more stable.

5. Conclusions

(1) The dynamic crossover rate and mutation rate that change with evolutionary generation were designed. The modified genetic algorithm was optimized by changing the crossover mode to the maternal inheritance rate of 1.0 and the elimination gene inheritance rate of 0.3. NMGA can solve the problems of slow convergence in the early stage of MGA and poor stability in the later stage.
(2) Through quantitative and qualitative comparative analysis, it was found that the improved NMGA model built an adaptive crossover rate and mutation rate, which further improved the slow convergence speed of MGA. From the perspective of time complexity, error, and statistical significance, it is shown that the algorithm has improved its convergence rate and stability.
(3) The new improved NMGA model can better provide emergency decision-making data for the toxic gas leakage accident scene and for fire protection and other fields, thereby guaranteeing national and ecological security.

Author Contributions

J.Y. conceived and designed the research, processed the data, and wrote the manuscript draft; Y.L. helped design the research and revise the manuscript; T.L. and Z.F. helped conceive the research and review the manuscript; S.Z. and H.L. conducted the fieldwork and analyzed the data. All authors have read and agreed to the published version of the manuscript.

Funding

This research was funded by the Scientific Research Projects for the National Natural Science Foundation of China (Grant No. 42101393).

Institutional Review Board Statement

Not applicable.

Informed Consent Statement

Not applicable.

Data Availability Statement

Data sharing is not applicable to this article.

Acknowledgments

We would like to thank the anonymous reviewers for the constructive comments on our manuscript, and we would like to express grateful appreciation to the funding support by the Scientific Research Projects for the National Natural Science Foundation of China (Grant No. 42101393).

Conflicts of Interest

The authors declare no conflict of interest.

References

  1. Zhang, J.; Liu, X.; Wei, L. Comparative study on the method of strong inverse calculation of leakage source of hazardous chemicals. China Saf. Sci. J. 2009, 19, 165–171. [Google Scholar] [CrossRef]
  2. Thomson, L.C.; Hirst, B.; Gibson, G.; Gillespie, S.; Jonathan, P.; Skeldon, K.D.; Padgett, M.J. An modified algorithm for locating a gas source using inverse methods. Atmos. Environ. 2007, 41, 1128–1134. [Google Scholar] [CrossRef]
  3. Zheng, X.; Xing, H. The source strength inverse calculation of pattern search algorithm in gas leakage. China Saf. Sci. J. 2010, 20, 29–34. [Google Scholar]
  4. Zhang, J. Research and Application of Source Strong Inverse Calculation Algorithm BASED on Monitoring Data; China Petroleum University: Beijing, China, 2011. [Google Scholar]
  5. Wang, Y. Source Strength and Position Inverse calculation Based on Hybrid Genetic-Nelder Mead Simplex Algorithm; Beijing University of Chemical Engineering: Beijing, China, 2011. [Google Scholar]
  6. Zhang, J.; Wang, Y.; Zheng, X.; Wang, Z. Source strength and position inverse calculation based on mixed genetic-Nelder Mead simplex algorithm. Theory Pract. Syst. Eng. 2011, 31, 1581–1587. [Google Scholar]
  7. Reich, S.L.; Gomez, D.R.; Dawidowski, L.E. Artificial neural network for the identification of unknown air pollution sources. Atmos. Environ. 1999, 33, 3045–3052. [Google Scholar] [CrossRef]
  8. Fan, Q.; Wang, P.; Gao, X.J. Improved genetic algorithm based on oriented crossover. Control Decis. 2009, 24, 542–546. [Google Scholar]
  9. Cui, S.S. Some Improvements of the Genetic Algorithm and their Applications; University of Science and Technology of China: Hefei, China, 2010. [Google Scholar]
  10. Haupt, S.E.; Beyer-Lout, A.; Long, K.J.; Young, G.S. Assimilating concentration observations for transport and dispersion modeling in a meandering wind field. Atmos. Environ. 2009, 43, 1329–1338. [Google Scholar] [CrossRef]
  11. Zhang, R.; Li, J. Source strength inverse calculation based on an improved genetic algorithm. China Saf. Sci. J. 2016, 26, 57–62. [Google Scholar]
  12. Holland, J.H. Adaptation in Natural and Artificial Systems: An Introductory Analysis with Applications to Biology, Control, and Artificial Intelligence; MIT Press: Boston, MA, USA, 1992; pp. 203–205. [Google Scholar]
  13. Yu, Y.; Liu, Y.; Wei, G. Encoding theory and application of genetic algorithm. Comput. Eng. Appl. 2006, 3, 86–89. [Google Scholar]
  14. Zhang, C.; Zheng, J.; Qian, J. Comparison of genetic algorithm coding schemes. Comput. Appl. Res. 2011, 28, 819–822. [Google Scholar] [CrossRef] [Green Version]
  15. Liu, Z.; Wang, X.; Xue, L.; Zhang, B.; Zhang, S. Improvement and parallelism of real-coded genetic algorithm. J. Hebei Univ. 2019, 39, 86–92. [Google Scholar]
  16. Zhou, Y.; Hu, Z. Application of improved fast genetic algorithm in function optimization. Mod. Electron. Tech. 2018, 41, 153–157. [Google Scholar]
  17. Ge, J.; Qiu, Y.; Wu, C.; Pu, G. Review of genetic algorithm research. Comput. Appl. Res. 2008, 2911–2916. [Google Scholar]
  18. Sourabh, K.; Singh, C.S.; Vijay, K. A review on genetic algorithm: Past, present, and future. Multimed. Tools Appl. 2021, 80, 8091–8126. [Google Scholar]
  19. Shen, C.S. Implementation of common selection operators in MATLAB in genetic algorithm. J. Shanghai Inst. Appl. Technol. 2003, 199–202. [Google Scholar]
  20. Pan, J.; Qian, Q.; Fu, Y.; Feng, Y. Multi-group genetic algorithm for optimal weight dynamic control learning mechanism. Comput. Sci. Explor. 2021, 15, 2421–2437. [Google Scholar]
  21. Bian, X.; Mi, L. Research Progress on Genetic Algorithm Theory and Its Application. Appl. Res. Comput. 2010, 27, 2425–2429+2434. [Google Scholar]
  22. Huang, W.; Xu, X.; Fan, J. Matlab implementation and application of common variation operators in real number coding genetic algorithm. Guangxi Light Ind. 2007, 77–78. [Google Scholar]
  23. Lim, S.M.; Sultan, A.B.; Sulaiman, M.N.; Mustapha, A.; Leong, K.Y. Crossover and Mutation Operators of Genetic Algorithms. Int. J. Mach. Learn. Comput. 2017, 7, 9–12. [Google Scholar] [CrossRef] [Green Version]
  24. Yan, C.; Li, M.; Zhou, X. Application of improved genetic algorithm in function optimization. Appl. Res. Computers. 2019, 39, 2982–2985. [Google Scholar]
  25. Schrider, D.R.; Shanku Alexander, G.; Kern Andrew, D. Effects of Linked Selective Sweeps on Demographic Inference and Model Selection. Genetics 2016, 204, 1207–1223. [Google Scholar] [CrossRef]
  26. Yang, C.; Qian, Q.; Wang, F.; Sun, M. Application of improved adaptive genetic algorithm in function optimization. Comput. Appl. Res. 2018, 35, 1042–1045. [Google Scholar]
  27. Flew, A. Darwinian Evolution; Taylor and Francis: London, UK, 2018. [Google Scholar]
  28. Liu, C.; Su, T.; Zhou, R.; Jiang, J. Research on inversion of gas leakage source information under modified Gaussian model. China Saf. Sci. J. 2022, 32, 98–104. [Google Scholar]
  29. Li, S.; Wang, J.; Zeng, J. An improved Gaussian prediction model algorithm for radioactive gas diffusion. Appl. Res. Comput. 2012, 29, 123–126. [Google Scholar]
  30. Sun, Q.; Dong, X.; Ren, Z. GIS Visualization of Atmospheric point source diffusion model. Surv. Mapp. Sci. 2011, 36, 24–25+142. [Google Scholar]
  31. Gifford, J.F.A. Use of routine meteorological observations for estimating atmospheric dispersion. Nucl. Saf. 1961, 2, 47–51. [Google Scholar]
Figure 1. Technical roadmap of improved genetic algorithm.
Atmosphere 14 00089 g001
Figure 2. Continuous leakage diagram of single-point sources in a 3D space.
Atmosphere 14 00089 g002
Figure 3. The inverse convergence curves of X, Y, Q, and He for the NMGA algorithm.
Atmosphere 14 00089 g003
Figure 4. Absolute error graph of the NMGA algorithm for 100 rounds.
Atmosphere 14 00089 g004
Table 1. Statistical analysis results for 100 independent MGA or NMGA calculations with different iterations.
VariablesType
MGANMGANMGA
Population × generation (N × M)100 × 2000100 × 1000100 × 500
Mean of x/m49.86−25−24.9719
Mean of y/m25.021616.0081
Mean of Q/(g·s−1)10,442.9615,178.0015,173
Mean of Hr/(g·s−1)2.001.9981
x standard deviation/m and relative error1.04 and 2.08%7.96 × 10⁻¹² and 5.46 × 10−140.25 and 0.11%
y standard deviation/m and relative error0.08 and 0.32%5.32 × 10⁻¹³ and 5.71 × 10−150.02 and 0.011%
Q distribution standard deviation/(g·s−1) and relative error55.40 and 0.53%1.46 × 10⁻⁹ and 1.43 × 10−1442.24 and 0.038%
Hr standard deviation/m and relative error4.4 × 10−13 and 3.7 × 10−140.02 and 0.094%
Disclaimer/Publisher’s Note: The statements, opinions and data contained in all publications are solely those of the individual author(s) and contributor(s) and not of MDPI and/or the editor(s). MDPI and/or the editor(s) disclaim responsibility for any injury to people or property resulting from any ideas, methods, instructions or products referred to in the content.

