Next Issue
Volume 14, February
Previous Issue
Volume 13, December


Atmosphere, Volume 14, Issue 1 (January 2023) – 190 articles

Cover Story (view full-size image): 
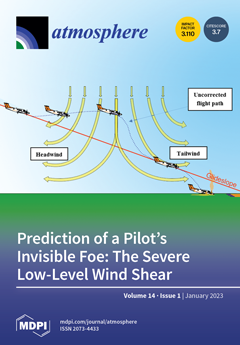
Aviation safety is confronted by severe low-level wind shear (S-LLWS) near airport runways. Understanding the causes of S-LLWS may improve aviation safety. This study introduces the Self-Paced Ensemble (SPE) framework and the Shapley Additive Explanations (SHAP) method for predicting and interpreting S-LLWS. We trained and evaluated Hong Kong International Airport's (HKIA) Doppler LiDAR and pilot report-based data to predict LLWS severity. The SPE framework outperformed other machine learning models in terms of their predictive performance. Afterwards, the SHAP method identified runway 25LD at HKIA, temperature and wind speed as major contributors to the occurrence of S-LLWS. This research is a vital resource for aviation policymakers and air traffic safety analysts. View this paper
  • Issues are regarded as officially published after their release is announced to the table of contents alert mailing list.
  • You may sign up for e-mail alerts to receive table of contents of newly released issues.
  • PDF is the official format for papers published in both, html and pdf forms. To view the papers in pdf format, click on the "PDF Full-text" link, and use the free Adobe Reader to open them.
Order results
Result details
Section
Select all
Export citation of selected articles as:
11 pages, 2310 KiB  
Article
General Method Based on Regressive Relationships to Parameterize the Three-Parameter Depth–Duration–Frequency Curve
by Amirabbas Mottahedin, Carlo Giudicianni, Giuseppe Barbero, Gabriella Petaccia and Enrico Creaco
Atmosphere 2023, 14(1), 190; https://doi.org/10.3390/atmos14010190 - 16 Jan 2023
Cited by 2 | Viewed by 1499
Abstract
This paper aims to present simple regressive equations to estimate the parameters of the three-parameter depth–duration–frequency (DDF) curve (3p-DDF), which accurately expresses, for a preassigned return period, the relationship between the rainfall depth and the rainfall duration over large duration ranges, from below [...] Read more.
This paper aims to present simple regressive equations to estimate the parameters of the three-parameter depth–duration–frequency (DDF) curve (3p-DDF), which accurately expresses, for a preassigned return period, the relationship between the rainfall depth and the rainfall duration over large duration ranges, from below 1 h (i.e., tens of minutes) to above 1 h (up to 24 h). These equations are developed to relate their parameters to those of the two-parameter DDF curve (2p-DDF), which can be estimated more easily being based on more readily available data related to rainfall durations above 1 h. In the applications, the regressive equations are first calibrated using recent pluviographic data in northern Italy, Germany, and Sweden. Two validation steps are then carried out to test the equations in terms of estimated rainfall depths using the same data as those used in the calibration step and data of stations from other geographic areas, i.e., Sicily in southern Italy, and from the past century, respectively. The results obtained prove this methodology capable of providing reliable estimation of short-duration rainfalls with various return periods in the absence of measurements with fine temporal resolution. Full article
(This article belongs to the Special Issue Climate Change Impacts on Urban Stormwater Management)
Show Figures

Figure 1

18 pages, 6648 KiB  
Article
A Comparative Analysis of Two Mediterranean Tornado Hotspots
by Elenio Avolio and Mario Marcello Miglietta
Atmosphere 2023, 14(1), 189; https://doi.org/10.3390/atmos14010189 - 16 Jan 2023
Cited by 1 | Viewed by 2131
Abstract
An updated climatology of EF1+ (Enhanced Fujita category 1 or stronger) tornadoes in Italy (445 events in the period of 1990–2021) confirms that the central Tyrrhenian (CT) and the southeastern (SE) regions of the Italian peninsula represent two of the areas most affected [...] Read more.
An updated climatology of EF1+ (Enhanced Fujita category 1 or stronger) tornadoes in Italy (445 events in the period of 1990–2021) confirms that the central Tyrrhenian (CT) and the southeastern (SE) regions of the Italian peninsula represent two of the areas most affected by tornadoes in the Mediterranean. We performed a comparative analysis between these two hotspots, examining the large-scale atmospheric features associated to the tornado occurrences, throughout the analysis of radiosounding observations and reanalysis (ERA5) fields. The conditions in which the tornadoes develop are investigated using metrics regarding atmospheric instability and/or horizontal/vertical wind shear. Common synoptic characteristics are found for both regions, i.e., a prevalent occurrence of tornadoes on the eastern flank of approaching troughs, with moderate shear/CAPE mean values. A large number of events develop in a high-shear/low-CAPE (HSLC) environment, in the presence of positive sea surface and 850 hPa temperature anomalies. Conversely, the upper-level winds suggest different characteristics of the tornado-spawning cells in the two areas, i.e., multi-cells/linear systems for CT and isolated supercells for SE. The maximum values for some typical atmospheric fields/instability parameters in the areas around the tornado hotspots permit the obtention of thresholds that identify the most favorable environments for tornado formation in these Italian areas. Full article
(This article belongs to the Section Meteorology)
Show Figures

Figure 1

17 pages, 6876 KiB  
Article
Air Quality at Ponta Delgada City (Azores) Is Unaffected so Far by Growing Cruise Ship Transit in Recent Years
by Filipe Bernardo, Patrícia Garcia and Armindo Rodrigues
Atmosphere 2023, 14(1), 188; https://doi.org/10.3390/atmos14010188 - 16 Jan 2023
Viewed by 2387
Abstract
The ease of travel allowed by contemporary means of long-range transportation has brought increasingly higher numbers of visitors to remote and relatively undisturbed insular territories. In a framework of environmental conservation of the natural patrimony, sustainably accommodating touristic flooding and the associated polluting [...] Read more.
The ease of travel allowed by contemporary means of long-range transportation has brought increasingly higher numbers of visitors to remote and relatively undisturbed insular territories. In a framework of environmental conservation of the natural patrimony, sustainably accommodating touristic flooding and the associated polluting footprint poses a demanding challenge. Over the past decade, Ponta Delgada, the largest city of the mid-Atlantic Azores archipelago, has become a hotspot for transatlantic cruise ship (CS) lines in spring and autumn. CSs are substantial contributors to the emissions of greenhouse gases (GHG), as well as hazardous sulphur (SOx) and nitrogen (NOx) oxides. It is hereby retrospectively investigated whether the background levels of air pollutants were raised following the CS influx at Ponta Delgada, which conventionally displays great air quality. The daily CS traffic at the local harbor was associated with the daily concentrations of air pollutants (SO2, O3, NO2, NOx, PM10 and PM2.5), monitored by the local urban background monitoring station (~1.3 km northwards). Exceedances above daily legislated limits from 2013 until 2020 only occurred sporadically for PM10 and PM2.5, often during episodes of natural dust storms. No major correlation was found between CS parameters with the recorded values of pollutants, although a noticeable signal of NOX increase of southern origin is observed during spring days with CS presence. Daily data suggest CS influx has not strongly influenced background air quality. A near-source, real-time monitoring network should be implemented in the city to provide the necessary spatial and temporal resolution for tracking short-term fluctuations in air pollutants during CS arrivals and departures. Full article
Show Figures

Figure 1

16 pages, 2951 KiB  
Article
Summer Onset in Northern East Asia: Feature, Mechanism and Variability
by Chen Shi, Zhongda Lin, Yi Lian, Shangfeng Li, Xu Yang, Baizhu Shen, Lixin Su and Gang Liu
Atmosphere 2023, 14(1), 187; https://doi.org/10.3390/atmos14010187 - 16 Jan 2023
Cited by 2 | Viewed by 1550
Abstract
Summer in the East Asian monsoon region is characterized by heavy rainfall and high temperature. Its onset, depicted by monsoon rainfall and/or airflow as well as surface air temperature, has been well documented. However, the onset of summer season is rarely addressed in [...] Read more.
Summer in the East Asian monsoon region is characterized by heavy rainfall and high temperature. Its onset, depicted by monsoon rainfall and/or airflow as well as surface air temperature, has been well documented. However, the onset of summer season is rarely addressed in northern East Asia (NEA) around the northern edge of the East Asian summer monsoon. This study investigates the feature, mechanism, and variability of the summer onset in NEA based on the ERA-5 reanalysis dataset for 1979–2020. Results show that, in climatology, the onset of summer in NEA occurs in pentad 31 when the spring-to-summer warming process is decelerated at the highest rate. The change in the warming rate is mainly attributed to a decrease in the diabatic heat, mostly surface sensible heat, and temperature advection plays a small role. After the onset of summer, regional low-level northwesterly winds are weakened, and a local NEA cyclonic low forms. The latter, coupled with monsoon southerly airflow to the south, advects more moisture into NEA and increases regional rainfall. Furthermore, a temperature threshold of 17 °C, the climatological regional mean surface air temperature in pentad 31, was proposed to depict summer onset in NEA. Based on the temperature threshold, the year-to-year variability of summer onset timing in NEA is revealed, ranging from pentad 29 (late May) to 34 (middle June), with the standard deviation of 1.2 pentads. It advanced by 0.6 pentads, on average, after the late 1990s. This study provides a new method to objectively quantify the timing of summer onset in East Asia, which is thermodynamically explainable and may help us to depict and monitor summer onset in different latitudes and topography. Full article
(This article belongs to the Section Climatology)
Show Figures

Figure 1

15 pages, 1919 KiB  
Article
The Impact of Local Environment and Neighboring Pollution on the Spatial Variation of Particulate Matter in Chinese Mainland
by Chanchan Gao and Min Liu
Atmosphere 2023, 14(1), 186; https://doi.org/10.3390/atmos14010186 - 16 Jan 2023
Viewed by 1448
Abstract
Particulate matter (PM) pollution has caused several environmental problems and damaged human health. To understand the different driving forces of PM2.5 and PM10, we investigated the spatial distribution of PM2.5, PM10, and the ratio of PM [...] Read more.
Particulate matter (PM) pollution has caused several environmental problems and damaged human health. To understand the different driving forces of PM2.5 and PM10, we investigated the spatial distribution of PM2.5, PM10, and the ratio of PM2.5 to PM10 (PM2.5/PM10), and simulated how they respond to socioeconomic, natural conditions and pollutant transmission in 336 cities across Chinese mainland in 2017. The results indicated that 35.4% and 49.7% of cities in Chinese mainland satisfied the national level II standard for PM2.5 (35 μg/m3) and PM10 (70 μg/m3), respectively. The average PM2.5/PM10 was 57.5 ± 9.4%, which is a relatively high value across the world. Global spatial regression results revealed that the transport of pollutants emitted from neighboring regions was the most important factor for local PM concentrations, while population density was the dominant local variable. The influence of socioeconomic factors and the neighboring pollution level on PM2.5 was greater than that on PM10, while the effect of precipitation was greater on PM10. Cluster analysis revealed that 336 Chinese cities could be classified into three groups. The regions with a high PM concentration and a high level of social economy were included in Group 1 (G1). Group 2 (G2) was predominantly observed in southern China, while Group 3 (G3) was seen in western China. Furthermore, population density significantly affected the PM in G2 and PM2.5 in G3, and PM levels in G1 and G3 had a sensitive response to the variation in precipitation, especially PM10. Full article
(This article belongs to the Section Aerosols)
Show Figures

Figure 1

15 pages, 5381 KiB  
Article
Intraseasonal Oscillation Features of the Two Types of Persistent High Temperature Events over Jiangnan Region
by Yan Li, Qingjiu Gao, Qi You and Yuanbo Yue
Atmosphere 2023, 14(1), 185; https://doi.org/10.3390/atmos14010185 - 15 Jan 2023
Viewed by 1293
Abstract
In order to find potential low-frequency signals and provide new ideas for extended-range forecasting, the intraseasonal oscillation (ISO) characteristics of persistent high temperature events (PHTEs) in the extended summer in Jiangnan area are explored by using daily maximum air temperature (Tmax) data from [...] Read more.
In order to find potential low-frequency signals and provide new ideas for extended-range forecasting, the intraseasonal oscillation (ISO) characteristics of persistent high temperature events (PHTEs) in the extended summer in Jiangnan area are explored by using daily maximum air temperature (Tmax) data from the China Meteorological Data Network and daily reanalysis data provided by NCEP/DOE. The results show that the low-frequency PHTEs can be classified into three types according to the position variation of the Western Pacific subtropical high (WPSH). For the first two types of PHTEs, a southwestward migrating mid-latitude wave train from the North American coast to the central and eastern China can be clearly seen in the whole troposphere. Whereas the two types of PHTEs show different features in the low-latitude. It is found that a significantly westward extension of the WPSH during the first type of PHTEs, with the low-frequency anticyclone moving westward in the mid-lower troposphere. For the second type of PHTEs, the WPSH is mainly located in the southeastern China with slightly movement. Analysis of the low-frequency vertical circulation and the thermodynamic equation further reveal that the increase of temperature in Jiangnan region is primarily attributed to the descending airflow. Full article
(This article belongs to the Special Issue Heat Waves: Perspectives from Observations, Reanalysis and Modeling)
Show Figures

Figure 1

18 pages, 1452 KiB  
Review
Production of Biocoal from Wastewater Sludge and Sugarcane Bagasse: A Review
by Zinhle Mkhwanazi, Yusuf Makarfi Isa and Shadana. T. Vallabh
Atmosphere 2023, 14(1), 184; https://doi.org/10.3390/atmos14010184 - 15 Jan 2023
Cited by 3 | Viewed by 2550
Abstract
The rising volume of wastewater sludge and sugarcane bagasse is becoming a prominent concern globally. Furthermore, the growing demand for fuel coupled with the depletion of fossil fuel reserves in South Africa demonstrates the need for alternative energy sources. To minimize the reliance [...] Read more.
The rising volume of wastewater sludge and sugarcane bagasse is becoming a prominent concern globally. Furthermore, the growing demand for fuel coupled with the depletion of fossil fuel reserves in South Africa demonstrates the need for alternative energy sources. To minimize the reliance on fossil-based energy sources, a renewable resource such as biomass can be optimized as an energy source. Wastewater sludge and bagasse have the energy potential to produce high-calorific-value biocoal; this will contribute to the supply of energy in South Africa. The synthesis of biocoal from wastewater sludge and bagasse through an artificial synthetic coal production process, i.e., hydrothermal carbonization (HTC), is preferred over other thermal conversion techniques as HTC is capable of handling feed having a high (75–90%) moisture content. This article focuses on the production of biocoal from wastewater sludge and sugarcane bagasse as an alternative to sustainable bioenergy supply and as one of the potential solutions for reducing net CO2 greenhouse gas (GHG) emissions from fossil-fuel power plants, and addresses the use of different thermochemical technologies, previous studies on the composition of wastewater sludge and bagasse, and the benefits of hydrothermal carbonization. Full article
Show Figures

Figure 1

20 pages, 4163 KiB  
Article
Effects of Meteorological Factors on Apple Yield Based on Multilinear Regression Analysis: A Case Study of Yantai Area, China
by Xirui Han, Longbo Chang, Nan Wang, Weifu Kong and Chengguo Wang
Atmosphere 2023, 14(1), 183; https://doi.org/10.3390/atmos14010183 - 15 Jan 2023
Cited by 7 | Viewed by 1725
Abstract
Evaluating the impact of different meteorological conditions on apple yield and predicting the future yield in Yantai City is essential for production. Furthermore, it provides a scientific basis for the increase in apple yield. In this study, first, a grey relational analysis (GRA) [...] Read more.
Evaluating the impact of different meteorological conditions on apple yield and predicting the future yield in Yantai City is essential for production. Furthermore, it provides a scientific basis for the increase in apple yield. In this study, first, a grey relational analysis (GRA) was used to determine the quantitative relationship between different meteorological factors and meteorological yield which is defined as affected only by meteorological conditions. Then, the comprehensive meteorological factors extracted by a principal component analysis (PCA) were used as inputs for multiple linear regression (MLR). The apple yield accuracy was compared with the lasso regression prediction. Trend analysis showed that the actual apple yield increased annually, but the meteorological yield decreased annually over a long time. Correlation ranking illustrated that the meteorological yield was significantly correlated with the frost-free period, the annual mean temperature, the accumulated temperature above 10 °C, etc. The good consistency between GRA and MLR–PCA showed that the accumulated temperature above 10 °C, the March–October mean temperature, and the June–August mean temperature are key meteorological factors. In addition, it was found that the principal components F2, F4, and F5 were negatively correlated with meteorological yield, while the principal components F1 and F3 were positively correlated with meteorological yield. Moreover, the MLR–PCA model predicted the apple yield in 2020 as 47.256 t·ha−1 with a 7.089% relative error. This work demonstrates that the principal component regression model can effectively extract information about different meteorological factors and improve the model’s accuracy for analyzing key meteorological factors and predicting apple yield. Full article
Show Figures

Figure 1

27 pages, 3210 KiB  
Article
Enhancing the Performance of Quantitative Precipitation Estimation Using Ensemble of Machine Learning Models Applied on Weather Radar Data
by Eugen Mihuleţ, Sorin Burcea, Andrei Mihai and Gabriela Czibula
Atmosphere 2023, 14(1), 182; https://doi.org/10.3390/atmos14010182 - 14 Jan 2023
Cited by 1 | Viewed by 2106
Abstract
Flash floods are a major weather-related risk, as they cause more than 5000 fatalities annually, according to the World Meteorological Organization. Quantitative Precipitation Estimation is a method used to approximate the rainfall over locations where direct field observations are not available. It represents [...] Read more.
Flash floods are a major weather-related risk, as they cause more than 5000 fatalities annually, according to the World Meteorological Organization. Quantitative Precipitation Estimation is a method used to approximate the rainfall over locations where direct field observations are not available. It represents one of the most valuable information employed by meteorologists and hydrologists for issuing early warnings concerning flash floods. The current study is in line with the efforts to improve radar-based rainfall estimates through the use of machine learning techniques applied on radar data. With this aim, as a proof of concept, six machine learning models are evaluated to make estimations of the radar-based hourly accumulated rainfall using reflectivity data collected on the lowest radar elevation angles, and we employ a new data model for representing these radar data. The data were collected by a WSR-98D weather radar of the Romanian Meteorological Administration, located in the central region of Romania, during 30 non-consecutive days of the convective seasons, between 2016 and 2021. We obtained encouraging results using a stacked machine learning model. In terms of the Root Mean Squared Error evaluation metric, the results of the proposed stacked regressor are better than the radar estimated accumulated rainfall by about 33% and also outperform the baseline computed using the Z-R relationship by about 13%. Full article
(This article belongs to the Special Issue Precipitation Observations and Prediction)
Show Figures

Figure 1

10 pages, 1644 KiB  
Article
Direct Electrical Sensing of Iodine Gas by a Covalent Organic Framework-Based Sensor
by Wanshuang Zhou, Chun Kang, Cong Yu, Zhaojie Cui and Xinbo Wang
Atmosphere 2023, 14(1), 181; https://doi.org/10.3390/atmos14010181 - 14 Jan 2023
Cited by 4 | Viewed by 1711
Abstract
Rapid and highly sensitive detection of iodine gaseous species is crucial as the first response in case of nuclear accidents and nuclear waste clean-up. A robust and user-friendly sensor-based technology that allows online monitoring is highly desirable. Herein, we report the success of [...] Read more.
Rapid and highly sensitive detection of iodine gaseous species is crucial as the first response in case of nuclear accidents and nuclear waste clean-up. A robust and user-friendly sensor-based technology that allows online monitoring is highly desirable. Herein, we report the success of using a covalent organic framework (AQ-COF)-based sensor for real-time iodine gas adsorption and detection by the electrochemical impedance spectroscopy (EIS) technique. The sensor exhibits a high sensitivity and a pronounced electrical response to trace amounts of iodine vapor. Gaseous iodine was readily detected with a significant change in resistance (104×) at 70 °C within 5 min exposure to air. Notably, the EIS response is quite chemoselective to iodine over other common species such as air, methanol, ethanol, and water, with a selectivity of 320, 14, 49, and 1030, respectively. A mechanical study shows that the adsorption of iodine can reduce the optical bandgap of the AQ-COF, causing the impedance to drop significantly. This study demonstrates how the adsorption enrichment effect of selective I2 adsorption by a covalent organic framework can be leveraged to create a highly selective sensor for the direct online electrical detection of radioactive gaseous toxins. Full article
(This article belongs to the Special Issue Two-Dimensional Nanomaterials for Gas Detection and Energy Storage)
Show Figures

Figure 1

20 pages, 5325 KiB  
Review
Impact of North African Sand and Dust Storms on the Middle East Using Iraq as an Example: Causes, Sources, and Mitigation
by Salih Muhammad Awadh
Atmosphere 2023, 14(1), 180; https://doi.org/10.3390/atmos14010180 - 13 Jan 2023
Cited by 14 | Viewed by 5448
Abstract
This study aims to determine the reasons for the increase in the frequency of sand and dust storms in the Middle East and to identify their sources and mitigate them. A set of climatic data from 60 years (1960–2022) was analyzed. Sand storms [...] Read more.
This study aims to determine the reasons for the increase in the frequency of sand and dust storms in the Middle East and to identify their sources and mitigate them. A set of climatic data from 60 years (1960–2022) was analyzed. Sand storms in Iraq are a silty sand mature arkose composed of 72.7% sand, 25.1% silt, and 2.19% clay; the clay fraction in dust storms constitutes 70%, with a small amount of silt (20.6%) and sand (9.4%). Dust and sand storms (%) are composed of quartz (49.2, 67.1), feldspar (4.9, 20.9), calcite (38, 5), gypsum (4.8, 0.4), dolomite (0.8, 1.0), and heavy minerals (3.2, 6.6). Increasing temperatures in Iraq, by an average of 2 °C for sixty years, have contributed to an increase in the number of dust storms from 75 to 200 times annually. North African storms affect the Middle East, with a monthly average exceeding 300 g/m3 in peak dust seasons. To reduce the negative impacts on public health, property, and infrastructure, the study suggests solutions to mitigate them, including reducing carbon dioxide gas emissions to prevent the expansion of drought and the afforestation of the desert with plants adapted to drought using advanced techniques and avoiding land overuse. Full article
(This article belongs to the Special Issue Sand and Dust Storms: Impact and Mitigation Methods)
Show Figures

Figure 1

14 pages, 2853 KiB  
Article
VOC Emission Characteristics of the Glass Deep-Processing Industry in China
by Fan Zhang, Mingya Wang, Mingshi Wang, Chun Chen, Xiyue Wang, Xiaojun Nie, Wenju Wang, Qinqing Xiong, Chunhui Zhang, Penghao Li, Yidong Wang and Xuechun Zhang
Atmosphere 2023, 14(1), 179; https://doi.org/10.3390/atmos14010179 - 13 Jan 2023
Cited by 2 | Viewed by 1579
Abstract
To understand the pollution characteristics of volatile organic compounds (VOCs) in the glass deep-processing industry, samples were collected using polyvinyl fluoride bags and quickly transferred to summa tanks for GC/MS/FID analysis. The emission characteristics of VOCs, the ozone formation potential and the secondary [...] Read more.
To understand the pollution characteristics of volatile organic compounds (VOCs) in the glass deep-processing industry, samples were collected using polyvinyl fluoride bags and quickly transferred to summa tanks for GC/MS/FID analysis. The emission characteristics of VOCs, the ozone formation potential and the secondary aerosol formation potential were studied. The results showed that the VOCs emitted by the six enterprises were mainly aromatics and OVOCs, accounting for 35% to 97% of the emissions, with high emission loads of alkanes and halocarbons from individual enterprises. The stack emissions from Enterprise 2 were as high as 38 mg/m3, while the emissions from the remaining five enterprises were all in the range of 1.7~4.1 mg/m3, probably because the terminal treatment facilities were not updated in a timely manner, resulting in excessive stack emissions from Enterprise 2. The characteristic pollutants, including OVOCs, aromatics and alkanes, which are mainly derived from spray painting and gluing, were screened in the six enterprises. Aromatics and OVOCs contributed the most to the ozone formation potential in the six enterprises, with some enterprises having a high contribution from alkanes and alkenes. On the basis of the secondary aerosol formation potential, toluene, benzene, ethylbenzene, o-xylene and m/p-xylene account for 98% of the six enterprises’ emissions. Glass enterprises should prioritise the control of benzene and OVOCs emissions. The glass processing industry mainly emits aromatics, OVOCs and alkanes. Through a preliminary study on the emission characteristics of VOCs in the glass deep-processing industry, we provided basic data for the reduction and control of VOCs in the glass deep-processing industry in China. Full article
(This article belongs to the Section Air Quality)
Show Figures

Figure 1

12 pages, 23241 KiB  
Article
Significant Increases in Wet Nighttime and Daytime–Nighttime Compound Heat Waves in China from 1961 to 2020
by Xi Chen
Atmosphere 2023, 14(1), 178; https://doi.org/10.3390/atmos14010178 - 13 Jan 2023
Viewed by 1360
Abstract
Heat waves (HWs) with high humidity are dangerous to human health. However, existing studies on different types of HWs considering the effect of humidity are still limited. This study defines three types of wet summer HWs (that is, wet independent daytime and nighttime [...] Read more.
Heat waves (HWs) with high humidity are dangerous to human health. However, existing studies on different types of HWs considering the effect of humidity are still limited. This study defines three types of wet summer HWs (that is, wet independent daytime and nighttime HWs and wet daytime-nighttime compound HWs) and investigates their spatial-temporal changes across China during 1961–2020. Results show significant upward trends of wet nighttime and compound HWs in terms of frequency, occurring days, duration, intensity and spatial extent, while changes for wet daytime HWs are weak and insignificant in nearly all sub-regions of China except for southwest and eastern northwest China. Compared with wet compound and daytime HWs, wet nighttime HWs accompanied by more elevated relative humidity exhibit larger growth rates in frequency, occurring days, duration and affected areas. Additionally, most wet nighttime and compound HWs with the longest duration and/or the maximum intensity are found to occur after the mid-1990s, compared to fewer than half for wet daytime HWs. Our findings emphasize the prominent intensifying trends in wet nighttime HWs across China for the last 60 years, and suggest more efforts on exploring humid HWs. Full article
(This article belongs to the Section Biometeorology)
Show Figures

Figure 1

15 pages, 4097 KiB  
Article
Experimental Verification of Mist Cooling Effect in Front of Air-Conditioning Condenser Unit, Open Space, and Bus Stop
by Sae Kyogoku and Hideki Takebayashi
Atmosphere 2023, 14(1), 177; https://doi.org/10.3390/atmos14010177 - 13 Jan 2023
Cited by 1 | Viewed by 2727
Abstract
Mist spraying is a technique for locally lowering air temperature by spraying fine mist into the air and using the latent heat of evaporation immediately after spraying. This study focuses on the conditions under which mist spraying contributes to the increase in sensible [...] Read more.
Mist spraying is a technique for locally lowering air temperature by spraying fine mist into the air and using the latent heat of evaporation immediately after spraying. This study focuses on the conditions under which mist spraying contributes to the increase in sensible heat release from the human body, using the ratio of air temperature decrease and humidity increase in the space where mist is sprayed. From the measurement results in front of the air-conditioning condenser unit, humidity increased by about 10 g/kg(DA), while air temperature decreased by about 10 °C. From the measurement results in an open space in a park, air temperature decreased by about 0.5 to 1 °C within 2 m of the mist spray and humidity increased by about 0.5 to 1 g/kg(DA) at the height of the mist spray, regardless of the distance from the mist spray. From the measurement results at semi-open bus stops, air temperature decreased slightly to 1 °C and humidity increased slightly to 1 g/kg(DA) under low-wind conditions. Unfortunately, the measured results of air temperature decrease in relation to humidity increase, which the human body perceives as cooler, were not available. Full article
Show Figures

Figure 1

20 pages, 7524 KiB  
Article
The Lateral Boundary Perturbations Growth and Their Dependence on the Forcing Types of Severe Convection in Convection-Allowing Ensemble Forecasts
by Lu Zhang, Jinzhong Min, Xiaoran Zhuang, Shizhang Wang and Xiaoshi Qiao
Atmosphere 2023, 14(1), 176; https://doi.org/10.3390/atmos14010176 - 13 Jan 2023
Cited by 1 | Viewed by 1131
Abstract
The application of lateral boundary perturbations (LBPs) helps to restore dispersion in convection-allowing ensemble forecasts (CAEFs). However, the applicability of LBPs remains unclear because of the differences between convection systems. Short-range (24 h) ensemble forecasts are carried out to explore this issue with [...] Read more.
The application of lateral boundary perturbations (LBPs) helps to restore dispersion in convection-allowing ensemble forecasts (CAEFs). However, the applicability of LBPs remains unclear because of the differences between convection systems. Short-range (24 h) ensemble forecasts are carried out to explore this issue with a strong-forcing (SF) case and a weak-forcing (WF) case in East China. The dependence of LBPs on the forcing types of severe convection is investigated regarding the forecast error growth caused by the lateral boundary conditions (LBCs). The results show that the LBPs mainly influence the SF case rather than the WF case, especially after a 12-h forecast. The large-scale errors dominate in the SF case because the change in the synoptic-scale system affects the forecast error evolution. In contrast, the large-scale errors are mainly derived from the upscaling of the small-scale errors in the WF case, indicating that using LBPs is only insufficient in such a case. In sensitivity experiments that vary the magnitude of LBPs from 10% to 150% of its original value, CAEFs demonstrate more sensitive to LBPs in the SF case than in the WF case, indicating that the WF case has intrinsically limited predictability. Overall, LBPs are more suitable for the SF case, while additional perturbations from other sources are required for CAEFs in the WF case because of the limits of intrinsic predictability. Full article
(This article belongs to the Section Meteorology)
Show Figures

Figure 1

14 pages, 3835 KiB  
Article
A Study on Monitoring and Supervision of Ship Nitrogen-Oxide Emissions and Fuel-Sulfur-Content Compliance
by Zheng Wang, Qianchi Ma, Zhida Zhang, Zichao Li, Cuihong Qin, Junfeng Chen and Chuansheng Peng
Atmosphere 2023, 14(1), 175; https://doi.org/10.3390/atmos14010175 - 13 Jan 2023
Cited by 1 | Viewed by 1308
Abstract
Regulations for the control of air-pollutant emissions from ships within pollutant emission control areas (ECAs) have been issued for several years, but the lack of practical technologies and fundamental theory in the implementation process remains a challenge. In this study, we designed a [...] Read more.
Regulations for the control of air-pollutant emissions from ships within pollutant emission control areas (ECAs) have been issued for several years, but the lack of practical technologies and fundamental theory in the implementation process remains a challenge. In this study, we designed a model to calculate the nitrogen-oxide-emission intensity of ships and the sulfur content of ship fuels using theoretical deduction from the law of the conservation of mass. The reliability and availability of the derived results were empirically evaluated using measurement data for NOx, SO2, and CO2 in the exhaust gas of a demonstration ship in practice. By examining the model and the measured or registered fuel-oil-consumption rates of ships, a compliance-determination workflow for NOx-emission intensity and fuel-sulfur-content monitoring and supervision in on-voyage ships were proposed. The results showed that the ship fuel’s NOx-emission intensity and sulfur content can be evaluated by monitoring the exhaust-gas composition online and used to assist in maritime monitoring and the supervision of pollutant emissions from ships. It is recommended that uncertainties regarding sulfur content should be considered within 15% during monitoring and supervision. The established model and workflow can assist in maritime monitoring. Meanwhile, all related governments and industry-management departments are advised to actively lead the development of monitoring and supervision technology for ship-air-pollutant control in ECAs, as well as strengthening the quality management of ships’ static data. Full article
(This article belongs to the Special Issue Traffic Related Emission and Control)
Show Figures

Figure 1

23 pages, 6385 KiB  
Article
An Empirical Relationship among Characteristics of Severe Convective Storms, Their Cloud-Top Properties and Environmental Parameters in Northern Eurasia
by Alexander Chernokulsky, Andrey Shikhov, Yulia Yarinich and Alexander Sprygin
Atmosphere 2023, 14(1), 174; https://doi.org/10.3390/atmos14010174 - 13 Jan 2023
Cited by 4 | Viewed by 2005
Abstract
Severe convective storms that produce tornadoes and straight-line winds usually develop under particular environmental conditions and have specific signatures on the cloud tops associated with intense updrafts. In this study, we performed a comparative analysis of satellite-derived characteristics, with a focus on cloud-top [...] Read more.
Severe convective storms that produce tornadoes and straight-line winds usually develop under particular environmental conditions and have specific signatures on the cloud tops associated with intense updrafts. In this study, we performed a comparative analysis of satellite-derived characteristics, with a focus on cloud-top properties, and ERA5-based environmental parameters of convective storms in forested regions of the western part of Northern Eurasia in 2006–2021. The analyzed sample includes 128 different convective storms that produced 138 tornadoes and 143 linear windstorms. We found most tornadoes and linear windstorms are generated by quasi-linear convective storms or supercells. Such supercells form under lower convective instability and precipitable water content compared to those for other types of storms. We found a significant negative correlation of minimum temperature on the storm cloud top with instability parameters. In turn, the longevity of convective storms significantly correlates with wind shear and storm-relative helicity. About half of the tornadoes and 2/3 of linear windstorms are associated with the presence of cloud-top signatures, such as overshooting tops, cold-ring or cold U/V features. The events associated with such signatures are formed under high values of instability parameters. Our results can be used for further analysis of peculiarities of tornado and linear windstorm formation and to enhance the predictability of such severe events, especially in regions with a lack of weather radar coverage. Full article
(This article belongs to the Special Issue Extreme Weather Events in Siberia)
Show Figures

Figure 1

13 pages, 2141 KiB  
Article
Relative Humidity Impact on Organic New Particle Formation from Ozonolysis of α- and β-Pinene at Atmospherically Relevant Mixing Ratios
by Christopher N. Snyder, Austin C. Flueckiger and Giuseppe A. Petrucci
Atmosphere 2023, 14(1), 173; https://doi.org/10.3390/atmos14010173 - 13 Jan 2023
Cited by 2 | Viewed by 1671
Abstract
The impact of relative humidity (RH) on organic new particle formation (NPF) from ozonolysis of monoterpenes remains an area of active debate. Previous reports provide contradictory results indicating both depression and enhancement of NPF under conditions of moderate RH, while others do not [...] Read more.
The impact of relative humidity (RH) on organic new particle formation (NPF) from ozonolysis of monoterpenes remains an area of active debate. Previous reports provide contradictory results indicating both depression and enhancement of NPF under conditions of moderate RH, while others do not indicate a potential impact. Only several reports have suggested that the effect may depend on absolute mixing ratio of the precursor volatile organic compound (VOC, ppbv). Herein we report on the impact of RH on NPF from dark ozonolysis of α- and β-pinene at mixing ratios ranging from 0.2 to 80 ppbv. We show that RH enhances NPF (by a factor of eight) at the lowest α-pinene mixing ratio, with a very strong dependence on α-pinene mixing ratio from 4 to 22 ppbv. At higher mixing ratios, the effect of RH plateaus, with resulting modest decreases in NPF. In the case of α- and β-pinene, NPF is enhanced at low mixing ratios due to a combination of chemistry, accelerated kinetics, and reduced partitioning of semi-volatile oxidation products to the particulate phase. Reduced partitioning would limit particle growth, permitting increased gas-phase concentrations of semi- and low-volatility products, which could favor NPF. Full article
(This article belongs to the Special Issue New Insights into Secondary Organic Aerosol Formation)
Show Figures

Figure 1

35 pages, 4729 KiB  
Review
The Widespread Use of Remote Sensing in Asbestos, Vegetation, Oil and Gas, and Geology Applications
by Leydy K. Torres Gil, David Valdelamar Martínez and Manuel Saba
Atmosphere 2023, 14(1), 172; https://doi.org/10.3390/atmos14010172 - 13 Jan 2023
Cited by 8 | Viewed by 3294
Abstract
Remote sensing is the technique of acquiring data from the earth’s surface from sensors installed on satellites or on manned or unmanned aircrafts. Its use is common in dozens of sectors of science and technology, agriculture, atmosphere, soil, water, land surface, oceans and [...] Read more.
Remote sensing is the technique of acquiring data from the earth’s surface from sensors installed on satellites or on manned or unmanned aircrafts. Its use is common in dozens of sectors of science and technology, agriculture, atmosphere, soil, water, land surface, oceans and coasts, snow and ice, and natural disasters, among others. This article focuses on an in-depth literature review of some of the most common and promising disciplines, which are asbestos–cement roof identification, vegetation identification, the oil and gas industry, and geology, with the aim of having clarity on the trends in research on these issues at the international level. The most relevant problems in each sector have been highlighted, evidencing the need for future research in the area in light of technological advances in multi- and hyperspectral sensors and the availability of satellite images with more precise spatial resolution. A bibliometric analysis is proposed for each discipline and the network of related keywords is discussed. Finally, the results suggest that policymakers, urban planners, mine, and oil and gas companies should consider remote sensing as primary tool when planning comprehensive development strategies and in field parameter multitemporal analysis. Full article
(This article belongs to the Topic Advances in Environmental Remote Sensing)
Show Figures

Figure 1

16 pages, 3751 KiB  
Article
Emission Characteristics of Fine Particles in Relation to Precursor Gases in Agricultural Emission Sources: A Case Study of Dairy Barns
by Hung-Soo Joo, Sang-Woo Han, Jin-Seok Han and Pius M. Ndegwa
Atmosphere 2023, 14(1), 171; https://doi.org/10.3390/atmos14010171 - 12 Jan 2023
Cited by 1 | Viewed by 1173
Abstract
Recently, precursor gases such as ammonia have sparked a growing interest in the secondary formation of particulate matter (PM). Most studies focus on urban areas and scientific data. Studies on precursor gases and PM emitted from agricultural sources are insufficient; thus, this paper [...] Read more.
Recently, precursor gases such as ammonia have sparked a growing interest in the secondary formation of particulate matter (PM). Most studies focus on urban areas and scientific data. Studies on precursor gases and PM emitted from agricultural sources are insufficient; thus, this paper presents a field monitoring study conducted from agricultural sources. To estimate the effect of precursor gases for PM2.5 from naturally ventilated dairy barns, correlation analyses were conducted using real-time monitoring data on the mass concentrations of PM2.5, NH3, SO2, NO2, and H2S and meteorological data. In addition to mass concentration, the emission and loading rates were used to closely analyze pollution status. The mass concentrations of PM2.5 and gaseous compounds did not correlate well, whereas the mass emission rates for PM2.5 and gaseous compounds (SO2, NH3, and NO2) correlated well because the unit of the emission rate reflected the ventilation factor. The correlation coefficients between PM2.5 and precursor gas emission rates ranged from 0.72 to 0.89 (R), with the SO2 emission rate exhibiting the highest correlation coefficient (R = 0.89). This correlation implies that SO2 from dairy farms is a dominant species among the gaseous precursors influencing the secondary formation of PM2.5; alternatively, SO2 and PM2.5 are produced from the same sources. The ambient PM2.5 loading rate and barn PM2.5 emission rate—estimated by multivariate linear regression using the gaseous independent variables NH3, SO2, and NO2—revealed high-correlation coefficients (0.60 and 0.92, respectively) with the measured data. At present, most studies investigating the precursor gases of PM in agricultural fields have focused on NH3; however, this study suggests that SO2 is a key factor in PM2.5 pollution. To elucidate the secondary formation of PM from precursor gases in agricultural sources, particulate ammonium, sulfate, nitrate, and chloride, which were not measured in this study, as well as oxidants and intermediates, should be considered in future research. Full article
(This article belongs to the Special Issue Ammonia Emission and Particulate Matter)
Show Figures

Figure 1

20 pages, 9756 KiB  
Article
A Rare Tropical Cyclone Necessitating the Issuance of Gale or Storm Wind Warning Signal in Hong Kong in Late Autumn in 2022—Severe Tropical Storm Nalgae
by Pak-Wai Chan, Chun-Wing Choy, Betty Mak and Junyi He
Atmosphere 2023, 14(1), 170; https://doi.org/10.3390/atmos14010170 - 12 Jan 2023
Cited by 3 | Viewed by 2755
Abstract
The invaluable meteorological observations for a late autumn tropical cyclone that came very close to Hong Kong, namely, Nalgae in November 2022, are documented in this article. In particular, the dropsonde data for two consecutive days for this late season storm close to [...] Read more.
The invaluable meteorological observations for a late autumn tropical cyclone that came very close to Hong Kong, namely, Nalgae in November 2022, are documented in this article. In particular, the dropsonde data for two consecutive days for this late season storm close to Hong Kong are presented. Meteorological data revealed that while Nalgae appeared to be rather weak from the meteorological satellite image under the cool sea surface water and the cool and dry northeast monsoon, it still maintained considerable intensity near the lower-boundary layer and managed to bring gale to storm force 10 min mean winds over many places in Hong Kong, necessitating the issuance of a gale or storm wind signal in November since 1972. The consideration in the issuance of the warning signal in Hong Kong and the difficulty in numerical weather prediction (NWP) model in forecasting Nalgae are also discussed in this article. Full article
(This article belongs to the Section Meteorology)
Show Figures

Figure 1

21 pages, 5632 KiB  
Article
Can Inner Mongolia Learn from Zhejiang’s Low-Carbon Policy?—Comparative Analysis Based on the EPS Model
by Wei Duan, Guilei Lin and Desheng Xu
Atmosphere 2023, 14(1), 169; https://doi.org/10.3390/atmos14010169 - 12 Jan 2023
Cited by 1 | Viewed by 1605
Abstract
Based on the energy policy simulation model (EPS model) and the reality of Zhejiang Province and Inner Mongolia Autonomous Region, the carbon pricing policy scenario and the early retirement policy scenario of coal power generation units were constructed, respectively, and the policy effects [...] Read more.
Based on the energy policy simulation model (EPS model) and the reality of Zhejiang Province and Inner Mongolia Autonomous Region, the carbon pricing policy scenario and the early retirement policy scenario of coal power generation units were constructed, respectively, and the policy effects simulated. The study explored whether Inner Mongolia Autonomous Region can learn from the low-carbon policies that have played a good role in Zhejiang Province in the process of achieving a carbon peak. The research found that: (1) Under the baseline scenario, both Zhejiang Province and Inner Mongolia Autonomous Region failed to achieve a carbon peak by 2030. (2) Under the scenarios of carbon pricing and early retirement of coal power generation units, the peak time of carbon in Zhejiang Province and Inner Mongolia Autonomous Region has been advanced, which shows the effectiveness of carbon pricing and early retirement of coal power generation units. (3) The above two policies have achieved good results in the overall implementation process of Zhejiang Province, but the carbon pricing policy has caused dramatic fluctuations in the power generation in Inner Mongolia Autonomous Region, and the early retirement policy of coal power units has failed to achieve the goal of reaching the peak carbon in Inner Mongolia Autonomous Region on schedule. Full article
(This article belongs to the Special Issue Carbon Emission and Carbon Neutrality in China)
Show Figures

Figure 1

17 pages, 11202 KiB  
Article
Automatic Center Detection of Tropical Cyclone Using Image Processing Based on the Operational Radar Network
by Sun-Jin Mo and Ji-Young Gu
Atmosphere 2023, 14(1), 168; https://doi.org/10.3390/atmos14010168 - 12 Jan 2023
Viewed by 1597
Abstract
This study presents the algorithm ACTION, defined as automatic center detection of tropical cyclone (TC) using image processing based on the operational radar network. Based on the high visibility of weather radar imagery, a TC’s motion vector is calculated from the continuous image [...] Read more.
This study presents the algorithm ACTION, defined as automatic center detection of tropical cyclone (TC) using image processing based on the operational radar network. Based on the high visibility of weather radar imagery, a TC’s motion vector is calculated from the continuous image change using optical flow, producing the TC’s rotation center. The algorithm performance was verified by analyzing the typhoons (TCs in the northwestern Pacific) that affected the Korean Peninsula from 2018–2021, demonstrating a high detection rate of 80.8% within an error distance of 40 km against the best track of the Korea Meteorological Administration (KMA). The detection rate was 100% for typhoons with temporally consistent morphological characteristics. ACTION automatically generates TC center information upon the TC’s initial entry inside the observation radius even in the absence of uniform radar data. As ACTION is capable of performing real-time calculations that are directly applied to rapidly generated weather radar images, it is currently being utilized by the KMA. The high temporal resolution TC center information calculated through ACTION is expected to improve the efficiency of TC forecasting. Full article
Show Figures

Graphical abstract

15 pages, 5012 KiB  
Article
Emission Characteristics of Particulate Matter from Boiling Food
by Yujiao Zhao, Mengyao Wang, Pengfei Tao, Guozhi Qiu and Xueying Lu
Atmosphere 2023, 14(1), 167; https://doi.org/10.3390/atmos14010167 - 12 Jan 2023
Viewed by 1439
Abstract
Cooking food in water or soup, such as hot pot, is a widely used cooking method in China. This type of cooking requires no oil and cooks at a lower temperature, but that does not mean it produces fewer pollutants or is less [...] Read more.
Cooking food in water or soup, such as hot pot, is a widely used cooking method in China. This type of cooking requires no oil and cooks at a lower temperature, but that does not mean it produces fewer pollutants or is less harmful. There are few research studies on the emission characteristics and mechanisms of particulate matter emissions when eating hot pot (the boiling process), which leads to the unreasonable design of ventilation systems for this kind of catering. In this paper, the effects of boiling different ingredients (including noodles, potatoes, fish, tofu, meatballs, and pork) on particle number concentration emissions were studied. The particle number concentration and particle size distribution of PM with diameters of 0.3 μm and less, 0.3–0.5 μm and 0.5–1.0 μm (PM0.3, PM0.3–0.5 and PM0.5–1.0, respectively) were measured in an experimental chamber. The food type and shape showed very little change in the PM emission characteristics of boiling. When the boiling state was reached, the number concentration, particle size distribution, and arithmetic mean diameter of particles all fluctuated within 60 s. The emission characteristics of particles produced by boiling water and heating oil were compared. Heating oil produced more small particles, and boiling water released more large particles. Transient and steady methods were used to calculate the emission rate of particles, and the steady-state calculation has a high estimation of the emission rate. Full article
Show Figures

Graphical abstract

13 pages, 4839 KiB  
Article
Investigation of Wind Characteristics and Cooling Effects of Crushed-Rock Embankment with Different Pavement Widths in Permafrost Region
by Hongting Zhao, Xiaolin Li and Xiaopeng Wu
Atmosphere 2023, 14(1), 166; https://doi.org/10.3390/atmos14010166 - 12 Jan 2023
Cited by 1 | Viewed by 1089
Abstract
A crushed-rock embankment (CRE) with a high porous crushed-rock layer (CRL) can effectively cool the underlying permafrost through natural ventilation within the layer. However, in addition to the ambient conditions, the ventilation efficiency of the CRL and its cooling effect are significantly affected [...] Read more.
A crushed-rock embankment (CRE) with a high porous crushed-rock layer (CRL) can effectively cool the underlying permafrost through natural ventilation within the layer. However, in addition to the ambient conditions, the ventilation efficiency of the CRL and its cooling effect are significantly affected by the pavement width. In this study, the local wind flow around an embankment section was first analyzed based on field monitoring data. Then, considering climate warming, a 2-D coupled model of heat and mass transfer was established to investigate the wind characteristics and the cooling effects of the CRE with different pavement widths. The results showed that the pavement width exerted considerable impacts on the wind characteristics and cooling effects of the CRE. These impacts were evaluated via variations in the wind speed, the permafrost table, and the soil temperatures. An increase in pavement width can lower the wind speed within the CRL, which is adverse to the long-term thermal regimes of the embankment and the underlying permafrost. In addition, due to differential wind flows around the embankments, an asymmetric distribution of the soil temperatures beneath the windward and leeward sides of the embankments existed. Overall, it is hoped that the results of this study can provide informative references for the Qinghai–Tibet expressway that is constructed in permafrost regions. Full article
(This article belongs to the Special Issue Interactions of Atmosphere and Permafrost)
Show Figures

Figure 1

23 pages, 994 KiB  
Article
Does Public Participation Reduce Regional Carbon Emission?
by Xin Zhang, Yongliang Yang and Yi Li
Atmosphere 2023, 14(1), 165; https://doi.org/10.3390/atmos14010165 - 12 Jan 2023
Cited by 4 | Viewed by 1732
Abstract
Public participation is playing an increasingly important role in environmental governance. This paper uses panel data from Chinese cities to evaluate the causal relationship between public participation, regional carbon emissions, and regional carbon intensity. We obtain the following conclusions: (1) Public participation significantly [...] Read more.
Public participation is playing an increasingly important role in environmental governance. This paper uses panel data from Chinese cities to evaluate the causal relationship between public participation, regional carbon emissions, and regional carbon intensity. We obtain the following conclusions: (1) Public participation significantly reduces regional carbon emissions and regional carbon intensity, which remains robust after a series of robustness and endogeneity discussions. (2) The carbon reduction effect of public participation performs better in eastern regions, regions with higher per capita income, and regions with a concentration of tertiary industries and talents. (3) We divided the public participation into resident participation and environment non-governmental organizations (ENGOs) participation. We found an excellent interactive emission reduction effect with resident participation and a good interaction between resident participation and government and environmental organizations. (4) This paper finds that promoting regional green technology innovation is a significant mechanism for public participation in achieving carbon emission reduction. (5) Finally, this paper found an “inverted U-shaped” non-linear relationship between public participation and regional carbon emissions. The results reveal the importance of public participation in regional carbon emissions and provide an empirical basis for promoting informal environmental regulation. Full article
(This article belongs to the Special Issue Science and Technology of Indoor and Outdoor Environment)
Show Figures

Figure 1

12 pages, 5218 KiB  
Article
Impact of Various Disturbance Sources on the Atmospheric Electric Field and Thunderstorm Activity of the Northern Tien-Shan
by Valentina Antonova, Vadim Lutsenko, Galina Gordiyenko and Sergey Kryukov
Atmosphere 2023, 14(1), 164; https://doi.org/10.3390/atmos14010164 - 12 Jan 2023
Viewed by 1635
Abstract
Features of the manifestations of various sources of disturbances in the atmospheric electric field at the Tien-Shan high-mountain station have been studied, and the statistical relationship between solar and thunderstorm activity has been established. Air currents arising over the ocean, having overcome the [...] Read more.
Features of the manifestations of various sources of disturbances in the atmospheric electric field at the Tien-Shan high-mountain station have been studied, and the statistical relationship between solar and thunderstorm activity has been established. Air currents arising over the ocean, having overcome the mountain gorges of the Himalayas, carry moisture to the Northern Tien-Shan and determine the weather features and thunderstorm activity at the Tien-Shan high-mountain station. It was established that the maximum and minimum thunderstorm activity at the Tien-Shan high-mountain station corresponds to the distribution curve of daily thunderstorm activity for the Asia–Australia region. The investigation showed that coronal mass ejections (CMEs) affect the atmospheric electric field by increasing or decreasing its level or causing its fluctuations, depending on the features of manifestations in the near-Earth space and in the Earth’s magnetosphere. In at least 70% of cases, thunderstorm activity was observed with a 1–2-day delay after impact on the Earth’s magnetosphere by CMEs and HSSs. A number of cases were studied when thunderstorm activity was observed in a quiet geomagnetic field. In these cases, an increase in the values of fmin (the minimum frequency of reflection from the ionosphere) and foEs (the critical frequency of the sporadic E layer) was observed, which indicated an increase in the level of radio wave absorption in the ionospheric D-region and the level of electron density at altitudes of 100–120 km. Full article
(This article belongs to the Special Issue Advances in Atmospheric Sciences ‖)
Show Figures

Figure 1

18 pages, 6340 KiB  
Article
Spatio-Temporal Variation of Carbon Emission Intensity and Spatial Heterogeneity of Influencing Factors in the Yangtze River Delta
by Jianhui Xu, Yuanyuan Li, Feng Hu, Li Wang, Kai Wang, Wenhao Ma, Ning Ruan and Weizong Jiang
Atmosphere 2023, 14(1), 163; https://doi.org/10.3390/atmos14010163 - 12 Jan 2023
Cited by 2 | Viewed by 1438
Abstract
The Yangtze River Delta plays an important strategic role in China’s economic development pattern, and its carbon emission intensity, which reflects the development of a low-carbon economy, has attracted much attention. From the perspective of the city-level, this study uses the coefficient of [...] Read more.
The Yangtze River Delta plays an important strategic role in China’s economic development pattern, and its carbon emission intensity, which reflects the development of a low-carbon economy, has attracted much attention. From the perspective of the city-level, this study uses the coefficient of variation, spatial autocorrelation and the Multi-scale Geographically Weighted Regression (MGWR) model to study the spatio-temporal characteristics of carbon emission intensity in the Yangtze River Delta from 1997 to 2017 and the spatial heterogeneity of its influencing factors. The results indicated that: (1) the carbon emission intensity in the Yangtze River Delta increased first and then decreased during the sample period, and the number of low-carbon emission intensity zones decreased first and then increased. (2) Through the coefficient of variation analysis, it is known that the ratio of nugget value to base value is much less than 25%, indicating that the correlation between the cities in the Yangtze River Delta is becoming more and more obvious, the spatial difference is becoming smaller, and the integration level is growing higher and higher. (3) The carbon emission intensity of the Yangtze River Delta has a strong positive spatial correlation, and the carbon emission intensity of the Yangtze River Delta decreases from the north to the south. (4) The effect of population size on carbon emission intensity is bidirectional, but the inhibition effect is greater than the promotion effect, and the average regression coefficient is −0.0796; the average regression coefficient of economic development level is 0.3674, and the average regression coefficient of industrial structure is 0.1702, both of which have a positive impact on carbon emission intensity. The degree of urbanization has a bidirectional effect, and the regression coefficient ranges from −0.920 to 0.091, and the negative effect is quite strong. Additionally, each factor has spatial heterogeneity. Full article
(This article belongs to the Special Issue Anthropic Activities and Greenhouse Gas Emission)
Show Figures

Figure 1

20 pages, 3008 KiB  
Article
Overview of PM10, PM2.5 and BC and Their Dependent Relationships with Meteorological Variables in an Urban Area in Northwestern Morocco
by Youssef Bounakhla, Abdelfettah Benchrif, Francesca Costabile, Mounia Tahri, Bassma El Gourch, El Kafssaoui El Hassan, Fatiha Zahry and Moussa Bounakhla
Atmosphere 2023, 14(1), 162; https://doi.org/10.3390/atmos14010162 - 12 Jan 2023
Cited by 4 | Viewed by 1844
Abstract
At an urban site in Kenitra, Morocco, two aerosol size fractions (PM2.5 and PM10) were sampled for four seasons to characterize the seasonal trends of particulate (PM) and carbonaceous (BC) aerosols. An in-depth statistical analysis of the lag-effects of meteorology [...] Read more.
At an urban site in Kenitra, Morocco, two aerosol size fractions (PM2.5 and PM10) were sampled for four seasons to characterize the seasonal trends of particulate (PM) and carbonaceous (BC) aerosols. An in-depth statistical analysis of the lag-effects of meteorology on collected data was investigated using uni- and multivariate linear regression analyses. The results revealed significant seasonal trends for PM10, PM2.5, and BC. PM concentrations showed the maximum values in autumn (61.4 ± 24.5 µg/m3 for PM10 and 21.2 ± 8.2 µg/m3 for PM2.5), while the minimum was observed in winter (40.2 ± 17.1 µg/m3) for PM10 and in summer (14.3 ± 3.3 µg/m3) for PM2.5. High BC concentrations were recorded in summer (6.3 ± 4.2 μg/m3, on average). The relative humidity 1–2 days earlier showed a higher negative correlation with the PM concentrations (except in winter), and the temperature 1–3 days earlier showed a negative correlation with the PM2.5 in winter and summer and a positive one with the PM10 in autumn. Wind speed was negatively associated with PM10 on the current day in winter and 3 days earlier in summer. However, diverse effects of wind speed on PM2.5 were observed (negative in summer and positive in spring). These results confirm the important role of meteorology in the formation of urban air pollution with pronounced variations in different seasons. Full article
Show Figures

Figure 1

21 pages, 4682 KiB  
Article
A Modified k-ε Turbulence Model for Heavy Gas Dispersion in Built-Up Environment
by Sebastian Schalau, Abdelkarim Habib and Simon Michel
Atmosphere 2023, 14(1), 161; https://doi.org/10.3390/atmos14010161 - 11 Jan 2023
Cited by 2 | Viewed by 1484
Abstract
For hazard assessment purposes, the dispersion of gases in complex urban areas is often a scenario to be considered. However, predicting the dispersion of heavy gases is still a challenge. In Germany, the VDI Guideline 3783, Part 1 and 2 is widely used [...] Read more.
For hazard assessment purposes, the dispersion of gases in complex urban areas is often a scenario to be considered. However, predicting the dispersion of heavy gases is still a challenge. In Germany, the VDI Guideline 3783, Part 1 and 2 is widely used for gas dispersion modelling. Whilst Part 1 uses a gauss model for calculating the dispersion of light or neutrally buoyant gases, Part 2 uses wind tunnel experiments to evaluate the heavier-than-air gas dispersion in generic built up areas. In practice, with this guideline, it is often not possible to adequately represent the existing obstacle configuration. To overcome this limitation, computational fluid dynamics (CFD) methods could be used. Whilst CFD models can represent obstacles in the dispersion area correctly, actual publications show that there is still further research needed to simulate the atmospheric flow and the heavy gas dispersion. This paper presents a modified k-ε-turbulence model that was developed in OpenFOAM v5.0 (England, London, The OpenFOAM Foundation Ltd Incorporated) to enhance the simulation of the atmospheric wind field and the heavy gas dispersion in built-up areas. Wind tunnel measurements for the dispersion of neutrally buoyant and heavy gases in built-up environments were used to evaluate the model. As a result, requirements for the simulation of the gas dispersion under atmospheric conditions have been identified and the model showed an overall good performance in predicting the experimental values. Full article
Show Figures

Figure 1

Previous Issue
Next Issue
Back to TopTop