Article

Variations in Aerosol Optical Properties over East Asian Dust Storm Source Regions and Their Climatic Factors during 2000–2021

1
State Key Laboratory of Numerical Modeling of Atmospheric Sciences and Geophysical Fluid Dynamics, Institute of Atmospheric Physics, Chinese Academy of Sciences, Beijing 100029, China
2
Collaborative Innovation Center on Forecast and Evaluation of Meteorological Disasters, Nanjing University of Information Science and Technology, Nanjing 210044, China
3
Institute of Carbon Neutrality, Qilu Zhongke, Jinan 250100, China
4
Key Laboratory of Cloud-Precipitation Physics and Severe Storms, Institute of Atmospheric Physics, Chinese Academy of Sciences, Beijing 100029, China
5
State Key Laboratory of Severe Weather (LASW), Chinese Academy of Meteorological Sciences (CAMS), CMA, Beijing 100081, China
6
School of Atmospheric Physics, Nanjing University of Information Science and Technology, Nanjing 210044, China
*
Author to whom correspondence should be addressed.
Atmosphere 2022, 13(6), 992; https://doi.org/10.3390/atmos13060992
Submission received: 19 May 2022 / Revised: 14 June 2022 / Accepted: 15 June 2022 / Published: 20 June 2022

Abstract

:
The East Asian dust storms occur in western and northern China, and southern Mongolia every year, particularly in spring. In this study, we use satellite aerosol products to demonstrate the spatial and temporal variation in aerosol optical depth (AOD) from MODIS, and the absorbing aerosol index (AAI) from TOMS and OMI, over the main dust storm source regions (MDSR), and to investigate their relationship to vegetation coverage (NDVI), soil properties (surface soil moisture content and soil temperature 0–10 cm underground), and climatic factors (surface wind speed, air temperature at 2 m above the ground, and precipitation) in spring for the period of 2000–2021. Compared with dust storm occurrence frequency (DSF) observed at surface stations, MODIS AOD, TOMS AAI, and OMI AAI showed consistent spatial distributions and seasonal variations with DSF in the MDSR, with correlation coefficients of 0.88, 0.55, and 0.88, respectively. The results showed that AOD and AAI over the MDSR decreased during 2000–2005, 2006–2017, and 2000–2021, but increased during 2017–2021.The improvements in vegetation coverage and soil moisture together with favorable climatic factors (the increase in temperature and precipitation and the decrease in surface wind speed) resulted in the decreasing trend of AOD and AAI during 2000–2005, 2006–2017, and the entire period of 2000–2021. Conversely, the increase in surface wind speed, the decrease in temperature and the low soil moisture in 2018 and 2020 were the reasons for the increases in AOD and AAI over the MDSR during 2017–2021. The combination effects of surface wind, temperature, soil moisture, and vegetation coverage would determine DSF, AOD, and AAI, in the end, under global climate change.

1. Introduction

Dust storm events tend to emit manydust aerosol particles into the atmosphere with the emission amount being 1000–3321 Tg year−1 (teragrams per year) [1,2]. Over the past decades, many studies have recognized that the dust storm originates in the continental arid and semi-arid regions, and they have focused on the climatic effects and the aeolian transport of mineral dust to the downwind regions [3,4,5,6,7]. Dust aerosol particles affect air pollution, the environment, and human society, not only in the source regions, but also the downwind regions through long-range transportation [8]. Dust aerosol particles can directly affect the radiative balance through scattering and absorption shortwave and longwave radiation [9,10]. Dust aerosol particles also indirectly affect the climate via clouds and precipitation byacting as giant cloud condensation nuclei (CCN) and ice nuclei (IN) [11,12,13], and trigger marine biological activities that are tightly related to the global carbon cycles and marine aerosol production after deposition into the ocean [14]. Dust particles can provide an effective reaction surface (hence, a sink) for acidic gaseous species such as sulfur oxides (SOx, including SO2, SO3, etc.) and nitrogen oxides (NOy, including NO, N2O, NO2 etc.) [15,16]. The observed formation of soluble materials (heterogeneously formed secondary sulfates, chlorides and nitrates) on many dust particles enhanced their cloud-nucleating abilities [13]. Studies have noted that dust in the atmosphere is an efficient way for microorganisms to transport during dust events, and dust-borne microorganisms may play a significant role in the ecosystem and health of the downwind area [17,18]. Thisimplies that dust plays a significant role in the environment, health, and the climate via controlling not only the cloud and precipitation, and marine ecosystem, but also the human health.
Many studies have focused on the distribution and frequency of dust storms in East Asia in recent years. Dust emissions originating from East Asia are estimated to be 214–1100 Tg year−1, accounting for 6–33% of the highest estimation of the total global dust emission, 3321 Tg year−1 [19,20,21], indicating the important contribution of East Asia to the global dust aerosols. The dust storm occurrence frequency (DSF) observed from ground-based meteorological stations during 1952–2002, clearly showed that there were seven high-dust-storm-occurring centers in the Taklimakan Desert, northern China and southern Mongolia [22,23,24]. Model simulations also showed similar results, that the major source regions for East Asian dust aerosols are the deserts in Mongolia, the deserts in northern China, and the Taklimakan Desert in western China, while their dust emission amount accounts for about 70% of the total emission amount [3,25]. Numerical models have been used to simulate the transport and distribution of one dust episode [15,16,26] or long-term distribution (2005–2012 or 2007–2016 or 1960–2014 or 2003–2017) and deposition (1991–2010) [5,6,7,21,27]. In addition to surface observations and model simulations, the MODIS, CALIPSO, the advanced very high resolution radiometer (AVHRR), multi-angle imaging spectroradiometer (MISR), or the TROPOspheric monitoring instrument (TROPOMI) satellites data have been used to observe the distribution and transport of several dust episodes [28,29,30,31,32] or long-term distributions, during different periods of 2001–2019 [7,33,34,35].
There have been many studies concerning the climatic factors of East Asian dust storms. The surface conditions in dust source regions and near-surface wind are two main reasons for the variation in the distribution and frequency of dust storms in East Asia directly [6]. Solar activity, climate change, atmospheric circulations, as well as human activities, will weaken or strengthen dust storms indirectly [6,24,36,37,38]. Increasing precipitation and surface relative humidity, and reducing surface wind speed will weaken dust emissions, while the opposite change in the above meteorological parameters will increase dust uplift [24,37,38]. Global warming was considered as a reason for the obvious downward trend of dust storm frequency in northern China during 1954–2007 [39]. To combine ground-based dust storm events with model simulations of surface dust concentration data, An et al. (2018) found that the intensity and frequency of dust storms were weakened significantly during 2007–2016, which was mainly caused by increased vegetation coverage, and diminished wind speed and polar vortex intensity. The dust AOD created on the basis of MODIS and AVHRR satellite data also showed that AOD decreased over Asia between 2001 and 2018 [33]. The decreasing trend of dust AOD, which was derived from MODIS and CALIOP, between 2003 and 2019 in the southern Gobi Desert, was also found to be significantly correlated with increasing vegetation and decreasing surface wind speed [34].
Although previous studies showed a decreasing trend of East Asian dust storms during 1954–2007, 2007–2016, 2001–2018, and 2003–2019, the variation in East Asian dust storms during the past 20 years is still unclear. Additionally, comprehensive analyses on the reasons for the variation in East Asian dust storms are still rare. In this study, we first carried out a detailed analysis of the variations in DSF in spring, during the period from 2000 to 2005, and aerosol optical depth (AOD) and absorbing aerosol index (AAI) during the period from 2000 to 2021, in East Asian dust storm source regions. Then, the relationship between the variation in climatic factors (wind speed, precipitation, temperature, soil moisture, vegetation index, etc.) and AOD or AAI were investigated to identify the reason for their interannual variation during different periods in East Asian dust storms.

2. Data and Methods

Satellite remote sensing is an important approach to observe the interannual variability and trends of aerosols, including dust aerosols [40], because of its long-term temporal and extensive spatial continuous coverage. For example, the moderate resolution imaging spectroradiometer (MODIS) sensor onboard the Terra (since February 2000) and Aqua (since July 2002) satellites has been observing the global aerosol system for more than 20 years [41]. MODIS has 36 spectral bands covering a wide spectral range from 0.41 to 14.24 μm. MODIS AOD, at 550 nm, has been used to obtain dust aerosol distribution over the ocean [7] and land for comparison with model dust simulations and ground dust observations [16,35,42]. The MODIS Deep Blue AOD algorithm has provided useful information about aerosol properties over bright-reflecting land surfaces, such as the desert, semiarid, and urban regions [43]. The Terra MODIS Deep Blue AOD at 550 nm from Level 3 Collection 6.1 product was used in this study [43]. The spatial resolution of MODIS AOD data is 1° × 1°. The temporal resolution of MODIS AOD data is monthly and seasonal. Compared with the aerosol robotic network (AERONET) measurements, the expected error of the Deep Blue AOD was estimated to be better than 0.05 + 20% [43]. Over various ecological regions of China, MODIS AOD demonstrated a high correlation with AERONET AOD (r = 0.885–0.902) and fell within the expected uncertainty of ±0.05 ± 0.15 × AODAERONET [35]. It is possible to analyze the long-term distribution of East Asian dust storms using the MODIS Deep Blue AOD product.
Absorbing aerosol index (AAI) was used to detect the UV-absorbing aerosols, such as dust and carbonaceous aerosols. Aerosols that absorb UV light are the most important source of positive aerosol index values [44]. The aerosol index is also used to investigate the temporal variability of dust storms over the East Asian dust storm source regions in this study. From 2000 to 2005, AAI was retrieved from the total ozone mapping spectrometer (TOMS, resolution 1.25° × 1°), and, from 2006 to 2021, it was from the ozone monitoring instrument (OMI, resolution 1° × 1°), as TOMS was out of service from2006, and OMI continued to record the total ozone and other atmospheric parameters after 1 October 2004 instead. Daily AAI data were used to calculate the monthly and seasonal averages.
Daily dust storm data observed at 753 meteorological stations in China (see Figure 1) during the period from 1954 to 2007, were used to look through the East Asian dust storm source regions. The monthly (daysmonth−1) and springtime (daysyear−1) dust storm occurrence frequency (DSF), calculated from daily dust storm data during 2000–2007, were used to evaluate the MODIS AOD, TOMS AAI, and OMI AAI products. The dust storm data were obtained from the National Meteorological Information Center, China Meteorological Administration (NMIC/CMA). At each station, dust storm weather phenomena were defined as storms with a minimum visibility of ≤1 km and instantaneous maximum wind speed of ≥10 ms−1 [24].
To evaluate whether the satellite AOD and AAI can represent the variations in East Asian dust storms or not, the correlation coefficients between monthly DSF and AOD/AAI were estimated and the significance level was obtained through t-test statistics. Significant correlation indicated that AOD/AAI can demonstrate the seasonal characteristics of dust storms. Meanwhile, the spatial distribution of AOD/AAI was compared to DSF during the same period. Spatial consistency further suggested that AOD/AAI could be used as an indicator of dust storms.
The normalized difference vegetation index (NDVI) is a normalized transform of the measured near-infrared (NIR)-to-red waveband spectral responses, (XNIR − Xred)/(XNIR + Xred), designed to standardize vegetation index values to between −1 and +1 [45,46]. The NDVI is utilized to monitor global vegetation conditions, land cover and land cover change, and agricultural activities, etc. [45]. The spatial resolution of Terra MODIS NDVI data is 0.05° × 0.05° and the temporal resolution of NDVI data is seasonal.
Other seasonal meteorological and soil condition parameters were from the modern-era retrospective analysis for research and applications version 2 (MERRA-2) [47]. MERRA-2 is a NASA atmospheric re-analysis dataset for the satellite era using the Goddard earth observing system model, version 5 (GEOS-5) with its atmospheric data assimilation system (ADAS), version 5.12.4. The datasets used included the air temperature at 2 m above the ground (unit: K, in short, 2-m air temperature), the surface skin temperature (unit: K), the volumetric soil moisture content in the 0–5 cm surface layer (SFMC, unit: m3m−3), the total column production of precipitation (unit: kgm−2s−1), and the surface wind speed (unit: ms−1). The spatial resolution of MERRA-2 data is 0.625° × 0.5°.

3. Results and Discussion

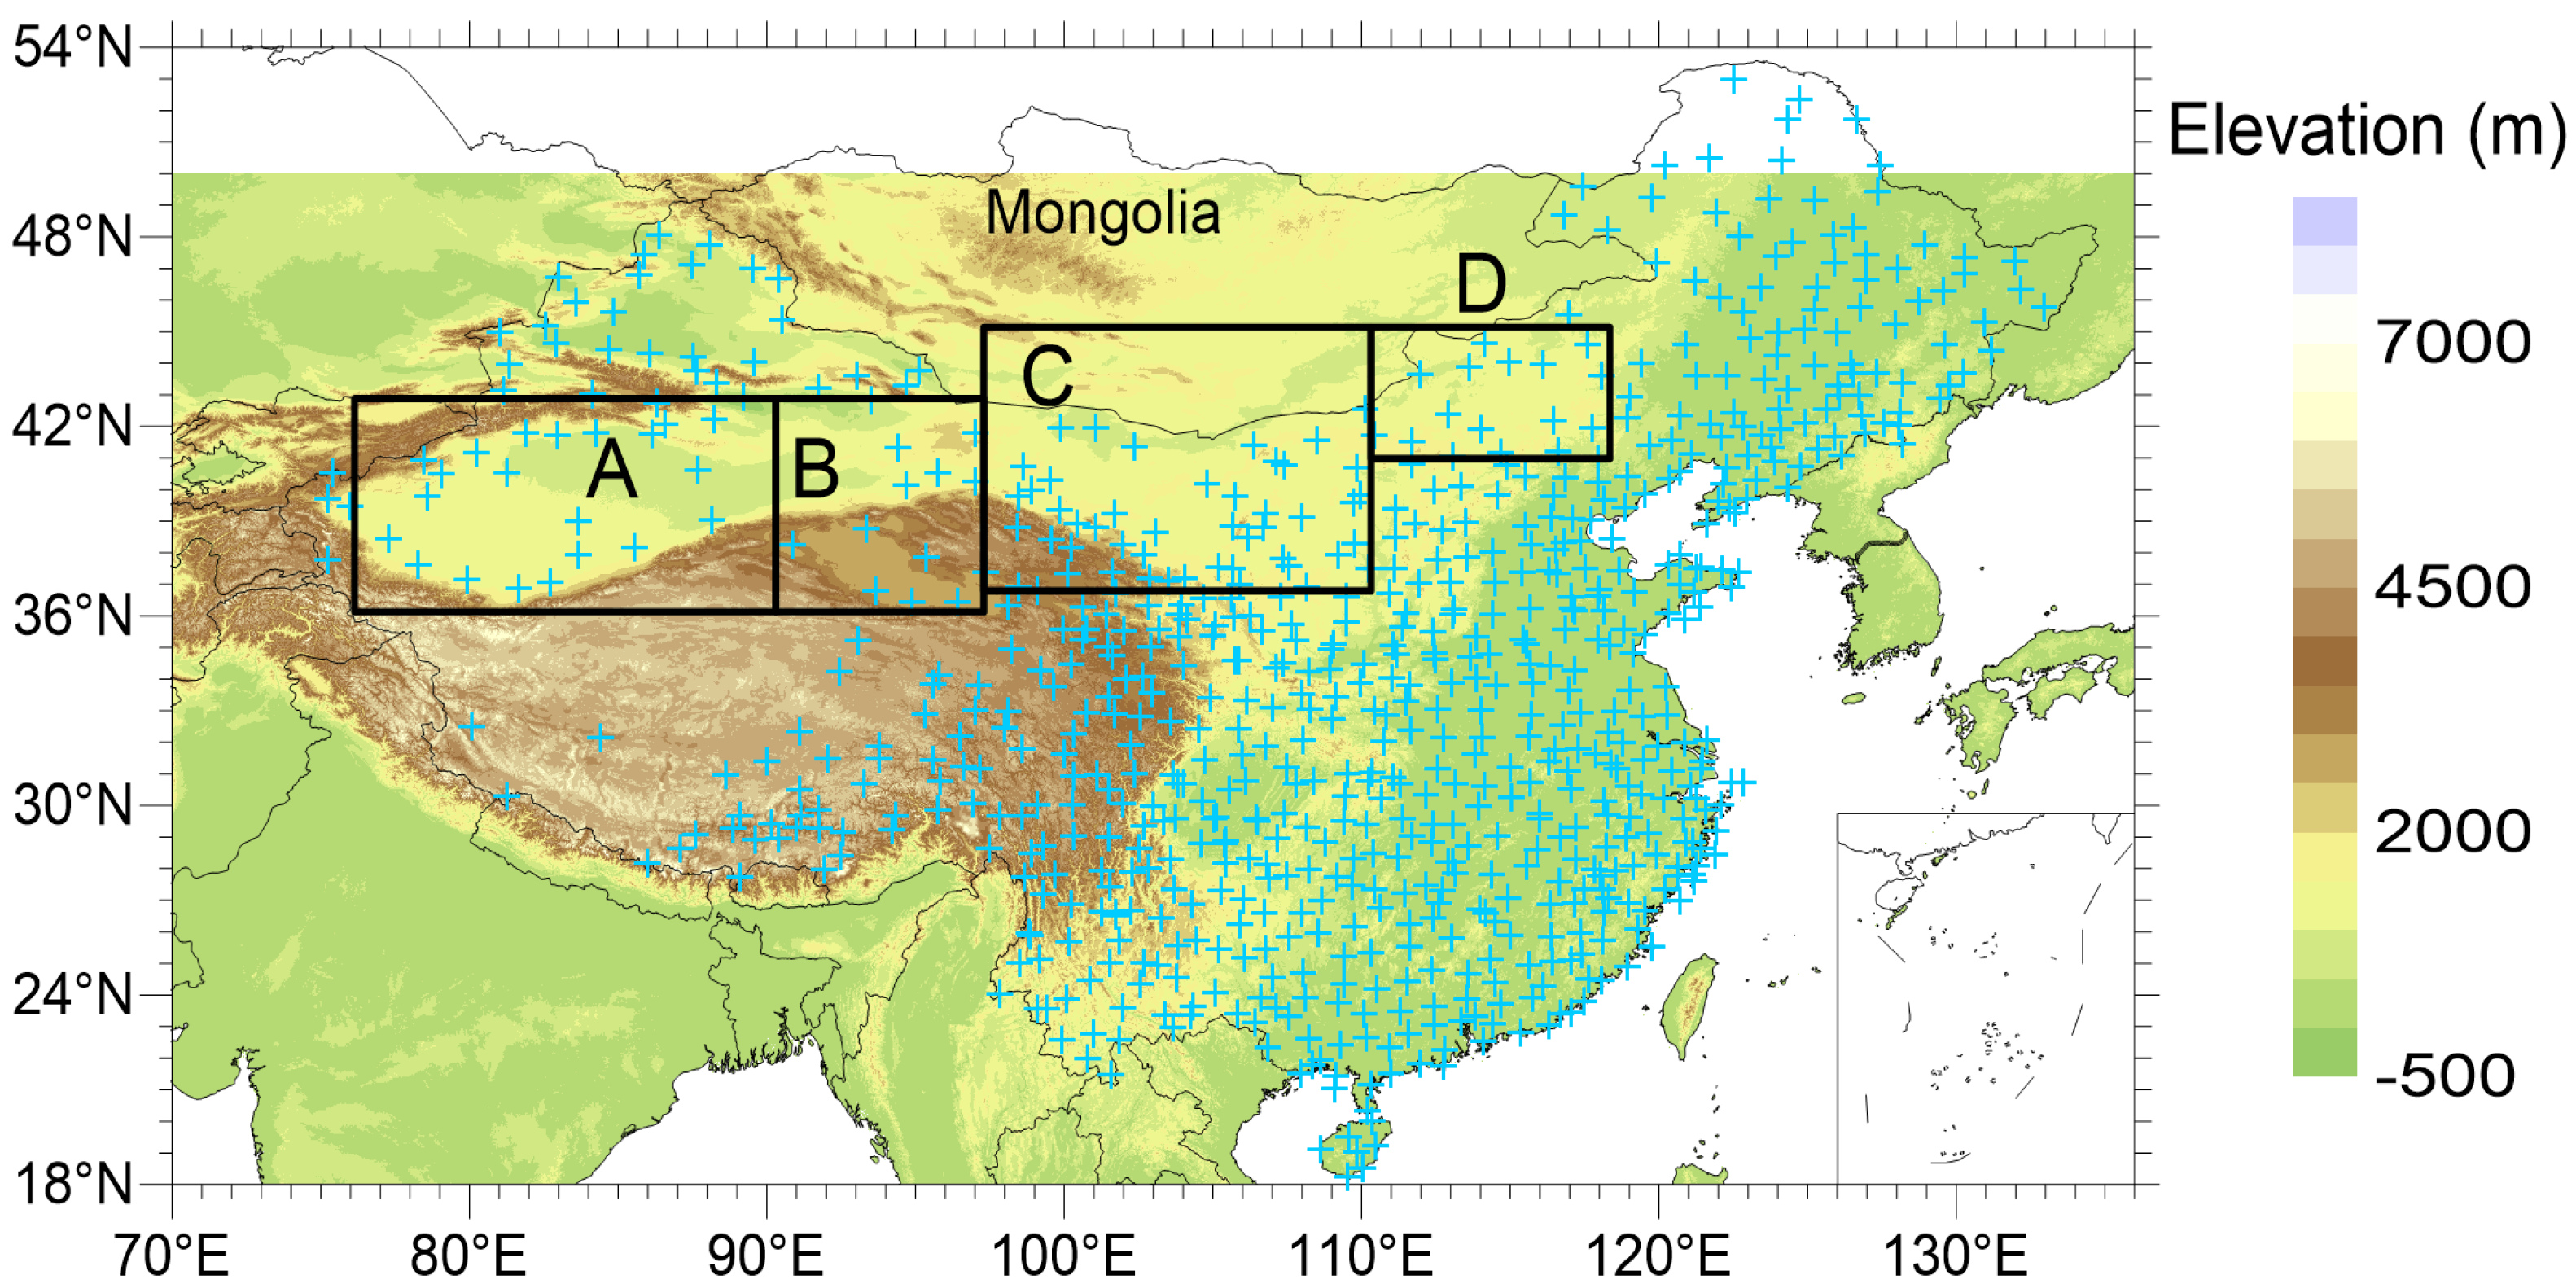
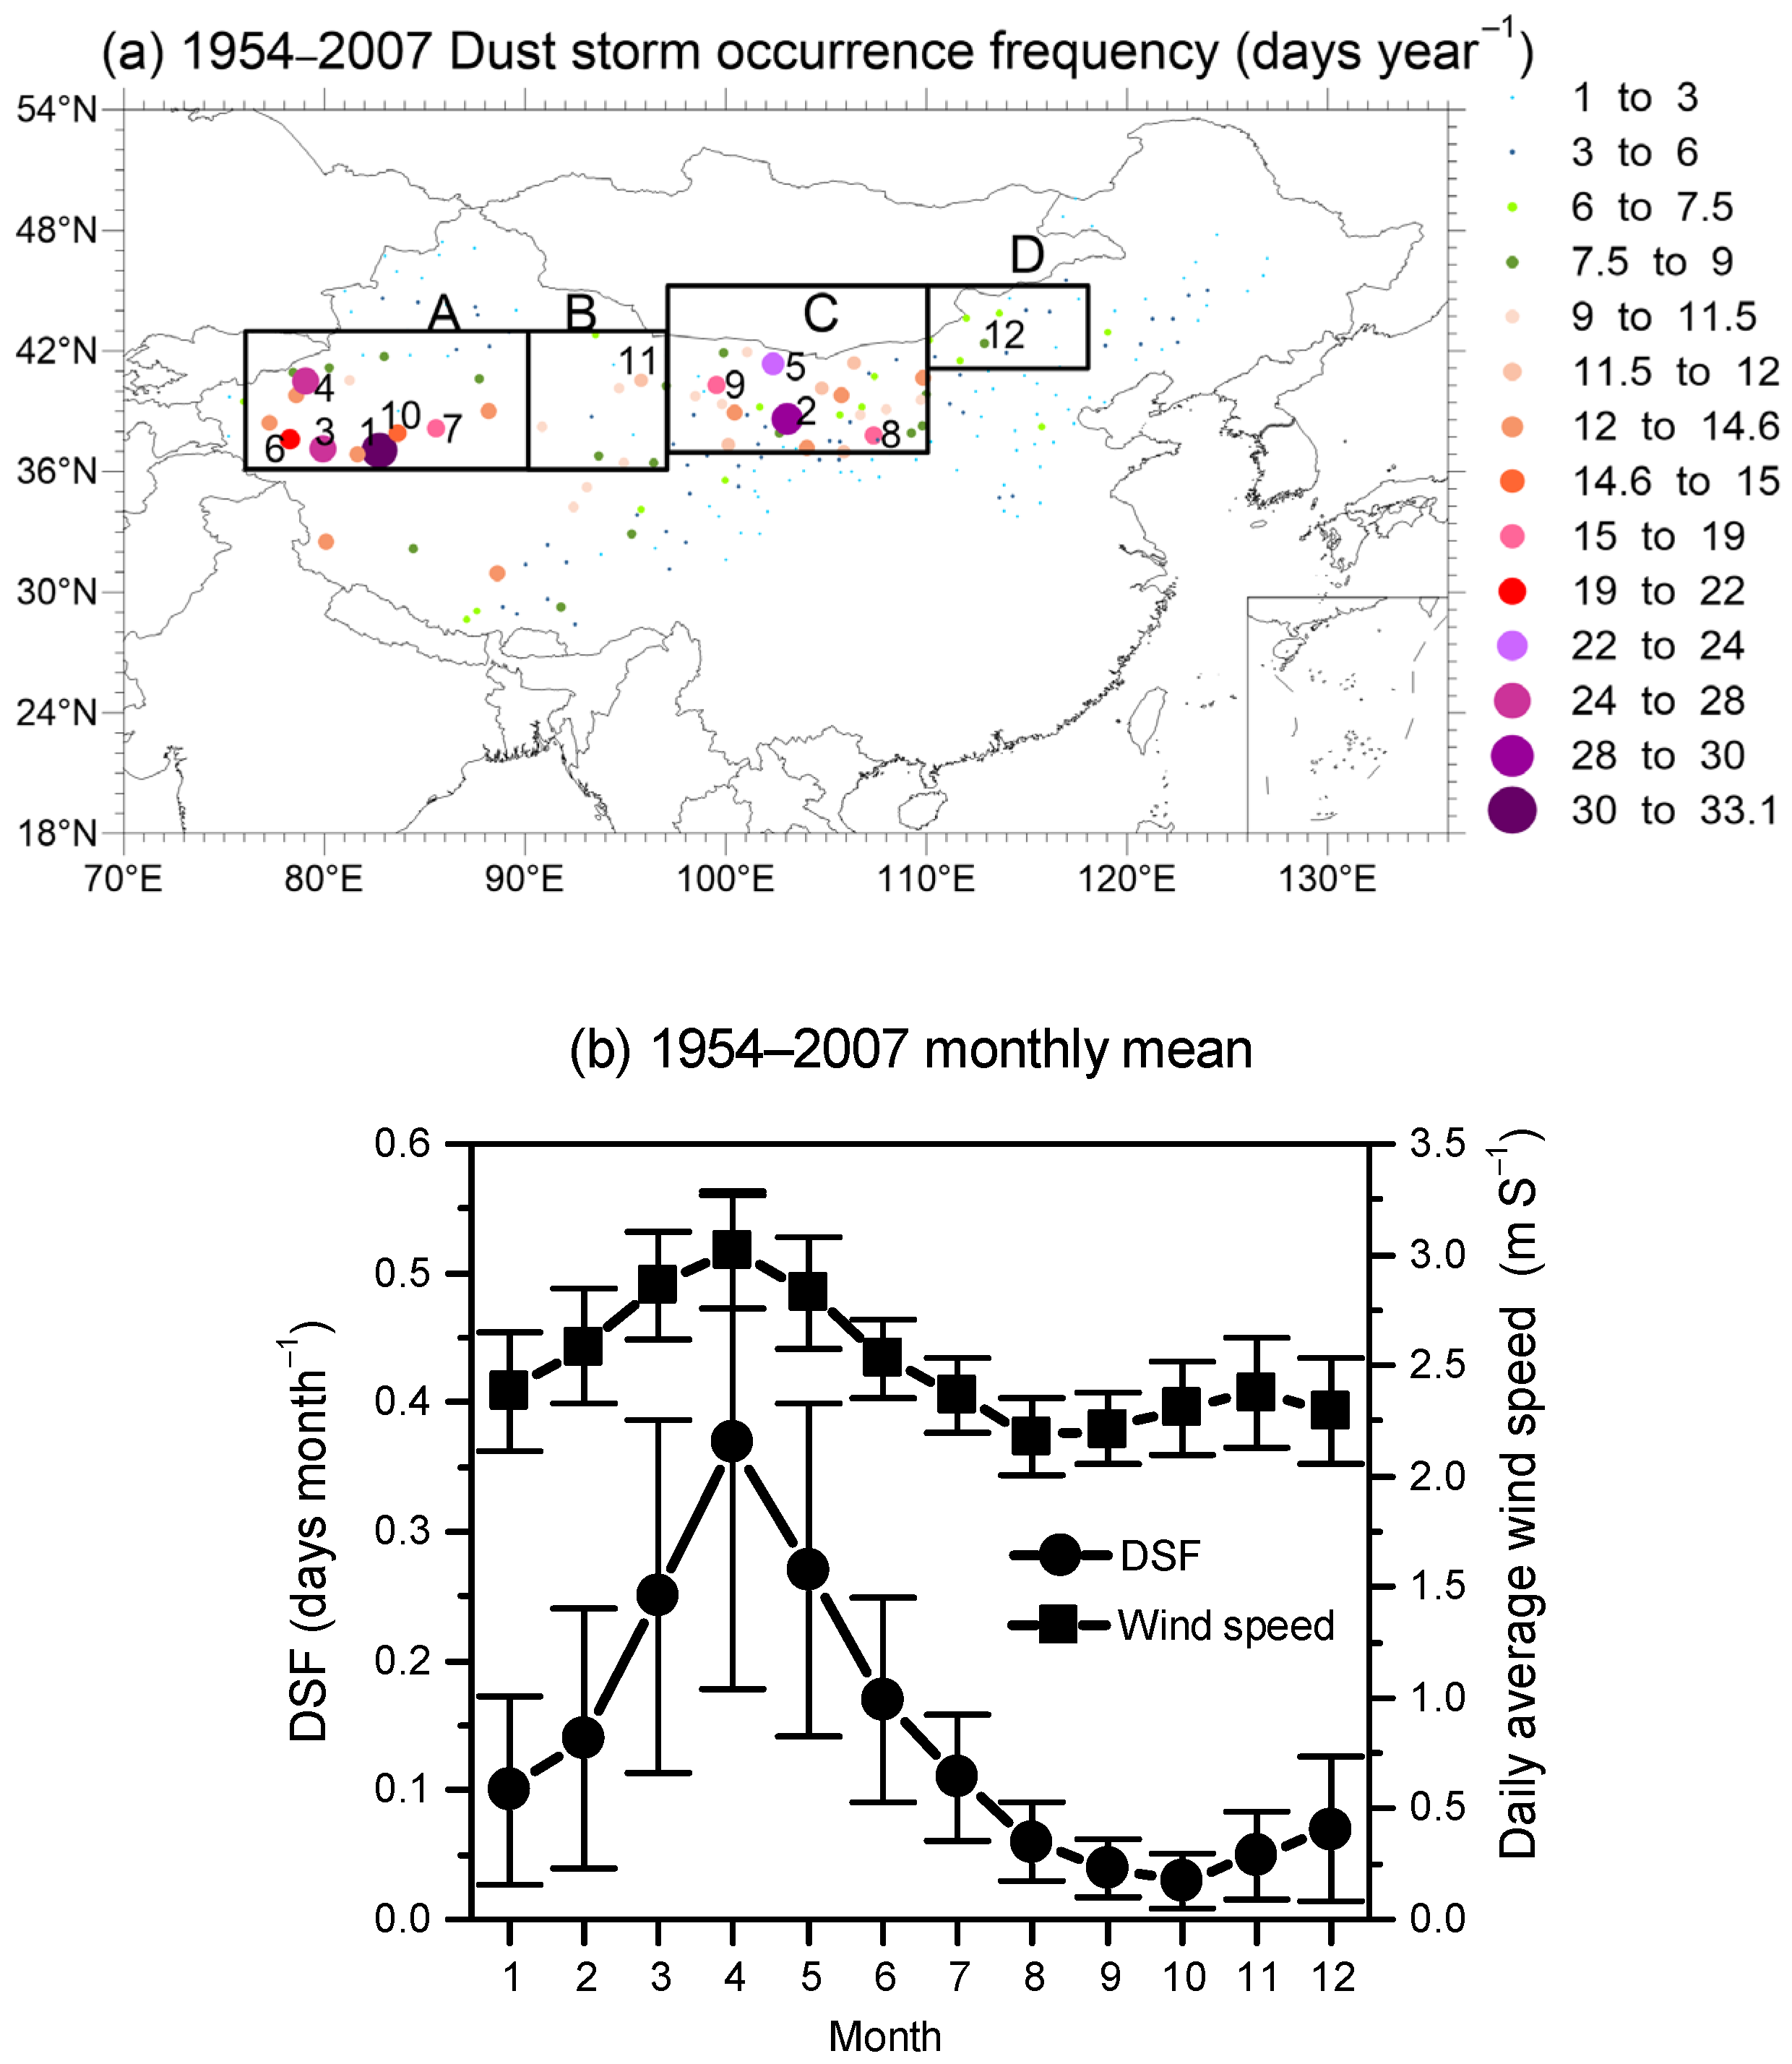
3.1. Climatological Mean of Dust Storm Occurrence Frequency over China

The East Asian dust storm source regions were shown from the climatological distribution of DSF during the period from 1954 to 2007. The spatial distributions of the annual mean occurrence frequency of dust storms (daysyear−1) during 1954–2007 in China is shown in Figure 2a. It shows four main source regions and they are: A: the Taklimakan Desert (76–90° E, 36–43° N) in the Tarim Basin; B: the desert in Tsaidam Basin and the Kumutage Desert (90–97° E, 36–43° N); C: southern Mongolia and western Inner Mongolia located in the Gobi Desert (97–110° E, 37–45° N), which contains the Hexi Corridor, the Alax Plateau, the Ordos Plateau, and the northern Loess Plateau; and D: the Hunshandake (or OnqinDaga) sandy land (110–118° E, 41–45° N).
The four source regions have a high DSF during the period from 1954 to 2007 (Figure 2a). The highest frequencies for A, B, C, and D occurred at the Minfeng, Anxi, Minqin, and Zhurihe (or Jurh) stations, respectively, with the values of 33.1, 11.5, 28.2, and 7.9 daysyear−1, respectively. The highest dust storms occurred at regions A and C. Six out of the top 10 highest DSF stations (stations 1–10 are shown in Figure 2a) were located in region A, and the remaining four highest DSF stations were located in region C. The frequencies at stations 1–10 are in descending order, which means that station 1 Minfeng has the highest frequency while the station 10 Andehe has the lowest frequency. Region C contains four high-dust-storm-occurring centers from Qian et al. (2006), and they are in the west and middle of Inner Mongolia, containing the Alax Plateau, the Hexi Corridor, the Ordos Plateau, and part of the Loess Plateau, and southern Mongolia. The four high DSF regions are consistent with the seven high-dust-storm-occurring centers in the Taklimakan Desert, northern China, and southern Mongolia observed from ground-based meteorological stations during 1952–2002 [22,23,24], which is also consistent with the model simulations [3,25].
The annual cycle of DSF (Figure 2b) showed that dust storms in China mainly occurred in the spring season (March, April, and May), which accounted for 54% of the year. April had the largest DSF, which accounted for 23% of the year. Thus, we focused on the variation in DSF, AOD, and AAI in the spring season in this study.

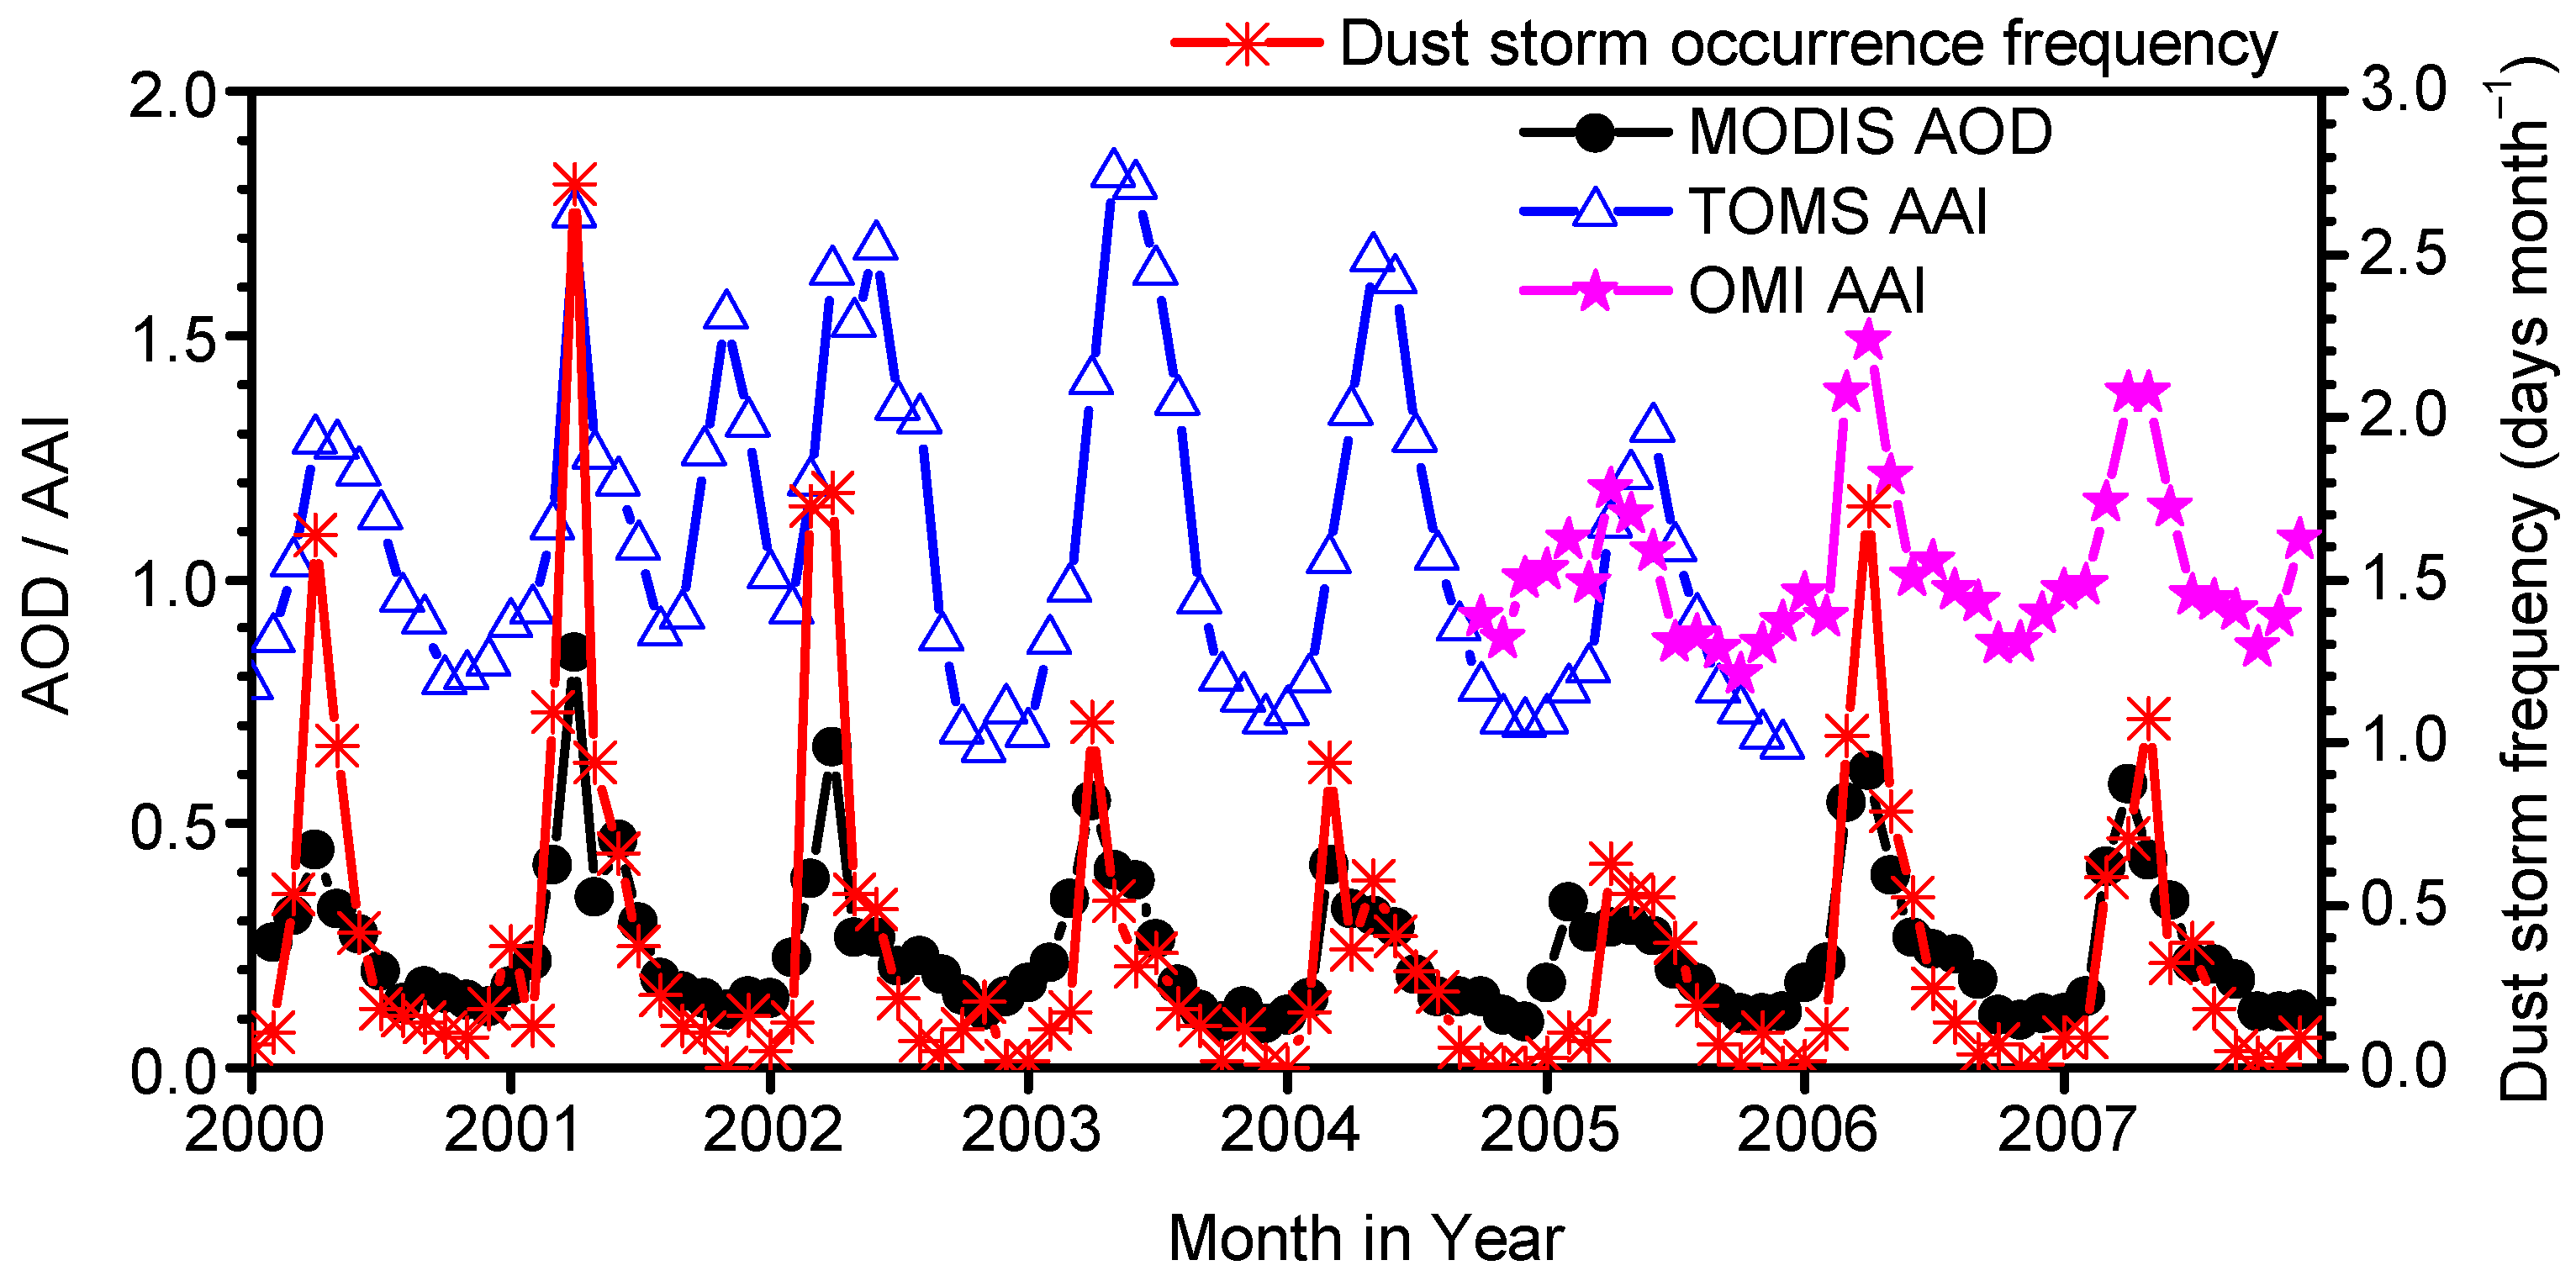
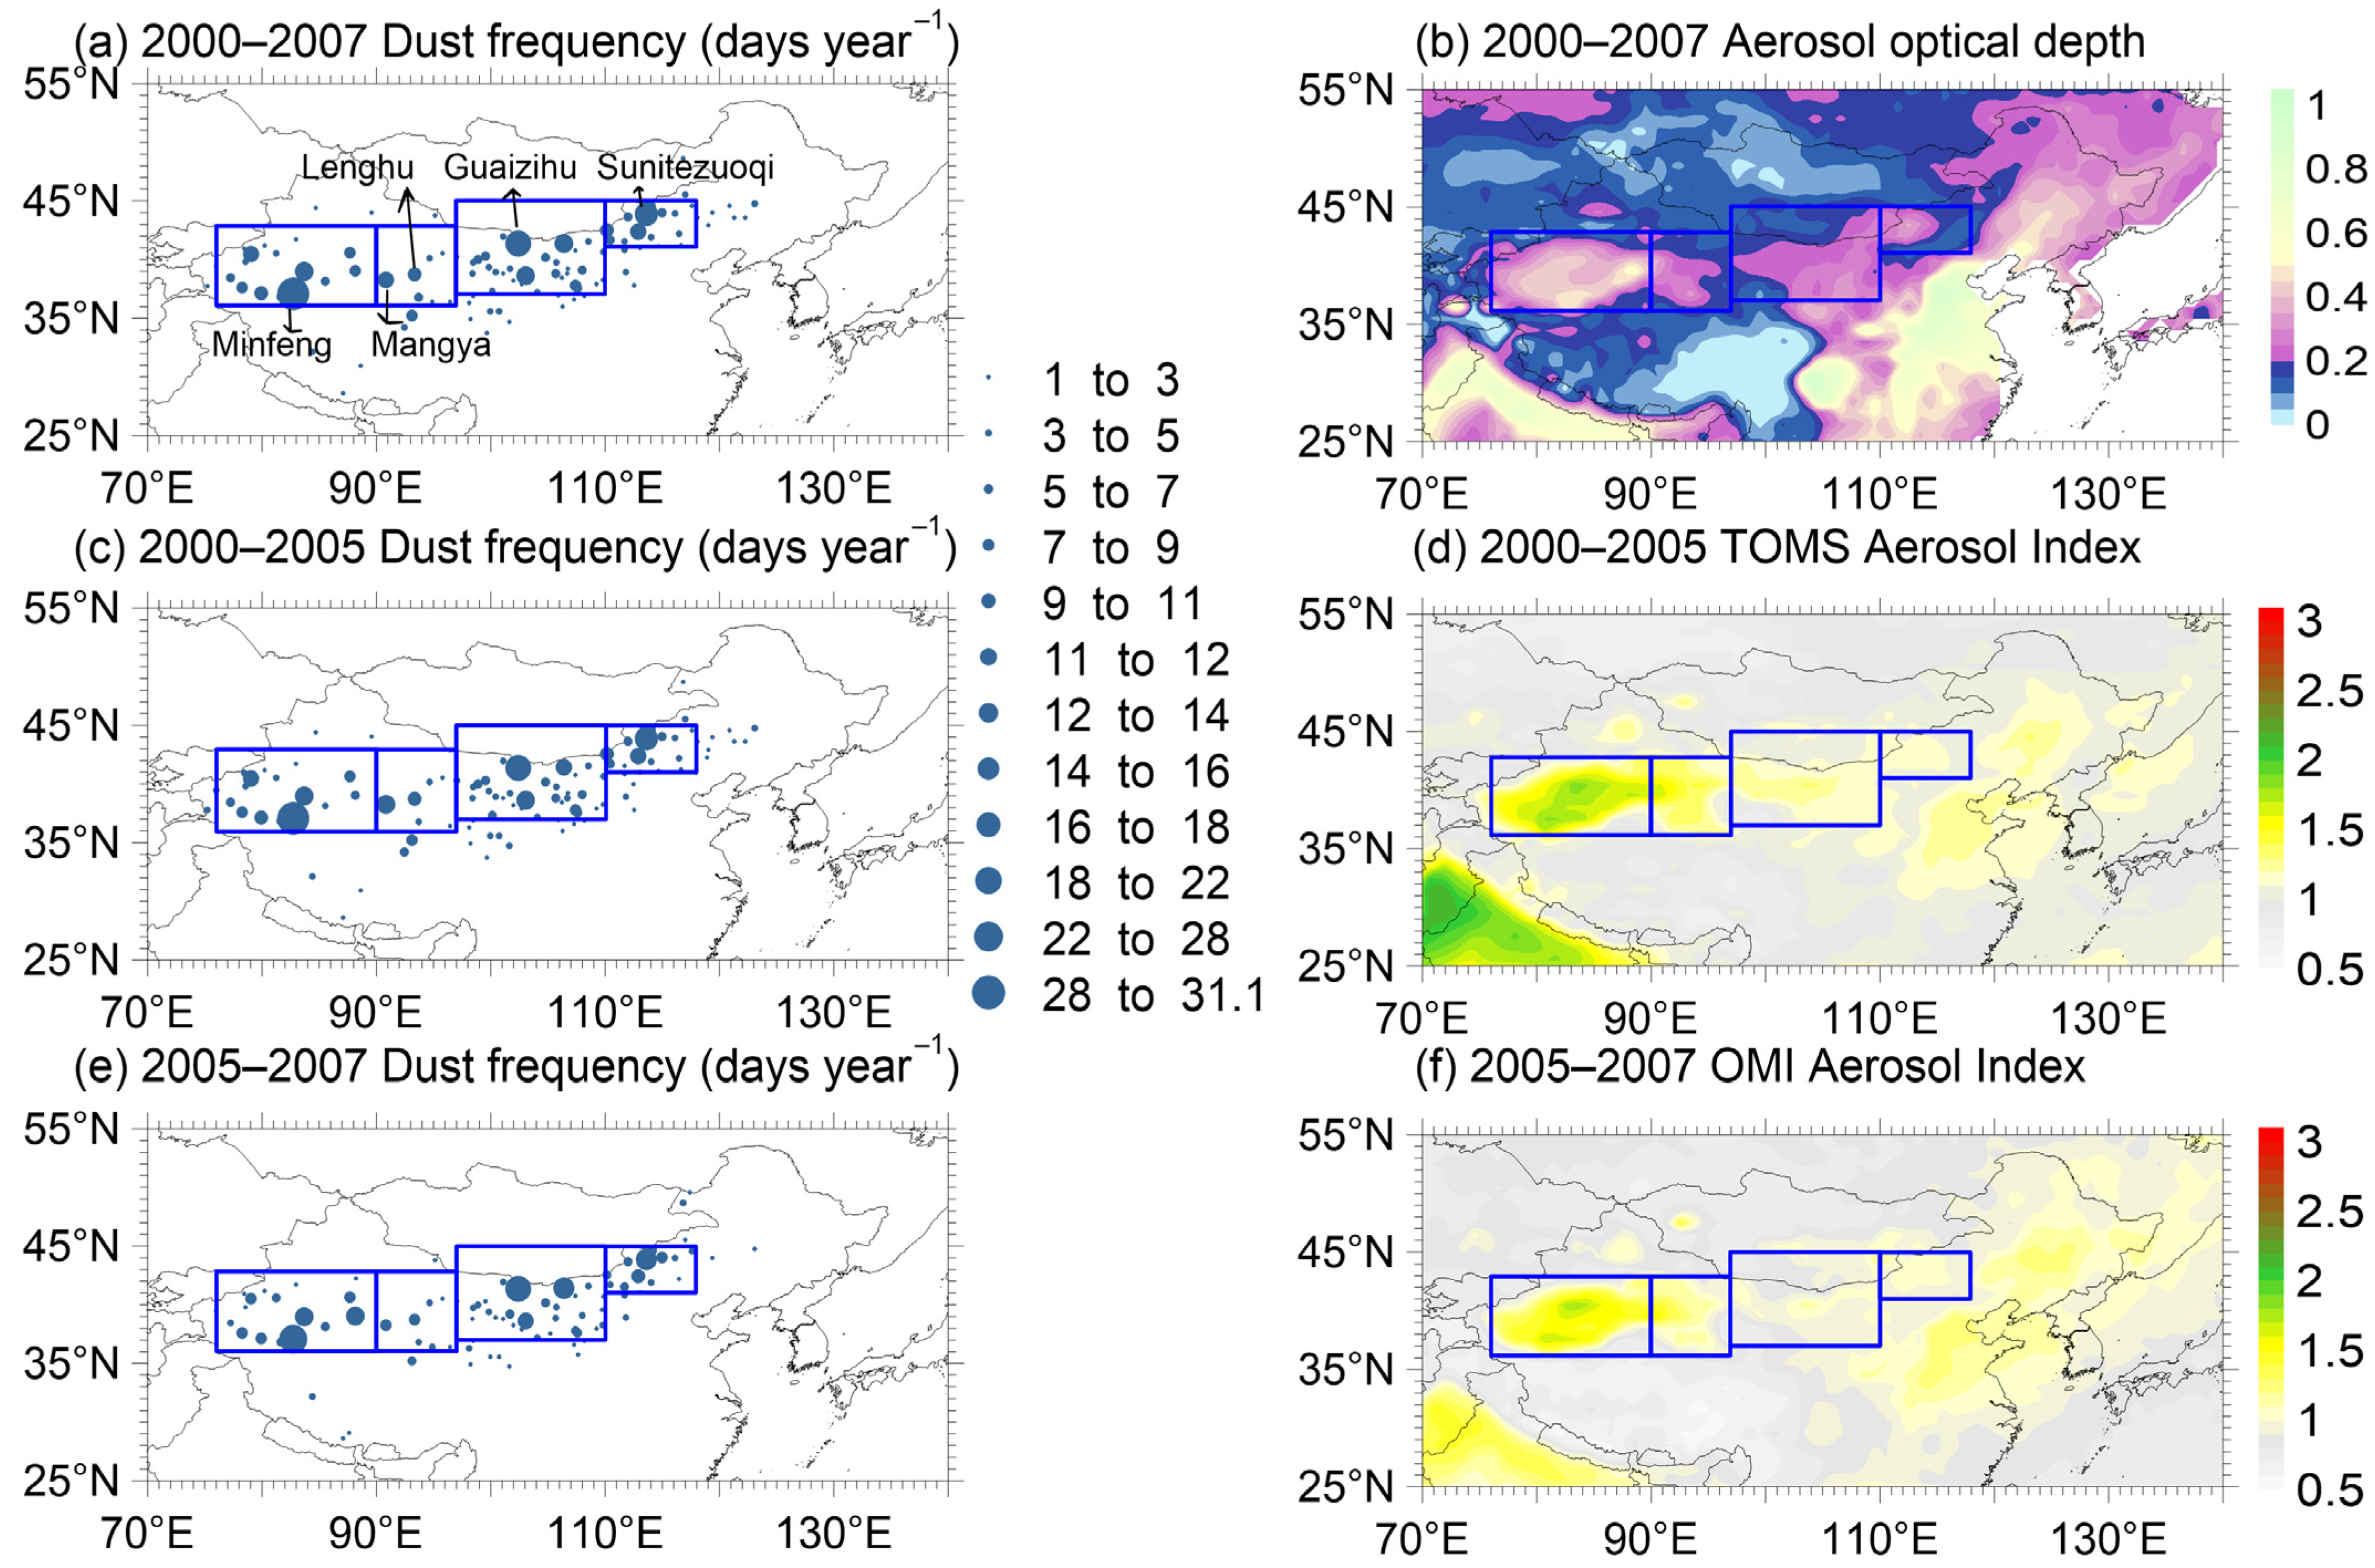
3.2. The Comparison of MODIS AOD and TOMS/OMI AAI with DSF

In the four main dust storm source regions, the monthly DSF (daysmonth−1) was significantly correlated with monthly MODIS AOD during 2000–2007, TOMS AAI during 2000–2005, and OMI AAI during 2004–2007 in China, with the correlation coefficients of 0.88, 0.55, and 0.88, respectively. Figure 3 showed that they had a similar seasonal variation, which explains why the values in spring were larger than that in the other seasons.
The spatial distributions of the annual mean DSF (daysyear−1) during 2000–2007, 2000–2005, and 2005–2007 (Figure 4) were similar to that during 1954–2007 (Figure 2a). The annual mean DSF during 2000–2007, 2000–2005, and 2005–2007 all showed the same four main source regions, A, B, C, and D, as that during 1954–2007. The highest frequency of dust storms occurred at regions A and C. The highest DSF during 2000–2007 for regions A, B, C, and D appeared at Minfeng, Mangya, Guaizihu, and Sunitezuoqi (or SonidZuoqi) with the values of 29.6, 11.4, 18.9, and 17.1, respectively. The highest DSF during 2000–2005 for regions A, B, C, and D appeared at the same stations as those during 2000–2007, and the values were 31.0, 12.3, 18.3, and 17.0, respectively. The highest DSF during 2005–2007 for regions A, B, C, and D appeared at Minfeng, Lenghu, Guaizihu, and Sunitezuoqi with the values of 26.0, 7.3, 19.3, and 15.7, respectively. The annual mean MODIS AOD during 2000–2007, TOMS AAI during 2000–2005, and OMI AAI during 2005–2007 showed similar distributions with the DSF. The large AOD and AAI values occurred over the four dust storm source regions, A, B, C, and D.
The consistent spatial and temporal distributions between the DSF and AOD or AAI implicated that AOD and AAI could be used as an index of dust aerosols in the four main East Asian dust storm source regions.

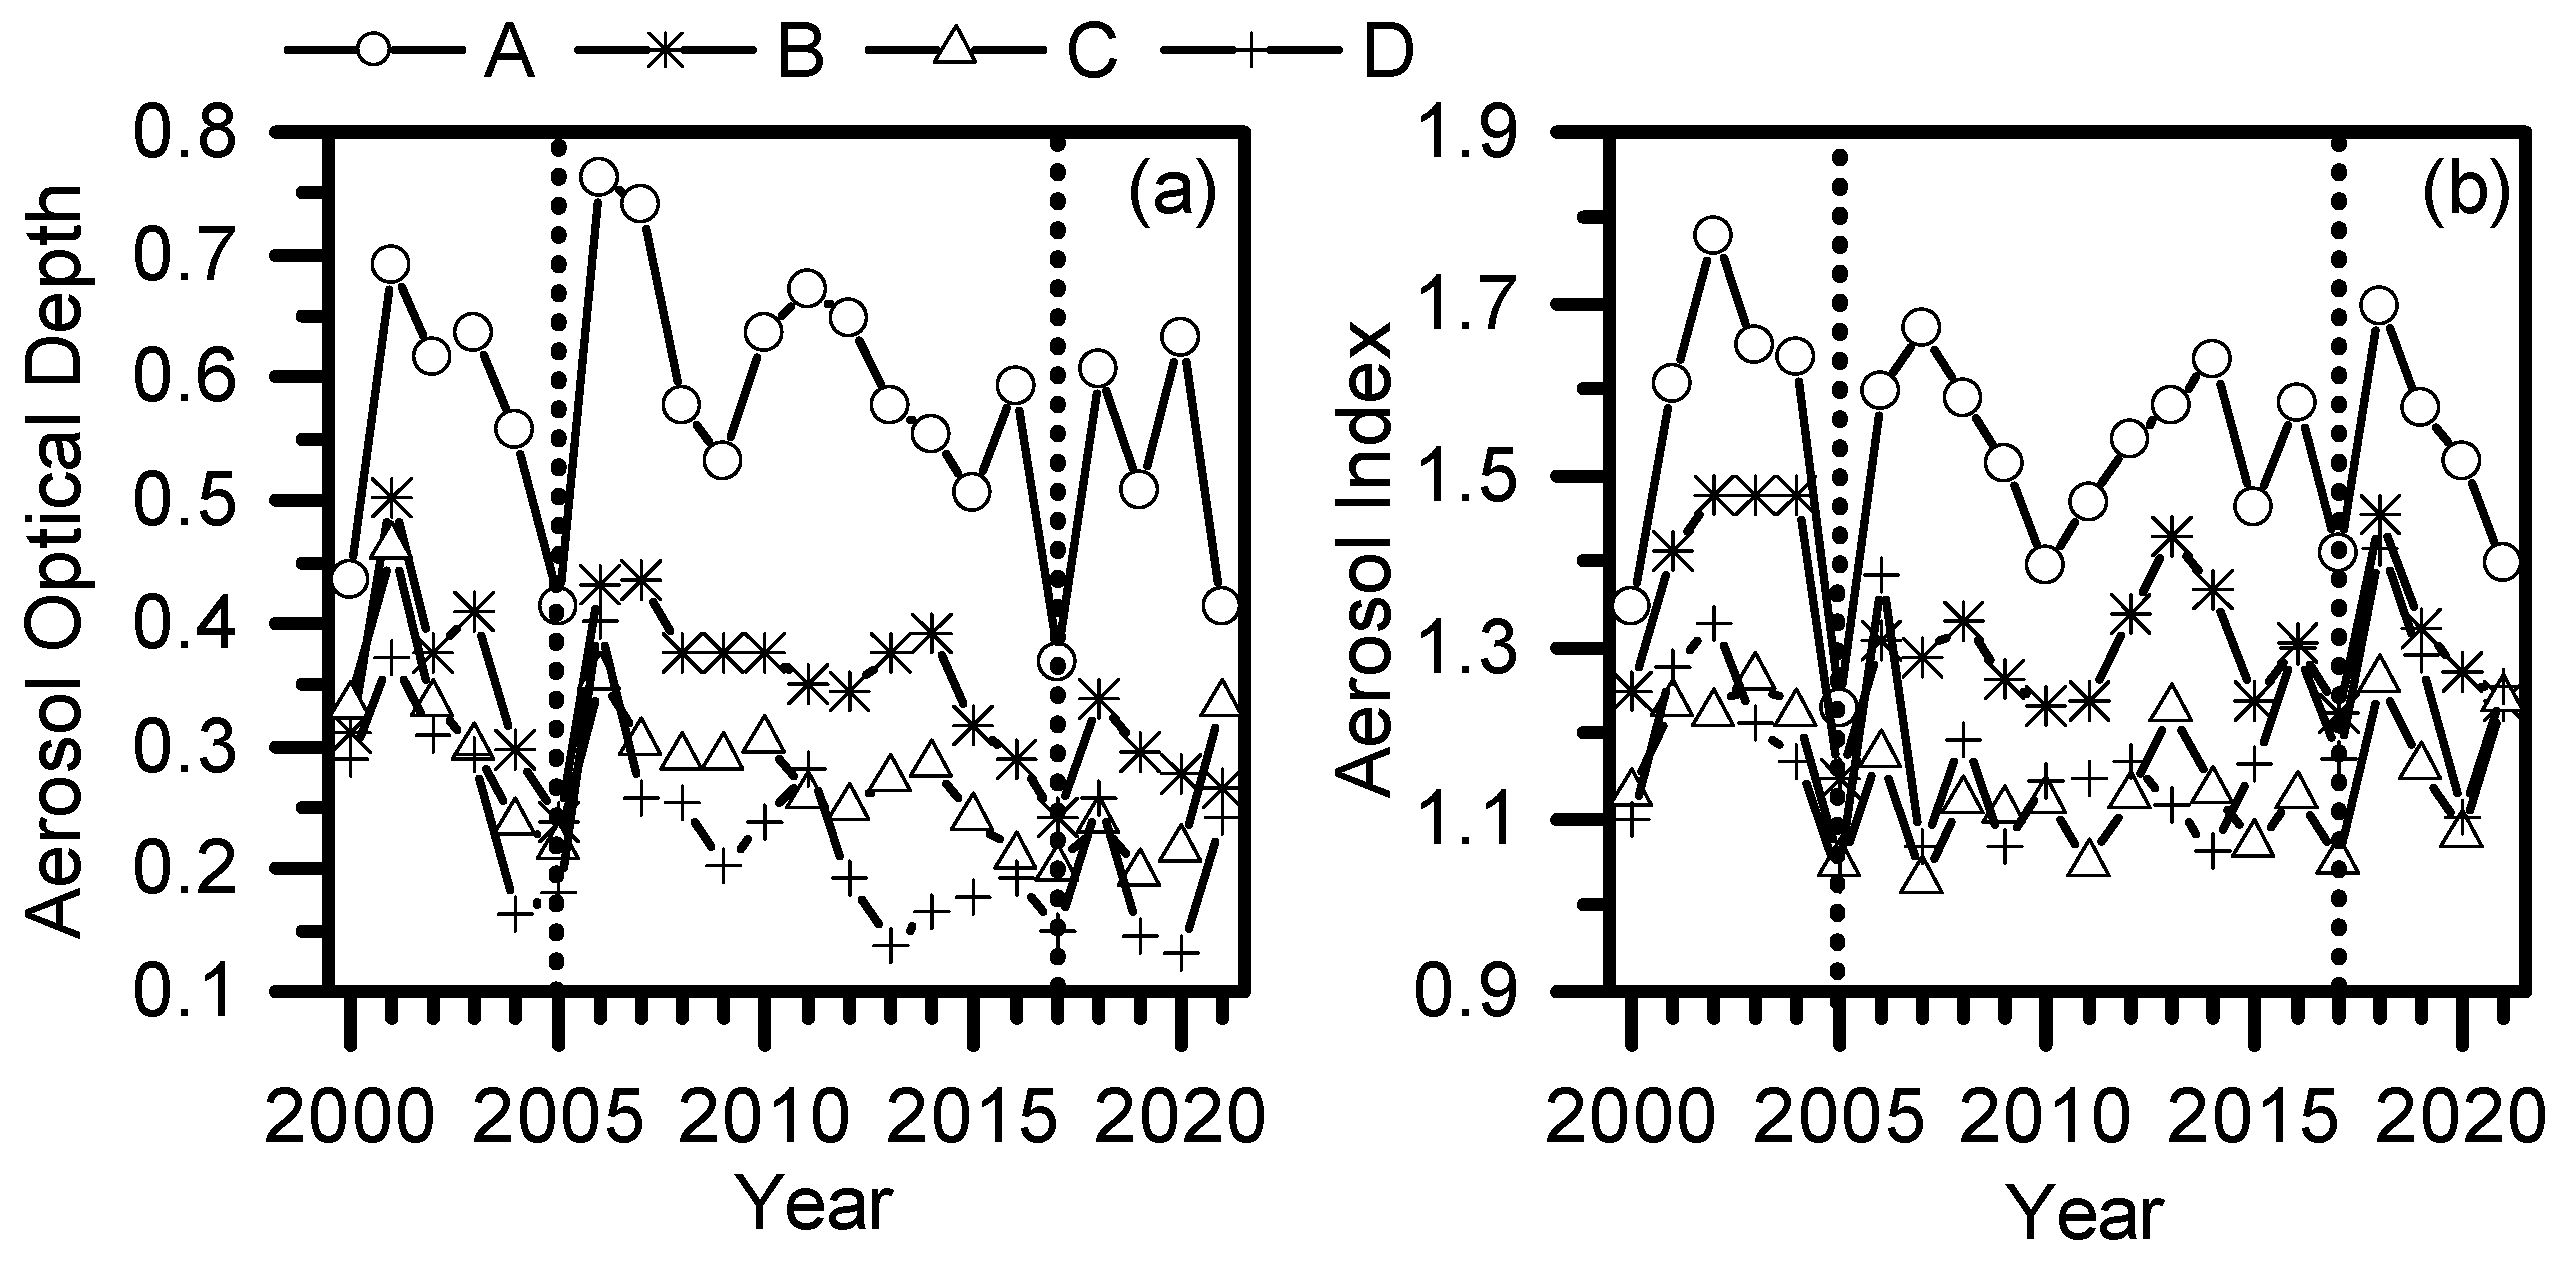
3.3. Variation in Spring AOD and AAI over the East Asian Dust Source Regions

The interannual variation in spring (March, April, and May) AOD and AAI over the dust storm source regions A, B, C, and D during the period 2000–2021 is shown in Figure 5. During the period 2000–2005, the AOD over these four regions had peak values in 2001 and then decreased to very low or the lowest level in 2005. During the period 2006–2017, AOD had another peak values in 2006 or 2007 and then decreased to very low or the lowest level in 2017. Compared with the AOD in 2017, a large increase was observed in 2018 and 2020 over region A, in 2018 over region B, in 2018 and 2021 over regions C and D. AAI showed similar variations inAOD, and AAI decreased to the lowest values in 2005, during the period 2000–2005, showed a decreasing trend during 2006–2017, and showed a large increase in 2018. An et al. (2018) also reported that the intensity and frequency of dust storms were weakened significantly during 2007–2016 [6]. Thus, we separated 2000–2021 into three sub-periods, 2000–2005, 2006–2017, and 2017–2021, to undertakefurther analyses.
During each sub-period of 2000–2005, 2006–2017, and 2017–2021, the annual mean AOD, AAI, and DSF in spring in each grid or at each station for all years during each sub-periodwere linearly fitted to determine the annual mean variations. The variation ratio of each parameter was the ratio of its annual mean variation to its annual mean value during the period 2000–2021 (Table 1 and Figure 6). The annual mean variations and variation ratios in spring DSF, AOD, and AAI are shown in Table 2 and Figure 7, Figure 8 and Figure 9. The annual mean variations in surface wind speed (ms−1), NDVI, precipitation (mmday−1), surface soil moisture content (m3m−3), 2-m air temperature (K), and soil temperature 0–10 cm underground (K) are also shown in the same table and figures.
The mean DSF over the main dust storm region (76–118° E, 36–45° N, MDSR) in spring from 2000 to 2005 (Figure 4c), the mean AOD and AAI over the MDSR in spring from 2000 to 2021 (Figure 6a,b) were 1.695 daysyear−1, 0.365, and 1.264 (Table 1), respectively. Region A had the highest AOD (0.573) and AAI (1.541), and the second largest DSF (2.616 daysyear−1). Region D had the lowest AOD (0.229) and low AAI (1.190). The average annual variations in DSF, AOD and AAI during the sub-period 2000−2005 over the MDSR were −0.522 days, −0.024, and −0.013 per year, respectively (Figure 7). The variation ratios of the mean spring DSF, AOD, and AAI over the MDSR during the sub-period 2000–2005 were −30.796%, −6.575%, and −1.028%, respectively (Table 2). The largest decrease in DSF occurred in region C, where the mean DSF decreased by −0.783 days per year (−31.320%). The decrease in DSF was also very large in regions B and D, where the mean DSF decreased by −0.559 days (−23.616%) and −0.875 days (−20.998%) per year, respectively. AOD had a similar variation with DSF. The top two largest decreases in AOD occurred in regions C and D, where the mean decreases in AOD were −0.037 (−13.262%) and −0.034 (−14.847%) per year, respectively. The largest decrease in AAI occurred in region D, where the mean AAI decreased by −0.022 per year (−1.849%).
AOD and AAI during the sub-period of 2006–2017 showed the same decreasing trend as that during the sub-period of 2000–2005. During the period 2006–2017, the average annual variations in spring AOD and AAI over the MDSR were −0.015 and −0.005 per year, respectively; the corresponding variation ratio of spring AOD and AAI were −4.110% and −0.396%, respectively (Table 2). The decrease in AOD and AAI during the period 2006–2017 was as least 37.490% smaller than that during the period 2000–2005. The largest and the second largest decreases in AOD occurred in regions D and A, respectively, and the average annual variations (ratio) in AOD were −0.016 (−6.987%) per year for region D and −0.024 (−4.188%) per year for region A. The average annual decreases in AOD in region B and C are similar, and were −0.013 (−3.757%) and −0.011 (−3.943%) per year, respectively. Similarly, the largest and the second largest decreases in AAI occurred in region A and D, respectively, where the average annual variationsin AAI were −0.009 (−0.584%) and −0.002 (−0.168%) per year, respectively.
Unlike the two sub-periods of 2000–2005 and 2006–2017, AOD and AAI increased during the sub-period 2017–2021 and increased in region B during the sub-period 2017–2020. AOD and AAI had high increases in regions A and C. The average annual variations in AOD in region A and C were 0.016 (2.792%) and 0.025 (8.961%) per year, respectively, and the average annual variations in AAI in region A and C were 0.020 (1.298%) and 0.020 (1.744%) per year, respectively (Table 2). During the period 2017–2021, the average annual variations in AOD and AAI in spring over the MDSR were 0.015 (4.110%) and 0.002 (0.158%) per year, respectively (Table 2).

3.4. The Relationship between AOD or AAI and Surface Wind Speed

Strong wind is an important factor for dust storms [4,6,24]. Wind erosion is an essential process of dust emission to the atmosphere, and an observational study found that soil moisture had marked effects on the aeolian erosion threshold wind speed [4]. The threshold wind speed for dry soil conditions was estimated to be 7.5 ms−1 at 3.8 m height and was 21% lower than that for wet soil conditions (9.5 ms−1) [4]. During the period from 2000 to 2021, the mean spring surface wind speed in the MDSR was relatively higher than that in surrounding regions, and the mean value was 6.296 ms−1 (Figure 6c and Table 1). The surface wind speeds in regions A, B, C, and D were 5.366, 6.264, 6.928, and 7.987 ms−1, respectively. The mean volumetric soil moisture content in the 0–5 cm surface layer, in spring during the period 2000–2021 in most MDSR, was lower than 0.2 m3m−3 (Figure 6h). The SFMC in the MDSR appeared lower than the surrounding regions, suggesting the dry soil conditions in the MDSR. The surface wind speed was the highest in region D and low in regions A and B, and the SFMC had the same pattern, where the highest SFMC occurred in region D (mean value 0.146 m3m−3) and was low in regions A (mean value 0.100 m3m−3) and B (mean value 0.092 m3m−3). This is consistent with the aeolian erosion threshold wind speed for dry soil conditions being lower than that for wet soil conditions [4].
Region A, the Taklimakan desert, had the lowest mean surface wind speed since it is located in the Tarim Basin in the southern Xingjiang Province. The areas in the north, west, and south of the Taklimakan desert are surrounded by high mountains (average elevation higher than 5000 m) and there is an open area only in the east. The wind near the surface in the Tarim Basin is easterly and/or northeasterly, dust particles frequently float near the surface to a height of about 5000 m over the Taklimakan desert, and dust particles uplifted to an elevationof >5000 m are transported over a long range by a westerly wind [48,49].
During the sub-periods of 2000–2005 and 2006–2017, the annual mean variations in surface wind speed in the MDSR were –0.006 ms−1 and –0.033 ms−1 per year, respectively, and the corresponding variation ratios were –0.095% and –0.524%, respectively (Table 2). During the whole period of 2000–2021, the annual mean variations in surface wind speed in the MDSR were –0.013 ms−1 (the corresponding variation ratios was –0.206%) per year. The decrease in surface wind speed contributed to the weakened dust storm events andhence, the decrease in DSF, AOD, and AAI. Conversely, the annual mean variation in surface wind speed in the MDSR for the period 2017–2021, increased by 0.021 ms−1 (the corresponding variation ratio was 0.334%) per year. The increase in surface wind speed would strengthen the occurrence of dust storm events and hence, the increase in AOD and AAI. The DSF, AOD, and AAI were significantly positively correlated with the surface wind speed in spring during different periods from 2000 to 2021 (Table 3). Similarly, the monthly climatology DSF during the period 1954–2007 had a significantly positive relationship with surface wind speed based on the observations at meteorological stations, and the correlation coefficient was 0.96 (Figure 2b). The significantly positive relationship between surface wind speed and DSF, AOD, or AAI supported the marked effects of surface wind speed on dust storm occurrence.

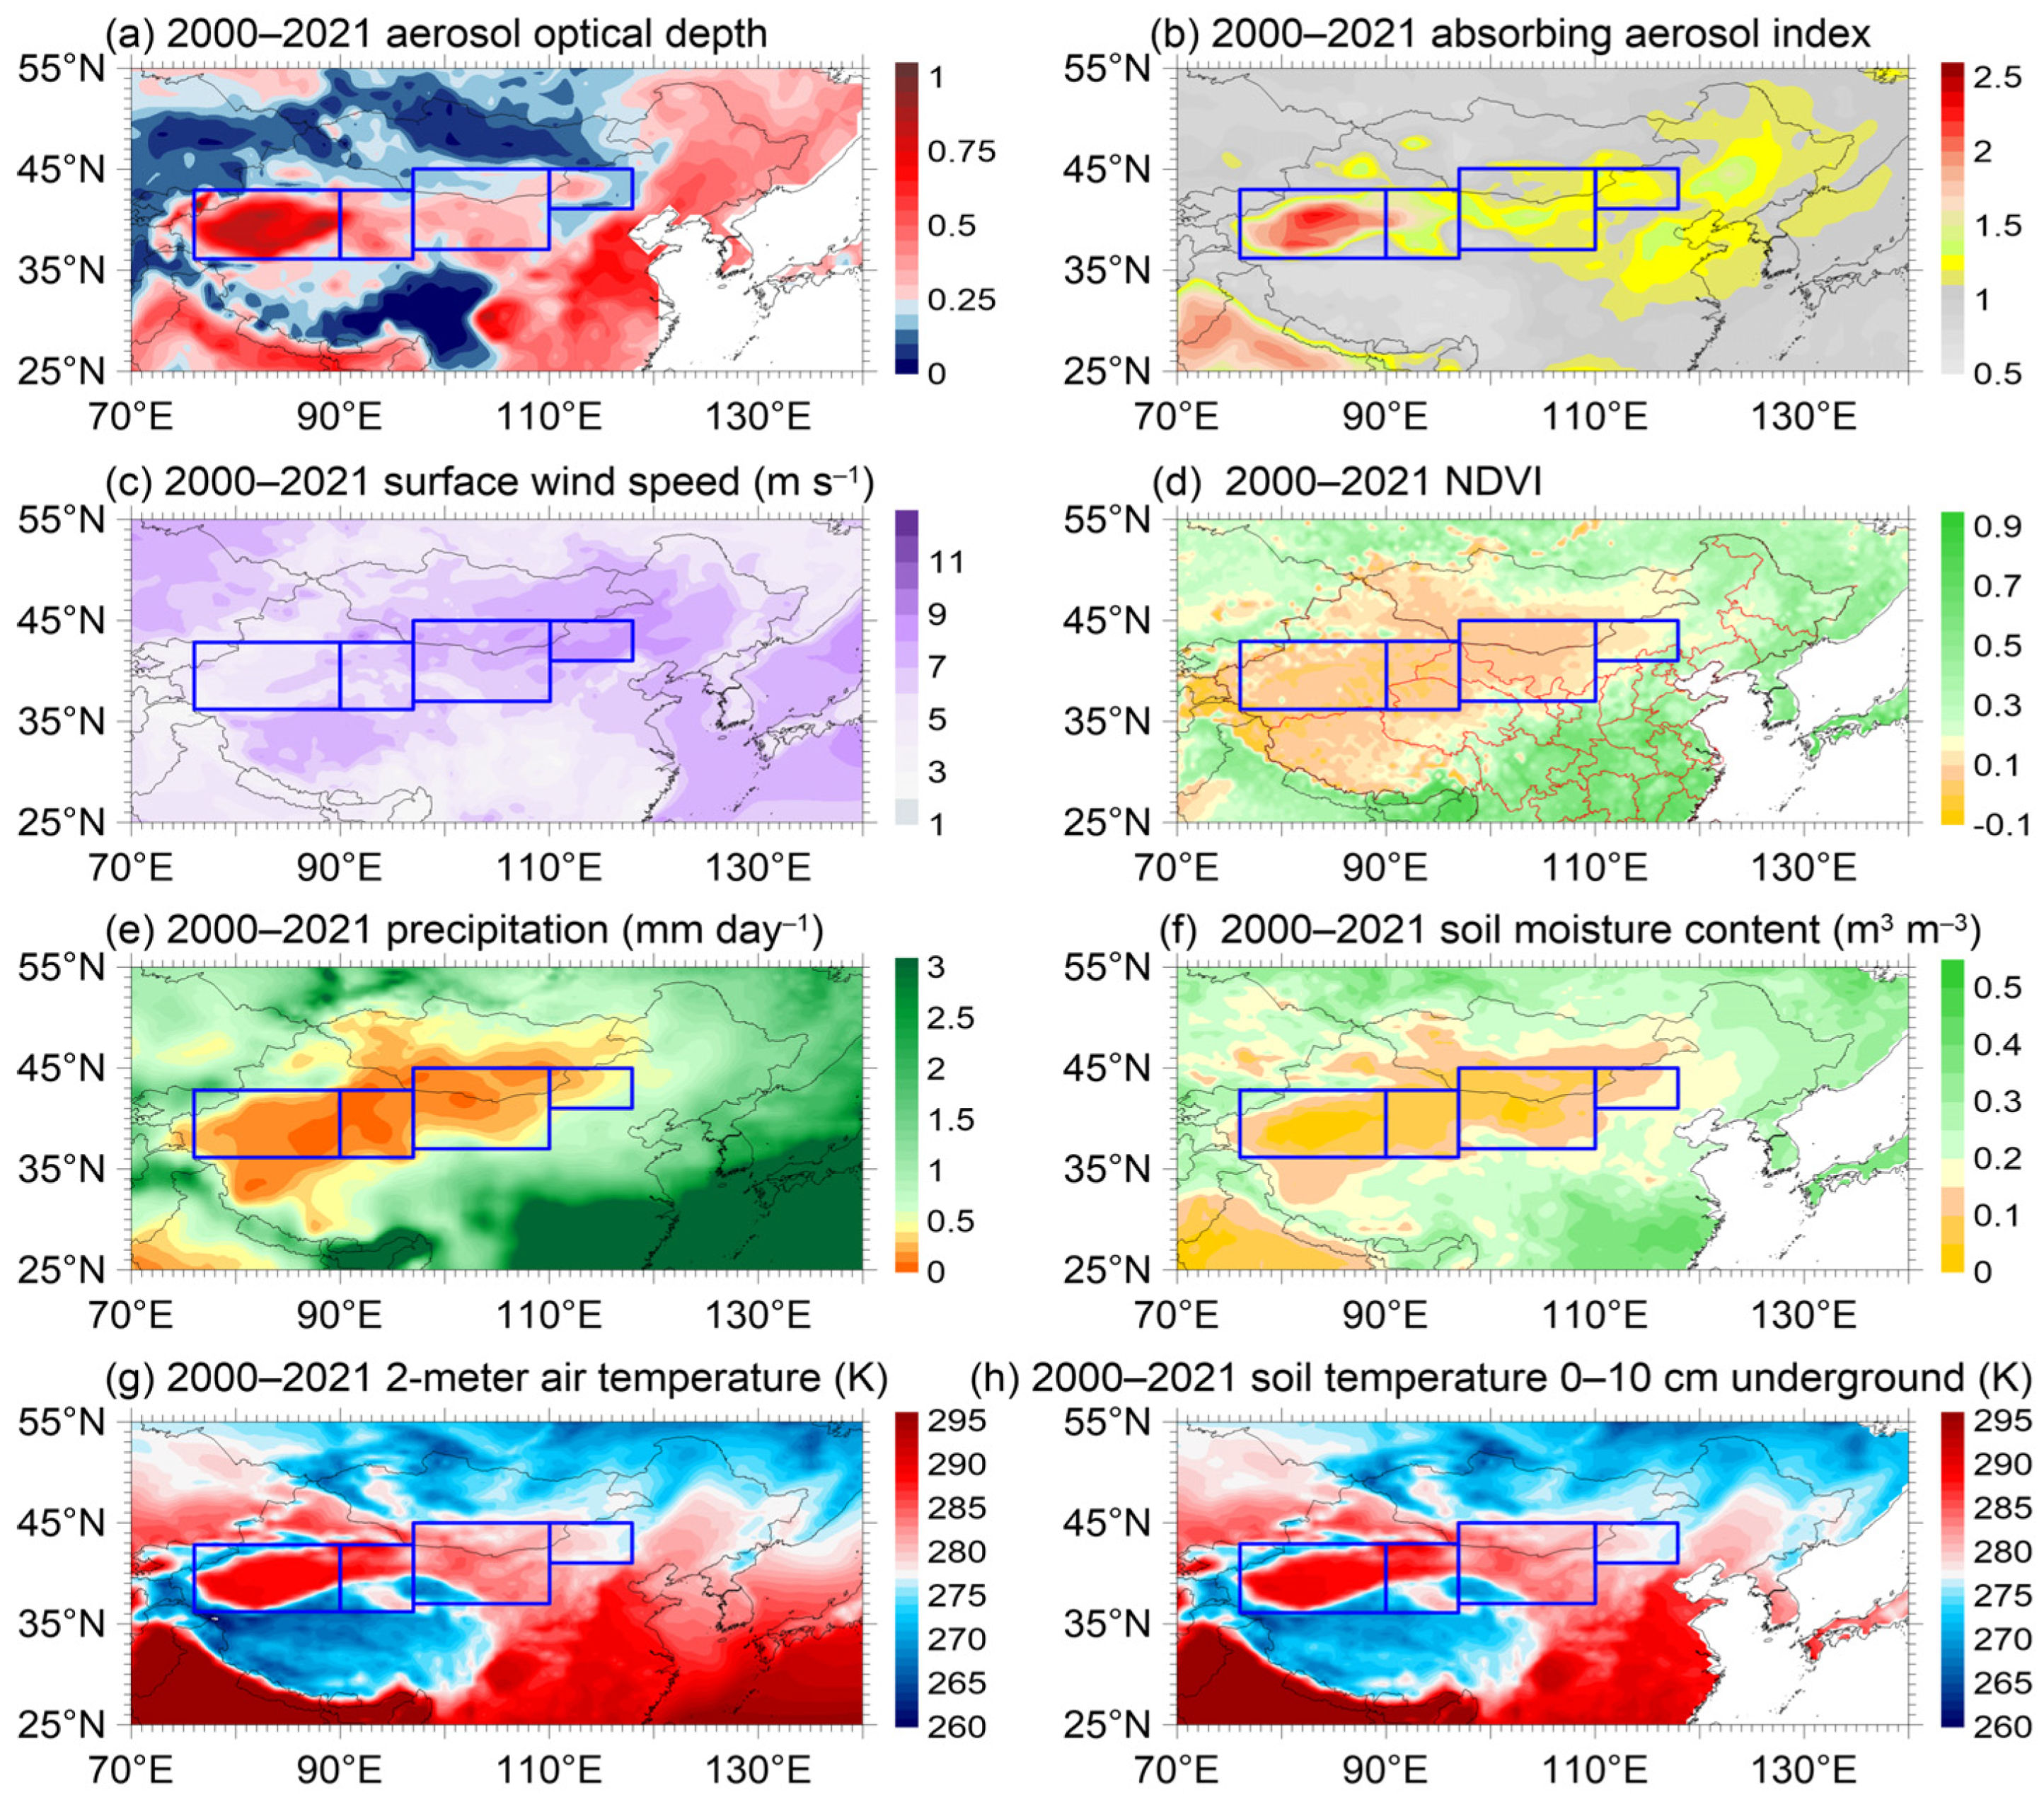
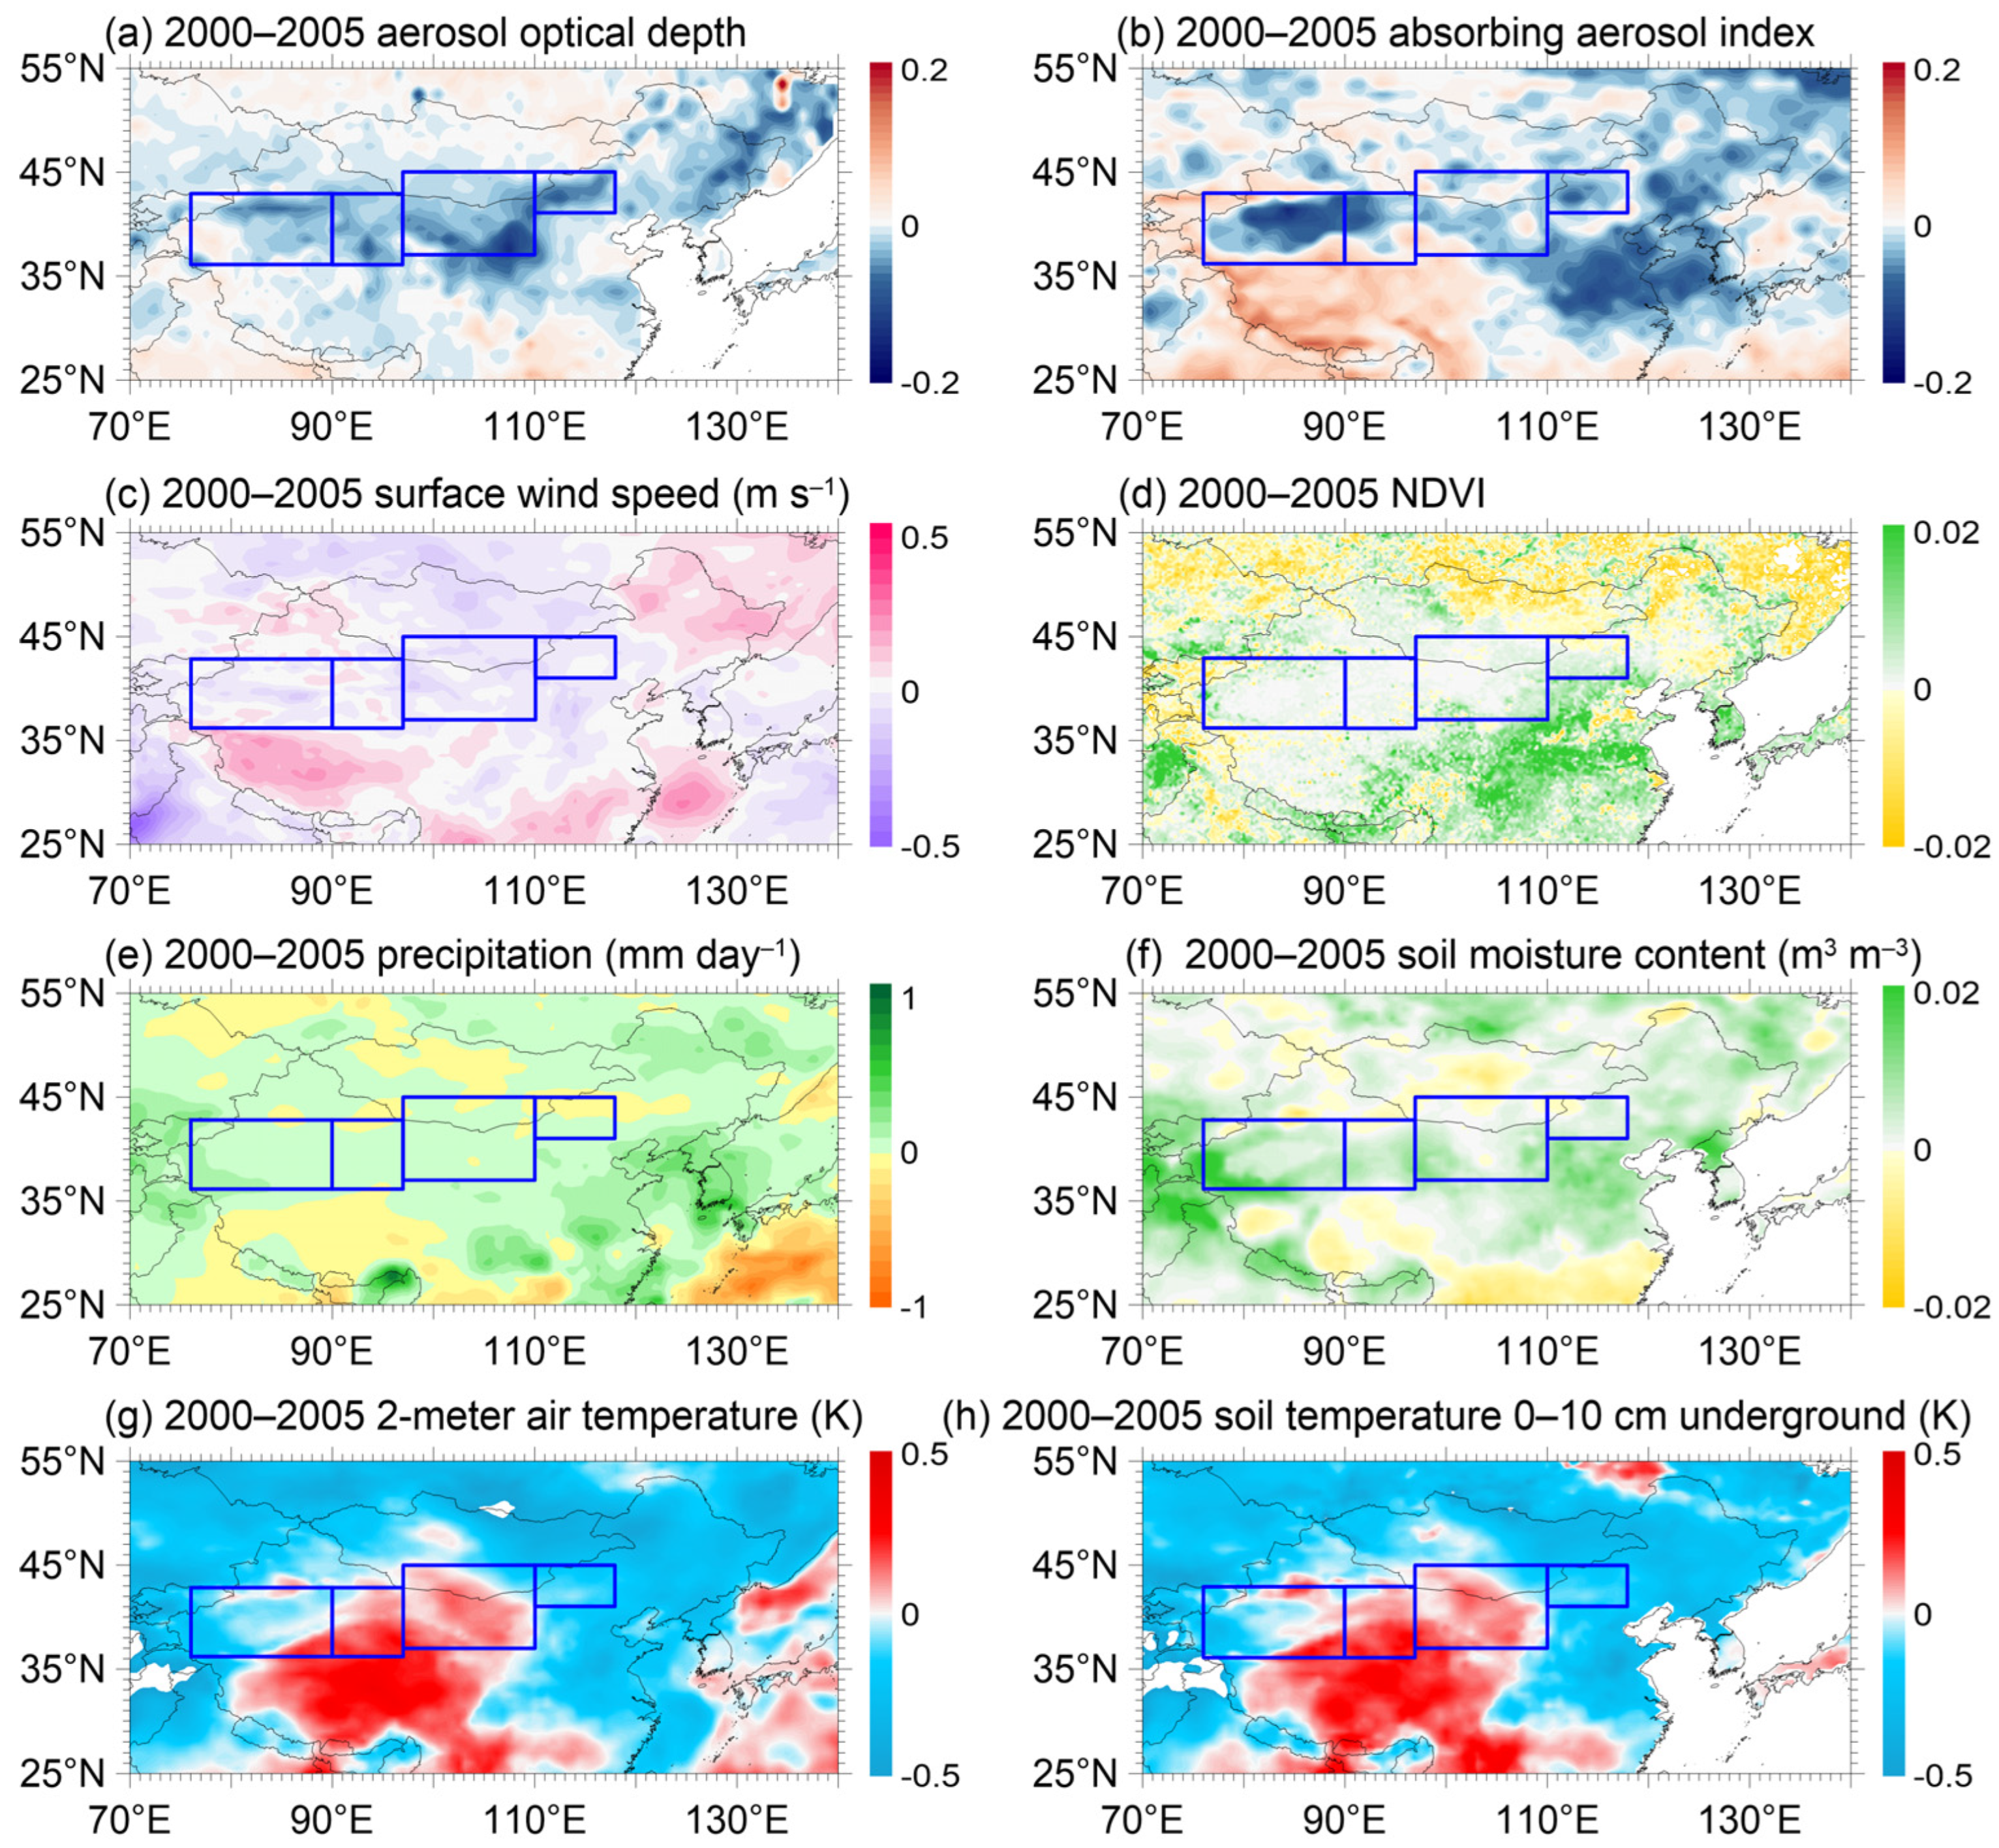
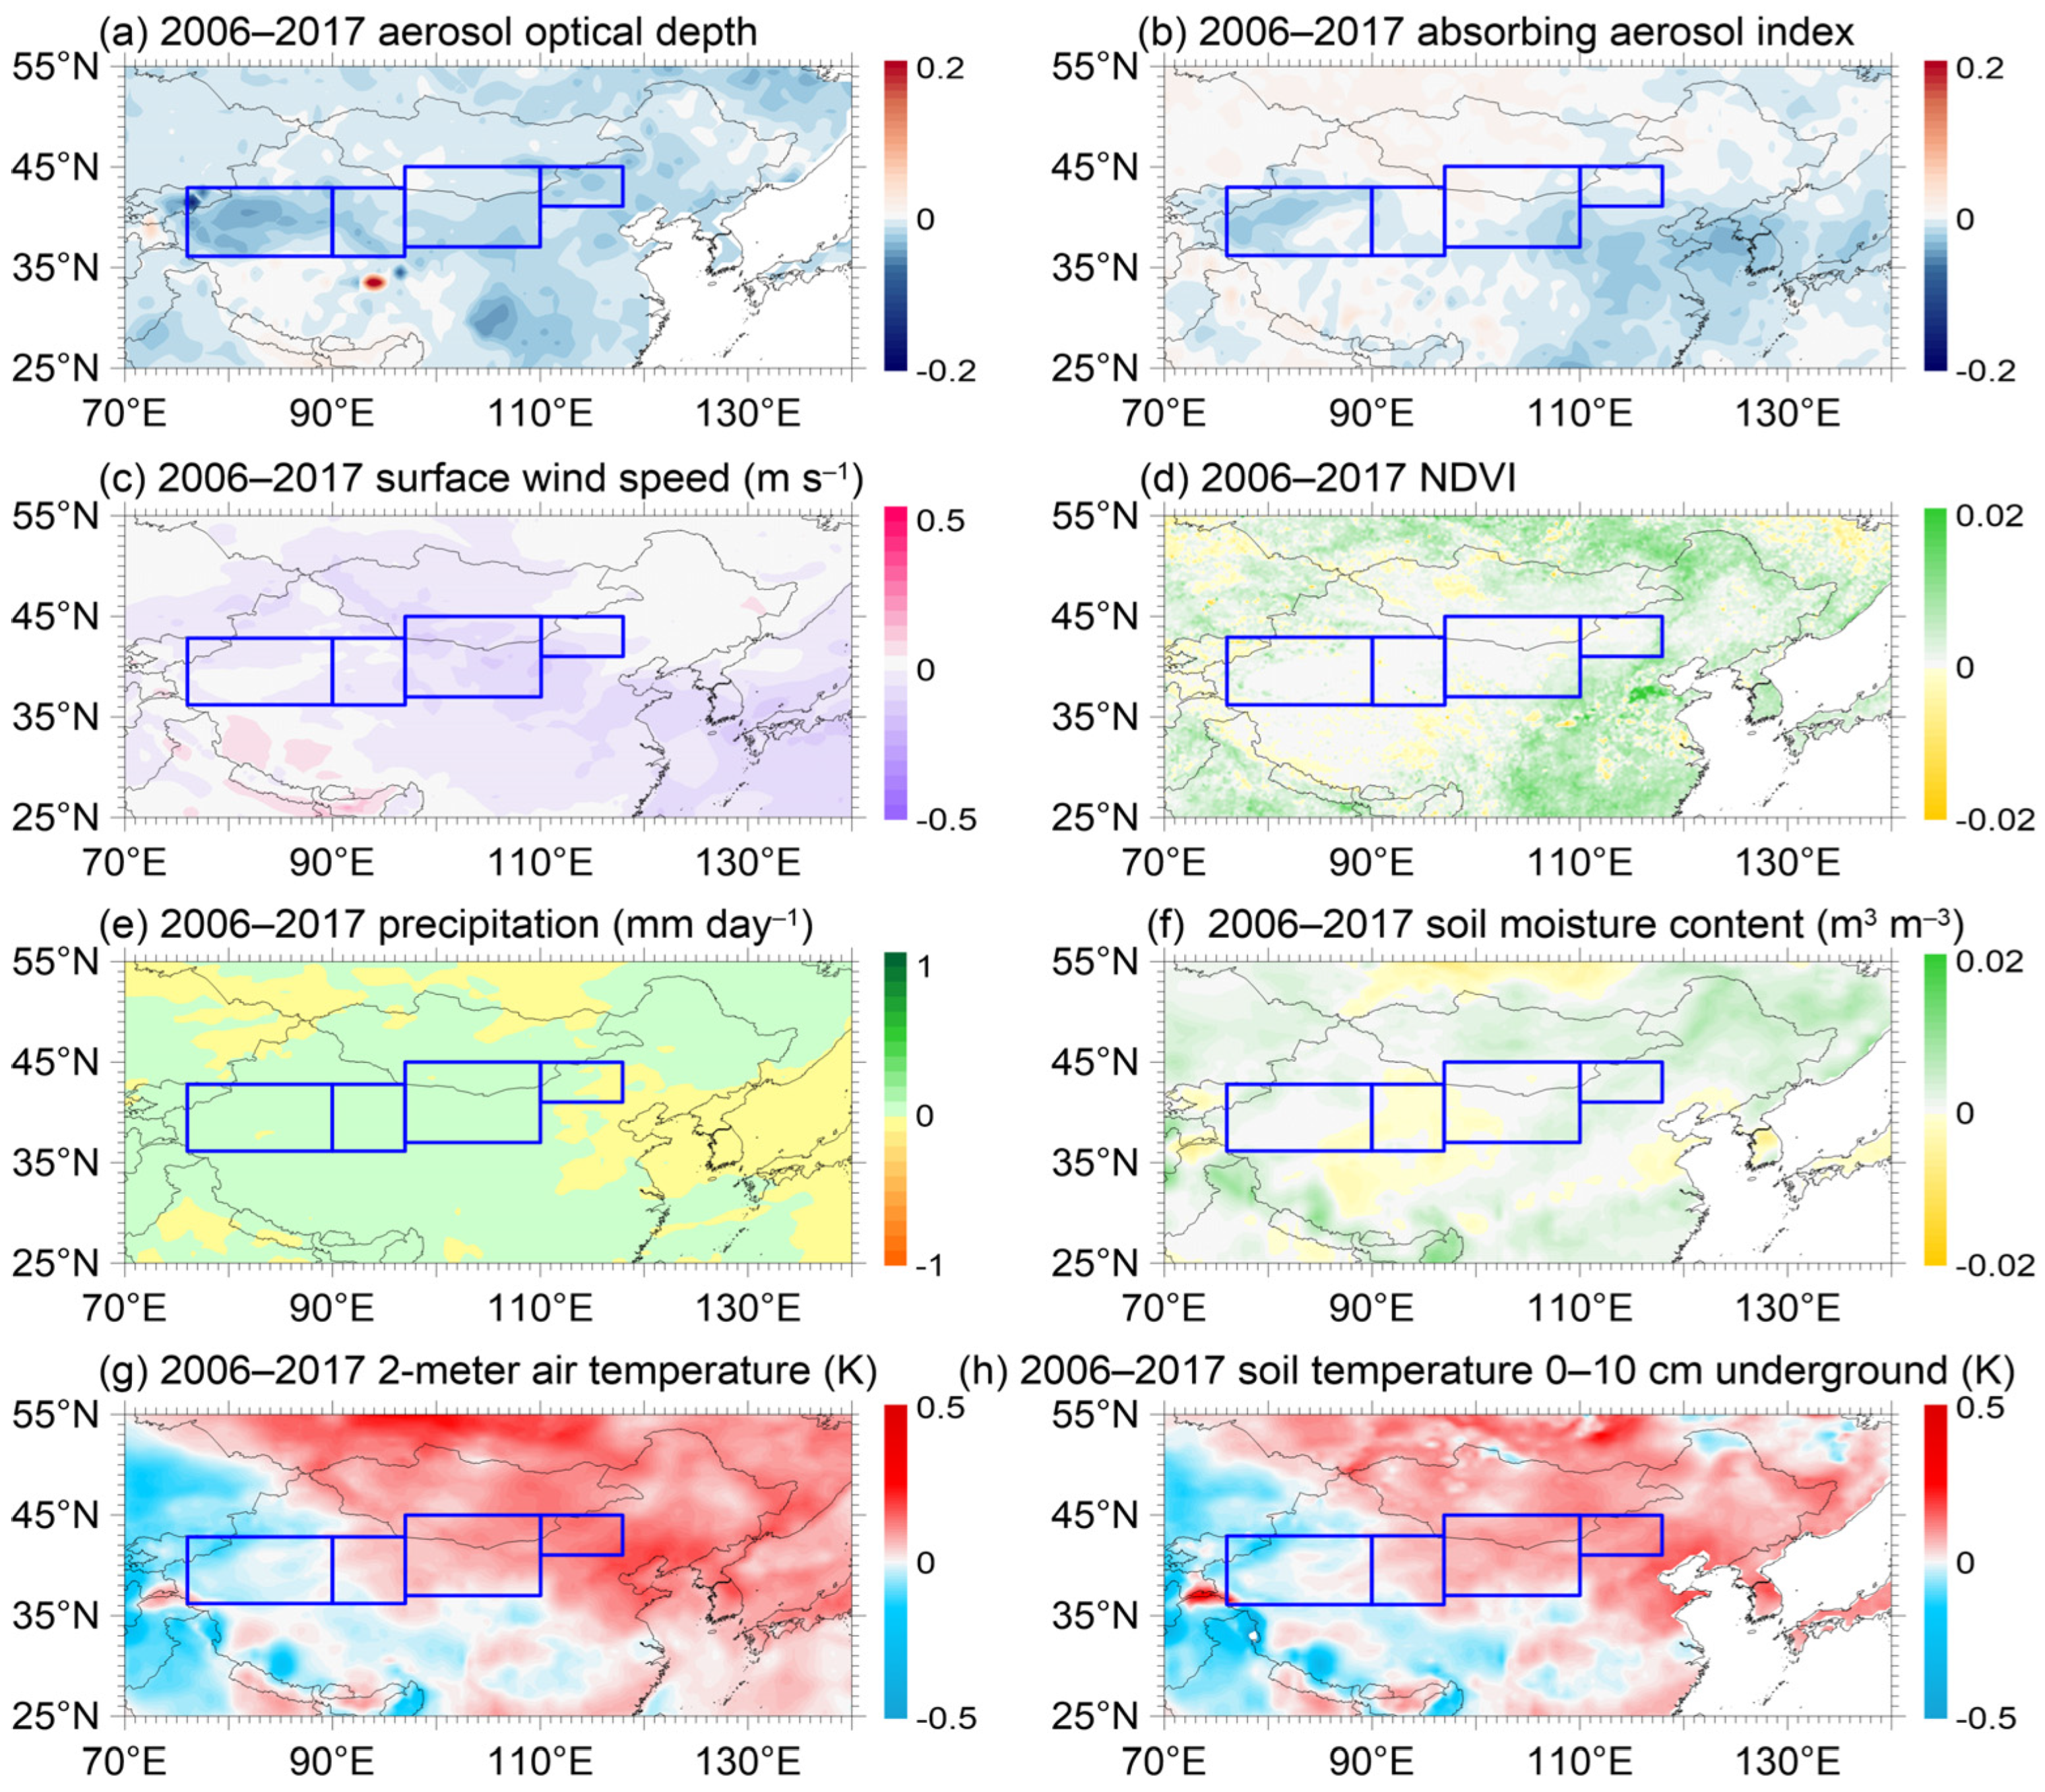
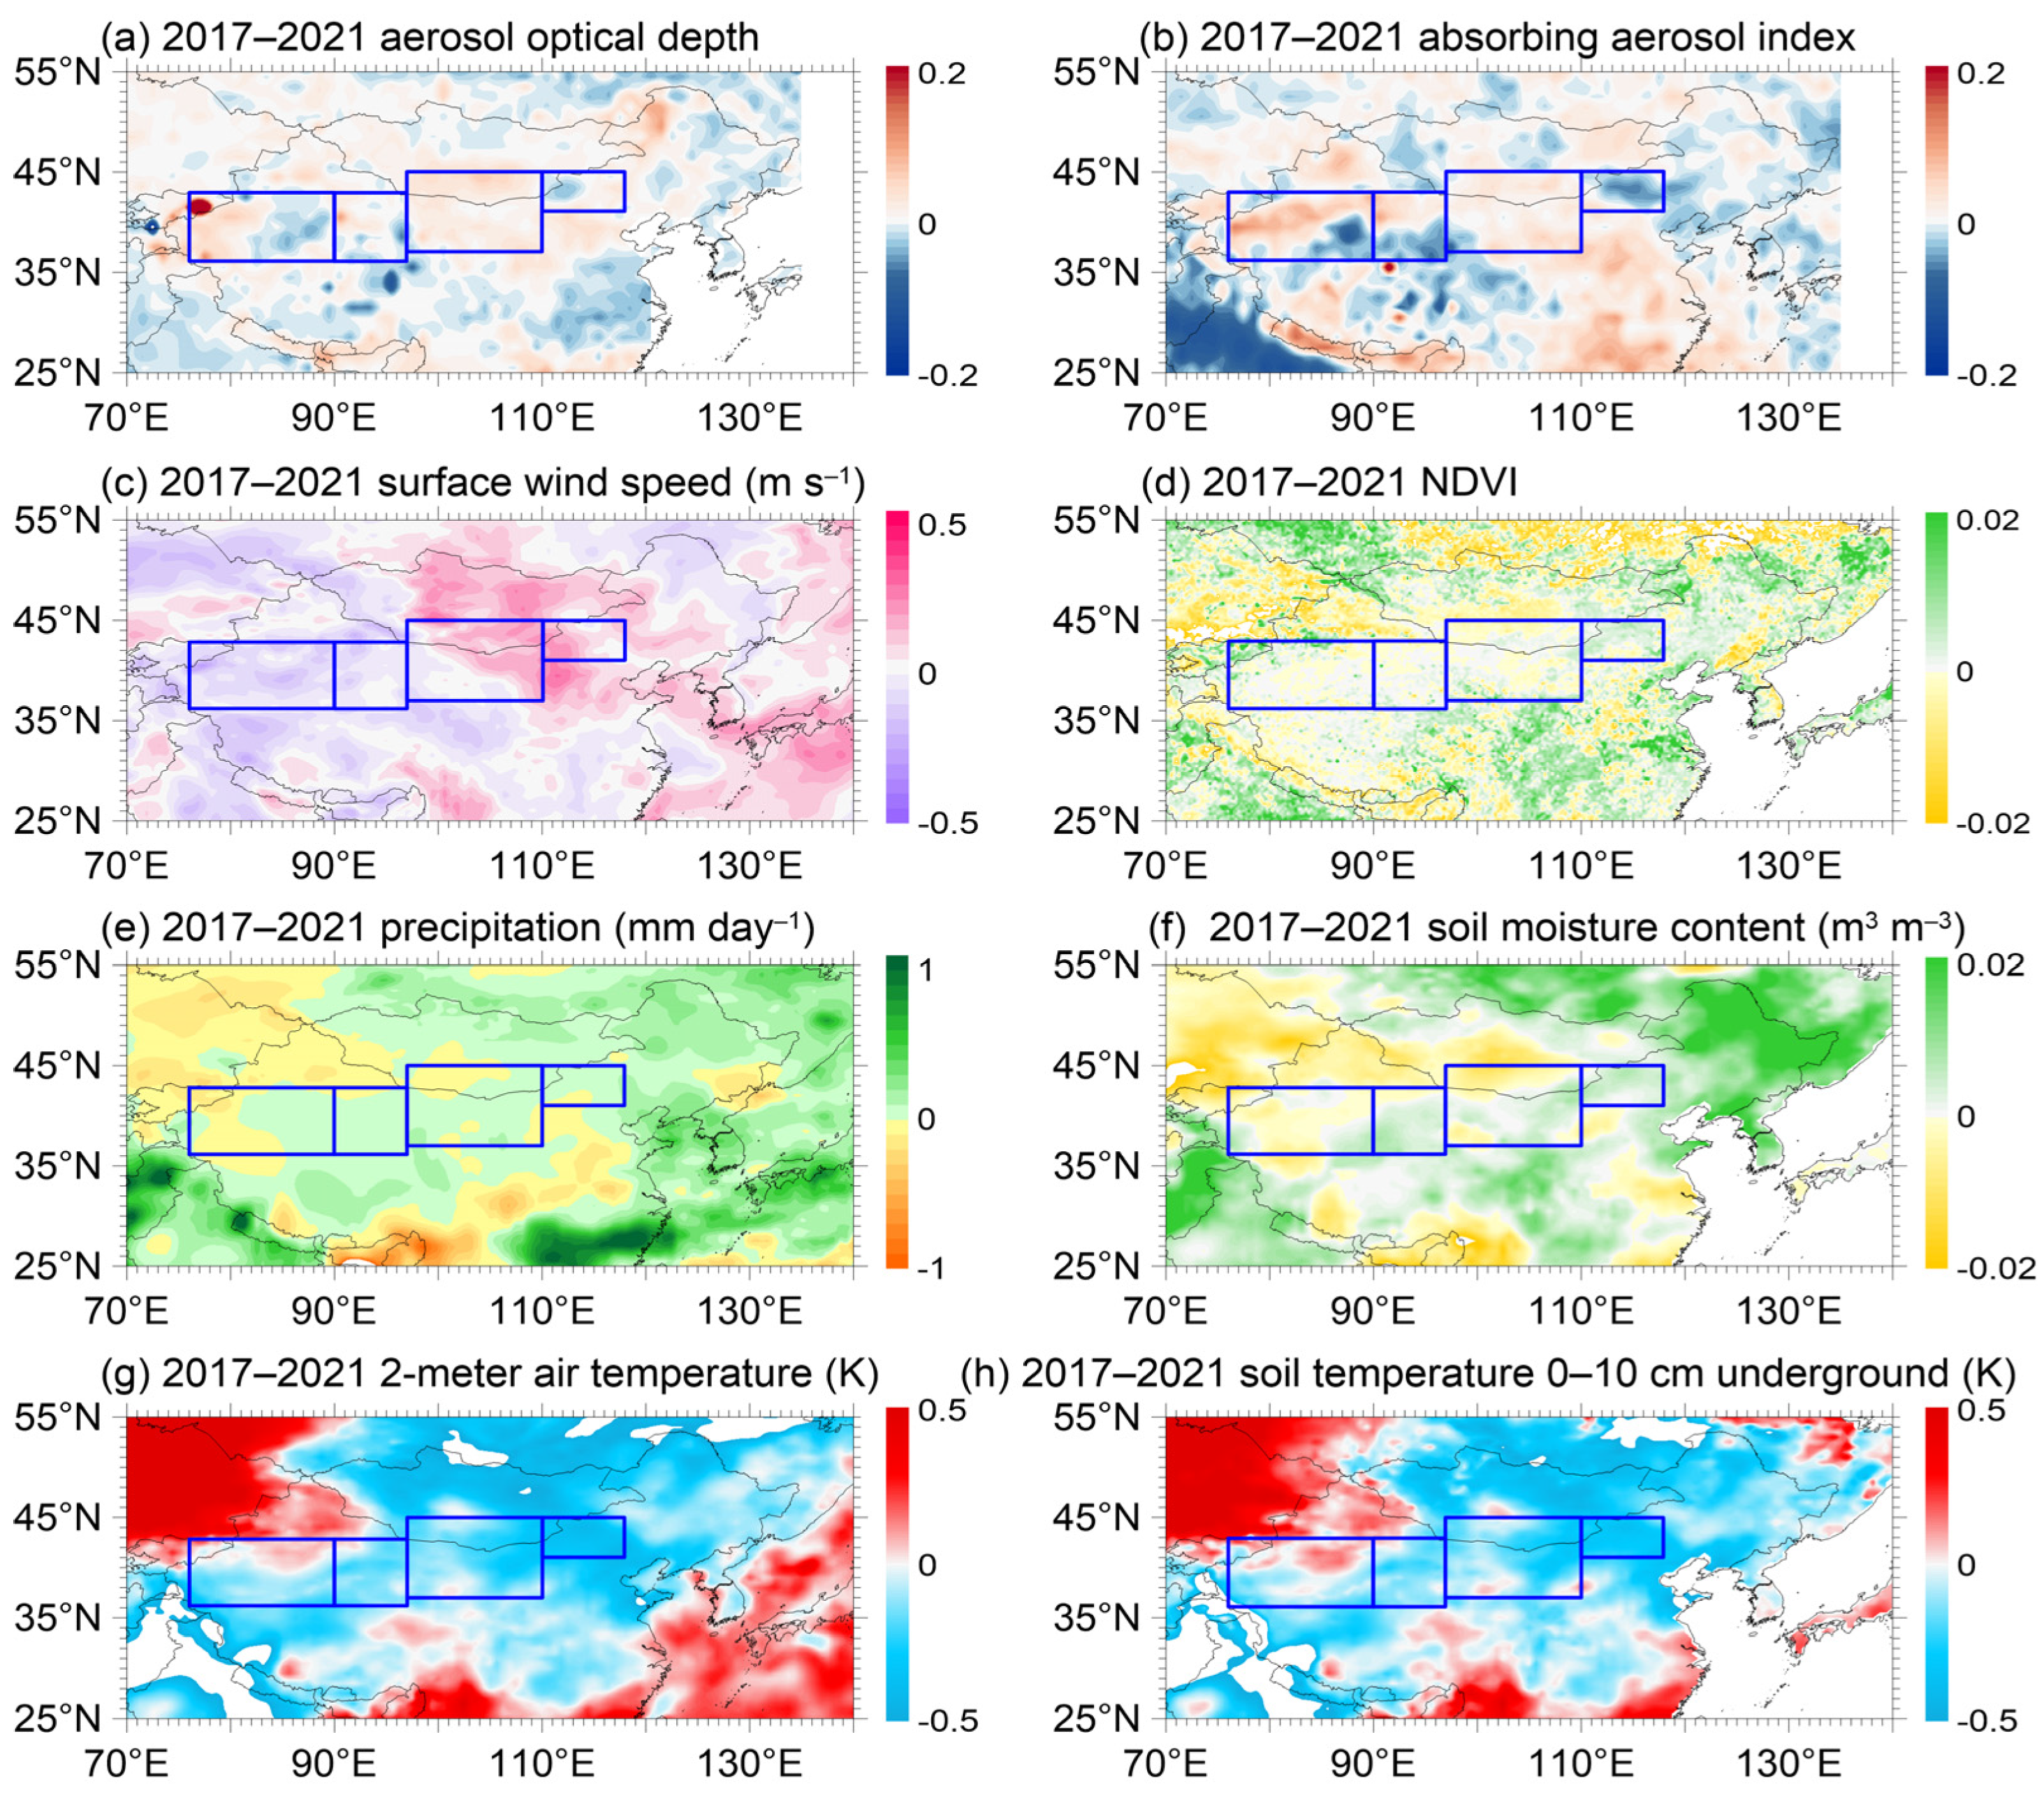
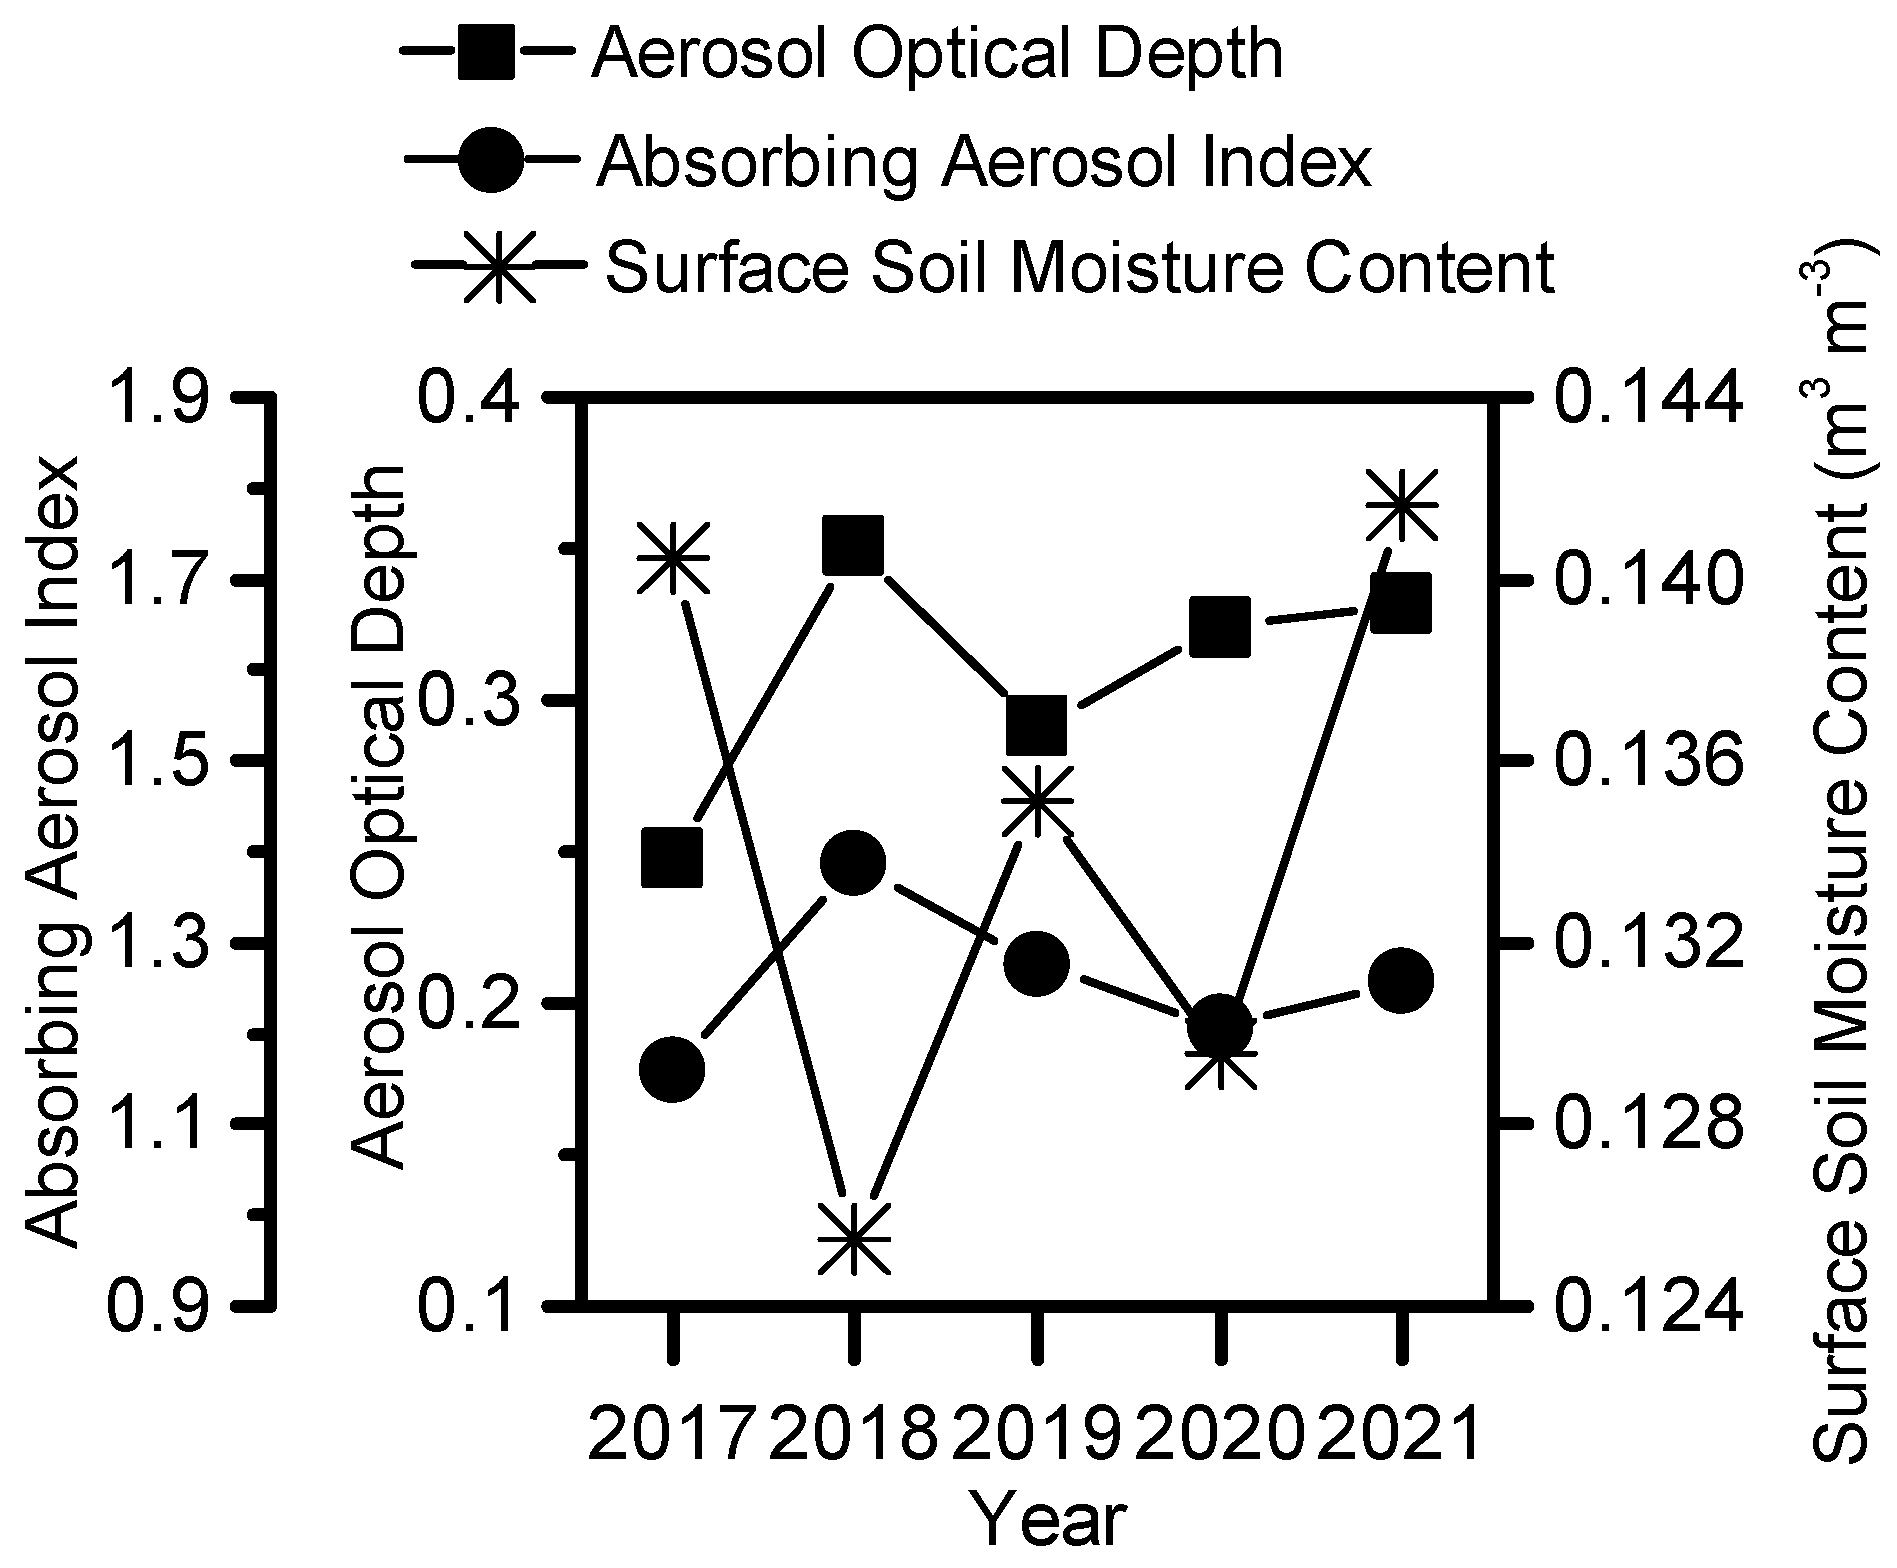
3.5. The Relationship between AOD or AAI and Surface Conditions

Due to the desert or sandy land surface, the East Asia main dust storm source region had a lower NDVI than the surrounding regions, and its NDVI was lower than 0.2 (Figure 6d). The annual mean NDVI in spring during the period 2000–2021 in the MDSR was 0.127 (Table 1). The NDVI was low in regions A (0.078) and B (0.059) and high in region D (0.176). The low NDVI supported the occurrence of dust storms. However, the spring NDVI increased during the three sub-periods and the whole period of 2000–2021. The largest increase was observed during the sub-periods of 2000–2005 and 2006–2017, and the annual mean variation in spring NDVI was 0.002 (1.575%) per year (Table 2). The significantly negative relationship between NDVI and DSF or AOD (Table 3) suggested that the increase in NDVI would weaken the occurrence of dust storms. The NDVI for 2017–2021 also increased but it was only half of that for the sub-periods of 2000–2005 and 2006–2017.
Most of the MDSR had quite low precipitation in spring, resulting in a very low surface soil moisture content and extremely low vegetation coverage. The mean daily precipitation in spring during the period 2000–2021 in western and northern China, and Mongolia was less than 0.5 mmday−1, which is much lower than the other parts of East Asia where the mean daily precipitation in spring is higher than 0.6 mmday−1 (Figure 6e). The mean daily precipitation in spring during the period 2000–2021 was 0.261, 0.142, 0.301, and 0.463 mmday−1 for regions A, B, C, and D, respectively, and the mean value for the four regions was 0.402 mmday−1. The annual mean variation in daily precipitation in the MDSR was 0.044 mmday−1 (10.945%), 0.005 mmday−1 (1.244%), 0.006 mmday−1 (1.493%), and 0.005 mmday−1 (1.244%) per year for the periods 2000–2005, 2006–2017, 2017–2021, and 2000–2021, respectively. The increase in daily precipitation may increase the surface soil moisture and hence, improve the vegetation coverage (Figure 7, Figure 8 and Figure 9).
The surface volumetric soil moisture content has a more direct influence on vegetation coverage than precipitation. The mean SFMC in spring during the period 2000–2021 in the MDSR was lower than 0.2 m3m−3 (Figure 6f), which results in the poor growth of vegetation. However, the annual mean variation in the SFMC in the MDSR increased during the period 2000–2021 (Table 2). The annual mean variation in the spring SFMC during the period 2000–2021 in the MDSR was 0.001 m3m−3 per year, which increased by 0.787% per year relative to the mean SFMC of 0.127 m3m−3. The annual mean variation in the SFMC in the MDSR also increased during the three sub-periods. The increase in SFMC may improve the growth of vegetation and result in lower emission of dust storms, and hence, the decrease in AOD and AAI over the MDSR. The annual mean variation in SFMC for the period 2000–2005 was five times higher than that for the periods 2006–2017 and 2000–2021, which supported that the decreases in AOD and AAI for the period 2000–2005 are higher than those during the periods of 2006–2017 and 2000–2021. The SFMC had an increased trend during 2017–2021. However, the low SFMC in 2018 and 2020 contributed to the increases in AOD and AAI in the same year (Figure 10). The significantly negative relationship between SFMC or precipitation and DSF or AOD or AAI (Table 3) suggested that low precipitation and SFMC would weaken the occurrence of dust storms.
The 2-m air temperature and the soil temperature 0–10 cm underground in the four dust storm source regions were higher than the surrounding regions due to their desert and semi-arid characteristics. The mean 2-m air temperature and soil temperature in spring during the period from 2000 to 2021, in most parts of the MDSR, were higher than 277 K. The mean spring 2-m air temperature in the MDSR varied from 265 K to 291 K (Figure 6g) and the soil temperature was slightly higher, which varied from 267 K to 292 K (Figure 6h). The mean spring 2-m air temperature and soil temperature 0–10 cm underground in regions A and C were higher than that in regions B and D due to the larger areas of desert, which was ascribed to the higher specific heat capacity for soil dust particles.
Increasing carbon dioxide concentrations and warming may cause both longer and warmer growing seasons and amplified photosynthesis, which causes plants to have the potential to ameliorate hydrological drought risks from warming by increasing soil moisture and stream flow [50,51,52]. The wetter land surface can reduce the incidence of dust storm events. Consequently, the 2-m air temperature, the soil temperature 0–10 cm underground, the NDVI, and the SFMC in the MDSR increased for the sub-periods 2000–2005 and 2006–2017, and the whole period during 2000–2021. Wetter soil and more vegetation coverage, plus the decrease in surface wind speed, caused weakened dust storms and decreases in AOD and AAI. This is supported by Zhu et al. (2008), who reported that global warming was considered as a reason for the obvious downward trend of dust storm frequency in northern China during 1954–2007. During the sub-period 2017–2021, the 2-m air temperature and soil temperature 0–10 cm underground decreased by –0.126 K (–0.045%) and–0.104 K (–0.037%) per year. Temperature had a negative relationship with DSF, AOD, and AAI in the MDSR (Table 3).

4. Conclusions

We investigated the variation in dust aerosols in the East Asian main dust source regions using satellite-observed AOD and AAI data. Firstly, we compared AOD and AAI with the ground-observed dust storm occurrence frequency, and the result showed that AOD and AAI have good, consistent spatial distributions and temporal variations with ground-observed dust storm occurrence frequency.
Then, the annual mean variations in AOD and AAI during the period 2000–2021 showed that AOD and AAI had the largest decrease for the sub-period of 2000–2005, the second largest decrease for the sub-period of 2006–2017, and the smallest decrease for the whole 22 years. However, AOD and AAI increased over the sub-period of 2017–2021.
Finally, the wind speed and surface conditions were considered as the two main reasons for the variations in AOD and AAI in the East Asian dust storm source regions. For the sub-periods 2000–2005 and 2006–2017, and the whole 22 years from 2000 to 2021, the increases in 2-m air temperature, soil temperature 0–10 cm underground, total surface precipitation, NDVI, and SFMC, together with the decrease in surface wind speed, resulted in the reduction of dust storm events, which caused decreases in AOD and AAI. However, during the sub-period of 2017–2021, the increase in surface wind speed and low SFMC induced more dust storm events and hence, the increase in AOD and AAI. An increase or decrease in dust storm events was the combined effect of all those climatic factors, including air temperature, soil temperature, precipitation, soil moisture, vegetation coverage, and surface wind speed.

Author Contributions

S.T. and G.S. conceived of and designed the study; H.C. and H.W. contributed the main ideas; S.T. was principally responsible for the writing of the manuscript and prepared the figures; B.C. revised the manuscript; and H.Y. performed the analyses. All authors have read and agreed to the published version of the manuscript.

Funding

This work was supported by the Ministry of Science and Technology of China (grant number 2016YFA0601901) and International Partnership Program of the Chinese Academy of Sciences (grant No. 134111KYSB20180021).

Institutional Review Board Statement

Not applicable.

Informed Consent Statement

Not applicable.

Data Availability Statement

The MODIS products and MERRA-2 re-analysis datasets. Available online: https://giovanni.gsfc.nasa.gov/ (accessed on 11 June 2021). The TOMS data. Available online: https://disc.gsfc.nasa.gov/datasets/TOMSEPL3daer_008/summary (accessed on 17 June 2021). The OMI data. Available online: https://disc.gsfc.nasa.gov/datasets/OMIAuraAER_1/summary (accessed on 17 June 2021). The dust storm data provided by the China Meteorological Administration. Available online: http://data.cma.cn/en (accessed on 8 April 2010).

Acknowledgments

All MODIS products and MERRA-2 re-analysis datasets were produced with the Giovanni online data system which is developed and maintained by the NASA Goddard Earth Sciences Data and Information Services Center (GES DISC) (https://giovanni.gsfc.nasa.gov/, accessed on 17 June 2021). The Global Land One-kilometer Base Elevation (GLOBE) data was provided by the National Oceanic and Atmospheric Administration, National Geophysical Data Center (http://www.ngdc.noaa.gov/mgg/topo/globe.html, accessed on 17 June 2021).

Conflicts of Interest

The authors declare no conflict of interest.

References

  1. Penner, J.E.; Andreae, M.; Annegarn, H.; Barrie, L.; Feichter, J.; Hegg, D.; Jayaraman, A.; Leaitch, R.; Murphy, D.; Nganga, J.; et al. Aerosols, their Direct and Indirect Effects. In Climate Change 2001: The Scientific Basis. Contribution of Working Group I to the Third Assessment Report of the Intergovernmental Panel on Climate Change; Houghton, J.T., Ding, Y., Griggs, D.J., Noguer, M., Linden, P.J.V.D., Dai, X., Maskell, K., Johnson, C.A., Eds.; Cambridge University Press: Cambridge, UK; New York, NY, USA, 2001; pp. 289–348. [Google Scholar]
  2. Shao, Y.; Wyrwoll, K.-H.; Chappell, A.; Huang, J.; Lin, Z.; McTainsh, G.H.; Mikami, M.; Tanaka, T.Y.; Wang, X.; Yoon, S. Dust cycle: An emerging core theme in Earth system science. Aeolian Res. 2011, 2, 181–204. [Google Scholar] [CrossRef]
  3. Zhang, X.Y.; Gong, S.-L.; Zhao, T.-L.; Arimoto, R. Sources of Asian dust and role of climate change versus desertification in Asian dust emission. Geophys. Res. Lett. 2003, 30, 2272. [Google Scholar] [CrossRef] [Green Version]
  4. Mikami, M.; Shi, G.Y.; Uno, I.; Yabuki, S.; Iwasaka, Y.; Yasui, M.; Aoki, T.; Tanaka, T.Y.; Kurosaki, Y.; Masuda, K.; et al. Aeolian dust experiment on climate impact: An overview of Japan-China joint project ADEC. Glob. Planet. Chang. 2006, 52, 142–172. [Google Scholar] [CrossRef]
  5. Zheng, Y.; Zhao, T.; Che, H.; Liu, Y.; Han, Y.; Liu, C.; Xiong, J.; Liu, J.; Zhou, Y. A 20-year simulated climatology of global dust aerosol deposition. Sci. Total Environ. 2016, 557, 861–868. [Google Scholar] [CrossRef]
  6. An, L.; Che, H.; Xue, M.; Zhang, T.; Wang, H.; Wang, Y.; Zhou, C.; Zhao, H.; Gui, K.; Zheng, Y.; et al. Temporal and spatial variations in sand and dust storm events in East Asia from 2007 to 2016: Relationships with surface conditions and climate change. Sci. Total Environ. 2018, 633, 452–462. [Google Scholar] [CrossRef]
  7. Yu, H.; Yang, Y.; Wang, H.; Tan, Q.; Chin, M.; Levy, R.C.; Remer, L.A.; Smith, S.J.; Yuan, T.; Shi, Y. Interannual variability and trends of combustion aerosol and dust in major continental outflows revealed by MODIS retrievals and CAM5 simulations during 2003–2017. Atmos. Chem. Phys. 2020, 20, 139–161. [Google Scholar] [CrossRef] [Green Version]
  8. Matsuki, A.; Iwasaka, Y.; Osada, K.; Matsunaga, K.; Kido, M.; Inomata, Y.; Trochkine, D.; Nishita, C.; Nezuka, T.; Sakai, T. Seasonal dependence of the long-range transport and vertical distribution of free tropospheric aerosols over east Asia: On the basis of aircraft and lidar measurements and isentropic trajectory analysis. J. Geophys. Res. 2003, 108, 8663–8676. [Google Scholar] [CrossRef]
  9. Sokolik, I.N.; Winker, D.M.; Bergametti, G.; Gillette, D.A.; Carmichael, G.; Kaufman, Y.J.; Gomes, L.; Schuetz, L.; Penner, J.E. Introduction to special section: Outstanding problems in quantifying the radiative impacts of mineral dust. J. Geophys. Res. 2001, 106, 18015–18027. [Google Scholar] [CrossRef]
  10. Wang, H.; Zhang, X.Y.; Gong, S.-L.; Chen, Y.; Shi, G.; Li, W. Radiative feedback of dust aerosols on the East Asian dust storms. J. Geophys. Res. 2010, 115, D23214. [Google Scholar] [CrossRef]
  11. Levin, Z.; Ganor, E.; Gladstein, V. The effects of desert particles coated with sulfate on rain formation in the eastern Mediterranean. J. Appl. Meteorol. 1996, 35, 1511–1523. [Google Scholar] [CrossRef] [Green Version]
  12. Yin, Y.; Chen, L. The effects of heating by transported dust layers on cloud and precipitation: A numerical study. Atmos. Chem. Phys. 2007, 7, 3497–3505. [Google Scholar] [CrossRef] [Green Version]
  13. Matsuki, A.; Schwarzenboeck, A.; Venzac, H.; Laj, P.; Crumeyrolle, S.; Gomes, L. Cloud processing of mineral dust: Direct comparison of cloud residual and clear sky particles during AMMA aircraft campaign in summer 2006. Atmos. Chem. Phys. 2010, 10, 1057–1069. [Google Scholar] [CrossRef] [Green Version]
  14. Jickells, T.D.; An, Z.S.; Andersen, K.K.; Baker, A.R.; Bergametti, G.; Brooks, N.; Cao, J.J.; Boyd, P.W.; Duce, R.A.; Hunter, K.A.; et al. Global iron connections between desert dust, ocean biogeochemistry, and climate. Science 2005, 308, 67–71. [Google Scholar] [CrossRef] [Green Version]
  15. Li, J.; Han, Z. Modeling Study of the Impact of Heterogeneous Reactions on Dust Surfaces on Aerosol Optical Depth and Direct Radiative Forcing over East Asia in Springtime. Atmos. Ocean. Sci. Lett. 2011, 4, 309–315. [Google Scholar]
  16. Li, J.; Wang, Z.; Zhuang, G.; Luo, G.; Sun, Y.; Wang, Q. Mixing of Asian mineral dust with anthropogenic pollutants over East Asia: A model case study of a super-duststorm in March 2010. Atmos. Chem. Phys. 2012, 12, 7591–7607. [Google Scholar] [CrossRef] [Green Version]
  17. Soleimani, Z.; Goudarzi, G.; Sorooshian, A.; Marzouni, M.B.; Maleki, H. Impact of Middle Eastern dust storms on indoor and outdoor composition of bioaerosol. Atmos. Environ. 2016, 138, 135–143. [Google Scholar] [CrossRef]
  18. Yuan, H.; Zhang, D.; Shi, Y.; Li, B.; Yang, J.; Yu, X.; Chen, N.; Kakikawa, M. Cell concentration, viability and culture composition of airborne bacteria during a dust event in Beijing. J. Environ. Sci. 2017, 55, 33–40. [Google Scholar] [CrossRef]
  19. Zhang, X.Y.; Arimoto, R.; An, Z.S. Dust emission from Chinese desert sources linked to variations in atmospheric circulation. J. Geophys. Res. 1997, 102, 28,041–28,047. [Google Scholar] [CrossRef]
  20. Tanaka, T.Y.; Chiba, M. A numerical study of the contributions of dust source regions to the global dust budget. Glob. Planet. Chang. 2006, 52, 88–104. [Google Scholar] [CrossRef]
  21. Yumimoto, K.; Takemura, T. Long-term inverse modeling of Asian dust: Interannual variations of its emission, transport, deposition, and radiative forcing. J. Geophys. Res. Atmos. 2015, 120, 1582–1607. [Google Scholar] [CrossRef]
  22. Zhou, Z.-J.; Zhang, G.-C. Typical severe dust storms in northern China during 1954–2002. Chin. Sci. Bull. 2003, 48, 2366–2370. [Google Scholar] [CrossRef]
  23. Wang, S.-G.; Wang, J.-Y.; Zhou, Z.-J.; Shang, K.-Z. Regional characteristics of three kinds of dust storm events in China. Atmos. Environ. 2005, 39, 509–520. [Google Scholar] [CrossRef]
  24. Qian, Z.-A.; Cai, Y.; Liu, J.-T.; Liu, C.-M.; Li, D.-L.; Song, M.-H. Some advances in dust storm research over China-Mongolia areas. Chin. J. Geophys. 2006, 49, 83–92. [Google Scholar] [CrossRef]
  25. Zhao, T.L.; Gong, S.L.; Zhang, X.Y.; Blanchet, J.-P.; McKendry, I.G.; Zhou, Z.J. A Simulated Climatology of Asian Dust Aerosol and Its Trans-Pacific Transport. Part I: Mean Climate and Validation. J. Clim. 2006, 19, 88–103. [Google Scholar] [CrossRef] [Green Version]
  26. Bian, H.; Tie, X.; Cao, J.; Ying, Z.; Han, S.; Xue, Y. Analysis of a Severe Dust Storm Event over China: Application of the WRF-Dust Model. Aerosol Air Qual. Res. 2011, 11, 419–428. [Google Scholar] [CrossRef] [Green Version]
  27. Wang, X.; Liu, J.; Che, H.; Ji, F.; Liu, J. Spatial and temporal evolution of natural and anthropogenic dust events over northern China. Sci. Rep. 2018, 8, 2141. [Google Scholar] [CrossRef]
  28. Huang, J.; Minnis, P.; Chen, B.; Huang, Z.; Liu, Z.; Zhao, Q.; Yi, Y.; Ayers, J.K. Long-range transport and vertical structure of Asian dust from CALIPSO and surface measurements during PACDEX. J. Geophys. Res. Atmos. 2008, 113. [Google Scholar] [CrossRef]
  29. Tan, S.-C.; Li, J.; Che, H.; Chen, B.; Wang, H. Transport of East Asian dust storms to the marginal seas of China and the southern North Pacific in spring 2010. Atmos. Environ. 2017, 148, 316–328. [Google Scholar] [CrossRef]
  30. Xie, Y.; Zhang, W.; Qu, J.J. Detection of Asian Dust Storm Using MODIS Measurements. Remote Sens. 2017, 9, 869. [Google Scholar] [CrossRef] [Green Version]
  31. Filonchyk, M.; Peterson, M. Development, progression, and impact on urban air quality of the dust storm in Asia in March 15–18, 2021. Urban Clim. 2022, 41, 101080. [Google Scholar] [CrossRef]
  32. Filonchyk, M. Characteristics of the severe March 2021 Gobi Desert dust storm and its impact on air pollution in China. Chemosphere 2022, 287, 132219. [Google Scholar] [CrossRef] [PubMed]
  33. Voss, K.K.; Evan, A.T. A New Satellite-Based Global Climatology of Dust Aerosol Optical Depth. J. Appl. Meteorol. Climatol. 2020, 59, 83–102. [Google Scholar] [CrossRef]
  34. Song, Q.; Zhang, Z.; Yu, H.; Ginoux, P.; Shen, J. Global dust optical depth climatology derived from CALIOP and MODIS aerosol retrievals on decadal timescales: Regional and interannual variability. Atmos. Chem. Phys. 2021, 21, 13369–13395. [Google Scholar] [CrossRef]
  35. Filonchyk, M.; Yan, H.; Zhang, Z.; Yang, S.; Li, W.; Li, Y. Combined use of satellite and surface observations to study aerosol optical depth in different regions of China. Sci. Rep. 2019, 9, 6174. [Google Scholar] [CrossRef]
  36. Han, Y.; Fang, X.; Kang, S.; Wang, H.; Kang, F. Shifts of dust source regions over central Asia and the Tibetan Plateau: Connections with the Arctic oscillation and the westerly jet. Atmos. Environ. 2008, 42, 2358–2368. [Google Scholar] [CrossRef]
  37. Li, D.-L.; Zhong, H.-L. The climatic formation cause and the future developing trend of sand-dust storm in China. China Environ. Sci. 2007, 27, 14–18. [Google Scholar]
  38. Yue, X.; Wang, H.; Liao, H.; Fan, K. Simulation of dust aerosol radiative feedback using the GMOD: 2. Dust-climate interactions. J. Geophys. Res. 2010, 115, D04201. [Google Scholar] [CrossRef]
  39. Zhu, C.; Wang, B.; Qian, W. Why do dust storms decrease in northern China concurrently with the recent global warming? Geophys. Res. Lett. 2008, 35, L18702. [Google Scholar] [CrossRef] [Green Version]
  40. Shao, Y.; Dong, C.H. A review on East Asian dust storm climate, modelling and monitoring. Glob. Planet. Chang. 2006, 52, 1–22. [Google Scholar] [CrossRef]
  41. Levy, R.C.; Mattoo, S.; Sawyer, V.; Shi, Y.; Colarco, P.R.; Lyapustin, A.I.; Wang, Y.; Remer, L.A. Exploring systematic offsets between aerosol products from the two MODIS sensors. Atmos. Meas. Tech. 2018, 11, 4073–4092. [Google Scholar] [CrossRef] [Green Version]
  42. Hsu, S.-C.; Tsai, F.; Lin, F.-J.; Chen, W.-N.; Shiah, F.-K.; Huang, J.-C.; Chan, C.-Y.; Chen, C.-C.; Liu, T.-H.; Chen, H.-Y.; et al. A super Asian dust storm over the East and South China Seas: Disproportionate dust deposition. J. Geophys. Res. Atmos. 2013, 118, 7169–7181. [Google Scholar] [CrossRef]
  43. Hsu, N.C.; Jeong, M.-J.; Bettenhausen, C.; Sayer, A.M.; Hansell, R.; Seftor, C.S.; Huang, J.; Tsay, S.-C. Enhanced Deep Blue aerosol retrieval algorithm: The second generation. J. Geophys. Res. Atmos. 2013, 118, 9296–9315. [Google Scholar] [CrossRef]
  44. Torres, O.; Tanskanen, A.; Veihelmann, B.; Ahn, C.; Braak, R.; Bhartia, P.K.; Veefkind, P.; Levelt, P. Aerosols and surface UV products from Ozone Monitoring Instrument observations: An overview. J. Geophys. Res. 2007, 112, D24S47. [Google Scholar] [CrossRef] [Green Version]
  45. Huete, A.; Justice, C.; Leeuwen, W.V. MODIS Vegetation Index (MOD 13) Algorithm Theoretical Basis Document. 1999. Available online: http://modis.gsfc.nasa.gov/data/atbd/atbd_mod13.pdf (accessed on 2 June 2021).
  46. Didan, K. MOD13C2 MODIS/Terra Vegetation Indices Monthly L3 Global 0.05Deg CMG V006 [Data Set]. NASA EOSDIS Land Processes DAAC. 2015. Available online: https://ladsweb.modaps.eosdis.nasa.gov/missions-and-measurements/products/MOD13C2 (accessed on 2 June 2021).
  47. Gelaro, R.; McCarty, W.; Suárez, M.J.; Todling, R.; Molod, A.; Takacs, L.; Randles, C.A.; Darmenov, A.; Bosilovich, M.G.; Reichle, R.; et al. The Modern-Era Retrospective Analysis for Research and Applications, Version 2 (MERRA-2). J. Clim. 2017, 30, 5419–5454. [Google Scholar] [CrossRef]
  48. Iwasaka, Y.; Shibata, T.; Nagatani, T.; Shi, G.Y.; Kim, Y.S.; Matsuki, A.; Trochkine, D.; Zhang, D.; Yamada, M.; Nagatani, M.; et al. Large depolarization ratio of free tropospheric aerosols over the Taklamakan Desert revealed by lidar measurements: Possible diffusion and transport of dust particles. J. Geophys. Res. 2003, 108, 8652. [Google Scholar] [CrossRef]
  49. Sun, J.; Zhang, M.; Liu, T. Spatial and temporal characteristics of dust storms in China and its surrounding regions, 1960–1999: Relations to source area and climate. J. Geophys. Res. 2001, 106, 10325–10333. [Google Scholar] [CrossRef]
  50. Mankin, J.S.; Seager, R.; Smerdon, J.E.; Cook, B.I.; Williams, A.P. Mid-latitude freshwater availability reduced by projected vegetation responses to climate change. Nat. Geosci. 2019, 12, 983–988. [Google Scholar] [CrossRef]
  51. Field, C.B.; Jackson, R.B.; Mooney, H.A. Stomatal responses to increased CO2: Implications from the plant to the global scale. Plant Cell Environ. 1995, 18, 1214–1225. [Google Scholar] [CrossRef]
  52. Idso, S.B.; Brazel, A.J. Rising atmospheric carbon dioxide concentrations may increase streamflow. Nature 1984, 312, 51–53. [Google Scholar] [CrossRef]
Figure 1. The 753 meteorological stations (cross mark) in China. Rectangles A–D are the main East Asian dust storm source regions. A: the Taklimakan Desert (76–90° E, 36–43° N) in the Tarim Basin, B: the southeastern Xinjiang, western Gansu, and northern Qinghai provinces containing the desert in Tsaidam Basin and the Kumutage Desert (90–97° E, 36–43° N), C: southern Mongolia and western Inner Mongolia located in the Gobi Desert (97–110° E, 37–45° N), and D: the Hunshandake (or OnqinDaga) sandy land (110–118° E, 41–45° N).
Atmosphere 13 00992 g001
Figure 2. (a) Annual mean dust storm occurrence frequency (DSF, days year−1) during 1954–2007. (b) Monthly climatology DSF (days month−1, black circles) and daily average wind speed (m s−1, black squares) during 1954–2007 and their standard deviation values (error bars). Numbers 1–12 in (a) shows the stations of 1 Minfeng, 2 Minqin, 3 Hotan, 4 Keping, 5 Guaizihu, 6 Pishan, 7 Qiemo, 8 Yanchi, 9 Dingxin, 10 Andehe, 11 Anxi, and 12 Zhurihe (or Jurh), respectively. Rectangles A–D are the main East Asian dust storm source regions shown in Figure 1.
Atmosphere 13 00992 g002
Figure 3. Monthly mean dust storm occurrence frequency (DSF, daysmonth−1), aerosol optical depth (AOD), TOMS absorbing aerosol index (AAI), and OMI AAI over the main dust storm source regions.
Atmosphere 13 00992 g003
Figure 4. Annual mean of dust storm occurrence frequency (days year−1) during (a) 2000–2007, (c) 2000–2005, and (e) 2005–2007. Annual mean of (b) aerosol optical depth, (d) TOMS aerosol index, and (f) OMI aerosol index. Rectangles are the main East Asian dust storm source regions shown in Figure 1.
Atmosphere 13 00992 g004
Figure 5. Annual mean (a) aerosol optical depth and (b) aerosol index over the four dust storm source regions A–D shown in Figure 1, in spring, during the period from 2000 to 2021. Vertical dashed lines are at 2005 and 2017.
Atmosphere 13 00992 g005
Figure 6. Annual mean (a) AOD, (b) AAI, (c) surface wind speed (ms−1), (d) NDVI, (e) precipitation (mm day−1), (f) surface soil moisture content (SFMC, m3 m−3), (g) 2-m air temperature (K), and (h) soil temperature 0–10 cm underground (K) in spring during 2000–2021. Rectangles are the main East Asian dust storm source regions shown in Figure 1.
Atmosphere 13 00992 g006
Figure 7. Annual mean variation in (a) AOD, (b) AAI, (c) surface wind speed (ms−1), (d) NDVI, (e) precipitation (mmday−1), (f) surface soil moisture content (SFMC, m3m−3), (g) 2-m air temperature (K), and (h) soil temperature 0–10 cm underground (K) in spring during 2000–2005. Rectangles are the main East Asian dust storm source regions shown in Figure 1.
Atmosphere 13 00992 g007
Figure 8. Annual mean variation in (a) AOD, (b) AAI, (c) surface wind speed (ms−1), (d) NDVI, (e) precipitation (mmday−1), (f) surface soil moisture content (SFMC, m3m−3), (g) 2-m air temperature (K), and (h) soil temperature 0–10 cm underground (K) in spring during 2006–2017. Rectangles are the main East Asian dust storm source regions shown in Figure 1.
Atmosphere 13 00992 g008
Figure 9. Annual mean variation in (a) AOD, (b) AAI, (c) surface wind speed (ms−1), (d) NDVI, (e) precipitation (mmday−1), (f) surface soil moisture content (SFMC, m3m−3), (g) 2-m air temperature (K), and (h) soil temperature 0–10 cm underground (K) in spring during 2017–2021, for dust storm source regions C and D. The AOD in region B and AAI in region A and B is for 2017–2020. Rectangles are the main East Asian dust storm source regions shown in Figure 1.
Atmosphere 13 00992 g009
Figure 10. Annual mean aerosol optical depth, absorbing aerosol index, and surface soil moisture content (m3m−3) in the MDSR in spring during 2017–2021.
Atmosphere 13 00992 g010
Table 1. The annual mean dust storm occurrence frequency (DSF, daysyear−1) in spring during 2000–2005, and annual mean values of aerosol optical depth (AOD), absorbing aerosol index (AAI), and the climatic factors, including surface wind speed, NDVI, surface soil moisture content (SFMC), precipitation, 2-m air temperature (T2m), and soil temperature 0–10 cm underground (TSoil1), in spring during 2000–2021, over the four dust storm source regions, A, B, C, and D shown in Figure 1. MDSR is the abbreviation for main dust storm source regions. The numbers in parentheses are standard deviations.
Source RegionsDSF (daysyear−1)AODAAIWind (ms−1)NDVISFMC (m3m−3)Precipitation (mmday−1)T2m (K)TSoil1 (K)
A2.616 (1.123)0.573 (0.245)1.541 (0.485)5.366 (0.929)0.078 (0.064)0.100 (0.064)0.261 (0.269)281.179 (8.578)281.897 (7.745)
B2.367 (1.285)0.346 (0.103)1.322 (0.255)6.264 (0.589)0.059 (0.021)0.092 (0.030)0.142 (0.081)279.410 (6.962)280.231 (6.383)
C2.500 (1.358)0.279 (0.061)1.147 (0.144)6.928 (0.783)0.100 (0.045)0.111 (0.043)0.301 (0.192)280.682 (3.964)280.855 (3.666)
D4.167 (3.193)0.229 (0.076)1.190 (0.086)7.987 (0.654)0.176 (0.069)0.146 (0.027)0.463 (0.161)278.546 (1.401)278.231 (1.263)
MDSR1.695 (0.877)0.365 (0.205)1.264 (0.335)6.296 (1.165)0.127 (0.102)0.127 (0.060)0.402 (0.332)280.939 (5.934)281.228 (5.466)
Table 2. The annual mean variation ratios of dust storm occurrence frequency (DSF, daysyear−1), aerosol optical depth (AOD), absorbing aerosol index (AAI), and the climatic factors, including surface wind speed, NDVI, surface soil moisture content (SFMC), precipitation, 2-m air temperature (T2m), and soil temperature 0–10 cm underground (TSoil1), in spring during different time periods over the four dust storm source regions, A, B, C, and D shown in Figure 1. MDSR is the abbreviation for main dust storm source regions.
YearSource RegionsDSF (daysyear−1)AODAAIWind (ms−1)NDVISFMC (m3m−3)Precipitation (mmday−1)T2m (K)TSoil1 (K)
2000–2005A−9.284%−2.618%−1.168%0.112%1.282%7.000%23.372%−0.015%−0.010%
B−23.616%−7.803%−0.681%0.176%1.695%4.348%18.310%0.044%0.048%
C−31.320%−13.262%−0.959%−0.361%2.000%.604%8.638%0.022%0.020%
D−20.998%−14.847%−1.849%−0.238%1.136%2.055%1.728%−0.043%−0.046%
MDSR−30.796%−6.575%−1.028%−0.095%1.575%3.937%10.945%0.006%0.007%
2006–2017A −4.188%−0.584%−0.056%1.282%1.000%4.598%−0.007%−0.005%
B −3.757%−0.076%−0.287%0.678%−0.326%0.141%0.011%0.014%
C −3.943%−0.087%−0.895%1.000%0.901%2.658%0.025%0.025%
D −6.987%−0.168%−0.351%1.136%1.370%−0.648%0.046%0.037%
MDSR −4.110%−0.396%−0.524%1.575%0.787%1.244%0.014%0.014%
2017–2021A 2.792%1.298%
(2017–2020)
−1.155%1.282%−4.000%−1.916%−0.026%−0.016%
B 1.734%
(2017–2020)
0.076%
(2017–2020)
−0.527%−0.678%3.261%28.169%−0.044%−0.041%
C 8.961%1.744%1.111%1.000%0.901%6.645%−0.057%−0.051%
D 2.620%−1.176%1.452%1.136%2.740%7.559%−0.123%−0.106%
MDSR 4.110%0.158%0.334%0.787%0.787%1.493%−0.045%−0.037%
2000–2021A −0.873%−0.130%−0.019%1.282%1.000%1.533%0.005%0.002%
B −1.445%−0.303%−0.160%0.678%0.435%1.408%0.014%0.014%
C −2.151%−0.174%−0.332%1.000%0.901%1.661%0.020%0.018%
D −3.057%0.168%−0.175%0.568%0.685%0.432%0.023%0.020%
MDSR −1.370%−0.237%−0.206%0.787%0.787%1.244%0.013%0.011%
Table 3. The correlation coefficients between dust storm occurrence frequency (DSF, daysyear−1), aerosol optical depth (AOD), absorbing aerosol index (AAI), and its climatic factors in spring during 2000–2021 over the main dust storm source regions. The numbers with a superscript asterisk have a significance level of 0.05.
DSF, AOD, and AAISurface Wind Speed (ms−1)NDVISurface Soil Moisture Content (m3m−3)Precipitation (mmday−1)2-m Air Temperature (K)Soil Temperature 0–10 cm Underground (K)
DSF 2000–20070.70 *−0.78 *−0.50 *−0.16−0.02−0.02
TOMS AAI 2000–20050.260.20−0.060.21−0.30−0.25
OMI AAI 2005–20210.29 *−0.11−0.29 *−0.26−0.03−0.05
AOD 2000–20210.43 *−0.43 *−0.20−0.27 *−0.29 *−0.28 *
Publisher’s Note: MDPI stays neutral with regard to jurisdictional claims in published maps and institutional affiliations.

