Article

Chemical Characteristics of Water-Soluble Inorganic Ions in Different Types of Asian Dust in Wajima, a Background Site in Japan

1
Graduate School of Medical Sciences, Kanazawa University, Kakuma-Machi, Kanazawa 920-1192, Japan
2
School of Civil Engineering, Architecture and Environment, Hubei University of Technology, Wuhan 430068, China
3
Institute of Nature and Environmental Technology, Kanazawa University, Kakuma-Machi, Kanazawa 920-1192, Japan
4
Collaborative Innovation Center on Forecast and Evaluation of Meteorological Disasters, Nanjing University of Information Science and Technology, Nanjing 210044, China
5
Key Laboratory of Cloud-Precipitation Physics and Severe Storms, Institute of Atmospheric Physics, Chinese Academy of Sciences, Beijing 100029, China
6
Institute of Carbon Neutrality, Qilu Zhongke, Jinan 250100, China
7
Institute of Medical, Pharmaceutical and Health Sciences, Kanazawa University, Kakuma-Machi, Kanazawa 920-1192, Japan
*
Author to whom correspondence should be addressed.
Atmosphere 2022, 13(8), 1210; https://doi.org/10.3390/atmos13081210
Submission received: 20 July 2022 / Revised: 27 July 2022 / Accepted: 28 July 2022 / Published: 1 August 2022

Abstract

:
Two Asian dust (AD) events were observed in March 2021 (AD1: 16 March 2021 00:00 UTC~17 March 2021 12:00 UTC and AD2: 28 March 2021 00:00 UTC~31 March 2021 12:00 UTC). To determine the chemical characteristics of water-soluble inorganic ions (WSIIs) in different types of Asian dust, the total suspended particulates (TSP) were collected at Kanazawa University Wajima Air Monitoring Station (KUWAMS), a background site in Japan from 27 February to 4 March, 2021. Based on the lidar observations and the backwards trajectory analysis results, AD events were divided into two types: ADN (aerosols were mainly mineral dust) and ADP (aerosols were mixtures of spherical particles). During ADs, the concentrations of the TSP and WSII increased, with the highest TSP concentration in ADN (38.6 μg/m3) and the highest WSII concentration in ADP (5.82 μg/m3). The increase in (cations)/(anions) during AD indicates that the input of AD aerosol buffered the aerosol acidity. Additionally, a significant increase in Cl depletion, along with ADN events, was found (Cl depletion = 73.8%). To comprehensively analyse the different types of ADs on WSIIs, we refer to the previous data from 2010 to 2015 at KUWAMS. As a result, the increased Cl depletion was caused by the heterogeneous reaction of HNO3 with sea salt when the air mass passed over the Japanese Sea. Additionally, the chemical form of SO42− was highly dependent on the source and pathway, while SO42− mainly came from natural soil dust in ADN and from anthropogenic emissions in ADP. The enhancement of secondary NO3 was observed in AD via the heterogeneous hydrolysis of N2O5.

1. Introduction

Mineral dust plays a nonnegligible role in increasing global and regional aerosol loading [1,2,3]. According to the Intergovernmental Panel on Climate Change, the global quantity of dust released into the atmosphere is estimated to be approximately 2150 Tg/y, accounting for approximately 40% of the annual emissions of global aerosols from desert areas, such as the Gobi Desert, Taklimakan Desert, Tengger Desert, Loess Plateau, etc. [4,5,6,7,8]. During the East Asian monsoon period (from November to May of the following year), due to the relatively dry surface of the desert area, increased frontal systems and the Mongolian cyclonic depression, large quantities of Asian dust (AD) particles are able to enter the atmosphere from desert areas and then undergo long-range transport to influence the atmospheric environment and health risk in downwind areas (such as China, the Korean peninsula, Japan and even the Pacific region) [9,10,11,12,13,14,15,16]. During long-range transportation, AD particles will mix with different kinds of aerosols, including natural aerosols and anthropogenic aerosols from passing regions, increasing the input both in natural particle aerosols and anthropogenic pollutant aerosols downwind to further change the composition and properties of atmospheric aerosols [17]. However, because the meteorological factors in each AD event are not consistent, the aerosol mixture type in AD outflows varies, which suggests that assuming that all AD events have a similar influence on downwind aerosols is not accurate [18,19,20].
Water-soluble inorganic ions (WSIIs) are a major component of atmospheric aerosols, accounting for approximately 30% of the mass in total suspended particulates (TSPs). WSIIs consist of primary WSIIs from natural sources or combustion and secondary WSIIs that are generated from chemical reactions of precursor gases and are regarded as reducing atmospheric visibility, influencing aerosol acidity and contributing secondary aerosols [21,22,23,24,25]. In East Asia, the concentration level of WSIIs is significantly high due to the huge consumption of coal, fossil fuels and biomass, especially in mainland China [26,27]. Through observations at a remote background station in Japan (Kanazawa University Wajima Air Monitoring Station (KUWAMS)), our previous studies have proven that WSIIs from the East Asian continent can be long-range transported during the East Asian monsoon period and impact aerosol characteristics in Japan [28,29].
The role of AD on the WSII characteristic variations has been reported in previous studies in which AD can change the concentration and composition of WSIIs to further influence the aerosol acidity [30,31,32]. Additionally, a report indicated that natural AD particles can accelerate the secondary formation of WSIIs [33]. According to the Japan Meteorological Agency, AD events have become more frequent and have affected Japan more widely since the 20th century, which makes atmospheric aerosols in Japan during AD more urgent to study [34]. Therefore, a comprehensive description of different types of AD on WSII characteristic variations will play an important role in understanding the impact of AD on the downwind environment.
In this study, we observed two AD events at KUWAMS in 2021 and referred to the data from 2010 to 2015 to evaluate the influence of AD on aerosol characteristics and acidity variation by comprehensively comparing the concentration and composition of WSIIs.

2. Materials and Methods
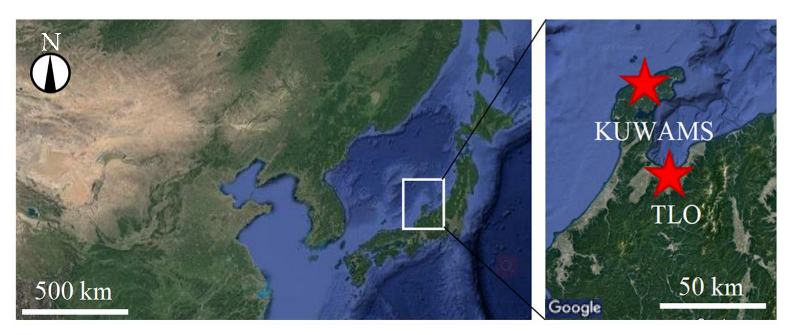
2.1. TSP Sampling

TSP samples were collected at KUWAMS (Figure 1, Nishifutamatamachi, Wajima City, Ishikawa Prefecture, Japan, 37.4° N, 136.9° E; 60 m above sea level), located on the Noto Peninsula between Western Japan and mainland China, 2.1 km from the coastline, without any major sources of air pollutant emissions [35,36].
TSP samples were collected starting at 9:00 a.m. by using a high-volume air sampler (AH-600, Sibata Sci. Tech. Ltd., Saitama, Japan) with a quartz fibre filter (8 inch × 10 inch, 2500QAT- UP, Pallflex Products, Putnam, CT, USA) at a flow rate of 700 L/min continuously from 27 February to 3 April, 2021. The filters were replaced once a week. After sampling, the filters were dried in a desiccator, kept in the dark, weighed and kept in the refrigerator (−20 °C) until use.

2.2. WSIIs Analysis

Eight kinds of WSIIs, including sodium (Na+), calcium (Ca2+), magnesium (Mg2+), potassium (K+), ammonium (NH4+), chloride (Cl), sulphate (SO42−) and nitrate (NO3), were analysed in each TSP sample.
The pre-treatment methods were detailed in our previous study [37]. Briefly, each filter was cut into small pieces and placed in centrifuge tubes. After adding 15 mL ultrapure water, the compounds were sealed and ultrasonicated for 20 min. The extract was filtered through a 0.45-μm micropore filter (Millex®-HP, Merck KGaA, Darmstadt, Germany) to remove particulate impurities. The solution was divided into two parts for the analysis of cations and anions. An ion chromatography system (883 Basic IC plus, Metrohm, Herisau, Switzerland), consisting of a conductivity detector, a suppressor, guard columns (Metrosep C 4 S-guard/4.0 for cations and Metrosep A Supp 5 S-Guard/4.0 for anions, Metrohm, Herisau, Switzerland) and separation columns (Metrosep C 4-250/4.0 for cations and Metrosep A Supp 5-250/4.0 for anions, Metrohm, Herisau, Switzerland), was used to analyse the above WSIIs.

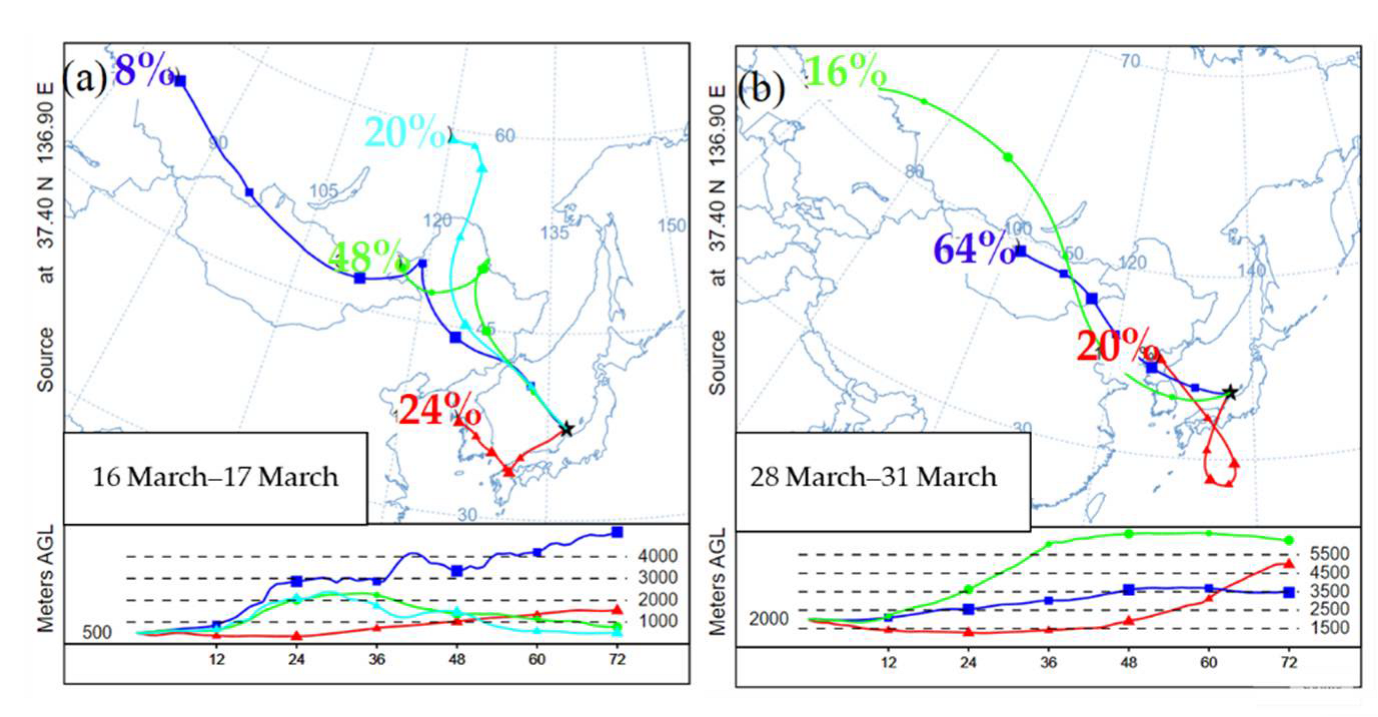
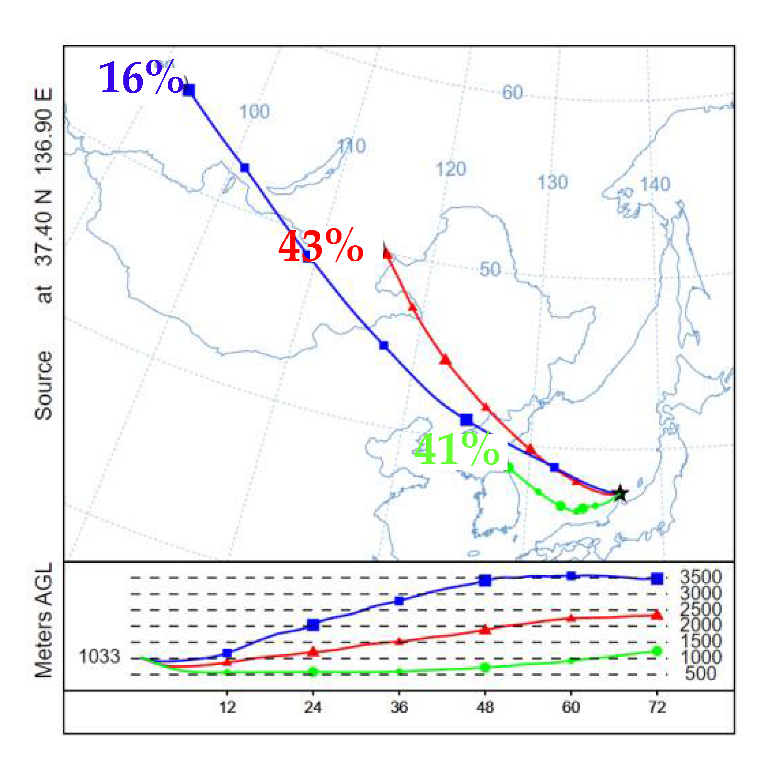
2.3. Backwards Trajectory Analysis

The Hybrid Single-Particle Lagrangian Integrated Trajectory model (HYSPLIT-4, Windows-based version, NOAA Air Resources Laboratory) was used to identify the potential source and transport pathway of the air mass during the AD periods. Three-day backwards trajectories of arrival at KUWAMS (37.4° N, 136.9° E) during the two AD events were used. Trajectories were set at two different arrival heights of 500 m and 2000 m due to the different heights of the AD layers over KUWAMS (Figure S1). The global data assimilation system (GDAS 1°) of days in 2021 provided by the National Centers for Environmental Prediction (NCEP) was used. For the first AD, the starting time was set as 16 March 00:00 UTC, and for the second AD, the starting time was 28 March 00:00 UTC.
The back trajectories were computed every 2 h in two AD events. Each trajectory is defined as a cluster. Every two clusters (trajectories) were combined as trajectory pairs, and the cluster spatial variance was calculated. The sum of the spatial variances of all clusters was defined as the total spatial variance (TSV). Cluster combinations of many different combinations perform cluster iteration. Most of the time, the clustering usually increases at a roughly constant rate. When it increases rapidly again, it indicates that the clusters being combined are not very similar. Based on the case of a significant increase in TSV, the appropriate number of clusters in both ADs was 3.

2.4. Non-Sea Salt Analysis

The non-sea salt concentration is usually calculated by using the total Na+ as a sea spray maker. However, based on our previous study on natural aeolian dust particles, the concentration of NaCl in the Gobi Desert was high [38]. Therefore, the Na+ collected at KUWAMS was also from continental dust (nss-Na+), and sea spray and sea salt Na+ (ss-Na+) can be calculated using the four-equation system reported below. The mean Ca2+/Na+ ratio in the crust ((Na+/Ca2+) = 1.78 w/w) and the mean Ca2+/Na+ ratio in sea water ((Ca2+/Na+) = 0.038 w/w) were referred [39].
ss Na + = Na + nss Na +
nss Na + = nss Ca 2 + × Na + Ca 2 + crust
nss Ca 2 + = Ca 2 + ss Ca 2 +
ss Ca 2 + = ss Na + × Ca 2 + Na + seawater
The concentrations of non-sea salt sulphate (nss-SO42−), non-sea salt potassium (nss-K+) and non-sea salt magnesium (nss-Mg2+) are expressed in Equations (5)–(7) [30,40]. The unit of concentrations was μg/m3 in these equations:
nss SO 4 2 = SO 4 2 0.2455 × ss Na +
nss K + = K + 0.0355 × ss Na +
nss Mg 2 + = Mg 2 + 0.0370 × ss Na +

2.5. Quality Assurance and Quality Control

The detection limits of Na+, Ca2+, Mg2+, K+, NH4+, Cl, SO42− and NO3 were 0.28, 0.13, 0.30, 0.43, 0.14, 0.23, 0.02 and 0.08 mg/L, respectively. The standard curves were linear, and the fitting degrees (R2) of the standard curves were all greater than 0.99. After every 20 samples, a random replicate check was performed, and the relative standard deviation (RSD) of each ion was less than 5% in the reproducibility testing. The test results of the standard materials (Multication Standard Solution III 137-1461 and Anion Mixture Standard Solution 1019-24011, FUJIFILM, Osaka, Japan) indicated that the recoveries ranged from 89.9% to 102.6%. All WSIIs were undetectable in the blank samples [27].

3. Results and Discussions

3.1. Optical Properties and Time-Height Evolution of AD

The optical properties and vertical distribution of AD aerosols were further identified by referring to data from the Toyama lidar obverse station (TLO) [41]. The linear distance between TLO and KUWAMS is 80.13 km (Figure 1).
In this study, two AD events were observed at KUWAMS from 16 March 00:00 UTC to 17 March 12:00 UTC (AD1) and from 28 March 00:00 UTC to 31 March 12:00 UTC (AD2) in 2021 (Figure S1). The dust layer can be identified by the depolarisation ratio at 532 nm (Figure S1). Since aerosols are assumed to be a mixture of two components: one component is mineral dust, mainly dust particles, and the other component includes spherical particles such as anthropogenic particles and sea salt droplets. The observed total particle extinction (δp532) should be divided into the dust extinction coefficient and the spherical particle extinction [42]. During AD1, the aerosol was regarded as a mixture of dust particles and spherical particles, and AD2 was mainly contributed by AD particles. Additionally, AD1 and AD2 had different vertical distributions of the extinction coefficient. During AD1, dust extinction was distributed from 1 km above ground level (AGL), and the extinction coefficient was approximately 0.15–0.35/km. AD2 shows strong dust extinction as the extinction coefficient reached 0.5/km lower than 2 km and approximately 0.2 in height from 2 km to 5 km (Figure S1).
A previous study proved that dust aerosols at different altitudes may originate from different source regions [43]. Therefore, a backwards trajectory analysis during two AD events was carried out in different settings. For AD1, the starting time was set at 16 March 00:00, 2021, at 500 m, with a total run time of 72 h. As shown in Figure 2a, the major air mass originated from the North-eastern China region at 1 km and was then transported at a low altitude (<2.5 km) over North-eastern China [44]. As shown in Figure S1, AD2 had a higher dust layer around 5 km at TLO, and the strong dust extinction was distributed around 2 km. Therefore, we hypothesised that the air mass with AD2 during outbreaking at the source region might be higher. To figure out the source of AD over KUWAMS, we set the starting height at 2 km. The starting time was 28 March 00:00, 2021, with a total running time of 72 h. As shown in Figure 2b, the dust aerosol was mainly from the Gobi Desert in Mongolia at a higher altitude (>3 km) and then passed over Northern eastern China.

3.2. Characteristics of Aerosols in AD

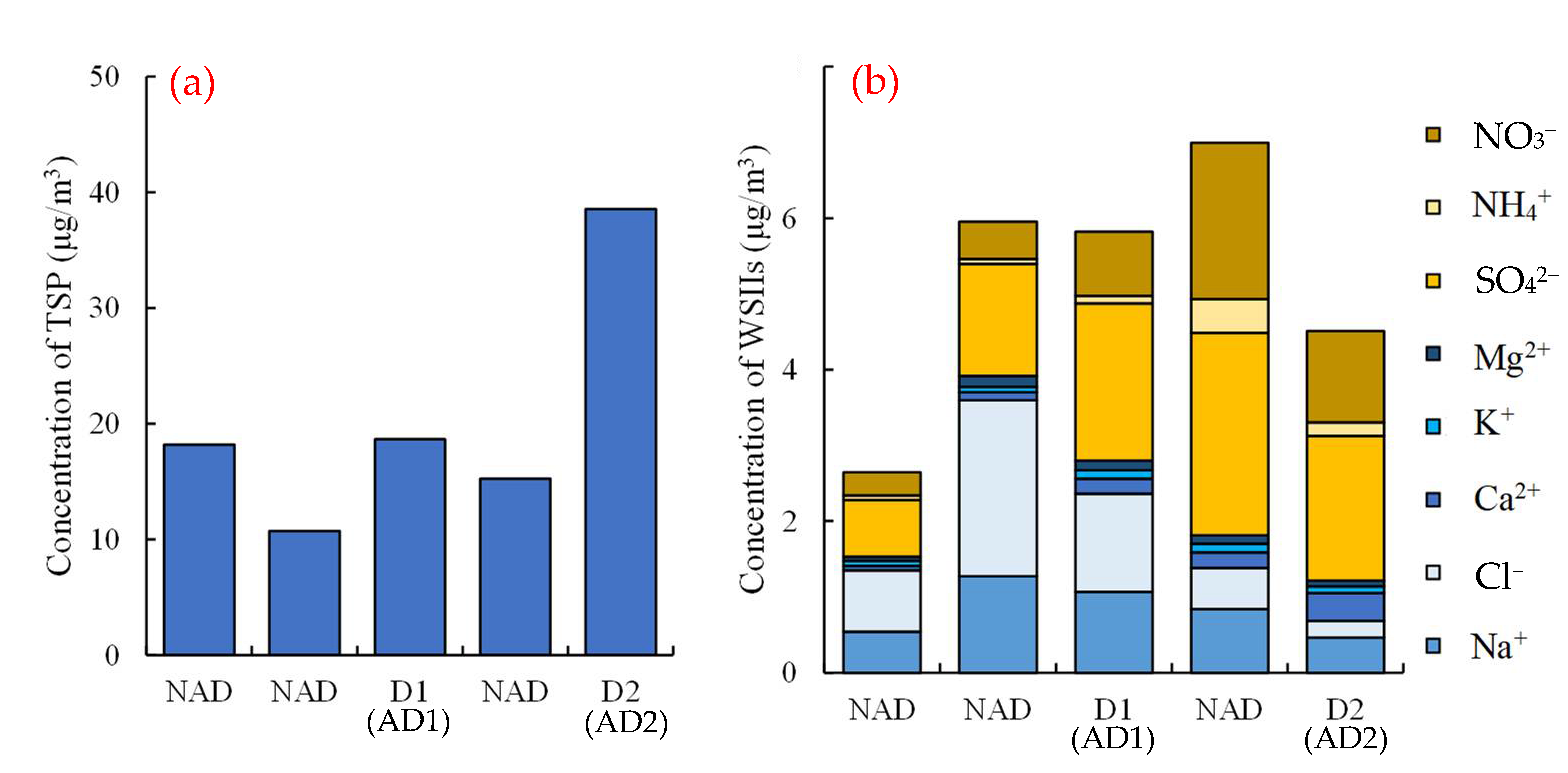
3.2.1. Concentration of TSP

Since our sampling was weekly, we used dust period 1 (D1) and dust period 2 (D2) to represent AD1 and AD2, respectively. Figure 3a shows the concentration variations of TSP in the sampling period. The TSP concentration increased due to the input of AD aerosols, with the highest TSP concentration in D2 (38.5 μg/m3), followed by D1 (18.7 μg/m3) and non-AD (NAD; 14.7 ± 3.75 μg/m3).
We also compared the particle concentrations at Ulaanbaatar (Mongolia) and several cities in Northern China to determine the atmospheric behaviour during ADs [45,46]. As shown in Figure S2, the first AD broke out on 14 March in Ulaanbaatar and then quickly settled in Hohhot with the PM2.5 concentration increased significantly. However, the PM10 concentration in Ulaanbaatar and the PM2.5 concentration increased at the same time on 27 March and were lower than those in the first AD, and then, a significant increase in the TSP concentration at KUWAMS was observed. Combined with the sea–surface pressure and backwards trajectory analysis during the two ADs, AD2 broke out at a higher pressure and then transported at a faster speed in the free troposphere, resulting in lower AD particle loss during the long-range transportation (Figure S3) [47]. Therefore, the TSP concentration in AD2 was the highest. The TSP concentration in AD1 did not show an obvious increase, because most AD particles had already been removed from the air mass.

3.2.2. Concentration of WSIIs

Figure 3b shows the concentration variation of WSIIs during the sampling period. The WSII concentration was highest in D1 (5.82 μg/m3), followed by NAD (5.19 ± 2.27 μg/m3), and lowest in D2 (4.51 μg/m3). This result suggests that the WSII concentration was determined by the source and long-range transport pathway of AD. During D1, the air mass was from North-eastern China, which has high anthropogenic pollutants due to the large consumption of coal, fossil fuels and biomass [48,49,50]. During long-range transportation, the air mass was able to mix with these anthropogenic pollutants, therefore resulting in higher concentration in D1. However, in D2, as we discussed before, the air mass rarely mixed with other types of aerosols. The WSII concentration in D2 was diluted by the additional significantly increased AD particles.
Since NaCl exists in both the ocean and the Gobi Desert. In order to better illustrate the effect of AD, the effect of sea salt WSIIs was excluded in this study. As shown in Table S1, in the NAD and D1 periods, the ss-Na+ concentration (NAD = 0.71 ± 0.39 μg/m3, D1 = 0.75 μg/m3) was higher than the nss-Na+ concentration (NAD = 0.17 ± 0.14 μg/m3, D1 = 0.31 μg/m3), indicating that Na+ was more contributed to by sea salt. However, in D2, nss-Na+ was the predominant contributor, with a ss-Na+ concentration of nearly 0 μg/m3. This result suggests that the Na+ concentration will increase when the AD air mass mainly contains soil particles that originate from the Gobi Desert. As shown in Figure S7a, we also found that Cl depletion in D1 (73.8%) and D2 (32.4%) was higher than that in NAD (26.5%), suggesting that the reaction between Cl and acidic components was enhanced. As a marker of dust particles, the nss-Ca2+ concentration was higher in D1 (0.18 μg/m3) and D2 (0.37 μg/m3) than in NAD (0.10 ± 0.08 μg/m3), reflecting the intensity of AD. The nss-K+ concentration and nss-Mg2+ concentration also increased as AD occurred.
As shown in Figure 3b, during the sampling period, secondary WSIIs (NO3, NH4+ and SO42+) were the major components, suggesting the strong effects of anthropogenic pollution from the Asian continent, which is consistent with previous studies [28,29]. However, as shown in Table S1, the secondary WSII concentration did not necessarily increase with AD occurrence, since secondary WSIIs may also be affected by chemical reactions in the atmosphere. Although the concentration of NH4+ was lower than those of nss-SO42− or NO3, NH4+ played an important role in neutralising aerosol acidity [51].

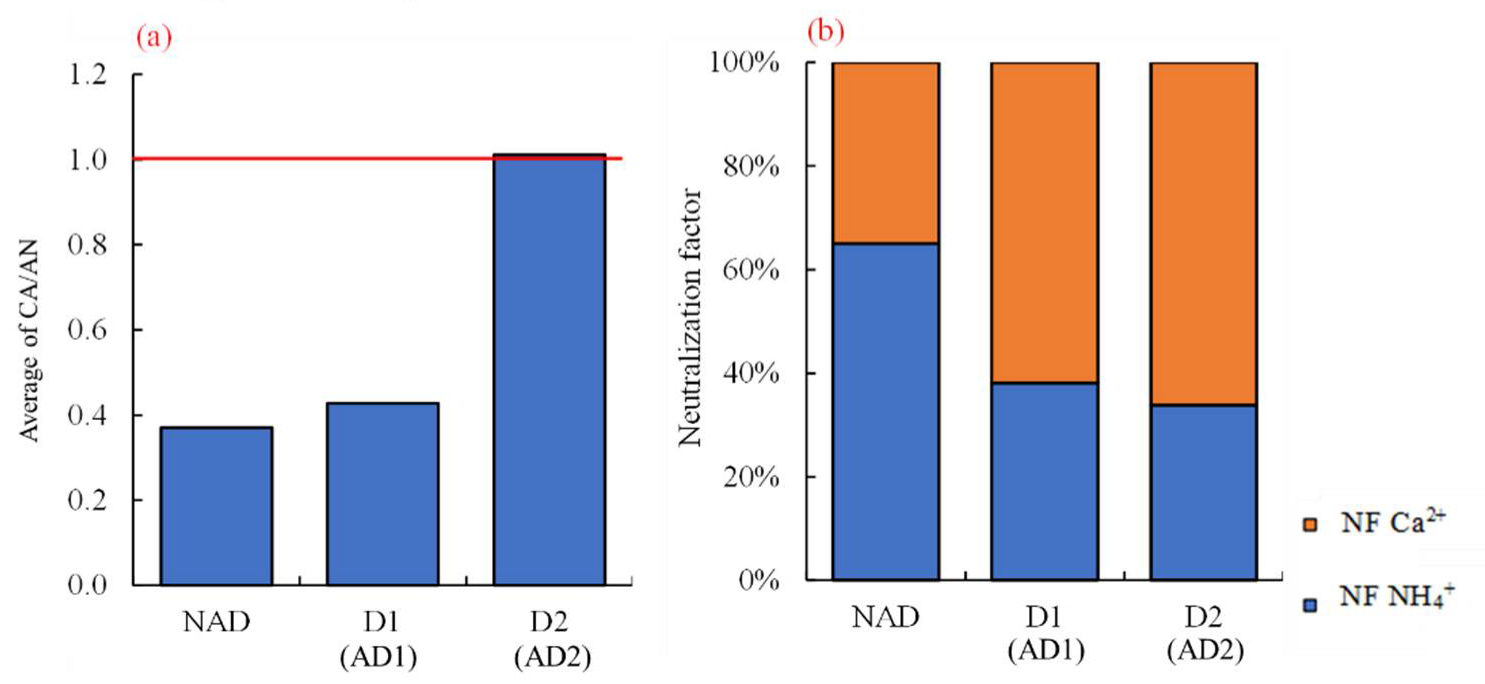
3.2.3. Aerosol Acidity and Neutralisation Factor

The acidity of atmospheric aerosols is determined by the cation (CA) and anion (AN) micro-equivalent concentrations (μeq/m3). The ratio of CA/AN = 1 represents neutrality, CA/AN > 1 represents alkalinity and CA/AN < 1 represents acidity. To better evaluate the influence of AD, the non-sea salt concentration was used to calculate the CA and AN.
CA = nss Na + / 23 + NH 4 + / 18 + nss K + / 39 + nss Ca 2 + / 20 + nss Mg 2 + / 12
AN = nss SO 4 2 / 48 + NO 3 / 63 + Cl / 35.5
As shown in Figure 4a, the CA/AN ratios in D1 (0.43) and D2 (1.01) were higher than that in NAD (0.37 ± 0.19). This result indicates that the acidity of aerosols will be buffered due to the occurrence of AD. The difference between D1 and D2 can be explained by the transport pathway of the air mass. In D1, the air mass passed over Northern China and mixed with anthropogenic pollutants. The high SO42− and NO3 emissions in Northern China resulted in the aerosol still being acidic. However, in D2, AD aerosols mainly contained natural AD particles, with less SO42− and NO3 and higher Ca2+ in the Gobi Desert, resulting in the acidity of aerosols tending to be neutralised. The acidic components in aerosols can be neutralised by alkaline components such as NH3 and CaCO3. Therefore, the neutralisation factor (NF) of NH4+ and Ca2+ was calculated to evaluate the contribution of alkaline components. The equation is as follows [52]:
NFNH4+ = [NH4+]eq/([nss-SO42−]eq + [NO3]eq)
NFnss-Ca2+ = [nss-Ca2+]eq/([nss-SO42−]eq + [NO3]eq)
As shown in Figure 4b, NH4+ (NFNH4+ = 65%) was the predominant neutralisation factor in the NAD period. During D1 and D2, nss-Ca2+ played a more important role due to the enhanced input of AD particles (D1: NFnss-Ca2+ = 62%, D2: NFnss-Ca2+ = 66%).

3.3. Long-Term Observation of AD

Due to the uncertainty and contingency of the sampling, it is not comprehensive to evaluate the effects of different types of ADs on aerosols only through two AD events. Therefore, in this study, we refer to the data previously observed at KUWAMS from 2010 to 2015 to systematically illustrate the effect of AD [28]. According to a previous study, Japan suffers from different atmospheric pressure patterns in the cold season and warm season: in the cold season, because of the strong Siberian High, air pollutants from the Asian continent tend to be transported to Japan; however, in the warm season, Japan is affected by air masses from the Pacific, since the Pacific High is strong in the summer [53]. To reduce the impact of different pressure patterns on the direction of the monsoon, we focus on the data in the cold season, also called the East Asian monsoon period, to illustrate. From 2010 to 2015, there were a total of 27 AD events observed by the Toyama lidar station during the East Asian monsoon period (Table S2 and Figure S1). As shown in Figure 5, ADs were generated from the Gobi Desert in Mongolia and North-eastern China and then transported at different altitudes, matching the observations of the two ADs in March 2021. Based on the lidar observation of the dust extinction coefficient and the spherical particle extinction in each AD event, we divided all ADs into two types: ADN (aerosols were mainly mineral dust) and ADP (aerosols were a mixture of spherical particles). There were 14 ADNs and 13 ADPs from 2010 to 2015. Two ADs observed in March 2021 might be classified as ADPs (AD1) and ADN (AD2).

3.3.1. General Description of ADs

As shown in Figure S4a, during AD events, the TSP concentration increased significantly (p < 0.001), and the highest TSP concentration appeared in ADN (40.1 ± 19.7 μg/m3), followed by ADP (33.9 ± 16.7 μg/m3) and NAD (19.9 ± 10.5 μg/m3), which matched our discussion on ADs in 2021. This result indicates that AD particles tended to be deposited at KUWAMS if the AD plumes travelled at heights above 3 km, although TSP is thought to be quickly removed when it is passing the ocean region [54]. The WSII concentration variations were significantly correlated with TSP (p < 0.001), with WSII concentrations in ADN (13.5 ± 5.31 μg/m3) being higher than those in ADP (10.8 ± 4.21 μg/m3) and NAD (9.65 ± 3.31 μg/m3) (Figure S4b).
The increase in the nss-Ca2+ concentration was the result of the input of AD particles, as discussed previously. Mg2+ may come from both ocean and continental sources [55]. Through the linear fit regression between Mg2+ and ss-Na+ and nss-Ca2+, Mg2+ had a better correlation with ss-Na+ in the NAD period (R2 = 0.673) and correlated with nss-Ca2+ in the ADN period (R2 = 0.554) (Figure S5). This result indicates that Mg2+ always tends to originate from ocean sources, since KUWAMS is located near the Japanese Sea; however, when AD events occur, especially for AD originating from the desert region and transported at a higher altitude, the input of AD will cause an increase in Mg2+ concentration. There are two sources of K+: anthropogenic sources (biomass burning) and natural sources (soil dust particles) [56,57]. Through linear fit regression, K+ was better correlated with nss-SO42− (ADN: R2 = 0.757, ADP: R2 = 0.717, NAD: R2 = 0.414) than with nss-Ca2+ (ADN: R2 = 0.443, ADP: R2 = 0.625, NAD: R2 = 0.399) (Figure S6a,b). However, since there is large anthropogenic emissions in Mongolia, to better evaluate the level of anthropogenic emissions, we further divided nss-SO42− into the crustal fraction of sulphate (Cr- SO42−) and anthropogenic fraction of sulphate (an- SO42−) (Equations (12) and (13)) [58].
cr SO 4 2 = nss Ca 2 + × SO 4 2 Ca 2 +
an SO 4 2 = SO 4 2 ss SO 4 2 cr SO 4 2  
As shown in Figure S6c,d, K+ had better correlation with an-SO42− (ADN: R2 = 0.751, ADP: R2 = 0.673, NAD: R2 = 0.405) than with cr-SO42− (ADN: R2 = 0.443, ADP: R2 = 0.625, NAD: R2 = 0.399). These results suggest that K+ tended to be generated more from biomass burning. NO3 and some SO42− are produced from chemical reactions, which will be discussed in detail in a later section.
The observations in March 2021 showed that the acidity of aerosols was buffered due to AD. This result can also be found in long-term observations, as the CA/AN ratio was higher in ADP (0.62 ± 0.14) and ADN (0.62 ± 0.23) than in NAD (0.42 ± 0.19) (Figure S4c). The results of the nonparametric tests also showed that CA/AN had significantly different distributions in different categories, with a p-value less than 0.001. For the neutralisation factor, NH4+ contributed more than 80% to the NAD period. During AD, the effect of Ca2+ on neutralisation increased, with Ca2+ contributing more than 50% to the neutralising acid during ADN (Figure S4d). The results of long-term observation further proved that AD would neutralise aerosol acidity due to the increased effect of Ca2+.

3.3.2. Cl Depletion

From the observation in March 2021, Cl depletion increased, along with the AD events occurring. Through long-term observation, Cl depletion was also enhanced simultaneously with AD, with the average Cl depletion showing the highest ADP (62% ± 19%), followed by NAD (52% ± 30%) and ADN (47% ± 35%), although the nonparametric test showed no significant difference (p = 0.493) (Figure S7b).
Previous studies have demonstrated that Cl in sea salt aerosols can be removed by reactions with acidic components, such as H2SO4 and HNO3. These processes can produce reactive Cl compounds to further affect the oxidation capacity of aerosols [59].
HNO3 (g) + NaCl (s) = HCl (g) + NaNO3(s)
H2SO4 (g) + 2NaCl (s) = 2HCl (g) +Na2SO4 (s)
where g represents the gas phases, and s represents the solid phase.
Through the linear regression between [Na+] and [Cl] + [NO3] and [Cl] + [nss-SO42−] (Figure 6), the [Cl] + [NO3] had a better linear correlation with [Na+] (ADN: R2 = 0.842, ADP: R2 = 0.534, NAD: R2 = 0.845), indicating that Cl depletion was mainly attributed to the heterogeneous reaction of HNO3 with sea salt [60]. Additionally, a previous study implied that oxidation of sulphate can proceed rapidly only when the pH is maintained above 6–6.5 [61]. However, in this study, aerosols tend to be acidic. Therefore, the oxidation of SO2 may be suppressed to further reduce the reaction between sea salt and sulphate.

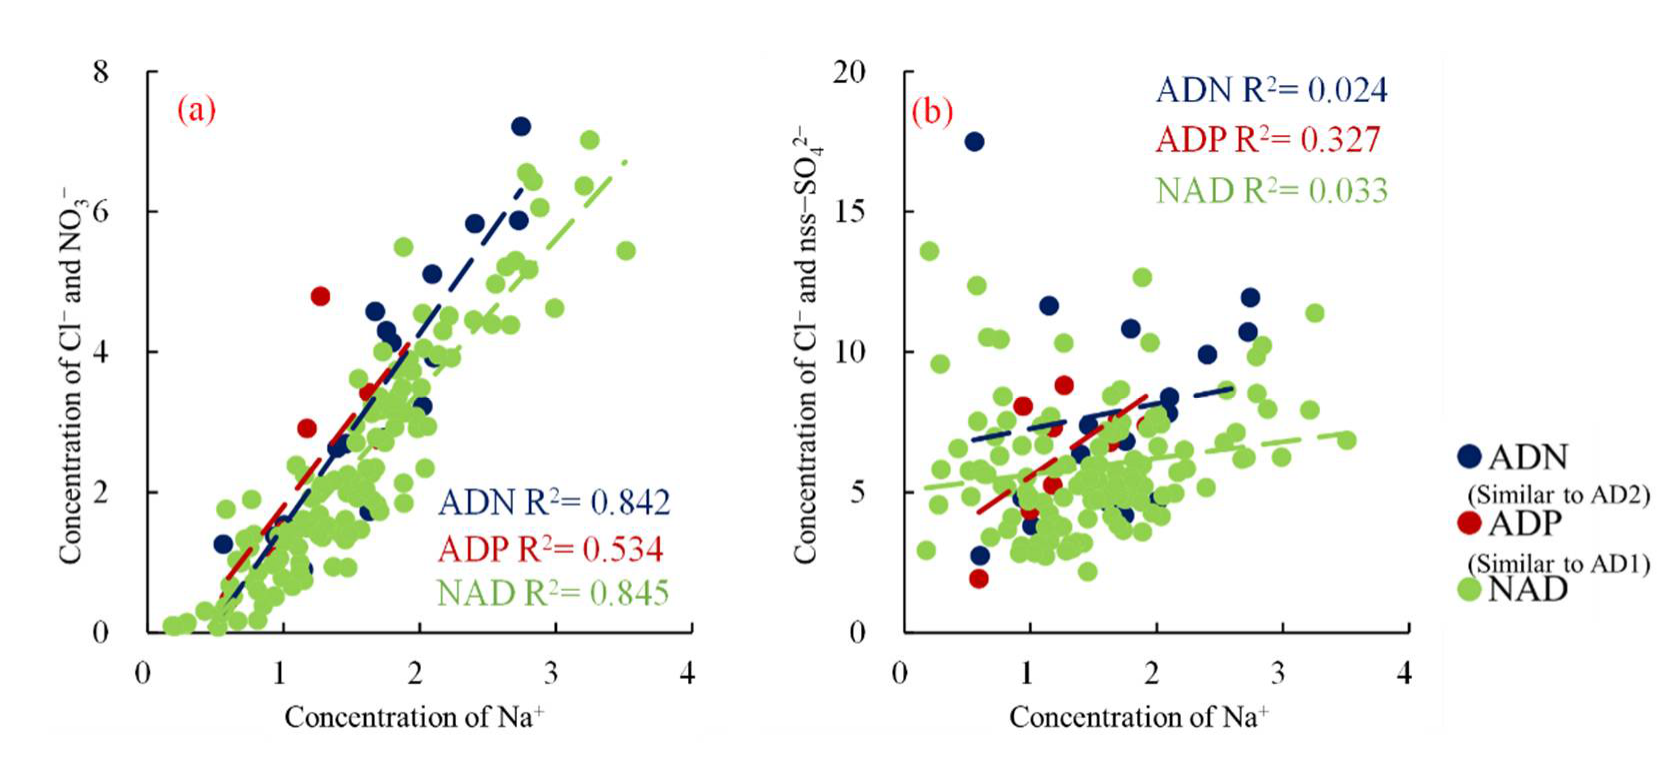
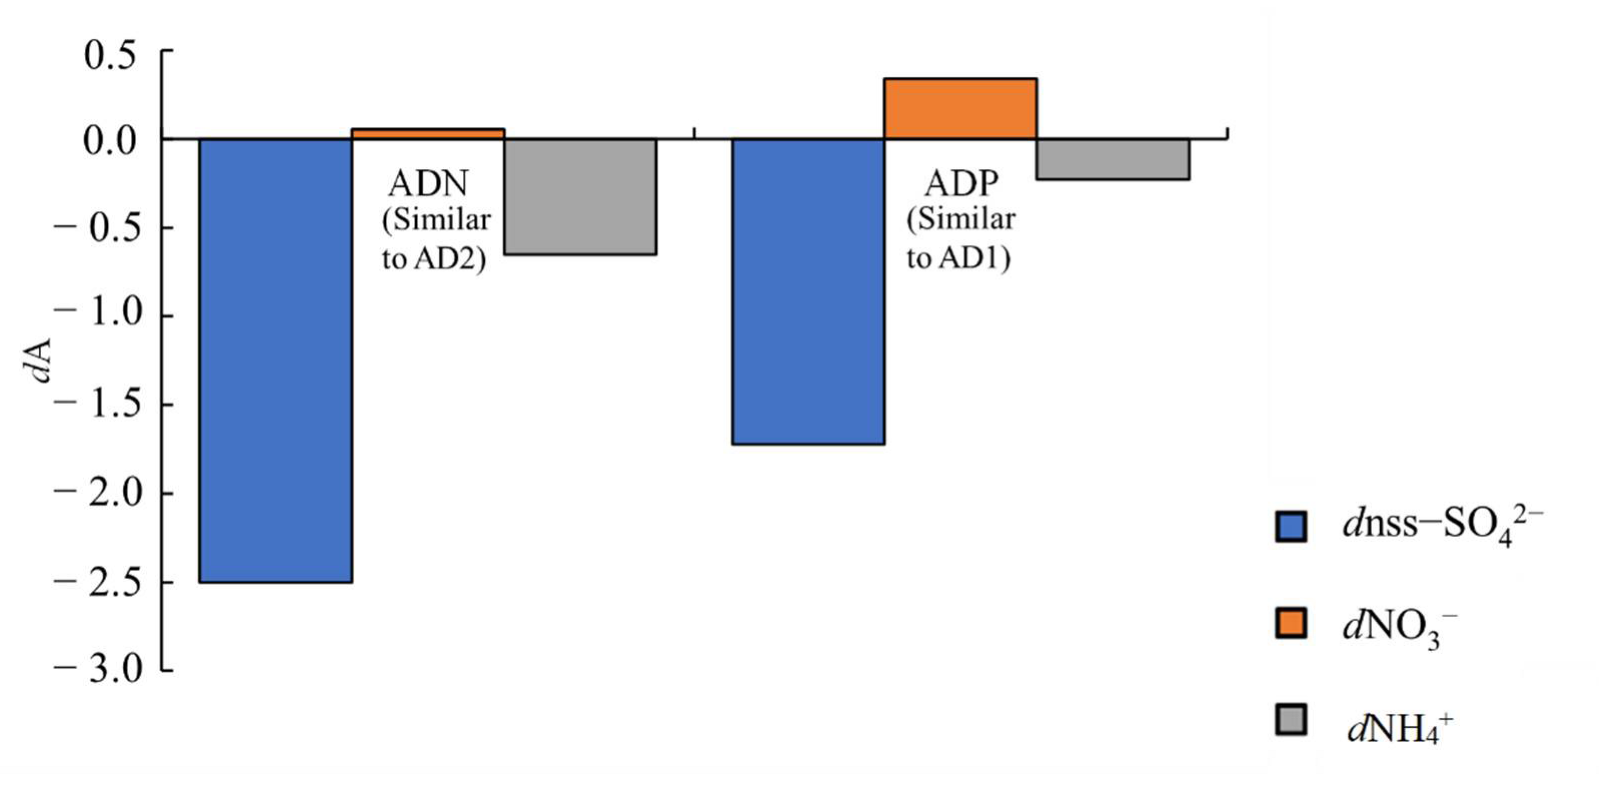
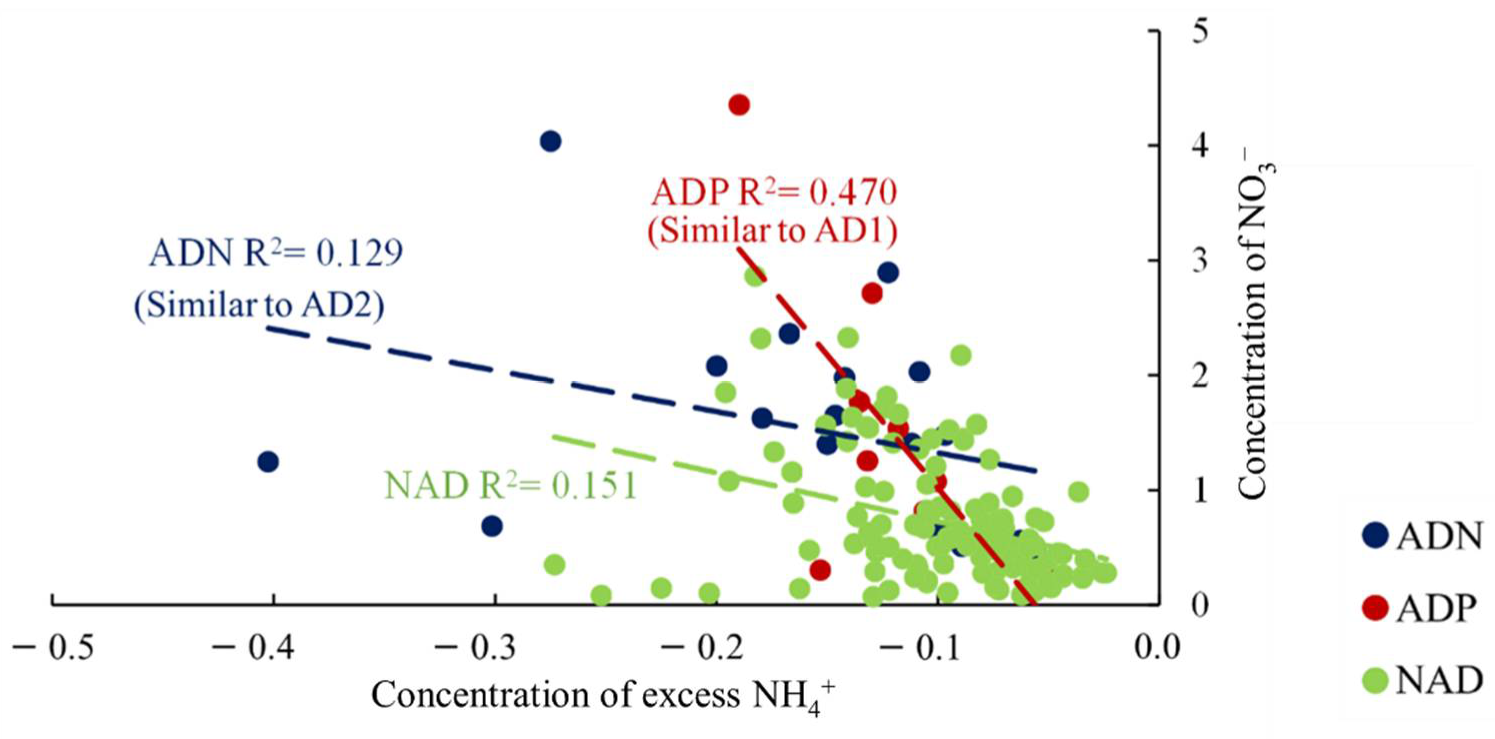
3.3.3. Secondary Formation of Sulphate and Nitrate

In this study, we used the following equation to calculate the secondary formation of nss-SO42−, NO3 and NH4+ during ADP and ADN [62].
dA = C A i C A ref C TSP ref × C TSP i
where dA is the secondarily formed nss-SO42−, NO3 and NH4+ in sample i; C A i is the concentration of nss-SO42−, NO3 and NH4+ in sample i; C A ref is the average concentration of nss-SO42−, NO3 and NH4+ in NAD ( C nssSO 42 ref = 4.32, C NO 3 ref = 0.74, C NH 4 + ref = 0.65); C TSP ref is the average concentration of TSP in NAD ( C TSP ref = 19.76) and C TSP i is the concentration of TSP in sample i. As a result, there was no significant amount of nss-SO42− and NH4+ that were secondarily formed during ADP and ADN, while the secondary formation of NO3 was found in ADP (dNO3 = 0.18 ± 1.02) and ADN (dNO3 = 0.02 ± 0.88) (Figure 7).
SO42− is mainly generated by oxidation reactions with SO2 gas. Some SO42− exists in sea salt particles in the form of Na2SO4, while CaSO4 exists in soil dust particles [32,63]. Through the correlation analysis, nss-SO42− was extremely significantly positively correlated with nss-Ca2+ (R2 = 0.625, p < 0.001) and NO3 (R2 = 0.433, p < 0.001) but had a significantly negative correlation with the change in ss-Na+ (R2 = −0.612, p < 0.001). As shown in Figure S8, nss-SO42− was highly correlated with NO3 in ADP (R2 = 0.428) and better correlated with nss-Ca2+ in ADN (R2 = 0.536). These results suggest that the source of nss-SO42− was highly affected by the transport pathway. In ADP, air masses mixed with atmospheric pollutants were generated from Northern China. Due to the high consumption of coal for heating in the cold season, the SO42− concentration was high [64]. When AD aerosols passed over North-eastern China, nss-SO42− mixed with AD particles to further increase the nss-SO42− concentration downwind. However, in ADN, AD particles rarely mixed with other aerosols; therefore, the soil dust particles were the main components, such as CaSO4.
NH4+ may originate from the reaction of NH3 gas with acidic gases, such as H2SO4, HNO3 and HCl [65]. Therefore, NH4+ always acts as a neutralisation factor, existing in the form of (NH4)2SO4 and NH4NO3. NR was calculated based on the equivalent concentrations of SO42−, NO3 and NH4+ and used to evaluate the neutralisation level of NH4+.
Neutralisation   ratio   NR = NH 4 +   neq / m 3 SO 4 2   neq / m 3 + NO 3   neq / m 3
As shown in Figure S9, both in the 2021 observations (NAD: NR = 0.20 ± 0.09, D1: NR = 0.10 and D2: NR = 0.16) and long-term observations from 2010 to 2015 (NAD: NR = 0.30 ± 0.13, ADP: NR = 0.30 ± 0.11 and ADN: NR = 0.20 ± 0.11), the NR values were all less than 1, suggesting that sulphate and nitrate cannot be fully neutralised by NH4+. This result illustrates that the atmospheric environment was ammonium-deficient. We used excess NH4+ concentration to evaluate the degree of ammonium-deficient environment by the following equation [66,67]. As a result, the excess NH4+ concentration in all aerosol outflows was less than 0 (Figure S10)”
excess   NH 4 + eq = NH 4 + SO 4 2 1.5 × SO 4 2
Previous studies have shown that, under NH4+-rich conditions, NO3 is formed by gas-phase reactions, while NO3 is formed by heterogeneous reactions of HNO3 in liquid phase under NH4+-poor conditions [68]:
HNO3 (g) + NH3 (g) ⇄ NH4NO3 (s, aq)
N2O5 (aq) + H2O (aq) ⇄ 2NO3 (aq) + 2H+ (aq)
As shown in Figure 8, the NO3 concentration increased while the excess NH4+ concentration decreased, suggesting that the NO3 concentration in this study cannot be explained by the homogeneous gas-phase reaction between NH3 and nitric acid. Nitrate can also be formed by heterogeneous hydrolysis of N2O5 on the moist aerosol surface during night-time, which depends on the concentration of N2O5 and water in the aerosol [69]. According to previous laboratory and field studies, the heterogeneous hydrolysis of N2O5 can be promoted by the enhanced hygroscopicity, surface area and acidity of the pre-existing particles [70,71,72]. The N2O5 uptake coefficients will increase if aerosols tend to be acidic [73]. Additionally, water plays an important role in the heterogeneous hydrolysis of N2O5, since water can promote the uptake of N2O5 on the aerosol surface [72]. However, the increase in water can decrease the aerosol acidity to further reduce the N2O5 uptake. In AD, the increased AD particles provided a surface area for heterogeneous reactions between the gases HNO3, NO2 and SO2 and particulate (NH4)2SO4. The acidic aerosols can promote the adsorption of N2O5 on the surface of particles as well. Previous studies have shown that the hygroscopicity of chemical species in dust particles depends on their transport pathways [74]. In ADP, hygroscopic species were formed by the interaction of AD particles with anthropogenic pollutants, such as Ca(NO3)2 and (NH4)2SO4, and during long-range transportation, with the aging of dust particles, the hygroscopes increased. Therefore, we indicate that the secondary generation of NO3 observed in ADP is due to the heterogeneous reaction of HNO3.

4. Conclusions

In this study, the effect of Asian dust (AD) on water-soluble inorganic ions (WSIIs) in total suspended particles (TSPs) was investigated at KUWAMS, a remote background site in Japan, from 27 February to 3 April 2021. To provide a comprehensive illustration, data from long-term observations of WSIIs at KUWAMS from 2010 to 2015 were referred During the East Asian monsoon period, the air mass mainly flowed out of the Asian continent. Based on the lidar observations and backwards trajectory analysis, the observed ADs were classified into two types: ADs mainly containing natural AD particles and ADs mixed with other anthropogenic pollutants. The TSP and WSII concentrations increased due to AD outbreaks, especially when AD was transported at a higher altitude with faster speed. The AD marker nss-Ca2+ had a concentration variation similar to that of TSP. AD buffered the acidity of aerosols with the increase in Ca2+ as a neutralisation factor. A higher Cl depletion was observed when the AD particles were mainly natural particles, which was caused by the heterogeneous reaction of HNO3 with sea salt. SO42− from soil dust existed in the form of CaSO4 in the natural AD particles, while it came from combustion sources when AD passed through polluted areas. When AD particles were transported with anthropogenic pollutants, the secondary formation of NO3 was enhanced, indicating the effect of AD on secondary aerosols, which was attributed to the heterogeneous hydrolysis of N2O5. Based on long-term observations, this study systematically analysed the chemical composition changes of water-soluble inorganic ions during Asian dust, which can more comprehensively describe the impact of Asian dust on the changes of aerosol in downwind areas and reduce the specificity between Asian dusts.

Supplementary Materials

The following supporting information can be downloaded at https://www.mdpi.com/article/10.3390/atmos13081210/s1: Figure S1: Lidar observation of the attenuated backscatter coefficient (532 nm) during AD events in 2021 and from 2010 to 2015. Each AD event is marked in red blocks, and the sampling period is marked with a black dotted line. Figure S2: Daily concentration of the PM10 concentration in Ulaanbaatar, PM2.5 in Hohhot, Shenyang and TSP concentration in KUWAMS from 10 March to 3 April, 2021. Figure S3: Sea–surface pressure on 14 March 05:00 LT (a) and 26 March 05:00 LT (b) in 2021. Figure S4: Concentration variation of TSP (a), WSIIs (b), (CA)/(AN) (c) and neutralisation factor (d) in different types of AD during long-term observation from 2010 to 2015. Figure S5: Linear fit regression of Mg2+ with nss-Ca2+ (a) and ss-Na+ (b) during long-term observation from 2010 to 2015. Figure S6: Linear fit regression of K+ with nss-Ca2+ (a), nss- SO42− (b), cr- SO42− (c) and an- SO42− (d) during long-term observation from 2010 to 2015. Figure S7: Cl depletion in different aerosol outflows during sampling in March 2021, (a) and long-term observation from 2010 to 2015 (b). Figure S8: Linear regression of (nss-SO42−) with (nss-Ca2+) (a) and (NO3) (b) during long-term observation from 2010 to 2015. Figure S9: Neutralisation ratio in different aerosol outflows during sampling period in 2021 (a) and long-term observation from 2010 to 2015 (b). Figure S10: Concentration of (excess NH4+) with (NO3) during long-term observation from 2010 to 2015. Table S1: Concentration of water-soluble inorganic ions (WSIIs) and non-sea salt WSIIs during the sampling period in 2021. Table S2: Time periods and type of AD from 2010 to 2015.

Author Contributions

N.T. designed the sampling work, the WSIIs analyses for particulate matters; N.T., L.Z., H.Z., X.Z. and Y.W. collected samples and conducted monitoring work; P.B. analysed the WSIIs and performed a statistical analysis and S.N., B.C. and N.T. gave recommendations to the paper. All authors have read and agreed to the published version of the manuscript.

Funding

This work was supported by the Bilateral Open Partnership Joint Research Projects of the Japan Society for the Promotion of Science, Japan (JPJSBP120219914), the CHOZEN Project of Kanazawa University, Japan and the cooperative research programs of Institute of Nature and Environmental Technology, Kanazawa University, Japan.

Institutional Review Board Statement

Not applicable.

Informed Consent Statement

Not applicable.

Data Availability Statement

Not applicable.

Acknowledgments

We thank the National Oceanic and Atmospheric Administration Air Resources Laboratory for providing the HYSPLIT 4 model (Windows-based). The authors acknowledge the Institute of Nature and Environmental Technology, Kanazawa University for the provision of the scientific data used in this publication (https://ki-net.db.kanazawa-u.ac.jp/, accessed on 5 July 2022). We thank the Saichun Tan for comments on the meteorological analysis.

Conflicts of Interest

The authors declare no conflict of interest.

References

  1. Zhao, T.L.; Gong, S.L.; Zhang, X.Y.; Blanchet, J.-P.; Mckendry, I.G.; Zhou, Z.J. A Simulated Climatology of Asian Dust Aerosol and Its Trans-Pacific Transport. Part I: Mean Climate and Validation. J. Clim. 2006, 19, 88–103. [Google Scholar] [CrossRef] [Green Version]
  2. Wang, Q.; Zhuang, G.; Li, J.; Huang, K.; Zhang, R.; Jiang, Y.; Lin, Y.; Fu, J.S. Mixing of Dust with Pollution on the Transport Path of Asian Dust-Revealed from the Aerosol over Yulin, the North Edge of Loess Plateau. Sci. Total Environ. 2011, 409, 573–581. [Google Scholar] [CrossRef] [PubMed]
  3. Prijith, S.S.; Rajeev, K.; Thampi, B.V.; Nair, S.K.; Mohan, M. Multi-Year Observations of the Spatial and Vertical Distribution of Aerosols and the Genesis of Abnormal Variations in Aerosol Loading over the Arabian Sea during Asian Summer Monsoon Season. J. Atmos. Sol.-Terr. Phys. 2013, 105–106, 142–151. [Google Scholar] [CrossRef]
  4. Griggs, D.J.; Noguer, M. Climate Change 2001: The Scientific Basis. Contribution of Working Group I to the Third Assessment Report of the Intergovernmental Panel on Climate Change. Weather 2002, 57, 267–269. [Google Scholar] [CrossRef]
  5. Laurent, B.; Marticorena, B.; Bergametti, G.; Chazette, P.; Maignan, F.; Schmechtig, C. Simulation of the Mineral Dust Emission Frequencies from Desert Areas of China and Mongolia Using an Aerodynamic Roughness Length Map Derived from the POLDER/ADEOS 1 Surface Products. J. Geophys. Res. D Atmos. 2005, 110, 1–21. [Google Scholar] [CrossRef]
  6. Kurosaki, Y.; Mikami, M. Recent Frequent Dust Events and Their Relation to Surface Wind in East Asia. Geophys. Res. Lett. 2003, 30, ASC 2-1-2-4. [Google Scholar] [CrossRef]
  7. Iino, N.; Kinoshita, K.; Iwasaki, R.; Masumizu, T.; Yano, T. NOAA and GMS Observations of Asian Dust Events during 2000–2002. In Proceedings of SPIE—The International Society for Optical Engineering; SPIE: Bellingham, WA, USA, 2002; Volume 4895, pp. 18–27. [Google Scholar] [CrossRef]
  8. Gao, T.; Yu, X.; Ma, Q.; Li, H.; Li, X.; Si, Y. Climatology and Trends of the Temporal and Spatial Distribution of Sandstorms in Inner Mongolia. Water Air Soil Pollut. Focus 2003, 3, 51–60. [Google Scholar] [CrossRef]
  9. Hwang, H.; Kim, H.; Ro, C.-U. Single-Particle Characterization of Aerosol Samples Collected before and during an Asian Dust Storm in Chuncheon, Korea. Atmos. Environ. 2008, 42, 8738–8746. [Google Scholar] [CrossRef]
  10. Feng, X.; Jiang, F.; Zhang, Z.; Xiong, Z.; Zhong, Y.; Dong, J.; Chen, T.; Li, A.; Zou, X.; Shi, X. Long Eccentricity Forcing Asian Dust Input into the Northwestern Pacific during the Early Pleistocene. Palaeogeogr. Palaeoclimatol. Palaeoecol. 2022, 596. [Google Scholar] [CrossRef]
  11. Lee, H.; Kim, H.; Honda, Y.; Lim, Y.-H.; Yi, S. Effect of Asian Dust Storms on Daily Mortality in Seven Metropolitan Cities of Korea. Atmos. Environ. 2013, 79, 510–517. [Google Scholar] [CrossRef]
  12. Han, Y.; Wu, Y.; Wang, T.; Xie, C.; Zhao, K.; Zhuang, B.; Li, S. Characterizing a Persistent Asian Dust Transport Event: Optical Properties and Impact on Air Quality through the Ground-Based and Satellite Measurements over Nanjing, China. Atmos. Environ. 2015, 115, 304–316. [Google Scholar] [CrossRef]
  13. Sun, Y.; Zhuang, G.; Huang, K.; Li, J.; Wang, Q.; Wang, Y.; Lin, Y.; Fu, J.S.; Zhang, W.; Tang, A.; et al. Asian Dust over Northern China and Its Impact on the Downstream Aerosol Chemistry in 2004. J. Geophys. Res. Atmos. 2010, 115, D00K09. [Google Scholar] [CrossRef]
  14. Kashima, S.; Yorifuji, T.; Bae, S.; Honda, Y.; Lim, Y.-H.; Hong, Y.-C. Asian Dust Effect on Cause-Specific Mortality in Five Cities across South Korea and Japan. Atmos. Environ. 2016, 128, 20–27. [Google Scholar] [CrossRef]
  15. Hansell, R.A.; Tsay, S.-C.; Hsu, N.C.; Ji, Q.; Bell, S.W.; Holben, B.N.; Welton, E.J.; Roush, T.L.; Zhang, W.; Huang, J.; et al. An Assessment of the Surface Longwave Direct Radiative Effect of Airborne Dust in Zhangye, China, during the Asian Monsoon Years Field Experiment (2008). J. Geophys. Res. Atmos. 2012, 117, D00K39. [Google Scholar] [CrossRef] [Green Version]
  16. Takahashi, H.; Naoe, H.; Igarashi, Y.; Inomata, Y.; Sugimoto, N. Aerosol Concentrations Observed at Mt. Haruna, Japan, in Relation to Long-Range Transport of Asian Mineral Dust Aerosols. Atmos. Environ. 2010, 44, 4638–4644. [Google Scholar] [CrossRef]
  17. Huebert, B.J.; Bates, T.; Russell, P.B.; Shi, G.; Kim, Y.J.; Kawamura, K.; Carmichael, G.; Nakajima, T. An Overview of ACE-Asia: Strategies for Quantifying the Relationships between Asian Aerosols and Their Climatic Impacts. J. Geophys. Res. Atmos. 2003, 108, ACE 1-1–ACE 1-20. [Google Scholar] [CrossRef] [Green Version]
  18. Kim, J. Transport Routes and Source Regions of Asian Dust Observed in Korea during the Past 40 Years (1965–2004). Atmos. Environ. 2008, 42, 4778–4789. [Google Scholar] [CrossRef]
  19. Jung, C.H.; Lee, J.Y.; Um, J.; Lee, S.S.; Kim, Y.P. Chemical Composition Based Aerosol Optical Properties According to Size Distribution and Mixture Types during Smog and Asian Dust Events in Seoul, Korea. Asia-Pac. J. Atmos. Sci. 2018, 54, 19–32. [Google Scholar] [CrossRef]
  20. Onishi, K.; Kurosaki, Y.; Otani, S.; Yoshida, A.; Sugimoto, N.; Kurozawa, Y. Atmospheric Transport Route Determines Components of Asian Dust and Health Effects in Japan. Atmos. Environ. 2012, 49, 94–102. [Google Scholar] [CrossRef]
  21. Vieira-Filho, M.; Pedrotti, J.J.; Fornaro, A. Water-Soluble Ions Species of Size-Resolved Aerosols: Implications for the Atmospheric Acidity in São Paulo Megacity, Brazil. Atmos. Res. 2016, 181, 281–287. [Google Scholar] [CrossRef]
  22. Lin, C.-C.; Chen, S.-J.; Huang, K.-L.; Lee, W.-J.; Lin, W.-Y.; Liao, C.-J.; Chaung, H.-C.; Chiu, C.-H. Water-Soluble Ions in Nano/Ultrafine/Fine/Coarse Particles Collected near a Busy Road and at a Rural Site. Environ. Pollut. 2007, 145, 562–570. [Google Scholar] [CrossRef] [PubMed]
  23. Huang, R.-J.; Zhang, Y.; Bozzetti, C.; Ho, K.-F.; Cao, J.-J.; Han, Y.; Daellenbach, K.R.; Slowik, J.G.; Platt, S.M.; Canonaco, F.; et al. High Secondary Aerosol Contribution to Particulate Pollution during Haze Events in China. Nature 2015, 514, 218–222. [Google Scholar] [CrossRef] [PubMed] [Green Version]
  24. Wang, L.; Wen, T.-X.; Miao, H.-Y.; Gao, W.-K.; Wang, Y.-S. Concentrations and Size Distributions of Water-Soluble Inorganic Ions in Aerosol Particles in Taiyuan, Shanxi. Huanjing Kexue/Environ. Sci. 2016, 37, 3249–3257. [Google Scholar] [CrossRef]
  25. Wu, X.; Deng, J.; Chen, J.; Hong, Y.; Xu, L.; Yin, L.; Du, W.; Hong, Z.; Dai, N.; Yuan, C.-S. Characteristics of Water-Soluble Inorganic Components and Acidity of PM2.5 in a Coastal City of China. Aerosol Air Qual. Res. 2017, 17, 2152–2164. [Google Scholar] [CrossRef]
  26. Yan, Q.; Kong, S.-F.; Liu, H.-B.; Wang, W.; Wu, J.; Zheng, M.-M.; Zheng, S.-R.; Yang, G.-W.; Wu, F.-Q. Emission Inventory of Water Soluble Ions in Fine Particles from Residential Coal Burning in China and Implication for Emission Reduction. Zhongguo Huanjing Kexue/China Environ. Sci. 2017, 37, 3708–3721. [Google Scholar]
  27. Yan, Q.; Kong, S.; Yan, Y.; Liu, H.; Wang, W.; Chen, K.; Yin, Y.; Zheng, H.; Wu, J.; Yao, L.; et al. Emission and Simulation of Primary Fine and Submicron Particles and Water-Soluble Ions from Domestic Coal Combustion in China. Atmos. Environ. 2020, 224, 117308. [Google Scholar] [CrossRef]
  28. Zhou, Q.; Zhang, L.L.; Yang, L.; Zhang, X.; Xing, W.L.; Hu, M.; Chen, B.; Han, C.; Toriba, A.; Hayakawa, K.; et al. Long-Term Variability of Inorganic Ions in TSP at a Remote Background Site in Japan (Wajima) from 2005 to 2015. Chemosphere 2021, 264, 128427. [Google Scholar] [CrossRef] [PubMed]
  29. Yang, L.; Zhang, L.L.; Zhang, H.; Zhou, Q.Y.; Zhang, X.; Xing, W.L.; Takami, A.; Sato, K.; Shimizu, A.; Yoshino, A.; et al. Comparative Analysis of PM2.5-Bound Polycyclic Aromatic Hydrocarbons (PAHS), Nitro-Pahs (NPAHS), and Water-Soluble Inorganic Ions (WSIIS) at Two Background Sites in Japan. Int. J. Environ. Res. Public Health 2020, 17, 8224. [Google Scholar] [CrossRef] [PubMed]
  30. Park, S.H.; Song, C.B.; Kim, M.C.; Kwon, S.B.; Lee, K.W. Study on Size Distribution of Total Aerosol and Water-Soluble Ions during an Asian Dust Storm Event at Jeju Island, Korea. Environ. Monit. Assess. 2004, 93, 157–183. [Google Scholar] [CrossRef] [PubMed]
  31. Liu, Q.; Liu, Y.; Zhao, Q.; Zhang, T.; Schauer, J.J. Increases in the Formation of Water Soluble Organic Nitrogen during Asian Dust Storm Episodes. Atmos. Res. 2021, 253, 105486. [Google Scholar] [CrossRef]
  32. Chen, S.-J.; Hsieh, L.-T.; Kao, M.-J.; Lin, W.-Y.; Huang, K.-L.; Lin, C.-C. Characteristics of Particles Sampled in Southern Taiwan during the Asian Dust Storm Periods in 2000 and 2001. Atmos. Environ. 2004, 38, 5925–5934. [Google Scholar] [CrossRef]
  33. Liu, C.; Ma, Q.; Liu, Y.; Ma, J.; He, H. Synergistic Reaction between SO2 and NO2 on Mineral Oxides: A Potential Formation Pathway of Sulfate Aerosol. Phys. Chem. Chem. Phys. 2012, 14, 1668–1676. [Google Scholar] [CrossRef]
  34. Japan Meteorological Agency. Available online: https://www.data.jma.go.jp/gmd/env/kosahp/kosa_table_1.html (accessed on 5 July 2022).
  35. Tang, N.; Hattori, T.; Taga, R.; Igarashi, K.; Yang, X.; Tamura, K.; Kakimoto, H.; Mishukov, V.F.; Toriba, A.; Kizu, R.; et al. Polycyclic Aromatic Hydrocarbons and Nitropolycyclic Aromatic Hydrocarbons in Urban Air Particulates and Their Relationship to Emission Sources in the Pan-Japan Sea Countries. Atmos. Environ. 2005, 39, 5817–5826. [Google Scholar] [CrossRef]
  36. Tang, N.; Sato, K.; Tokuda, T.; Tatematsu, M.; Hama, H.; Suematsu, C.; Kameda, T.; Toriba, A.; Hayakawa, K. Factors Affecting Atmospheric 1-, 2-Nitropyrenes and 2-Nitrofluoranthene in Winter at Noto Peninsula, a Remote Background Site, Japan. Chemosphere 2014, 107, 324–330. [Google Scholar] [CrossRef] [PubMed] [Green Version]
  37. Xing, W.L.; Yang, L.; Zhang, H.; Zhang, X.; Wang, Y.; Bai, P.C.; Zhang, L.L.; Hayakawa, K.; Nagao, S.; Tang, N. Variations in Traffic-Related Water-Soluble Inorganic Ions in PM2.5 in Kanazawa, Japan, after the Implementation of a New Vehicle Emission Regulation. Atmos. Pollut. Res. 2021, 12, 101233. [Google Scholar] [CrossRef]
  38. Zhang, L.L.; Zhang, X.; Xing, W.L.; Zhou, Q.Y.; Yang, L.; Nakatsubo, R.; Wei, Y.; Bi, J.; Shima, M.; Toriba, A.; et al. Natural Aeolian Dust Particles Have No Substantial Effect on Atmospheric Polycyclic Aromatic Hydrocarbons (PAHs): A Laboratory Study Based on Naphthalene. Environ. Pollut. 2020, 263, 114454. [Google Scholar] [CrossRef] [PubMed]
  39. Becagli, S.; Proposito, M.; Benassai, S.; Gragnani, R.; Magand, O.; Traversi, R.; Udisti, R. Spatial distribution of biogenic sulphur compounds (MSA, nssSO42–) in the northern Victoria Land–Dome C–Wilkes Land area, East Antarctica. Ann. Glaciol. 2005, 41, 23–31. [Google Scholar] [CrossRef] [Green Version]
  40. Kumar, A.; Sarin, M.M. Atmospheric Water-Soluble Constituents in Fine and Coarse Mode Aerosols from High-Altitude Site in Western India: Long-Range Transport and Seasonal Variability. Atmos. Environ. 2010, 44, 1245–1254. [Google Scholar] [CrossRef]
  41. AD-Net/GALION Data Center. Available online: https://www-lidar.nies.go.jp/AD-Net/ (accessed on 5 July 2022).
  42. Shimizu, A.; Nishizawa, T.; Jin, Y.; Kim, S.-W.; Wang, Z.; Batdorj, D.; Sugimoto, N. Evolution of a Lidar Network for Tropospheric Aerosol Detection in East Asia. Opt. Eng. 2017, 56, 031219. [Google Scholar] [CrossRef]
  43. Tan, S.-C.; Li, J.; Che, H.; Chen, B.; Wang, H. Transport of East Asian Dust Storms to the Marginal Seas of China and the Southern North Pacific in Spring 2010. Atmos. Environ. 2017, 148, 316–328. [Google Scholar] [CrossRef]
  44. Rasilo, T.; Hutchins, R.; Ruiz-González, C.; Giorgio, P. Transport and Transformation of Soil-Derived CO2, CH4 and DOC Sustain CO2 Supersaturation in Small Boreal Streams. Sci. Total Environ. 2017, 579, 902–912. [Google Scholar] [CrossRef]
  45. Ministry of Environment and Tourism of Mongolia. Available online: https://www.iqair.com/ (accessed on 5 July 2022).
  46. Air Quality Online Monitoring and Analysis Platform. Available online: https://www.aqistudy.cn/ (accessed on 5 July 2022).
  47. Natural Earth. Available online: https://earth.nullschool.net/ (accessed on 5 July 2022).
  48. Hong, Y.; Li, C.; Li, X.; Ma, Y.; Zhang, Y.; Zhou, D.; Wang, Y.; Liu, N.; Chang, X. Analysis of Compositional Variation and Source Characteristics of Water-Soluble Ions in PM2.5 during Several Winter-Haze Pollution Episodes in Shenyang, China. Atmosphere 2018, 9, 280. [Google Scholar] [CrossRef] [Green Version]
  49. Lin, Y.-C.; Zhang, Y.-L.; Song, W.; Yang, X.; Fan, M.-Y. Specific Sources of Health Risks Caused by Size-Resolved PM-Bound Metals in a Typical Coal-Burning City of Northern China during the Winter Haze Event. Sci. Total Environ. 2020, 734. [Google Scholar] [CrossRef] [PubMed]
  50. Zhang, X.; Tian, S.-S.; Liu, Y.-Y.; Zhao, X.-Y.; Yu, H.; Zhang, H.; Chen, L.; Wang, X.-H. Pollution Characteristics and Source Apportionment of PM2.5 in Heating and Non-Heating Periods in Shenyang. Huanjing Kexue/Environ. Sci. 2019, 40, 1062–1070. [Google Scholar] [CrossRef]
  51. Lee, H.; Kim, J.E.; Chun, Y. The Comparison of Two Severe Hwangsa (Asian Dust) Cases of Spring and Winter in Seoul, Korea. Asia-Pac. J. Atmos. Sci. 2013, 49, 49–56. [Google Scholar] [CrossRef]
  52. Pathak, R.K.; Wu, W.S.; Wang, T. Summertime PM2.5 Ionic Species in Four Major Cities of China: Nitrate Formation in an Ammonia-Deficient Atmosphere. Atmos. Chem. Phys. 2009, 9, 1711–1722. [Google Scholar] [CrossRef] [Green Version]
  53. Tang, N.; Hakamata, M.; Sato, K.; Okada, Y.; Yang, X.; Tatematsu, M.; Toriba, A.; Kameda, T.; Hayakawa, K. Atmospheric Behaviors of Polycyclic Aromatic Hydrocarbons at a Japanese Remote Background Site, Noto Peninsula, from 2004 to 2014. Atmos. Environ. 2015, 120, 144–151. [Google Scholar] [CrossRef] [Green Version]
  54. Lee, B.-K.; Lee, H.K.; Jun, N.-Y. Analysis of Regional and Temporal Characteristics of PM10 during an Asian Dust Episode in Korea. Chemosphere 2006, 63, 1106–1115. [Google Scholar] [CrossRef] [PubMed]
  55. Zhao, J.; Zhang, F.; Xu, Y.; Chen, J.; Yin, L.; Shang, X.; Xu, L. Chemical Characteristics of Particulate Matter during a Heavy Dust Episode in a Coastal City, Xiamen, 2010. Aerosol Air Qual. Res. 2011, 11, 300–309. [Google Scholar] [CrossRef]
  56. Cooper, J.A. Environmental Impact of Residential Wood Combustion Emissions and Its Implications. J. Air Pollut. Control. Assoc. 1980, 30, 855–861. [Google Scholar] [CrossRef]
  57. Carmichael, G.R.; Zhang, Y.; Chen, L.-L.; Hong, M.-S.; Ueda, H. Seasonal Variation of Aerosol Composition at Cheju Island, Korea. Atmos. Environ. 1996, 30, 2407–2416. [Google Scholar] [CrossRef]
  58. Udisti, R.; Bazzano, A.; Becagli, S.; Bolzacchini, E.; Caiazzo, L.; Cappelletti, D.; Ferrero, L.; Frosini, D.; Giardi, F.; Grotti, M.; et al. Sulfate source apportionment in the Ny-Ålesund (Svalbard Islands) Arctic aerosol. Rend. Fis. Acc. Lincei 2016, 27, 85–94. [Google Scholar] [CrossRef]
  59. Fu, J.; Wang, B.; Chen, Y.; Ma, Q. The Influence of Continental Air Masses on the Aerosols and Nutrients Deposition over the Western North Pacific. Atmos. Environ. 2018, 172, 1–11. [Google Scholar] [CrossRef]
  60. Sullivan, R.C.; Guazzotti, S.A.; Sodeman, D.A.; Prather, K.A. Direct Observations of the Atmospheric Processing of Asian Mineral Dust. Atmos. Chem. Phys. 2007, 7, 1213–1236. [Google Scholar] [CrossRef] [Green Version]
  61. Chou, C.C.-K.; Lee, C.T.; Yuan, C.S.; Hsu, W.C.; Lin, C.-Y.; Hsu, S.-C.; Liu, S.C. Implications of the Chemical Transformation of Asian Outflow Aerosols for the Long-Range Transport of Inorganic Nitrogen Species. Atmos. Environ. 2008, 42, 7508–7519. [Google Scholar] [CrossRef]
  62. Wang, G.H.; Cheng, C.L.; Huang, Y.; Tao, J.; Ren, Y.Q.; Wu, F.; Meng, J.J.; Li, J.J.; Cheng, Y.T.; Cao, J.J.; et al. Evolution of Aerosol Chemistry in Xi’an, Inland China, during the Dust Storm Period of 2013 – Part 1: Sources, Chemical Forms and Formation Mechanisms of Nitrate and Sulfate. Atmos. Chem. Phys. 2014, 14, 11571–11585. [Google Scholar] [CrossRef] [Green Version]
  63. Whitby, K.T. The Physical Characteristics of Sulfur Aerosols. Atmos. Environ. 1978, 12, 135–159. [Google Scholar] [CrossRef]
  64. Wang, G.-Z.; Ren, W.-H.; Yu, X.-N.; Hou, S.-Y.; Zhang, Y.-X. Characteristics and Sources of Water-Soluble Ion Pollution in PM2.5 in Winter in Shenyang. Huanjing Kexue/Environ. Sci. 2021, 42, 30–37. [Google Scholar] [CrossRef]
  65. Kim, Y.P.; Shim, S.-G.; Moon, K.C.; Hu, C.-G.; Kang, C.H.; Park, K.Y. Monitoring of Air Pollutants at Kosan, Cheju Island, Korea, during March-April 1994. J. Appl. Meteorol. 1998, 37, 1117–1126. [Google Scholar] [CrossRef]
  66. Pathak, R.K.; Yao, X.; Chan, C.K. Sampling Artifacts of Acidity and Ionic Species in PM2.5. Environ. Sci. Technol. 2004, 38, 254–259. [Google Scholar] [CrossRef]
  67. Pathak, R.K.; Chan, C.K. Inter-Particle and Gas-Particle Interactions in Sampling Artifacts of PM2.5 in Filter-Based Samplers. Atmos. Environ. 2005, 39, 1597–1607. [Google Scholar] [CrossRef]
  68. Zhang, X.; Zhao, X.; Ji, G.; Ying, R.; Shan, Y.; Lin, Y. Seasonal Variations and Source Apportionment of Water-Soluble Inorganic Ions in PM2.5 in Nanjing, a Megacity in Southeastern China. J. Atmos. Chem. 2019, 76, 73–88. [Google Scholar] [CrossRef]
  69. Finlayson-Pitts, B.J.; Wingen, L.M.; Sumner, A.L.; Syomin, D.; Ramazan, K.A. The Heterogeneous Hydrolysis of NO2 in Laboratory Systems and in Outdoor and Indoor Atmospheres: An Integrated Mechanism. Phys. Chem. Chem. Phys. 2003, 5, 223–242. [Google Scholar] [CrossRef] [Green Version]
  70. Anttila, T.; Kiendler-Scharr, A.; Tillmann, R.; Mentel, T.F. On the Reactive Uptake of Gaseous Compounds by Organic-Coated Aqueous Aerosols: Theoretical Analysis and Application to the Heterogeneous Hydrolysis of N2O5. J. Phys. Chem. A 2006, 110, 10435–10443. [Google Scholar] [CrossRef] [PubMed] [Green Version]
  71. Martinez, M.; Perner, D.; Hackenthal, E.-M.; Külzer, S.; Schütz, L. NO3 at Helgoland during the NORDEX Campaign in October 1996. J. Geophys. Res. Atmos. 2000, 105, 22685–22695. [Google Scholar] [CrossRef]
  72. Hallquist, M.; Stewart, D.J.; Stephenson, S.K.; Cox, R.A. Hydrolysis of N2O5 on Sub-Micron Sulfate Aerosols. Phys. Chem. Chem. Phys. 2003, 5, 3453–3463. [Google Scholar] [CrossRef]
  73. Hu, J.H.; Abbatt, J.P.D. Reaction Probabilities for N2O5 Hydrolysis on Sulfuric Acid and Ammonium Sulfate Aerosols at Room Temperature. J. Phys. Chem. A 1997, 101, 871–878. [Google Scholar] [CrossRef]
  74. Heim, E.W.; Dibb, J.; Scheuer, E.; Jost, P.C.; Nault, B.A.; Jimenez, J.L.; Peterson, D.; Knote, C.; Fenn, M.; Hair, J.; et al. Asian Dust Observed during KORUS-AQ Facilitates the Uptake and Incorporation of Soluble Pollutants during Transport to South Korea. Atmos. Environ. 2020, 224, 117305. [Google Scholar] [CrossRef]
Figure 1. Location of Kanazawa University Wajima Air Monitoring Station (KUWAMS; 37.4° N, 136.9° E) and Toyama Light Detection and Ranging Observatory (TLO; 36.70° N, 137.10° E) (used with permission. Google map: https://www.google.com/maps, accessed on 5 July 2022).
Atmosphere 13 01210 g001
Figure 2. Cluster mean backward trajectory analysis during AD1 (a) and AD2 (b) and the different colours represent different transport pathways.
Atmosphere 13 01210 g002
Figure 3. Concentration variations of TSP (a) and WSIIs (b) during the sampling period. D1 and. D2 are the sampling periods that contains the AD1 and AD2 events, respectively.
Atmosphere 13 01210 g003
Figure 4. The ratio of cation ions (CA) to anion ions (AN) (a) and neutralisation factor (b) during the sampling period. D1 and D2 are the sampling periods that contain the AD1 and AD2 events, respectively.
Atmosphere 13 01210 g004
Figure 5. Cluster mean backward trajectory analysis during AD events from 2010 to 2015, and the different colours represent different transport pathways.
Atmosphere 13 01210 g005
Figure 6. Linear regression of concentration of Na+ with concentration of Cl and NO3 (a) and concentration of Cl and nss-SO42− (b) during long-term observation from 2010 to 2015. ADN can be regard as similar to the situation of the AD2 event, ADP can be regarded as similar to the situation of the AD1 event.
Atmosphere 13 01210 g006
Figure 7. Secondary formation of nss-SO42−, NO3 and NH4+ during ADP and ADN during the long-term observation from 2010 to 2015. ADN can be regarded as similar to the situation of the AD2 event, ADP can be regard as similar to the situation of AD1.
Atmosphere 13 01210 g007
Figure 8. Linear regression of concentration of excess NH4+ and with concentration of NO3 during the long-term observation from 2010 to 2015. ADN can be regarded as similar to the situation of AD2; ADP can be regarded as similar to the situation of AD1.
Atmosphere 13 01210 g008
Publisher’s Note: MDPI stays neutral with regard to jurisdictional claims in published maps and institutional affiliations.

