Article

Abundance, Source Apportionment and Health Risk Assessment of Polycyclic Aromatic Hydrocarbons and Nitro-Polycyclic Aromatic Hydrocarbons in PM2.5 in the Urban Atmosphere of Singapore

1
Graduate School of Medical Sciences, Kanazawa University, Kanazawa 920-1192, Japan
2
School of Civil Engineering, Architecture and Environment, Hubei University of Technology, Wuhan 430068, China
3
Institute of Nature and Environmental Technology, Kanazawa University, Kanazawa 920-1192, Japan
4
Department of Biological Sciences/Yale-NUS College, National University of Singapore, Singapore 119077, Singapore
5
Collaborative Innovation Center on Forecast and Evaluation of Meteorological Disasters, Nanjing University of Information Science and Technology, Nanjing 210044, China
6
Key Laboratory of Cloud-Precipitation Physics and Severe Storms, Institute of Atmospheric Physics, Chinese Academy of Sciences, Beijing 100029, China
7
Institute of Carbon Neutrality, Qilu Zhongke, Jinan 250100, China
8
Graduate School of Biomedical Sciences, Nagasaki University, 1-14 Bunkyomachi, Nagasaki 852-8521, Japan
9
Institute of Medical, Pharmaceutical and Health Sciences, Kanazawa University, Kanazawa 920-1192, Japan
*
Author to whom correspondence should be addressed.
Atmosphere 2022, 13(9), 1420; https://doi.org/10.3390/atmos13091420
Submission received: 9 August 2022 / Revised: 26 August 2022 / Accepted: 31 August 2022 / Published: 2 September 2022

Abstract

:
In this study, the levels of fine particulate matter (PM2.5), polycyclic aromatic hydrocarbons (PAHs) and nitro-PAHs (NPAHs) in PM2.5 samples were determined from 2020 to 2021 in Singapore. For analysis convenience, the sampling period was classified according to two monsoon periods and the inter-monsoon period. Considering Singapore’s typically tropical monsoon climate, the four seasons were divided into the northeast monsoon season (NE), southwest monsoon season (SW), presouthwest monsoon season (PSW) and prenortheast monsoon season (PNE)). The PM2.5 concentration reached 17.1 ± 8.38 μg/m3, which was slightly higher than that in 2015, and the average PAH concentration continuously declined during the sampling period compared to that reported in previous studies in 2006 and 2015. This is the first report of NPAHs in Singapore indicating a concentration of 13.1 ± 10.7 pg/m3. The seasonal variation in the PAH and NPAH concentrations in PM2.5 did not obviously differ owing to the unique geographical location and almost uniform climate changes in Singapore. Diagnostic ratios revealed that PAHs and NPAHs mainly originated from local vehicle emissions during all seasons. 2-Nitropyrene (2-NP) and 2-nitrofluoranthene (2-NFR) in Singapore were mainly formed under the daytime OH-initiated reaction pathway. Combined with airmass backward trajectory analysis, the Indonesia air mass could have influenced Singapore’s air pollution levels in PSW. However, these survey results showed that no effect was found on the concentrations of PAHs and NPAHs in PM2.5 in Indonesia during SW because of Indonesia’s efforts in the environment. It is worth noting that air masses from southern China could impact the PAH and NPAH concentrations according to long-range transportation during the NE. The results of the total incremental lifetime cancer risk (ILCR) via three exposure routes (ingestion, inhalation and dermal absorption) for males and females during the four seasons indicated a low long-term potential carcinogenic risk, with values ranging from 10−10 to 10−7. This study systematically explains the latest pollution conditions, sources, and potential health risks in Singapore, and comprehensively analyses the impact of the tropical monsoon system on air pollution in Singapore, providing a new perspective on the transmission mechanism of global air pollution.

1. Introduction

Among air pollutants, fine particulate matter (PM2.5: diameter < 2.5 μm) negatively affects human health and is closely related to human respiratory diseases [1]. In recent years, a network for continuous PM2.5 monitoring has been established worldwide, and policies have been continuously formulated to improve PM2.5 pollution reduction [2]. Following this growing recognition, PM2.5, which contains a large number of toxic substances, is easily transported by wind and can persist in the atmosphere for extended periods due to its small size [3,4]. Polycyclic aromatic hydrocarbons (PAHs) have received much attention as the most carcinogenic and mutagenic substances in PM2.5 [5,6,7]. PAHs represent a group of aromatic hydrocarbons with two or more fused benzene rings and are considered ubiquitous atmospheric contaminants [8,9]. Most PAHs are persistent organic pollutants (POPs) in the environment due to their hydrophobicity and chemical inertness [10,11,12]. However, PAHs can react with ozone and hydroxyl radicals to form a series of PAH derivatives [13,14]. Among these PAH derivatives, nitro-PAHs (NPAHs) have received global attention due to their higher mutagenicity and genotoxicity [15,16,17].
Southeast Asia remains among the most air polluted regions globally according to the annual update of the Air Quality Life Index in 2022 [18]. This is the result of the reliance on coal for power generation and vegetation fires to support “slash-and-burn” farming methods across Southeast Asia [19,20]. Moreover, South Asia monsoons can transport haze throughout most of the Association of Southeast Asian Nations (ASEAN) countries, including Singapore, Indonesia, Malaysia, Brunei, Thailand, and the Philippines [21]. In addition, the unique climatic conditions in recent years have further exacerbated the haze severity in affected countries, such as the dry weather conditions attributable to the El Niño-Southern Oscillation and positive Indian Ocean dipole during the southwest monsoon season (SW) [22,23]. Therefore, the near-catastrophic extent of seasonal haze episodes prompted the ASEAN Agreement on Transboundary Haze Pollution (AATHP) in 2002 [24,25]. Unfortunately, during the repeated severe air pollution events in Southeast Asia in 2013 and 2019, the pollutant level exceeded 200 μg/m3, especially PM2.5 [26,27]. Several studies have found that these seasonal haze episodes in an acute setting contribute to worsening asthma problems and other respiratory-related symptoms [28,29,30,31]. In addition, studies have consistently reported increased short-term respiratory morbidity and mortality levels due to seasonal exposure to smoke originating from episodic wildfires [32]. Among ASEAN countries, Singapore has experienced smoke haze episodes almost every dry season since the late 1990s due to its geographical location. Singapore is a typical industrial country with a small land area and high population density bordering Malaysia to the north and is adjacent to Indonesia to the south. Several studies have been conducted encompassing short-term measurements of PAHs in Singapore, but the seasonal and yearly variations in PAHs remain poorly understood in this region [33,34,35,36].
In the present research, PM2.5 samples were collected in the urban environment of Singapore for more than one year. The objective of this study was to (1) better understand the pollution status of PM2.5, PAHs and NPAHs in a subtropical urban atmosphere, (2) analyze the seasonal variation and influencing factors of atmospheric transport, (3) explore the potential sources of PAHs and NAPHs in PM2.5, and (4) evaluate the potential health risks of PAHs and NPAHs in PM2.5. This study represents the first evaluation of the distribution of airborne PAHs and NPAHs during different seasons and an assessment of the potential health risks of PAHs and NPAHs in Singapore.

2. Materials and Methods

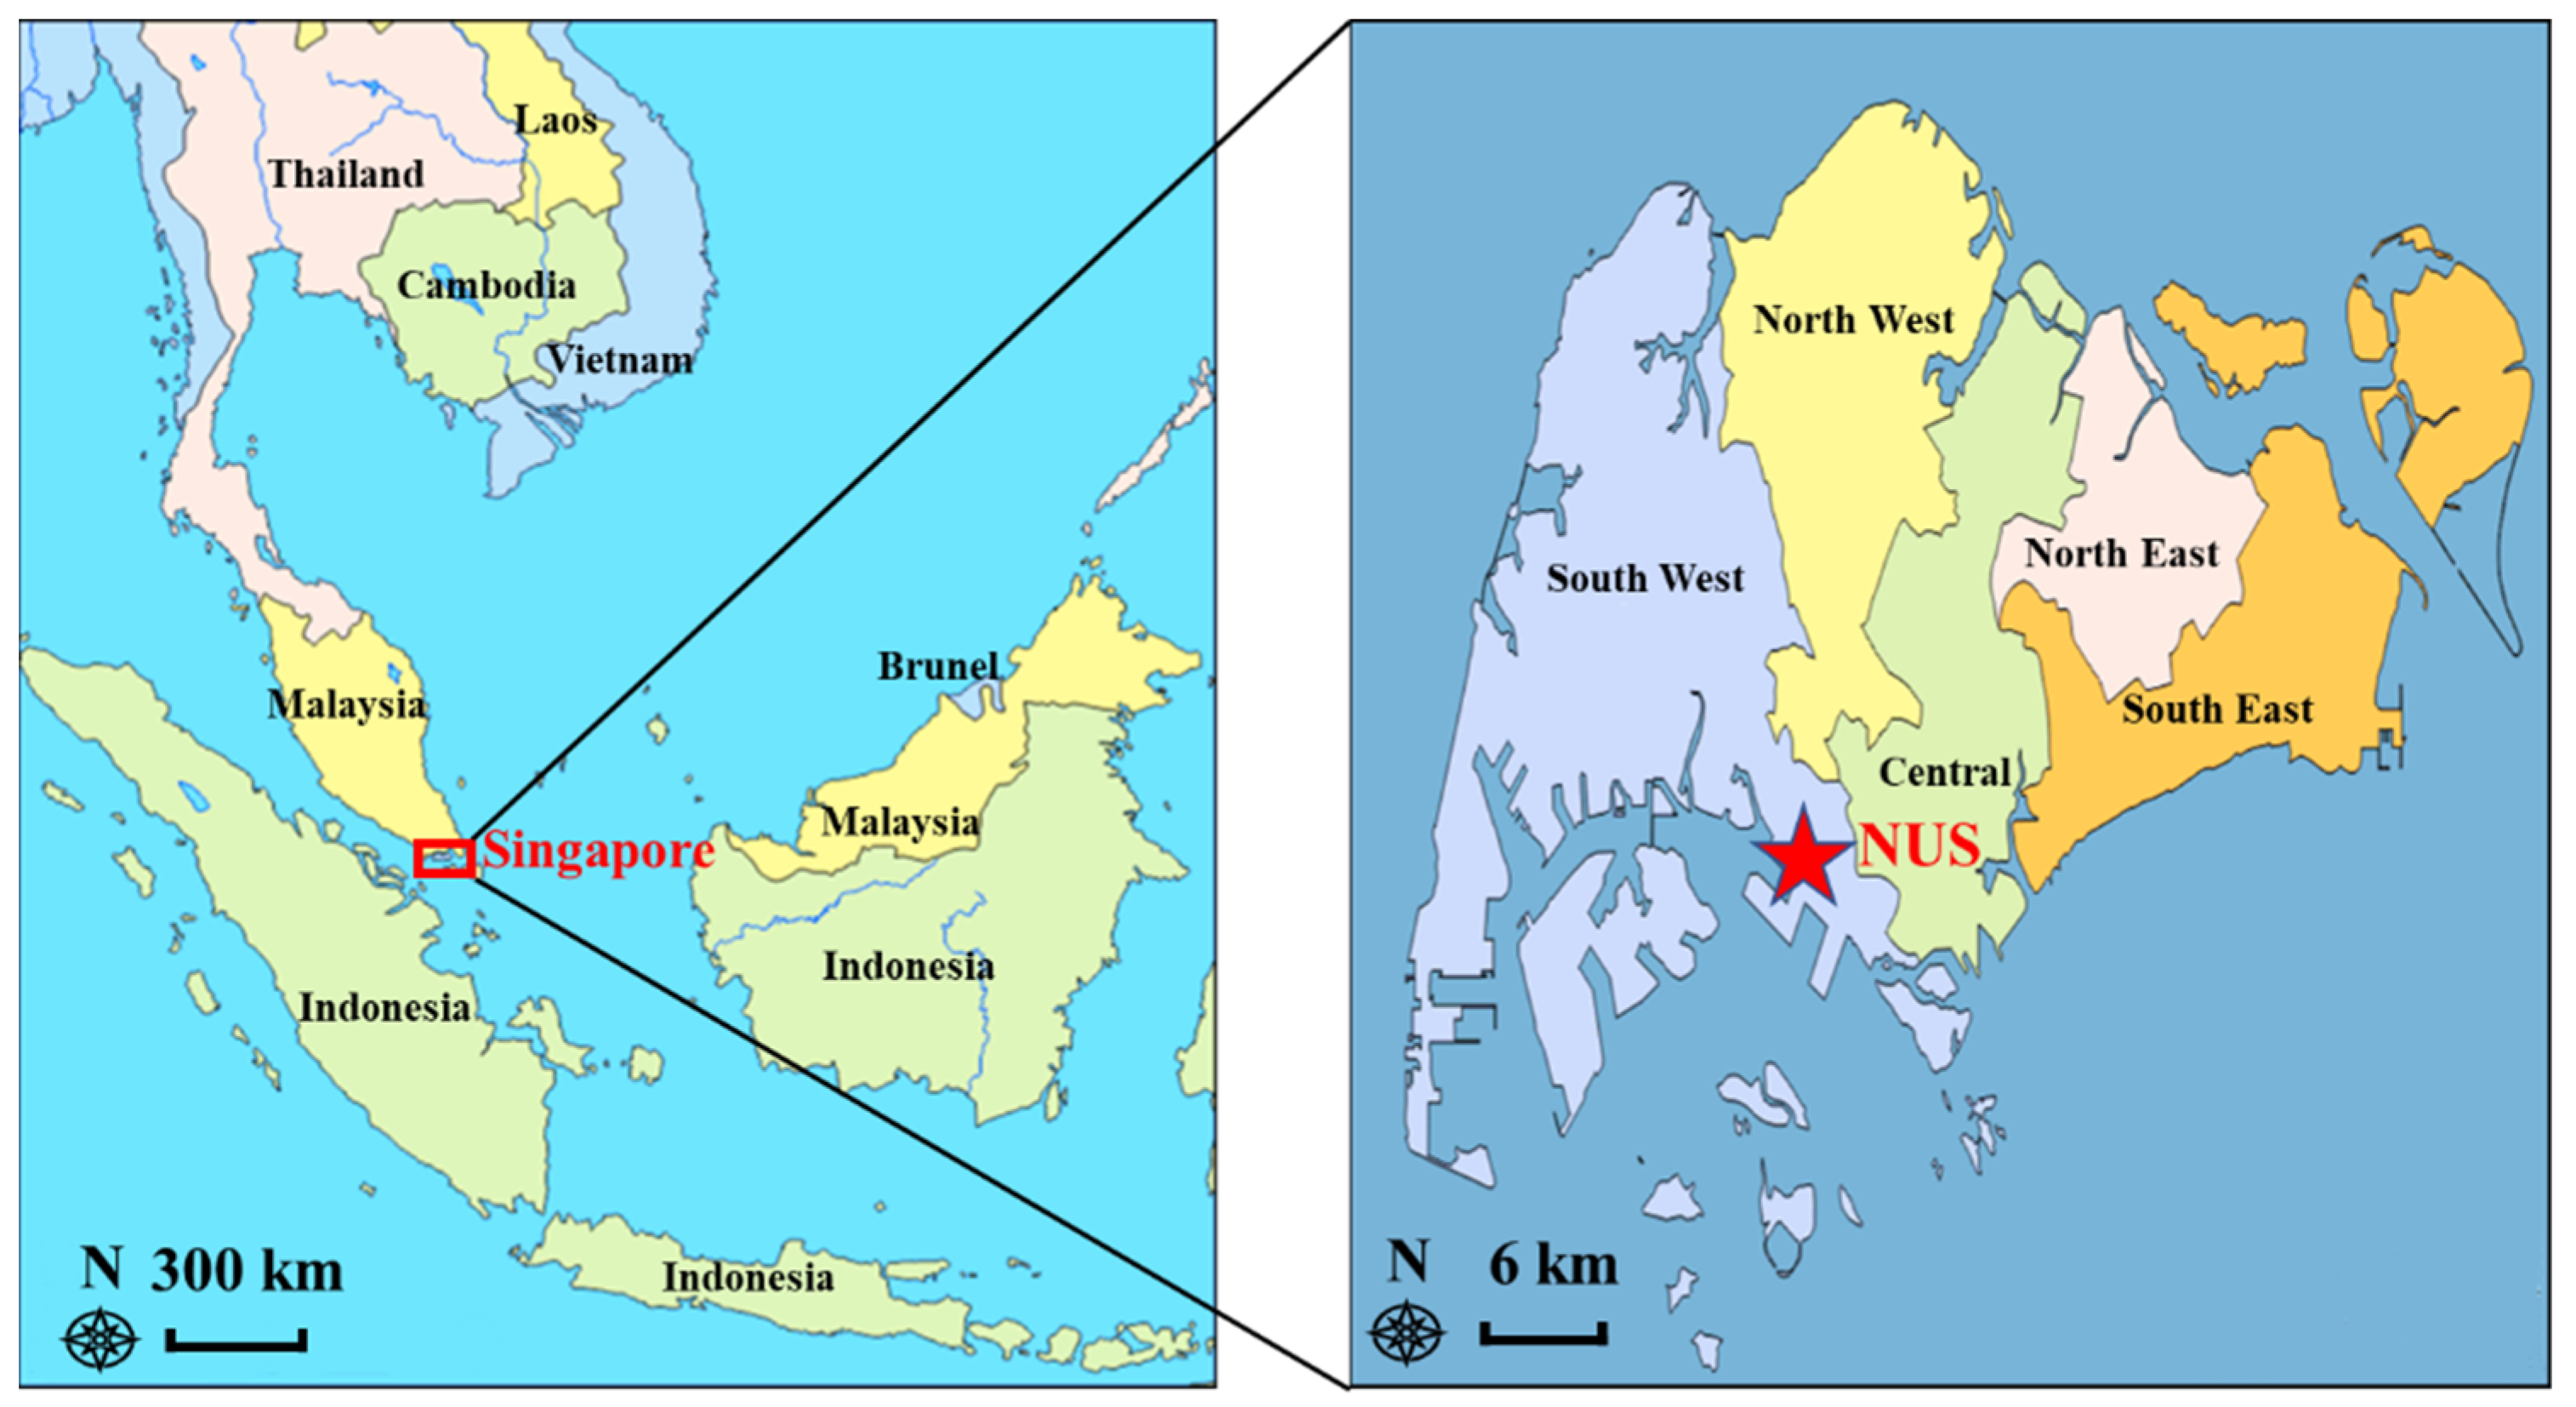
2.1. Sample Collection

Seventy-seven PM2.5 samples were collected from January 2020 to August 2021 on the National University of Singapore (NUS) campus which is located at a latitude of 1.29° N and longitude of 103.77° E, as shown in Figure 1. The island of Singapore is situated north of the equator, near Malaysia, Indonesia and southern China linking the Indian Ocean to the South China Sea. The northeast and southwest monsoons determine Singapore’s climate characteristics [37,38]. Due to the geographical location and typically tropical climate of Singapore, the four seasons were divided into: the northeast monsoon season (NE), SW, presouthwest monsoon season (PSW) and prenortheast monsoon season (PNE). In general, the NE lasts from December to March while the SW ranges from June to September. The PSW extends from April to May and the PNE occurs between October and November. Details the sampling period are provided in Table S1.
PM2.5 samples were collected using a high-volume air sampler (Sibata Sci. Tech. Ltd., Saitama, Japan) equipped with a quartz fiber filter (2500QAT-UP, Pallflex Products, Putnam, CT, USA) at an intake flow rate of 1000 L/min. PM2.5 samples were collected for a week at a month, and the filters were changed every 24 h. After sampling, the samples were stored in a desiccator for 48 h and then weighed. These samples were wrapped in aluminum foil and refrigerated at −20 °C until the samples were analyzed.

2.2. Materials and Sample Analysis

The pretreatment process, analytical procedure and quality control process were the same as those in our previous study [39,40]. In each PM2.5 sample, ten PAHs—fluoranthene (FR), pyrene (Pyr), benzo[a]anthracene (BaA), chrysene (Chr), benzo[b]fluoranthene (BbF), benzo[k]fluoranthene (BkF), benzo[a]pyrene (BaP), benzo[e]pyrene (BeP), benzo[ghi]perylene (BgPe), and indeno [1,2,3-cd]pyrene (IDP) (Supelco Park, Bellefonte, PA, USA)—and four NPAHs—2-NFR, 1-NPs, 2-NPs, and 6-nitrobenzo[a]pyrene (6-NBaP) (Chiron, Trondheim, Norway)—were analyzed with a high-performance liquid chromatography (HPLC) system with fluorescence detection (Shimadzu Inc., Kyoto, Japan). Two internal standards (Pyr-d10 and BaP-d12) were purchased from Wako Pure Chemicals (Osaka, Japan). All reagents were of analytical grade. Blank and standard samples were analyzed every seven samples to avoid cross-contamination and confirm the stability of the HPLC system.

2.3. Airmass Backwards Trajectory Analysis

The Hybrid Single-Particle Lagrangian Integrated Trajectory (HYSPLIT) model (HYSPLIT-4, Windows-based version, NOAA Air Resources Laboratory) developed by the National Oceanic and Atmospheric Administration (NOAA), was used to calculate backwards trajectories and obtain air mass routes during the sampling period [41,42]. Backwards trajectories were generated at 500 m above ground level to ensure that all trajectory started in the atmospheric boundary layer. Each backwards trajectory was calculated at hourly intervals and tracked for 96 h. In this study, cluster analysis of all backward trajectories was conducted based on the monsoon season and premonsoon season characteristics. The meteorological data used in the backwards trajectory calculation were retrieved from the National Centers for Environmental Prediction (NCEP) Global Data Assimilation System (GDAS, global, 2005-present). In addition, meteorological conditions (daily rainfall, mean temperature and mean wind speed) were obtained from the Changi Automatic Weather Observatory, Singapore (http://www.weather.gov.sg accessed on 25 July 2022).

2.4. Health Risk Assessment

The human health risk assessment process in this study considered various exposure pathways in the different environments where humans may be exposed to pollutants and may experience adverse effects. The exposure pathways included ingestion, dermal absorption and inhalation [43,44]. The populations considered included males and females exposed to pollutants in the atmospheric environment. The incremental lifetime cancer risk (ILCR) was assessed combined with the toxic equivalency factor (TEF) model [45,46].
The ILCR values for the ingestion, dermal absorption, and inhalation exposure routes and summation of the three risk forms (the total ILCR) were estimated as follows [47,48]:
R ing = C   ×   CSF ing   ×   BW 70 3   ×   IR ing   ×   EF   ×   ED BW   ×   AT   ×   10 6
R inh = C   ×   CSF inh   ×   BW 70 3   ×   IR inh   ×   EF   ×   ED BW × AT × PEF
R dem = C   ×   CSF dem   ×   BW 70 3   ×   SA   ×   AF   ×   ABS   ×   EF   ×   ED BW   ×   AT   ×   10 6
Total   ILCR = ILCR ing + ILCR inh + ILCR dem
where C is the sum of the toxic equivalent concentrations of the 16 individual PAHs in ng/m3 (C = TEQPAH), which can be calculated as follows [49]:
TEQ i = C i   ×   TEF i
TEQ total = TEQ i
where TEFi is the toxic equivalent of the individual PAHs as listed in Table S2 [50,51].
Ring, Rinh, and Rdem denote the risk values considering the ingestion, inhalation, and dermal absorption exposure routes, respectively. The carcinogenic slope factors (CSFs) of BaP were parameterized as 7.3, 25, and 3.85 (1/(mg/kg/day)) for ingestion (CSFing), inhalation (CSFinh), and dermal adsorption (CSFdem), respectively. Moreover, BW is the average body weight in kg. IRing is the intake rate under the ingestion exposure route in mg/day, EF is the annual exposure frequency in days/year, ED is the exposure duration in years, AT is the average life span in days, IRinh is the intake rate under the inhalation exposure route in mg/day, PEF is the particle emission factor in mg/kg, SA is the exposed area of skin in cm2, AF is the skin adherence factor in mg/cm2, and ABS is the skin absorption factor in day−1. Details of the parameters used are provided in Table S3 [52,53].

2.5. Statistical Analysis

In this study, the difference of PAH and NPAH concentrations in the PM2.5 samples during the different seasons was explored according to one-way ANOVA. The test results were expressed considering a 95% confidence interval. SPSS version 24.0 (IBM Corp., Armonk, NK, USA) was used for statistical analysis.

3. Results

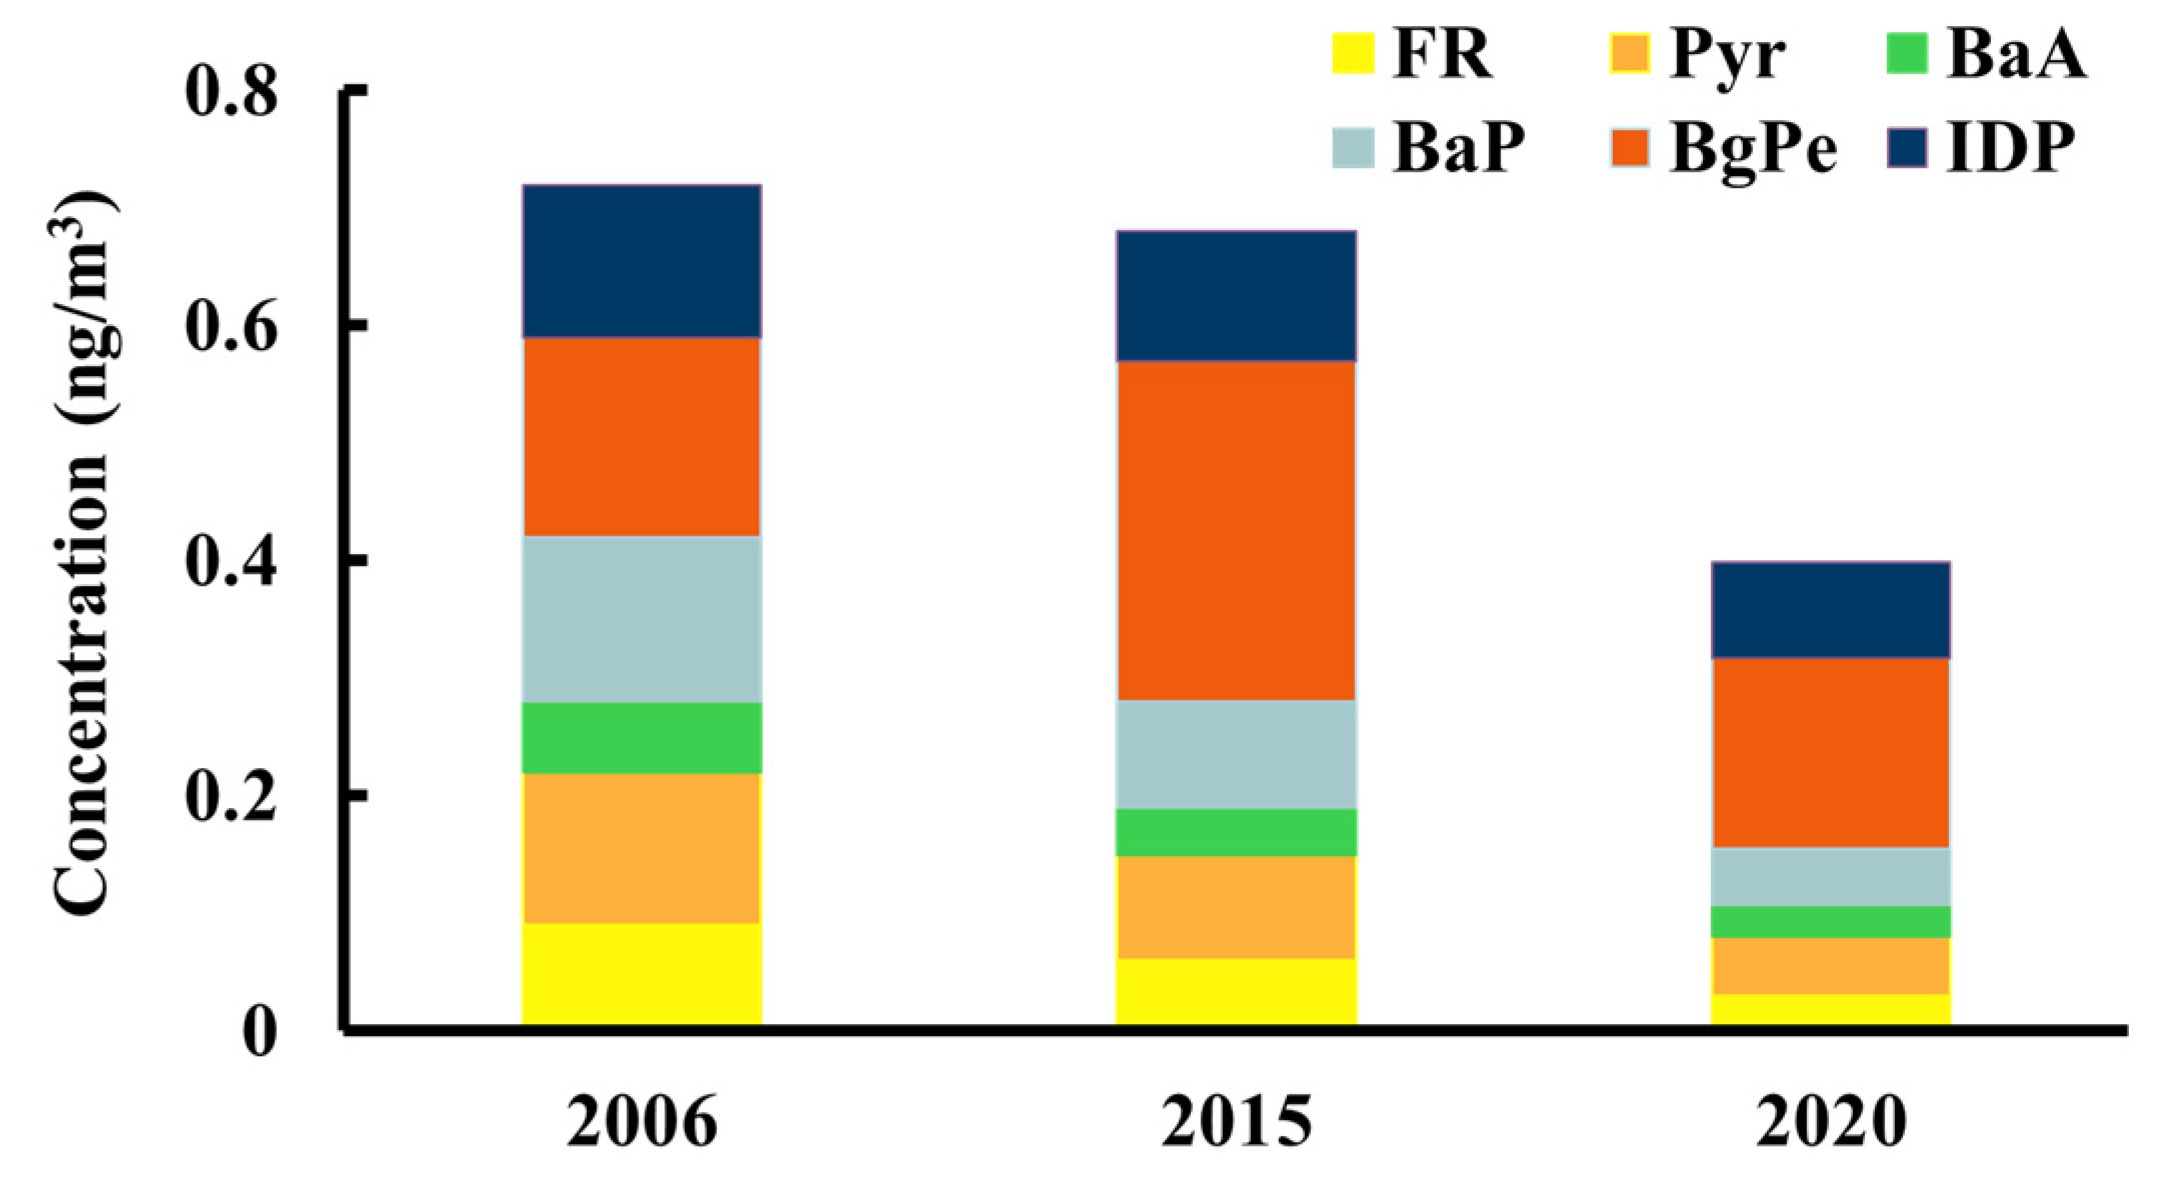
3.1. Distribution of PM2.5, PAHs and NPAHs

The PM2.5 concentration during the sampling period was 17.1 ± 8.38 μg/m3, which was higher than that at the same sampling location in 2015 (13.0 ± 2.73 μg/m3) [54]. Moreover, the average PM2.5 concentration in Singapore was slightly lower than that of Kuala Lumpur (19.3 μg/m3) in Malaysia [55], just half that of Jakarta (33.0 μg/m3) in Indonesia [56], and much lower than that of Hanoi (73.6 μg/m3) in Vietnam [57]. The PAH concentration was 0.62 ± 0.31 ng/m3, and the NAPHs concentration reached 13.2 ± 10.7 pg/m3, which is the first report on NPAHs in Singapore. It has been reported that the concentrations of 1-NP, 2-NP and 2-NFR in Singapore are slightly higher than those at background observatories (Noto Peninsula) but much lower than those in Beijing, Shenyang, and Vladivostok [58,59]. BgPe was the most abundant PAH (PSW: 26%, PNE: 24%, NE: 28%, SW: 23%), while 2-NFR was the most abundant NPAH (PSW: 62%, PNE: 36%, NE: 56%, SW: 40%). As shown in Figure 2, the six analyzed PAHs in PM.2.5 in previous studies were compared, and the average concentration was 0.72 ng/m3 in 2006 [50], 0.68 ng/m3 in 2015 [60], and 0.40 ng/m3 in 2020 (this study). Due to repeated seasonal haze over the past 20 years, especially after the 2015 Southeast Asian haze caused economic loss (SGD 1.46 billion) in Singapore [61], Singapore has introduced an environmental law on transboundary haze pollution, and imposed fines and penalties for foreign companies to create toxic smog that spread across Singapore, effectively curbing Indonesia’s forest fires [62]. Meanwhile, the PAH concentration had a sharp drop in 2020, which might explain why the introduction of Euro VI standards for vehicles in Singapore began on 1 September 2017 [63].
The seasonal concentrations of PM2.5, PAHs and NPAHs in PM2.5 are summarized in Table 1. The PM2.5 concentrations during the PNE and SW were 32.8 ± 7.34 μg/m3 and 19.8 ± 6.52 μg/m3, respectively, which are slightly higher than the air quality target of Singapore (12 μg/m3) and 3-fold higher than the World Health Organization (WHO) guideline value (5 μg/m3). The highest PAH concentration was observed during the PNE, and the lowest was observed during the PSW, where the PAH concentrations reached 0.77 ± 0.12 and 0.47 ± 0.12 ng/m3, respectively. In regard to NPAHs, the highest concentration was observed during the SW, and the lowest concentrations were observed during the PSW, at 15.5 ± 9.27 pg/m3 and 10.3 ± 10.0 pg/m3, respectively. However, according to one-way ANOVA results, the concentration values of PAHs (p = 0.22) and NAPHs (p = 0.64) in PM2.5 during the four seasons were not significant difference. This means that no significant change in the emission sources of PAHs and NPAHs during the survey period [35]. Meanwhile, almost uniform weather conditions throughout the sampling period, such as temperature, rainfall, and wind speed, were suggested to be another factor [64,65,66] (Table S4).

3.2. Main Sources of PAHs and NPAHs

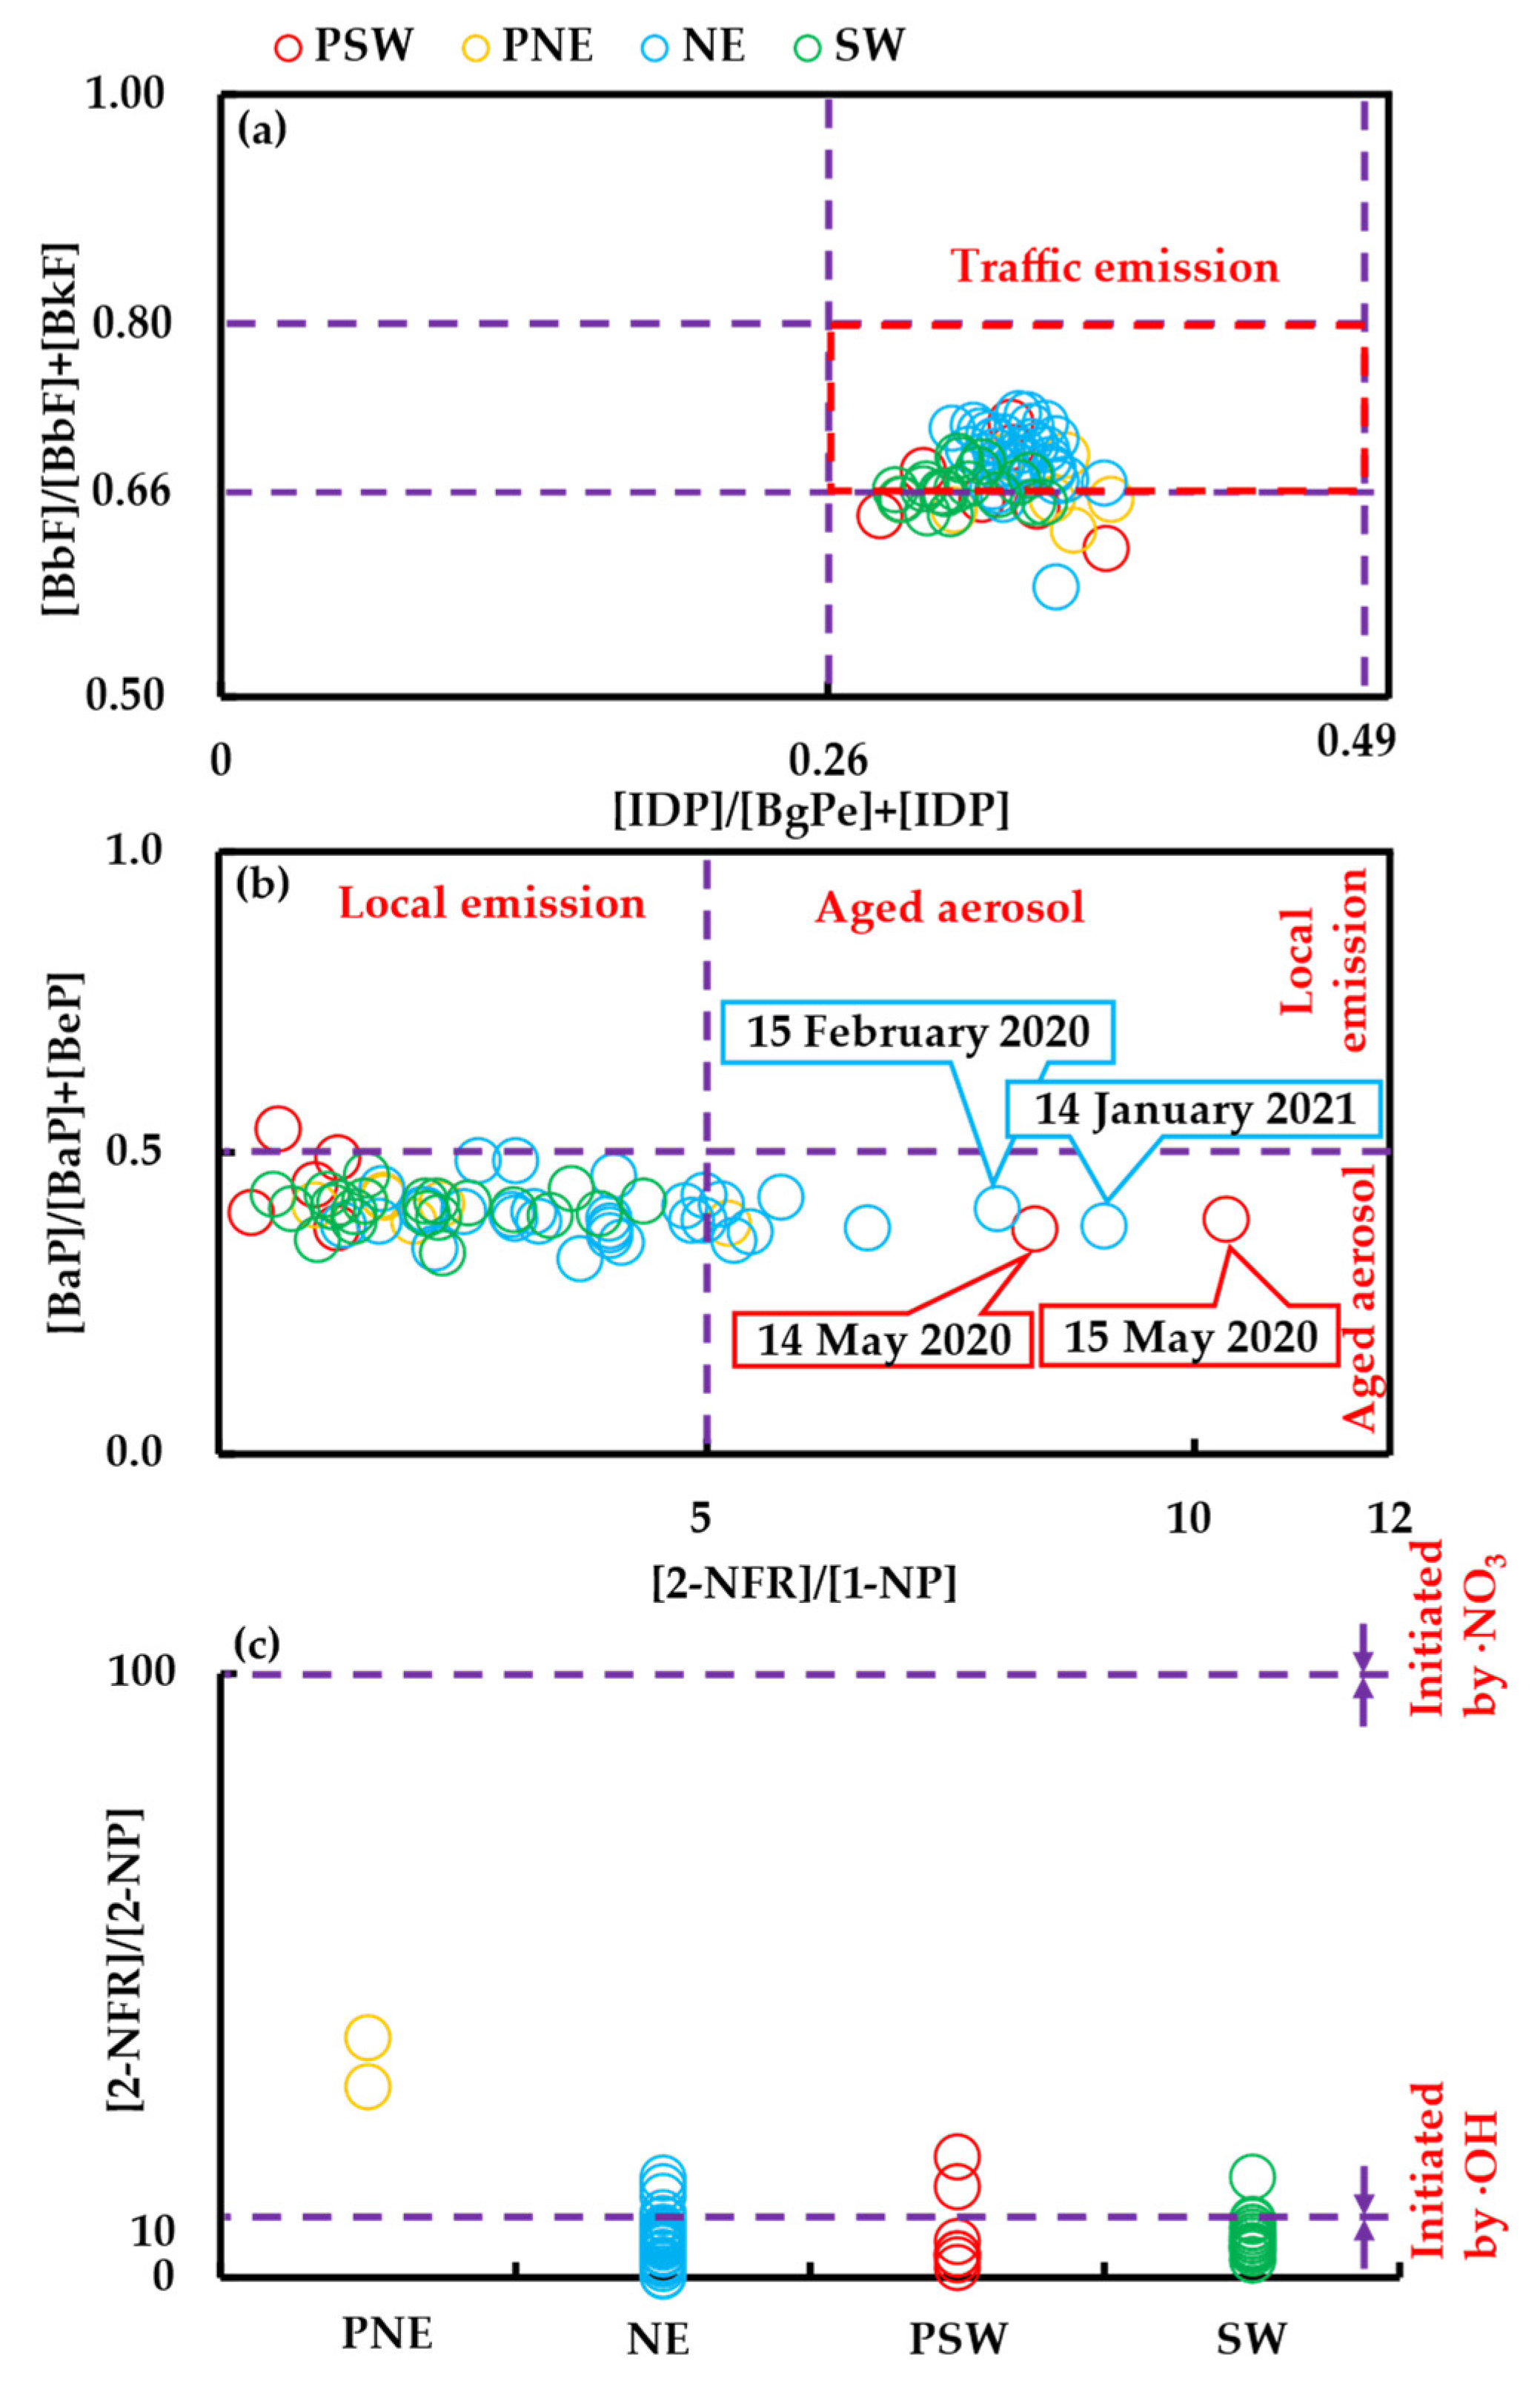
3.2.1. Diagnostic Ratios

Several source identification diagnostic ratios were applied in this research. The combination of the [BbF]/([BbF] + [BkF]) and [IDP]/([BgPe] + [IDP]) ratios was used to distinguish traffic or other sources of PAHs and NPAHs in PM2.5. Our previous research confirmed that these two diagnostic ratios can effectively discriminate the source of PAHs in the particle phase with high accuracy and independent of spatial and temporal distributions [39,67].
As shown in Figure 3a, most values of [BbF]/([BbF] + [BkF]) and [IDP]/([BgPe] + [IDP]) ranged from 0.66 to 0.81 and 0.26 to 0.49, respectively. These results indicated that traffic emissions were the main contributors to PAHs and NPAHs in PM2.5 in Singapore.
On the other hand, [BeP] and [BaP] are structural isomers but are known to significantly differ in terms of the photooxidation rate [68]. The atmospheric degradation of BaP is much faster than that of BeP during transportation due to its higher reactivity [69,70]. Regarding NPAHs, the [2-NFR]/[1-NP] ratio was also used to clarify local sources, in which 1-NP is usually considered to indicate direct emissions, while 2-NFR formed secondarily in the atmosphere via photochemical reactions of parent PAH (FR) [58,71,72]. [2-NFR]/[1-NP] ratio values less than 5 were typically observed at sites near primary emission sources according to a previous study [13,73,74]. Therefore, the values of [BaP]/([BaP] + [BeP]) and [2-NFR]/[1-NP] can generally suitably indicate aerosol ageing to speculate about local emissions and long-range transportation. The results for the [BaP]/([BaP] + [BeP]) and [2-NFR]/[1-NP] ratios are shown Figure 3b. Most of the [BeP]/([BaP] + [BeP]) values were close to 0.5, while most of the [2-NFR]/[1-NP] values were below 5. Local emissions were the main source of PAHs and NPAHs in PM2.5 in Singapore during the four monsoon seasons. However, as shown in Figure 3b, the values of several [2-NFR]/[1-NP] ratios were larger than 5, although their [BaP]/([BaP] + [BeP]) ratios were close to 0.5 (15 February 2020, 14 January 2021 and 14–15 May 2020). This suggested that aged aerosols coming from other areas may also influence atmospheric PAHs and NPAHs in Singapore depending on the day (for details, see Section 3.2.2).
The [2-NFR]/[2-NP] ratio is used to clarify the advantages of atmospheric reactions initiated by ·OH (close to 10) and NO3· (close to 100) radicals because 2-NP and 2-NFR are formed in the atmosphere mainly by the ·OH radical and NO3· radical pathways [58]. As shown in Figure 3c, the average [2-NFR]/[2-NP] ratios ranged from 0.27 to 39.8, which means that particle-phase 2-NP and 2-NFR in Singapore were mainly formed by the OH radical pathway, in agreement with previous studies [14,39,49].

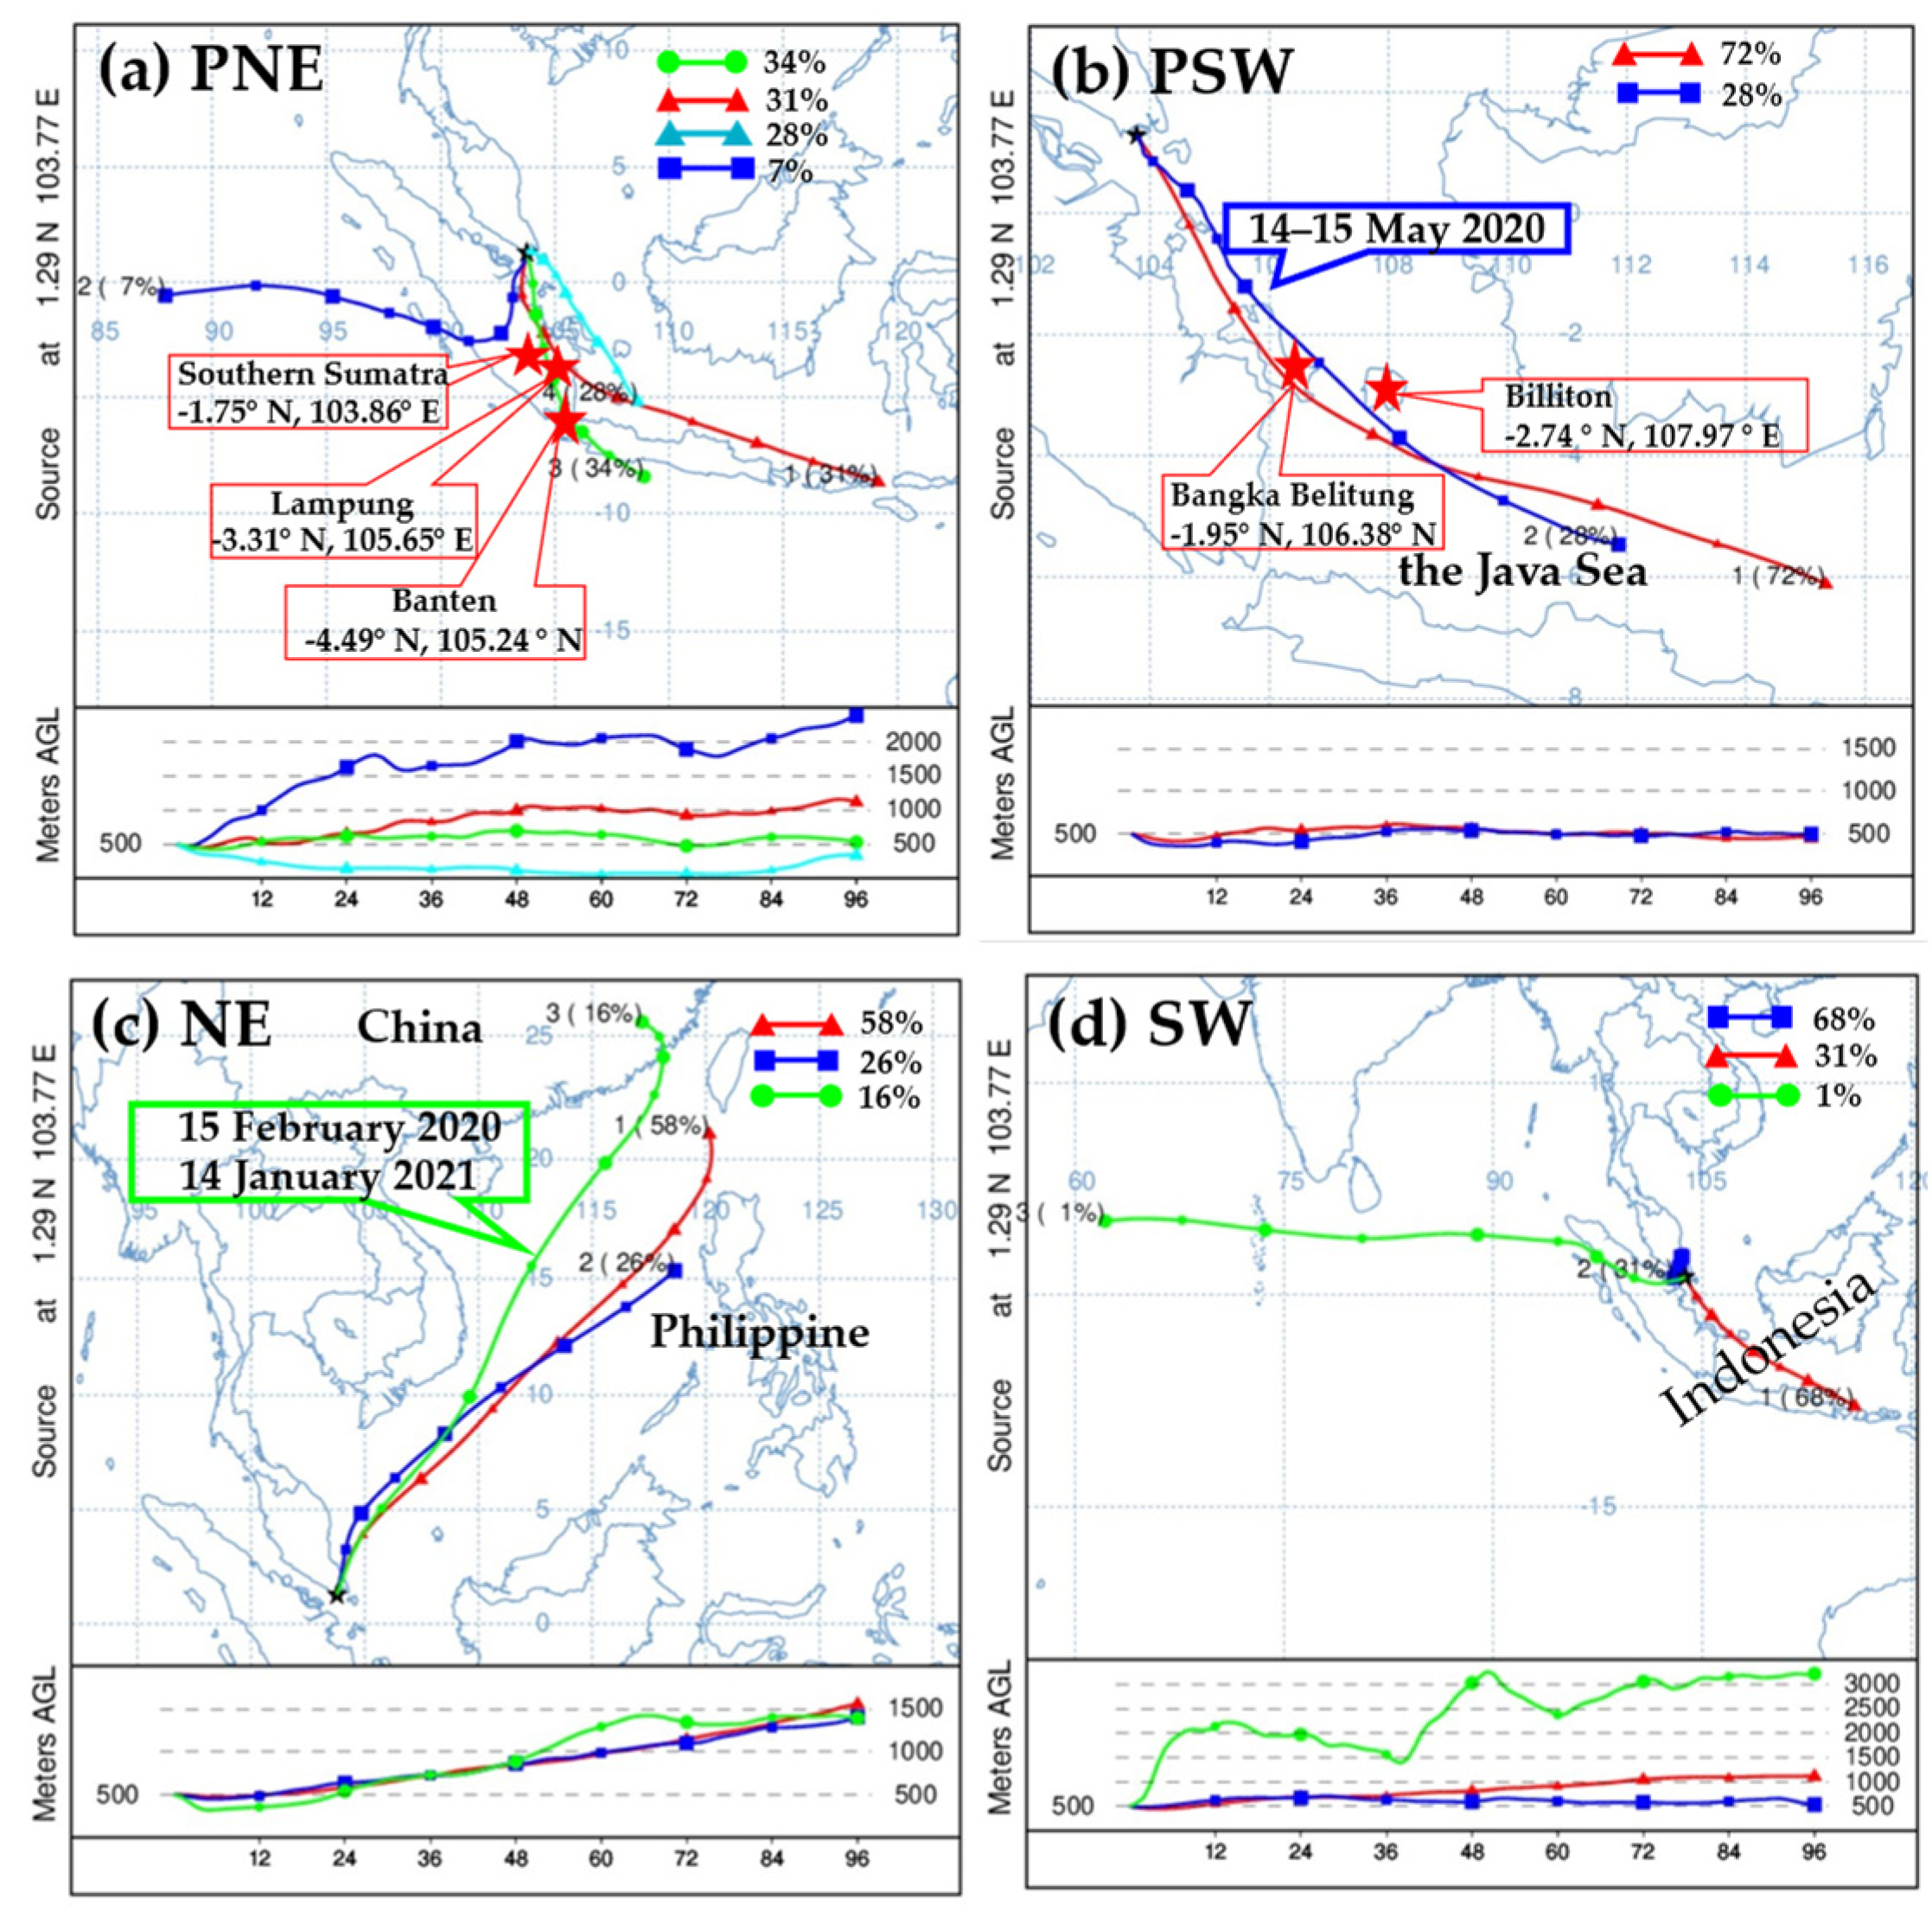
3.2.2. Airmass Backwards Trajectory Analysis

To explore possible emission sources for long-range transportation during the sampling period, 96 h backwards trajectories of the air masses arriving in Singapore during the different monsoon seasons are shown in Figure 4. During the PNE (Figure 4a) the air masses did not follow a dominant pathway and were partly terrestrial and oceanic in origin, originating from various directions. Thirty-four percent of the air masses originated from the northwest coast of Indonesia across Southern Sumatra province, Lampung province, Banten province, 31% of the air masses originated from Laut Sawu, part of the Pacific Ocean, and 28% of the air masses exhibited a loop trajectory with a low altitude. During PSW (Figure 4b), all air masses originated from the Java Sea and passed through the islands of Bangka Belitung Islands and Billiton Island. Most of the NE air masses were of continental origin; more than half of the air masses stemmed from southern China, such as Fujian Province, Guangdong Province or Taiwan Island/strait (82%); and 16% of the air masses originated from the Philippines (Figure 4c). Sixty-eight percent of the air masses received at the sampling site exhibited obvious Indonesian origin characteristics and thirty-one percent of the air masses originated from the local area during the SW (Figure 4d).
According to previous reports [33,35,75,76], haze usually occurs in Singapore during PNE, PSW and SW since land clearing activities in South Sumatra and Kalimantan in Indonesia. As we mentioned before, a series of active measures taken by the Singapore government to target cross-border pollution has led to a significant decrease in the number of forest fires in Indonesia. In this study, a few hotspots were observed in Indonesia during the PNE and SW as shown in satellite images (https://www.globalforestwatch.org/, accessed on 20 June 2022). This may be the reason why PM2.5, PAH and NPAH concentrations were slightly higher during PNE and SW than during PSW and NE.
Moreover, as mentioned earlier, the ratio of [2-NFR]/[1-NP] during the periods of 14–15 May 2020 (PSW) and 15 February 2020, and 14 January 2021 (NE) was above 5. Meanwhile, the PAH and NPAH concentrations were 0.68 and 29.08 pg/m3 (14 May 2020), 0.52 and 19.63 pg/m3 (15 May 2020), 0.36 and 9.6 pg/m3 (15 February 2020), and 0.57 and 5.87 pg/m3 (14 January 2021), respectively. These values were higher than most PAH and NPAH concentrations during the period, showing that transboundary pollution has an impact on Singapore’s airborne PAHs and NPAHs. As shown in Figure 4b,c, the air masses on 14–15 May 2020 originated from the Java Sea near Indonesia, while the air masses on 15 February 2020 and 14 January 2021 originated from southern China. Although this study could not prove that the air mass passed through the areas mentioned above during high pollution periods in these areas, it can be speculated that long-range transport has the potential to exacerbate air pollution in Singapore during PSW and NE periods.

3.3. Health Effects of PAHs and NPAHs

3.3.1. Toxic Equivalent Concentration Relative to BaP (TEQ)

In general, global-scale modelling and air quality monitoring rely on BaP as an indicator for risk assessment considering the total PAHs and derivatives of PAHs mixtures since BaP was proven to be the major contributor to the cancer risk of PAHs (40–80%) [77]. Some studies have proven that BaP to represent far less than 50% of the cancer risk [78], and the potential exposure risks of other PAHs and derivatives, for example, Dibenz[a,h]anthracene (DBA) [79] and dinitropyrenes (DNPs) [80] which TEFs are equal or higher than that of BaP cannot be ignored. However, these compounds have not been covered in this study. In this study, the ten PAHs and two NPAHs were evaluated, except 6-NBaP and 2-NP, due to the lack of corresponding TEF data. The obtained TEQ results for the total and individual PAHs and NPAHs during the four seasons are listed in Table 2. The total TEQ values of BaP varied between 0.01 and 0.26 pg/m3 during the four seasons. During the sampling period, the total TEQ concentration was much lower than the European Union standard (1 ng/m3), and the highest ILCR values were obtained for BaP, BbF, IDP, BkF and BaA in PM2.5, which can pose a high carcinogenic risk to human health [33,81,82]. In the future, regular monitoring of atmospheric PAHs is needed to detect changes, especially considering 4- to 6-ring PAHs.

3.3.2. ILCR Assessment

In the atmospheric environment, humans are exposed to PAH vapor or PAHs contained in particulate matter and dust, which pose a potential carcinogenic risk even at low doses. Many studies have reported that sources of human exposure to PAHs mainly include the inhalation of air (traffic, biomass burning and residential heating-related emissions), consumption of food and skin contact [83]. Laboratory studies suggest that NPAHs are highly toxic and can be up to 1000-fold more toxic than their respective parent compounds, which cannot be ignored [84]. In this study, the accumulated exposure risk for PAHs and NPAHs in PM2.5 through direct ingestion, dermal contact, and respiratory exposure could be quantitatively assessed with the ILCR model. An ILCR value below 10−6 is considered acceptable, while a value exceeding 10−4 indicates the need for risk reduction [77].
Table 3 reveals that the total ILCR values of PAHs and NPAHs under the three exposure routes exhibited the following seasonal characteristics: PNE (males: 7.44 × 10⁻⁷, females: 8.52 × 10⁻⁷) > SW (males: 3.52 × 10⁻⁷, females: 4.03 × 10⁻⁷) > NE (males: 2.92 × 10⁻⁷, females: 3.34 × 10⁻⁷) > PSW (males: 1.76 × 10⁻⁷, females: 2.01 × 10⁻⁷). The ILCR values obtained in this study ranged from 10−7 to 10−10, revealing a potentially low cancer risk concern among Singapore residents in regard to incremental lifetime exposure.

4. Conclusions

In this study, the abundance of PM2.5, PAHs and NPAHs in PM2.5 from 2020 to 2021 in Singapore was evaluated. To the best of our knowledge, this is the first report on atmospheric NPAHs in Singapore. Atmospheric yearly average concentrations of PM2.5 and PAHs were compared to historical data. The results indicated that the PM2.5 concentration in this area was not lower than that according to previous data over the past decade, while there was a significant decline in PAHs in the atmosphere. Singapore adopted Euro VI emission standards for petrol vehicles on 1 September 2017, which could reduce vehicular PAH emissions. PM2.5, PAHs and NPAHs exhibited no obvious seasonal characteristics based on comparison of the PM2.5, PAH and NPAH concentrations among the 4 seasons. In particular, the pollution level of PM2.5 during the four seasons was higher than the target value defined in WHO guidelines. By combining diagnostic ratios and airmass backwards trajectories, the results demonstrated that local traffic emissions constituted a major source of PAHs and NPAHs in Singapore. The [2-NFR]/[2-NP] ratios indicated that the daytime OH-initiated reaction was the dominant formation pathway for 2-NFR and 2-NP in Singapore. This study found that air masses from Indonesia might affect the PAH and NPAH concentrations in PM2.5 during PSW. In addition, the air masses from South China during NE might also have an impact on the PAH and NPAH concentrations in PM2.5 in Singapore. In addition, the ILCR values during the survey period remained well below the safe limit, indicating that the air quality in Singapore is suitable and that the long-term exposure hazard to residents is minimal. However, continued monitoring of transboundary haze is recommended.

Supplementary Materials

The following supporting information can be downloaded at: https://www.mdpi.com/article/10.3390/atmos13091420/s1, Table S1. Sampling periods and sample numbers; Table S2. Toxic equivalent factor (TEF) of PAHs and NPAHs; Table S3. Parameters used for the estimation of the incremental lifetime cancer risks (ILCRs); Table S4. Daily weather conditions in each sample in Singapore from 2020 to 2021.

Author Contributions

N.T. designed the sampling work and performed the PAH analyses for particulate matter; S.J.H., S.B.P., L.Z., H.Z., X.Z., Y.W. and P.B. collected samples and conducted monitoring work; Y.W. analyzed the PAHs; Y.W. and P.B. performed statistical analysis; A.T., B.C. and S.N. reviewed and commented during the creation process of this paper; Y.W. and N.T. wrote this paper. All authors have read and agreed to the published version of the manuscript.

Funding

This work was supported by the Bilateral Open Partnership Joint Research Projects of the Japan Society for the Promotion of Science, Japan (JPJSBP120219914); the CHOZEN Project of Kanazawa University, Japan; and the cooperative research programs of Institute of Nature and Environmental Technology, Kanazawa University, Japan.

Institutional Review Board Statement

Not applicable.

Informed Consent Statement

Not applicable.

Data Availability Statement

Data are contained within this article or supplementary material. The data presented in this study are available in Supplementary Material.

Acknowledgments

We thank the National Oceanic and Atmospheric Administration Air Resources Laboratory for providing the HYSPLIT 4 model (window-based). The authors acknowledge the Institute of Nature and Environmental Technology, Kanazawa University for the provision of the scientific data used in this publication (https://www.ki-net.kanazawa-u.ac.jp/EN/ accessed on 20 July 2022).

Conflicts of Interest

The authors declare no conflict of interest.

References

  1. Xing, Y.F.; Xu, Y.-H.; Shi, M.-H.; Lian, Y.-X. The Impact of PM2.5 on the Human Respiratory System. J. Thorac. Dis. 2016, 8, E69–E74. [Google Scholar] [CrossRef] [PubMed]
  2. World Bank. The Global Health Cost of PM2.5 Air Pollution: A Case for Action Beyond 2021; World Bank Publications: Washington, DC, USA, 2022; ISBN 978-1-4648-1816-5. [Google Scholar]
  3. Manisalidis, I.; Stavropoulou, E.; Stavropoulos, A.; Bezirtzoglou, E. Environmental and Health Impacts of Air Pollution: A Review. Front. Public Health 2020, 8, 14. [Google Scholar] [CrossRef] [PubMed]
  4. Jaffe, D.A.; O’Neill, S.M.; Larkin, N.K.; Holder, A.L.; Peterson, D.L.; Halofsky, J.E.; Rappold, A.G. Wildfire and Prescribed Burning Impacts on Air Quality in the United States. J. Air Waste Manag. Assoc. 2020, 70, 583–615. [Google Scholar] [CrossRef] [PubMed]
  5. Lara, S.; Villanueva, F.; Martín, P.; Salgado, S.; Moreno, A.; Sánchez-Verdú, P. Investigation of PAHs, Nitrated PAHs and Oxygenated PAHs in PM10 Urban Aerosols. A Comprehensive Data Analysis. Chemosphere 2022, 294, 133745. [Google Scholar] [CrossRef]
  6. Nowakowski, M.; Rykowska, I.; Wolski, R.; Andrzejewski, P. Polycyclic Aromatic Hydrocarbons (PAHs) and Their Derivatives (O-PAHs, N-PAHs, OH-PAHs): Determination in Suspended Particulate Matter (SPM)—A Review. Environ. Process. 2022, 9, 2. [Google Scholar] [CrossRef]
  7. Yang, L.; Tang, N.; Matsuki, A.; Takami, A.; Hatakeyama, S.; Kaneyasu, N.; Nagato, E.G.; Sato, K.; Yoshino, A.; Hayakawa, K. A Comparison of Particulate-Bound Polycyclic Aromatic Hydrocarbons Long-Range Transported from the Asian Continent to the Noto Peninsula and Fukue Island, Japan. Asian J. Atmos. Environ. 2018, 12, 369–376. [Google Scholar] [CrossRef]
  8. Abdel Shafy, H.I.; Mansour, M.S.M. A Review on Polycyclic Aromatic Hydrocarbons: Source, Environmental Impact, Effect on Human Health and Remediation. Egypt. J. Pet. 2016, 25, 107–123. [Google Scholar] [CrossRef]
  9. Zhang, L.L.; Yang, L.; Zhou, Q.Y.; Zhang, X.; Xing, W.L.; Wei, Y.; Hu, M.; Zhao, L.; Toriba, A.; Hayakawa, K.; et al. Size Distribution of Particulate Polycyclic Aromatic Hydrocarbons in Fresh Combustion Smoke and Ambient Air: A Review. J. Environ. Sci. 2020, 88, 370–384. [Google Scholar] [CrossRef]
  10. Farrington, J.; Takada, H. Persistent Organic Pollutants (POPs), Polycyclic Aromatic Hydrocarbons (PAHs), and Plastics: Examples of the Status, Trend, and Cycling of Organic Chemicals of Environmental Concern in the Ocean. Oceanography 2014, 27, 196–213. [Google Scholar] [CrossRef]
  11. Zhang, L.L.; Morisaki, H.; Wei, Y.; Li, Z.; Yang, L.; Zhou, Q.Y.; Zhang, X.; Xing, W.L.; Hu, M.; Shima, M.; et al. PM2.5-Bound Polycyclic Aromatic Hydrocarbons and Nitro-Polycyclic Aromatic Hydrocarbons inside and Outside a Primary School Classroom in Beijing: Concentration, Composition, and Inhalatshnion Cancer Risk. Sci. Total Environ. 2020, 705, 135840. [Google Scholar] [CrossRef]
  12. Zhang, H.; Zhang, X.; Wang, Y.; Bai, P.C.; Hayakawa, K.; Zhang, L.L.; Tang, N. Characteristics and Influencing Factors of Polycyclic Aromatic Hydrocarbons Emitted from Open Burning and Stove Burning of Biomass: A Brief Review. Int. J. Environ. Res. Public Health 2022, 19, 3944. [Google Scholar] [CrossRef] [PubMed]
  13. Nielsen, T.; Ramdahl, T.; Bjørseth, A. The Fate of Airborne Polycyclic Organic Matter. Environ. Health Perspect. 1983, 13, 103–114. [Google Scholar] [CrossRef] [PubMed]
  14. Keyte, I.J.; Roy, M. Harrison; Gerhard Lammel. Chemical reactivity and long-range transport potential of polycyclic aromatic hydrocarbons—A review. Chem. Soc. Rev. 2013, 42, 9333–9391. [Google Scholar] [CrossRef]
  15. Bolton, J.L.; Trush, M.A.; Penning, T.M.; Dryhurst, G.; Monks, T.J. Role of Quinones in Toxicology. Chem. Res. Toxicol. 2000, 13, 135–160. [Google Scholar] [CrossRef] [PubMed]
  16. Misaki, K.; Takamura-Enya, T.; Ogawa, H.; Takamori, K.; Yanagida, M. Tumour-Promoting Activity of Polycyclic Aromatic Hydrocarbons and Their Oxygenated or Nitrated Derivatives. Mutagenesis 2016, 31, 205–213. [Google Scholar] [CrossRef]
  17. Yang, L.; Zhang, L.L.; Zhang, H.; Zhou, Q.Y.; Zhang, X.; Xing, W.L.; Takami, A.; Sato, K.; Shimizu, A.; Yoshino, A.; et al. Comparative Analysis of PM2.5-Bound Polycyclic Aromatic Hydrocarbons (PAHs), Nitro-PAHs (NPAHs), and Water-Soluble Inorganic Ions (WSIIs) at Two Background Sites in Japan. Int. J. Environ. Res. Public Health 2020, 17, 8224. [Google Scholar] [CrossRef]
  18. Greenstone, M. Air Quality Life. Available online: https://aqli.epic.uchicago.edu/reports/ (accessed on 25 July 2022).
  19. Ketterings, Q.M.; Tri Wibowo, T.; van Noordwijk, M.; Penot, E. Farmers’ Perspectives on Slash-and-Burn as a Land Clearing Method for Small-Scale Rubber Producers in Sepunggur, Jambi Province, Sumatra, Indonesia. For. Ecol. Manag. 1999, 120, 157–169. [Google Scholar] [CrossRef]
  20. Page, S.E.; Hooijer, A. In the Line of Fire: The Peatlands of Southeast Asia. Philos. Trans. R. Soc. B 2016, 371, 20150176. [Google Scholar] [CrossRef]
  21. Chongsuvivatwong, V.; Phua, K.H.; Yap, M.T.; Pocock, N.S.; Hashim, J.H.; Chhem, R.; Wilopo, S.A.; Lopez, A.D. Health and Health-Care Systems in Southeast Asia: Diversity and Transitions. Lancet 2011, 377, 429–437. [Google Scholar] [CrossRef]
  22. Yuen, B.; Mainguy, G.; Kong, L. Climate Change and Urban Planning in Southeast Asia. SAPI EN. S. Surv. Perspect. Integr. Environ. Soc. 2009, 2, 3. [Google Scholar] [CrossRef]
  23. Lieberman, V.; Buckley, B. The Impact of Climate on Southeast Asia, circa 950–1820: New Findings. Mod. Asian Stud. 2012, 46, 1049–1096. [Google Scholar] [CrossRef]
  24. Heilmann, D. After Indonesia’s Ratification: The ASEAN Agreement on Transboundary Haze Pollution and Its Effectiveness as a Regional Environmental Governance Tool. J. Curr. Southeast Asian Aff. 2015, 34, 95–121. [Google Scholar] [CrossRef]
  25. Sunchindah, A. Transboundary Haze Pollution Problem in Southeast Asia: Reframing ASEAN’s Response. Available online: https://www.eria.org/publications/transboundary-haze-pollution-problem-in-southeast-asia-reframing-aseans-response/ (accessed on 25 July 2022).
  26. Velasco, E.; Rastan, S. Air Quality in Singapore during the 2013 Smoke-Haze Episode over the Strait of Malacca: Lessons Learned. Sustain. Cities Soc. 2015, 17, 122–131. [Google Scholar] [CrossRef]
  27. Niampradit, S.; Kliengchuay, W.; Mingkhwan, R.; Worakhunpiset, S.; Kiangkoo, N.; Sudsandee, S.; Hongthong, A.; Siriratruengsuk, W.; Muangsuwan, T.; Tantrakarnapa, K. The Elemental Characteristics and Human Health Risk of PM2.5 during Haze Episode and Non-Haze Episode in Chiang Rai Province, Thailand. Int. J. Environ. Res. Public Health 2022, 19, 6127. [Google Scholar] [CrossRef]
  28. Tchounwou, P. Environmental Research and Public Health. Int. J. Environ. Res. Public Health 2004, 1, 1–2. [Google Scholar] [CrossRef]
  29. Myatt, T.A.; Vincent, M.S.; Kobzik, L.; Naeher, L.P.; MacIntosh, D.L.; Suh, H. Markers of Inflammation in Alveolar Cells Exposed to Fine Particulate Matter from Prescribed Fires and Urban Air. J. Occup. Environ. Med. 2011, 53, 1110–1114. [Google Scholar] [CrossRef]
  30. Jacobson, L.d.S.V.; Hacon, S.d.S.; de Castro, H.A.; Ignotti, E.; Artaxo, P.; Ponce de Leon, A.C.M. Association between Fine Particulate Matter and the Peak Expiratory Flow of Schoolchildren in the Brazilian Subequatorial Amazon: A Panel Study. Environ. Res. 2012, 117, 27–35. [Google Scholar] [CrossRef] [PubMed]
  31. Ho, A.F.W.; Zheng, H.; De Silva, D.A.; Wah, W.; Earnest, A.; Pang, Y.H.; Xie, Z.; Pek, P.P.; Liu, N.; Ng, Y.Y.; et al. The Relationship Between Ambient Air Pollution and Acute Ischemic Stroke: A Time-Stratified Case-Crossover Study in a City-State with Seasonal Exposure to the Southeast Asian Haze Problem. Ann. Emerg. Med. 2018, 72, 591–601. [Google Scholar] [CrossRef] [PubMed]
  32. Xiang, H.; Mertz, K.J.; Arena, V.C.; Brink, L.L.; Xu, X.; Bi, Y.; Talbott, E.O. Estimation of Short-Term Effects of Air Pollution on Stroke Hospital Admissions in Wuhan, China. PLoS ONE 2013, 8, e61168. [Google Scholar] [CrossRef]
  33. Wei See, S.; Balasubramanian, R.; Sern Yang, T.; Karthikeyan, S. Assessing Exposure to Diesel Exhaust Particles: A Case Study. J. Toxicol. Environ. Health Part A 2006, 69, 1909–1925. [Google Scholar] [CrossRef]
  34. He, J.; Balasubramanian, R. Passive Sampling of Gaseous Persistent Organic Pollutants in The Atmosphere. Energy Procedia 2012, 16, 494–500. [Google Scholar] [CrossRef]
  35. Urbančok, D.; Payne, A.J.R.; Webster, R.D. Regional Transport, Source Apportionment and Health Impact of PM10 Bound Polycyclic Aromatic Hydrocarbons in Singapore’s Atmosphere. Environ. Pollut. 2017, 229, 984–993. [Google Scholar] [CrossRef] [PubMed]
  36. Lee, S.H.; Shen, J.; Tan, S.T.; Ng, L.C.; Fang, M.; Jia, S. Effects of Architecture Structure on Volatile Organic Compound and Polycyclic Aromatic Hydrocarbon Diffusion in Singapore’s Integrated Transport Hubs. Chemosphere 2022, 287, 132067. [Google Scholar] [CrossRef]
  37. Kraus, J.; Trihamdani, A.R.; Kubota, T.; Lee, H.S.; Kawamura, K. Interaction of Singapore and Johor Bahru on Urban Climate during Monsoon Seasons. In Proceedings of the ICUC9—9th International Conference on Urban Climate Jointly with 12th Symposium on the Urban Environment, Toulouse, France, 20–24 July 2015; Available online: http://www.meteo.fr/icuc9/LongAbstracts/poster_10-8-8641497_a.pdf (accessed on 25 July 2022).
  38. Li, X.; Zhang, K.; Babovic, V. Projections of Future Climate Change in Singapore Based on a Multi-Site Multivariate Downscaling Approach. Water 2019, 11, 2300. [Google Scholar] [CrossRef]
  39. Wang, Y.; Zhang, H.; Zhang, X.; Bai, P.C.; Neroda, A.; Mishukov, V.F.; Zhang, L.L.; Hayakawa, K.; Nagao, S.; Tang, N. PM-Bound Polycyclic Aromatic Hydrocarbons and Nitro-Polycyclic Aromatic Hydrocarbons in the Ambient Air of Vladivostok: Seasonal Variation, Sources, Health Risk Assessment and Long-Term Variability. Int. J. Environ. Res. Public Health 2022, 19, 2878. [Google Scholar] [CrossRef] [PubMed]
  40. Zhang, H.; Zhang, L.L.; Yang, L.; Zhou, Q.Y.; Zhang, X.; Xing, W.L.; Hayakawa, K.; Toriba, A.; Tang, N. Impact of COVID-19 Outbreak on the Long-Range Transport of Common Air Pollutants in KUWAMS. Chem. Pharm. Bull. 2021, 69, 237–245. [Google Scholar] [CrossRef]
  41. Yang, L.; Zhang, L.L.; Chen, L.; Han, C.; Akutagawa, T.; Endo, O.; Yamauchi, M.; Neroda, A.; Toriba, A.; Tang, N. Polycyclic Aromatic Hydrocarbons and Nitro-Polycyclic Aromatic Hydrocarbons in Five East Asian Cities: Seasonal Characteristics, Health Risks, and Yearly Variations. Environ. Pollut. 2021, 287, 117360. [Google Scholar] [CrossRef]
  42. Yang, L.; Zhang, X.; Xing, W.L.; Zhou, Q.Y.; Zhang, L.L.; Wu, Q.; Zhou, Z.; Chen, R.; Toriba, A.; Hayakawa, K.; et al. Yearly Variation in Characteristics and Health Risk of Polycyclic Aromatic Hydrocarbons and Nitro-PAHs in Urban Shanghai from 2010–2018. J. Environ. Sci. 2021, 99, 72–79. [Google Scholar] [CrossRef]
  43. Lao, J.Y.; Xie, S.-Y.; Wu, C.-C.; Bao, L.-J.; Tao, S.; Zeng, E.Y. Importance of Dermal Absorption of Polycyclic Aromatic Hydrocarbons Derived from Barbecue Fumes. Environ. Sci. Technol. 2018, 52, 8330–8338. [Google Scholar] [CrossRef]
  44. Gungormus, E.; Tuncel, S.; Hakan Tecer, L.; Sofuoglu, S.C. Inhalation and Dermal Exposure to Atmospheric Polycyclic Aromatic Hydrocarbons and Associated Carcinogenic Risks in a Relatively Small City. Ecotoxicol. Environ. Saf. 2014, 108, 106–113. [Google Scholar] [CrossRef] [Green Version]
  45. Yang, L.; Zhang, H.; Zhang, X.; Xing, W.L.; Wang, Y.; Bai, P.C.; Zhang, L.L.; Hayakawa, K.; Toriba, A.; Tang, N. Exposure to Atmospheric Particulate Matter-Bound Polycyclic Aromatic Hydrocarbons and Their Health Effects: A Review. Int. J. Environ. Res. Public Health 2021, 18, 2177. [Google Scholar] [CrossRef] [PubMed]
  46. Zhang, X.; Yang, L.; Zhang, H.; Xing, W.L.; Wang, Y.; Bai, P.C.; Zhang, L.L.; Hayakawa, K.; Toriba, A.; Wei, Y.; et al. Assessing Approaches of Human Inhalation Exposure to Polycyclic Aromatic Hydrocarbons: A Review. Int. J. Environ. Res. Public Health 2021, 18, 3124. [Google Scholar] [CrossRef] [PubMed]
  47. Goudarzi, G.; Baboli, Z.; Moslemnia, M.; Tobekhak, M.; Tahmasebi Birgani, Y.; Neisi, A.; Ghanemi, K.; Babaei, A.A.; Hashemzadeh, B.; Ahmadi Angali, K.; et al. Assessment of Incremental Lifetime Cancer Risks of Ambient Air PM10-Bound PAHs in Oil-Rich Cities of Iran. J. Environ. Health Sci. Eng. 2021, 19, 319–330. [Google Scholar] [CrossRef] [PubMed]
  48. Qin, N.; Tuerxunbieke, A.; Wang, Q.; Chen, X.; Hou, R.; Xu, X.; Liu, Y.; Xu, D.; Tao, S.; Duan, X. Key Factors for Improving the Carcinogenic Risk Assessment of PAH Inhalation Exposure by Monte Carlo Simulation. Int. J. Environ. Res. Public Health 2021, 18, 11106. [Google Scholar] [CrossRef]
  49. Zhang, H.; Yang, L.; Zhang, X.; Xing, W.L.; Wang, Y.; Bai, P.C.; Zhang, L.L.; Li, Y.; Hayakawa, K.; Toriba, A.; et al. Characteristics and Health Risks of Polycyclic Aromatic Hydrocarbons and Nitro-PAHs in Xinxiang, China in 2015 and 2017. Int. J. Environ. Res. Public Health 2021, 18, 3017. [Google Scholar] [CrossRef]
  50. EPA/600/R-11/052; U.S. EPA. 2010 U.S. Environmental Protection Agency (EPA) Decontamination Research and Development Conference. U.S. Environmental Protection Agency: Washington, DC, USA, 2011.
  51. Collins, J.F.; Brown, J.P.; Alexeeff, G.V.; Salmon, A.G. Potency equivalency factors for some polycyclic aromatic hydrocarbons and polycyclic aromatic hydrocarbon derivatives. Regul. Toxicol. Pharmacol. 1998, 28, 45–54. [Google Scholar] [CrossRef]
  52. Singapore Department of Statistics. Available online: https://www.singstat.gov.sg//media/files/standards_and_classifications/nsa.ashx (accessed on 21 July 2022).
  53. Panis, L.I.; De Geus, B.; Vandenbulcke, G.; Willems, H.; Degraeuwe, B.; Bleux, N.; Mishra, V.; Thomas, I.; Meeusen, R. Exposure to particulate matter in traffic: A comparison of cyclists and car passengers. Atmos. Environ. 2010, 44, 2263–2270. [Google Scholar] [CrossRef]
  54. Kalaiarasan, M.; Balasubramanian, R.; Cheong, K.W.D.; Tham, K.W. Particulate-Bound Polycyclic Aromatic Hydrocarbons in Naturally Ventilated Multi-Storey Residential Buildings of Singapore: Vertical Distribution and Potential Health Risks. Build. Environ. 2009, 44, 418–425. [Google Scholar] [CrossRef]
  55. Othman, M.; Latif, M.T. Air Pollution Impacts from COVID-19 Pandemic Control Strategies in Malaysia. J. Clean. Prod. 2021, 291, 125992. [Google Scholar] [CrossRef]
  56. Rendana, M.; Idris, W.M.R.; Rahim, S.A. Changes in Air Quality during and after Large-Scale Social Restriction Periods in Jakarta City, Indonesia. Acta Geophys. 2022, 2022, 1–9. [Google Scholar] [CrossRef]
  57. Nguyen, T.P.M.; Bui, T.H.; Nguyen, M.K.; Nguyen, T.H.; Vu, V.T.; Pham, H.L. Impact of Covid-19 Partial Lockdown on PM2.5, SO2, NO2, O3, and Trace Elements in PM2.5 in Hanoi, Vietnam. Environ. Sci. Pollut. Res. 2022, 29, 41875–41885. [Google Scholar] [CrossRef] [PubMed]
  58. Tang, N.; Sato, K.; Tokuda, T.; Tatematsu, M.; Hama, H.; Suematsu, C.; Kameda, T.; Toriba, A.; Hayakawa, K. Factors Affecting Atmospheric 1-, 2-Nitropyrenes and 2-Nitrofluoranthene in Winter at Noto Peninsula, a Remote Background Site, Japan. Chemosphere 2014, 107, 324–330. [Google Scholar] [CrossRef] [PubMed]
  59. Hayakawa, K.; Tang, N.; Nagato, E.; Toriba, A.; Lin, J.-M.; Zhao, L.; Zhou, Z.; Qing, W.; Yang, X.; Mishukov, V.; et al. Long-Term Trends in Urban Atmospheric Polycyclic Aromatic Hydrocarbons and Nitropolycyclic Aromatic Hydrocarbons: China, Russia, and Korea from 1999 to 2014. Int. J. Environ. Res. Public Health 2020, 17, 431. [Google Scholar] [CrossRef] [PubMed]
  60. Zhang, Z.H.; Khlystov, A.; Norford, L.K.; Tan, Z.-K.; Balasubramanian, R. Characterization of Traffic-Related Ambient Fine Particulate Matter (PM2.5) in an Asian City: Environmental and Health Implications. Atmos. Environ. 2017, 161, 132–143. [Google Scholar] [CrossRef]
  61. Quah, E.; Chia, W.-M.; Tan, T.-S. Economic Impact of 2015 Transboundary Haze on Singapore. J. Asian Econ. 2021, 75, 101329. [Google Scholar] [CrossRef]
  62. Chun, J.; Lye, L.H. Environmental Law in Singapore; Academy Publishing: Cambridge, MA, USA, 2019; pp. 118–120. [Google Scholar]
  63. National Environment Agency Switching Over to Higher Emission Standards to Reduce Harmful Vehicular Emissions. Available online: https://www.nea.gov.sg/our-services/pollution-control/air-pollution/air-pollution-regulations (accessed on 20 July 2022).
  64. Zhang, L.L.; Yang, L.; Zhang, H.; Zhou, Q.Y.; Zhang, X.; Xing, W.L.; Toriba, A.; Hayakawa, K.; Tang, N. Impact of the COVID-19 outbreak on the long-range transport of particulate PAHs in East Asia. Aerosol Air Qual. Res. 2020, 20, 2035–2046. [Google Scholar] [CrossRef]
  65. Zhang, X.; Zhang, L.L.; Yang, L.; Zhou, Q.Y.; Xing, W.L.; Toriba, A.; Hayakawa, K.; Wei, Y.J.; Tang, N. Characteristics of polycyclic aromatic hydrocarbons (PAHs) and common air pollutants at Wajima, a remote background site in Japan. Int. J. Environ. Res. Public Health 2020, 17, 957. [Google Scholar] [CrossRef]
  66. Yang, L.; Suzuki, G.; Zhang, L.L.; Zhou, Q.Y.; Zhang, X.; Xing, W.L.; Shima, M.; Yoda, Y.; Nakatsubo, R.; Hiraki, T.; et al. The characteristics of polycyclic aromatic hydrocarbons in different emission source areas in Shenyang, China. Int. J. Environ. Res. Public Health 2019, 16, 2817. [Google Scholar] [CrossRef]
  67. Xing, W.L.; Yang, L.; Zhang, H.; Zhang, X.; Wang, Y.; Bai, P.C.; Zhang, L.L.; Hayakawa, K.; Nagao, S.; Tang, N. Variations in Traffic-Related Polycyclic Aromatic Hydrocarbons in PM2.5 in Kanazawa, Japan, after the Implementation of a New Vehicle Emission Regulation. J. Environ. Sci. 2022, 121, 38–47. [Google Scholar] [CrossRef]
  68. Ishii, S.; Hisamatsu, Y.; Inazu, K.; Kobayashi, T.; Aika, K. Mutagenic Nitrated Benzo[a]Pyrene Derivatives in the Reaction Product of Benzo[a]Pyrene in NO2–Air in the Presence of O3 or under Photoirradiation. Chemosphere 2000, 41, 1809–1819. [Google Scholar] [CrossRef]
  69. Oliveira, C.; Martins, N.; Tavares, J.; Pio, C.; Cerqueira, M.; Matos, M.; Silva, H.; Oliveira, C.; Camões, F. Size Distribution of Polycyclic Aromatic Hydrocarbons in a Roadway Tunnel in Lisbon, Portugal. Chemosphere 2011, 83, 1588–1596. [Google Scholar] [CrossRef] [PubMed]
  70. Tanaka, N.; Sakata, M. Effect of Photooxidation on. DELTA.13C of Benzo(a)Pyrene and Benzo(e)Pyrene in the Atmosphere. Geochem. J. 2002, 36, 235–245. [Google Scholar] [CrossRef]
  71. Ciccioli, P.; Cecinato, A.; Brancaleoni, E.; Frattoni, M.; Zacchei, P.; Miguel, A.H.; de Castro Vasconcellos, P. Formation and transport of 2-nitrofluoranthene and 2-nitropyrene of photochemical origin in the troposphere. J. Geophys. Res. Atmos. 1996, 101, 19567–19581. [Google Scholar] [CrossRef]
  72. Araki, Y.; Tang, N.; Ohno, M.; Kameda, T.; Toriba, A.; Hayakawa, K. Analysis of Atmospheric Polycyclic Aromatic Hydrocarbons and Nitropolycyclic Aromatic Hydrocarbons in Gas/Particle Phases Separately Collected by a High-Volume Air Sampler Equipped with a Column Packed with XAD-4 Resin. J. Health Sci. 2009, 55, 77–85. [Google Scholar] [CrossRef]
  73. Bamford, H.; Baker, J.E. Nitro-polycyclic aromatic hydrocarbon concentrations and sources in urban and suburban atmospheres of the Mid-Atlantic region. Atmos. Environ. 2003, 37, 2077–2091. [Google Scholar] [CrossRef]
  74. Lammel, G.; Mulder, M.D.; Shahpoury, P.; Kukučka, P.; Lišková, H.; Přibylová, P.; Prokeš, R.; Wotawa, G. Nitro-Polycyclic Aromatic Hydrocarbons—Gas–Particle Partitioning, Mass Size Distribution, and Formation along Transport in Marine and Continental Background Air. Atmos. Chem. Phys. 2017, 17, 6257–6270. [Google Scholar] [CrossRef]
  75. He, J.; Zielinska, B.; Balasubramanian, R. Composition of Semi-Volatile Organic Compounds in the Urban Atmosphere of Singapore: Influence of Biomass Burning. Atmos. Chem. Phys. 2010, 10, 11401–11413. [Google Scholar] [CrossRef]
  76. He, J.; Balasubramanian, R. Semi-Volatile Organic Compounds (SVOCs) in Ambient Air and Rainwater in a Tropical Environment: Concentrations and Temporal and Seasonal Trends. Chemosphere 2010, 78, 742–751. [Google Scholar] [CrossRef]
  77. Zhang, J.; Wang, P.; Li, J.; Mendola, P.; Sherman, S.; Ying, Q. Estimating Population Exposure to Ambient Polycyclic Aromatic Hydrocarbon in the United States-Part II: Source Apportionment and Cancer Risk Assessment. Environ. Int. 2016, 97, 163–170. [Google Scholar] [CrossRef]
  78. Kelly, J.M.; Ivatt, P.D.; Evans, M.J.; Kroll, J.H.; Hrdina, A.I.H.; Kohale, I.N.; White, F.M.; Engelward, B.P.; Selin, N.E. Global Cancer Risk from Unregulated Polycyclic Aromatic Hydrocarbons. Geohealth 2021, 5, e2021GH000401. [Google Scholar] [CrossRef]
  79. Nisbet, I.C.; LaGoy, P.K. Toxic equivalency factors (TEFs) for polycyclic aromatic hydrocarbons (PAHs). Regul. Toxicol. Pharmacol. 1992, 16, 290–300. [Google Scholar] [CrossRef]
  80. Delistraty, D. Toxic equivalency factor approach for risk assessment of polycyclic aromatic hydrocarbons. Toxicol. Environ. Chem. 1997, 64, 81–108. [Google Scholar] [CrossRef]
  81. Polachova, A.; Gramblicka, T.; Parizek, O.; Sram, R.J.; Stupak, M.; Hajslova, J.; Pulkrabova, J. Estimation of Human Exposure to Polycyclic Aromatic Hydrocarbons (PAHs) Based on the Dietary and Outdoor Atmospheric Monitoring in the Czech Republic. Environ. Res. 2020, 182, 108977. [Google Scholar] [CrossRef]
  82. Zhang, L.L.; Morisaki, H.; Wei, Y.J.; Li, Z.G.; Yang, L.; Zhou, Q.Y.; Zhang, X.; Xing, W.L.; Hu, M.; Shima, M.; et al. Characteristics of air pollutants inside and outside a primary school classroom in Beijing and respiratory health impact on children. Environ. Pollut. 2019, 255, 113147. [Google Scholar] [CrossRef] [PubMed]
  83. Zhang, X.; Zhang, H.; Wang, Y.; Bai, P.B.; Zhang, L.L.; Wei, Y.; Tang, N. Personal PM2.5-bound PAH exposure and lung function in healthy office workers: A pilot study in Beijing and Baoding, China. J. Environ. Sci. 2022, in press. [Google Scholar] [CrossRef]
  84. Wislocki, P.G.; Bagan, E.S.; Lu, A.Y.; Dooley, K.L.; Fu, P.P.; Han-Hsu, H.; Beland, F.A.; Kadlubar, F.F. Tumorigenicity of nitrated derivatives of pyrene, benz[a]anthracene, chrysene and benzo[a]pyrene in the newborn mouse assay. Carcinogenesis 1986, 7, 1317–1322. [Google Scholar] [CrossRef] [PubMed]
Figure 1. The location of the sampling site (the original image comes from the open-source website: https://d-maps.com/index.php?lang=en, accessed on 17 July 2022).
Atmosphere 13 01420 g001
Figure 2. Concentration and composition changes of six PAHs in PM2.5 in Singapore in 2006, 2015 and 2020.
Atmosphere 13 01420 g002
Figure 3. The distribution of diagnostic ratios of PAHs and NPAHs in four monsoon seasons in Singapore: (a) The values of the [BbF]/([BbF] + [BkF]) and [IDP]/([BgPe] + [IDP]) ratios; (b) The values of [BaP]/([BaP] + [BeP]) and [2-NFR]/[1-NP] ratios; (c) the values of several [2-NFR]/[1-NP] ratio.
Atmosphere 13 01420 g003
Figure 4. The cluster analysis of 96 h airmass backwards trajectories in four different seasons: (a) backwards trajectories air masses in PNE; (b) backwards trajectories air masses in PSW; (c) backwards trajectories air masses in NE; (d) backwards trajectories air masses in SW.
Atmosphere 13 01420 g004
Table 1. The mean concentration and standard deviation of PM2.5, ten PAHs and four NPAHs in PM2.5 in Singapore from 2020 to 2021.
CompoundPNENEPSWSW
PM2.5 (μg/m3)32.8 ± 7.3411.4 ± 5.168.49 ± 3.2119.8 ± 6.52
FR0.04 ± 0.010.03 ± 0.010.02 ± 0.010.03 ± 0.01
Pyr0.06 ± 0.020.04 ± 0.020.04 ± 0.010.06 ± 0.03
BaA0.04 ± 0.010.02 ± 0.020.02 ± 0.010.04 ± 0.02
Chr0.08 ± 0.030.05 ± 0.040.04 ± 0.010.07 ± 0.03
BbF0.08 ± 0.020.07 ± 0.040.05 ± 0.020.07 ± 0.03
BkF0.04 ± 0.010.03 ± 0.020.02 ± 0.010.03 ± 0.01
BaP0.06 ± 0.010.04 ± 0.030.04 ± 0.010.06 ± 0.02
BeP0.09 ± 0.020.06 ± 0.040.05 ± 0.010.08 ± 0.03
BgPe0.18 ± 0.040.17 ± 0.110.12 ± 0.030.15 ± 0.06
IDP0.10 ± 0.030.09 ± 0.060.06 ± 0.020.07 ± 0.03
ΣPAHs (ng/m3)0.77 ± 0.120.61 ± 0.370.47 ± 0.120.65 ± 0.25
2-NFR4.22 ± 2.567.03 ± 6.366.43 ± 8.946.19 ± 4.59
1-NP3.34 ± 1.362.00 ± 2.361.86 ± 0.853.44 ± 2.63
2-NP0.11 ± 0.071.32 ± 1.680.60 ± 0.440.95 ± 0.66
6-NBaP4.27 ± 1.742.17 ± 2.661.41 ± 0.544.93 ± 2.66
ΣNPAHs (pg/m3)11.9 ± 4.0612.5 ± 12.510.3 ± 10.015.5 ± 9.27
Table 2. The concentration range of ten PAHs and two NPAHs (except 6-NBaP and 2-NP) with respect to the toxic equivalent factor.
NEPNEPSWSW
PAHs
(pg/m3)
FR0.01–0.060.03–0.050.02–0.030.01–0.07
Pyr0.02–0.120.04–0.080.03–0.050.03–0.12
BaA0.48–10.02.14–5.661.06–3.011.07–7.60
Chr0.11–1.880.43–1.090.25–0.540.20–1.34
BbF1.05–19.05.11–10.43.27–9.113.18–13.6
BkF0.73–8.862.58–5.091.48–3.771.65–5.83
BaP8.53–19648.1–75.320.6–57.427.1–105
BeP0.03–0.410.13–0.210.07–0.130.07–0.29
BgPe0.41–4.751.13–2.260.76–1.850.71–3.04
IDP2.25–25.14.64–13.43.25–9.473.68–14.3
ΣPAHs15.1–26371.1–10830.8–78.238.5–148
NPAHs
(pg/m3)
2-NFR0.02–0.270.02–0.070.01–0.220.01–0.17
1-NP0.02–1.030.15–0.530.11–0.340.07–0.94
ΣNPAHs0.02–1.310.17–0.530.12–0.490.08–0.99
Total(ng/m3)0.01–0.260.07–0.110.03–0.080.04–0.15
Table 3. ILCRs for three exposure routes in four seasons from 2020 to 2021 in Singapore.
PSWPNENESW
MaleFemaleMaleFemaleMaleFemaleMaleFemale
Ingestion1.44 × 10−71.65 × 10−76.92 × 10−77.92 × 10−72.55 × 10−72.91 × 10−73.07 × 10−73.51 × 10⁻⁷
Inhalation1.05 × 10−101.01 × 10−101.72 × 10−101.65 × 10−101.24 × 10−101.19 × 10−101.50 × 10−101.44 × 10⁻¹⁰
Dermal3.18 × 10−83.64 × 10−85.19 × 10−85.94 × 10−83.75 × 10−84.29 × 10−84.52 × 10−85.17 × 10⁻⁸
SUM1.76 × 10−72.01 × 10−77.44 × 10−78.52 × 10−72.92 × 10−73.34 × 10−73.52 × 10−74.03 × 10⁻⁷
Publisher’s Note: MDPI stays neutral with regard to jurisdictional claims in published maps and institutional affiliations.

