Article

Cross-Inventory Uncertainty Analysis of Fossil Fuel CO2 Emissions for Prefecture-Level Cities in Shandong Province

1
Carbon Neutrality Research Center, Institute of Atmospheric Physics, Chinese Academy of Sciences, Beijing 100029, China
2
Key Laboratory of Middle Atmosphere and Global Environment Observation, Institute of Atmospheric Physics, Chinese Academy of Sciences, Beijing 100029, China
3
University of Chinese Academy of Sciences, Beijing 100049, China
4
Shandong Air Traffic Management Sub-Bureau, Civil Aviation Administration of China, Jinan 250107, China
*
Author to whom correspondence should be addressed.
Atmosphere 2022, 13(9), 1474; https://doi.org/10.3390/atmos13091474
Submission received: 26 August 2022 / Accepted: 7 September 2022 / Published: 10 September 2022

Abstract

:
A series of carbon dioxide (CO2) emission inventories with high spatial resolutions covering China have been developed in the last decade, making it possible to assess not only the anthropogenic emissions of large administrational units (countries; provinces) but also those of small administrational units (cities; counties). In this study, we investigate three open-source gridded CO2 emission inventories (EDGAR; MEIC; PKU-CO2) and two statistical data-based inventories (CHRED; CEADs) covering the period of 2000–2020 for 16 prefecture-level cities in Shandong province in order to quantify the cross-inventory uncertainty and to discuss potential reasons for it. Despite ±20% differences in aggregated provincial emissions, all inventories agree that the emissions from Shandong increased by ~10% per year before 2012 and that the increasing trend slowed down after 2012, with a quasi-stationary industrial emission proportion being observed during 2008–2014. The cross-inventory discrepancies increased remarkably when downscaled to the city level. The relative differences between two individual inventories for half of the cities exceeded 100%. Despite close estimations of aggregated provincial emissions, the MEIC provides relatively high estimates for cities with complex and dynamic industrial systems, while the CHRED tends to provide high estimates for heavily industrial cities. The CHRED and MEIC show reasonable agreement regarding the evolution of city-level emissions and the city-level industrial emission ratios over 2005–2020. The PKU-CO2 and EDGAR failed to capture the emissions and their structural changes at the city level, which is related to their point-source database stopping updates after 2012. Our results suggest that cross-inventory differences for city-level emissions exist not only in their aggregated emissions but also in their changes over time.

1. Introduction

Based on the global consensus that fast-growing anthropogenic fossil fuel carbon dioxide (FFCO2; note that CO2 in this paper refers to FFCO2) emissions are the major driver of global warming [1], increasing nations have united to reduce emissions. China, as the lead emitter [2], has taken a series of actions towards climate change mitigation and emission reduction. Ahead of the national emission reduction targets, a CO2 emission estimate with high accuracy as well as a high spatial and temporal resolution is necessary for policy making. A series of gridded and monthly inventories have been rapidly developed in recent years for the design and evaluation of emission mitigation policies, not only on the national or provincial scales but also on smaller administrative scales (region and city). These global gridded emission inventories include global emission inventories such as the Emission Database for Global Atmospheric Research (EDGAR) [3] and the Peking University CO2 emission inventory (PKU-CO2) [4,5]. Both inventories use point-source statistics from the International Energy Agency (IEA). Aiming to achieve better estimates of China’s CO2 emissions, nationwide emission databases have been established, including gridded emission inventories such as the Multi-resolution Emission Inventory for China (MEIC) developed by Tsinghua University [6,7], the China High Resolution Emission Database (CHRED) [8,9], and the China Emission Accounts and Datasets (CEADs) [10,11,12]. The advantages of the nationwide emission inventories are the utilization of provincial-level data and realistic emission factors (EFs) as well as up-to-date point-source information. In particular, the CHRED uses unique enterprise-level point-source data and has been reported to make reliable estimates of city-level emissions [13].
Due to various methodologies, EFs and data sources, nonnegligible uncertainties of emission estimates have been reported, and moreover, the discrepancies are amplified when downscaling to smaller administrative units. Despite uncertainty levels within ± 10% seeming acceptable for global total CO2 emission estimates [14], the discrepancies of national emissions are as high as 50% [15,16] and are commonly within the range of ±25% for China.
Contributing ~70% of global CO2 emissions [17] and 85% of the emissions in China [18], city-level emission evaluation has received a great deal of attention. However, downscaling emission estimates to the city level is considered unreliable. The reported discrepancies among multi-inventories range from 5% to 300%, among which differences over 100% are not rare [13,19,20,21]. The suggested explanation for the significant differences between emission inventories varies with the considered inventories and the local features. Several studies have suggested that inventories based on international and national source data have pronounced biases when used for city-level estimates [13,20]. The delayed and poor point- and line-source information also leads to large differences as well as divergence between sectors and EFs [22].
Massive urbanization and industry upgrades are ongoing in China. More effort should be made to quantify, understand, and reduce the uncertainties among multi-inventories. In this study, we will focus on 16 prefecture-level cities in Shandong province, a heavy industry base that has contributed to the national CO2 emissions the most during the last two decades, with an accumulative contribution of 10.35% over 2000–2012, as quantified by previous research [18]. The characteristics of the cities in Shandong are quite diverse and include the service-based capital Jinan, high-tech and rapidly developing city of Qingdao, heavily industrial city of Zibo, energy-providing city of Dongying, and rural and light-industry city of Linyi [23].
Different from previous comparisons of city-level emission inventories [13], in this study, we assess the cross-inventory uncertainties not only from the perspective of provincial aggregated emissions (Section 3.1) and city-level aggregated emissions (Section 3.2) but also from the perspective of their time evolutions over the past two decades (Section 3.3). In addition to aggregated emissions, the corresponding emission structure, represented by the ratios of industry-related emissions to total emissions, is also analyzed. The results of this study may help us to explore the reasons for the discrepancies across inventories.

2. Materials and Methods

2.1. Emission Inventories

In this study, the annual CO2 emissions from four emission inventories are considered: the Multi-resolution Emission Inventory for China (MEIC) version 1.3; the Peking University CO2 emission inventory (PKU-CO2) version 2; the Emission Database for Global Atmospheric Research (EDGAR) version 6.0; and the China High Resolution Emission Database (CHRED). The provincial inventory of the China Emission Accounts and Datasets (CEADs) is also included for the assessment of provincial emissions.
The key information regarding these inventories is listed in Table 1 (adapted from official websites and Han et al. [13,24]).
In addition to the total CO2 emissions, we also investigate the evolution of industrial CO2 emission ratios, which are defined as the ratio of emissions from industrial energy consumption and from industrial processes (sum of these two referring to “industrial emissions” in the following) to the total emissions. The sector information from each inventory is used to calculate the industrial emissions. The industrial emission ratios are representative of the emission structure. Urbanization is usually accompanied by the growth of the population, transportation development, industrial upgrades, and a reduction in heavy-industrial enterprises. Therefore, the subsequent decrease in the industrial emission ratio (or the increase in the non-industrial emission ratio) is expected.
Note that different sectoral scopes and methodologies are applied to different inventories. The most important source of differences in industrial emissions is the point-source database, which the energy consumption information of power plants and industrial enterprises. More details regarding the sectoral scopes and methodologies are listed in the Supplementary Materials. We are aware that discrepancies in the absolute values of the industrial emission ratios are inevitable. We will focus on comparing its time evolutions, which should show consistency due to the remarkable changes in the emission structure over the last few decades.

2.2. Method

We first unified the annual emission units from all of the inventories to ton of CO2 per km2. Then, using prefecture-level administrative units data from the National Geomatics Center of China, we extracted the emission amounts within the city boundaries. For the grids on the boundary edges, the emission cells are weighted according to their grid area fractions intersected with the regional mask. Note that the prefecture city Laiwu was incorporated into Jinan in 2018, which reduced the previous number of prefecture-level cities in Shandong from 17 to 16 cities. In order to use consistent administrative division among all inventories, we applied up-to-date administrative divisions (16 prefecture-level cities) to all of the inventories.
Here, we used two quantities to represent the cross-inventory uncertainty. One was the relative standard deviation among all of the considered inventories. The other was the largest individual relative differences, i.e., 100% × ( e m a x e m i n ) / e m i n .
To quantify the relative differences for a specific inventory, the quantity 100% × ( e e r e f ) / e r e f was used. Following the cross-inventory comparison study by [13], we also took CHRED s1 as an emission reference ( e r e f ) based on city-level statistics and applied unique point sources, including over 1.5 million enterprises.

3. Results

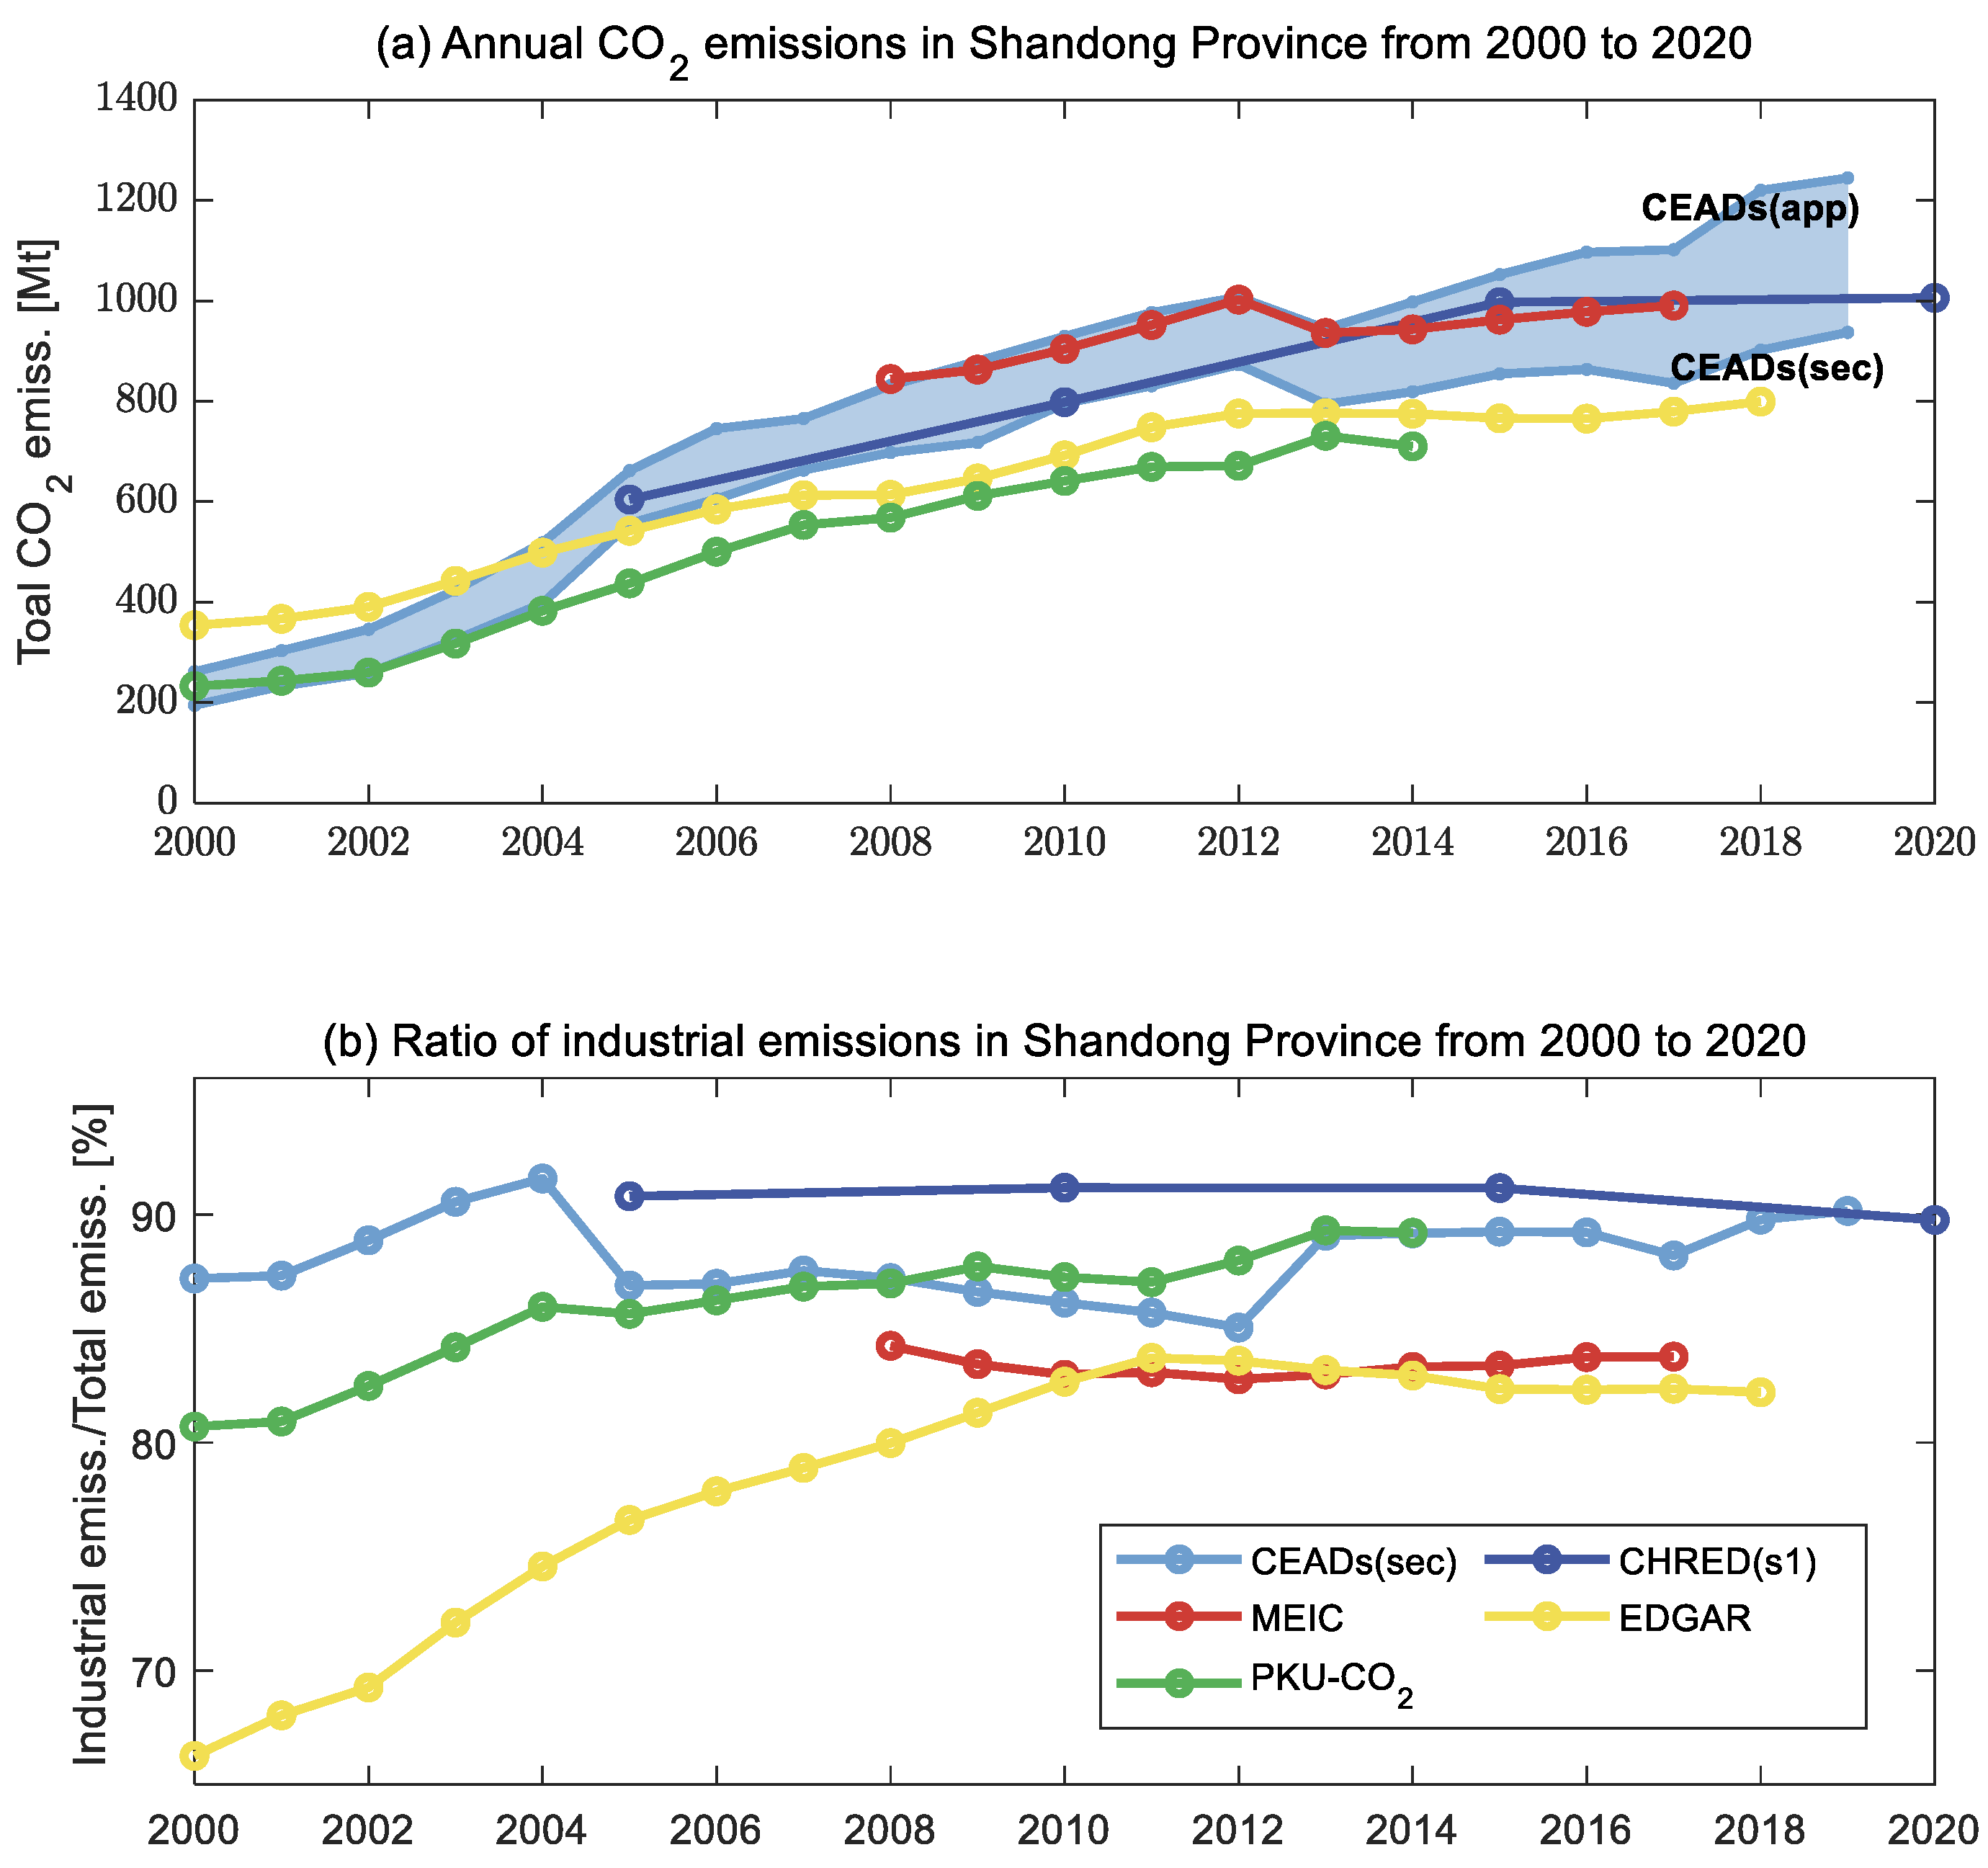
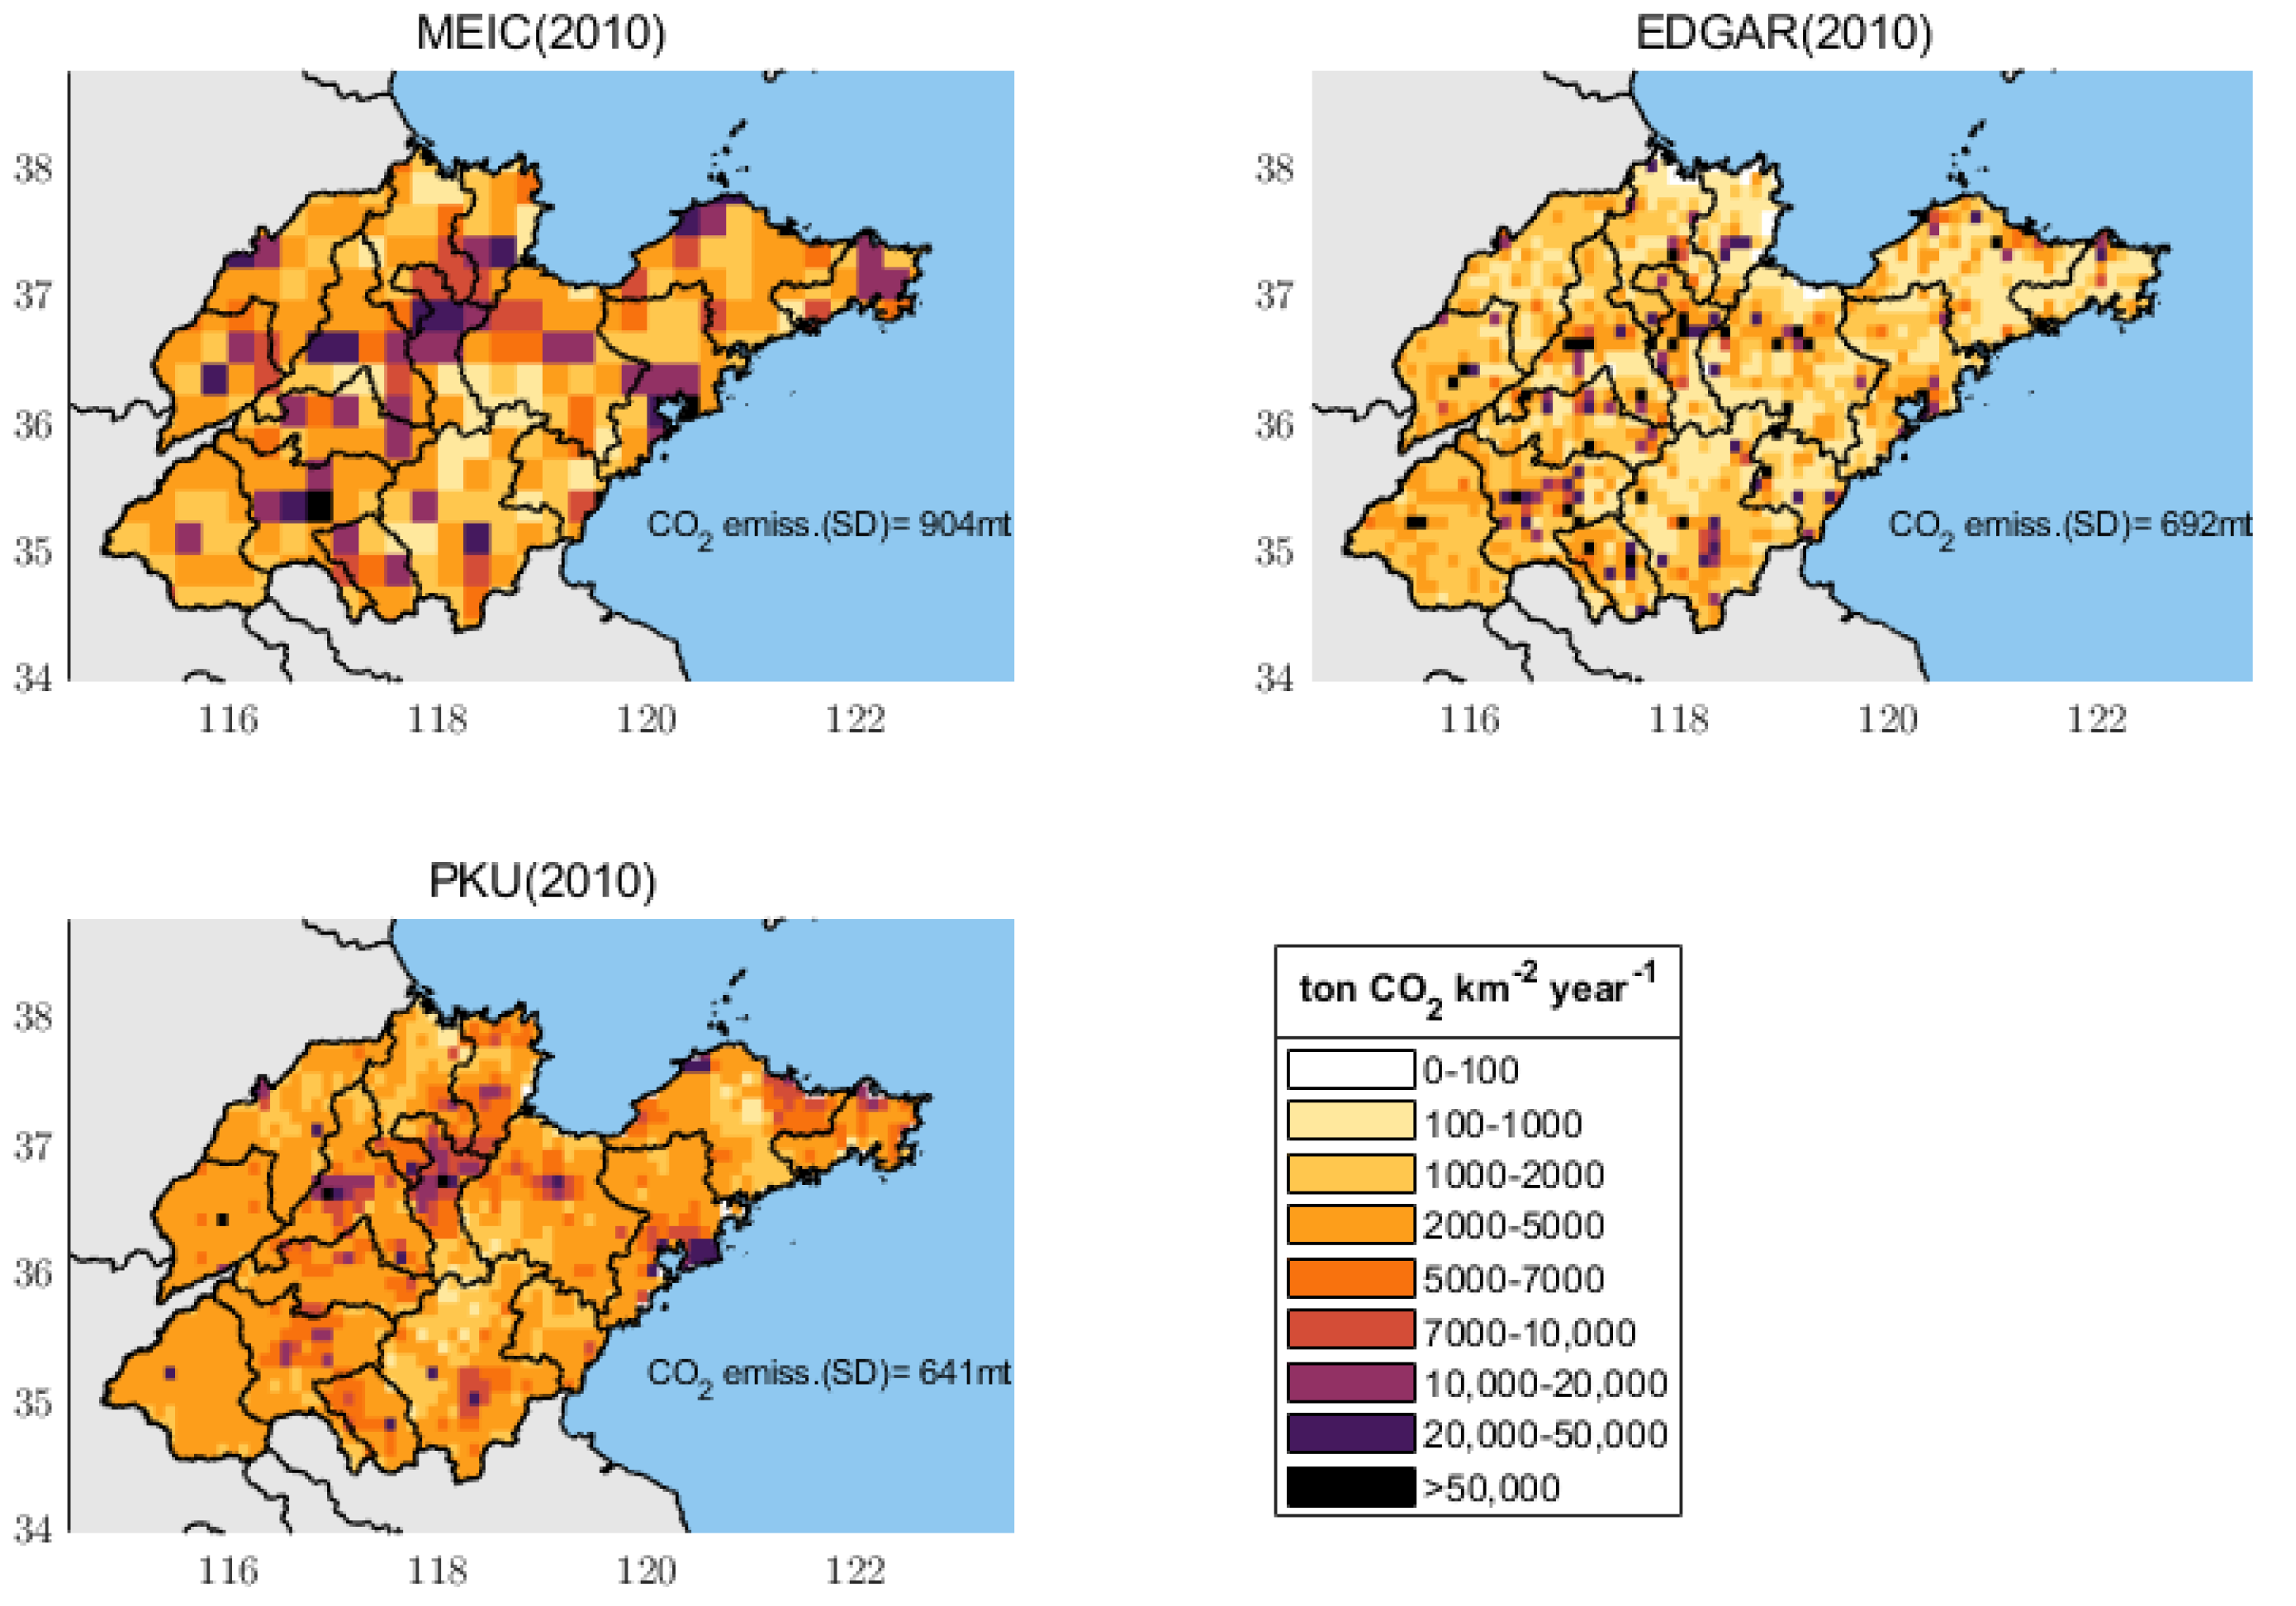
3.1. Cross-Inventory Uncertainties in Provincial Emissions

We first compared the evolution of the annual emissions and ratios of industrial emissions among the five inventories (Figure 1). All of the inventories show profound increases, from 234 Mt (±17%, 195–273 Mt) in 2000 to 856 Mt (±20%, 671–1007 Mt) in the provincial aggregated emissions in 2012. The emissions grew quickly, at a rate of about 50MtC per year (~10% year−1) between 2000 and 2012. Most inventories (including CHRED, CEADs(sec), MEIC, PKU-CO2, and EDGAR) agreed to slow emissions growth after 2012.
We noticed that the discrepancies in the emission estimates not only increased between different inventories but also between different scopes or methodologies under one inventory. For example, the estimates via the apparent consumption and sector approach produce 20%~30% differences from CEADs (the light blue shaded area in Figure 1a). The apparent energy consumption approach has advantages considering the poor quality of energy statistics [18]. The provincial emissions agree reasonably among CHRED, MEIC, and CEADs(app), which use provincial- or city-level source data. Their relative uncertainty is ~10%. However, the estimates from the nation-level inventories (EDGAR and PKU-CO2) are remarkably lower (~15–50%) than the city-level and province-level inventories, especially after 2005.
Since all of the emission inventories cover the year 2010, we took a closer look into their spatial distributions during 2010. The spatial distributions of the three inventories show similarities: high emission spots are located at heavy-industry and energy-providing cities, including Zibo, Rizhao, Dongying, Weifang, etc., while low emissions are mainly located in economically underdeveloped cities such as Heze, Liaocheng, and Linyi. The MEIC provides relatively high CO2 emission estimates for 2010 (904 Mt), even higher emission estimates than CHRED (s1: 798Mt; s2: 877 Mt) and CEADs (sec: 795; app: 929 Mt), which is likely due to stronger and larger proportional high emission spots than the other inventories, especially in Yantai, Weihai, Qingdao, Dongying, and Jining (see Figure 2). Although the provincial aggregated emissions estimated by EDGAR (642 Mt) and PKU-CO2 (641 Mt) are close, most of the grids in the PKU-CO2 have annual emissions ranging within 2000–5000 tonC per km2, whereas the EDGAR map shows that most grid emissions are lower than 2000 tonC per km2 and have higher emission spots.
Figure 1b shows that the differences in the ratios of the industrial emissions to the aggregated provincial emissions are quite large across the inventories. The ratio values spread from 80–90% during the common period of 2008–2014. MEIC and EDGAR suggest ~80% emissions from industry and ~20% non-industrial emissions (mainly from residential and transportation) for the whole province. The CHRED estimates that ~90% of emissions are from industry. We are aware that differences in the absolute values of the industrial emission ratios among inventories are inevitable and are caused by the different scopes, methodologies, and emission factors for each inventory (for more details, see the Supplementary Materials).
Based on the self-consistency of individual inventories, we compared their changes over time and their spatial distribution. We found that in their evolution, the industrial ratios during the common period of 2008–2014 were similar to the proportion of industrial emissions for Shandong Province and were quasi-stationary. CHRED and PKU-CO2 showed a subtle decline in these ratios starting from 2012 (2010 for CHRED).
The regional distribution of the industrial emission ratios at the city level in 2010 is shown in Figure 3. Note that ranges in the different colored-bars are used for the different inventories. Here, we only focus on the regional distributions interpreted by different inventories. It is seen that some agreements are archived among the inventories. For example, the highest industrial emission ratios are commonly found in heavily industrial cities such as Zibo and Zaozhuang. The ratios are relatively low in rural regions such as Linyi and Heze. However, clear disagreements can be observed. In contrast to other inventories showing a relatively low industrial emission ratios for cities such as Qingdao, Yantai, Weihai, and Dongying, the MEIC suggests relatively high industrial emission proportions in those cities that are even comparable to those of heavily industrial cities such as Zibo. This is also reminiscent of the high emission spots shown in the MEIC map of these cities in Figure 2. The reason for this is that the power plant database (CPED) used in the MEIC includes many small power plants that are neglected by other point-source databases (CARMA and FCPSC) (referring to Figure 13 in [25]).

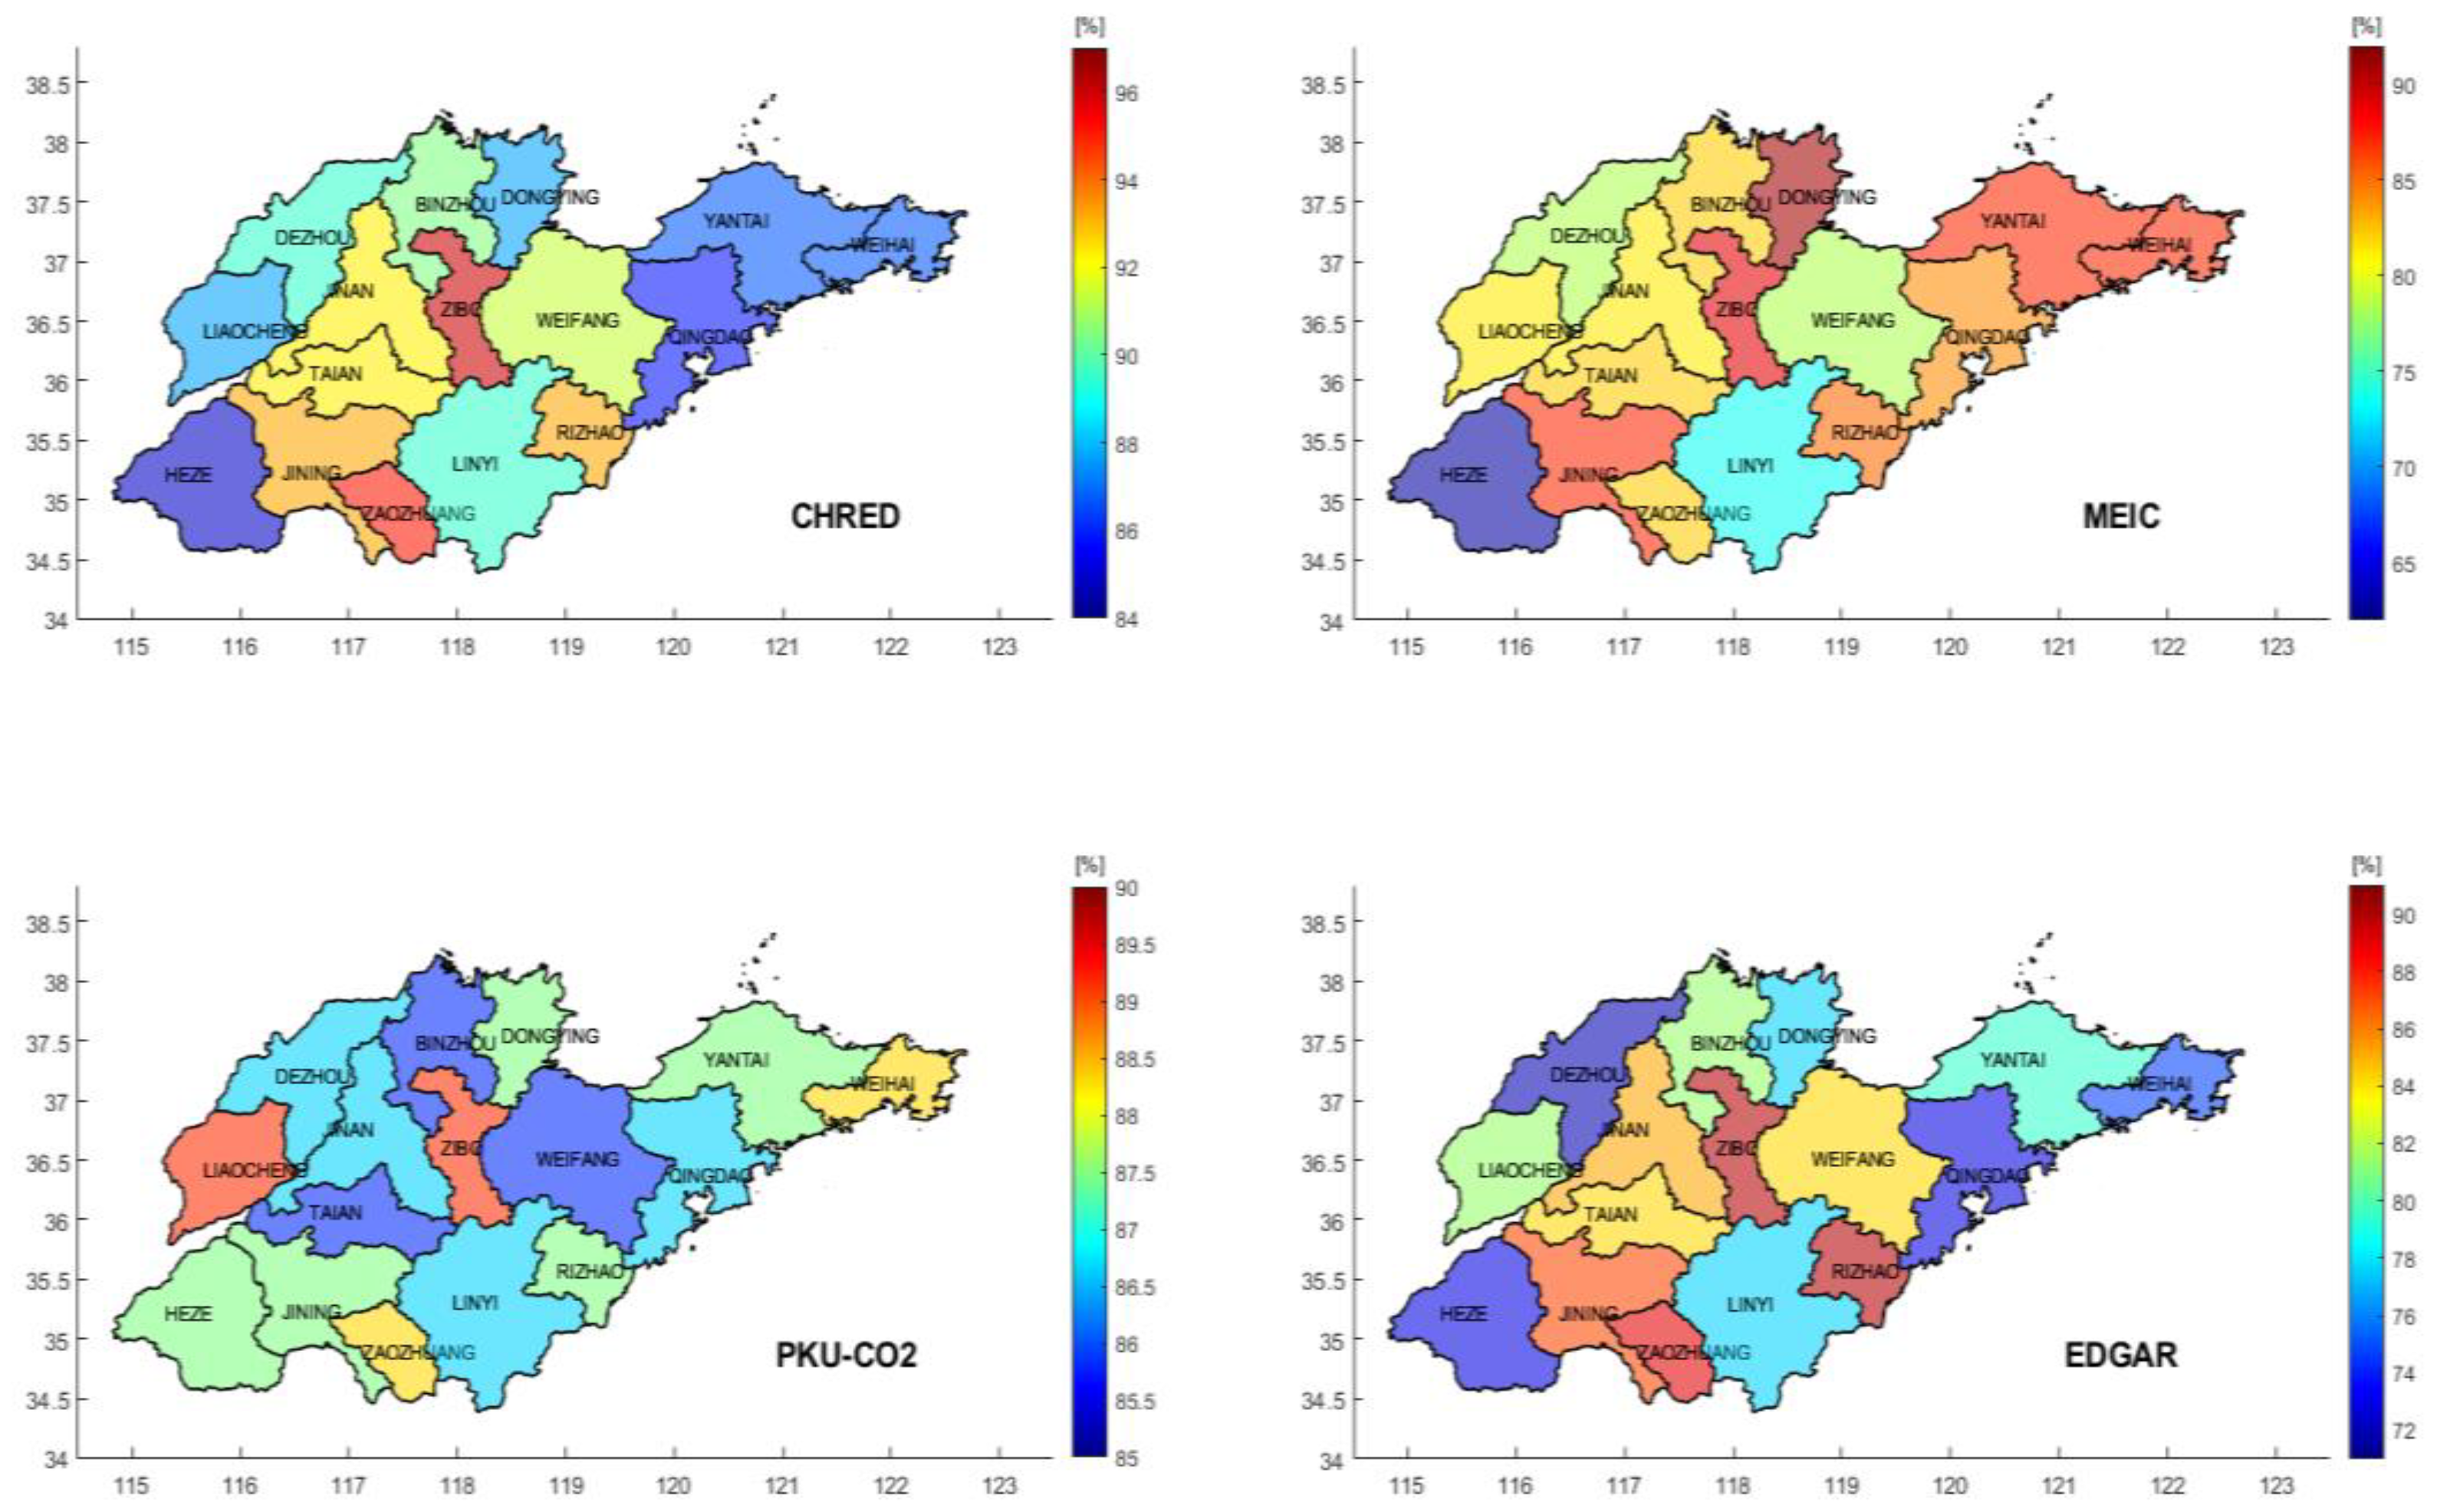
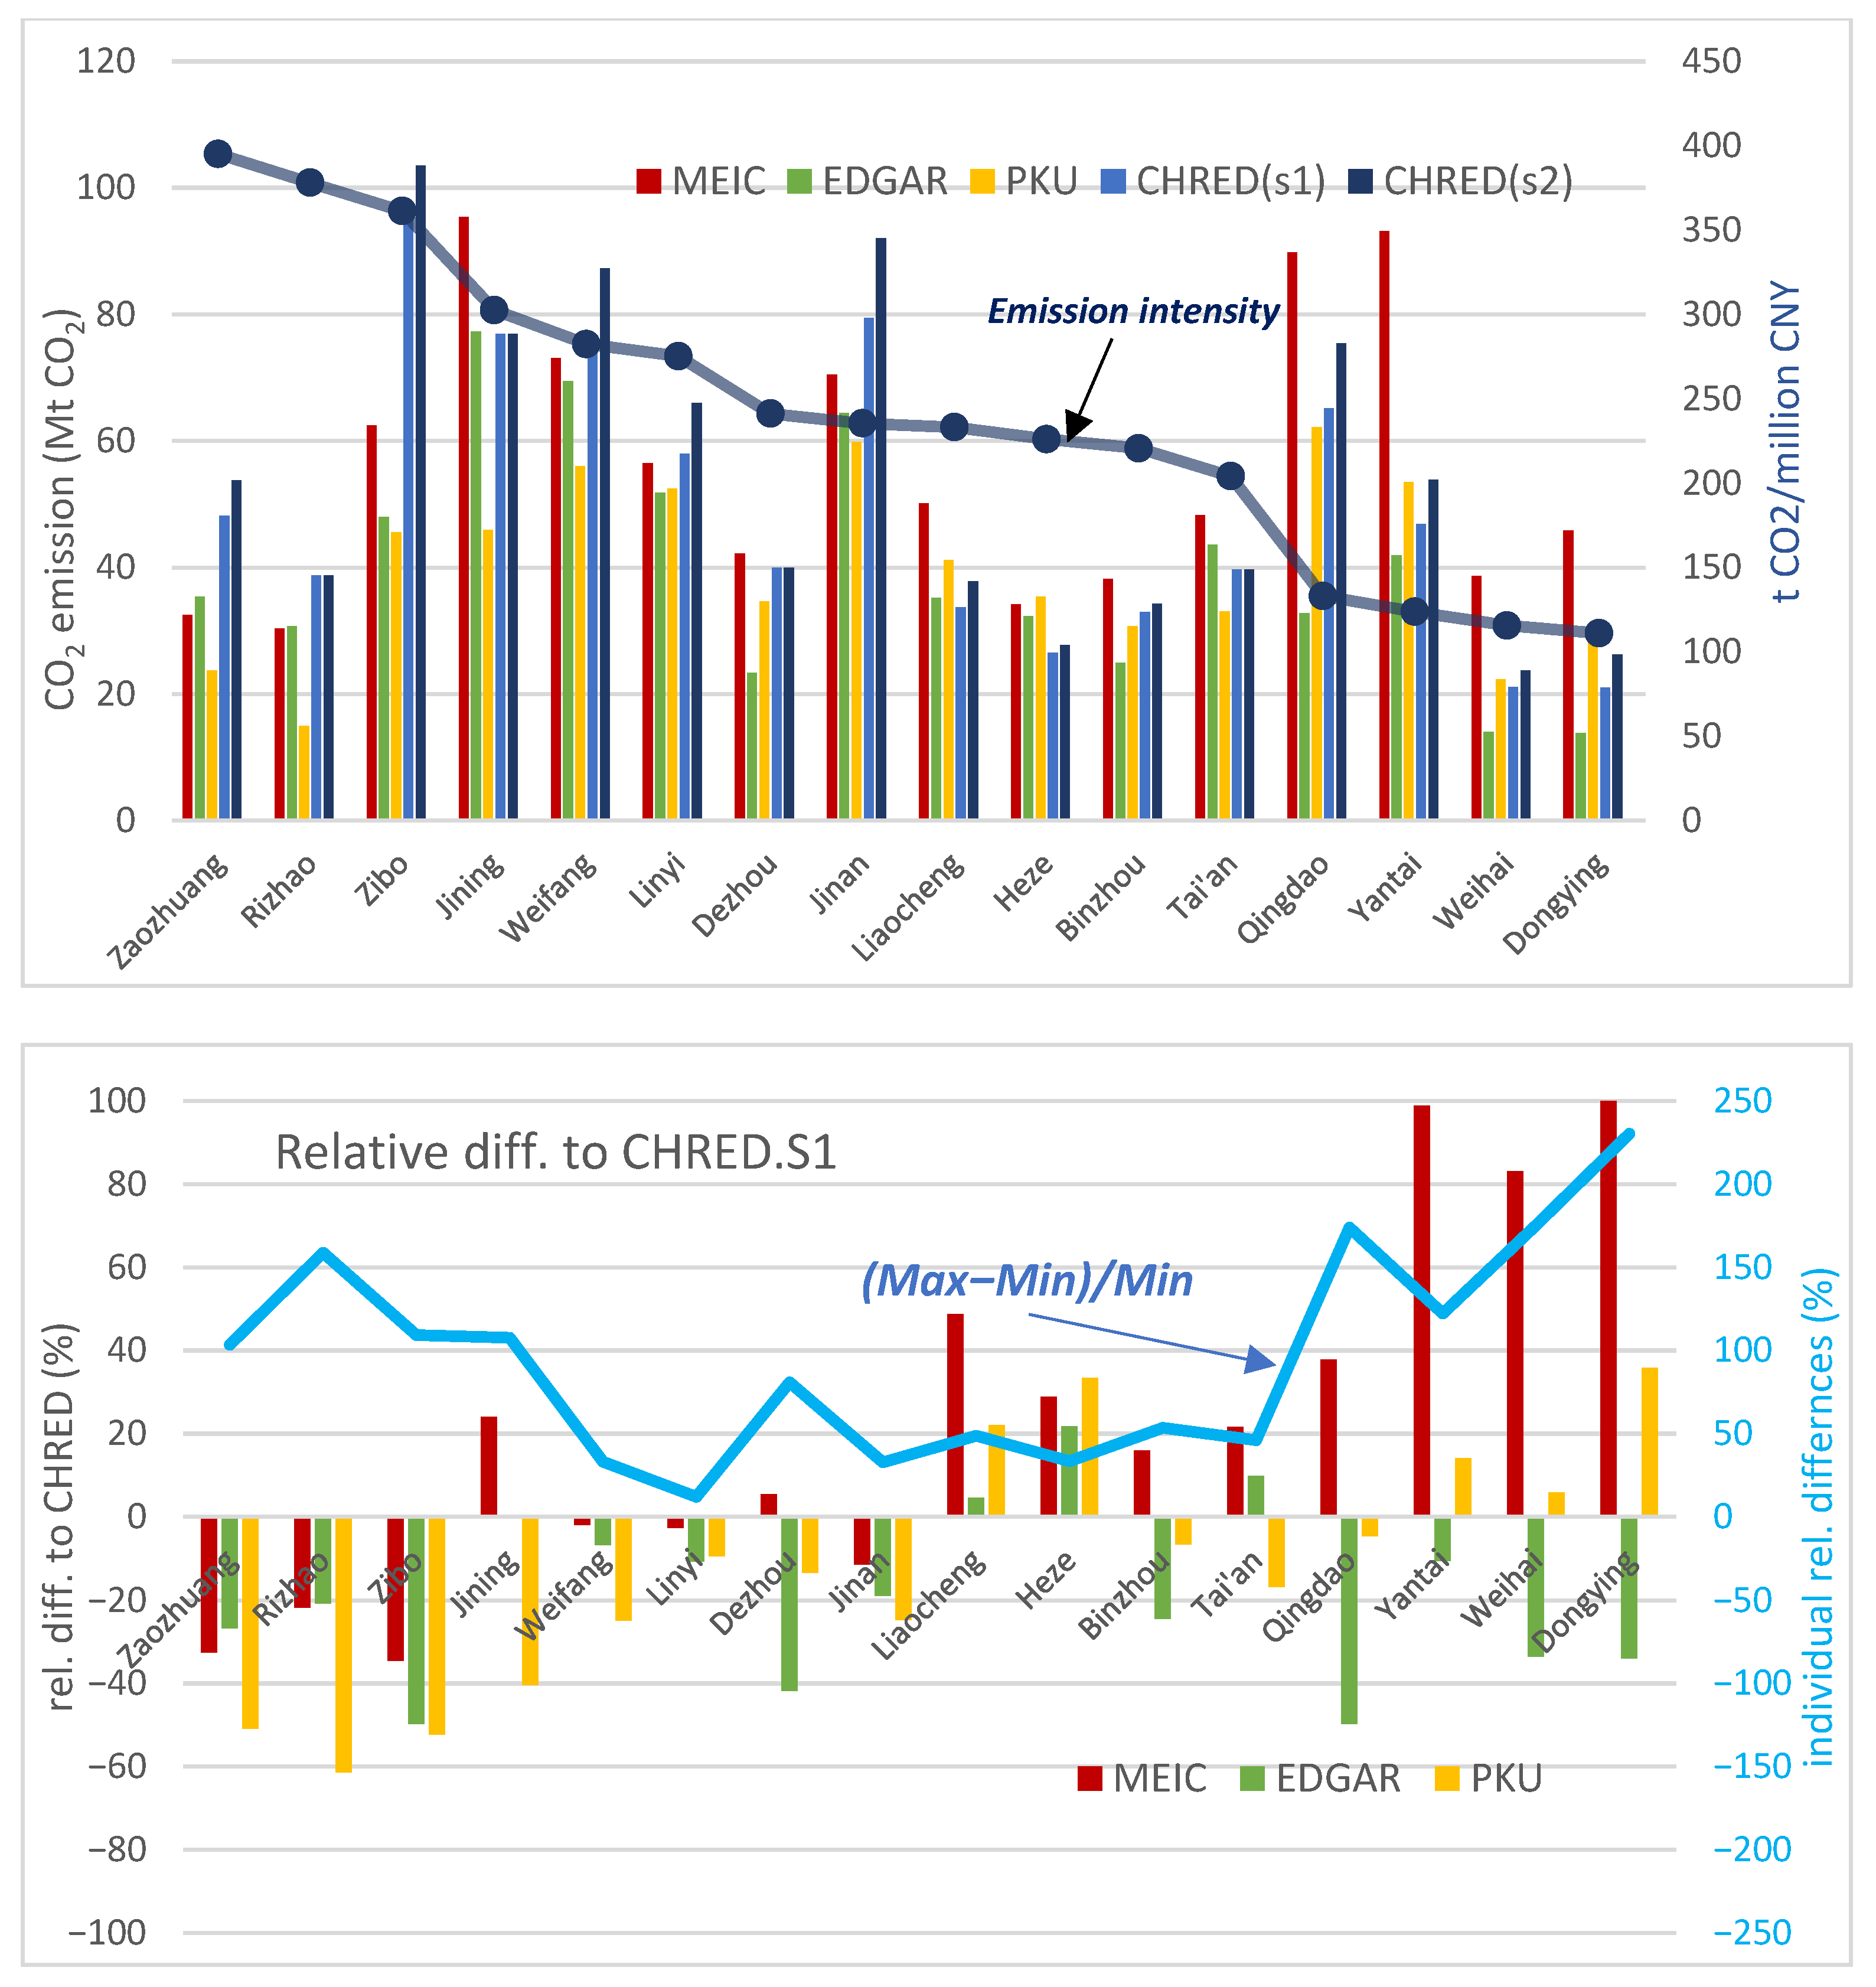
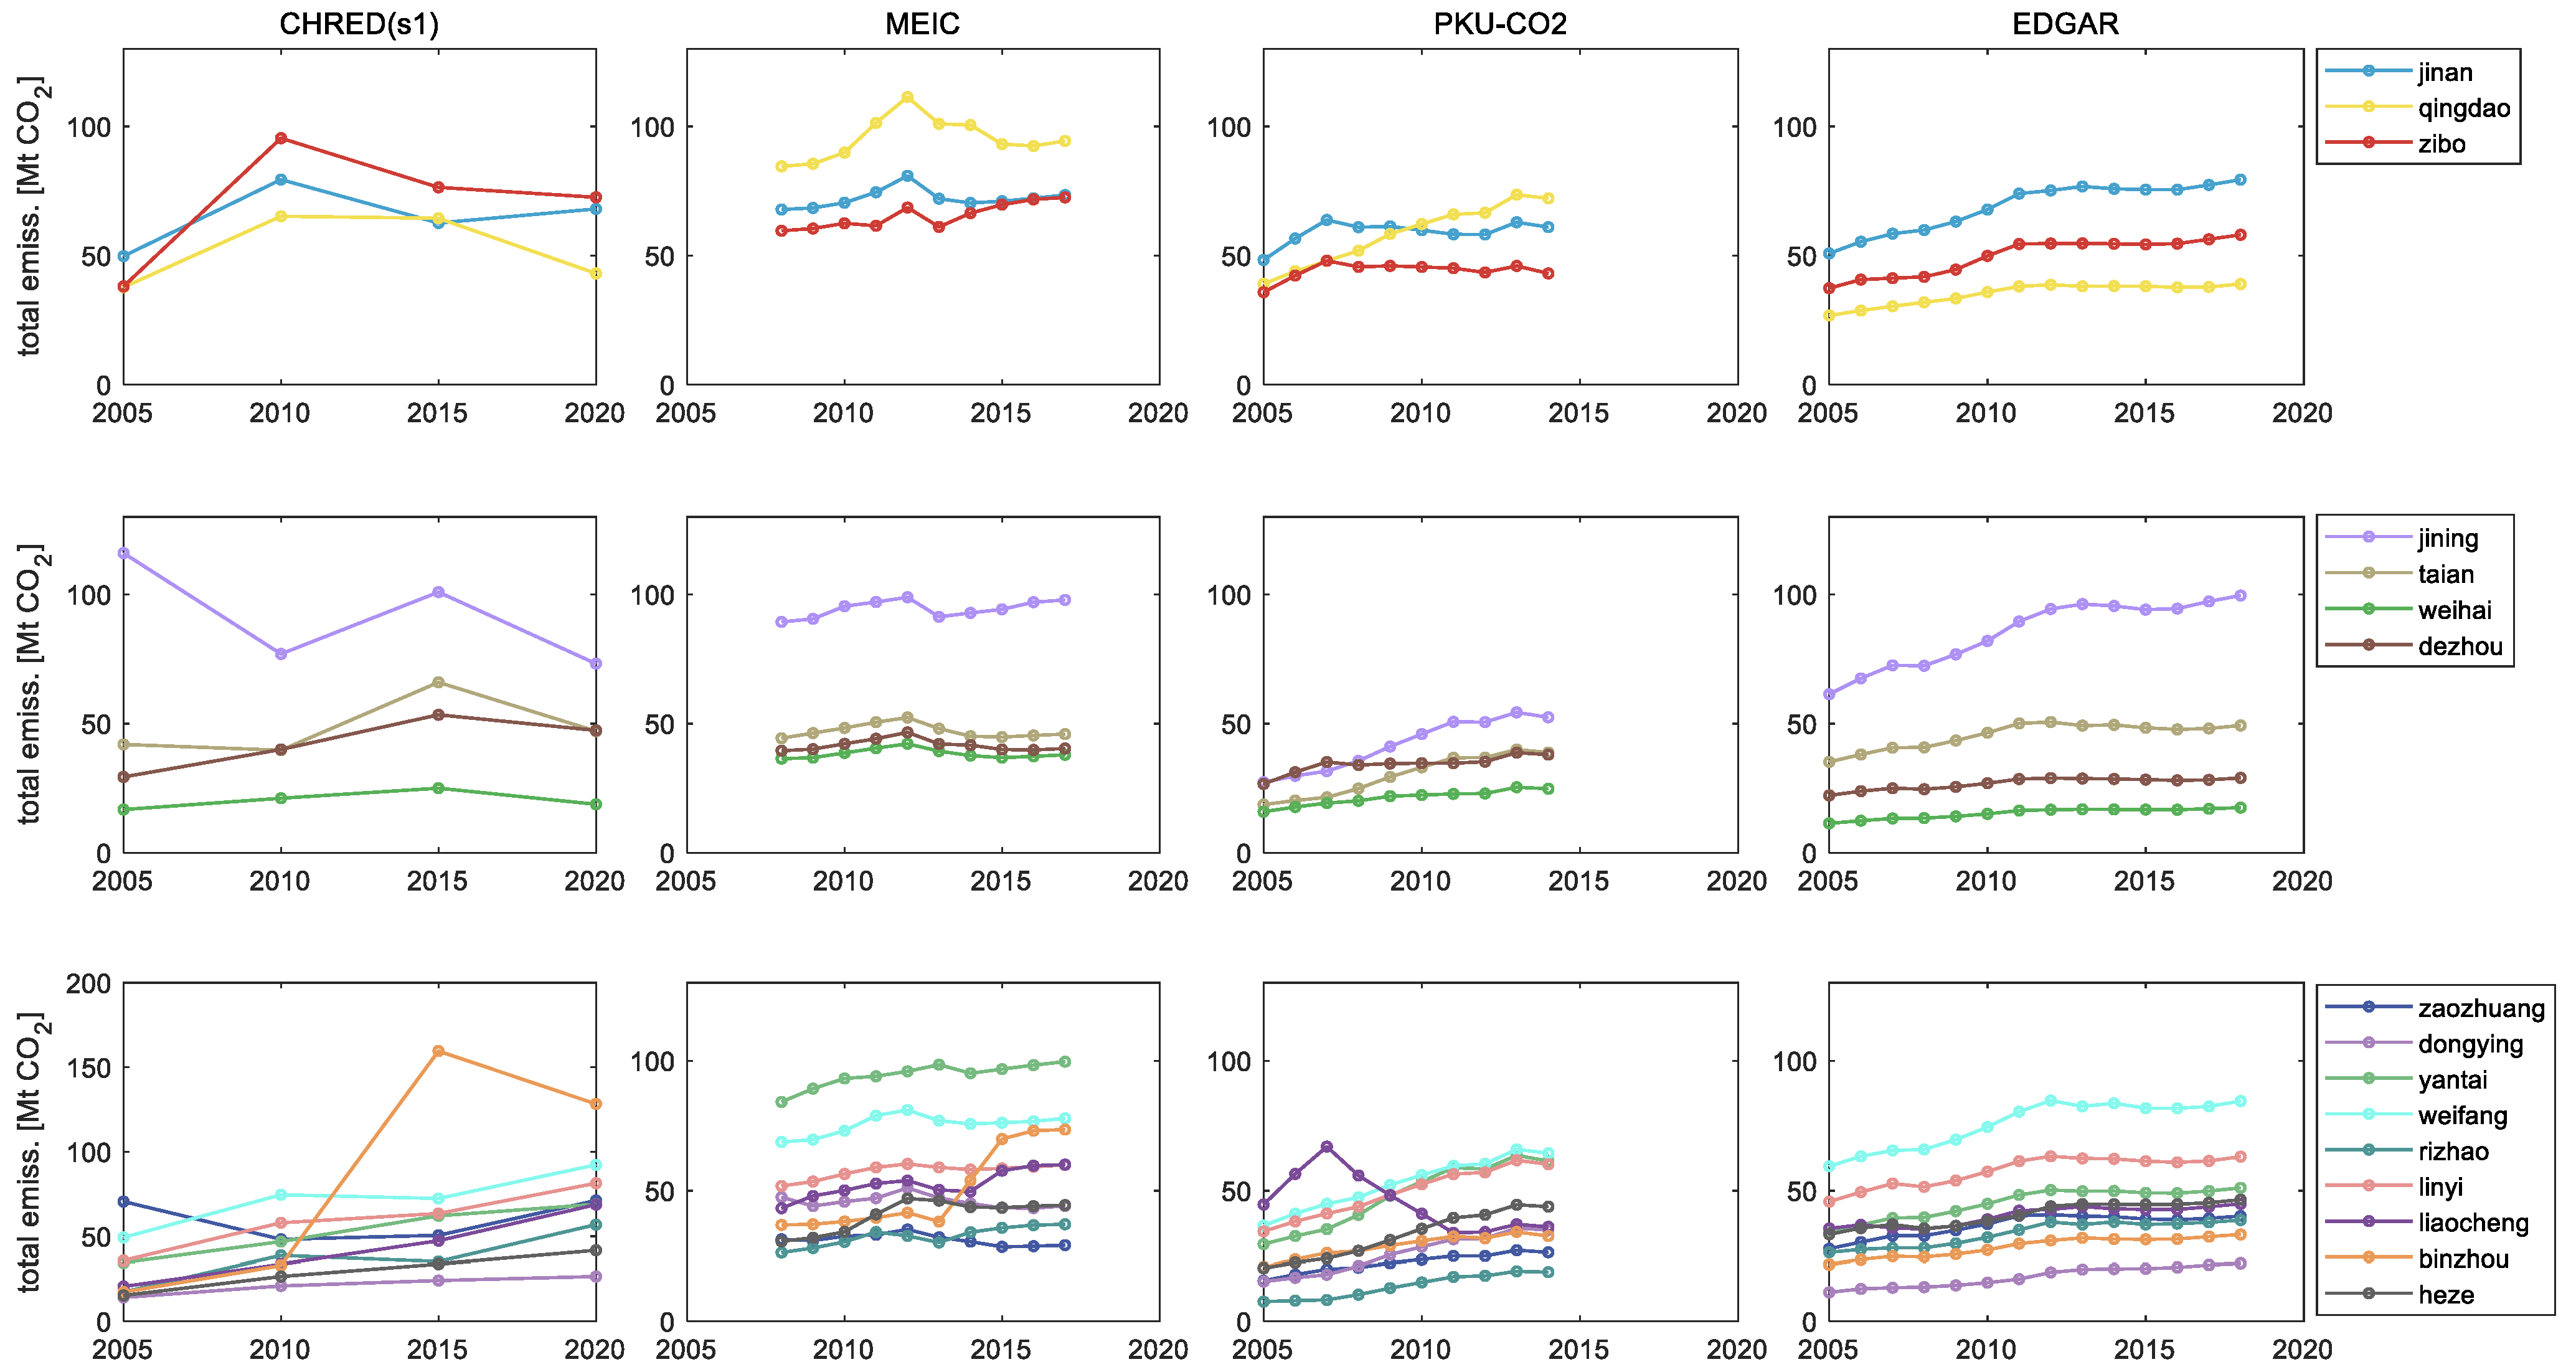
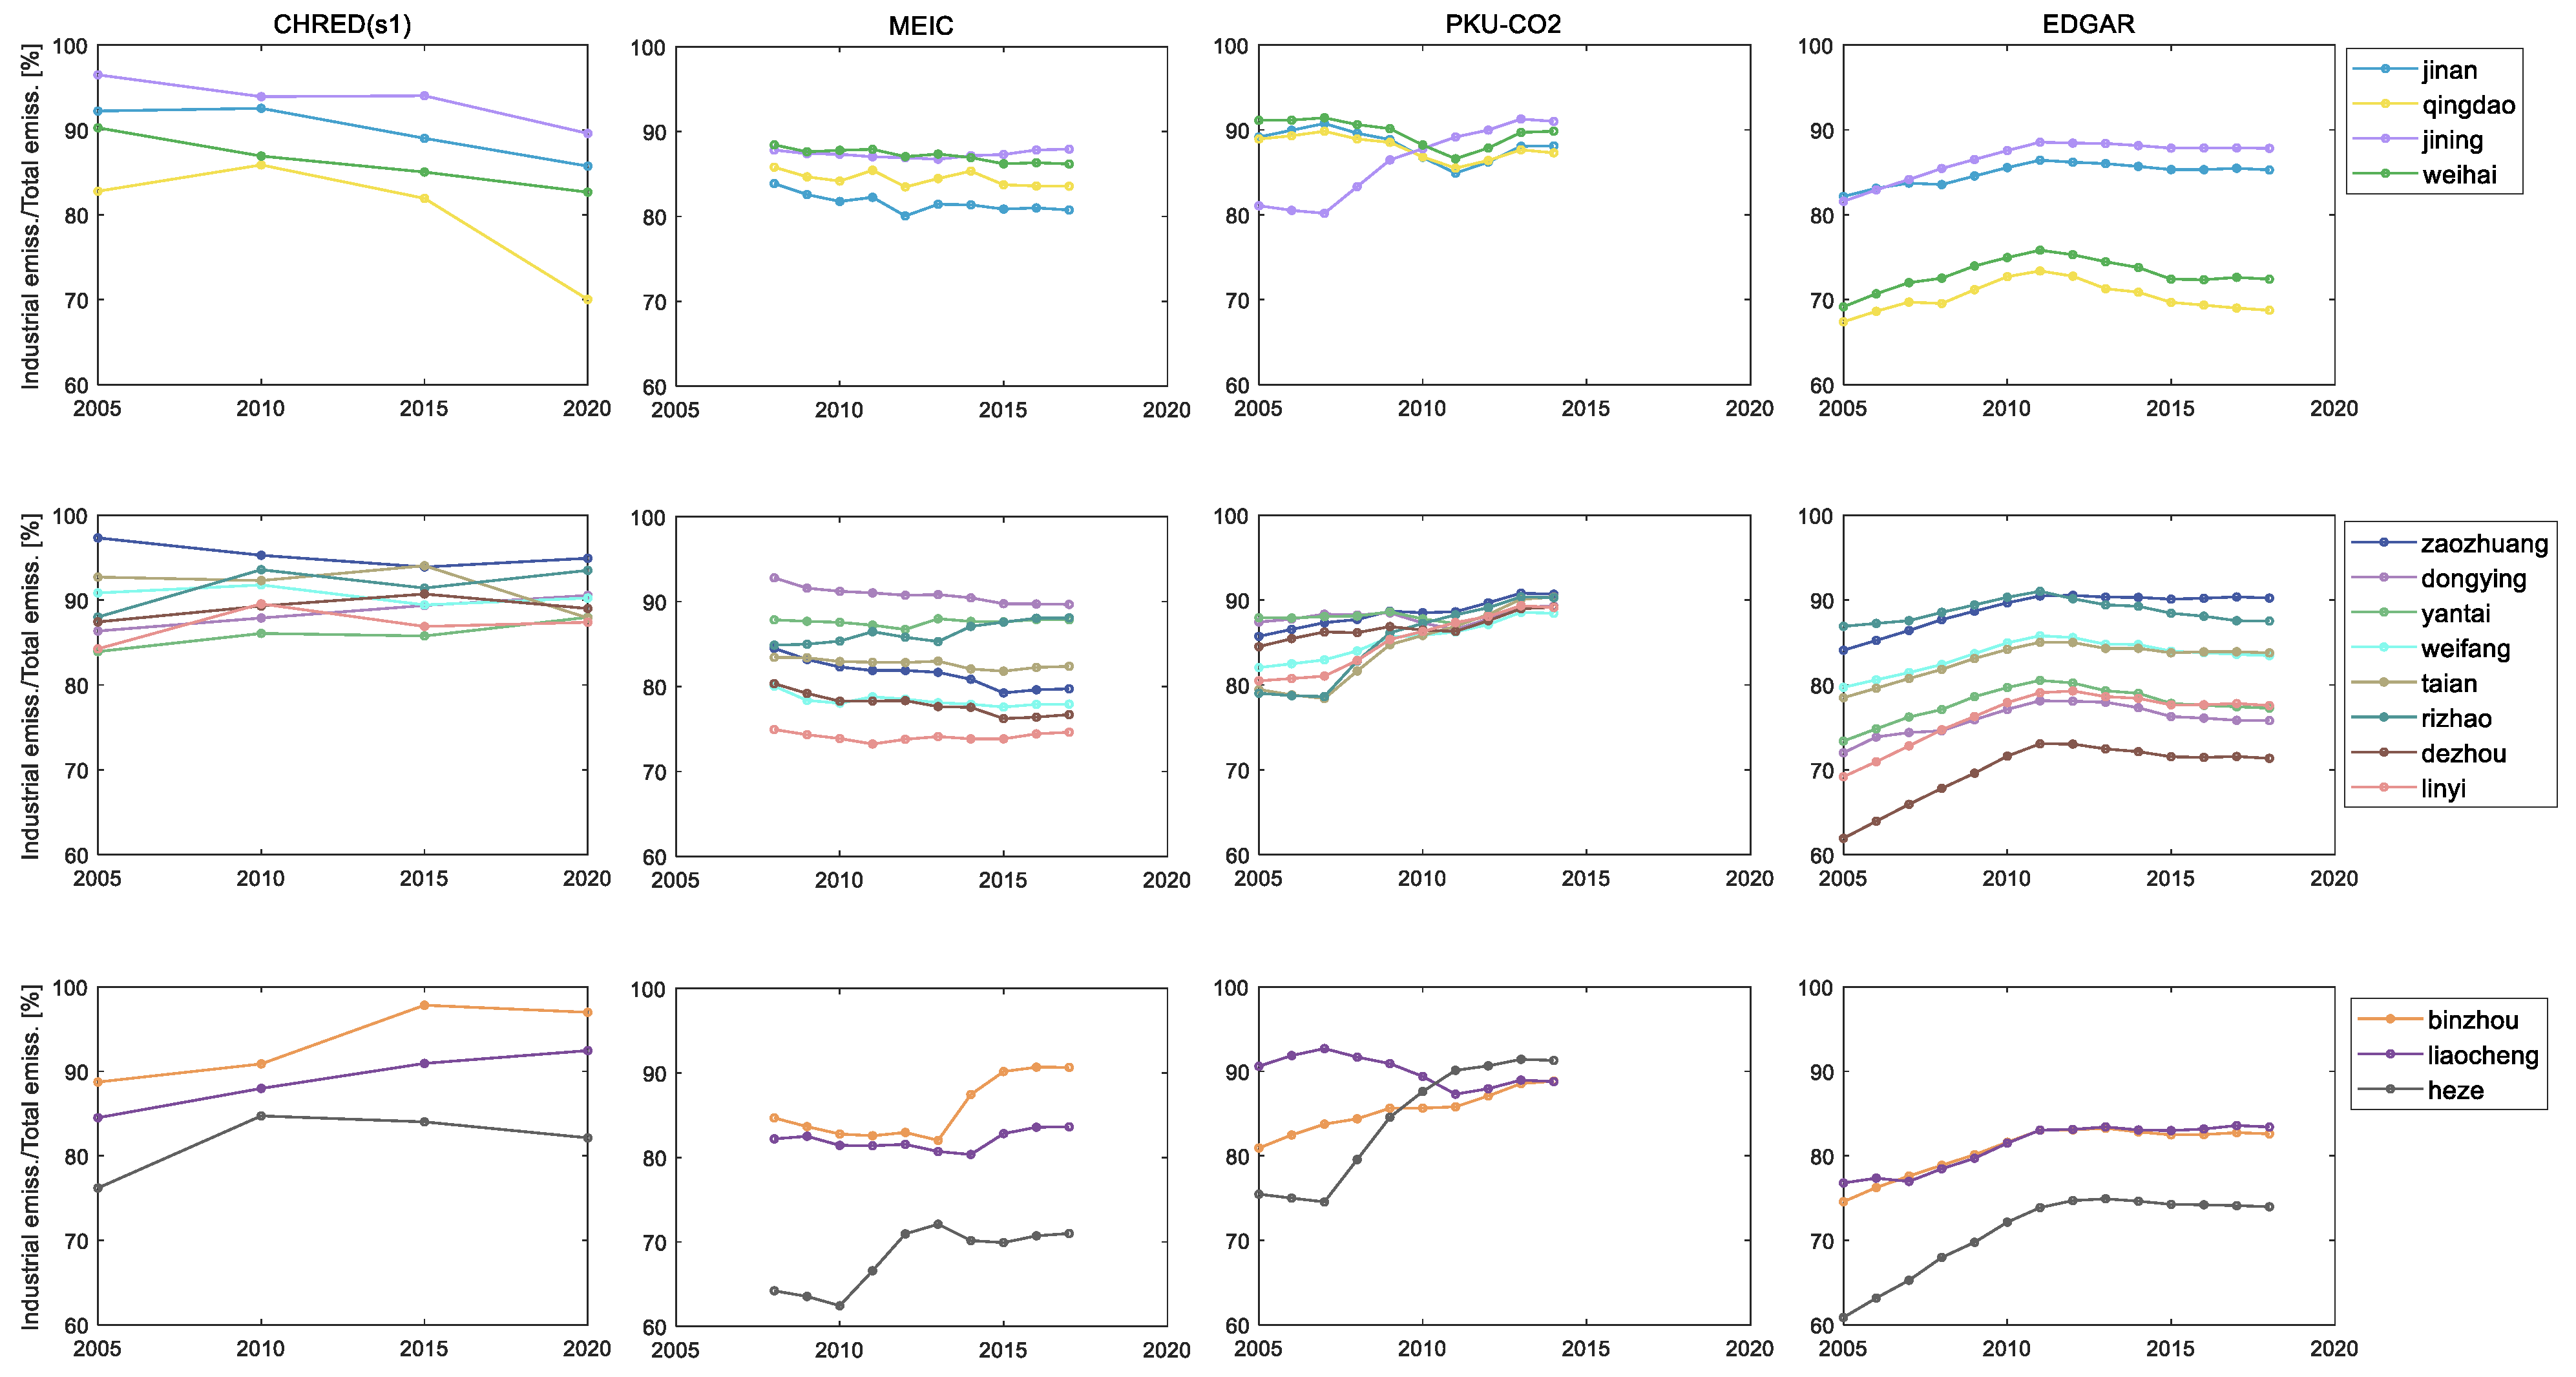
3.2. Cross-Inventory Uncertainties in City-Level Emission Estimates

Compared to the discrepancies in the provincial aggregated emission estimates among inventories, the differences in the city emissions based on different inventories are much larger, as shown in Figure 4. The relative standard deviation of the city-level emissions in 2010 among all four inventories ranges from 5% (Linyi) to 50% (Dongying). The individual relative differences range from 10% (Linyi) to 230% (Dongying), which is shown as the light blue line in Figure 4 bottom panel. The individual relative differences suggest that inventory uncertainties lower than 50% are only valid for one-third of cities, while the uncertainties for half of the cities are larger than 100%. Although the MEIC provides quite a close estimate of the provincially aggregated emissions, referring to CHRED and CEADs (see Figure 1a), the estimates from MEIC at the city level are relatively higher for low-carbon-intensity cities (e.g., Qingdao, Yantai, Weihai, and Dongying), while the EDGAR provides low estimates for these low-carbon-intensity cities. The two inventories (EDGAR and PKU-CO2) based on national- and provincial-level data tend to underestimate the CO2 emissions for all of the cities except for two rural regions (Liaocheng and Heze).
The emissions for both the high- and low-carbon-intensity cities contain great uncertainties obtained from the different inventories. The best agreements are archived for the medium-carbon-intensity cities, which are either service-based cities, for example, the capital city Jinan, where statistical data are more elaborate and reliable, or rural regions, such as Heze and Linyi, where the energy flow is relatively simple. Heavy-manufacturing cities (such as Zibo, Rizhao, and Zaozhuang) are underestimated by all three inventories by 20~55% compared to the CHRED. We further found that over 80% of the underestimation can be attributed to the industrial emissions in these cities. This suggests that the unique enterprise-level point-source data used in the CHRED provide more comprehensive information about the power planes and industrial processes in these traditional heavily industrial cities. MEIC shows ~20–70% higher estimates for developed and quickly developing cities such as Qingdao, Yantai, Weihai, and Dongying than other inventories. The relatively high estimates for those cities by the MEIC mainly come from its high estimates for industrial power and processes. As we discussed in the last section, a number of small power planes are uniquely marked by the point-source database used in MEIC [25]. These small power planes might significantly contribute to the CO2 emissions in the cities where the industrial system is more complex and diversified.

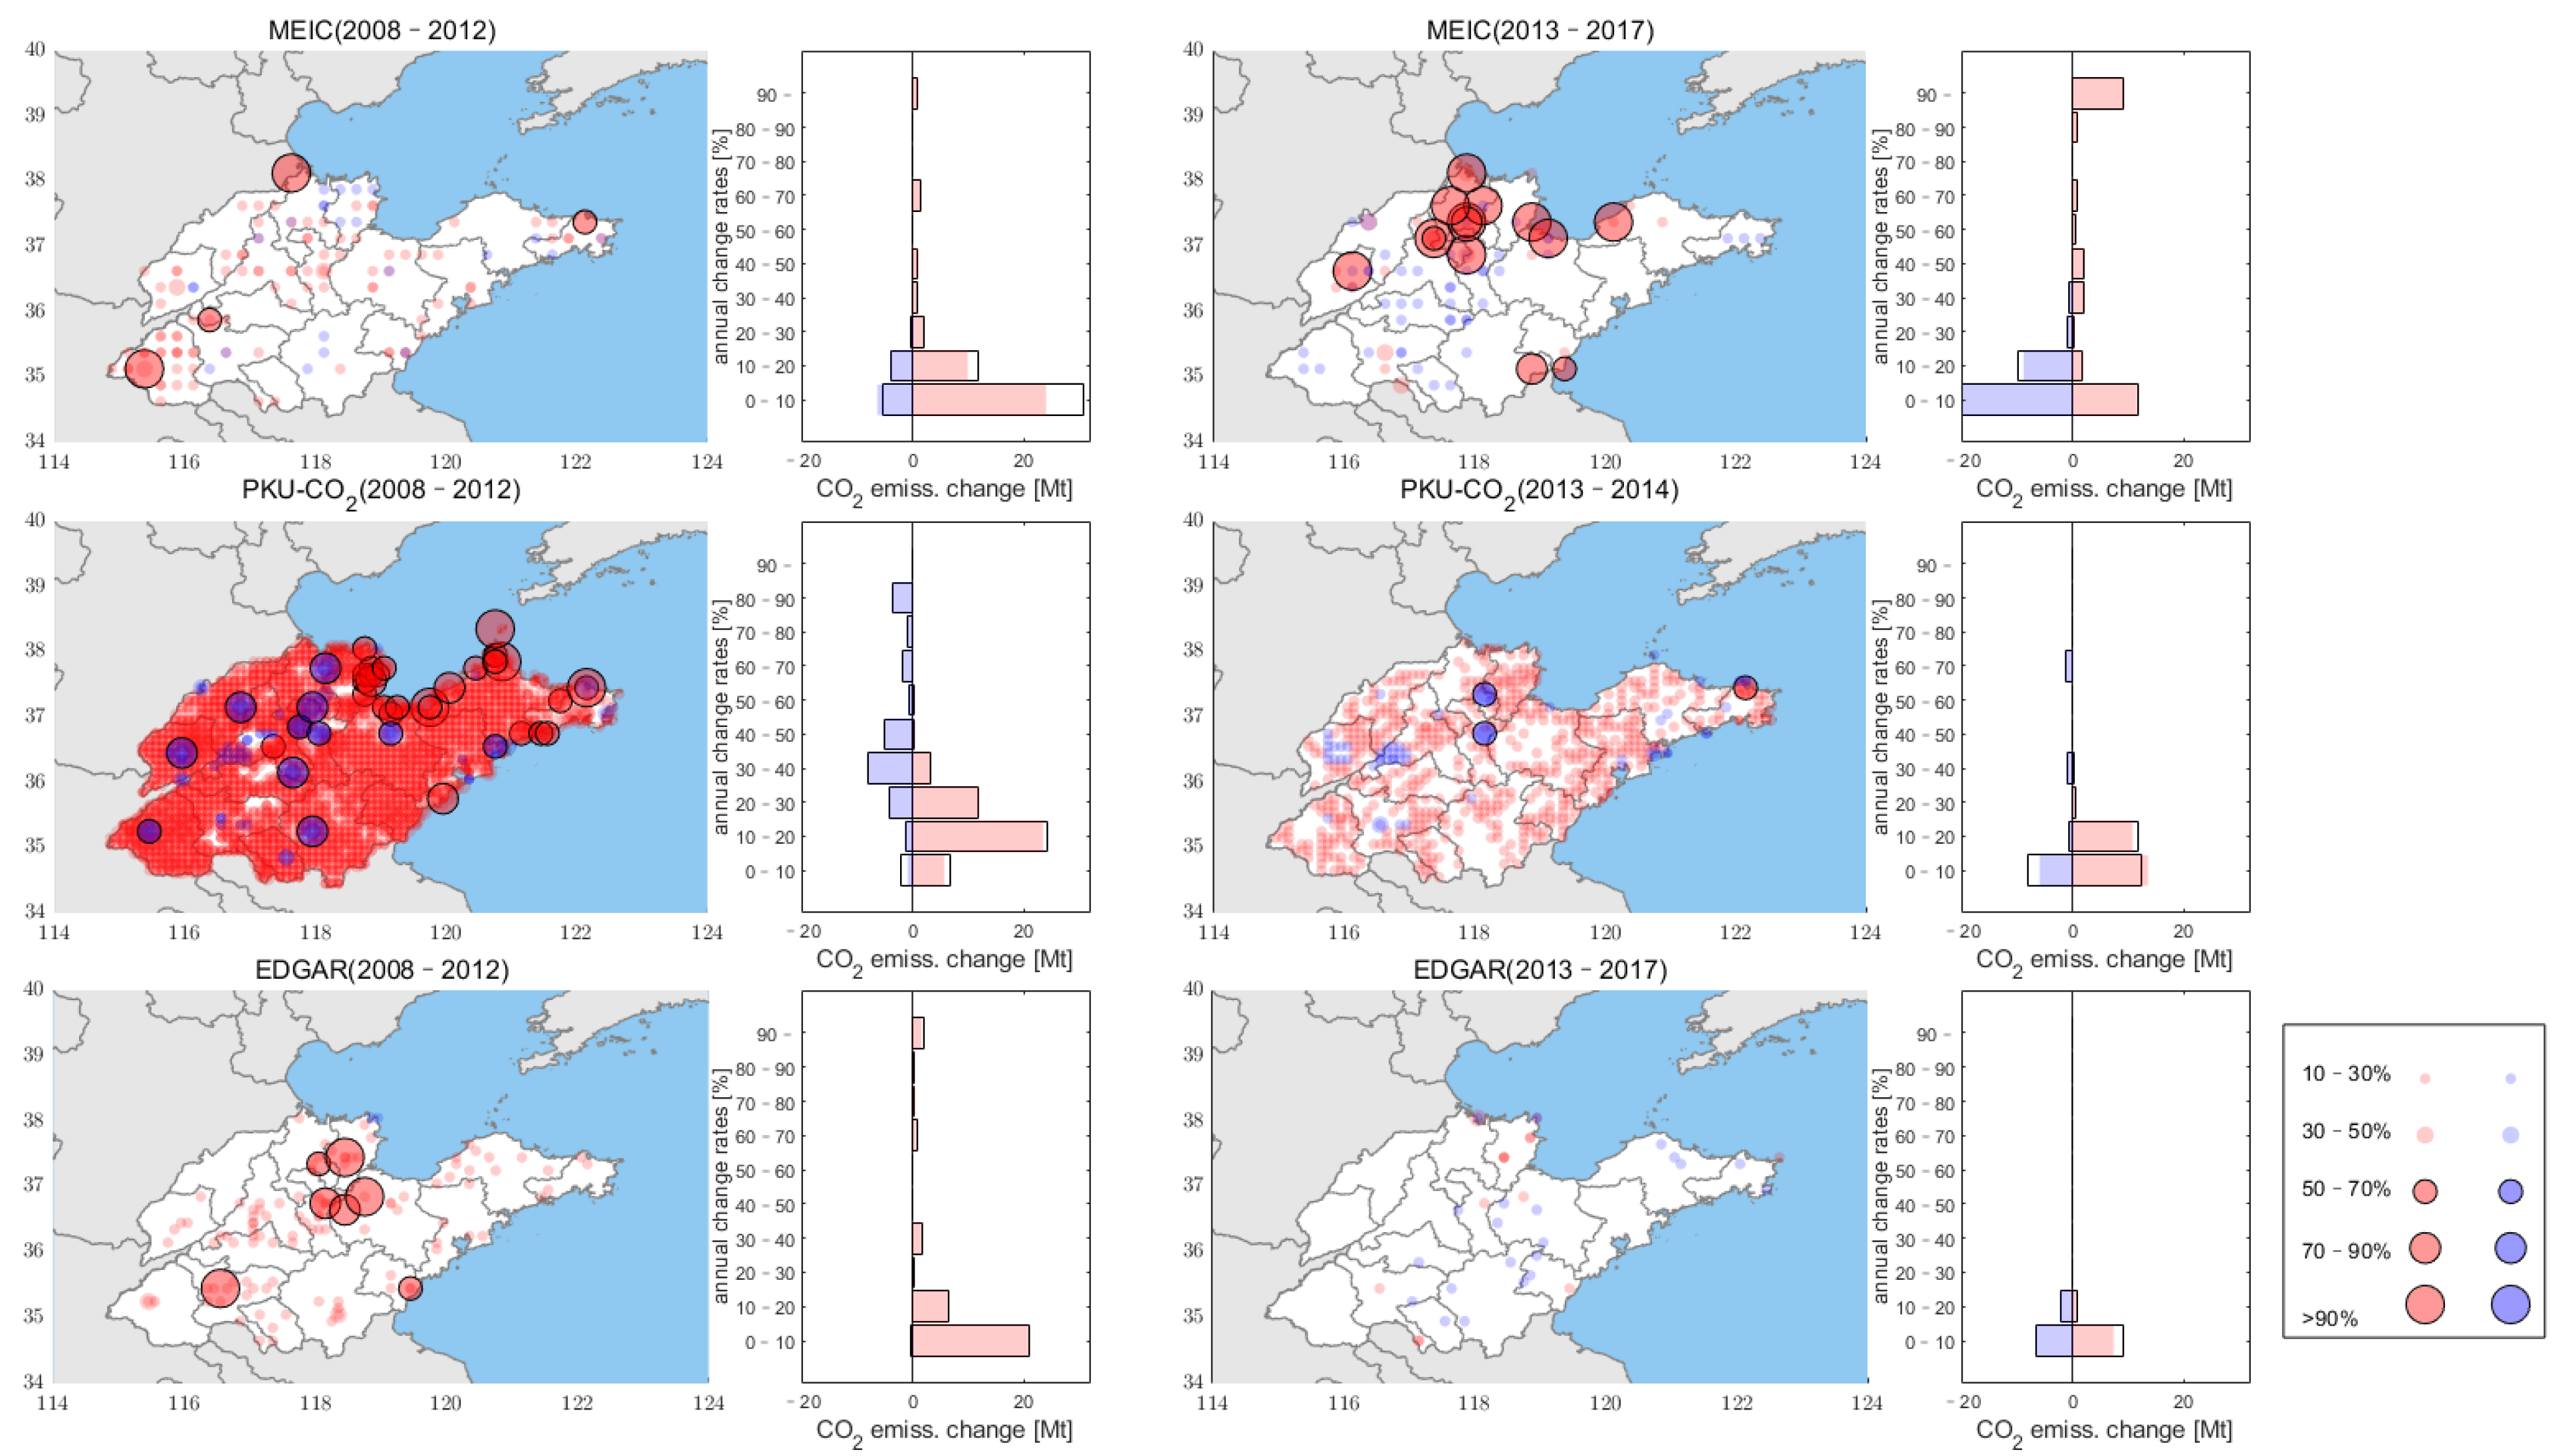
3.3. Evolution of the City-Level Emissions

The key question of this section is whether the gridded emission inventories are capable of capturing the main features of emission evolutions as well as the features of the structural changes in emissions at the city level. We will continue to use the CHRED as a reference. According to the evolution observed in the city-level emissions based on the CHRED (see the left column in Figure 5), we divided the 16 cities into three groups according to the changes in their emissions from 2005–2020. The three relatively developed cities (Jinan, Qingdao, and Zibo), whose emissions reached their peak around 2010 and slowly decreased afterwards, make up the first group. The second group contains four cities (Jining, Yantai, Weihai, and Dezhou). Their emissions all declined after 2015. The third group includes all of the other cities that show a clear increasing trend until 2020. Note that Binzhou is an outliner in the third group, in which emission declined a little during 2015–2020 following a remarkable rise from 2010 to 2015. However, we found that its emission intensity (not shown) continued to rise until 2020, which indicates the potential for emission increases in the future.
In general, the MEIC shows more reasonable evaluation of the time evolution of the city-level emissions. The MEIC identifies a clear decrease after 2012 for most of the cities in the first and second groups, although it continuously shows relative high estimates for Qingdao and Weihai. For the third group, the MEIC shows a particularly good ability to identify the dramatic increase in emissions in Binzhou from 2013 to 2015 and in Heze from 2010 to 2012, which is not found in other two inventories. Although the PKU-CO2 captured a decline in the CO2 emissions from Jinan and Zibo as well as quasi-stationary emissions in Weihai and Dezhou, PKU-CO2 shows a synchronous emission evolution for most other analyzed cities. This is potentially the result of the spatial averaging of the provincial emissions, which thus neglects the changes in emission sources. In addition, the high emissions in Liaocheng during 2005–2010 should be an overestimate, something that is not supported by any of the other inventories. The EDGAR is clearly not capable of capturing evolution of city-level emissions. We found that all of the cities show highly synchronous changes.
In Figure 6, we again divided the cities into three groups according to the evolutionary features of their industrial emission ratios. The first group experienced a remarkable decrease in the industrial emission ratios interpreted by the CHRED. This feature is captured fairly well by the MEIC. The PKU-CO2 shows decrease for three cities in the first group, but only before 2012. Note that the point-source data used in the PKU stopped being updated in 2012, which might explain this and will be discussed later. However, the rises in the industrial ratios in Jining interpreted by the PKU-CO2 are contradictory to the interpretations by the MEIC and CHRED. The industrial emission ratios in the second group did not show pronounced changes from the CHRED. For the three cities in the third group, the industrial emission ratios were increased, which suggests that some high-emission enterprises were introduced. This is well-captured by the MEIC and partially captured by the PKU-CO2 (except for Liaocheng). Again, the EDGAR shows highly synchronous changes in all of the cities, which suggests that it is not qualified for studies on the evolution of city-level emissions.
From the analysis above, we found that the aggregated provincial emissions as well as those of most cities experienced a remarkable change in their trends around the year 2012, i.e., either increasing before 2012 and declining afterwards (first group in Figure 5) or increasing before 2012 and remaining stationary afterwards (second group in Figure 5). Another fact is that the point-source database (CARMA) for PKU-CO2 and EDGAR stopped being updated in 2012, which would clearly influence their source emission estimates. Therefore, we show the annual change rates for the gridded emissions separately for the period before and after 2012. The common period between 2008 and 2017 (MEIC time coverage) is applied to the other two inventories for a fair comparison.
Figure 7 shows various interesting features in the annual changes in the grid emissions from the three gridded inventories despite the aggregated provincial emissions experiencing a similar evolution (see Figure 1a). First, both the PKU-CO2 and EDGAR are clearly influenced by the pause of point-source database collection after 2012. The renewal of point sources, which is the pronounced increase or decrease in grid emissions (i.e., circles with black edges), almost disappeared in the PKU-CO2 and EDGAR inventories after 2012.
Secondly, the increase in the provincial emissions before 2012 at a rate of about 50 MtC per year is interpreted completely differently among the three gridded inventories. The MEIC and EDGAR indicate that the increase is mainly from grid emission increases of 0–10% per year combined with a small fraction of dramatic increases (i.e., new point sources). Nevertheless, the distributions of the grid-changes are very different between the MEIC and EDGAR. On the other hand, the increase in emissions interpreted by the PKU-CO2 is the result of a widespread grid emission increase of 10–30% per year balanced by a dramatic decrease in some grids (see the blue circles with black edges). Moreover, from the bar plots, we found that only the MEIC attributes the ~20% increase during 2008–2012 to non-industrial emissions (shown as the parts of the bars that are in white), while all of the other inventories attributing an increase of over 95% to the growth in industrial emissions (the parts of the bars that are in color).
Thirdly, the MEIC suggests that the slow-down in emission increases in Shandong after 2012 is the result of an equilibrium between the general 0–20% annual decrease in industrial emissions and of an emission increase resulting from some updated industrial point sources. The updated sources after 2012 are mainly located in Binzhou, which are also validated by city-level inventory, CHRED.

4. Discussion

A series of previous studies found that cross-inventory uncertainties when downscaling to the city-level units range from 10% to 300% [13,20,28]. Previous studies related the remarkable differences among multiple inventories at the prefectural-city-level to (1) the utilization of data sources from the national, provincial, or enterprise levels and (2) the divergence of point-source information [13,20].
Our study found a similar range of prefectural-city-level emission differences (10–230%) among the inventories under investigation. Our study found two facts based on the investigation of 16 cities in Shandong. One is that outdated point-source databases cause inventories such as PKU-CO2 and EDGAR to be unqualified for evaluating city-level emissions and their evolution. Another finding is that different point-source databases introduce regional biases to the inventories. For example, comparing the two inventories using a highly resolved point-source database, the CHRED shows high estimates for traditional industrial cities, while the MEIC provides high estimates for cities with complex and dynamic industrial systems.
Thus, we suggest that a reliable and up-to-date point-source database at unit (/enterprise) level is of the first priority to improve the quality of city-level emission estimates from bottom-up emission inventories. This is particularly important for the regions such as Shandong, where the industrial structure transitions and industrial technological upgrades (e.g., [29,30]) are remarkable, while the quality of the statistical data is poor.
Another valuable approach to independently verify the bottom-up CO2 emission inventories is CO2 flux inversion based on a transport model assimilating observed CO2 concentrations. A series of monitoring networks have been established, for example, the INFLUX project in Indianapolis [31], Paris [32], and Beijing [33]. The ongoing CO2-monitoring project located at Jinan will provide insights into the potential of atmospheric observations for evaluating city-level inventories in the future.

5. Conclusions

The provincial- and city-level CO2 emissions in Shandong province were investigated using open-source gridded CO2 emission inventories (EDGAR; MEIC; PKU-CO2) and statistical data-based inventories (CHRED; CEAD). The provincial- and city-level uncertainties were evaluated to determine the aggregated emissions as well as the emission structure (industrial emissions/total emissions). The results suggest that (1) cross-inventory discrepancies for aggregated provincial emissions are acceptable (~20%) and that all inventories are qualified to evaluate provincial emission changes; (2) remarkable cross-inventory uncertainties for city-level emissions exist not only in their aggregated emissions but also in their changes over time.
The results show that the uncertainties in the provincially aggregated emissions across the involved five inventories are around ±20%, as quantified by the relative standard deviation, and 50%, as quantified by the relative differences between the individual inventories ((max-min)/min). The MEIC agrees better with city-level statistics-based inventories (CEADs and CHRED), while the EDGAR and PKU-CO2 are 15%-50% lower than them. Although the involved inventories show similarity in their spatial patterns, the discrepancies in the emission estimations for individual cities are very large. The city-level emission differences between maximum and minimum estimates vary from 10% to 230% for the 16 cities in 2010. The large cross-inventory uncertainties (>100%) are identified for heavily industrial cities with high carbon intensities and cities with complex and dynamic industrial systems where the carbon intensities are relatively low. The MEIC provides relatively high estimates for cities with complex and dynamic industrial systems (e.g., Qingdao, Yantai, Weihai, and Jining), while CHRED tends to provide high estimates for heavily industrial cities (e.g., Zibo and Zaozhuang). Our results suggest that this is related to the different point-source databases used in the MEIC and CHRED.
Good agreement was found among all of the involved inventories in terms of the time evolution of the aggregated provincial emissions: the provincial emissions increased by ~5% per year before 2012, and the increasing trend slowed down after 2012. In addition, all of the inventories show a quasi-stationary industrial emission proportion over the common time range (2008–2014). However, the discrepancies in the emission changes over the same period are remarkable when downscaled to cities. The CHRED and MEIC agree well regarding the evolution of city-level emissions and their structure changes. Both inventories characterize three groups of cities: the first group shows a clear decline as early as 2005; the second one shows a decline a few years later; and the third group shows a continuous emission increase. The PKU-CO2 and EDGAR failed to capture these emission characteristics and their structural changes at the city level. This is clearly related to the fact that their common point-source database stopped being updated in 2012. The MEIC is the only qualified inventory among the three gridded inventories and can be used to represent city-level emission changes.

Supplementary Materials

The following supporting information can be downloaded at: https://www.mdpi.com/article/10.3390/atmos13091474/s1, 1. EDGAR, 2. PKU-CO2, 3. MEIC and 4. CHRED. Refs. [34,35] are cited in Supplementary Materials.

Author Contributions

Conceptualization, Z.C., M.T. and Y.L.; methodology, M.T. and Z.C.; software, K.C., D.Y. and M.Y.; analysis, M.T., L.W. and P.W.; visualization, M.T. and K.C.; writing—original draft preparation, M.T and Z.C.; writing—review and editing, all authors. All authors have read and agreed to the published version of the manuscript.

Funding

This research was funded by the National Key R&D Program of China, grant number “2019YFE0127500”; and the National Natural Science Foundation of China for young scholars, grant number “42105060” and “Youth Innovation Promotion Association, UCAS”.

Data Availability Statement

All the emission inventories were obtained from open-source data. The download links are listed in Table 1.

Acknowledgments

We would thank the Shandong collaborative innovation center of industrial technology for providing the economic information on city development in Shandong.

Conflicts of Interest

The authors declare no conflict of interest.

References

  1. Eggleston, S.; Buendia, L.; Miwa, K.; Ngara, T.; Tanabe, K. (Eds.) . 2006 IPCC Guidelines for National Greenhouse Gas Inventories Volume 4 Agriculture, Forestry and Other Land Use; IGES: Hayama, Japan, 2006. [Google Scholar]
  2. Janssensm Ae Nhout, G.; Crippa, M.; Guizzardi, D.; Muntean, M.; Schaaf, E.; Olivier, J.; Peters, J.; Schure, K.M. Fossil CO2 and GHG Emissions of All World Countries. 2017. Available online: https://edgar.jrc.ec.europa.eu/report_2017 (accessed on 9 September 2022).
  3. Crippa, M.; Solazzo, E.; Huang, G.; Guizzardi, D.; Koffi, E.; Muntean, M.; Schieberle, C.; Friedrich, R.; Janssens-Maenhout, G. High resolution temporal profiles in the Emissions Database for Global Atmospheric Research. Sci. Data 2020, 7, 121. [Google Scholar] [CrossRef] [PubMed]
  4. Wang, R.; Tao, S.; Ciais, P.; Shen, H.Z.; Huang, Y.; Chen, H.; Shen, G.F.; Wang, B.; Li, W.; Zhang, Y.Y.; et al. High-resolution mapping of combustion processes and implications for CO2 emissions. Atmos. Chem. Phys. 2013, 13, 5189–5203. [Google Scholar] [CrossRef]
  5. Liu, Z.; Guan, D.; Wei, W.; Davis, S.J.; Ciais, P.; Bai, J.; Peng, S.; Zhang, Q.; Hubacek, K.; Marland, G.; et al. Reduced carbon emission estimates from fossil fuel combustion and cement production in China. Nature 2015, 524, 335–338. [Google Scholar] [CrossRef] [PubMed]
  6. Li, M.; Liu, H.; Geng, G.; Hong, C.; Liu, F.; Song, Y.; Tong, D.; Zheng, B.; Cui, H.; Man, H.; et al. Anthropogenic emission inventories in China: A review. Natl. Sci. Rev. 2017, 4, 834–866. [Google Scholar] [CrossRef]
  7. Zheng, B.; Tong, D.; Li, M.; Liu, F.; Hong, C.; Geng, G.; Li, H.; Li, X.; Peng, L.; Qi, J.; et al. Trends in China’s anthropogenic emissions since 2010 as the consequence of clean air actions. Atmos. Chem. Phys. 2018, 18, 14095–14111. [Google Scholar] [CrossRef]
  8. Cai, B.; Liang, S.; Zhou, J.; Wang, J.; Cao, L.; Qu, S.; Xu, M.; Yang, Z. China high resolution emission database (CHRED) with point emission sources, gridded emission data, and supplementary socioeconomic data. Resour. Conserv. Recycl. 2017, 129, 232–239. [Google Scholar] [CrossRef]
  9. Wang, J.; Cai, B.; Zhang, L.; Cao, D.; Liu, L.; Zhou, Y.; Zhang, Z.; Xue, W. High Resolution Carbon Dioxide Emission Gridded Data for China Derived from Point Sources. Environ. Sci. Technol. 2014, 48, 7085–7093. [Google Scholar] [CrossRef]
  10. Guan, Y.; Shan, Y.; Huang, Q.; Chen, H.; Wang, D.; Hubacek, K. Assessment to China’s Recent Emission Pattern Shifts. Earth’s Future 2021, 9, e2021EF002241. [Google Scholar] [CrossRef]
  11. Shan, Y.; Zheng, H.; Ou, J.; Li, Y.; Meng, J.; Mi, Z.; Liu, Z.; Zhang, Q. China CO2 emission accounts 1997–2015. Sci. Data 2018, 5, 170201. [Google Scholar] [CrossRef]
  12. Shan, Y.; Huang, Q.; Guan, D.; Hubacek, K. China CO2 emission accounts 2016–2017. Sci. Data 2020, 7, 54. [Google Scholar] [CrossRef] [Green Version]
  13. Han, P.; Zeng, N.; Oda, T.; Zhang, W.; Lin, X.; Liu, D.; Cai, Q.; Ma, X.; Meng, W.; Wang, G.; et al. A city-level comparison of fossil-fuel and industry processes-induced CO2 emissions over the Beijing-Tianjin-Hebei region from eight emission inventories. Carbon Balance Manag. 2020, 15, 25. [Google Scholar] [CrossRef] [PubMed]
  14. Marland, G.; Rotty, R.M.; Treat, N.L. CO2 from fossil fuel burning: Global distribution of emissions. Tellus B Chem. Phys. Metereol. 1985, 37B, 243–258. [Google Scholar] [CrossRef]
  15. Andres, R.J.; Boden, T.A.; Bréon, F.-M.; Ciais, P.; Davis, S.; Erickson, D.; Gregg, J.S.; Jacobson, A.; Marland, G.; Miller, J.; et al. A synthesis of carbon dioxide emissions from fossil-fuel combustion. Biogeosciences 2012, 9, 1845–1871. [Google Scholar] [CrossRef]
  16. Trends in Global CO2 Emissions. 2014. Available online: https://www.pbl.nl/en/publications/trends-in-global-CO2-emissions-2014-report (accessed on 9 September 2022).
  17. The Core Writing Team; Pachauri, R.K.; Meyer, L. (Eds.) Climate Change 2014 Synthesis Report: Summary for Policymakers. 2014. Available online: https://www.ipcc.ch/site/assets/uploads/2018/02/AR5_SYR_FINAL_SPM.pdf (accessed on 9 September 2022).
  18. Shan, Y.; Liu, J.; Liu, Z.; Xu, X.; Shao, S.; Wang, P.; Guan, D. New provincial CO2 emission inventories in China based on apparent energy consumption data and updated emission factors. Appl. Energy 2016, 184, 742–750. [Google Scholar] [CrossRef]
  19. Chen, J.; Zhao, F.; Zeng, N.; Oda, T. Comparing a global high-resolution downscaled fossil fuel CO2 emission dataset to local inventory-based estimates over 14 global cities. Carbon Balance Manag. 2020, 15, 9. [Google Scholar] [CrossRef]
  20. Gately, C.K.; Hutyra, L.R. Large Uncertainties in Urban-Scale Carbon Emissions. J. Geophys. Res. Atmos. 2017, 122, 11,242–11,260. [Google Scholar] [CrossRef]
  21. Gurney, K.R.; Liang, J.; O’Keeffe, D.; Patarasuk, R.; Hutchins, M.; Huang, J.; Rao, P.; Song, Y. Comparison of Global Downscaled Versus Bottom-Up Fossil Fuel CO2 Emissions at the Urban Scale in Four U. S. Urban Areas. J. Geophys. Res. Atmos. 2019, 124, 2823–2840. [Google Scholar] [CrossRef]
  22. Oda, T.; Bun, R.; Kinakh, V.; Topylko, P.; Halushchak, M.; Marland, G.; Lauvaux, T.; Jonas, M.; Maksyutov, S.; Nahorski, Z.; et al. Errors and uncertainties in a gridded carbon dioxide emissions inventory. Mitig. Adapt. Strat. Glob. Chang. 2019, 24, 1007–1050. [Google Scholar] [CrossRef]
  23. Yuli, S.; Guan, D.; Hubacek, K.; Zheng, B.; Davis, S.J.; Jia, L.; Liu, J.; Liu, Z.; Fromer, N.; Mi, Z.; et al. City-level climate change mitigation in China. Sci. Adv. 2018, 2018. 4, eaaq0390. [Google Scholar]
  24. Han, P.; Zeng, N.; Oda, T.; Lin, X.; Crippa, M.; Guan, D.; Janssens-Maenhout, G.; Ma, X.; Liu, Z.; Shan, Y.; et al. Evaluating China’s fossil-fuel CO2 emissions from a comprehensive dataset of nine inventories. Atmos. Chem. Phys. 2020, 20, 11371–11385. [Google Scholar] [CrossRef]
  25. Liu, F.; Zhang, Q.; Tong, D.; Zheng, B.; Li, M.; Huo, H.; He, K.B. High-resolution inventory of technologies, activities, and emissions of coal-fired power plants in China from 1990 to 2010. Atmos. Chem. Phys. 2015, 15, 13299–13317. [Google Scholar] [CrossRef] [Green Version]
  26. Janssens-Maenhout, G.; Crippa, M.; Guizzardi, D.; Muntean, M.; Schaaf, E.; Dentener, F.; Bergamaschi, P.; Pagliari, V.; Olivier, J.G.J.; Peters, J.A.H.W.; et al. EDGAR v4.3.2 Global Atlas of the three major greenhouse gas emissions for the period 1970–2012. Earth Syst. Sci. Data 2019, 11, 959–1002. [Google Scholar] [CrossRef]
  27. Mosier, A.; Kroeze, C.; Nevison, C.; Oenema, O.; Seitzinger, S.; van Cleemput, O. An overview of the revised 1996 IPCC guidelines for national greenhouse gas inventory methodology for nitrous oxide from agriculture. Environ. Sci. Policy 1999, 2, 325–333. [Google Scholar] [CrossRef]
  28. Cai, B.; Li, W.; Dhakal, S.; Wang, J. Source data supported high resolution carbon emissions inventory for urban areas of the Beijing-Tianjin-Hebei region: Spatial patterns, decomposition and policy implications. J. Environ. Manag. 2018, 206, 786–799. [Google Scholar] [CrossRef] [PubMed]
  29. Giwa, S.O.; Nwaokocha, C.N.; Samuel, D.O. Off-grid gasoline-powered generators: Pollutants’ footprints and health risk assessment in Nigeria. Energy Sources Part A Recovery Util. Environ. Eff. 2019, 18. [Google Scholar] [CrossRef]
  30. Singh, T.S.; Rajak, U.; Samuel, O.D.; Chaurasiya, P.K.; Natarajan, K.; Verma, T.N.; Nashine, P. Optimization of performance and emission parameters of direct injection diesel engine fuelled with microalgae Spirulina (L.)—Response surface methodology and full factorial method approach. Fuel 2020, 285, 119103. [Google Scholar] [CrossRef]
  31. Mitchell, L.E.; Lin, J.C.; Bowling, D.R.; Pataki, D.E.; Strong, C.; Schauer, A.J.; Bares, R.; Bush, S.E.; Stephens, B.B.; Mendoza, D.; et al. Long-term urban carbon dioxide observations reveal spatial and temporal dynamics related to urban characteristics and growth. Proc. Natl. Acad. Sci. USA 2018, 115, 2912–2917. [Google Scholar] [CrossRef]
  32. Bréon, F.M.; Broquet, G.; Puygrenier, V.; Chevallier, F.; Xueref-Rémy, I.; Ramonet, M.; Dieudonné, E.; Lopez, M.; Schmidt, M.; Perrussel, O.; et al. An attempt at estimating Paris area CO2 emissions from atmospheric concentration measurements. Atmos. Chem. Phys. 2015, 15, 1707–1724. [Google Scholar] [CrossRef]
  33. Che, K.; Liu, Y.; Cai, Z.; Yang, D.; Wang, H.; Ji, D.; Yang, Y.; Wang, P. Characterization of Regional Combustion Efficiency using ΔXCO: ΔXCO2 Observed by a Portable Fourier-Transform Spectrometer at an Urban Site in Beijing. Adv. Atmos. Sci. 2022, 39, 1299–1315. [Google Scholar] [CrossRef]
  34. Zhang, Y.; Tao, S.; Cao, J.; Coveney, R.M. Emission of polycyclic aromatic hydrocarbons in China by county. Environ. Sci. Technol. 2007, 41, 683–687. [Google Scholar] [CrossRef]
  35. Liu, J.; Tong, D.; Zheng, Y.; Cheng, J.; Qin, X.; Shi, Q.; Yan, L.; Lei, Y.; Zhang, Q. Carbon and air pollutant emissions from China’s cement industry 1990–2015: Trends, evolution of technologies, and drivers. Atmos. Chem. Phys. 2021, 21, 1627–1647. [Google Scholar] [CrossRef]
Figure 1. Annual CO2 emissions during from 2000 to 2020 (a) and industrial emission ratios (b) from multi-inventories for Shandong province.
Atmosphere 13 01474 g001
Figure 2. The CO2 emission distribution for Shandong province in 2010 from MEIC, EDGAR, and PKU-CO2.
Atmosphere 13 01474 g002
Figure 3. The ratios of industrial CO2 emissions (industrial energy use and industrial processes) to the aggregated city-level emissions in 2010 from CHRED, MEIC, EDGAR, and PKU-CO2.
Atmosphere 13 01474 g003
Figure 4. Top: CO2 emissions of 16 cities in Shandong province from MEIC, EDGAR, PKU-CO2, and CHRED for 2010; bottom: the relative differences in MEIC, EDGAR, and PKU-CO2 in relation to CHRED s1. The cities are ranked according to their emission intensity (emission/GDP, shown as a dark blue line in the top panel). The light blue line in the bottom panel shows the differences (estimated by (max-min)/min) among the inventories.
Atmosphere 13 01474 g004
Figure 5. Evolution of aggregated city-level CO2 emissions from four inventories from 2000 to 2020 for three groups of cities. The definitions of the groups are described in the paper.
Atmosphere 13 01474 g005
Figure 6. Same as Figure 4 but for the ratios of industrial emissions to the aggregated city-level emissions. The definitions of the groups are described in the paper.
Atmosphere 13 01474 g006
Figure 7. The change rates of grid emissions for three inventories during their covered period before 2012 (left column) and after 2012 (right column). The change rates for each grid are derived by 100 % × ( e i y e a r + 1 e i y e a r ) / e i y e a r . The red circles indicate increasing rates (>10%), while blue circles indicate decreasing rates (<−10%). The sizes of the circles are proportional to the change magnitudes, and the circled marking change rates over 50% are plotted with black edges. The bar-plots on the left side of each map show the corresponding cumulative annual change emissions (outlined in black) and the amount of industrial emissions (shaded in color), which are sorted using the different gridded change scales (y-axis).
Atmosphere 13 01474 g007
Table 1. Information about the emission inventories used in this study.
DatabaseEDGAR v6PKU-CO2 v2MEIC v1.3CHRED *CEADs *
Level of source dataNational level dataNational and subnational level dataProvince-level dataCity- and enterprise-level dataProvince-level data
MethodologySectoral approachApparent consumptionSectoral approachSectoral approachSectoral approach and apparent consumption
Scope1111 and 21
Time window1970–20181960–20142008–20172005, 2010, 20151997–2015
Spatial resolution0.1° × 0.1°0.1° × 0.1°0.25° × 0.25°Prefecture-level administrative unitsProvincial administrative units
Original unitkg m−2 s−1G km−2 year−1G cell−1 year−1Wt per unitWt per unit
Emission factor of raw coal and oil (tC /ton)0.713/0.8380.510/0.7580.491/0.8290.518/0.8390.499/0.829
Point sourceCarmaCarmaCpedFcpsc N/A
Info about point sourceUpdates end at 2012Unit-based1300 more small power planes than CARMA in China at 2009 [25]Enterprise-level1.5 million industrial facilities and 2000 landfills and 4000 water treatment planesN/A
Area sourcePopulation, nighttime lightPopulation, nighttime light, vegetationPopulation, land usePopulation, land use, human activityN/A
Line sourceOpen street and railway mapN/ATransport networksNational road, railway, navigation network, traffic flowN/A
Download linkEDAGR. Available online: https://edgar.jrc.ec.europa.eu/ (accessed on 9 September 2022)PKU-Fuel. Available online: http://inventory.pku.edu.cn/ (accessed on 9 September 2022)MEIC. Available online: http://meicmodel.org/ (accessed on 9 September 2022)CHRED. Available online: http://www.cityghg.com (accessed on 9 September 2022)CEADs. Available online: http://www.ceads.net (accessed on 9 September 2022)
Reference[3,26][4,5][6,7][8,9][10,11,12]
* Both the sectoral approach and the apparent consumption approach are applied to estimate emission for CEADs. Thus, the corresponding emission estimates are abbreviated to CEADs sec and CEADs app. * Scope 1 (territorial emissions) accounts for emissions within the region boundary, while scope 2 accounts for indirect emissions due to electricity and heat purchased outside the boundary, according to the IPCC definition [27]. In our study, only scope 1 is applied for CHRED, which is abbreviated to CHRED s1.
Publisher’s Note: MDPI stays neutral with regard to jurisdictional claims in published maps and institutional affiliations.

