
Greenhouse Gas Emissions Response to Fertilizer Application and Soil Moisture in Dry Agricultural Uplands of Central Kenya

 ,
,
Abstract
:1. Introduction
2. Materials and Methods
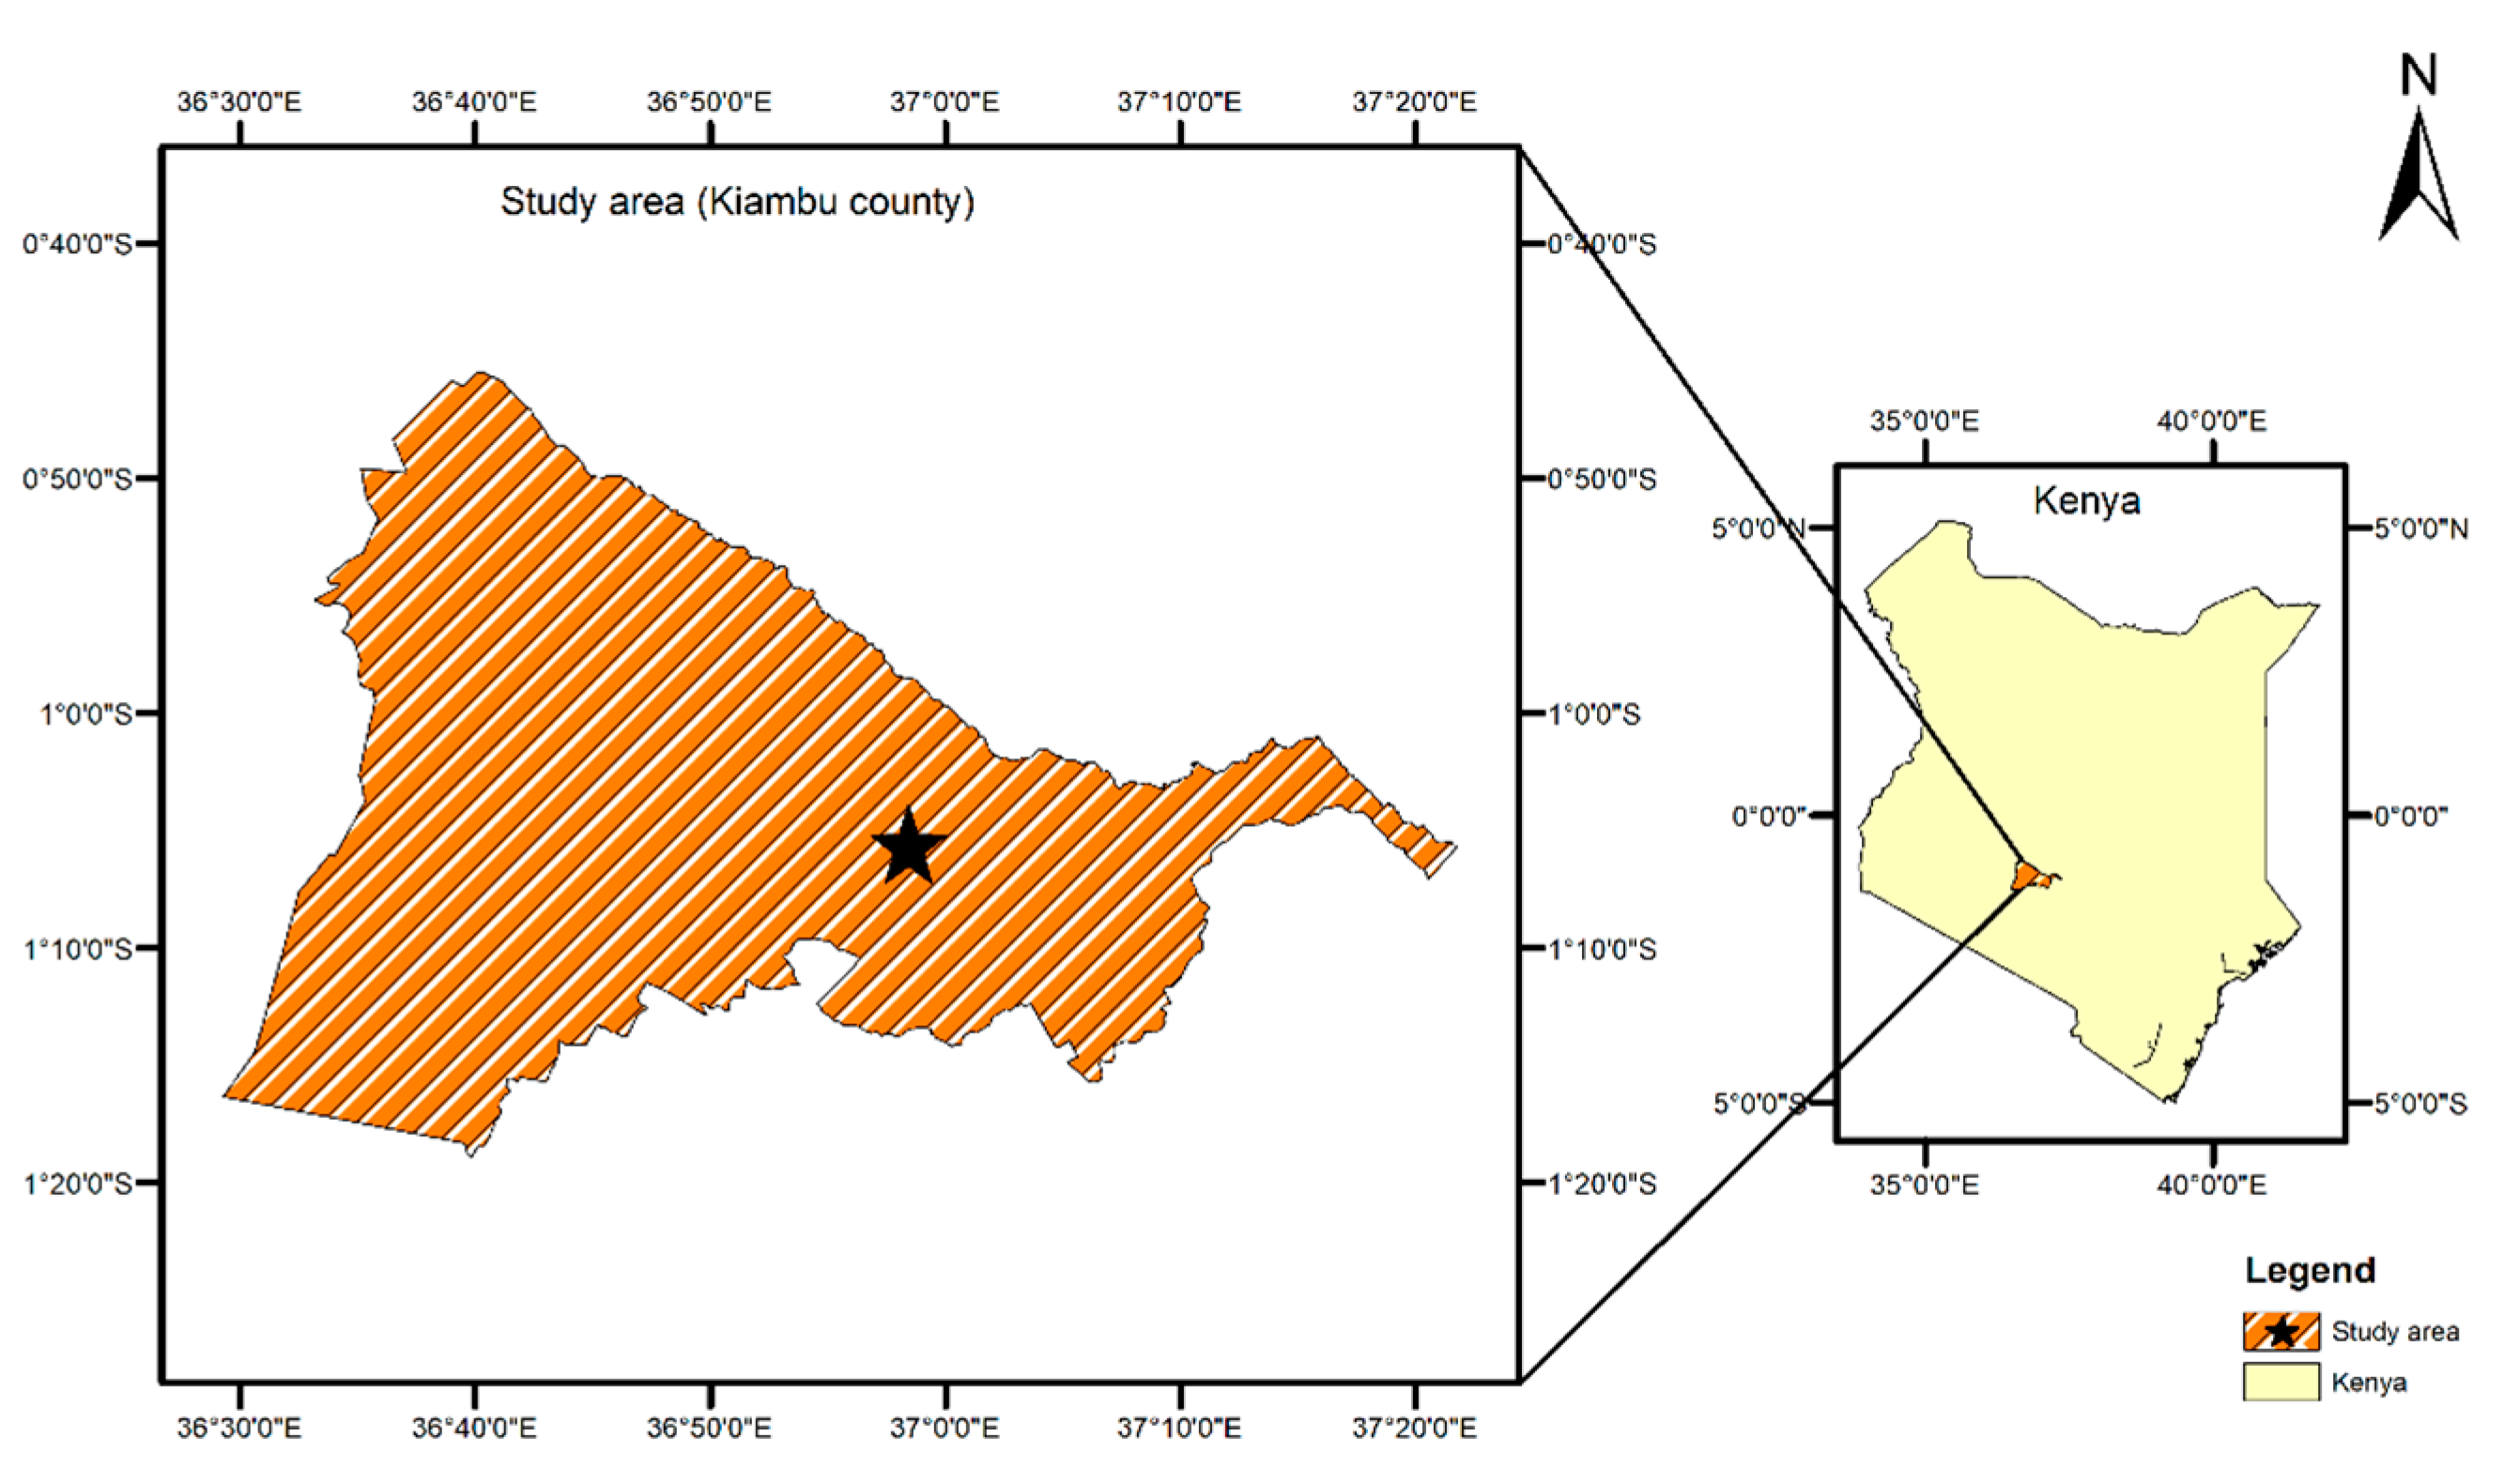
2.1. Site Description
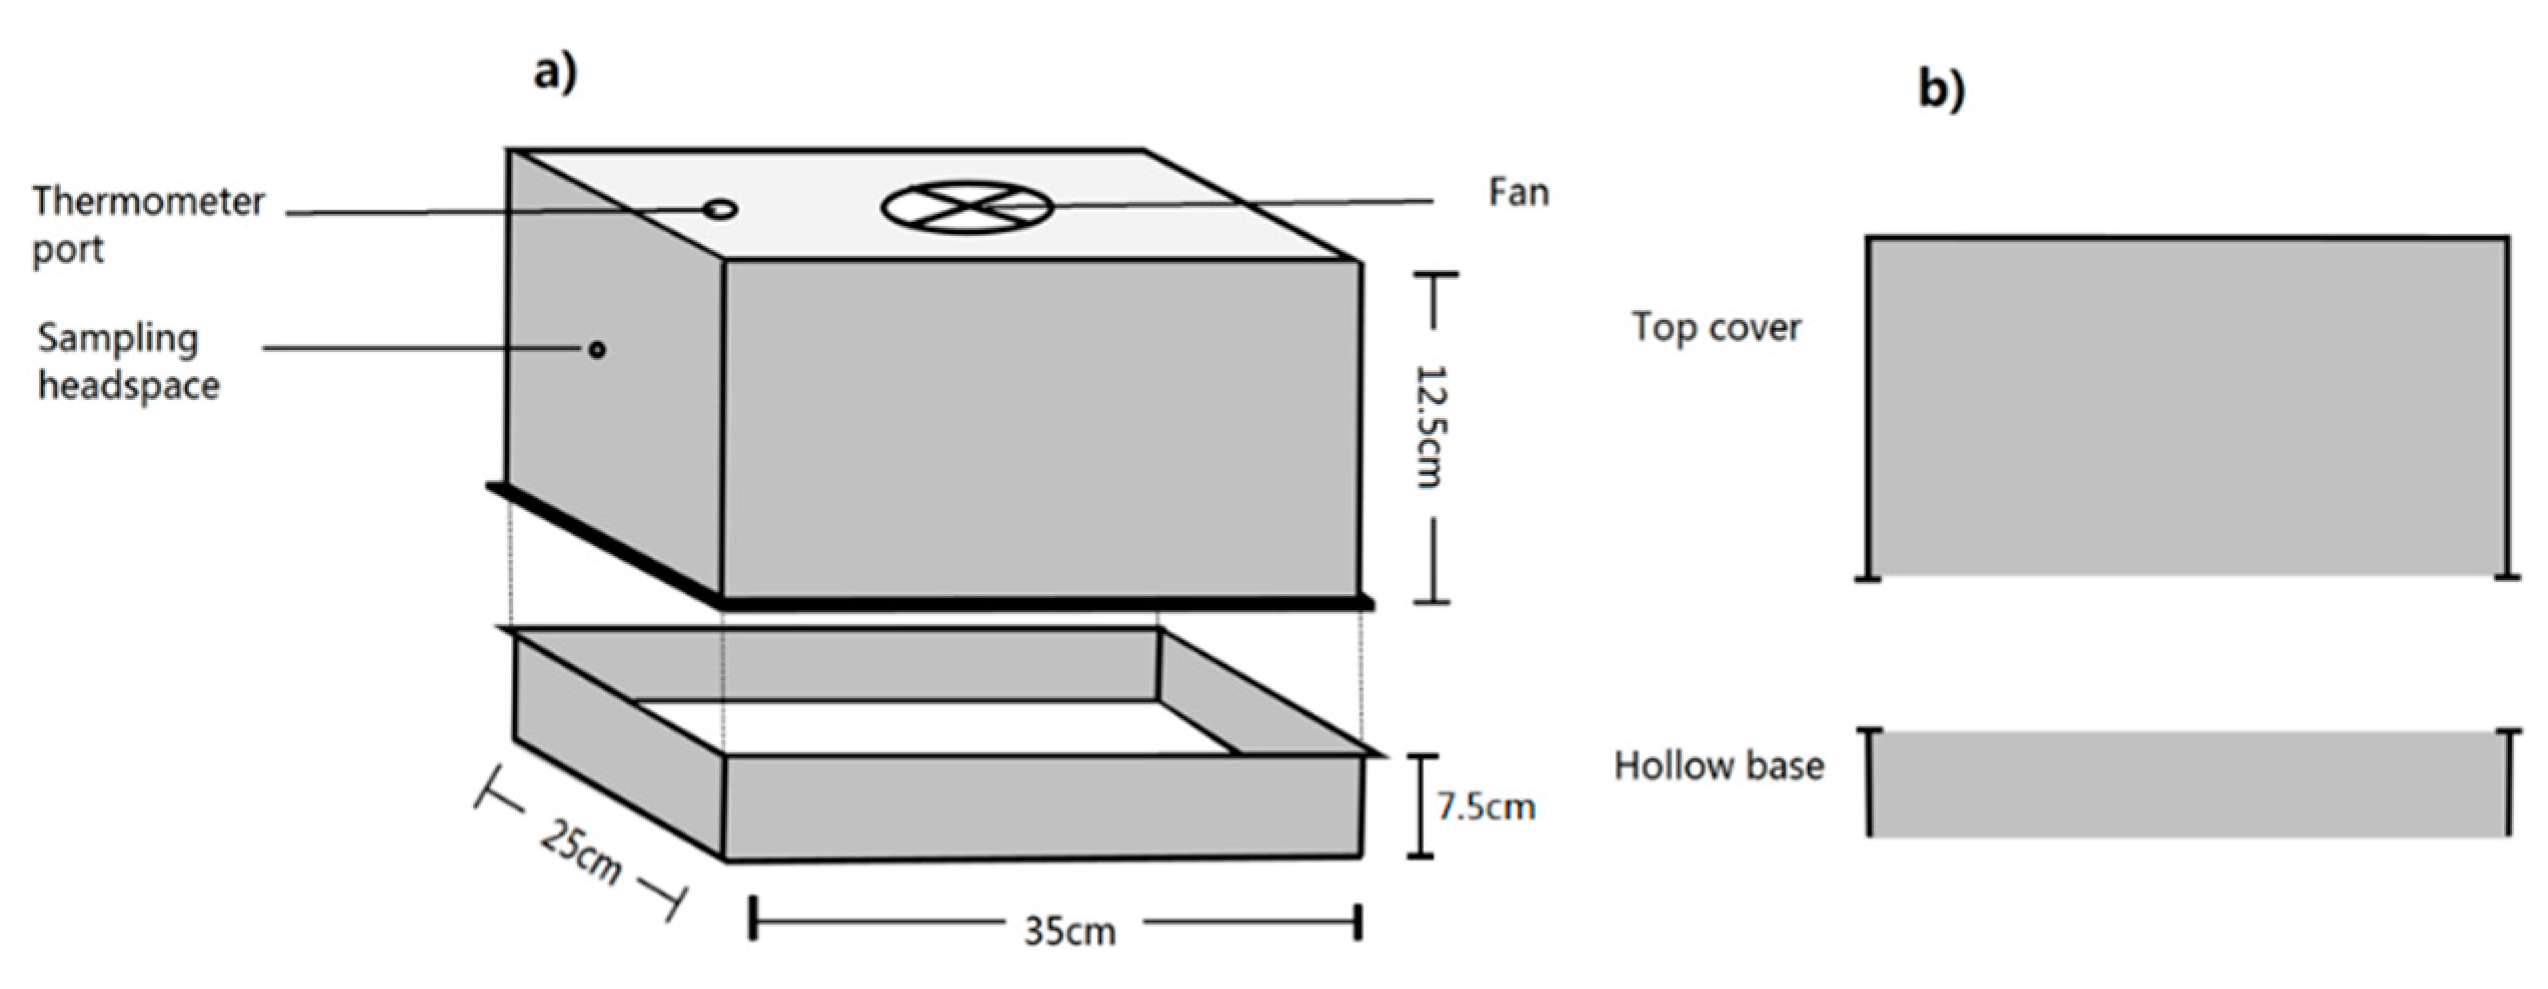
2.2. Chamber Design
2.3. Gas Sample Collection
2.4. Greenhouse Gas Measurements
2.5. Flux Calculations
2.6. Soil Analysis
2.7. Statistical Analysis
3. Results
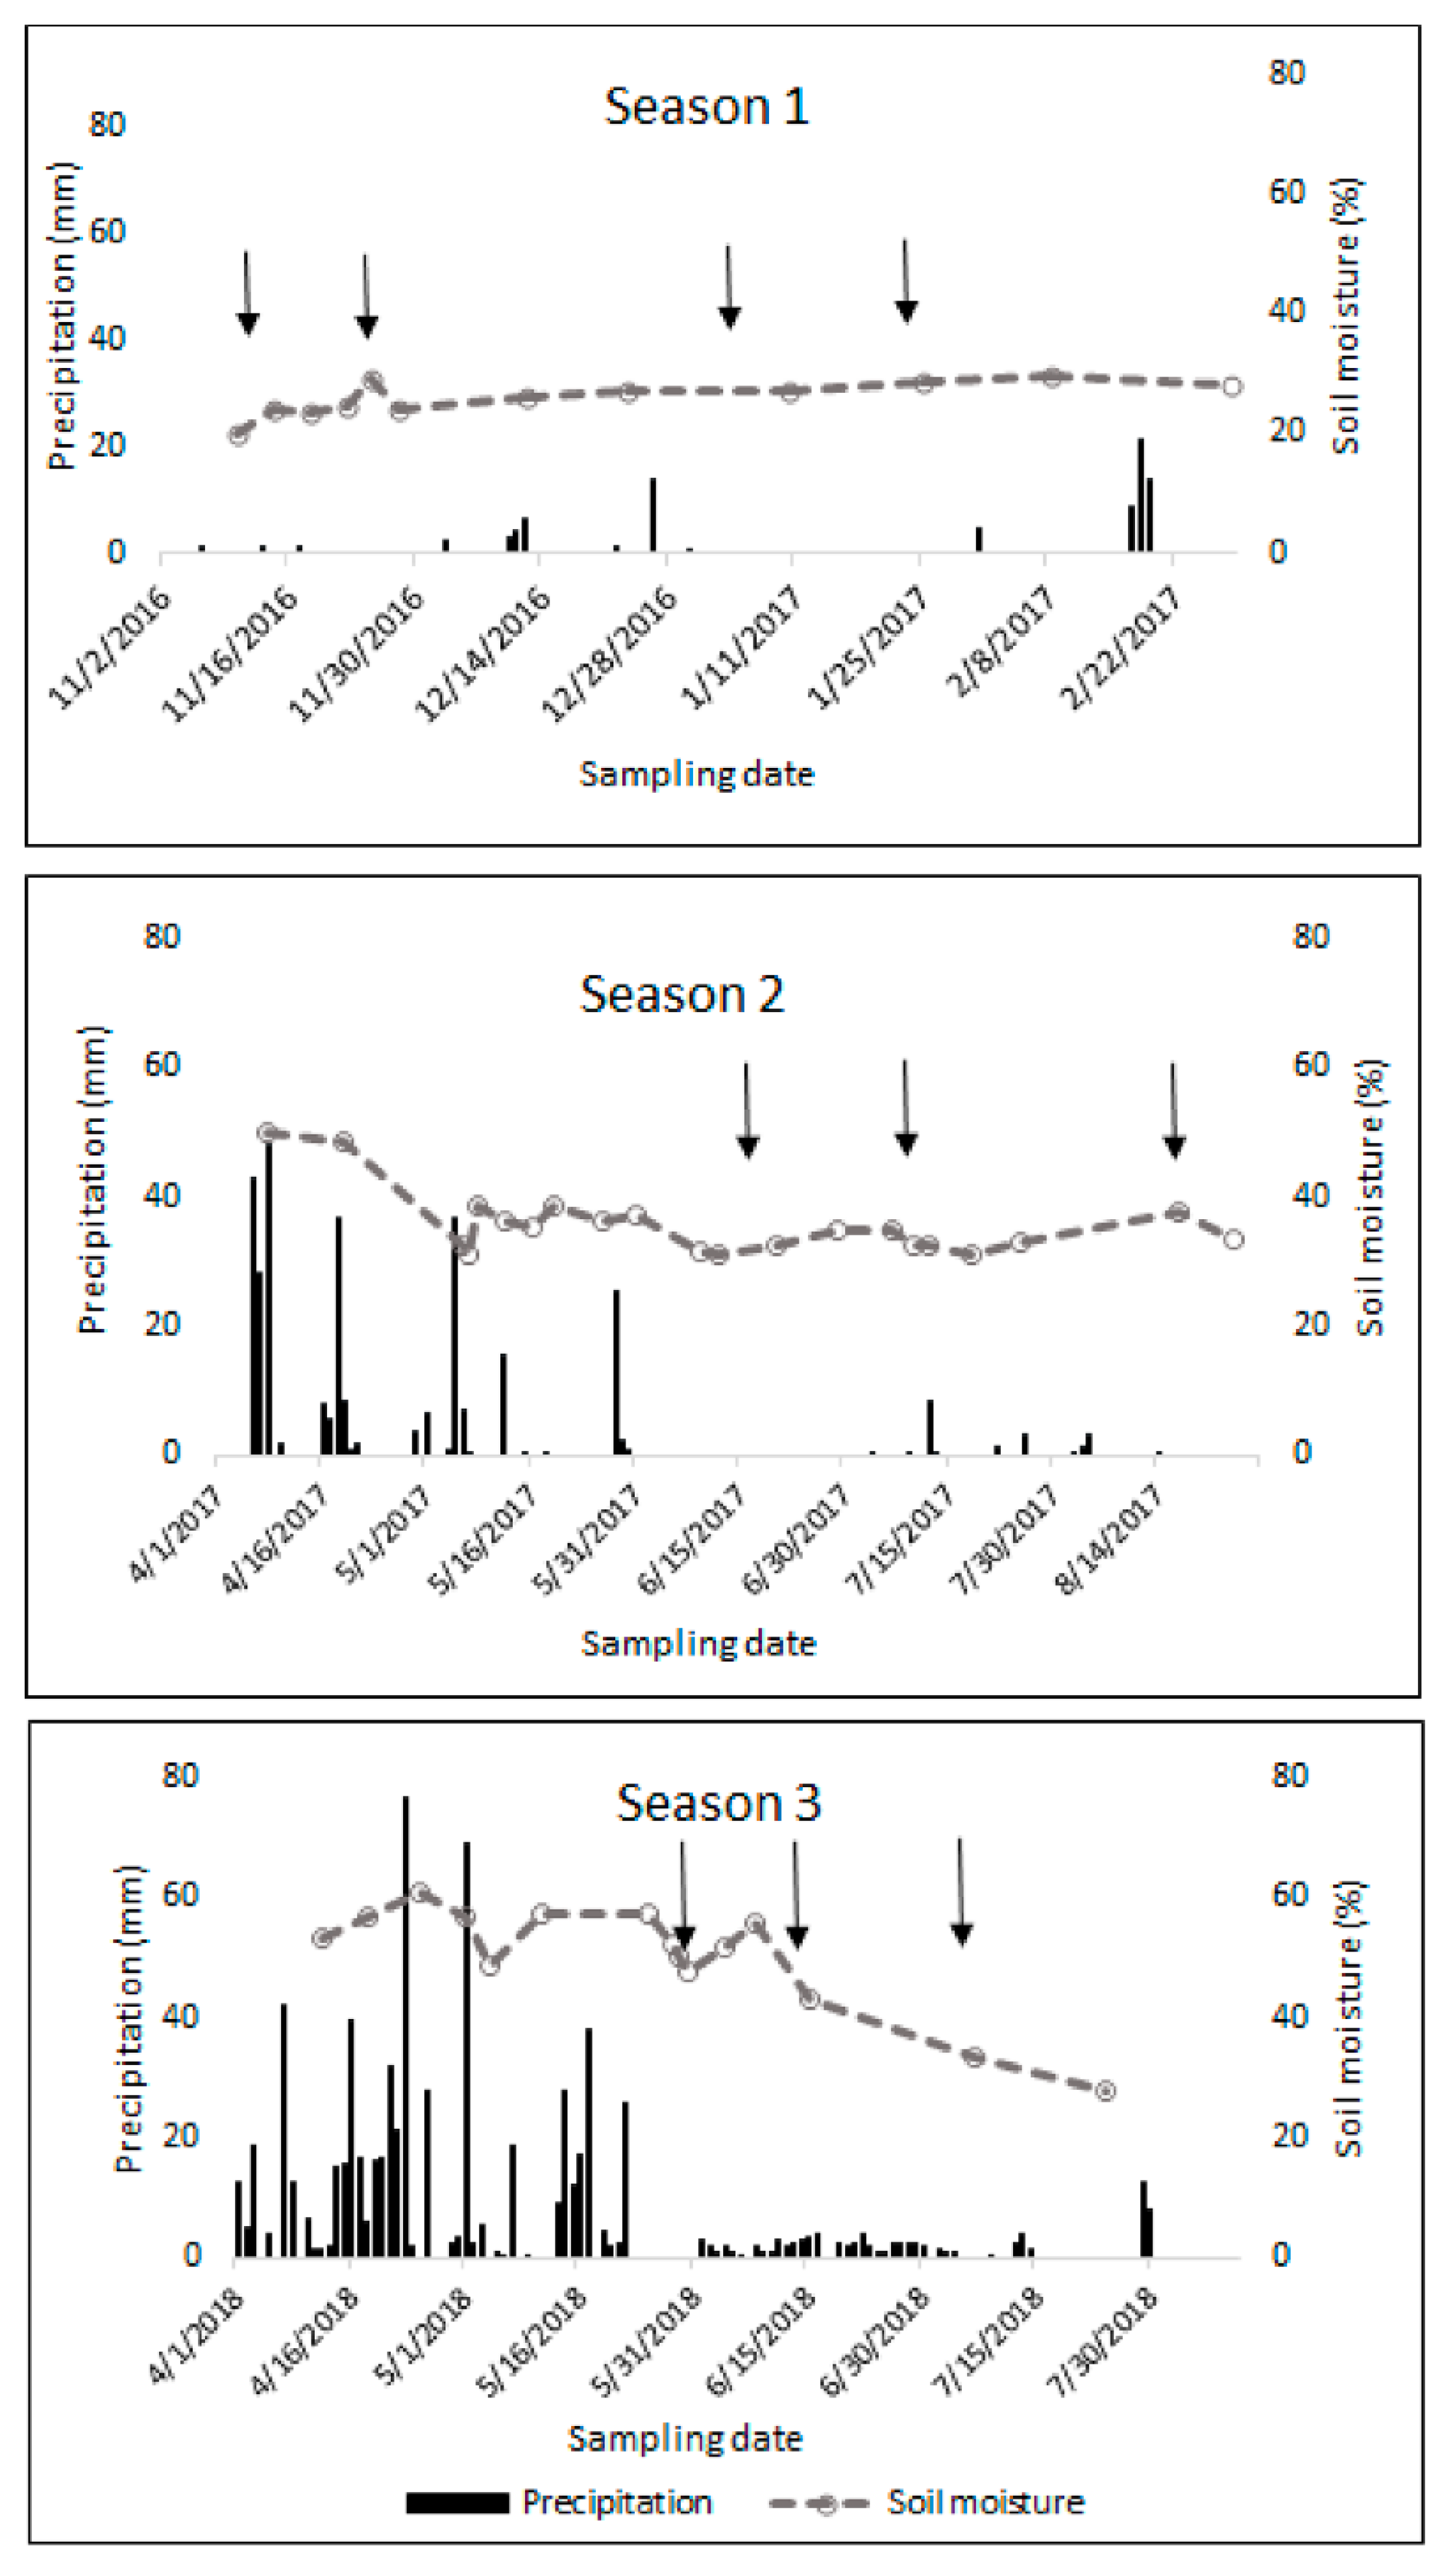
3.1. Environmental Factors
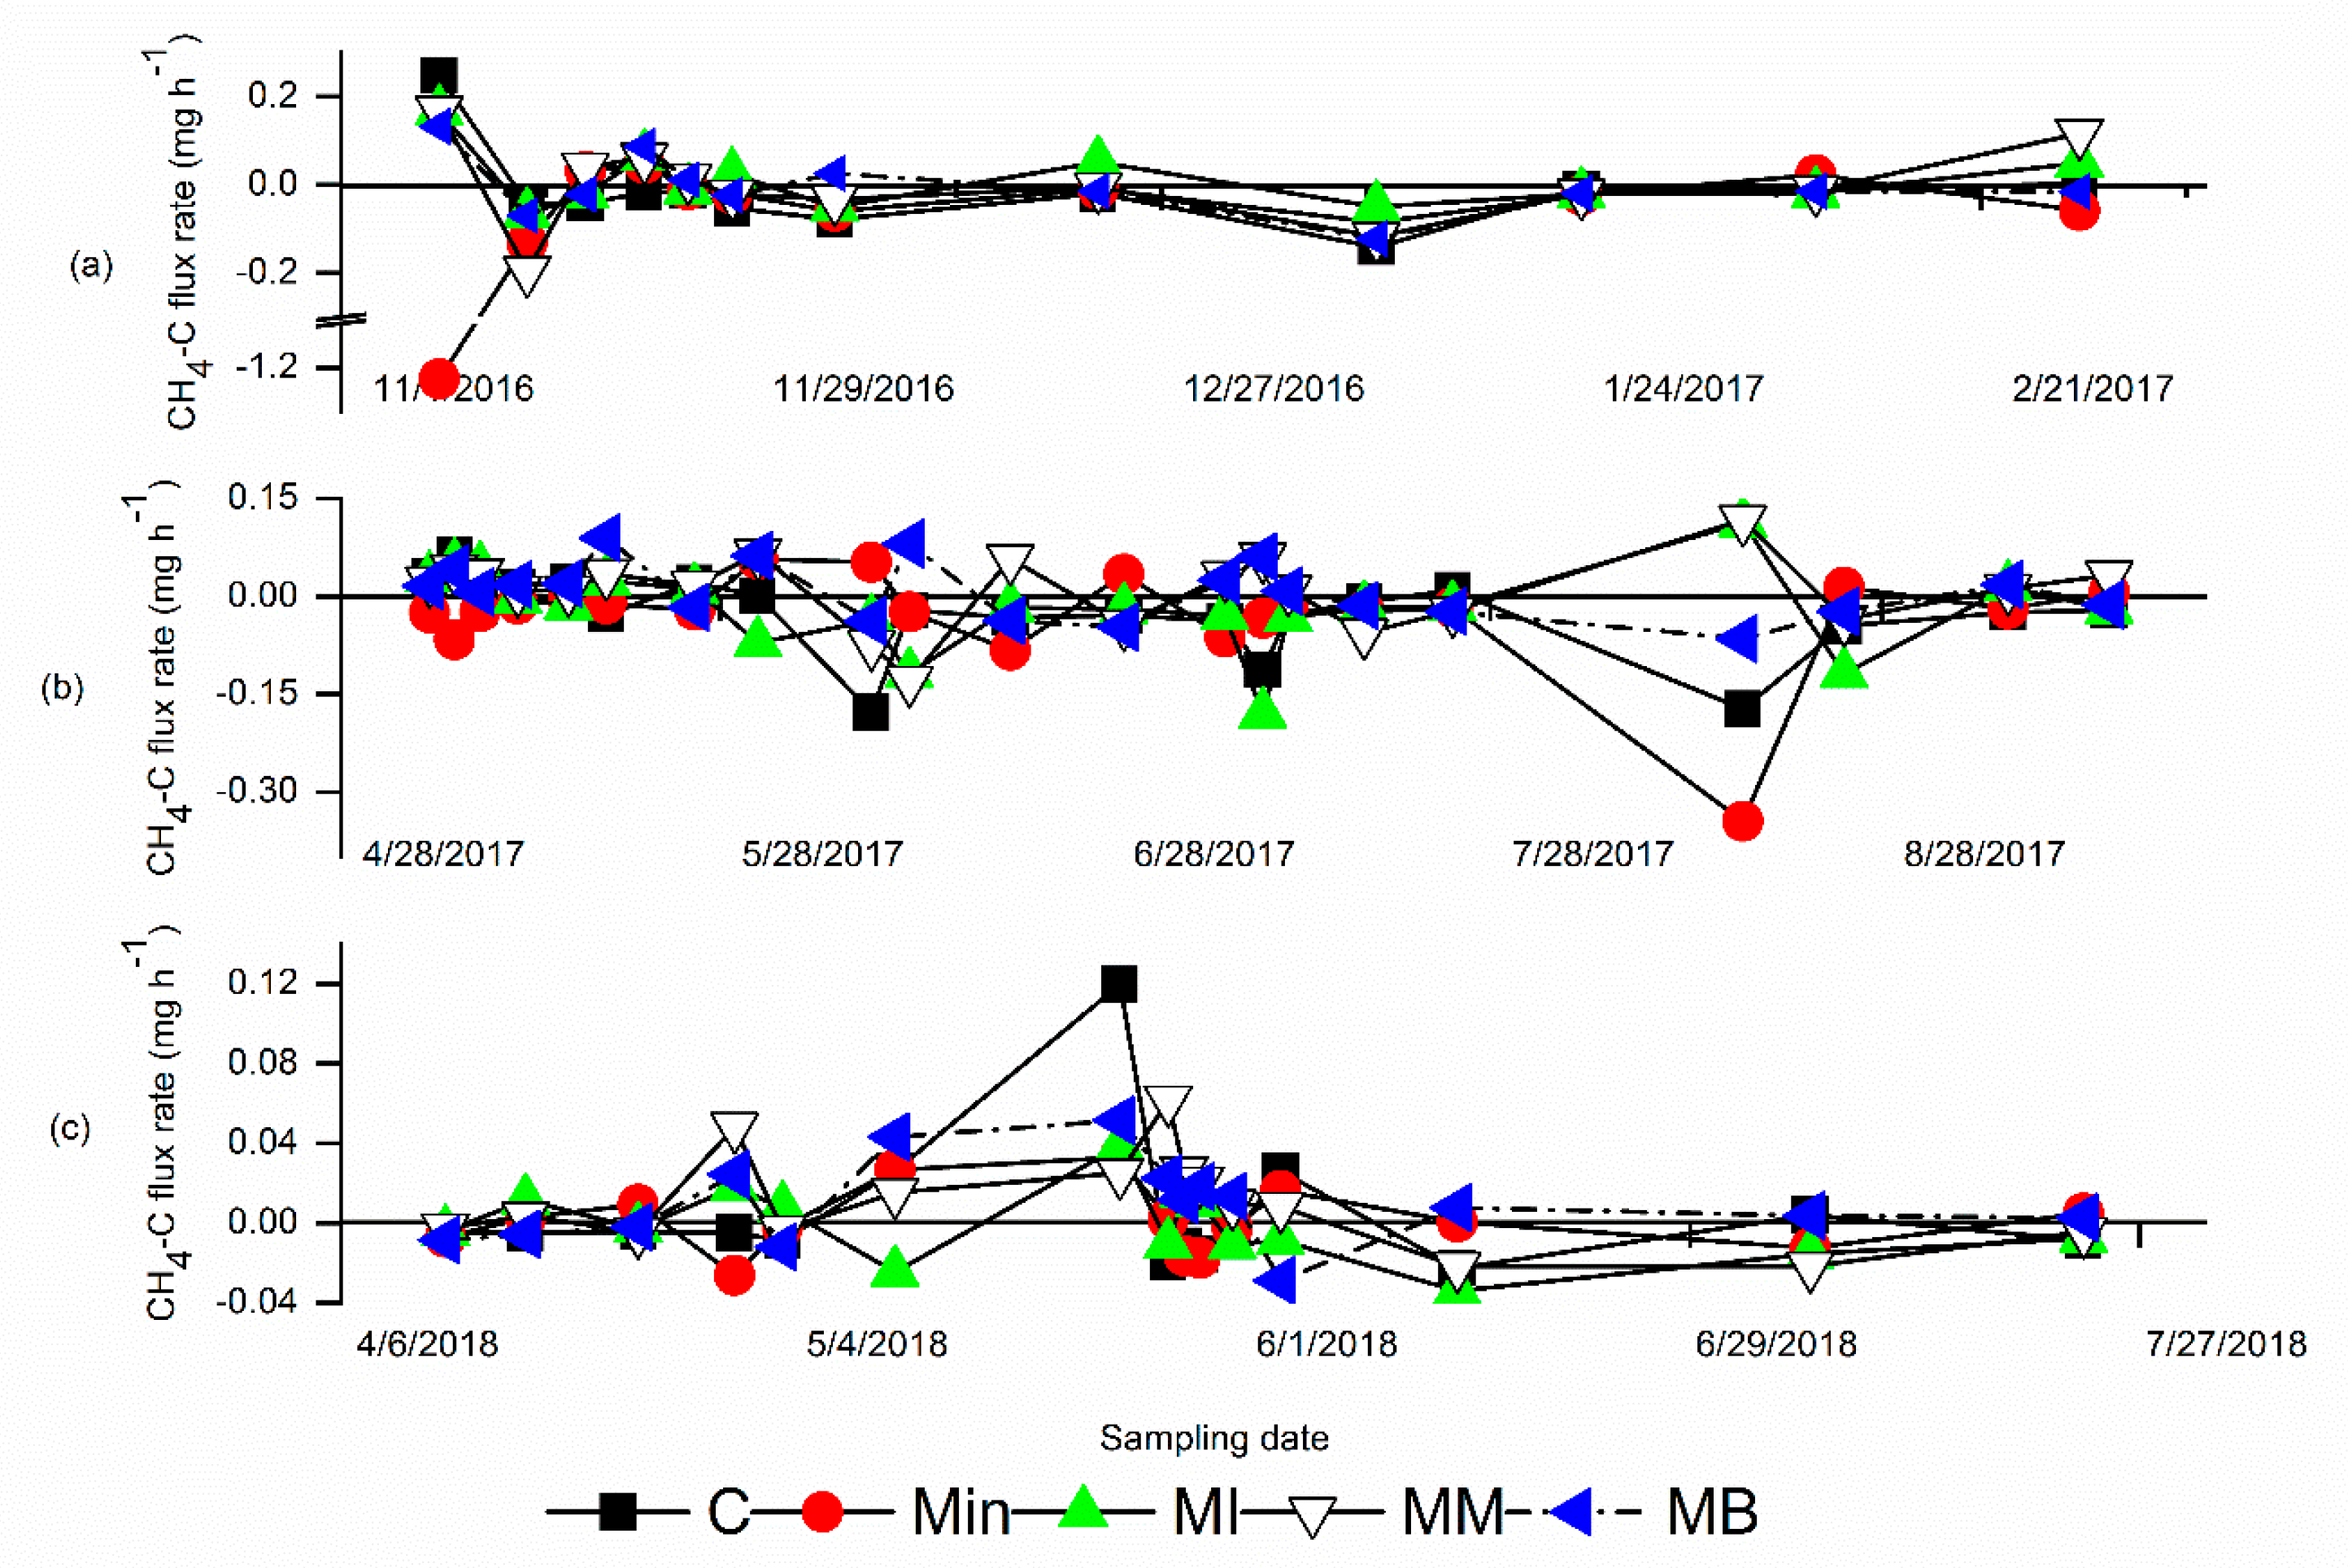
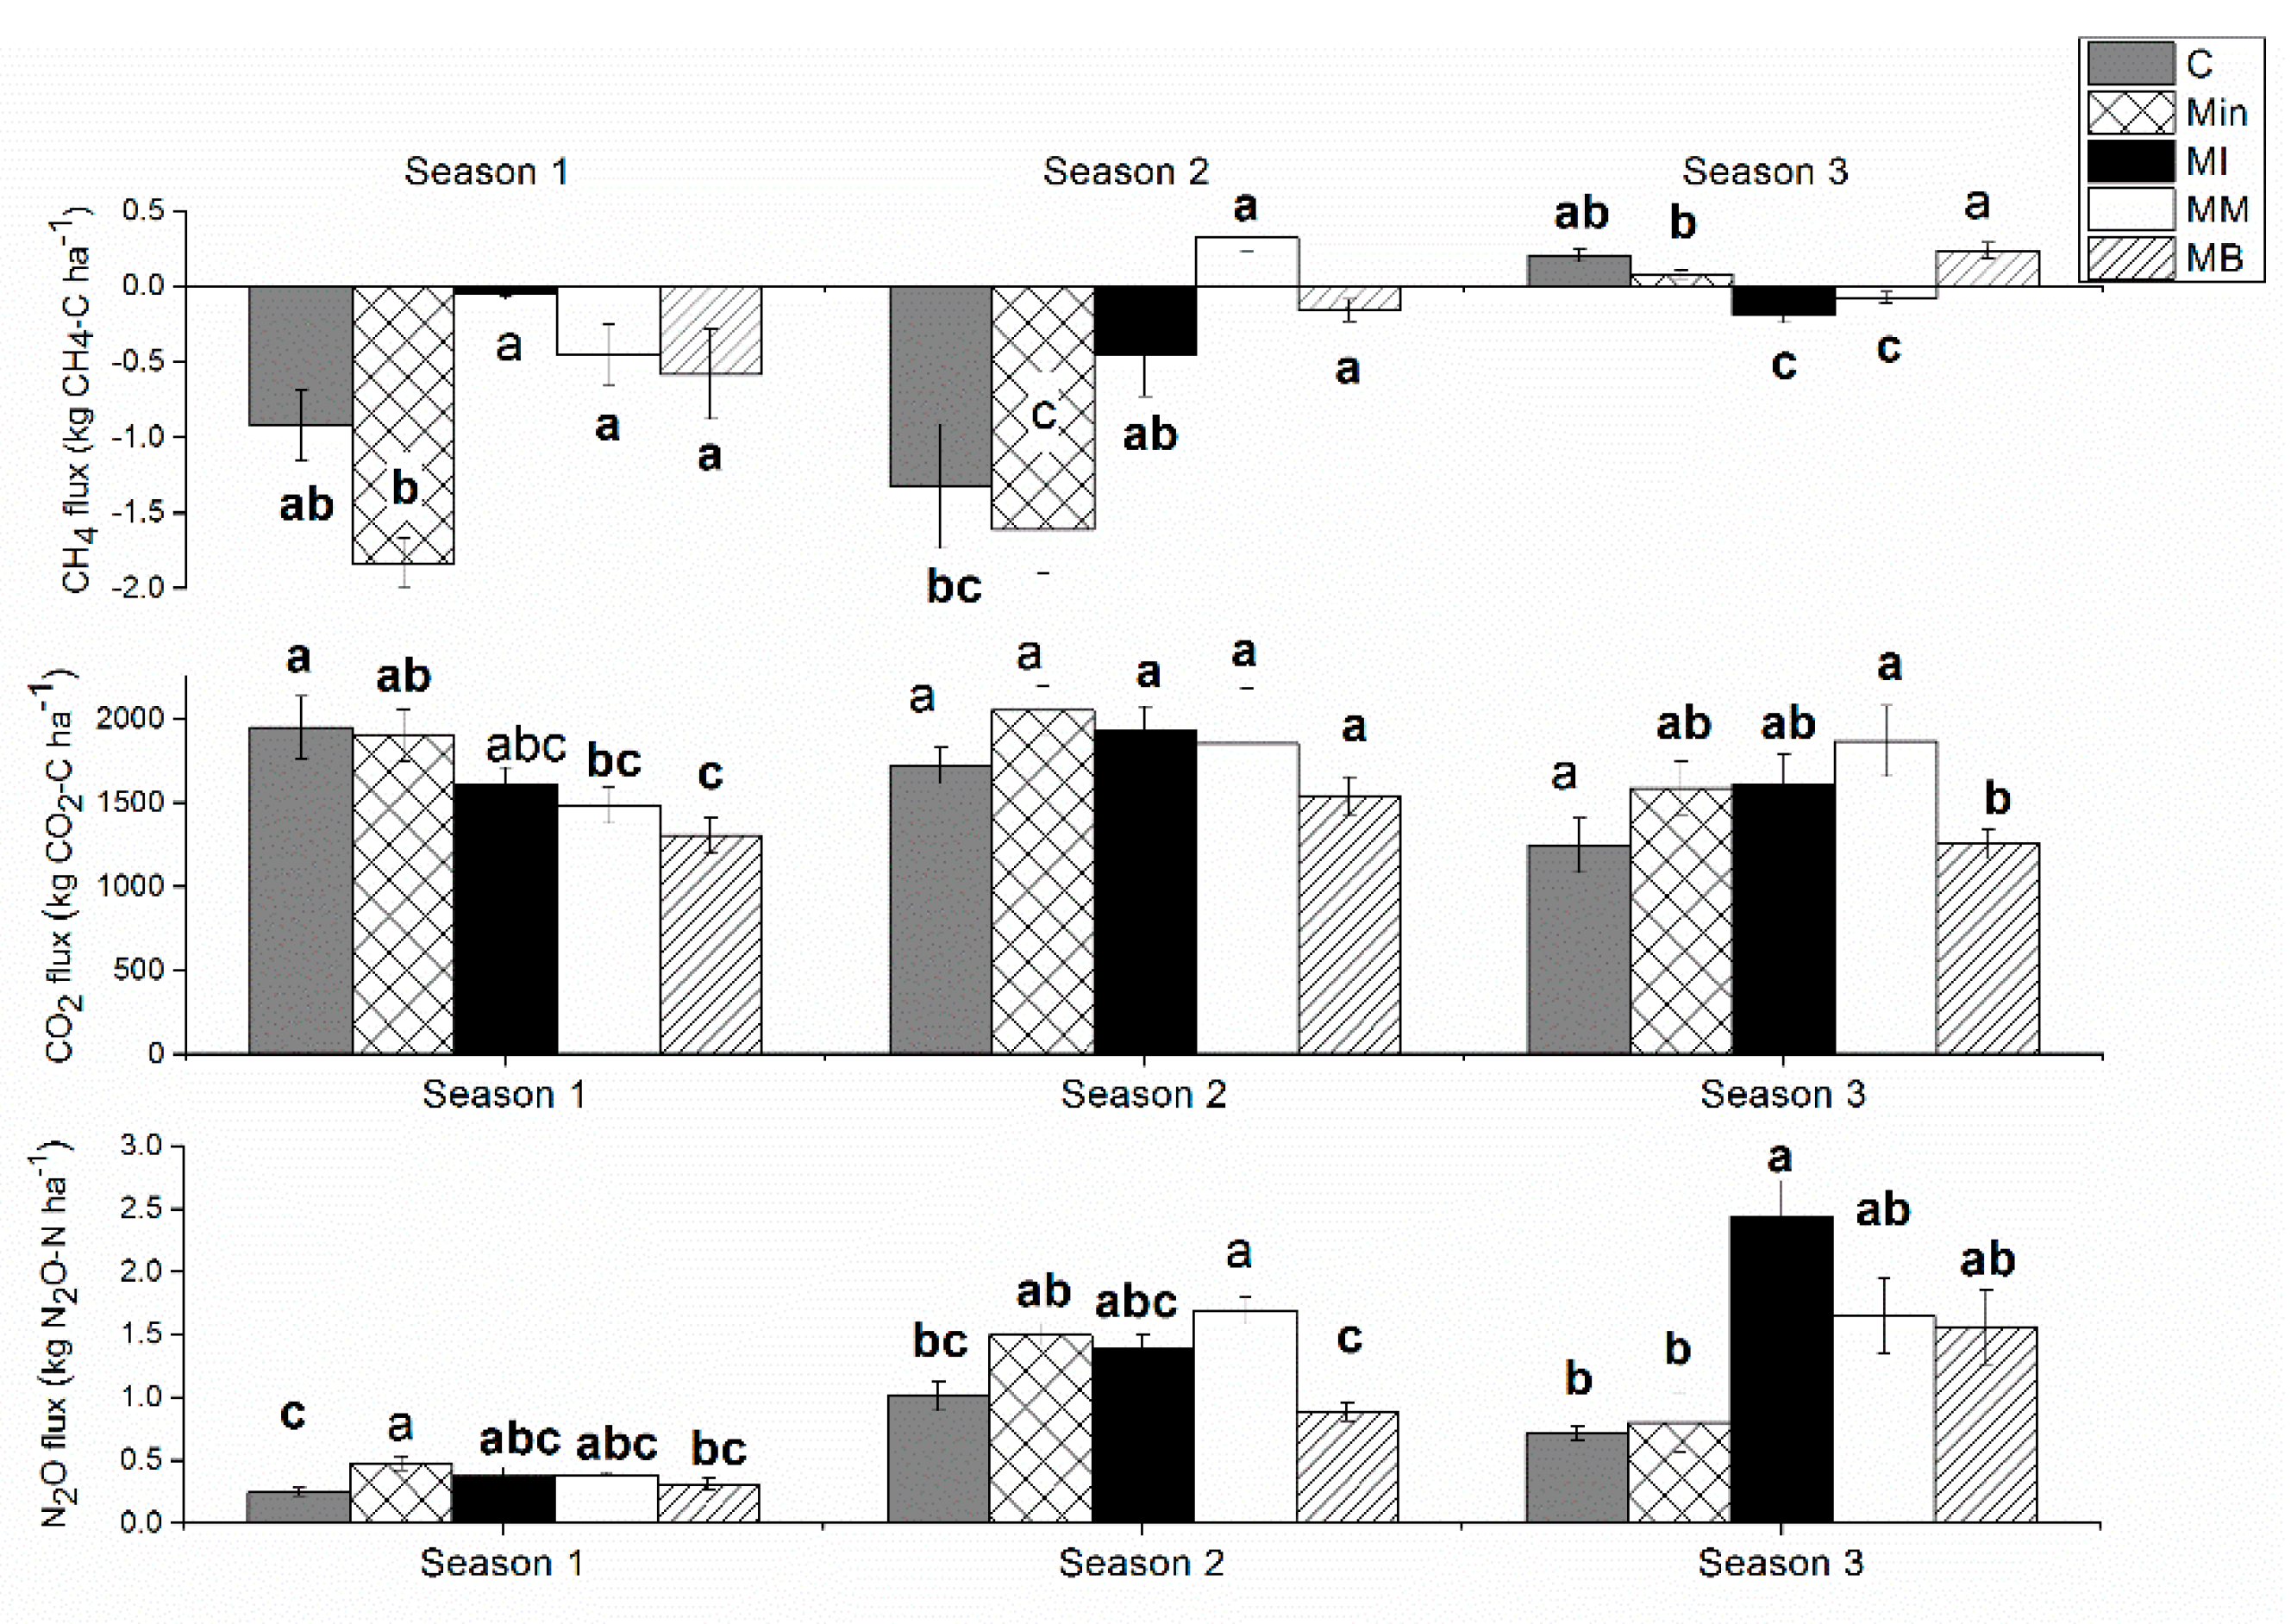
3.2. CH4 Fluxes
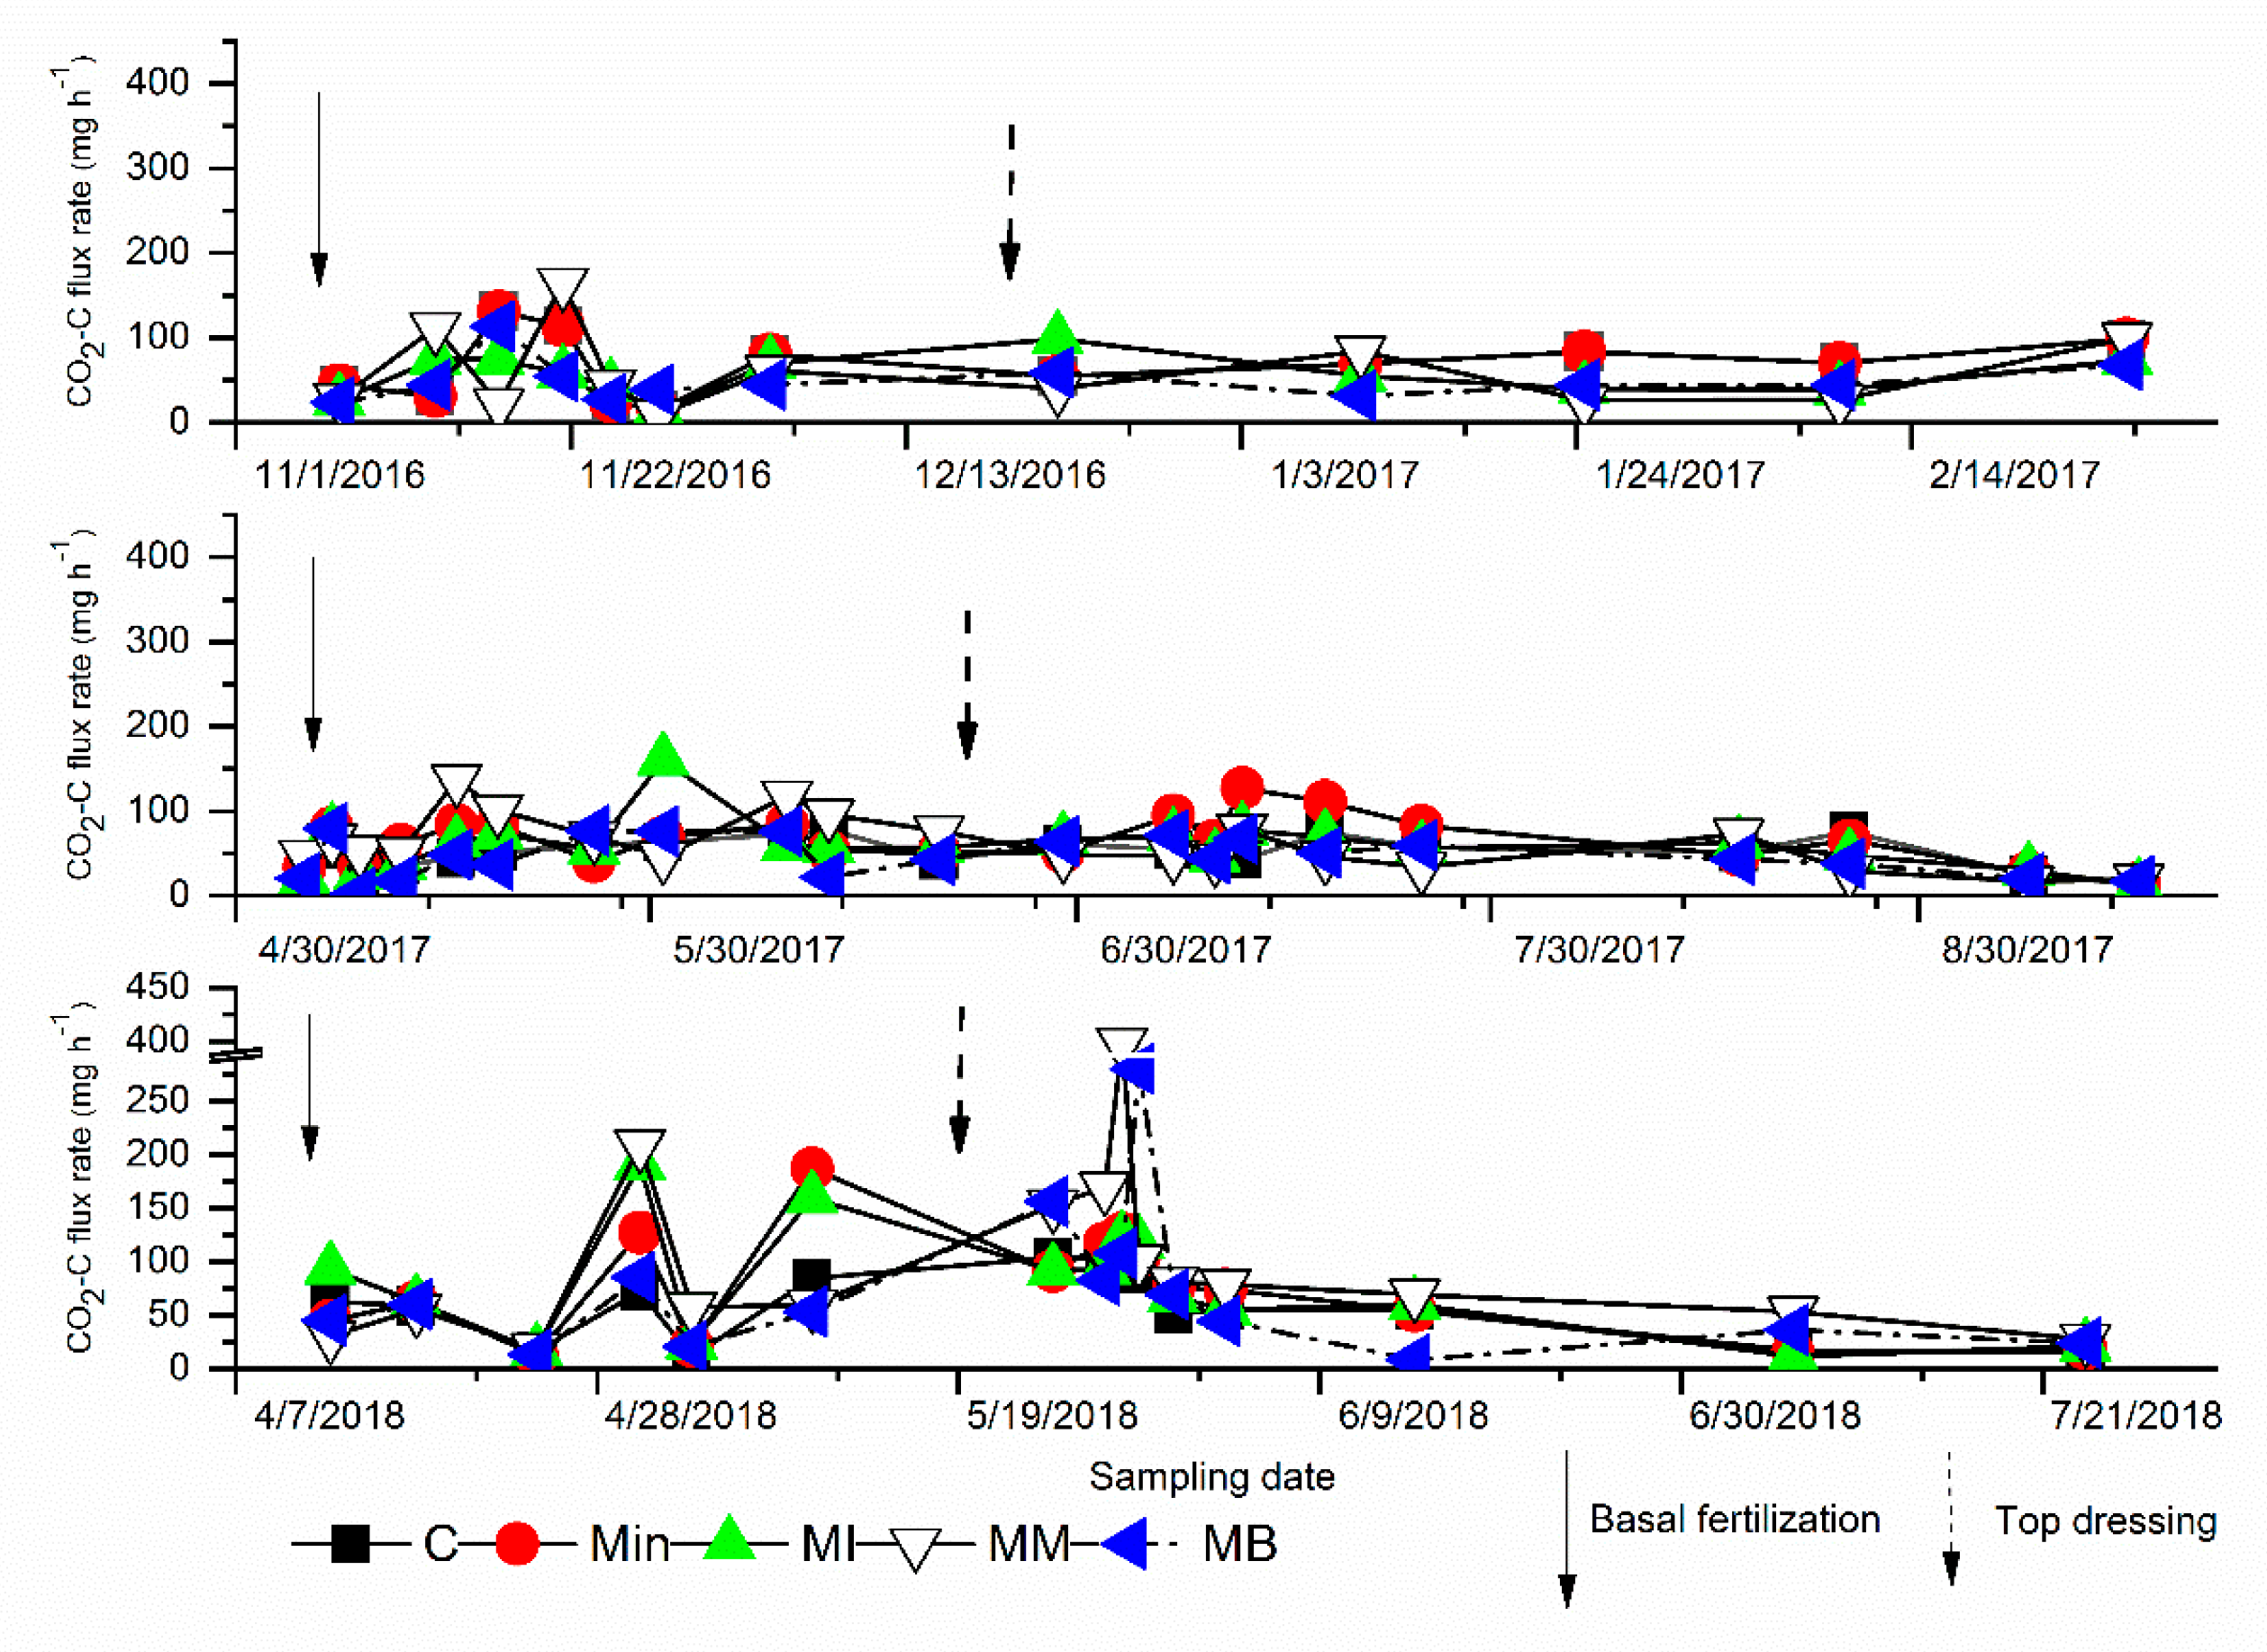
3.3. CO2 Fluxes
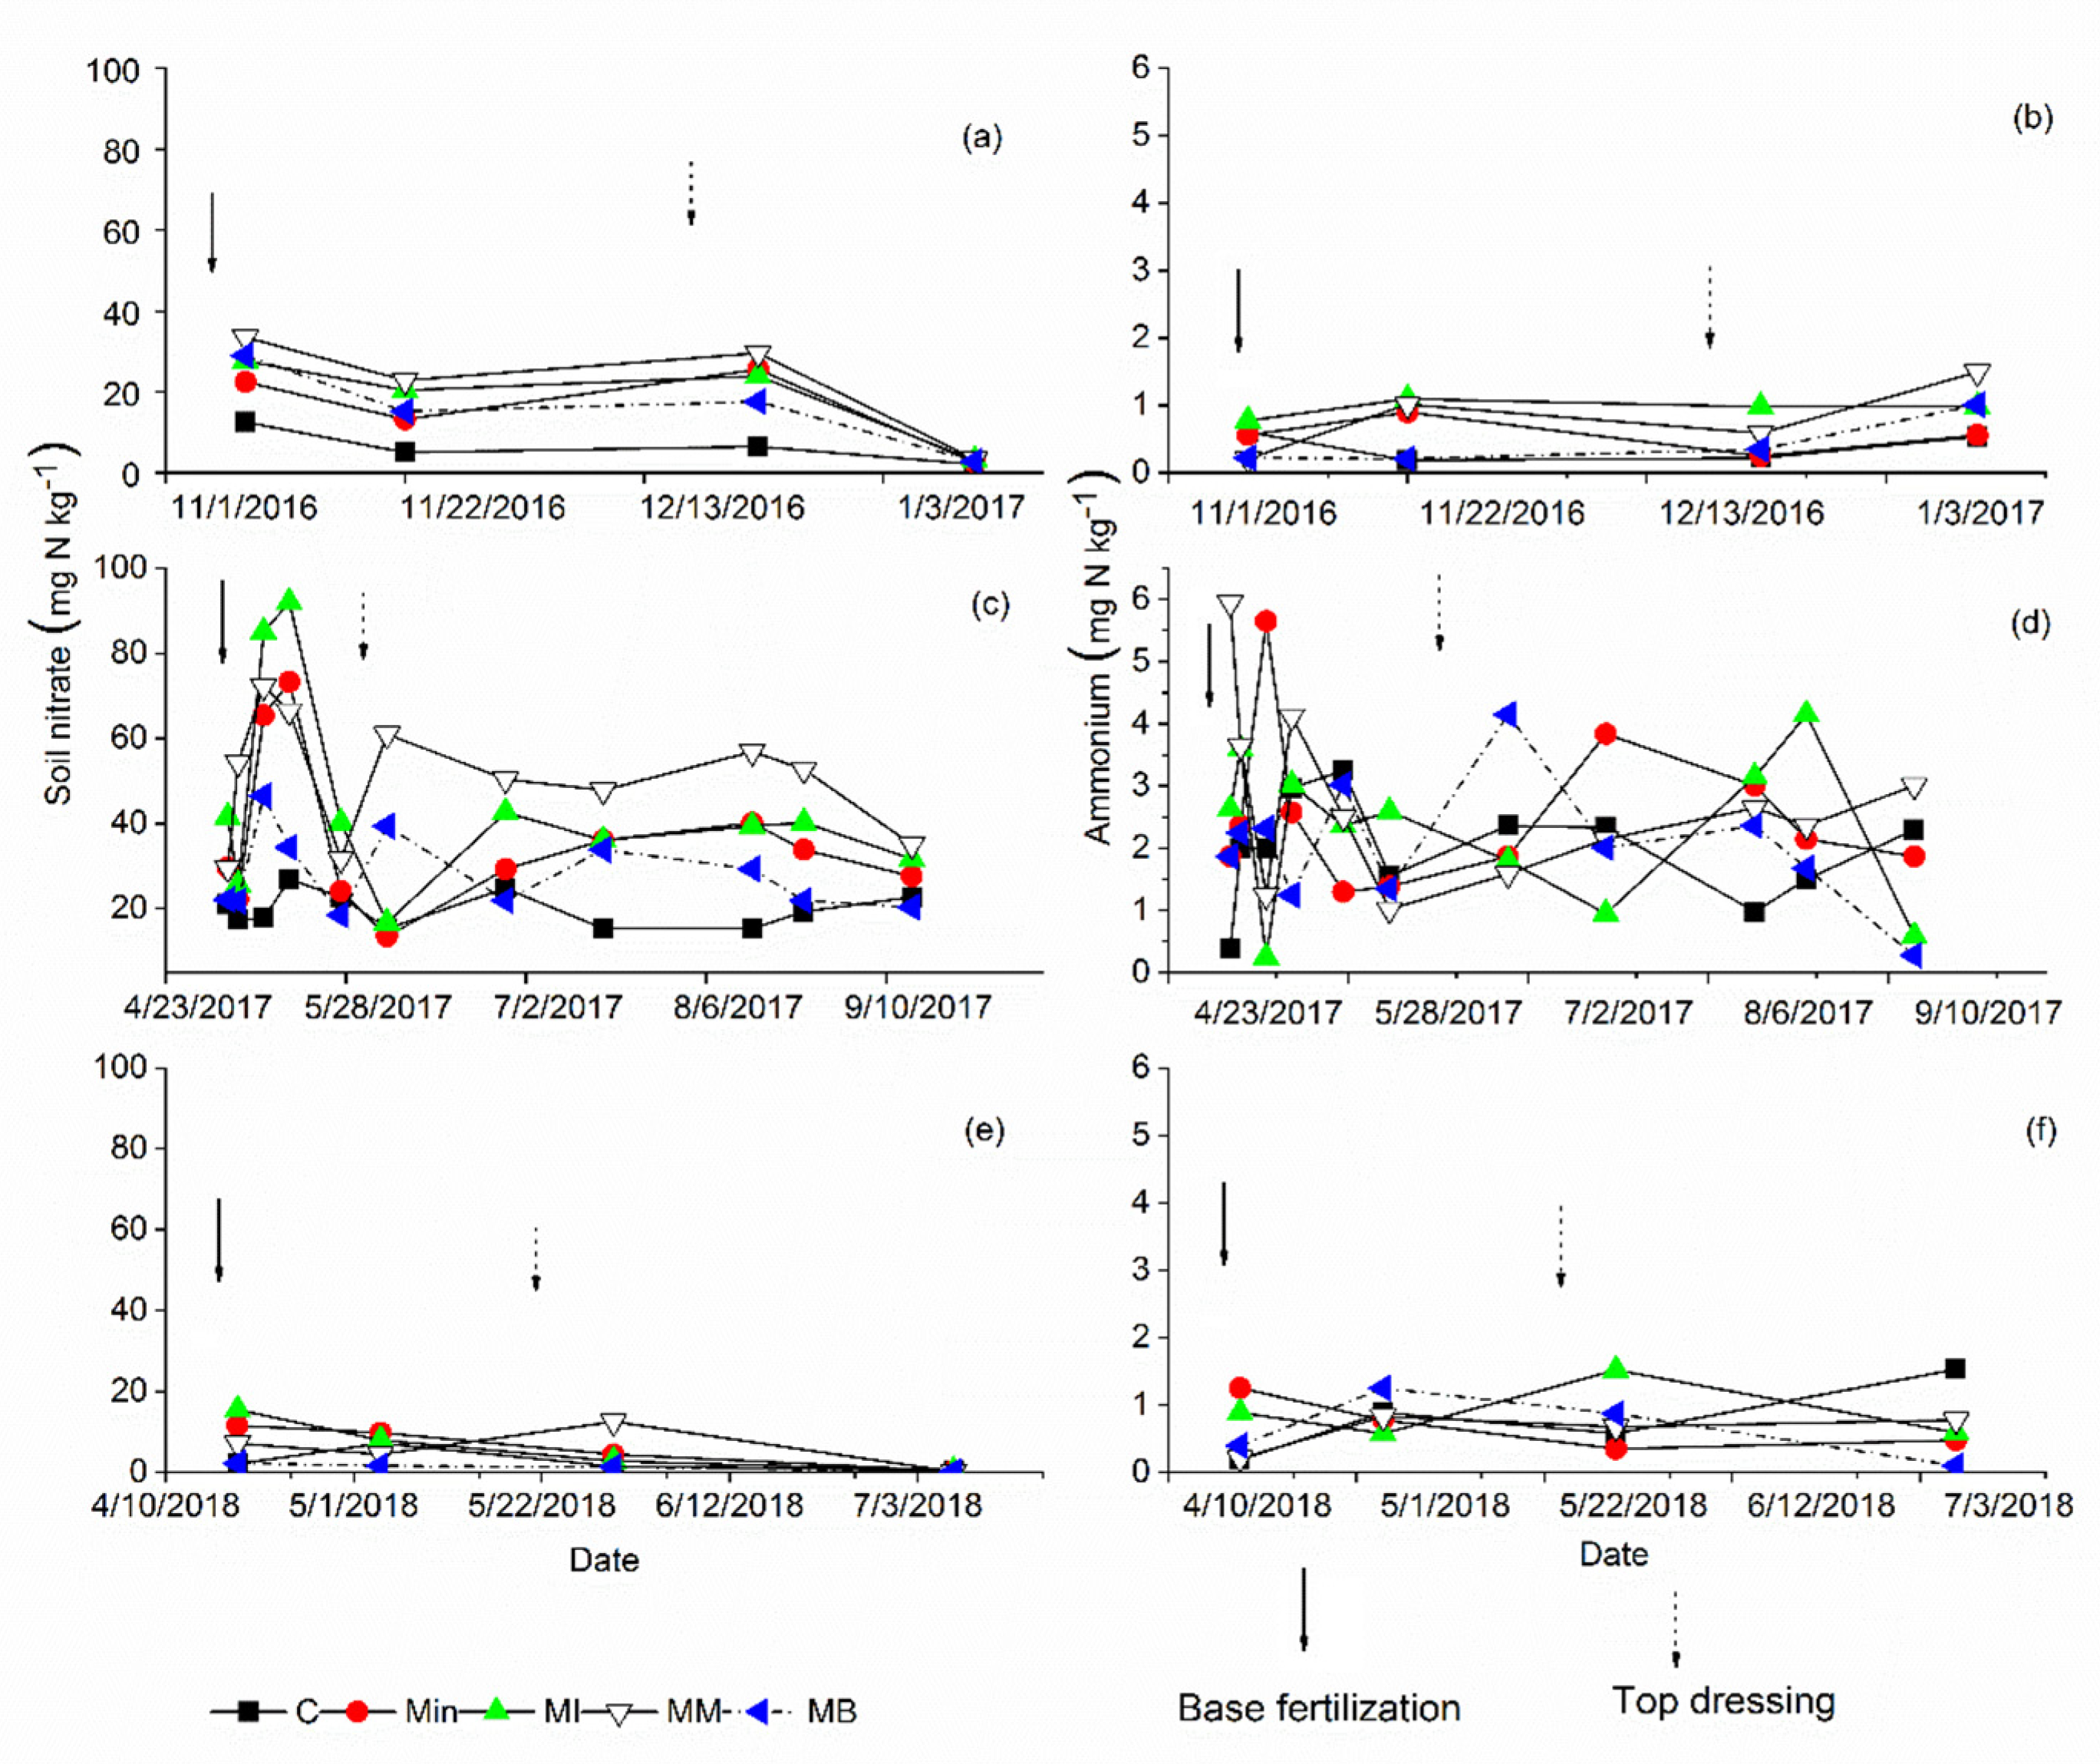
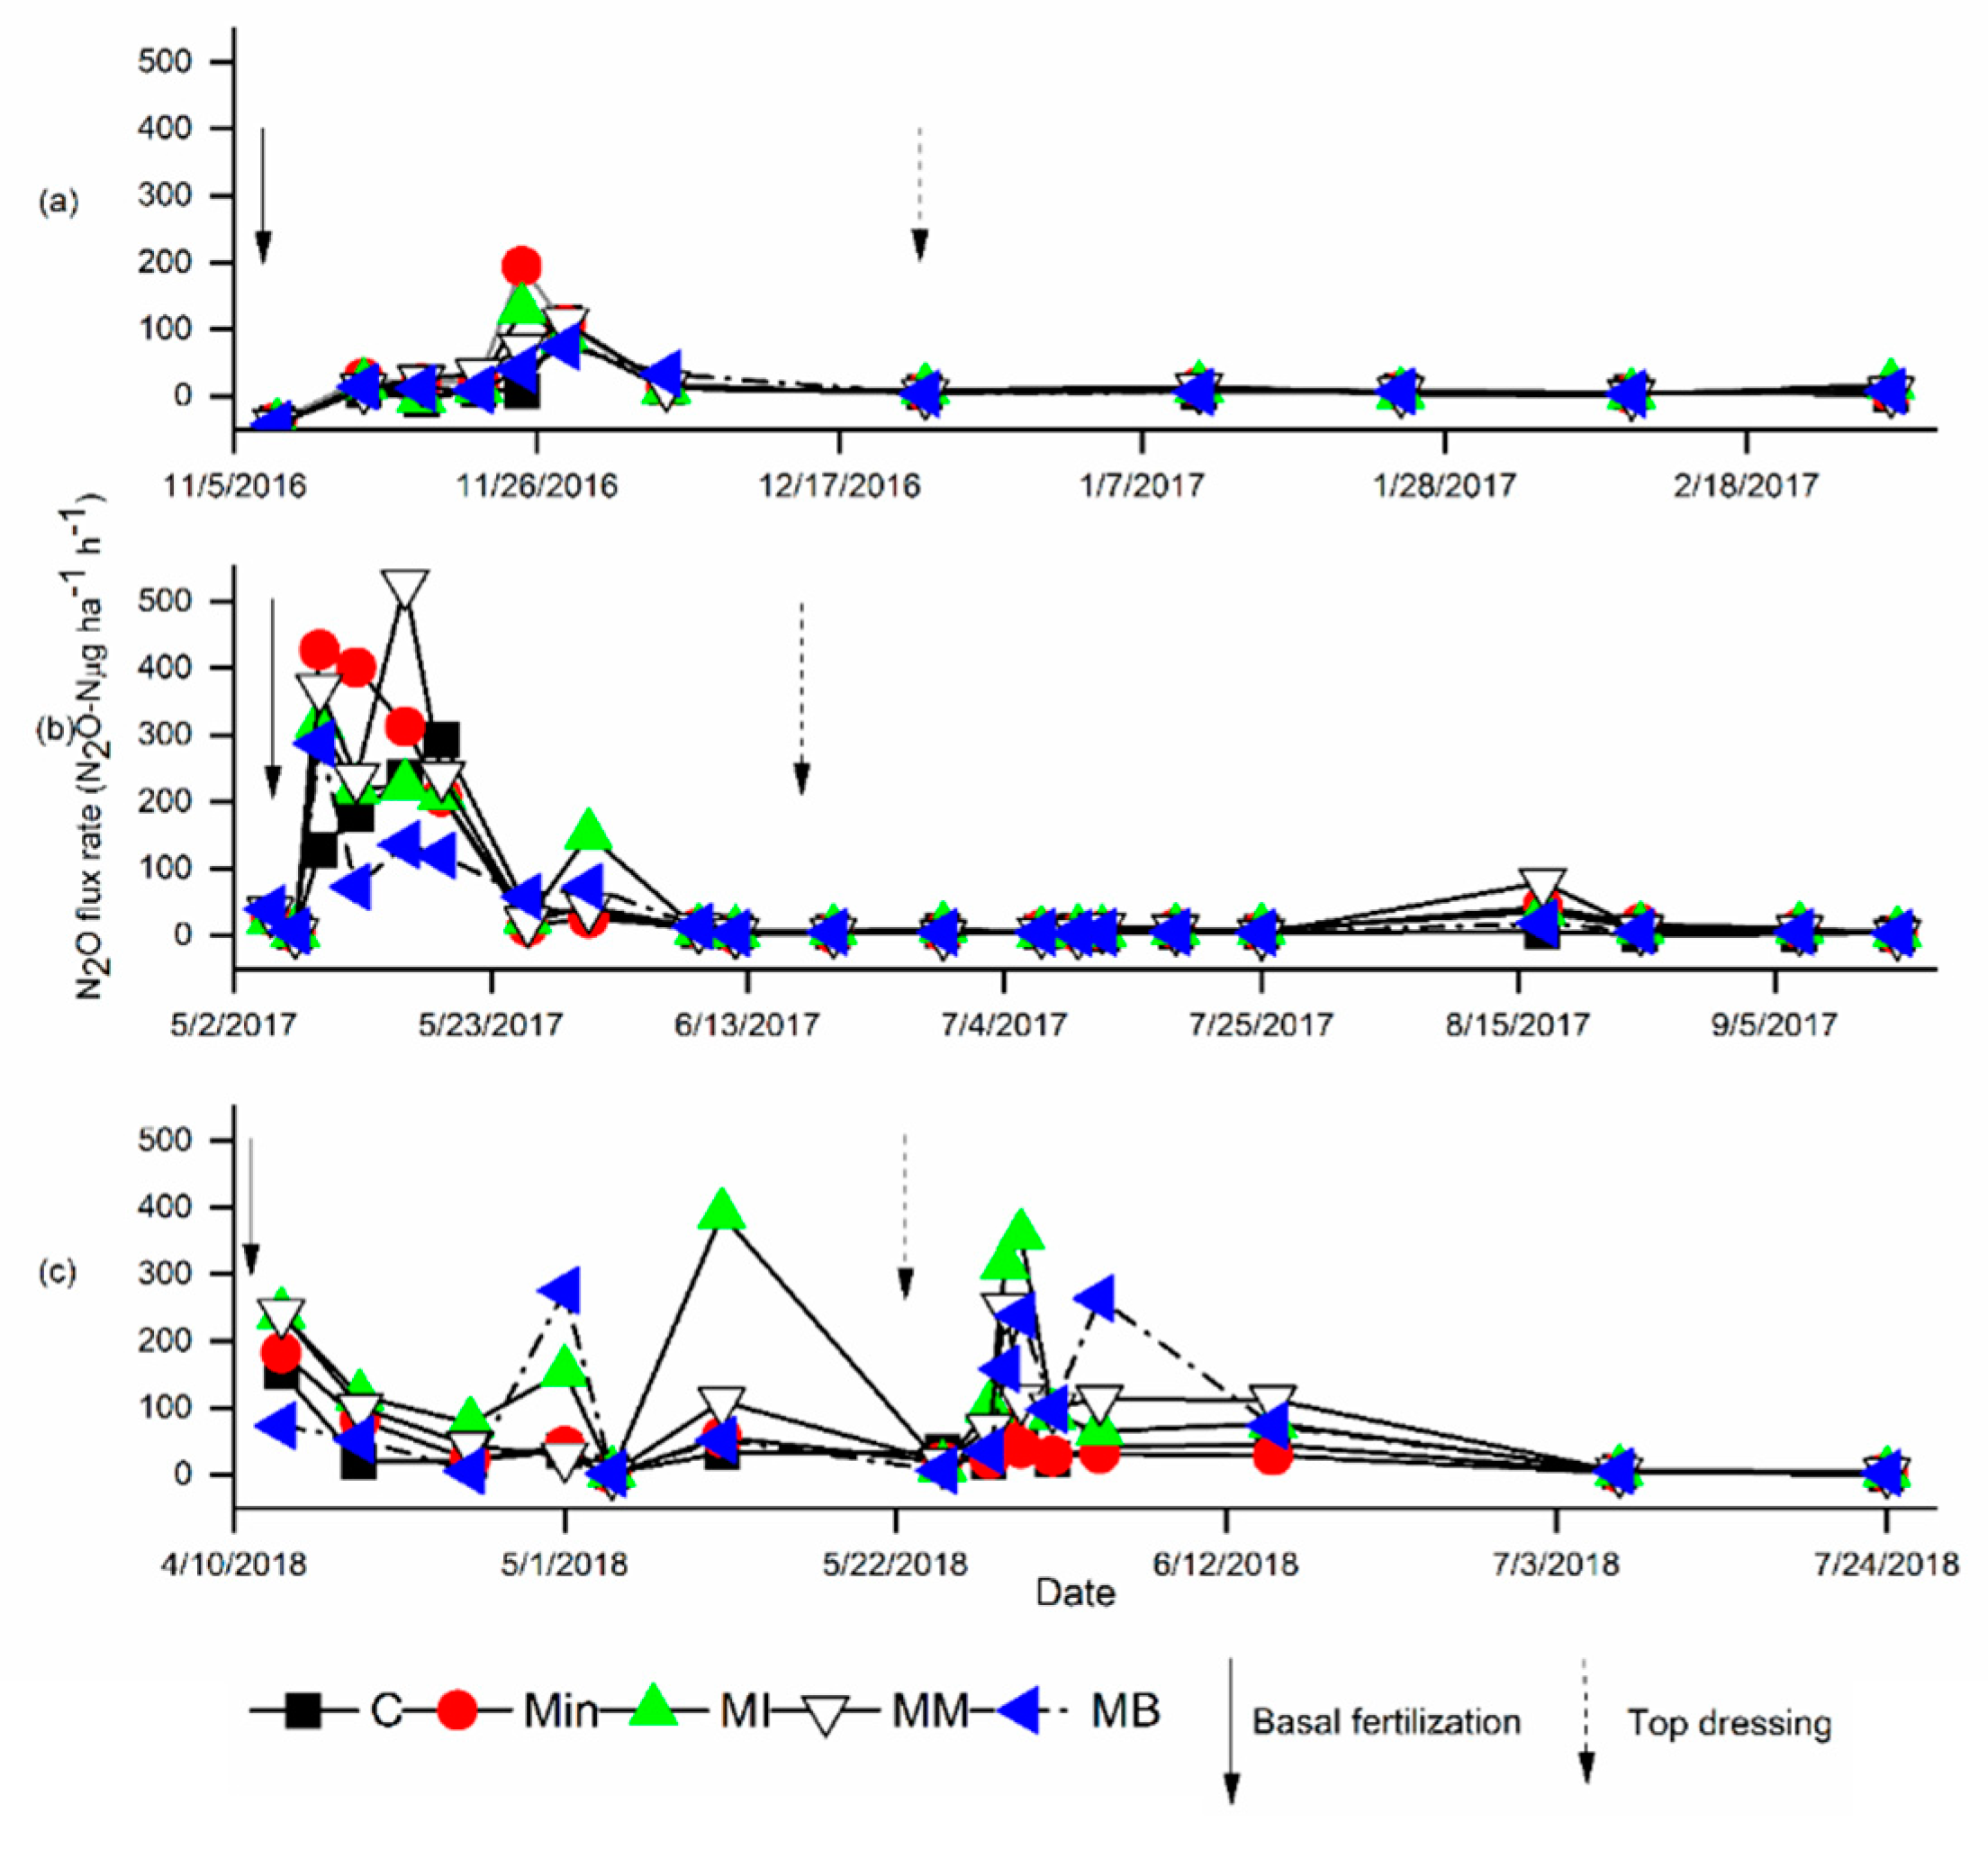
3.4. N2O Fluxes
4. Discussion
4.1. CH4 Emissions
4.2. CO2 Emissions
4.3. N2O Emissions
5. Conclusions
Author Contributions
Funding
Data Availability Statement
Acknowledgments
Conflicts of Interest
References
- Crippa, M.; Solazzo, E.; Guizzardi, D.; Monforti-Ferrario, F.; Tubiello, F.N.; Leip, A. Food systems are responsible for a third of global anthropogenic GHG emissions. Nat. Food 2021, 2, 198–209. [Google Scholar] [CrossRef]
- Tubiello, F.N.; Salvatore, M.; Ferrara, A.; Rossi, S.; Biancalani, R.; Federici, S.; Jacobs, H.; Flammini, A. Agriculture, Forestry and Other Land Use Emissions by Sources and Removals by Sinks. ESS Work. Pap. 2014, 2, 4–89. [Google Scholar]
- Sánchez, P.A. Tripling crop yields in tropical Africa. Nat. Geosci. 2010, 3, 299–300. [Google Scholar] [CrossRef]
- Ariga, J.; Jayne, T.S. Fertilizer in Kenya: Factors Driving the Increase in Usage by Smallholder Farmers. In Yes, Africa Can: Success Stories from a Dynamic Continent; World Bank Publications: Washington, DC, USA, 2011; pp. 269–288. [Google Scholar]
- FAO. World Fertilizer Trends and Outlook to 2022; FAO: Rome, Italy, 2019. [Google Scholar]
- Davidson, E.A.; Keller, M.; Erickson, H.E.; Verchot, L.V.; Veldkamp, E. Testing a Conceptual Model of Soil Emissions of Nitrous and Nitric Oxides. Bioscience 2000, 50, 667. [Google Scholar] [CrossRef]
- Norton, J.; Ouyang, Y. Controls and Adaptive Management of Nitrification in Agricultural Soils. Front. Microbiol. 2019, 10, 1931. [Google Scholar] [CrossRef] [PubMed] [Green Version]
- Scheer, C.; Fuchs, K.; Pelster, D.E.; Butterbach-bahl, K. ScienceDirect Estimating global terrestrial denitrification from measured N2O:(N2O + N2) product ratios. Curr. Opin. Environ. Sustain. 2020, 47, 72–80. [Google Scholar] [CrossRef]
- Butterbach-Bahl, K.; Baggs, E.M.; Dannenmann, M.; Kiese, R.; Zechmeister-Boltenstern, S. Nitrous oxide emissions from soils: How well do we understand the processes and their controls? Philos. Trans. R. Soc. B Biol. Sci. 2013, 368, 20130122. [Google Scholar] [CrossRef]
- Balaine, N.; Clough, T.J.; Beare, M.H.; Thomas, S.M.; Meenken, E.D.; Ross, J.G. Changes in Relative Gas Diffusivity Explain Soil Nitrous Oxide Flux Dynamics. Soil Sci. Soc. Am. J. 2013, 77, 1496–1505. [Google Scholar] [CrossRef]
- Abegunde, V.O.; Sibanda, M.; Obi, A. The Dynamics of Climate Change Adaptation in Sub-Saharan Africa: A Review of Climate-Smart Agriculture among Small-Scale Farmers. Climate 2019, 7, 132. [Google Scholar] [CrossRef] [Green Version]
- Ntinyari, W.; Gweyi-Onyango, J.P. Greenhouse Gases Emissions in Agricultural Systems and Climate Change Effects in Sub- Saharan Africa. In African Handbook of Climate Change Adaptation; Oguge, N., Ayal, D., Adeleke, L., da Silva, I., Eds.; Springer International Publishing: Cham, Switzerland, 2021; pp. 1081–1105. [Google Scholar]
- Mapanda, F.; Wuta, M.; Nyamangara, J.; Rees, R.M. Effects of organic and mineral fertilizer nitrogen on greenhouse gas emissions and plant-captured carbon under maize cropping in Zimbabwe. Plant Soil 2011, 343, 67–81. [Google Scholar] [CrossRef] [Green Version]
- Pelster, D.; Rufino, M.; Rosenstock, T.; Mango, J.; Saiz, G.; Diaz-Pines, E.; Baldi, G.; Butterbach-Bahl, K. Smallholder farms in eastern African tropical highlands have low soil greenhouse gas fluxes. Biogeosciences 2017, 14, 187–202. [Google Scholar] [CrossRef] [Green Version]
- Zhou, M.; Zhu, B.; Wang, S.; Zhu, X.; Vereecken, H.; Brüggemann, N. Stimulation of N2O emission by manure application to agricultural soils may largely offset carbon benefits: A global meta-analysis. Glob. Chang. Biol. 2017, 23, 4068–4083. [Google Scholar] [CrossRef] [PubMed]
- Chen-Rui, W.; Yi, S.; Xiao-Ming, Y.; Jie, W.; Jin, Y. Advances of study on atmospheric methane oxidation (consumption) in forest soil. J. For. Res. 2003, 14, 230–238. [Google Scholar] [CrossRef]
- Liu, S.; Ji, C.; Wang, C.; Chen, J.; Jin, Y.; Zou, Z.; Li, S.; Niu, S.; Zou, J. Climatic role of terrestrial ecosystem under elevated CO2: A bottom-up greenhouse gases budget. Ecol. Lett. 2018, 21, 1108–1118. [Google Scholar] [CrossRef] [Green Version]
- Menon, S.; Denman, K.L.; Brasseur, G.; Chidthaisong, A.; Ciais, P.; Cox, P.M.; Dickinson, R.E.; Hauglustaine, D.; Heinze, C.; Holland, E.; et al. Couplings between Changes in the Climate System and Biogeochemistry; Lawrence Berkeley National Lab.(LBNL): Berkeley, CA, USA, 2007.
- Houghton, R. Balancing the Global Carbon Budget. Annu. Rev. Earth Planet. Sci. 2007, 35, 313–347. [Google Scholar] [CrossRef] [Green Version]
- Kim, D.-G.; Thomas, A.D.; Pelster, D.; Rosenstock, T.S.; Sanz-Cobena, A. Greenhouse gas emissions from natural ecosystems and agricultural lands in sub-Saharan Africa: Synthesis of available data and suggestions for further research. Biogeosciences 2016, 13, 4789–4809. [Google Scholar] [CrossRef] [Green Version]
- Rosenstock, T.S.; Mpanda, M.; Pelster, D.E.; Butterbach-Bahl, K.; Rufino, M.C.; Thiong’O, M.; Mutuo, P.; Abwanda, S.; Rioux, J.; Kimaro, A.A.; et al. Greenhouse gas fluxes from agricultural soils of Kenya and Tanzania. J. Geophys. Res. Biogeosci. 2016, 121, 1568–1580. [Google Scholar] [CrossRef] [Green Version]
- Rochette, P. Towards a standard non-steady-state chamber methodology for measuring soil N2O emissions. Anim. Feed Sci. Technol. 2011, 166–167, 141–146. [Google Scholar] [CrossRef]
- Alves, B.J.; Smith, K.A.; Flores, R.; Cardoso, A.; Oliveira, W.R.; Jantalia, C.P.; Urquiaga, S.; Boddey, R.M. Selection of the most suitable sampling time for static chambers for the estimation of daily mean N2O flux from soils. Soil Biol. Biochem. 2012, 46, 129–135. [Google Scholar] [CrossRef]
- Arias-Navarro, C.; Díaz-Pinés, E.; Kiese, R.; Rosenstock, T.S.; Rufino, M.; Stern, D.; Neufeldt, H.; Verchot, L.; Butterbach-Bahl, K. Gas pooling: A sampling technique to overcome spatial heterogeneity of soil carbon dioxide and nitrous oxide fluxes. Soil Biol. Biochem. 2013, 67, 20–23. [Google Scholar] [CrossRef]
- Barton, L.; Wolf, B.; Rowlings, D.W.; Scheer, C.; Kiese, R.; Grace, P.R.; Stefanova, K.; Butterbachbahl, K. Sampling frequency affects estimates of annual nitrous oxide fluxes. Sci. Rep. 2015, 5, 15912. [Google Scholar] [CrossRef] [PubMed] [Green Version]
- Troeh, F.R.; Thompson, L.M. Soils and Soil Fertility. Soils Soil Fertil. 2005, 7, 5. [Google Scholar]
- Le Mer, J.; Roger, P. Production, oxidation, emission and consumption of methane by soils: A review. Eur. J. Soil Biol. 2001, 37, 25–50. [Google Scholar] [CrossRef]
- Johansson, D.J.A.; Persson, U.M.; Azar, C. The Cost of Using Global Warming Potentials: Analysing the Trade off between CO2, CH4 and N2O. Clim. Chang. 2006, 77, 291–309. [Google Scholar] [CrossRef] [Green Version]
- Baggs, E.; Chebii, J.; Ndufa, J. A short-term investigation of trace gas emissions following tillage and no-tillage of agroforestry residues in western Kenya. Soil Tillage Res. 2006, 90, 69–76. [Google Scholar] [CrossRef]
- Butterbach-Bahl, K.; Papen, H. Four years continuous record of CH4-exchange between the atmosphere and untreated and limed soil of a N-saturated spruce and beech forest ecosystem in Germany. Plant Soil 2002, 240, 77–90. [Google Scholar] [CrossRef]
- Mosier, A.R.; Pendall, E.; Morgan, J.A. Effect of water addition and nitrogen fertilization on the fluxes of CH4, CO2, NOx, and N2O following five years of elevated CO2 in the Colorado Shortgrass Steppe. Atmos. Chem. Phys. 2003, 3, 1703–1708. [Google Scholar] [CrossRef] [Green Version]
- Ussiri, D.A.; Lal, R.; Jarecki, M.K. Nitrous oxide and methane emissions from long-term tillage under a continuous corn cropping system in Ohio. Soil Tillage Res. 2009, 104, 247–255. [Google Scholar] [CrossRef]
- Ruan, L.; Robertson, G. Initial nitrous oxide, carbon dioxide, and methane costs of converting conservation reserve program grassland to row crops under no-till vs. conventional tillage. Glob. Chang. Biol. 2013, 19, 2478–2489. [Google Scholar] [CrossRef] [Green Version]
- Rong, Y.; Ma, L.; Johnson, D.A. Methane uptake by four land-use types in the agro-pastoral region of northern China. Atmos. Environ. 2015, 116, 12–21. [Google Scholar] [CrossRef]
- Steinkamp, R.; Butterbach-Bahl, K.; Papen, H. Methane oxidation by soils of an N limited and N fertilized spruce forest in the Black Forest, Germany. Soil Biol. Biochem. 2001, 33, 145–153. [Google Scholar] [CrossRef]
- Merino, A.; Pérez-Batallón, P.; Macías, F. Responses of soil organic matter and greenhouse gas fluxes to soil management and land use changes in a humid temperate region of southern Europe. Soil. Biol. Biochem. 2004, 36, 917–925. [Google Scholar] [CrossRef]
- Czaban, J.; Gajda, A.; Wróblewska, B. The motility of bacteria from rhizosphere and different zones of winter wheat roots. Pol. J. Environ. Stud. 2007, 16, 301–308. [Google Scholar]
- Rochette, P.; Angers, D.A.; Flanagan, L.B. Maize Residue Decomposition Measurement Using Soil Surface Carbon Dioxide Fluxes and Natural Abundance of Carbon-13. Soil Sci. Soc. Am. J. 1999, 63, 1385–1396. [Google Scholar] [CrossRef]
- Deng, X.; Ma, W.; Ren, Z.; Zhang, M.; Grieneisen, M.L. Geoderma Spatial and temporal trends of soil total nitrogen and C/N ratio for croplands of East China. Geoderma 2020, 361, 114035. [Google Scholar] [CrossRef]
- Millar, N.; Ndufa, J.K.; Cadisch, G.; Baggs, L. Nitrous oxide emissions following incorporation of improved-fallow residues in the humid tropics. Glob. Biogeochem. Cycles 2004, 18, 1–9. [Google Scholar] [CrossRef]
- Hickman, J.E.; Palm, C.A.; Mutuo, P.; Melillo, J.M.; Tang, J. Nitrous oxide (N2O) emissions in response to increasing fertilizer addition in maize (Zea mays L.) agriculture in western Kenya. Nutr. Cycl. Agroecos. 2014, 100, 177–187. [Google Scholar] [CrossRef]
- IPCC. Summary for Policymakers; IPCC: Geneva, Switzerland, 2014. [Google Scholar]
- Chatskikh, D.; Olesen, J.E. Soil tillage enhanced CO2 and N2O emissions from loamy sand soil under spring barley. Soil Tillage Res. 2007, 97, 5–18. [Google Scholar] [CrossRef]
- Snyder, C.; Bruulsema, T.; Jensen, T.; Fixen, P. Review of greenhouse gas emissions from crop production systems and fertilizer management effects. Agric. Ecosyst. Environ. 2009, 133, 247–266. [Google Scholar] [CrossRef]
- Shcherbak, I.; Millar, N.; Robertson, G.P. Global metaanalysis of the nonlinear response of soil nitrous oxide (N2O) emissions to fertilizer nitrogen. Proc. Natl. Acad. Sci. USA 2014, 111, 9199–9204. [Google Scholar] [CrossRef] [Green Version]
- Firestone, E.; Davidson, M.K. Microbial basis of NO and N2O production and consumption in soil. Exchange of trace gases between terrestrial ecosystems and the atmosphere. In Microbiological Basis of NO and N2O Production and Consumption in Soil; Andreae, D.S., Schimel, M.O., Eds.; Wiley: New York, NY, USA, 1989; pp. 7–21. [Google Scholar]
- Ssiri, D.; Lal, R. Global sources of nitrous oxide. In Soil Emission of Nitrous Oxide and Its Mitigation; Springer: Berlin/Heidelberg, Germany, 2013; pp. 131–175. [Google Scholar]
- Li, X.; Sørensen, P.; Olesen, J.E.; Petersen, S.O. Evidence for denitrification as main source of N2O emission from residue-amended soil. Soil Biol. Biochem. 2016, 92, 153–160. [Google Scholar] [CrossRef]
- Opdyke, M.R.; Ostrom, N.E.; Ostrom, P.H. Evidence for the predominance of denitrification as a source of N2O in temperate agricultural soils based on isotopologue measurements. Glob. Biogeochem. Cycles 2009, 23, 1–10. [Google Scholar] [CrossRef]
- Linn, D.M.; Doran, J.W. Effect of Water-Filled Pore Space on Carbon Dioxide and Nitrous Oxide Production in Tilled and Nontilled Soils. Soil Sci. Soc. Am. J. 1984, 48, 1267–1272. [Google Scholar] [CrossRef] [Green Version]
- de Carvalho, A.M.; de Oliveira, W.R.D.; Ramos, M.L.G.; Coser, T.R.; de Oliveira, A.D.; Pulrolnik, K.; Souza, K.W.; Vilela, L.; Marchão, R.L. Soil N2O fluxes in integrated production systems, continuous pasture and Cerrado. Nutr. Cycl. Agroecos. 2017, 108, 69–83. [Google Scholar] [CrossRef]
- Birch, H.F. Nitrification in soils after different periods of dryness. Plant Soil 1960, 12, 81–96. [Google Scholar] [CrossRef]
- Leitner, S.; Minixhofer, P.; Inselsbacher, E.; Keiblinger, K.M.; Zimmermann, M.; Zechmeister-Boltenstern, S. Short-term soil mineral and organic nitrogen fluxes during moderate and severe drying–rewetting events. Appl. Soil Ecol. 2017, 114, 28–33. [Google Scholar] [CrossRef]
- Chen, Z.; Ding, W.; Xu, Y.; Müller, C.; Yu, H.; Fan, J. Increased N2O emissions during soil drying after waterlogging and spring thaw in a record wet year. Soil Biol. Biochem. 2016, 101, 152–164. [Google Scholar] [CrossRef]
- Kong, Q.; Wang, Z.-B.; Niu, P.-F.; Miao, M.-S. Greenhouse gas emission and microbial community dynamics during simultaneous nitrification and denitrification process. Bioresour. Technol. 2016, 210, 94–100. [Google Scholar] [CrossRef]
- Guo, X.; Drury, C.F.; Yang, X.; Reynolds, W.D.; Fan, R. The Extent of Soil Drying and Rewetting Affects Nitrous Oxide Emissions, Denitrification, and Nitrogen Mineralization. Soil Sci. Soc. Am. J. 2014, 78, 194–204. [Google Scholar] [CrossRef]
- Oertel, C.; Matschullat, J.; Zurba, K.; Zimmermann, F.; Erasmi, S. Greenhouse gas emissions from soils—A review. Geochemistry 2016, 76, 327–352. [Google Scholar] [CrossRef] [Green Version]
- Klemedtsson, L.; Svensson, B.; Rosswall, T. Relationships between soil moisture content and nitrous oxide production during nitrification and denitrification. Biol. Fertil. Soils 1988, 6, 106–111. [Google Scholar] [CrossRef]


| Soil Type | Chromic Vertisol |
|---|---|
| Silt content | 26% |
| Clay content | 62% |
| Available nitrogen (N) | 374 mg/kg |
| SOM | 2.98% |
| Total nitrogen | 0.55% |
| Total Soil Nitrogen | Soil Organic Carbon | |
|---|---|---|
| C | 0.13 ± 0.005 a | 1.85 ± 0.15 a |
| Min | 0.16 ± 0.006 a | 1.76 ± 0.17 a |
| MI | 0.15 ± 0.005 b | 1.71 ± 0.05 b |
| MM | 0.14 ± 0.011 b | 1.72 ± 0.04 c |
| MB | 0.16 ± 0.005 a | 1.61 ± 0.06 d |
| Season 1 | Season 2 | Season 3 | Mean | |
|---|---|---|---|---|
| Min | 0.23 ± 0.02 | 0.49 ± 0.01 | 0.08 ± 0.02 | 0.27 ± 0.12 |
| MI | 0.13 ± 0.03 | 0.39 ± 0.01 | 0.17 ± 0.03 | 0.23 ± 0.08 |
| MM | 0.14 ± 0.06 | 0.68 ± 0.03 | 0.93 ± 0.15 | 0.58 ± 0.23 |
| MB | 0.06 ± 0.06 | 0.12 ± 0.31 | 0.84 ± 0.26 | 0.34 ± 0.25 |
| Season 1 | Season 2 | Season 3 | |
|---|---|---|---|
| C | 80.0 ± 0.64 a | 81.7 ± 0.36 a | 79.7 ± 1.30 a |
| Min | 95.0 ± 0.11 a | 85.8 ± 1.30 b | 82.3 ± 0.80 a |
| MI | 94.2 ± 2.80 a | 88.8 ± 1.30 a | 85.6 ± 0.59 a |
| MM | 94.3 ± 1.50 b | 91.9 ± 2.30 a | 90.3 ± 0.38 a |
| MB | 84.5 ± 0.95 a | 81.8 ± 1.70 ab | 89.3 ± 2.40 a |
Publisher’s Note: MDPI stays neutral with regard to jurisdictional claims in published maps and institutional affiliations. |
© 2022 by the authors. Licensee MDPI, Basel, Switzerland. This article is an open access article distributed under the terms and conditions of the Creative Commons Attribution (CC BY) license (https://creativecommons.org/licenses/by/4.0/).
Share and Cite
Mosongo, P.S.; Pelster, D.E.; Li, X.; Gaudel, G.; Wang, Y.; Chen, S.; Li, W.; Mburu, D.; Hu, C. Greenhouse Gas Emissions Response to Fertilizer Application and Soil Moisture in Dry Agricultural Uplands of Central Kenya. Atmosphere 2022, 13, 463. https://doi.org/10.3390/atmos13030463
Mosongo PS, Pelster DE, Li X, Gaudel G, Wang Y, Chen S, Li W, Mburu D, Hu C. Greenhouse Gas Emissions Response to Fertilizer Application and Soil Moisture in Dry Agricultural Uplands of Central Kenya. Atmosphere. 2022; 13(3):463. https://doi.org/10.3390/atmos13030463
Chicago/Turabian StyleMosongo, Peter Semba, David E. Pelster, Xiaoxin Li, Gokul Gaudel, Yuying Wang, Suying Chen, Wenyan Li, David Mburu, and Chunsheng Hu. 2022. "Greenhouse Gas Emissions Response to Fertilizer Application and Soil Moisture in Dry Agricultural Uplands of Central Kenya" Atmosphere 13, no. 3: 463. https://doi.org/10.3390/atmos13030463