Article

The Different Impacts of Emissions and Meteorology on PM2.5 Changes in Various Regions in China: A Case Study

1
Department of Atmospheric and Oceanic Sciences and Institute of Atmospheric Sciences, Fudan University, Shanghai 200433, China
2
State Key Laboratory of Severe Weather and Key Laboratory of Atmospheric Chemistry of CMA, Chinese Academy of Meteorological Sciences, Beijing 100081, China
*
Author to whom correspondence should be addressed.
Atmosphere 2022, 13(2), 222; https://doi.org/10.3390/atmos13020222
Submission received: 27 December 2021 / Revised: 25 January 2022 / Accepted: 26 January 2022 / Published: 28 January 2022

Abstract

:
Emissions and meteorology are significant factors affecting aerosol pollution, but it is not sufficient to understand their relative contributions to aerosol pollution changes. In this study, the observational data and the chemical model (GRAPES_CUACE) are combined to estimate the drivers of PM2.5 changes in various regions (the Beijing–Tianjin–Hebei (BTH), the Central China (CC), the Yangtze River Delta (YRD), and the Pearl River Delta (PRD)) between the first month after COVID-19 (FMC_2020) (i.e., from 23 January to 23 February 2020) and the corresponding period in 2019 (FMC_2019). The results show that PM2.5 mass concentration increased by 26% (from 61 to 77 µg m−3) in the BTH, while it decreased by 26% (from 94 to 70 µg m−3) in the CC, 29% (from 52 to 37 µg m−3) in the YRD, and 32% (from 34 to 23 µg m−3) in the PRD in FMC_2020 comparing with FMC_2019, respectively. In the BTH, although emissions reductions partly improved PM2.5 pollution (−5%, i.e., PM2.5 mass concentration decreased by 5% due to emissions) in FMC_2020 compared with that of FMC_2019, the total increase in PM2.5 mass concentration was dominated by more unfavorable meteorological conditions (+31%, i.e., PM2.5 mass concentration increased by 31% due to meteorology). In the CC and the YRD, emissions reductions (−33 and −36%) played a dominating role in the total decrease in PM2.5 in FMC_2020, while the changed meteorological conditions partly worsened PM2.5 pollution (+7 and +7%). In the PRD, emissions reductions (−23%) and more favorable meteorological conditions (−9%) led to a total decrease in PM2.5 mass concentration. This study reminds us that the uncertainties of relative contributions of meteorological conditions and emissions on PM2.5 changes in various regions are large, which is conducive to policymaking scientifically in China.

1. Introduction

PM2.5 pollution has serious impacts on human daily life and health by affecting radiation, visibility, the ecological environment, etc. [1,2,3,4,5], which has attracted widespread attention in China.
PM2.5 pollution in China is closely related to anthropogenic emissions [6,7,8,9]. Combustion sources (coal combustion, traffic emissions, industrial emissions, biomass burning, etc.) have made significant contributions to aerosol pollution over the past several years [10,11,12,13]. In the past, coal combustion contributed to more than 50% of PM2.5 emissions during the winter in Northern China [14,15]. However, traffic emissions have increasingly become the largest source of PM2.5 emissions and account for 40 to 60% [11,12,16]. Secondary aerosol formation also can contribute significantly to elevated PM2.5 mass concentration, accounting for 50 to 70% of the aerosol components during the heavy aerosol pollution episodes (HPEs) [17,18,19,20].
In addition to emissions, meteorological conditions also have important impacts on PM2.5 concentration by changing the ventilation rate, dry/wet deposition, chemical conversion loss rate, etc. [21,22,23]. Zonal westerly airflow and high-pressure ridge are two major background circulations that cause a reduction in the height of the planetary boundary layer (PBLH), affecting the formation of aerosol pollution in the Beijing–Tianjin–Hebei (BTH) [24]. Under normal circumstances, the appearance of weaker wind speed (WS), higher relative humidity (RH), and temperature inversion can be conducive to the accumulation of aerosol pollution in Beijing, Nanjing, Guangzhou, Sichuan Basin, etc. [25,26,27,28]. Some studies show that increasing wind speed will enhance PM2.5 mass concentration by a transmission and convergence process [29,30]. It should also be noted that when the PM2.5 accumulates to a certain level, it will further worsen the meteorological conditions [31,32]. A significant “two-way feedback” effect between PM2.5 and unfavorable meteorological conditions for aerosol pollution diffusion is determined by studying the formation of HPEs in multiple cities in China [33,34,35].
Emissions and meteorological conditions will both affect the changes in PM2.5 mass concentration, but the question of which parameter is more important is still the focus of research [21,36,37,38,39]. In the past few years, the Chinese government has implemented a series of air pollution control measures, such as the “Action Plan on Prevention and Control of Air Pollution”, the “Three-year Action Plan for Blue Skies”, etc. [40,41,42,43]. Under the influence of control measures, the PM2.5 pollution has been greatly improved. Most studies show that emissions reductions play a dominant role (about 70–80%) in the improvement of air quality from 2013 to 2017 [21,38,39]. However, some studies also pointed out that the contributions of changed meteorological conditions to the improvement of PM2.5 reach about 50% in winter [44,45]. Moreover, even in the background of continuous emissions reductions, HPEs still occur in many cities in China due to unfavorable meteorological conditions for aerosol pollution diffusion and secondary formation [46,47,48]. All of these fully illustrate the complicated non-linear relationship between PM2.5 concentration, meteorological conditions, and pollutants emissions. During the COVID-19 outbreak period, various anthropogenic emissions showed a significant decrease [49,50,51,52], e.g., large reductions in NO2 were caused by the significantly reduced traffic emissions [52,53]. This special lockdown situation provided a better opportunity to study the relationship between PM2.5 and emissions and meteorological conditions in China.
Although many studies have carried out some work about the reasons for changes in emissions, major air pollutants concentration, and aerosol composition during the COVID-19 outbreak in China [53,54,55,56,57], they are only for a certain element or region. The comprehensive study of the causes of PM2.5 changes during the COVID-19 outbreak is still poor, especially the comparisons in various regions. In this study, air pollutants data, meteorological data, and the GRAPES_CUACE model are used to investigate reasons for PM2.5 mass concentration changes during the first month (from 23 January to 23 February 2020) after COVID-19 (FMC_2020) compared with the corresponding historical period in 2019 (FMC_2019) in China. The discussions help further understand the causes of aerosol pollution changes in various regions and provide scientific technique support for regional aerosol pollution control in China.

2. Materials and Methods

2.1. Air Pollutants Data

Hourly major air pollutants (PM2.5, CO, NO2, and SO2) mass concentration in FMC_2019 and FMC_2020 are collected by an automated ambient air quality monitoring system (an air quality monitoring sub-station, a quality assurance laboratory, etc.) from the Ministry of Ecology and Environment of China. This system can automatically monitor, collect, process, and store PM2.5 and gaseous pollutants data, then transmit data to the central computer, and finally collate data by quality assurance process (invalid data should have raw records). The mass concentration units are µg m−3 for PM2.5, NO2, SO2, and mg m−3 for CO. For the missing data, if the sample size is sufficient, we choose to directly remove the missing data. If the sample size is insufficient, we use adjacent data to supplement [58].

2.2. Meteorological Data
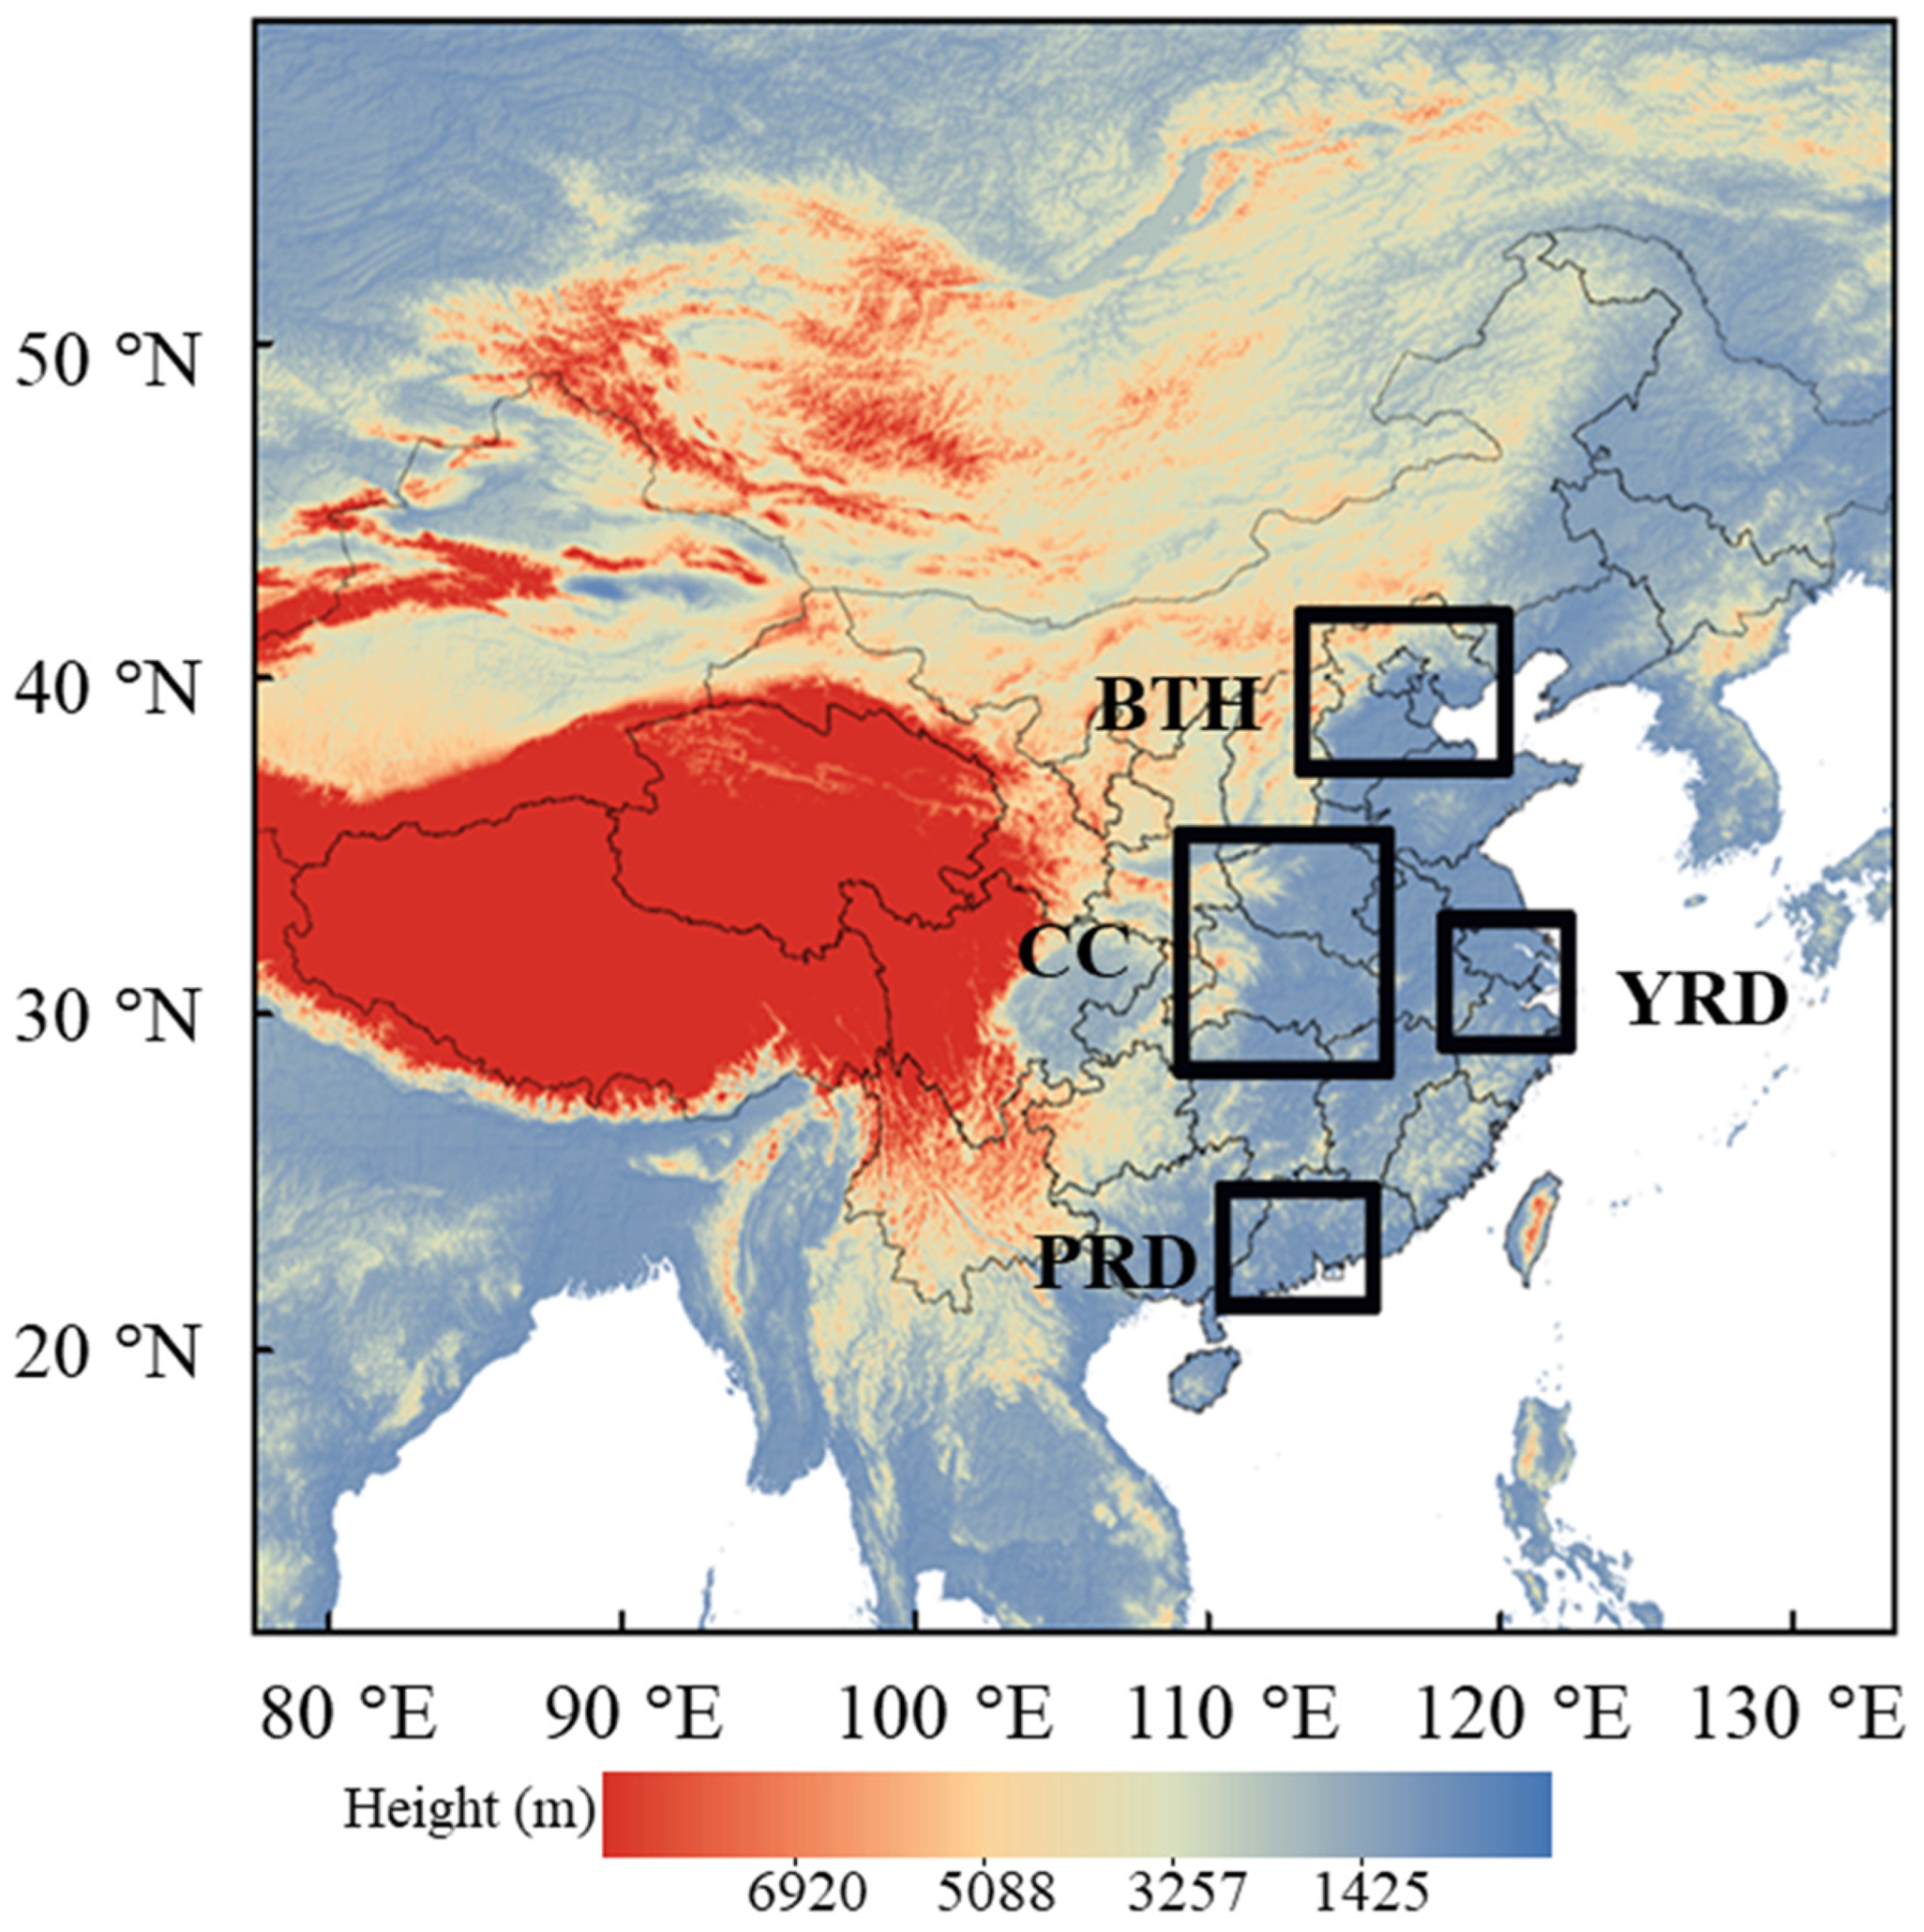
Meteorological data come from National Centers for Environmental Prediction (NCEP) Final (FNL) analysis data. This product is conducted by the Global Data Assimilation System (GDAS), which continuously collects observational data from the Global Telecommunications System (GTS), and other sources. The FNL analysis data are made with the same model which NCEP uses in the Global Forecast System (GFS), but the FNL analysis data are delayed so that more observational data (e.g., satellite data and radar data) can be used. We use the FNL analysis data in FMC_2019 and FMC_2020 with the resolution of 0.25° × 0.25° in this paper. These data mainly include geopotential height, sea level pressure, PBLH, temperature (T), RH, and WS.

2.3. Study Regions

This study focuses on the comparative analysis of the four major megacity clusters (the BTH, the Yangtze River Delta (YRD), the Pearl River Delta (PRD), and the Central China (CC)) (Figure 1). The aerosol pollution in the BTH (38° N–42° N, 113° E–120° E), the YRD (29° N–33° N, 118° E–122° E), the PRD (21° N–25° N, 110° E–115° E), and the CC (28° N–35° N, 109° E–116° E) has been extensively studied, which are the four typical pollution regions in China.

2.4. Statistical Analysis

In a certain period, primary PM2.5 and gas pollutants generally have the same anthropogenic emissions, and the contribution ratio of emissions to them is relatively stable, so gas pollutants can be used to estimate impacts of emissions changes on PM2.5 [59,60,61]. For the primary source of PM2.5, the influence of combustion sources is mainly studied. Among the main gas pollutants, CO is selected as an indicator of the primary combustion sources [62,63], because CO has a long lifetime and is less affected by chemical reactions [63,64,65,66]. In addition, we use a linear relationship to fit CO and PM2.5 mass concentration with a determination coefficient (r2). The r2 reflects how much the changes of CO mass concentration can account for PM2.5 changes, as shown in Equation (1):
r 2 = ( y i ˙ y ¯ ) 2 ( y i y ¯ ) 2
where i is the ith sample, y i ˙ and y i represent the PM2.5 mass concentration calculated by the linear fitting equation and the actual PM2.5 mass concentration, respectively, and y ¯ is the mean PM2.5 mass concentration.
Here we assume that the changes of air pollutants are only affected by emissions and meteorological conditions, which is a general method in many studies. Therefore, the changes in CO and PM2.5 mass concentration under similar meteorological conditions are used to represent the contributions of emissions.

2.5. Model

GRAPES_CUACE is a chemical weather model which is online coupled by the mesoscale weather model (the Global–Regional Assimilation and Prediction System, i.e., GRAPES_Meso) and the chemical module (the Chinese Unified Atmospheric Chemistry Environment, i.e., CUACE) [67,68,69]. GRAPES_Meso model is an operational regional numerical weather prediction model independently developed by China Meteorological Administration (CMA) [70,71,72]. CUACE mainly includes four parts: emissions, gas-phase chemistry, aerosols, and data assimilation [67]. GRAPES_CUACE model has been widely used in studying the interactions between aerosol and meteorology, aerosol pollution transport, pollutants forecast, etc. [73,74,75].
The assimilation system of GRAPES_CUACE model is formed by the Three-Dimensional Variational Assimilation (3DVAR) and the Four-Dimensional Variational Assimilation (4DVAR), which is optional. In this study, we use 3DVAR to perform data assimilation [71]. The physical and chemical schemes selected in this model are the same as those in Zhang et al. [76]. These schemes are listed in Table 1. There are 7 species of aerosol that can be modeled, including sulfates, soil dust, black carbon, organic carbon, sea salts, nitrates, and ammonium salts. The initial and boundary conditions are provided by FNL reanalysis data (0.25° × 0.25°), and the emissions used in the model are Multi-resolution Emission Inventory for China (MEIC) of Tsinghua University in 2017 [7,59]. The anthropogenic emissions used in the model are Multi-resolution Emission Inventory for China (MEIC) of Tsinghua University in 2017. MEIC covers more than 700 anthropogenic emissions in the whole of China, which has 10 major atmospheric pollutants and carbon dioxide (SO2, NOx, CO, NMVOC, NH3, PM2.5, PM10, BC and OC, CO2). The natural emissions do not enter into the current model. Usually, the contributions of anthropogenic emissions to aerosol pollution are much greater than those of natural emissions. In the future, we will consider natural emissions in the model to simulate air pollution accurately. The simulated area includes the entire Chinese region and the two simulated periods are FMC_2019 and FMC_2020. The model has a horizontal resolution of 0.15° × 0.15° and a vertical resolution of 31 levels (from 1000 hPa to 1 hPa).
It is worth noting that we cannot evaluate the simulations in this study because the emissions and the simulated period are not in the same years. However, the model simulations by using the emissions and the meteorology in the same year have been widely validated in the paper of Zhang et al. [76], which indicates that the GRAPES_CUACE model can be used to simulate changes in meteorology and PM2.5 and the results are credible. The descriptions of sensitive experiments are shown in Table 2 and the difference between the two experiments (EXP1 and EXP2) can determine the impact of meteorological conditions on PM2.5 changes.

3. Results

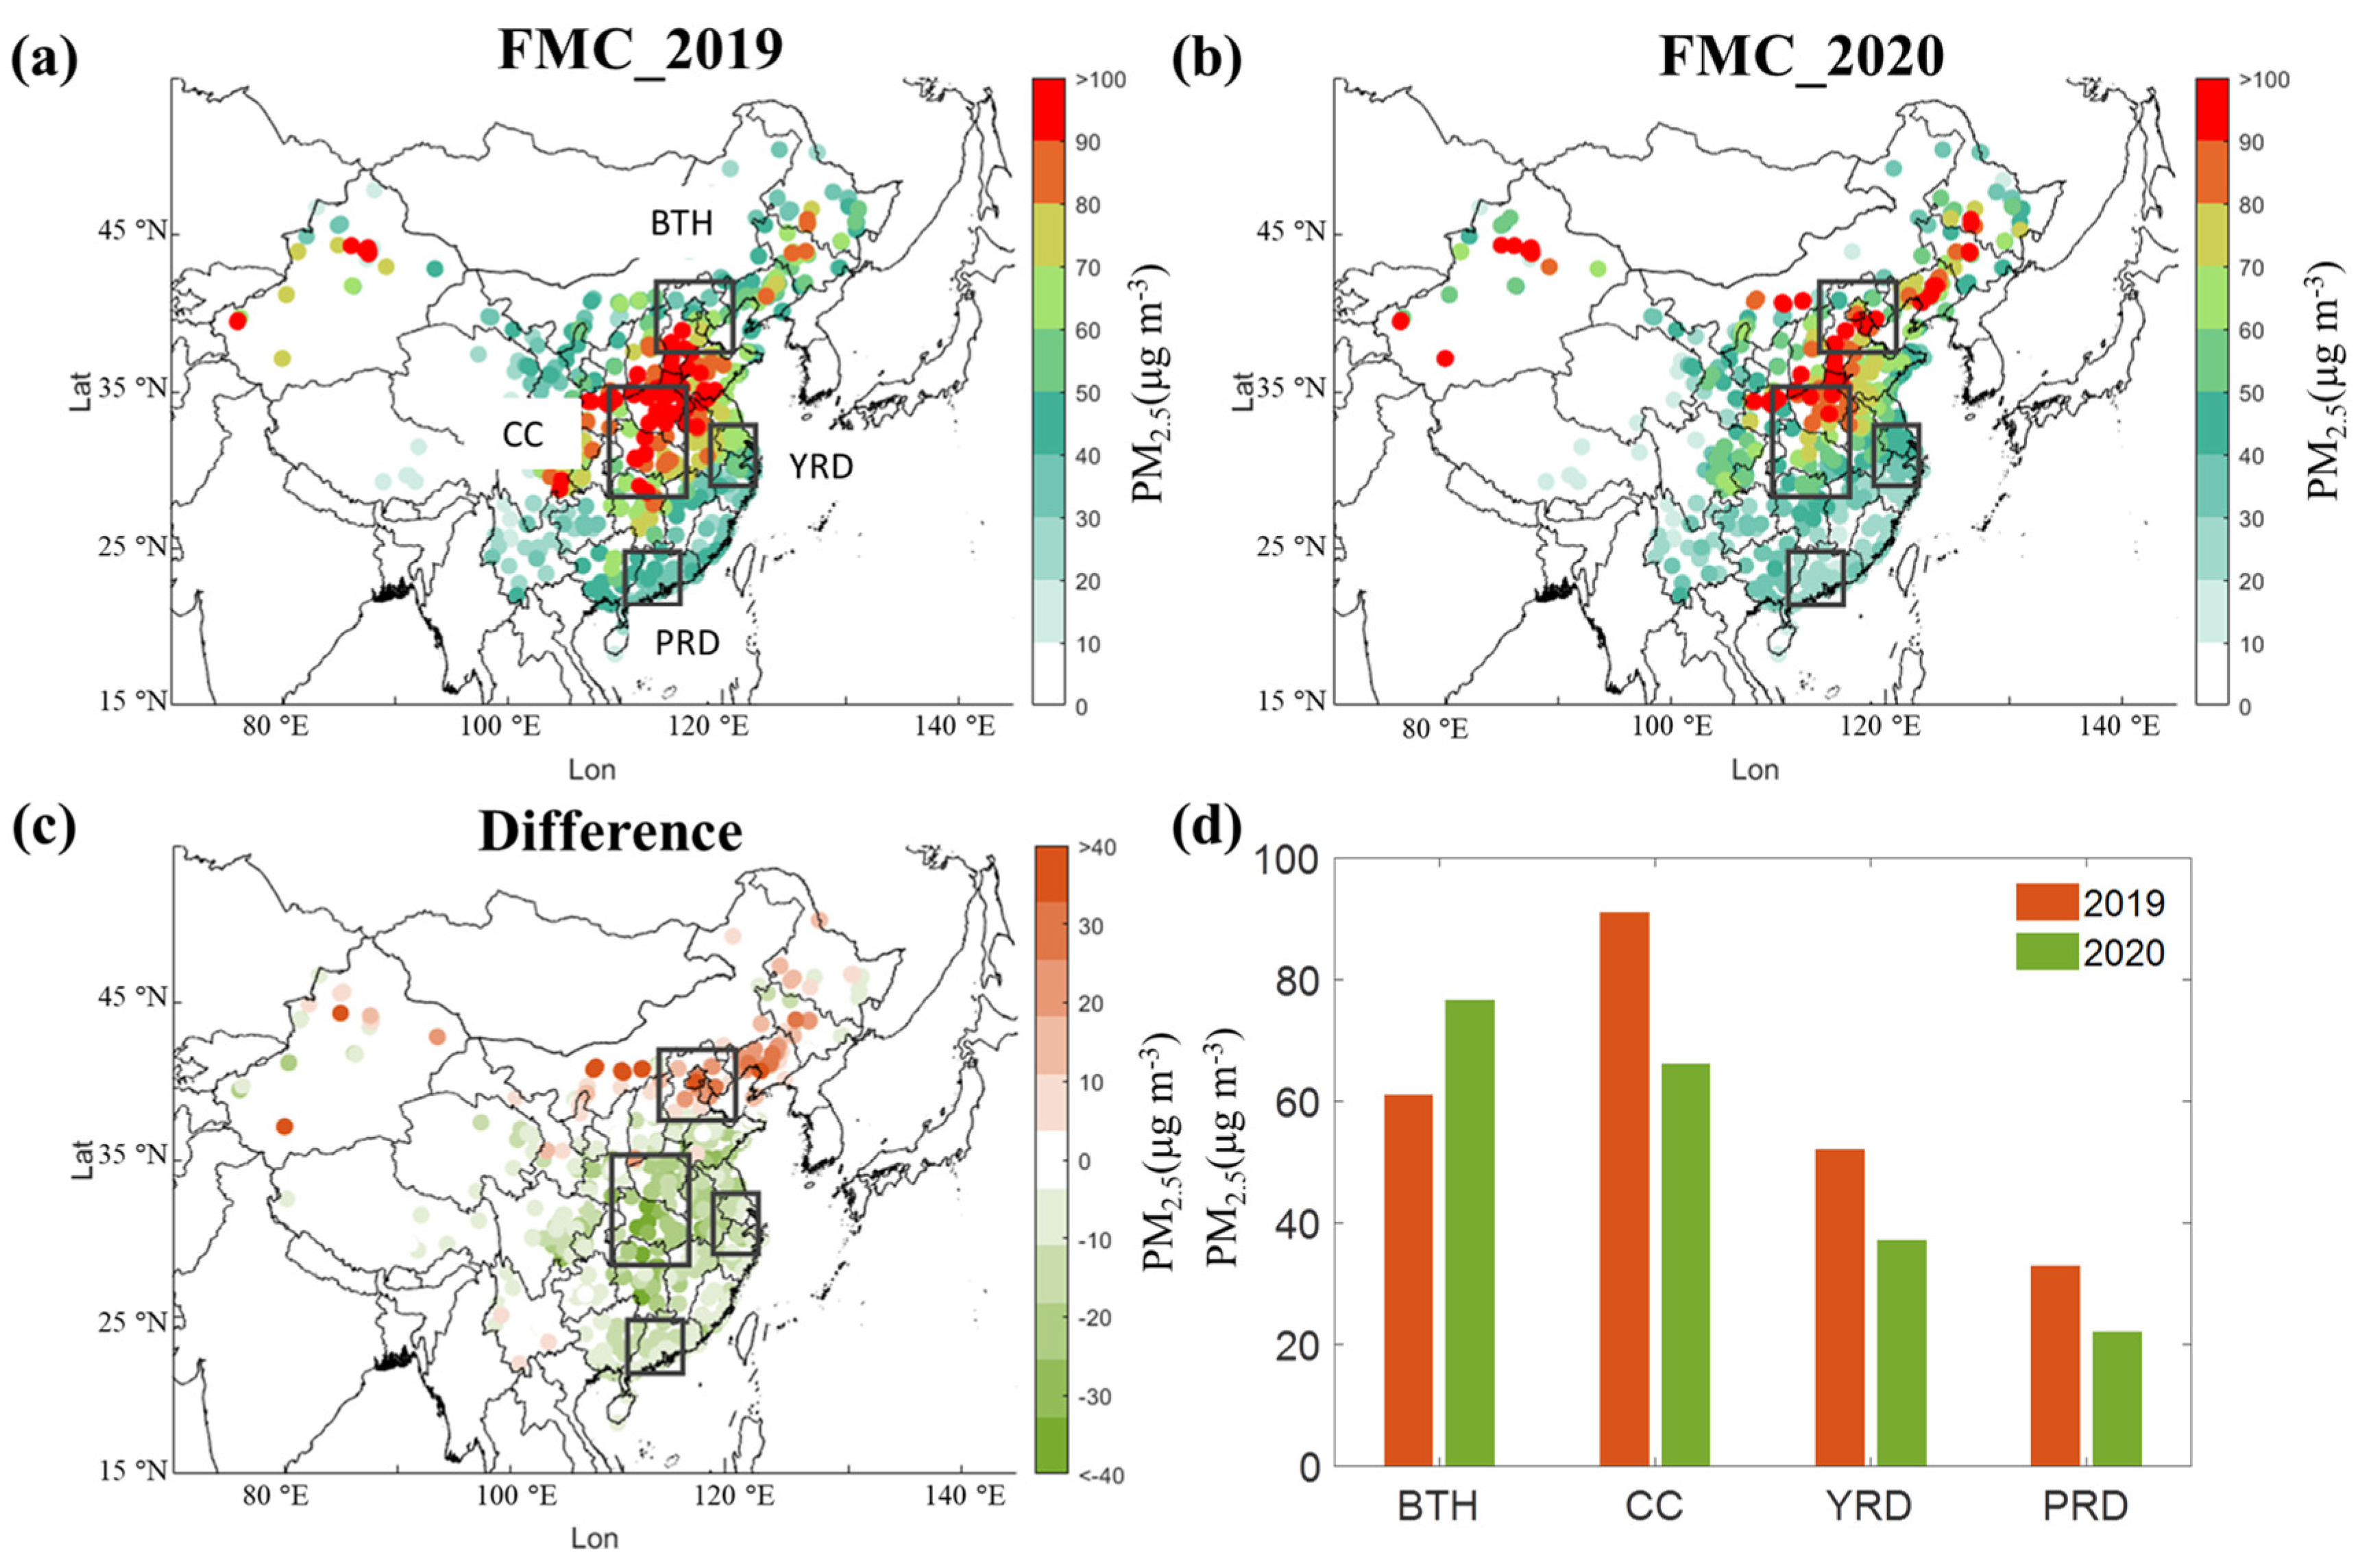
3.1. Changes in PM2.5 Mass Concentration from FMC_2019 to FMC_2020

Figure 2 shows the distributions of PM2.5 mass concentration in China in FMC_2020 and FMC_2019. In FMC_2019, the highest monthly average PM2.5 mass concentration is 94 µg m−3 in the CC, followed by 61 µg m−3 in the BTH, 52 µg m−3 in the YRD, and 34 µg m−3 in the PRD (Figure 2a). Compared with FMC_2019, the PM2.5 mass concentration in the CC, the YRD, and the PRD regions decrease to 70, 37, 23 µg m−3 (26, 29, and 32% less than the PM2.5 mass concentration in FMC_2019) in FMC_2020 (Figure 2b–d). However, PM2.5 mass concentration in the BTH unexpectedly increases to 77 µg m−3 (26% more than the PM2.5 mass concentration in FMC_2019) (Figure 2b–d). In general, the PM2.5 pollution levels in the BTH and the CC are higher than those in the YRD and the PRD.

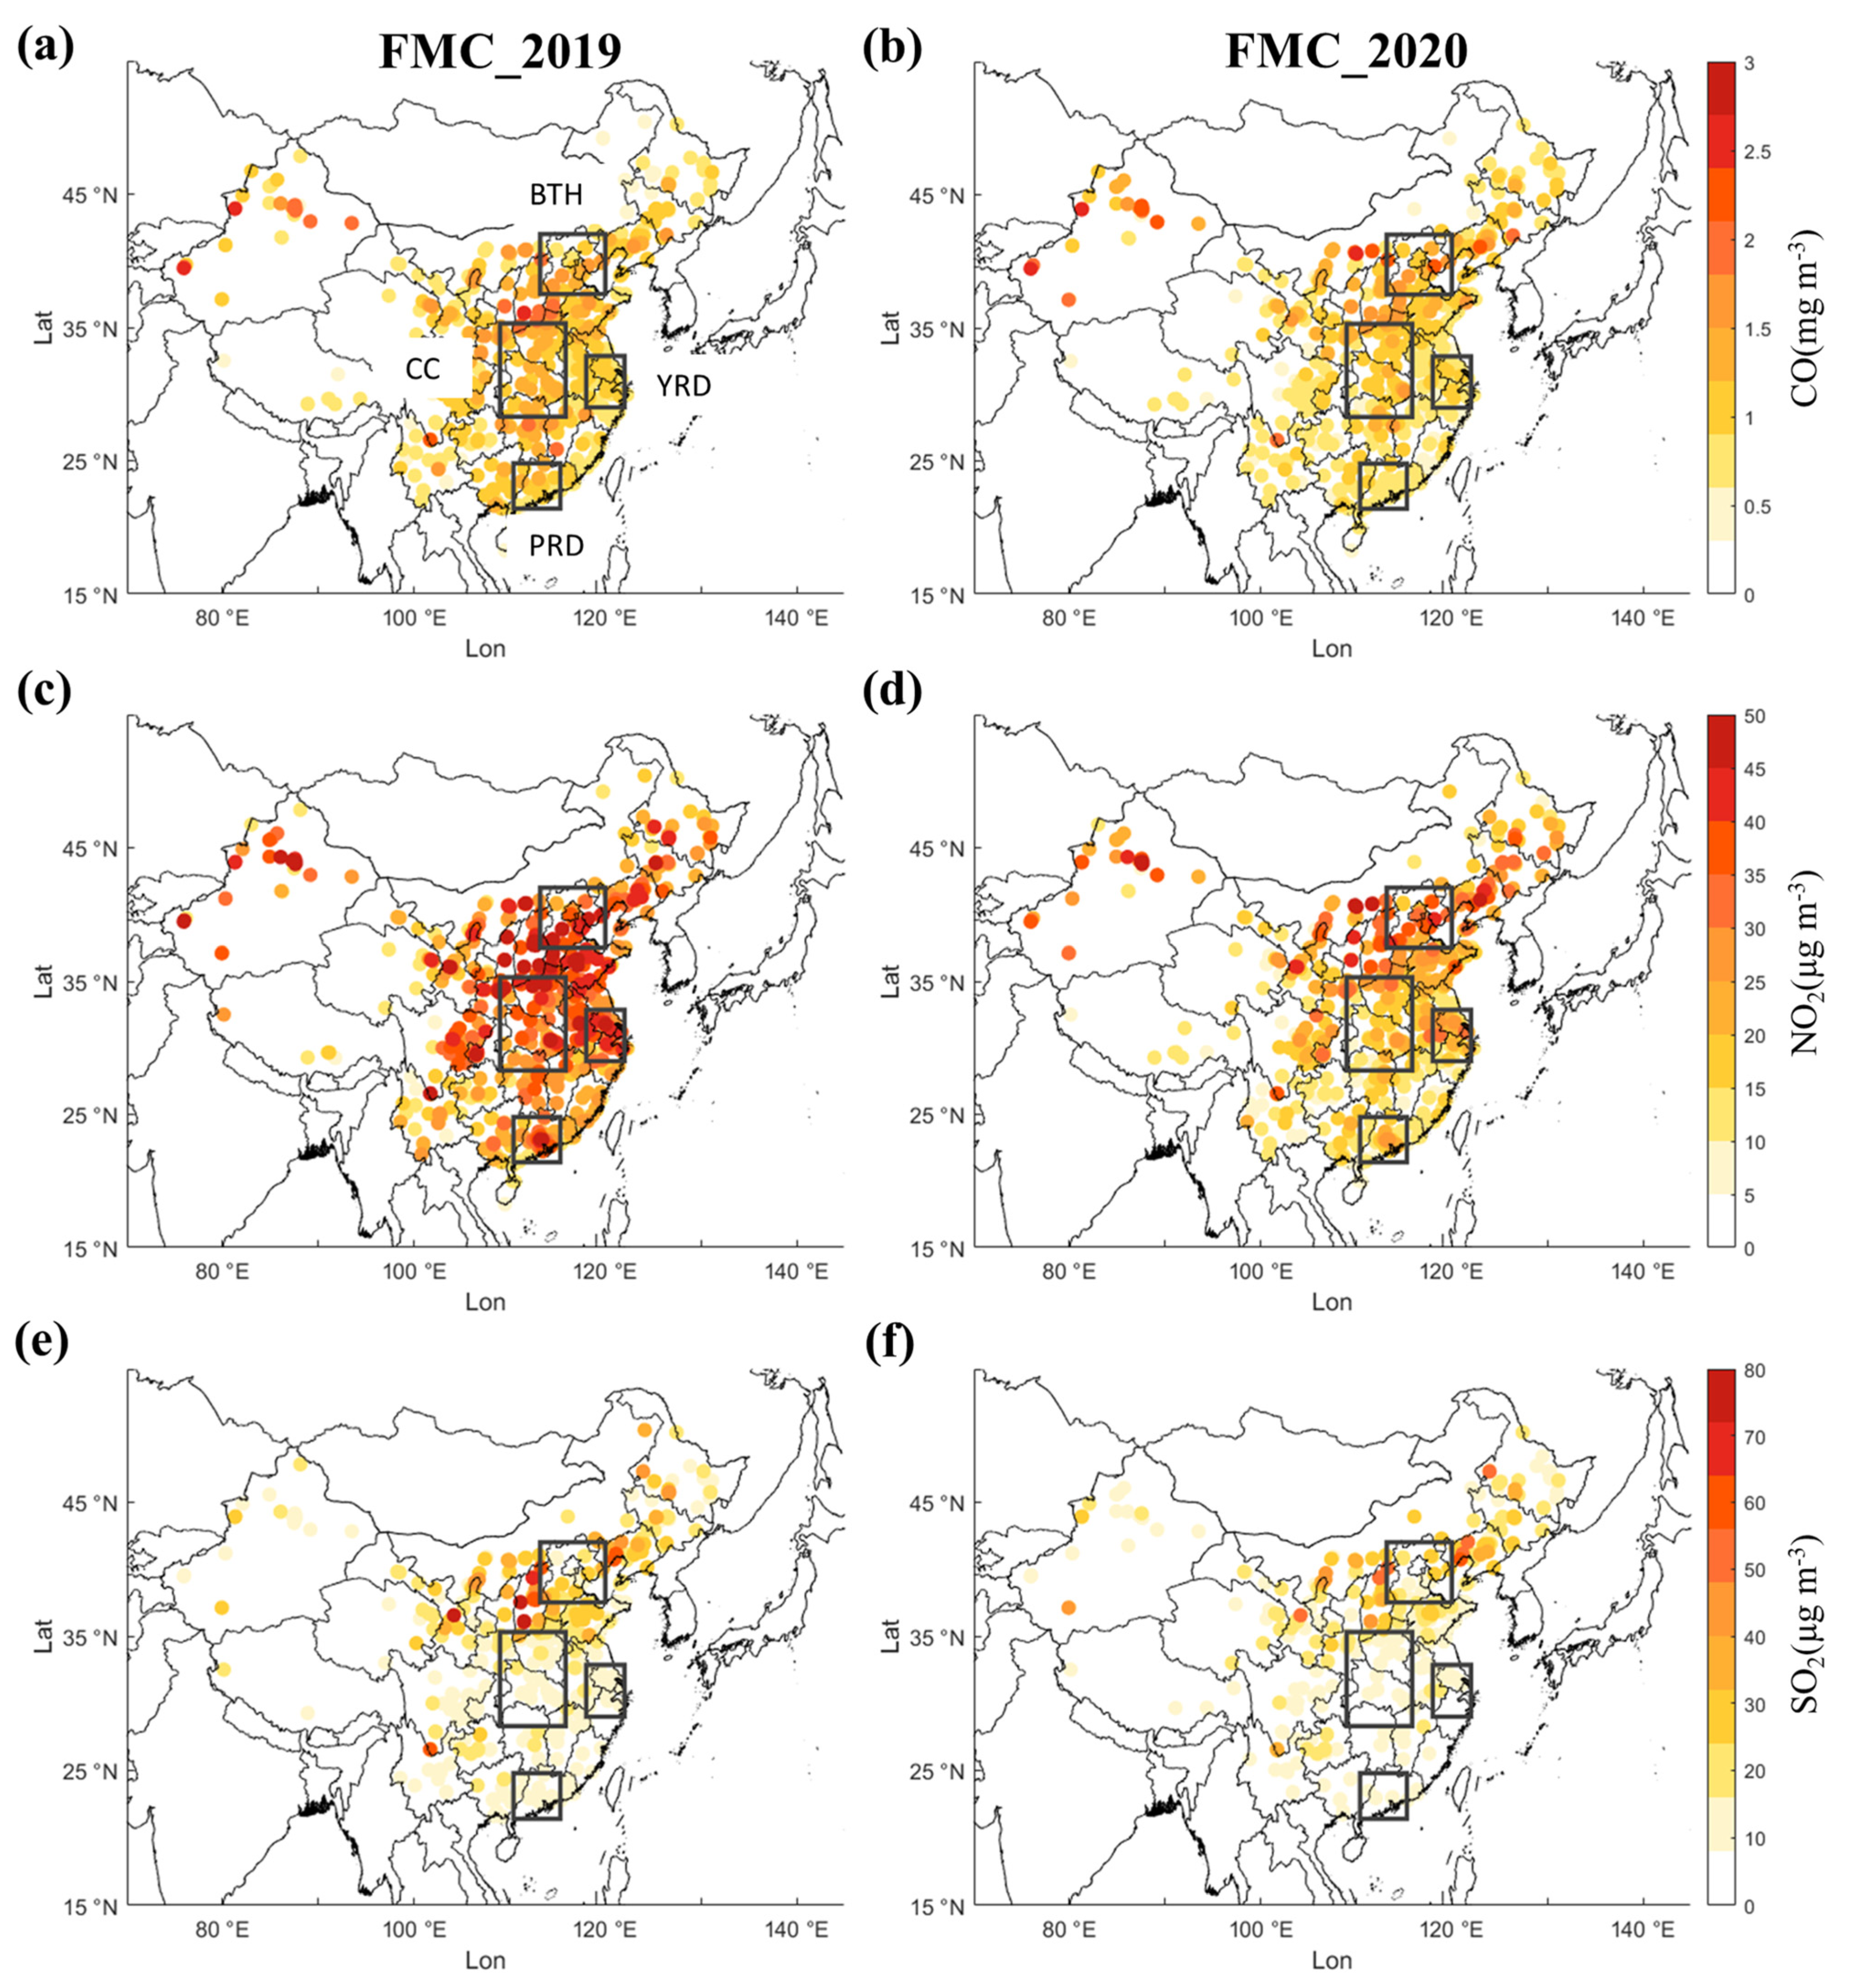
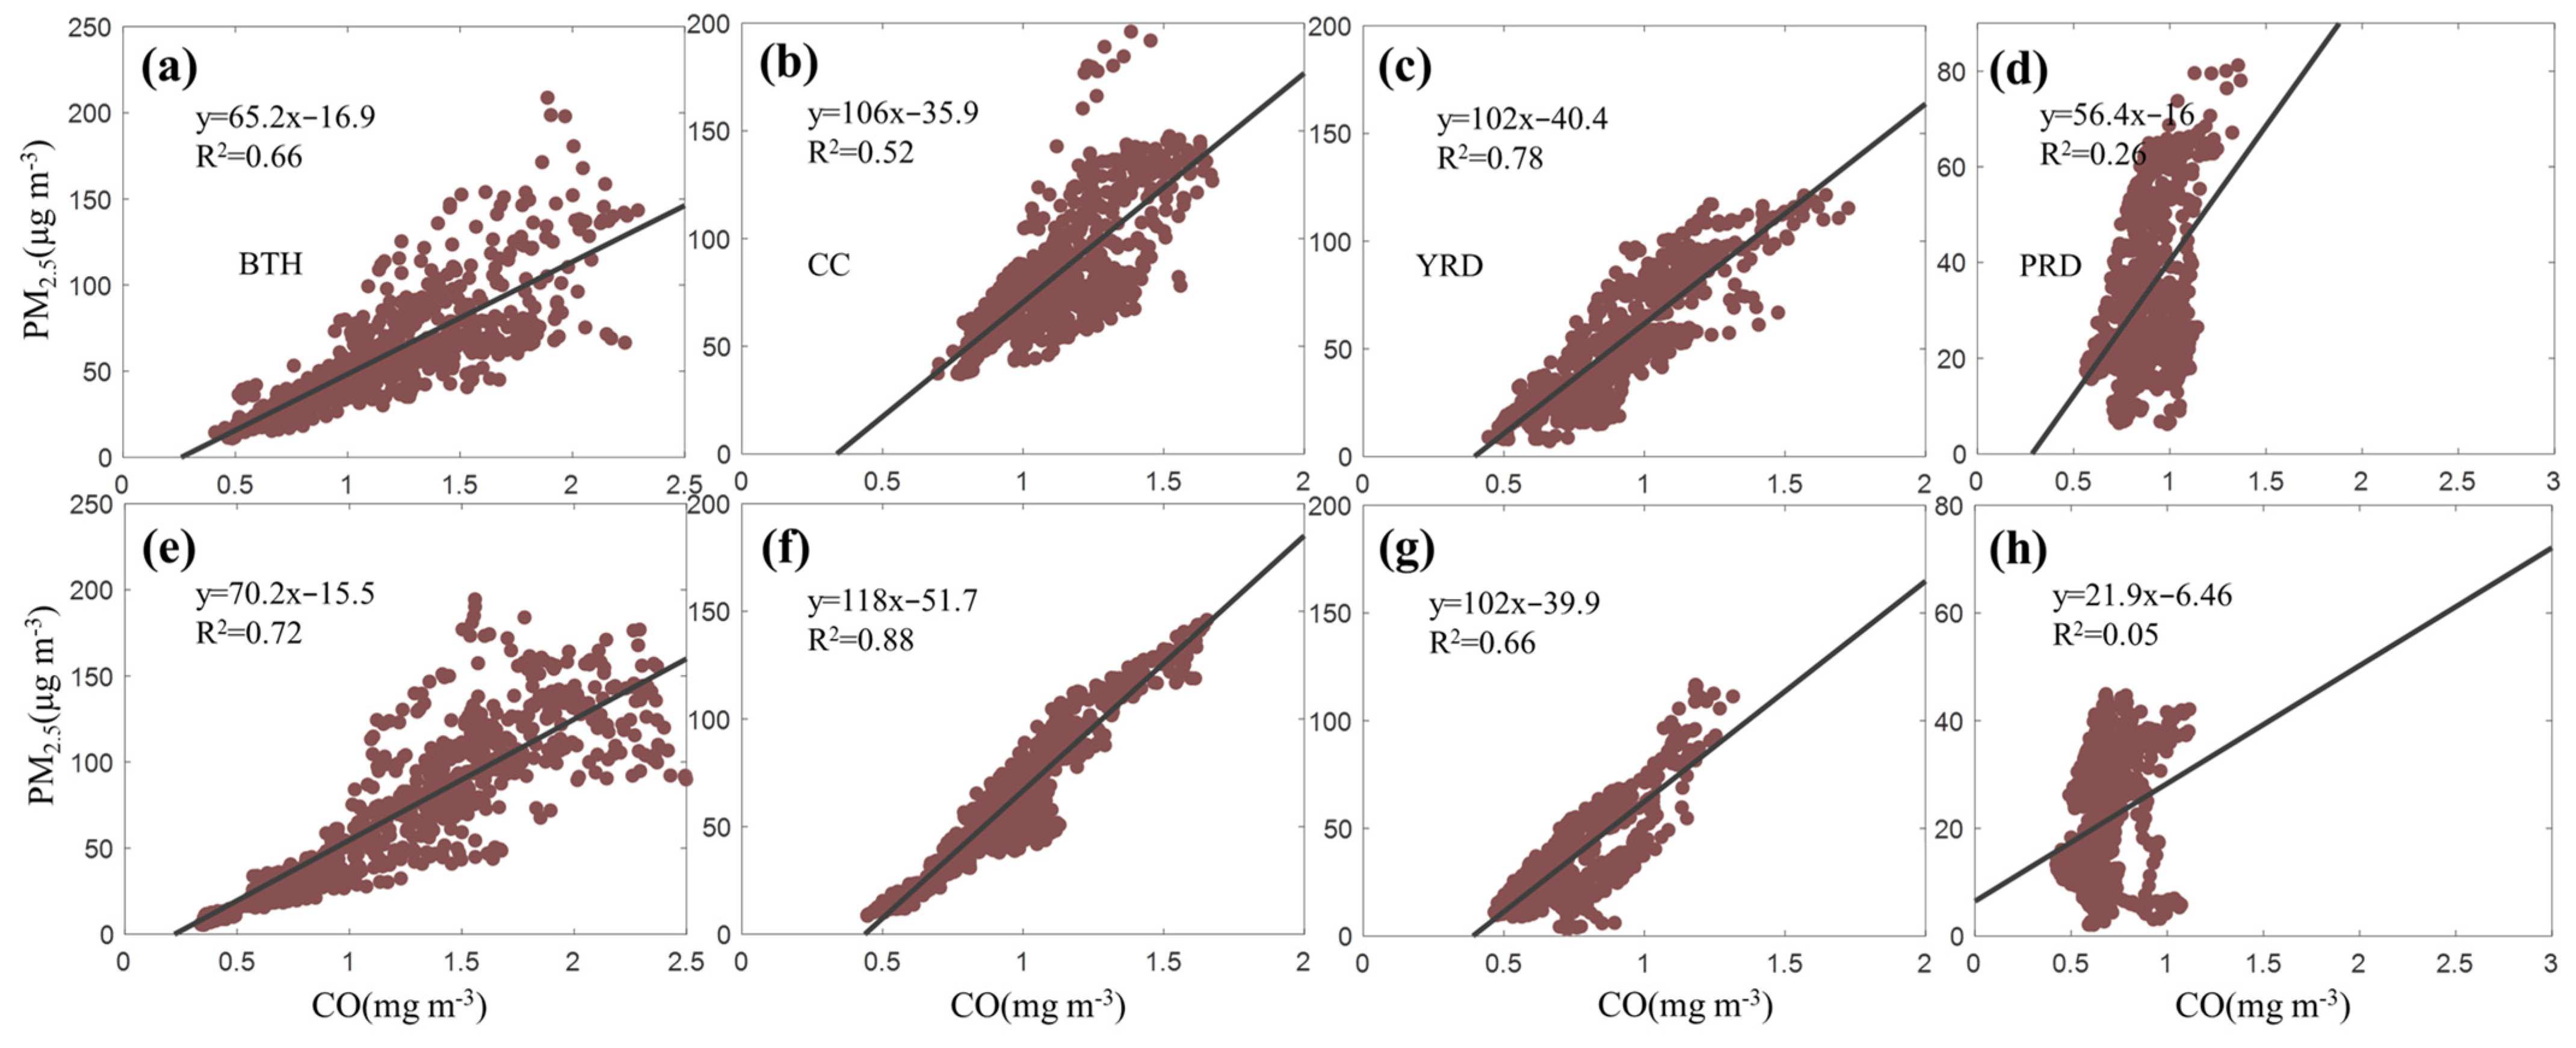
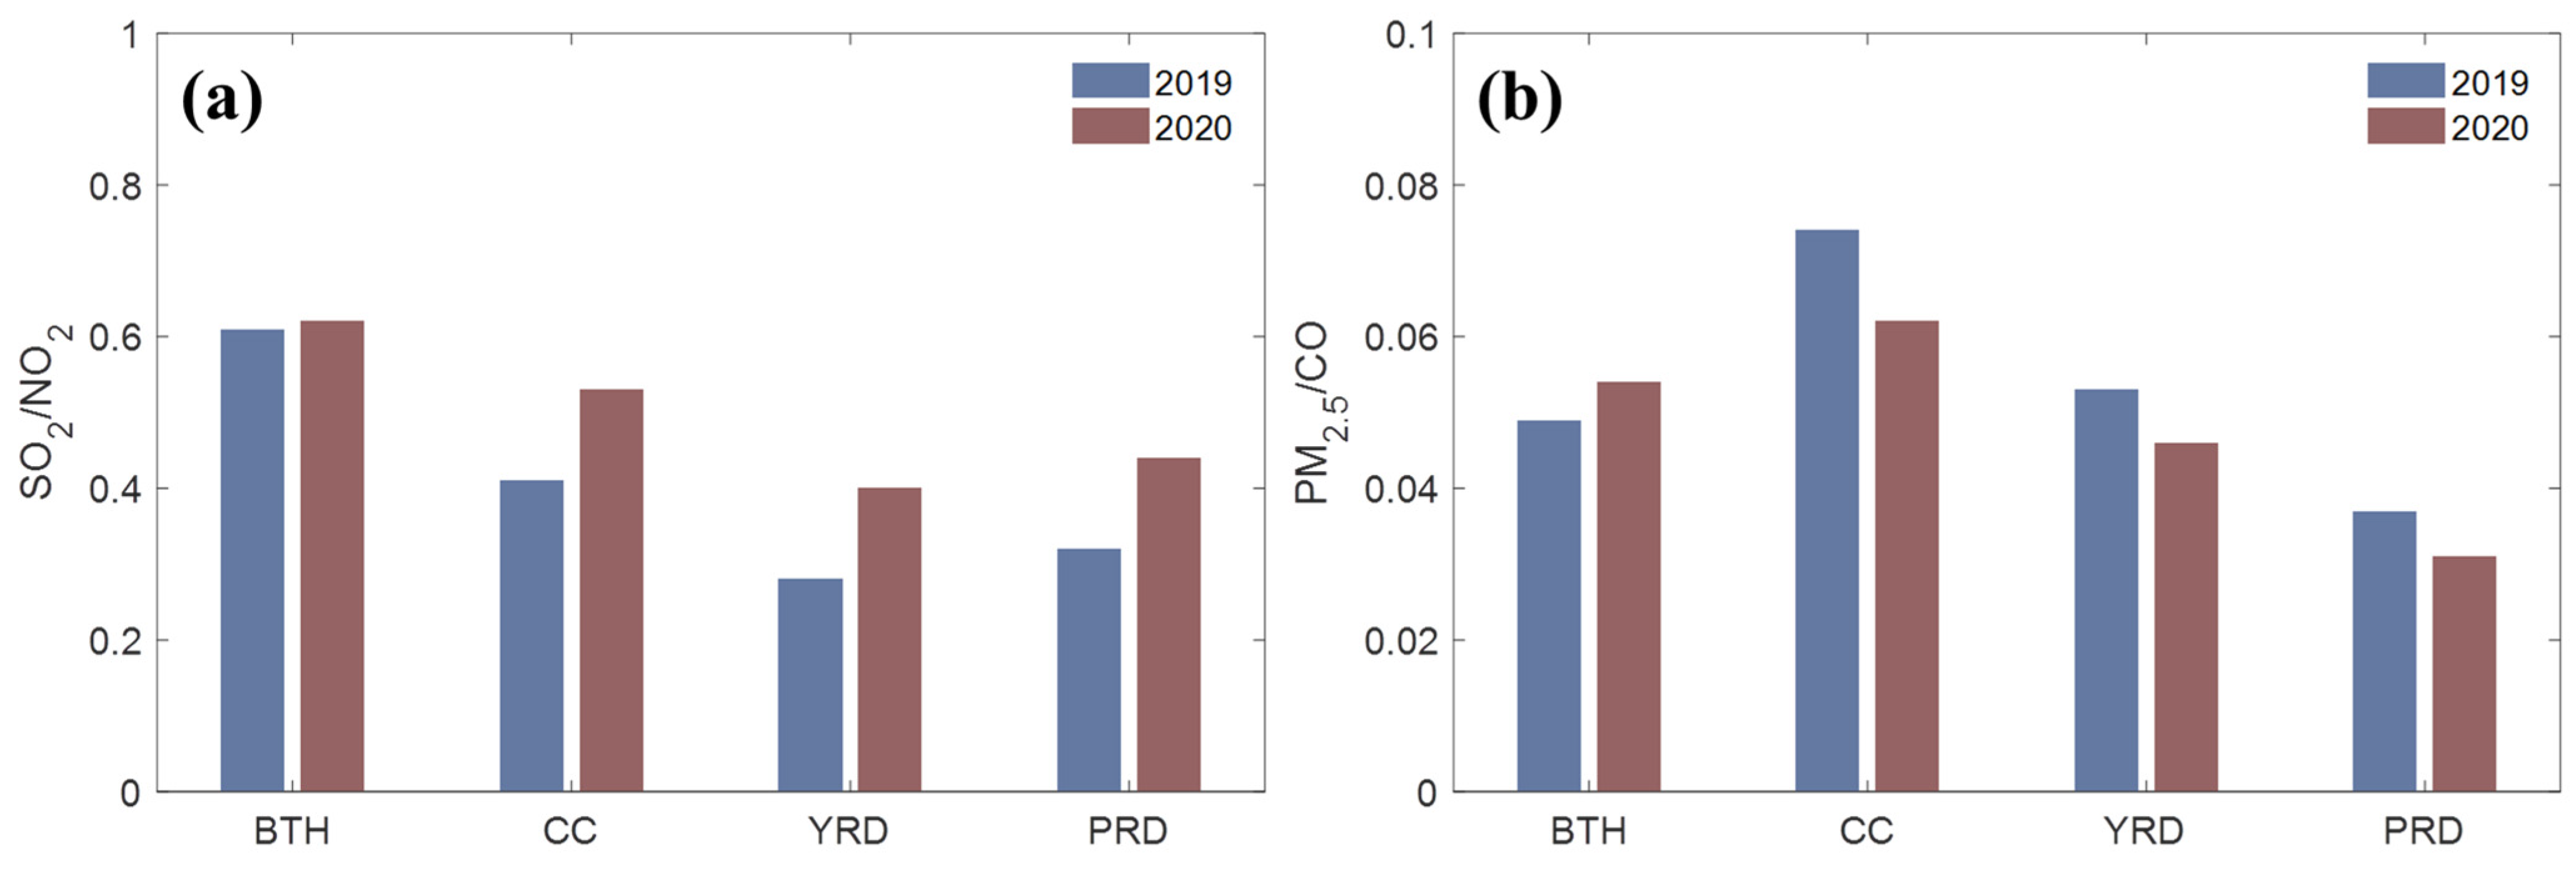
3.2. Impacts of Anthropogenic Emissions on PM2.5 Mass Concentration Changes from FMC_2019 to FMC_2020

Figure 3a,b is the spatial distribution of CO in China. Compared with FMC_2019, CO mass concentration has a small decrease in FMC_2020. The overall CO mass concentration in the CC, the YRD, and the PRD has decreased by 14, 12, and 21%, but the CO mass concentration in the BTH has increased by 10% (Table 3). The changes in CO mass concentration in these four regions are mainly affected by primary sources and meteorological conditions. To eliminate the influence of meteorological conditions and the possibility of transportation [85], we select periods for analysis that are associated with stable and similar meteorological conditions between FMC_2019 and FMC_2020 in four regions as much as possible (Table 4). For example, the meteorological conditions affecting BTH during 28–29 January and 1–2 February 2019 are similar to those during 9–11 February and 19–20 February 2020. The difference of mean atmospheric compositions between the periods in FMC_2019 and FMC_2020 can indicate the net effectiveness of large-scale lockdown measures after the COVID-19 outbreak. The same methods are also used in the CC, the YRD, and the PRD. The long-range transport of CO can be excluded in Figures S3–S6. The comparison results show that CO mass concentration from primary sources decreases by about 4, 18, 15, and 10% in the BTH, the CC, the YRD, and the PRD in FMC_2020 compared with FMC_2019 (Table 4), which means that the combustion sources reductions are relatively smaller in the BTH and larger in the CC than other regions.
In addition, Figure 4 shows the linear correlation between CO and PM2.5. CO and PM2.5 in the BTH, the CC, and the YRD have a strong positive correlation (r2 > 0.6), while the correlation in the PRD is weak (r2 < 0.3). All of these passed the 0.05 significance test. These show that PM2.5 and CO in the BTH, the CC, and the YRD have similar sources, which means combustion sources have large contributions to PM2.5. PM2.5 in the PRD may be mainly affected by non-combustion sources, secondary aerosol, etc. Through calculations by the linear regression equations with different r2 (Figure 4), compared with FMC_2019, the primary PM2.5 from combustion sources increases by about 15% in the BTH, 18% in the CC, and decreases by 38% in the YRD, 83% in the PRD, which is consistent with previous studies about primary PM2.5 [51,56]. Furthermore, the correlations analysis also finds that the increase in primary PM2.5 from combustion sources in the BTH is closely related to the increase in the contribution of coal combustion (r2 between SO2 and PM2.5 increases from 0.22 in FMC_2019 to 0.46 in FMC_2020). In the CC, the increase in the primary PM2.5 from combustion sources is mainly related to NOx emissions (r2 between NO2 and PM2.5 increases from 0.14 in FMC_2019 to 0.42 in FMC_2020), but it has been confirmed that the total primary emissions of PM2.5 decrease (Table 4), indicating a more significant decrease in PM2.5 from non-combustion sources. The lower contributions from combustion sources in the YRD and the PRD are mainly related to the decreased contributions of SO2 related emissions (r2 between SO2 and PM2.5 decreases from 0.44 (0.64) in FMC_2019 to 0.17 (0.18) in FMC_2020 in YRD (PRD)).
In China, nitrate and sulfate are the most important components of secondary particulate matter in PM2.5, which is partly affected by NOx and SO2 in the air [86,87]. Figure 3c–f shows the spatial distribution of NO2 mass concentration and SO2 mass concentration in China in FMC_2019 and FMC_2020. It can be seen that compared with FMC_2019, NO2 mass concentration and SO2 mass concentration in China in FMC_2020 decrease significantly. The overall average NO2 mass concentration in the BTH, the CC, the YRD, and the PRD regions decrease by 23, 47, 47, and 42%, and the SO2 mass concentration decrease by 19, 31, 22, and 19%, respectively (Table 3). Correspondingly, the primary emissions of NOx and SO2 in the four regions in FMC_2020 also show a downward trend, which is also confirmed by other studies [54]. The ratio of SO2/NO2 is one indicator of air pollution sources from mobile sources and stationary sources [88,89]. Figure 5 is the values of SO2/NO2. The highest value of SO2/NO2 is in the BTH, followed by the CC, the PRD, and the YRD, which shows that industrial emissions and coal combustion have a more significant impact on air pollution in the BTH in winter. At the same time, compared with two years, the value of SO2/NO2 in the BTH has changed a little, indicating that the impacts of mobile sources and stationary sources on air pollution are similar between FMC_2019 and FMC_2020. In the other three regions, the values of SO2/NO2 all increase in FMC_2020, indicating that air pollution is mainly influenced by stationary sources. The value of PM2.5/CO is also often used to measure the impacts of aerosol secondary formation processes on PM2.5 [58,66]. Therefore, values of PM2.5/CO are calculated in the BTH, the CC, the YRD, and the PRD in FMC_2019 (0.049, 0.074, 0.053, and 0.037) and FMC_2020 (0.054, 0.062, 0.046, and 0.031). The degree of correlation between CO and PM2.5 is not very high (r2 < 0.3) in the PRD, so aerosol secondary formations are not well determined by the ratio and are, therefore, not very meaningful. The secondary aerosol formations in the BTH and the CC show higher contributions to PM2.5 than those in the PRD and the YRD. Compared with FMC_2019, the weakening secondary aerosol formation processes in the air in FMC_2020 are mainly related to the substantial decrease in NOx and SO2. It is worth noting that although primary emissions of NOx and SO2 in the BTH have also been reduced, the secondary contributions to PM2.5 are strengthened, which is consistent with previous studies [19,90]. For example, although the NOx emissions have decreased, the secondary aerosol formation process is still strengthened under unfavorable meteorological conditions for aerosol pollution diffusion, mainly due to the increased particle acidity (pH), which offsets the emissions reductions [19,90].
From the perspective of the contributions of all emissions changes to PM2.5, we calculate the PM2.5 mass concentration under similar meteorological conditions (Table 4). Compared with FMC_2019, PM2.5 mass concentration decreases by 6, 25, 32, and 21% in the BTH, the CC, the YRD, and the PRD in FMC_2020. To a certain extent, there are still many uncertainties in the calculations. On the one hand, the impacts of meteorological conditions cannot be completely eliminated. On the other hand, the secondary formation processes of aerosol are greatly affected by meteorological conditions. For example, there are more secondary aerosols generated under unfavorable meteorological conditions for aerosol pollution diffusion [90]. All of these will lead to errors. However, there is a certain reference value when comparing the contributions of the two-year emissions changes to PM2.5. Further research is needed.

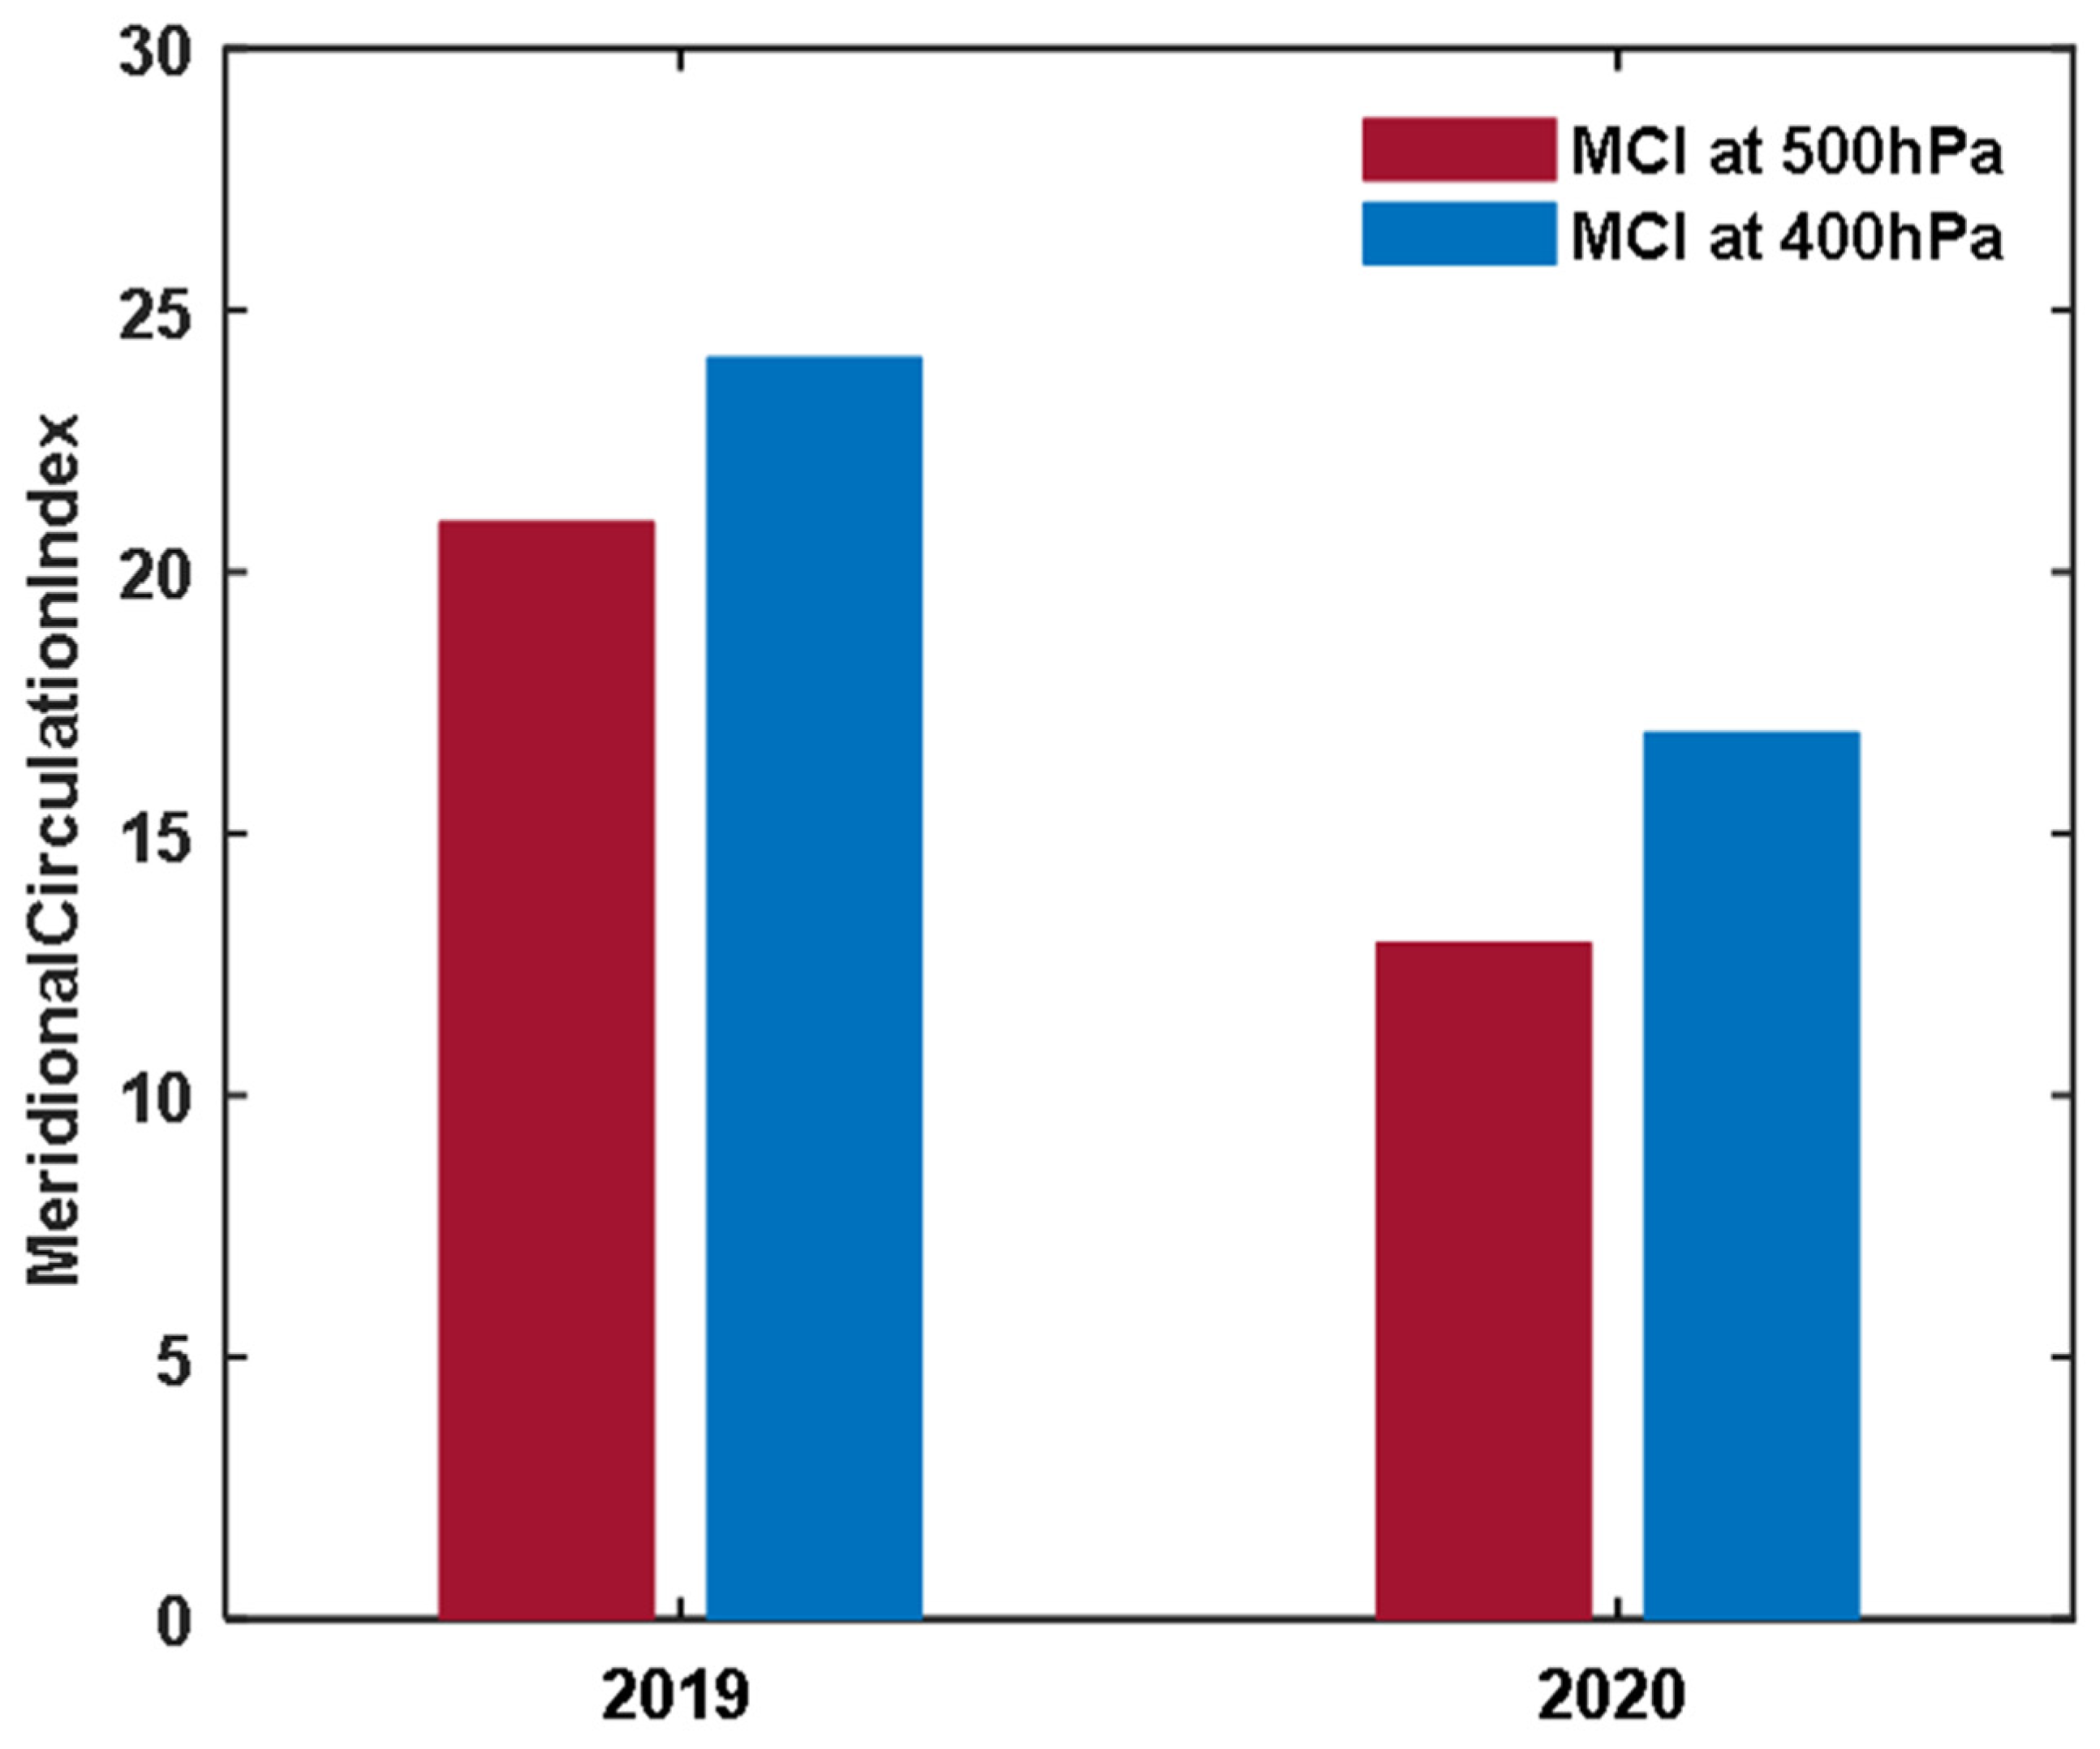
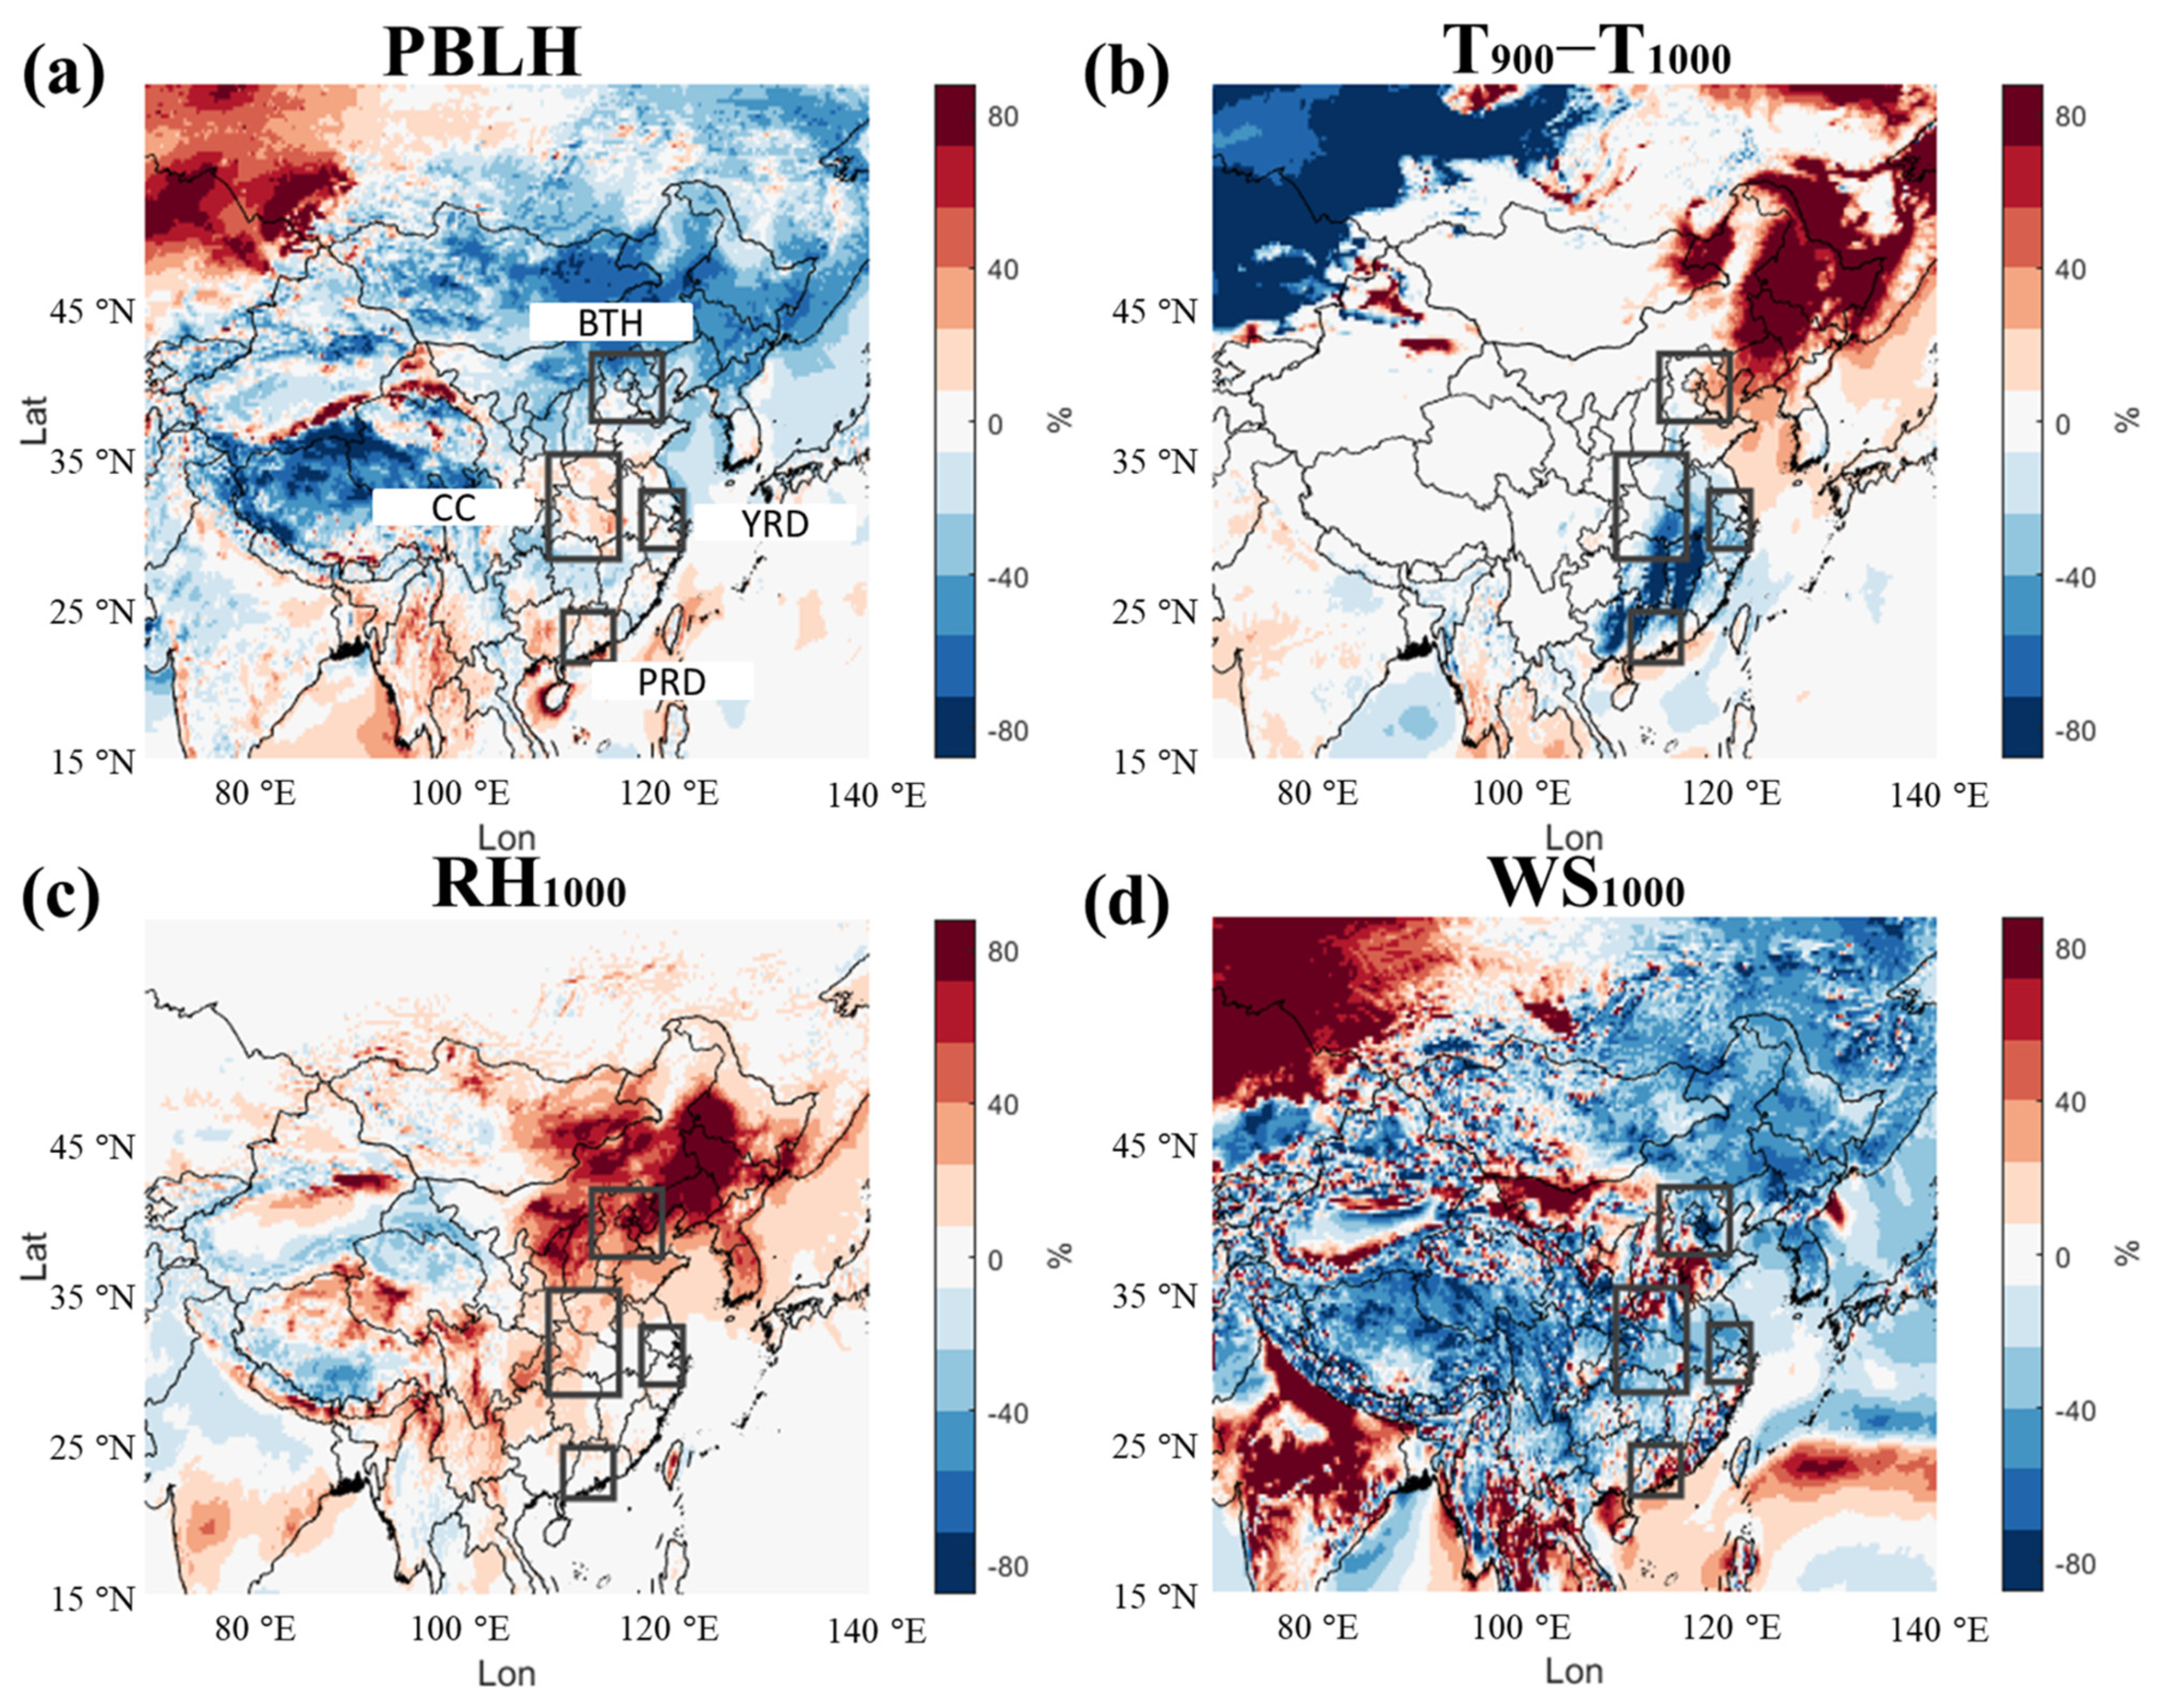
3.3. Effects of Changes in Meteorological Conditions on PM2.5 Mass Concentration from FMC_2019 to FMC_2020

Meteorological conditions also have a significant impact on affecting PM2.5 pollution [21,46]. Figure 6 shows the background circulation patterns in FMC_2019 and FMC_2020. In FMC_2019, there is a strong Siberian–Mongolian high pressure with a central value of more than 1040 hPa. Eastern China is affected by this high-pressure system, causing clean and cold air from the north. At the same time, the 500 hPa geopotential height lines are relatively dense and the development of a high-pressure ridge is weak, which leads to poor atmospheric stability. In this case, it is beneficial to the horizontal and vertical diffusion of air pollutants. In FMC_2020, the Siberian–Mongolian high pressure becomes weaker and the central value is about 1035 hPa. The sea-level pressure in the four regions in China decreases significantly and becomes uniform. However, in the PRD, the gradient of sea-level pressure becomes larger, which is beneficial to the diffusion of air pollutants. At 500 hPa, the geopotential height lines are less dense than those in FMC_2019, and the development of the high-pressure ridge is strengthened, which leads to relatively strong atmospheric stability. These unfavorable meteorological conditions are conducive to the accumulation of aerosol pollution.
The meridional circulation index (MCI) is used to represent the intensity of atmospheric circulation [91,92]. The higher value of MCI means that it is easier for cold air from the north to flow to the south, and the exchange of airflow between north and south is enhanced, which is conducive to the diffusion of aerosol pollution. In this paper, we choose two regions for calculating MCI (50–65° N, 70–90° E and 50–65° N, 126–146° E, white boxes in Figure 6), which is consistent with the previous research [93]. Figure 7 shows the values of MCI at 400 and 500 hPa in FMC_2019 and FMC_2020. It can be seen that compared with FMC_2019, the MCI at 400 and 500 hPa in FMC_2020 has decreased by 38% (from 21 to 13) and 29% (from 24 to 17), respectively. This shows that the meridional circulation is significantly weaker in FMC_2020 and impacts of clean and cold air from the north on PM2.5 are weakened, which is not conducive to the removal of aerosol pollution. The influence of the meridional circulation on the four regions of China is weakened one by one from the BTH to the PRD.
According to existing research, PBLH, temperature inversion, RH, and WS are the meteorological factors closely related to PM2.5 [28,93], among which the difference of temperature between 900 and 1000 hPa (T900−T1000) refers to the temperature inversion and atmospheric stability [55,93]. Figure 8 and Table 5 show the fractional changes of the PBLH, T900−T1000, RH at 1000 hPa (RH1000), and WS at 1000 hPa (WS1000) between FMC_2020 and FMC_2019. It can be seen that in the BTH in FMC_2020, the PBLH has decreased by 24% and the lower PBLH allows PM2.5 to mix in a smaller range; the T900−T1000 has increased by 13% and the stronger atmospheric stability is not conducive to the vertical diffusion of PM2.5; the RH increases by 53% and the hygroscopic growth of PM2.5 is strengthened; the WS decrease by 4% and horizontal diffusion of PM2.5 is weakened. All of these meteorological factors are beneficial to the accumulation of air pollutants in the BTH. However, the four meteorological factors have different impacts on PM2.5 changes in the CC, the YRD, and the PRD. The ±10% difference is used to take as a threshold of significance [55], which means that when the absolute values of fractional changes in meteorological factors are more than 10%, the meteorological factors may have a significant impact on PM2.5 mass concentration. In the CC, the absolute values of fractional changes of PBLH, RH, and WS are less than 10%, and only T900−T1000 decreases by 22%. In the YRD, the absolute values of fractional changes of PBLH and RH are less than 10%, and T900−T1000 and WS decrease 17 and 26%, respectively. In general, the comprehensive effects of these changed meteorological elements on PM2.5 changes are small in the CC and the YRD. In the PRD, PBLH increases by 8%, T900−T1000 decreases by 20%, WS increases by 18%, and RH increases a little (3%), all of which are beneficial to the diffusion of PM2.5.
The contributions of changed meteorological conditions to PM2.5 mass concentration can be derived from the difference between the two sensitive experiments. From Figure 9a–c, compared with FMC_2019, the overall meteorological conditions of FMC_2020 cause PM2.5 mass concentration to increase by 35% (from 31 to 42 µg m−3) in the BTH, 5% (from 28 to 29.5 µg m−3) in the CC, and 6% (from 34 to 36 µg m−3) in the YRD, which indicates that the meteorological conditions in FMC_2020 are more conducive to the accumulation of aerosol pollution. Besides, PM2.5 mass concentration decreases by 8% (from 12 to 11 µg m−3) in the PRD. This indicates that the meteorological conditions are more conducive to the diffusion of aerosol pollution.

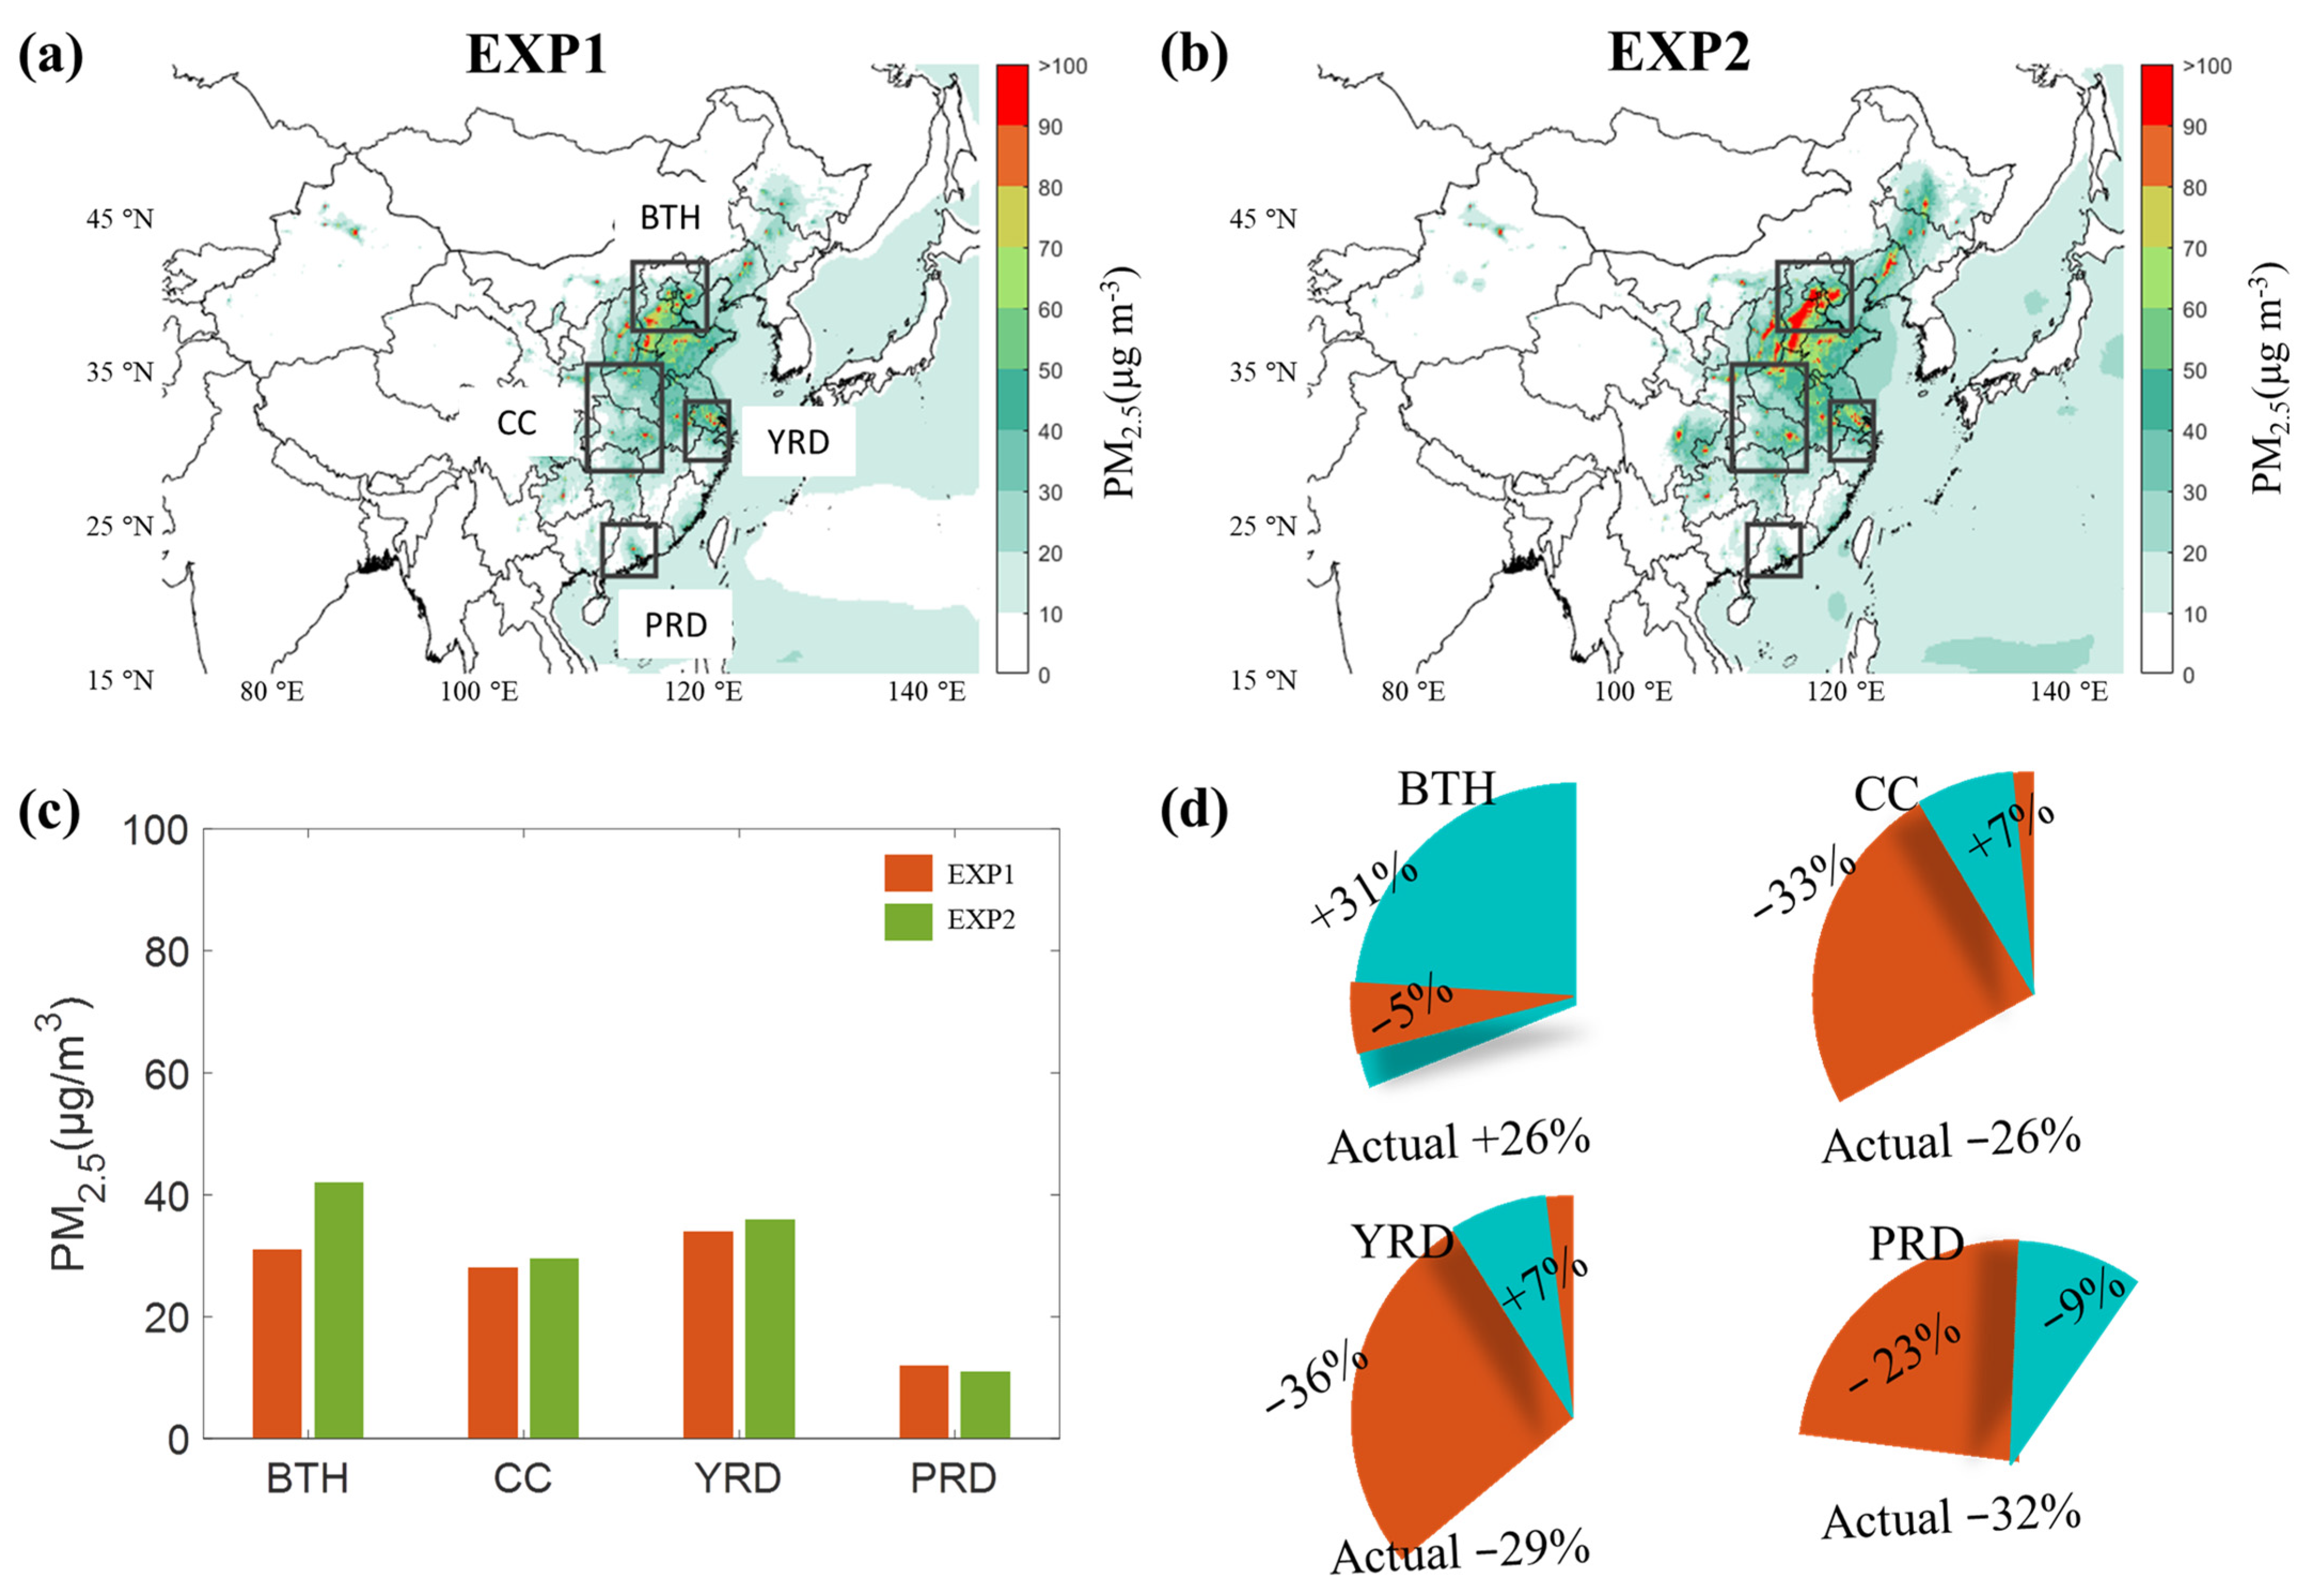
3.4. Relative Contributions of Emissions and Meteorological Conditions to PM2.5 Changes

Assuming that the relationship between meteorology, emissions and PM2.5 is linear is a widely used method to calculate the relative contributions of meteorology and emissions to PM2.5 changes [94,95]. In Section 3.2 and Section 3.3, the changes of PM2.5 mass concentration caused by changed emissions and meteorological conditions are estimated, so the Equations (2) and (3) can be used to calculate the relative contributions of them to actual PM2.5 mass concentration changes.
ReCON ( met ) = AC ( PM 2.5 ) × CON ( met ) CON ( met ) + CON ( emi )
ReCON ( emi ) = AC ( PM 2.5 ) × CON ( emis ) CON ( met ) + CON ( emi )
where ReCON ( met ) and ReCON ( emi ) represent the relative contributions of meteorological conditions and emissions to PM2.5 mass concentration. AC ( PM 2.5 ) represents the actual changes of PM2.5 mass concentration. CON ( met ) and CON ( emi ) represent the contributions of changed meteorological conditions and emissions to PM2.5 mass concentration changes. The calculated results are shown in Figure 9d. The changed meteorological conditions and emissions cause PM2.5 mass concentration to increase by 31% and decrease by 5% in the BTH, respectively, which indicates that meteorological conditions dominate the increase in PM2.5 mass concentration. In the CC and the YRD, the changed emission causes the PM2.5 mass concentration to decrease by 33 and 36%, respectively, which is much greater than the 7 and 7% increase from meteorology, reflecting the primary effect of the emissions. In the PRD, emissions and meteorology have caused PM2.5 mass concentration to decrease by 23 and 9%.

4. Conclusions

The relative contributions of meteorological conditions and emissions to PM2.5 changes are hot issues of air quality research in China. This paper uses air pollutants data, meteorological data, and the GRAPES_CUACE model to analyze and compare the relative contributions of emissions and meteorology on PM2.5 changes in four different regions (the BTH, the CC, the YRD, and the PRD).
The results show that compared with FMC_2019, the PM2.5 mass concentration in FMC_2020 in four regions has changed significantly. Among them, PM2.5 mass concentration increases by 26% in the BTH while it decreases by 26, 29, and 32% in the CC, the YRD, and the PRD, respectively. These changes are mainly caused by the combined effects of changed emissions and meteorological conditions.
In terms of emissions, compared with FMC_2019, CO emissions have the smallest decrease in the BTH (4%), followed by the PRD (10%), the YRD (15%), and the CC (18%) in FMC_2020 by calculating the difference of CO mass concentration during periods associated with similar stable weather conditions. Besides, through using the linear regression equations with different r2, the contributions of combustion sources to primary PM2.5 in FMC_2020 increase by about 15% in the BTH and 18% in the CC, while decrease by 38% in the YRD and 83% in the PRD. The increased contributions in the BTH and the CC are caused by higher contributions of coal burning and emissions related to NO2, respectively. The decreased contributions of combustion sources in the YRD and the PRD are mainly related to the lower contributions of emissions related to SO2.
For meteorology, compared with FMC_2019, the Siberian–Mongolian high-pressure is weakened, the high-pressure ridge at 500 hPa is strengthened, and the geopotential height lines are less dense in FMC_2020, which is not conducive to the diffusion of PM2.5 in the BTH, the CC, and the YRD. However, the gradient of sea level pressure becomes larger in the PRD region, which is conducive to the diffusion of air pollutants. The MCI changes show that the air ventilation between the north and the south of China is weakened, which is not conducive to the diffusion of aerosol pollution in four regions. Moreover, PBLH decreases by 24%, the T900−T1000 increases by 13%, the RH increases by 53%, and the WS decreases by 4% in the BTH, which are all beneficial to the accumulation of aerosol pollution. However, meteorological factors have no significant changes in the CC and the YRD. In the PRD, meteorological factors are beneficial to the diffusion of aerosol pollution.
In general, in the BTH, the observed PM2.5 mass concentration increase is mainly attributed to unfavorable meteorological conditions (+31%) which eliminate the −5% changes of PM2.5 mass concentration caused by emissions reductions. In the CC and the YRD, the decrease in PM2.5 mass concentration is dominated by emissions reductions (−33 and −36%), which are greater than the positive contributions of meteorological conditions (+7 and +7%). In the PRD, the decrease in PM2.5 mass concentration is caused by emissions reductions (−23%) and favorable meteorological conditions (−9%). The changes in air pollutants in further pre-COVID years (Figures S1 and S2 from the Supplementary Materials) will continue to be discussed in future studies.

Supplementary Materials

The following supporting information can be downloaded at: https://www.mdpi.com/article/10.3390/atmos13020222/s1, Figure S1: Distributions of monthly average PM2.5 mass concentration (µg m−3) in China; Figure S2: Distributions of monthly average CO mass concentration (mg m−3) in China; Figure S3: The values of CO/NOx during FMC_2019 and FMC_2020 in the BTH; Figure S4: As in Figure S3, but in the CC; Figure S5: As in Figure S3, but in the YRD; Figure S6: As in Figure S3, but in the PRD.

Author Contributions

Conceptualization, H.W.; methodology, W.Z.; validation, W.Z., Y.P. and Z.L.; investigation, W.Z.; resources, Y.W. and H.C.; data curation, J.Z.; writing—review and editing, W.Z.; visualization, W.Z. and Y.Z.; supervision, H.W. and X.Z. All authors have read and agreed to the published version of the manuscript.

Funding

This study is supported by the National Key Research and Development Program of China (2019YFC0214601), the Major Program of National Natural Science Foundation of China (Grant No. 42090030).

Institutional Review Board Statement

Not applicable.

Informed Consent Statement

Not applicable.

Data Availability Statement

Not applicable.

Conflicts of Interest

The authors declare no conflict of interest. The funders had no role in the design of the study; in the collection, analyses, or interpretation of data; in the writing of the manuscript, or in the decision to publish the results.

References

  1. Fu, G.Q.; Xu, W.Y.; Yang, R.F.; Li, J.B.; Zhao, C.S. The distribution and trends of fog and haze in the North China Plain over the past 30 years. Atmos. Chem. Phys. 2014, 14, 11949–11958. [Google Scholar] [CrossRef] [Green Version]
  2. Li, Z.; Ma, Z.; van der Kuijp, T.J.; Yuan, Z.; Huang, L. A Review of Soil Heavy Metal Pollution from Mines in China: Pollution and Health Risk Assessment. Sci. Total Environ. 2013, 468–469, 843–853. [Google Scholar] [CrossRef] [PubMed]
  3. Matus, K.; Nam, K.M.; Selin, N.E.; Lamsal, L.N.; Reilly, J.M.; Paltsev, S. Health damages from air pollution in China. Glob. Environ. Chang. 2012, 22, 55–66. [Google Scholar] [CrossRef] [Green Version]
  4. Che, H.; Zhang, X.-Y.; Xia, X.; Goloub, P.; Holben, B.; Zhao, H.; Wang, Y.; Wang, H.; Blarel, L.; Damiri, B.; et al. Ground-based aerosol climatology of China: Aerosol optical depths from the China Aerosol Remote Sensing Network (CARSNET) 2002–2013. Atmos. Chem. Phys. 2015, 15, 7619–7652. [Google Scholar] [CrossRef] [Green Version]
  5. Chen, H.; Wang, H. Haze Days in North China and the associated atmospheric circulations based on daily visibility data from 1960 to 2012. J. Geophys. Res. Atmos. 2015, 120, 5895–5909. [Google Scholar] [CrossRef]
  6. Querol, X.; Alastuey, A.; Rodriguez, S.; Plana, F.; Ruiz, C.R. Monitoring of PM10 and PM2.5 around primary particulate anthropogenic emission sources. Atmos. Environ. 2001, 35, 845–858. [Google Scholar] [CrossRef]
  7. Zhang, Q.; Streets, D.G.; He, K.; Klimont, Z. Major components of China’s anthropogenic primary particulate emissions. Environ. Res. Lett. 2007, 2, 045027. [Google Scholar] [CrossRef]
  8. Zhai, S.; Jacob, D.; Wang, X.; Shen, L.; Ke, L.; Zhang, Y.; Gui, K.; Zhao, T.; Liao, H. Fine particulate matter (PM2.5) trends in China, 2013–2018: Separating contributions from anthropogenic emissions and meteorology. Atmos. Chem. Phys. 2019, 19, 11031–11041. [Google Scholar] [CrossRef] [Green Version]
  9. Jin, Q.; Fang, X.; Wen, B.; Shan, A. Spatio-temporal variations of PM2.5 emission in China from 2005 to 2014. Chemosphere 2017, 183, 429–436. [Google Scholar] [CrossRef]
  10. Andersson, A.; Deng, J.; Du, K.; Yan, C.; Zheng, M.; Sköld, M.; Gustafsson, O. Regionally-Varying Combustion Sources of the January 2013 Severe Haze Events over Eastern China. Environ. Sci. Technol. 2015, 49, 2038–2043. [Google Scholar] [CrossRef]
  11. Pui, D.Y.H.; Chen, S.-C.; Zuo, Z. PM2.5 in China: Measurements, sources, visibility and health effects, and mitigation. Particuology 2014, 13, 1–26. [Google Scholar] [CrossRef]
  12. Cheng, S.; Lang, J.; Zhou, Y.; Han, L.; Wang, G.; Chen, D. A new monitoring-simulation-source apportionment approach for investigating the vehicular emission contribution to the PM2.5 pollution in Beijing, China. Atmos. Environ. 2013, 79, 308–316. [Google Scholar] [CrossRef]
  13. Zhang, T.; Claeys, M.; Cachier, H.; Dong, S.; Wang, W.; Maenhaut, W.; Liu, X. Identification and estimation of the biomass burning contribution to Beijing aerosol using levoglucosan as a molecular marker. Atmos. Environ. 2008, 42, 7013–7021. [Google Scholar] [CrossRef]
  14. Liu, P.; Zhang, C.; Xue, C.; Mu, Y.; Liu, J.; Zhang, Y.; Tian, D.; Ye, C.; Zhang, H.; Guan, J. The contribution of residential coal combustion to atmospheric PM2. 5 in northern China during winter. Atmos. Chem. Phys. 2017, 17, 11503–11520. [Google Scholar] [CrossRef] [Green Version]
  15. Zhang, Z.; Wang, W.; Cheng, M.; Liu, S.; Xu, J.; He, Y.; Meng, F. The contribution of residential coal combustion to PM2.5 pollution over China’s Beijing-Tianjin-Hebei region in winter. Atmos. Environ. 2017, 159, 147–161. [Google Scholar] [CrossRef]
  16. Xu, Q.; Wang, S.; Jiang, J.; Bhattarai, N.; Li, X.; Chang, X.; Qiu, X.; Zheng, M.; Hua, Y.; Hao, J. Nitrate dominates the chemical composition of PM2.5 during haze event in Beijing, China. Sci. Total Environ. 2019, 689, 1293–1303. [Google Scholar] [CrossRef] [PubMed]
  17. Zhang, Q.; Quan, J.; Tie, X.; Li, X.; Liu, Q.; Gao, Y.; Zhao, D. Effects of meteorology and secondary particle formation on visibility during heavy haze events in Beijing, China. Sci. Total Environ. 2015, 502, 578–584. [Google Scholar] [CrossRef] [PubMed]
  18. Cheng, Y.; Zheng, G.; Wei, C.; Mu, Q.; Zheng, B.; Wang, Z.; Gao, M.; Zhang, Q.; He, K.; Carmichael, G.; et al. Reactive nitrogen chemistry in aerosol water as a source of sulfate during haze events in China. Sci. Adv. 2016, 2, e1601530. [Google Scholar] [CrossRef] [PubMed] [Green Version]
  19. Sun, Y.; Lei, L.; Zhou, W.; Chen, C.; He, Y.; Sun, J.; Li, Z.; Xu, W.; Wang, Q.; Ji, D.; et al. A chemical cocktail during the COVID-19 outbreak in Beijing, China: Insights from six-year aerosol particle composition measurements during the Chinese New Year holiday. Sci. Total Environ. 2020, 742, 140739. [Google Scholar] [CrossRef]
  20. Huang, R.-J.; Zhang, Y.; Bozzetti, C.; Ho, K.-F.; Cao, J.-J.; Han, Y.; Daellenbach, K.R.; Slowik, J.G.; Platt, S.M.; Canonaco, F.; et al. High secondary aerosol contribution to particulate pollution during haze events in China. Nature 2014, 514, 218–222. [Google Scholar] [CrossRef] [Green Version]
  21. Zhang, X.; Xu, X.; Ding, Y.; Liu, Y.; Zhang, H.; Wang, Y.; Zhong, J. The impact of meteorological changes from 2013 to 2017 on PM2.5 mass reduction in key regions in China. Sci. China Earth Sci. 2019, 62, 1885–1902. [Google Scholar] [CrossRef]
  22. Leibensperger, E.; Mickley, L.; Jacob, D. Sensitivity of US air quality to mid-latitude cyclone frequency and implications of 1980–2006 climate change. Atmos. Chem. Phys. 2008, 8, 7075–7086. [Google Scholar] [CrossRef] [Green Version]
  23. Li, Q.; Jacob, D.J.; Park, R.; Wang, Y.; Heald, C.L.; Hudman, R.; Yantosca, R.M.; Martin, R.V.; Evans, M. North American pollution outflow and the trapping of convectively lifted pollution by upper-level anticyclone. J. Geophys. Res. Atmos. 2005, 110, D10301. [Google Scholar] [CrossRef] [Green Version]
  24. Wu, P.; Ding, Y.; Liu, Y. Atmospheric circulation and dynamic mechanism for persistent haze events in the Beijing–Tianjin–Hebei region. Adv. Atmos. Sci. 2017, 34, 429–440. [Google Scholar] [CrossRef] [Green Version]
  25. Liao, T.; Wang, S.; Ai, J.; Gui, K.; Duan, B.; Zhao, Q.; Zhang, X.; Jiang, W.; Sun, Y. Heavy pollution episodes, transport pathways and potential sources of PM2.5 during the winter of 2013 in Chengdu (China). Sci. Total Environ. 2017, 584–585, 1056–1065. [Google Scholar] [CrossRef] [PubMed]
  26. Liu, J.; Man, R.; Ma, S.; Li, J.; Wu, Q.; Peng, J. Atmospheric levels and health risk of polycyclic aromatic hydrocarbons (PAHs) bound to PM2.5 in Guangzhou, China. Mar. Pollut. Bull. 2015, 100, 134–143. [Google Scholar] [CrossRef]
  27. Wang, M.; Cao, C.; Li, G.; Singh, R.P. Analysis of a severe prolonged regional haze episode in the Yangtze River Delta, China. Atmos. Environ. 2015, 102, 112–121. [Google Scholar] [CrossRef]
  28. Wang, H.; Li, J.; Peng, Y.; Zhang, M.; Che, H.; Zhang, X. The impacts of the meteorology features on PM2.5 levels during a severe haze episode in central-east China. Atmos. Environ. 2019, 197, 177–189. [Google Scholar] [CrossRef]
  29. Zhang, Y.; Chen, J.; Yang, H.; Li, R.; Yu, Q. Seasonal variation and potential source regions of PM2.5-bound PAHs in the megacity Beijing, China: Impact of regional transport. Environ. Pollut. 2017, 231, 329–338. [Google Scholar] [CrossRef]
  30. Mu, Q.; Liao, H. Simulation of the interannual variations of aerosols in China: Role of variations in meteorological parameters. Atmos. Chem. Phys. 2014, 14, 9597–9612. [Google Scholar] [CrossRef] [Green Version]
  31. Zhong, J.; Zhang, X.; Wang, Y.; Sun, J.; Zhang, Y.; Wang, J.; Tan, K.; Shen, X.; Che, H.; Zhang, L.; et al. Relative contributions of boundary-layer meteorological factors to the explosive growth of PM2.5 during the red-alert heavy pollution episodes in Beijing in December 2016. J. Meteorol. Res. 2017, 31, 809–819. [Google Scholar] [CrossRef]
  32. Zhong, J.; Zhang, X.; Dong, Y.; Wang, Y.; Liu, C.; Wang, J.; Zhang, Y.; Che, H. Feedback effects of boundary-layer meteorological factors on cumulative explosive growth of PM2.5 during winter heavy pollution episodes in Beijing from 2013 to 2016. Atmos. Chem. Phys. 2018, 18, 247–258. [Google Scholar] [CrossRef] [Green Version]
  33. Zhong, J.; Zhang, X.; Wang, Y.; Wang, J.; Shen, X.; Zhang, H.; Wang, T.; Xie, Z.; Liu, C.; Chang, H.; et al. The two-way feedback mechanism between unfavorable meteorological conditions and cumulative aerosol pollution in various haze regions of China. Atmos. Chem. Phys. 2019, 19, 3287–3306. [Google Scholar] [CrossRef] [Green Version]
  34. Liu, L.; Zhang, X.; Zhong, J.; Wang, J.; Yang, Y. The ‘two-way feedback mechanism’ between unfavorable meteorological conditions and cumulative PM2.5 mass existing in polluted areas south of Beijing. Atmos. Environ. 2019, 208, 1–9. [Google Scholar] [CrossRef]
  35. Zhang, W.; Zhang, X.; Zhong, J.; Wang, Y.; Wang, J.; Zhao, Y.; Bu, S. The effects of the “two-way feedback mechanism” on the maintenance of persistent heavy aerosol pollution over areas with relatively light aerosol pollution in northwest China. Sci. Total Environ. 2019, 688, 642–652. [Google Scholar] [CrossRef] [PubMed]
  36. Chen, Z.; Chen, D.; Zhao, C.; Kwan, M.-P.; Cai, J.; Zhuang, Y.; Zhao, B.; Wang, X.; Chen, B.; Yang, J.; et al. Influence of meteorological conditions on PM2.5 concentrations across China: A review of methodology and mechanism. Environ. Int. 2020, 139, 105558. [Google Scholar] [CrossRef]
  37. Cai, S.; Wang, Y.; Zhao, B.; Wang, S.; Chang, X.; Hao, J. The impact of the “Air Pollution Prevention and Control Action Plan” on PM2.5 concentrations in Jing-Jin-Ji region during 2012–2020. Sci. Total Environ. 2017, 580, 197–209. [Google Scholar] [CrossRef]
  38. Wang, G.; Cheng, S.; Wei, W.; Yang, X.; Wang, X.; Jia, J.; Lang, J.; Lv, Z. Characteristics and emission-reduction measures evaluation of PM2.5 during the two major events: APEC and Parade. Sci. Total Environ. 2017, 595, 81–92. [Google Scholar] [CrossRef]
  39. Zhang, Q.; Zheng, Y.; Tong, D.; Shao, M.; Wang, S.; Zhang, Y.; Xu, X.; Wang, J.; He, H.; Liu, W. Drivers of improved PM2.5; air quality in China from 2013 to 2017. Proc. Natl. Acad. Sci. USA 2019, 116, 24463. [Google Scholar] [CrossRef] [Green Version]
  40. The State Council of the People’s Republic of China, The Eleventh Five-Year Plan for National Economic and Social Development of the People’s Republic of China. 2006. Available online: https://www.gov.cn/gongbao/content/2006/content_268766.htm (accessed on 8 May 2021). (In Chinese)
  41. The State Council of the People’s Republic of China. The Twelfth Five-Year Plan for Energy Saving and Emission Reduction. Available online: https://www.gov.cn/2011lh/content_1824603.htm (accessed on 8 May 2021). (In Chinese)
  42. The State Council of the People’s Republic of China. Air Pollution Prevention and Control Action Plan. Available online: https://www.gov.cn/zwgk/2013-09/12/content_2486773.htm (accessed on 8 May 2021). (In Chinese)
  43. The State Council of the People’s Republic of China. Three-year Action Plan for Blue Skies. Available online: https://www.gov.cn/zhengce/content/2018-07/03/content_5303158.htm (accessed on 9 May 2021). (In Chinese)
  44. Ansari, T.U.; Wild, O.; Li, J.; Yang, T.; Xu, W.; Sun, Y.; Wang, Z. Effectiveness of short-term air quality emission controls: A high-resolution model study of Beijing during the Asia-Pacific Economic Cooperation (APEC) summit period. Atmos. Chem. Phys. 2019, 19, 8651–8668. [Google Scholar] [CrossRef] [Green Version]
  45. Zhang, L.; Shao, J.; Lu, X.; Zhao, Y.; Hu, Y.; Henze, D.K.; Liao, H.; Gong, S.; Zhang, Q. Sources and Processes Affecting Fine Particulate Matter Pollution over North China: An Adjoint Analysis of the Beijing APEC Period. Environ. Sci. Technol. 2016, 50, 8731–8740. [Google Scholar] [CrossRef] [PubMed]
  46. Liu, T.; Gong, S.; He, J.; Yu, M.; Wang, Q.; Li, H.; Liu, W.; Zhang, J.; Li, L.; Wang, X.; et al. Attributions of meteorological and emission factors to the 2015 winter severe haze pollution episodes in China’s Jing-Jin-Ji area. Atmos. Chem. Phys. 2017, 17, 2971–2980. [Google Scholar] [CrossRef] [Green Version]
  47. Ma, Q.; Wu, Y.; Zhang, D.; Wang, X.; Xia, Y.; Liu, X.; Tian, P.; Han, Z.; Xia, X.; Wang, Y.; et al. Roles of regional transport and heterogeneous reactions in the PM2.5 increase during winter haze episodes in Beijing. Sci. Total Environ. 2017, 599, 246–253. [Google Scholar] [CrossRef] [PubMed]
  48. Zhong, J.; Zhang, X.; Wang, Y. Reflections on the threshold for PM 2.5 explosive growth in the cumulative stage of winter heavy aerosol pollution episodes (HPEs) in Beijing. Tellus Ser. B Chem. Phys. Meteorol. 2018, 71, 1445379. [Google Scholar]
  49. Chang, Y.; Huang, R.-J.; Ge, X.; Huang, X.; Hu, J.; Duan, Y.; Zou, Z.; Liu, X.; Lehmann, M. Puzzling Haze Events in China During the Coronavirus (COVID-19) Shutdown. Geophys. Res. Lett. 2020, 47, e2020GL088533. [Google Scholar] [CrossRef]
  50. Huang, X.; Ding, A.; Gao, J.; Zheng, B.; Zhou, D.; Qi, X.; Tang, R.; Wang, J.; Ren, C.; Nie, W.; et al. Enhanced secondary pollution offset reduction of primary emissions during COVID-19 lockdown in China. Natl. Sci. Rev. 2020, 8, nwaa137. [Google Scholar] [CrossRef] [PubMed]
  51. Tian, J.; Wang, Q.; Zhang, Y.; Yan, M.; Liu, H.; Zhang, N.; Ran, W.; Cao, J. Impacts of primary emissions and secondary aerosol formation on air pollution in an urban area of China during the COVID-19 lockdown. Environ. Int. 2021, 150, 106426. [Google Scholar] [CrossRef]
  52. Le, T.; Wang, Y.; Liu, L.; Yang, J.; Yung, Y.L.; Li, G.; Seinfeld, J.H. Unexpected air pollution with marked emission reductions during the COVID-19 outbreak in China. Science 2020, 369, 702–706. [Google Scholar] [CrossRef]
  53. Chu, B.; Zhang, S.; Liu, J.; Ma, Q.; He, H. Significant concurrent decrease in PM2.5 and NO2 concentrations in China during COVID-19 epidemic. J. Environ. Sci. 2021, 99, 346–353. [Google Scholar] [CrossRef]
  54. Wang, Y.; Yuan, Y.; Wang, Q.; Liu, C.; Zhi, Q.; Cao, J. Changes in air quality related to the control of coronavirus in China: Implications for traffic and industrial emissions. Sci. Total Environ. 2020, 731, 139133. [Google Scholar] [CrossRef]
  55. Wang, X.; Zhang, R. How Does Air Pollution Change during COVID-19 Outbreak in China? Bull. Am. Meteorol. Soc. 2020, 101, E1645–E1652. [Google Scholar] [CrossRef]
  56. Zhao, N.; Wang, G.; Li, G.; Lang, J.; Zhang, H. Air pollution episodes during the COVID-19 outbreak in the Beijing–Tianjin–Hebei region of China: An insight into the transport pathways and source distribution. Environ. Pollut. 2020, 267, 115617. [Google Scholar] [CrossRef] [PubMed]
  57. Li, M.; Wang, T.; Xie, M.; Li, S.; Zhuang, B.; Fu, Q.; Zhao, M.; Wu, H.; Liu, J.; Saikawa, E.; et al. Drivers for the poor air quality conditions in North China Plain during the COVID-19 outbreak. Atmos. Environ. 2021, 246, 118103. [Google Scholar] [CrossRef] [PubMed]
  58. He, J.; Gong, S.; Yu, Y.; Yu, L.; Wu, L.; Mao, H.; Song, C.; Zhao, S.; Liu, H.; Li, X.; et al. Air pollution characteristics and their relation to meteorological conditions during 2014–2015 in major Chinese cities. Environ. Pollut. 2017, 223, 484–496. [Google Scholar] [CrossRef]
  59. Li, M.; Zhang, Q.; Streets, D.; He, K.; Cheng, Y.; Emmons, L.; Huo, H.; Kang, S.C.; Lu, Z.; Shao, M.; et al. Mapping Asian anthropogenic emissions of non-methane volatile organic compounds to multiple chemical mechanisms. Atmos. Chem. Phys. 2014, 14, 5617–5638. [Google Scholar] [CrossRef] [Green Version]
  60. Li, M.; Liu, H.; Geng, G.; Hong, C.; Liu, F.; Song, Y.; Tong, D.; Zheng, B.; Cui, H.; Man, H.; et al. Anthropogenic emission inventories in China:a review. Natl. Sci. Rev. 2017, 4, 834–866. [Google Scholar] [CrossRef]
  61. Li, M.; Zhang, Q.; Kurokawa, J.-I.; Woo, J.-H.; He, K.; Lu, Z.; Ohara, T.; Song, Y.; Streets, D.G.; Carmichael, G.R.; et al. MIX: A mosaic Asian anthropogenic emission inventory under the international collaboration framework of the MICS-Asia and HTAP. Atmos. Chem. Phys. 2017, 17, 935–963. [Google Scholar] [CrossRef] [Green Version]
  62. Lai, H.K.; Kendall, M.; Ferrier, H.; Lindup, I.; Alm, S.; Hänninen, O.; Jantunen, M.; Mathys, P.; Colvile, R.; Ashmore, M.; et al. Personal exposures and microenvironment concentrations of PM2.5, VOC, NO2 and CO in Oxford, UK. Atmos. Environ. 2004, 38, 6399–6410. [Google Scholar] [CrossRef]
  63. Northcross, A.; Chowdhury, Z.; McCracken, J.; Canuz, E.; Smith, K. Estimating personal PM2.5 exposures using CO measurements in Guatemalan households cooking with wood fuel. J. Environ. Monit. 2010, 12, 873–878. [Google Scholar] [CrossRef]
  64. Bari, A.; Dutkiewicz, V.; Judd, C.; Wilson, L.; Luttinger, D.; Husain, L. Regional sources of particulate sulfate, SO2, PM2.5, HCl, and HNO3, in New York, NY. Atmos. Environ. 2003, 37, 2837–2844. [Google Scholar] [CrossRef]
  65. Song, H.; Zhang, Y.; Luo, M.; Gu, J.; Wu, M.; Xu, D.; Xu, G.; Ma, L. Seasonal variation, sources and health risk assessment of polycyclic aromatic hydrocarbons in different particle fractions of PM2.5 in Beijing, China. Atmos. Pollut. Res. 2019, 10, 105–114. [Google Scholar] [CrossRef]
  66. de Gouw, J.A.; Welsh-Bon, D.; Warneke, C.; Kuster, W.C.; Alexander, L.; Baker, A.K.; Beyersdorf, A.J.; Blake, D.R.; Canagaratna, M.; Celada, A.T.; et al. Emission and chemistry of organic carbon in the gas and aerosol phase at a sub-urban site near Mexico City in March 2006 during the MILAGRO study. Atmos. Chem. Phys. 2009, 9, 3425–3442. [Google Scholar] [CrossRef] [Green Version]
  67. Wang, H.; Gong, S.; Zhang, H.; Chen, Y.; Shen, X.; Chen, D.; Xue, J.; Shen, Y.; Wu, X.; Jin, Z. A new-generation sand and dust storm forecasting system GRAPES_CUACE/Dust: Model development, verification and numerical simulation. Chin. Sci. Bull. 2010, 55, 635–649. [Google Scholar] [CrossRef]
  68. Gong, S.; Zhang, X. CUACE/Dust–an integrated system of observation and modeling systems for operational dust forecasting in Asia. Atmos. Chem. Phys. 2008, 8, 2333–2340. [Google Scholar] [CrossRef] [Green Version]
  69. An, X.Q.; Zhai, S.X.; Jin, M.; Gong, S.; Wang, Y. Development of an adjoint model of GRAPES–CUACE and its application in tracking influential haze source areas in north China. Geosci. Model Dev. 2016, 9, 2153–2165. [Google Scholar] [CrossRef]
  70. Chen, D. Recent Progress on GRAPES Research and Application. J. Appl. Meteorol. Sci. 2006, 17, 773–777. [Google Scholar]
  71. Chen, D.H.; Xue, J.; Yang, X.; Zhang, H.; Shen, X.; Hu, J.; Wang, Y.; Ji, L.; Chen, J. New generation of multi-scale NWP system (GRAPES): General scientific design. Chin. Sci. Bull. 2008, 53, 3433–3445. [Google Scholar] [CrossRef] [Green Version]
  72. Zhang, R.H.; Shen, X. On the development of the GRAPES—A new generation of the national operational NWP system in China. Chin. Sci. Bull. 2008, 53, 3429–3432. [Google Scholar] [CrossRef] [Green Version]
  73. Jiang, C.; Wang, H.; Zhao, T.; Li, T.; Che, H. Modeling study of PM2.5 pollutant transport across cities in China’s Jing–Jin–Ji region during a severe haze episode in December 2013. Atmos. Chem. Phys. 2015, 15, 5803–5814. [Google Scholar] [CrossRef] [Green Version]
  74. Wang, H.; Shi, G.Y.; Zhang, X.Y.; Gong, S.L.; Tan, S.C.; Chen, B.; Che, H.Z.; Li, T. Mesoscale modelling study of the interactions between aerosols and PBL meteorology during a haze episode in China Jing–Jin–Ji and its near surrounding region–Part 2: Aerosols’ radiative feedback effects. Atmos. Chem. Phys. 2015, 15, 3277–3287. [Google Scholar] [CrossRef] [Green Version]
  75. Wang, H.; Xue, M.; Zhang, X.Y.; Liu, H.L.; Zhou, C.H.; Tan, S.C.; Che, H.Z.; Chen, B.; Li, T. Mesoscale modeling study of the interactions between aerosols and PBL meteorology during a haze episode in Jing–Jin–Ji (China) and its nearby surrounding region–Part 1: Aerosol distributions and meteorological features. Atmos. Chem. Phys. 2015, 15, 3257–3275. [Google Scholar] [CrossRef] [Green Version]
  76. Zhang, W.; Wang, H.; Zhang, X.; Peng, Y.; Zhong, J.; Wang, Y.; Zhao, Y. Evaluating the contributions of changed meteorological conditions and emission to substantial reductions of PM2.5 concentration from winter 2016 to 2017 in Central and Eastern China. Sci. Total Environ. 2020, 716, 136892. [Google Scholar] [CrossRef] [PubMed]
  77. Chen, F.; Dudhia, J. Coupling an advanced land surface–hydrology model with the Penn State–NCAR MM5 modeling system. Part I: Model implementation and sensitivity. Mon. Weather. Rev. 2001, 129, 569–585. [Google Scholar] [CrossRef] [Green Version]
  78. Hong, S.-Y.; Lim, J.-O.J. The WRF single-moment 6-class microphysics scheme (WSM6). Asia-Pac. J. Atmos. Sci. 2006, 42, 129–151. [Google Scholar]
  79. Mlawer, E.J.; Taubman, S.J.; Brown, P.D.; Iacono, M.J.; Clough, S.A. Radiative transfer for inhomogeneous atmospheres: RRTM, a validated correlated-k model for the longwave. J. Geophys. Res. Atmos. 1997, 102, 16663–16682. [Google Scholar] [CrossRef] [Green Version]
  80. Chou, M.-D.; Suarez, M.J.; Ho, C.-H.; Yan, M.M.H.; Lee, K.-T. Parameterizations for Cloud Overlapping and Shortwave Single-Scattering Properties for Use in General Circulation and Cloud Ensemble Models. J. Clim. 1998, 11, 202–214. [Google Scholar] [CrossRef]
  81. Chen, F.; Janjić, Z.; Mitchell, K. Impact of Atmospheric Surface-layer Parameterizations in the new Land-surface Scheme of the NCEP Mesoscale Eta Model. Bound. Layer Meteorol. 1997, 85, 391–421. [Google Scholar] [CrossRef]
  82. Hong, S.-Y.; Pan, H.-L. Nonlocal Boundary Layer Vertical Diffusion in a Medium-Range Forecast Model. Mon. Weather. Rev. 1996, 124, 2322–2339. [Google Scholar] [CrossRef] [Green Version]
  83. Stockwell, W.R.; Middleton, P.; Chang, J.S.; Tang, X. The second generation regional acid deposition model chemical mechanism for regional air quality modeling. J. Geophys. Res. Atmos. 1990, 95, 16343–16367. [Google Scholar] [CrossRef]
  84. Zhou, C.-H.; Gong, S.; Zhang, X.-Y.; Liu, H.-L.; Xue, M.; Cao, G.-L.; An, X.-Q.; Che, H.; Zhang, Y.-M.; Niu, T. Towards the improvements of simulating the chemical and optical properties of Chinese aerosols using an online coupled model–CUACE/Aero. Tellus B Chem. Phys. Meteorol. 2012, 64, 18965. [Google Scholar] [CrossRef] [Green Version]
  85. Zhang, X.Y.; Wang, Y.Q.; Lin, W.L.; Zhang, Y.M.; Zhang, X.C.; Gong, S.; Zhao, P.; Yang, Y.Q.; Wang, J.Z.; Hou, Q.; et al. Changes of Atmospheric Composition and Optical Properties Over Beijing—2008 Olympic Monitoring Campaign. Bull. Am. Meteorol. Soc. 2009, 90, 1633–1652. [Google Scholar] [CrossRef] [Green Version]
  86. Zhao, B.; Wang, S.; Wang, J.; Fu, J.S.; Liu, T.; Xu, J.; Fu, X.; Hao, J. Impact of national NOx and SO2 control policies on particulate matter pollution in China. Atmos. Environ. 2013, 77, 453–463. [Google Scholar] [CrossRef]
  87. Wang, G.; Zhang, R.; Gomez, M.E.; Yang, L.; Levy, Z.M.; Hu, M.; Lin, Y.; Peng, J.; Guo, S.; Meng, J.; et al. Persistent sulfate formation from London Fog to Chinese haze. Proc. Natl. Acad. Sci. USA 2016, 48, 13630–13635. [Google Scholar] [CrossRef] [Green Version]
  88. Aneja, V.P.; Agarwal, A.; Roelle, P.A.; Phillips, S.B.; Tong, Q.; Watkins, N.; Yablonsky, R. Measurements and analysis of criteria pollutants in New Delhi, India. Environ. Int. 2001, 27, 35–42. [Google Scholar] [CrossRef]
  89. Song, C.; Wu, L.; Xie, Y.; He, J.; Chen, X.; Wang, T.; Lin, Y.; Jin, T.; Wang, A.; Liu, Y.; et al. Air pollution in China: Status and spatiotemporal variations. Environ. Pollut. 2017, 227, 334–347. [Google Scholar] [CrossRef] [PubMed]
  90. Shah, V.; Jaeglé, L.; Thornton, J.A.; Lopez-Hilfiker, F.D.; Lee, B.H.; Schroder, J.C.; Campuzano-Jost, P.; Jimenez, J.L.; Guo, H.; Sullivan, A.P.; et al. Chemical feedbacks weaken the wintertime response of particulate sulfate and nitrate to emissions reductions over the eastern United States. Proc. Natl. Acad. Sci. USA 2018, 115, 8110. [Google Scholar] [CrossRef] [PubMed] [Green Version]
  91. Buchholz, S.; Junk, J.; Krein, A.; Heinemann, G.; Hoffmann, L. Air pollution characteristics associated with mesoscale atmospheric patterns in northwest continental Europe. Atmos. Environ. 2010, 44, 5183–5190. [Google Scholar] [CrossRef]
  92. Liu, Z.; Wang, H.; Shen, X.; Peng, Y.; Shi, Y.; Che, H.; Wang, G. Contribution of Meteorological Conditions to the Variation in Winter PM2.5 Concentrations from 2013 to 2019 in Middle-Eastern China. Atmosphere 2019, 10, 563. [Google Scholar] [CrossRef] [Green Version]
  93. Zhong, J.; Zhang, X.; Wang, Y. Relatively weak meteorological feedback effect on PM2.5 mass change in Winter 2017/18 in the Beijing area: Observational evidence and machine-learning estimations. Sci. Total Environ. 2019, 664, 140–147. [Google Scholar] [CrossRef]
  94. Cheng, J.; Su, J.; Cui, T.; Li, X.; Dong, X.; Sun, F.; Yang, Y.; Tong, D.; Zheng, Y.; Li, Y.; et al. Dominant role of emission reduction in PM2.5 air quality improvement in Beijing during 2013–2017: A model-based decomposition analysis. Atmos. Chem. Phys. 2019, 19, 6125–6146. [Google Scholar] [CrossRef] [Green Version]
  95. Zhang, Q.; Jiang, X.; Tong, D.; Davis, S.J.; Zhao, H.; Geng, G.; Feng, T.; Zheng, B.; Lu, Z.; Streets, D.G.; et al. Transboundary health impacts of transported global air pollution and international trade. Nature 2017, 543, 705–709. [Google Scholar] [CrossRef] [PubMed] [Green Version]
Figure 1. The four study regions in China including the BTH, the CC, the YRD, and the PRD. The shadow represents the height of the terrain (m).
Atmosphere 13 00222 g001
Figure 2. Distributions of monthly average PM2.5 mass concentration (µg m−3) in China. (a) FMC_2019. (b) FMC_2020. (c) Difference of PM2.5 mass concentration between FMC_2019 and FMC_2020. (d) The histogram of PM2.5 mass concentration in the BTH, the CC, the YRD, and the PRD.
Atmosphere 13 00222 g002
Figure 3. Distributions of monthly average gas pollutants mass concentration (µg m−3 for NO2 and SO2, and mg m−3 for CO) in FMC_2019 and FMC_2020 in China. (a,b) CO. (c,d) NO2. (e,f) SO2.
Atmosphere 13 00222 g003
Figure 4. The linear correlations between CO and PM2.5 mass concentration (µg m−3 for PM2.5 and mg m−3 for CO) in the BTH, the CC, the YRD and the PRD. (ad) FMC_2019. (eh) FMC_2020.
Atmosphere 13 00222 g004
Figure 5. The values of SO2/NO2 (a) and PM2.5/CO (b) in the BTH, the CC, the YRD, and the PRD.
Atmosphere 13 00222 g005
Figure 6. Monthly average geopotential height at 500 hPa and sea-level pressure over Eurasia. (a) FMC_2019; (b) FMC_2020. The white boxes are meridional circulation regions.
Atmosphere 13 00222 g006
Figure 7. The meridional circulation index at 500 and 400 hPa in FMC_2019 and FMC_2020.
Atmosphere 13 00222 g007
Figure 8. The fractional changes of the meteorological factors between FMC_2020 and FMC_2019 in China. (a) PBLH. (b) T900−T1000. (c) RH1000. (d) WS1000.
Atmosphere 13 00222 g008
Figure 9. Simulated monthly average PM2.5 mass concentration (µg m−3) in China. (a) EXP1; (b) EXP2; (c) comparisons of PM2.5 mass concentration between EXP1 and EXP2; (d) the relative contributions of changed emission and meteorological conditions to PM2.5 mass concentration. The green parts and red parts in (d) represent meteorological conditions and emissions.
Atmosphere 13 00222 g009
Table 1. Physical and chemical schemes.
Schemes OptionReferences
Noah land surface(Chen and Dudhia) [77]
WSM6 cloud microphysics(Hong and Lim) [78]
RRTM long-wave radiation(Mlawer et al.) [79]
Goddard short-wave radiation(Chou et al.) [80]
Monin-Obukhov near-ground layer(Chen et al.) [81]
MRF boundary layer(Hong and Pan) [82]
RADM2 gas-phase chemistry(Stockwell et al.) [83]
CUACE aerosol process(Zhou et al.) [84]
Table 2. The descriptions of sensitive experiments.
ExperimentDescription
EXP1Model runs with FMC_2019 meteorology and 2017 emission
EXP2Model runs with FMC_2020 meteorology and 2017 emission
Table 3. Regional monthly average gas pollutants (CO, NO2, SO2) mass concentration in FMC_2019 and FMC_2020.
AreaCO (mg m−3)NO2 (µg m−3)SO2 (µg m−3)
201920202019202020192020
BTH1.161.2637.9029.0120.0416.21
CC1.130.9731.5816.6211.437.91
YRD0.820.7234.5318.248.086.33
PRD0.860.6826.3715.217.115.78
Table 4. The average CO mass and PM2.5 mass concentration during periods associated with similar stable meteorological conditions in FMC_2019 and FMC_2020.
PeriodsMajor Influencing Weather SystemsAverage CO Mass Concentration (mg m−3)Average PM2.5 Mass Concentration (µg m−3)
BTH
28–29 January 2019BTH is controlled by a strong high ridge at 500 hPa and uniform sea level pressure. Then the high ridge moves eastward. 1.6195
1–2 February 2019
9–11 February 20201.5589
19–20 February 2020
CC
27–28 January 2019CC is controlled by zonal westerly airflow at 500 hPa and relatively weaker sea level pressure gradient. 1.2109
17–20 February 2019
1–4 February 20200.9882
YRD
27–28 January 2019YRD is basically controlled by zonal westerly airflow at 500 hPa and relatively weaker sea level pressure gradient. 0.8353
16–17 February 2019
1–4 February 20200.7136
PRD
28 January 2019–1 February 2019PRD is controlled by a weak high ridge with continuous movement to eastward at 500 hPa. The relatively weaker sea level pressure gradient influences PRD. 0.8449
10–12 February 20200.7639
Table 5. The fractional changes of PBLH, T900−T1000, RH1000, and WS1000.
AreaPBLHT900−T1000RH1000WS1000
BTH−24%13%53%−4%
CC4%−22%8%−7%
YRD−8%−17%2%−26%
PRD8%−20%3%18%
Publisher’s Note: MDPI stays neutral with regard to jurisdictional claims in published maps and institutional affiliations.

