
What Made the Sustained Intensification of Tropical Cyclone Fani in the Bay of Bengal? An Investigation Using Coupled Atmosphere–Ocean Model


Abstract
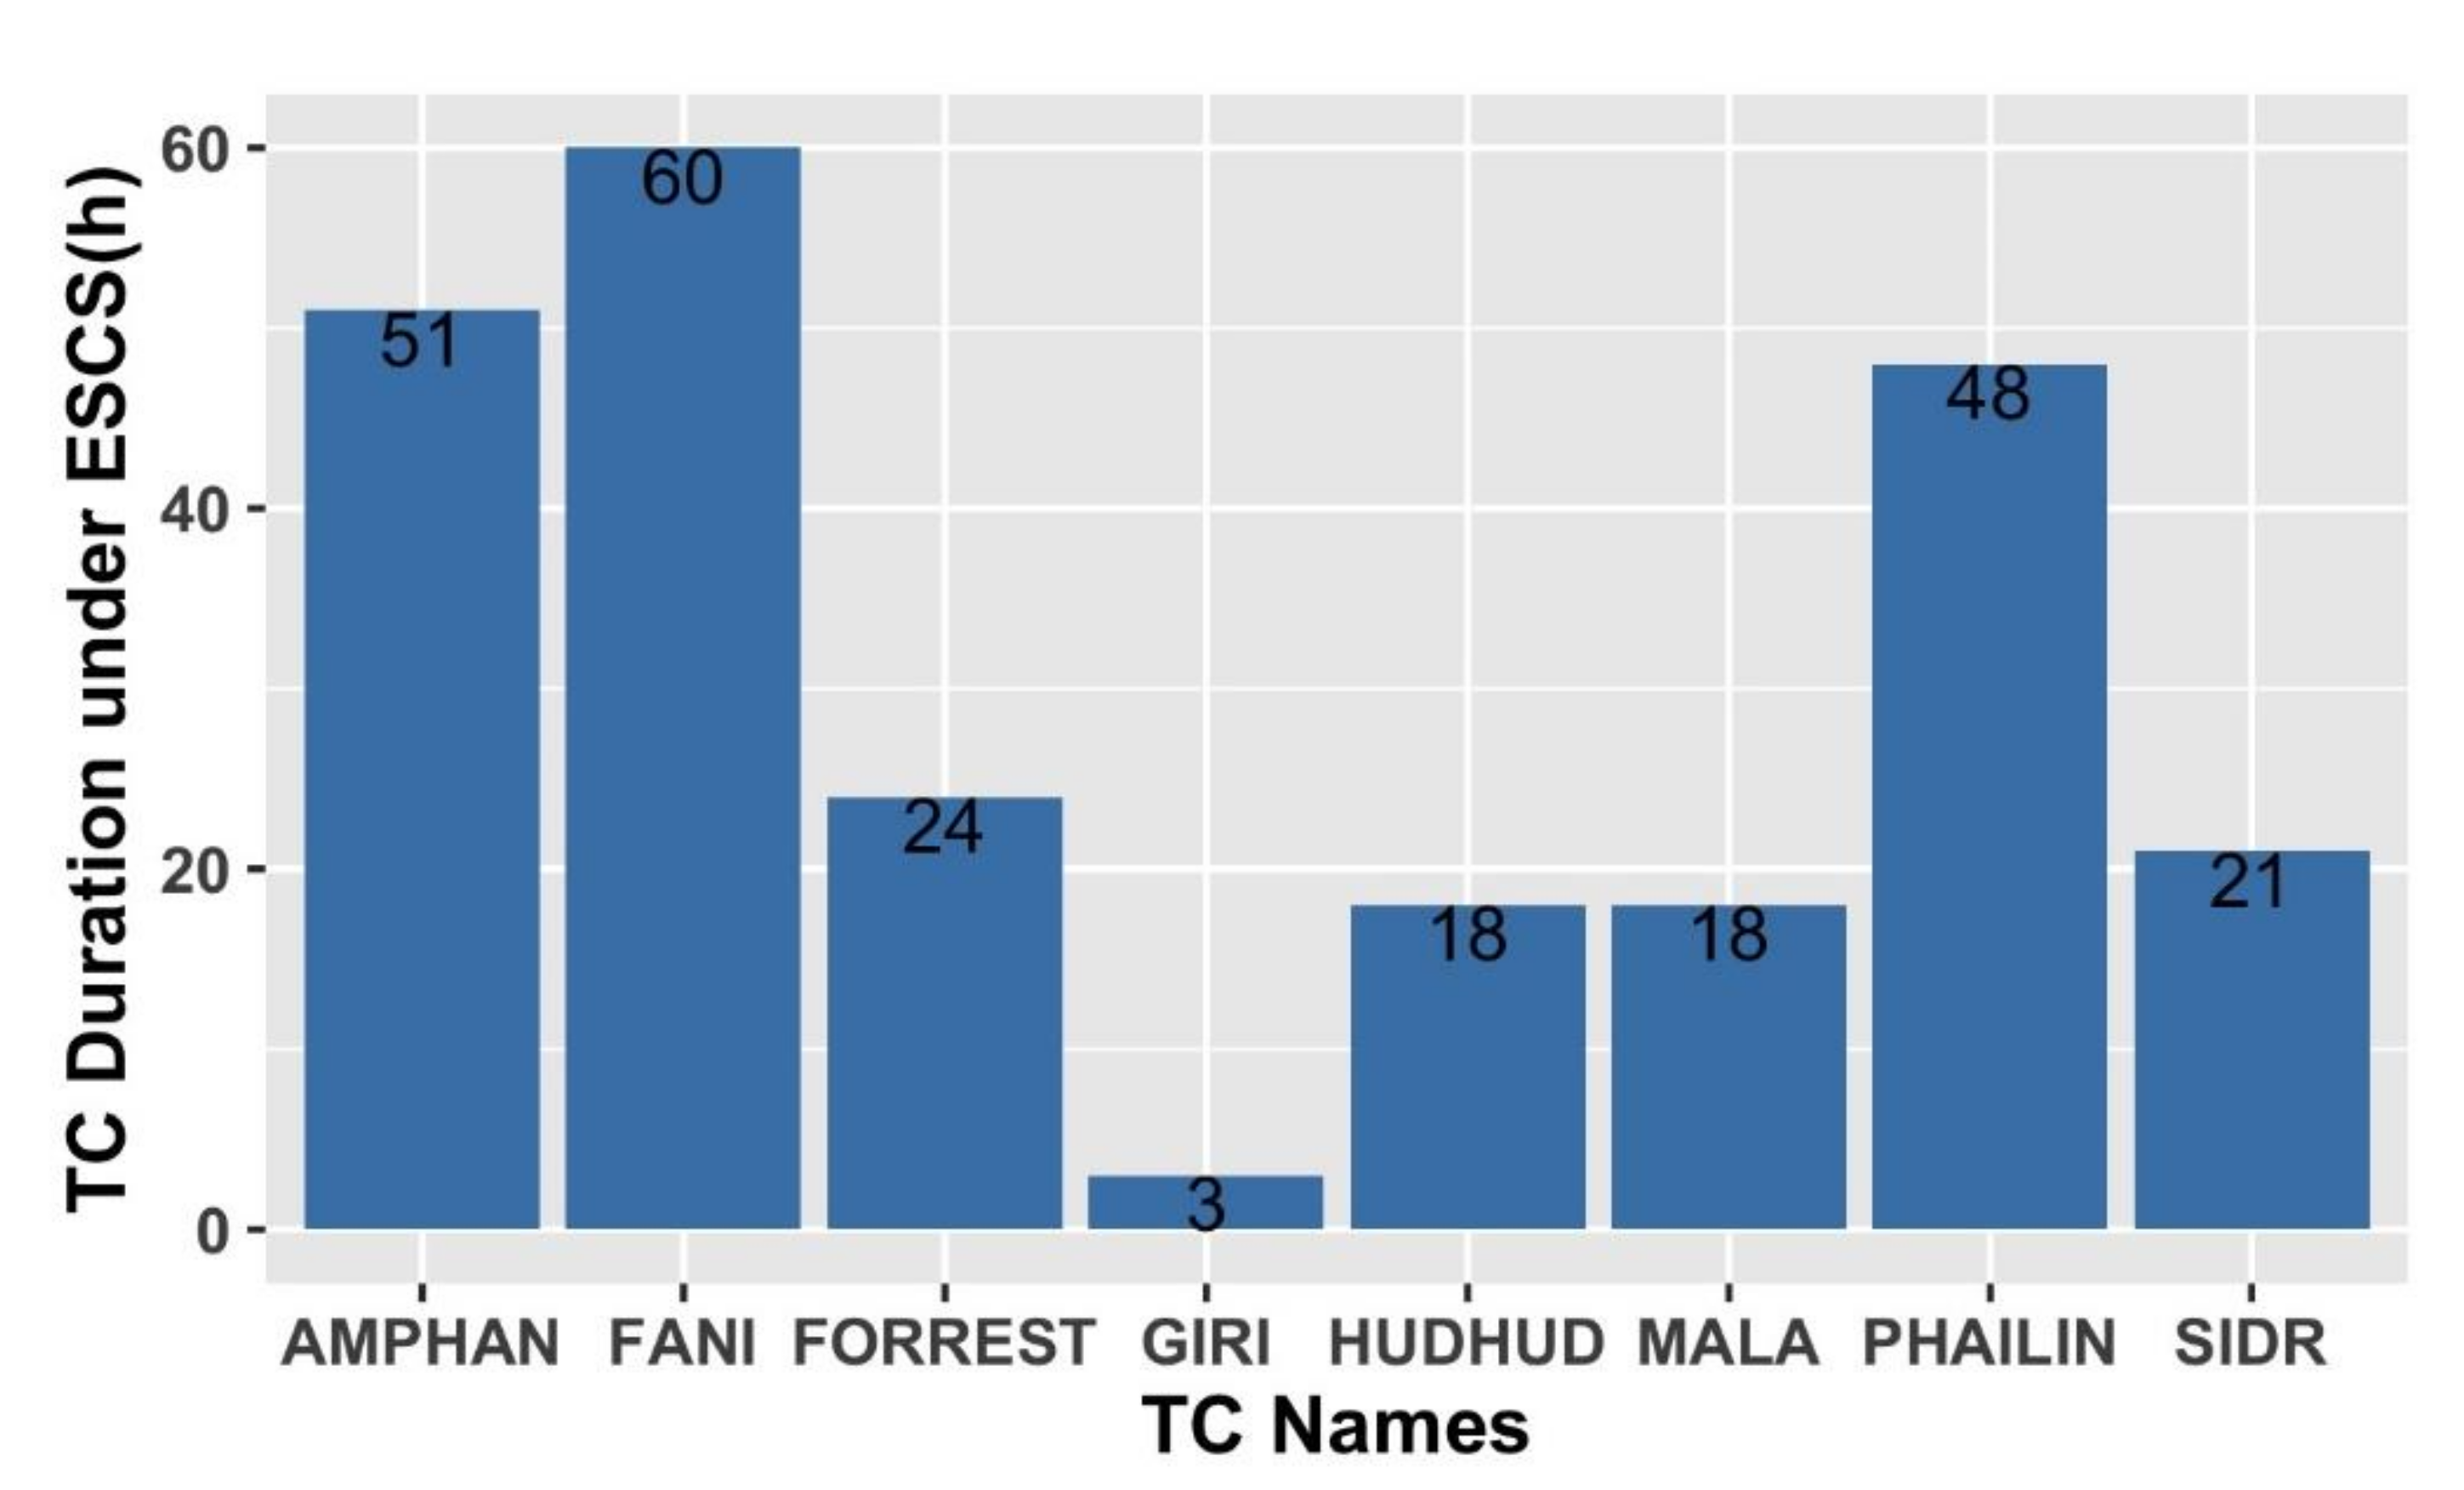
:1. Introduction
2. Data and Methodology
Model Details and Configuration
3. Results and Discussion
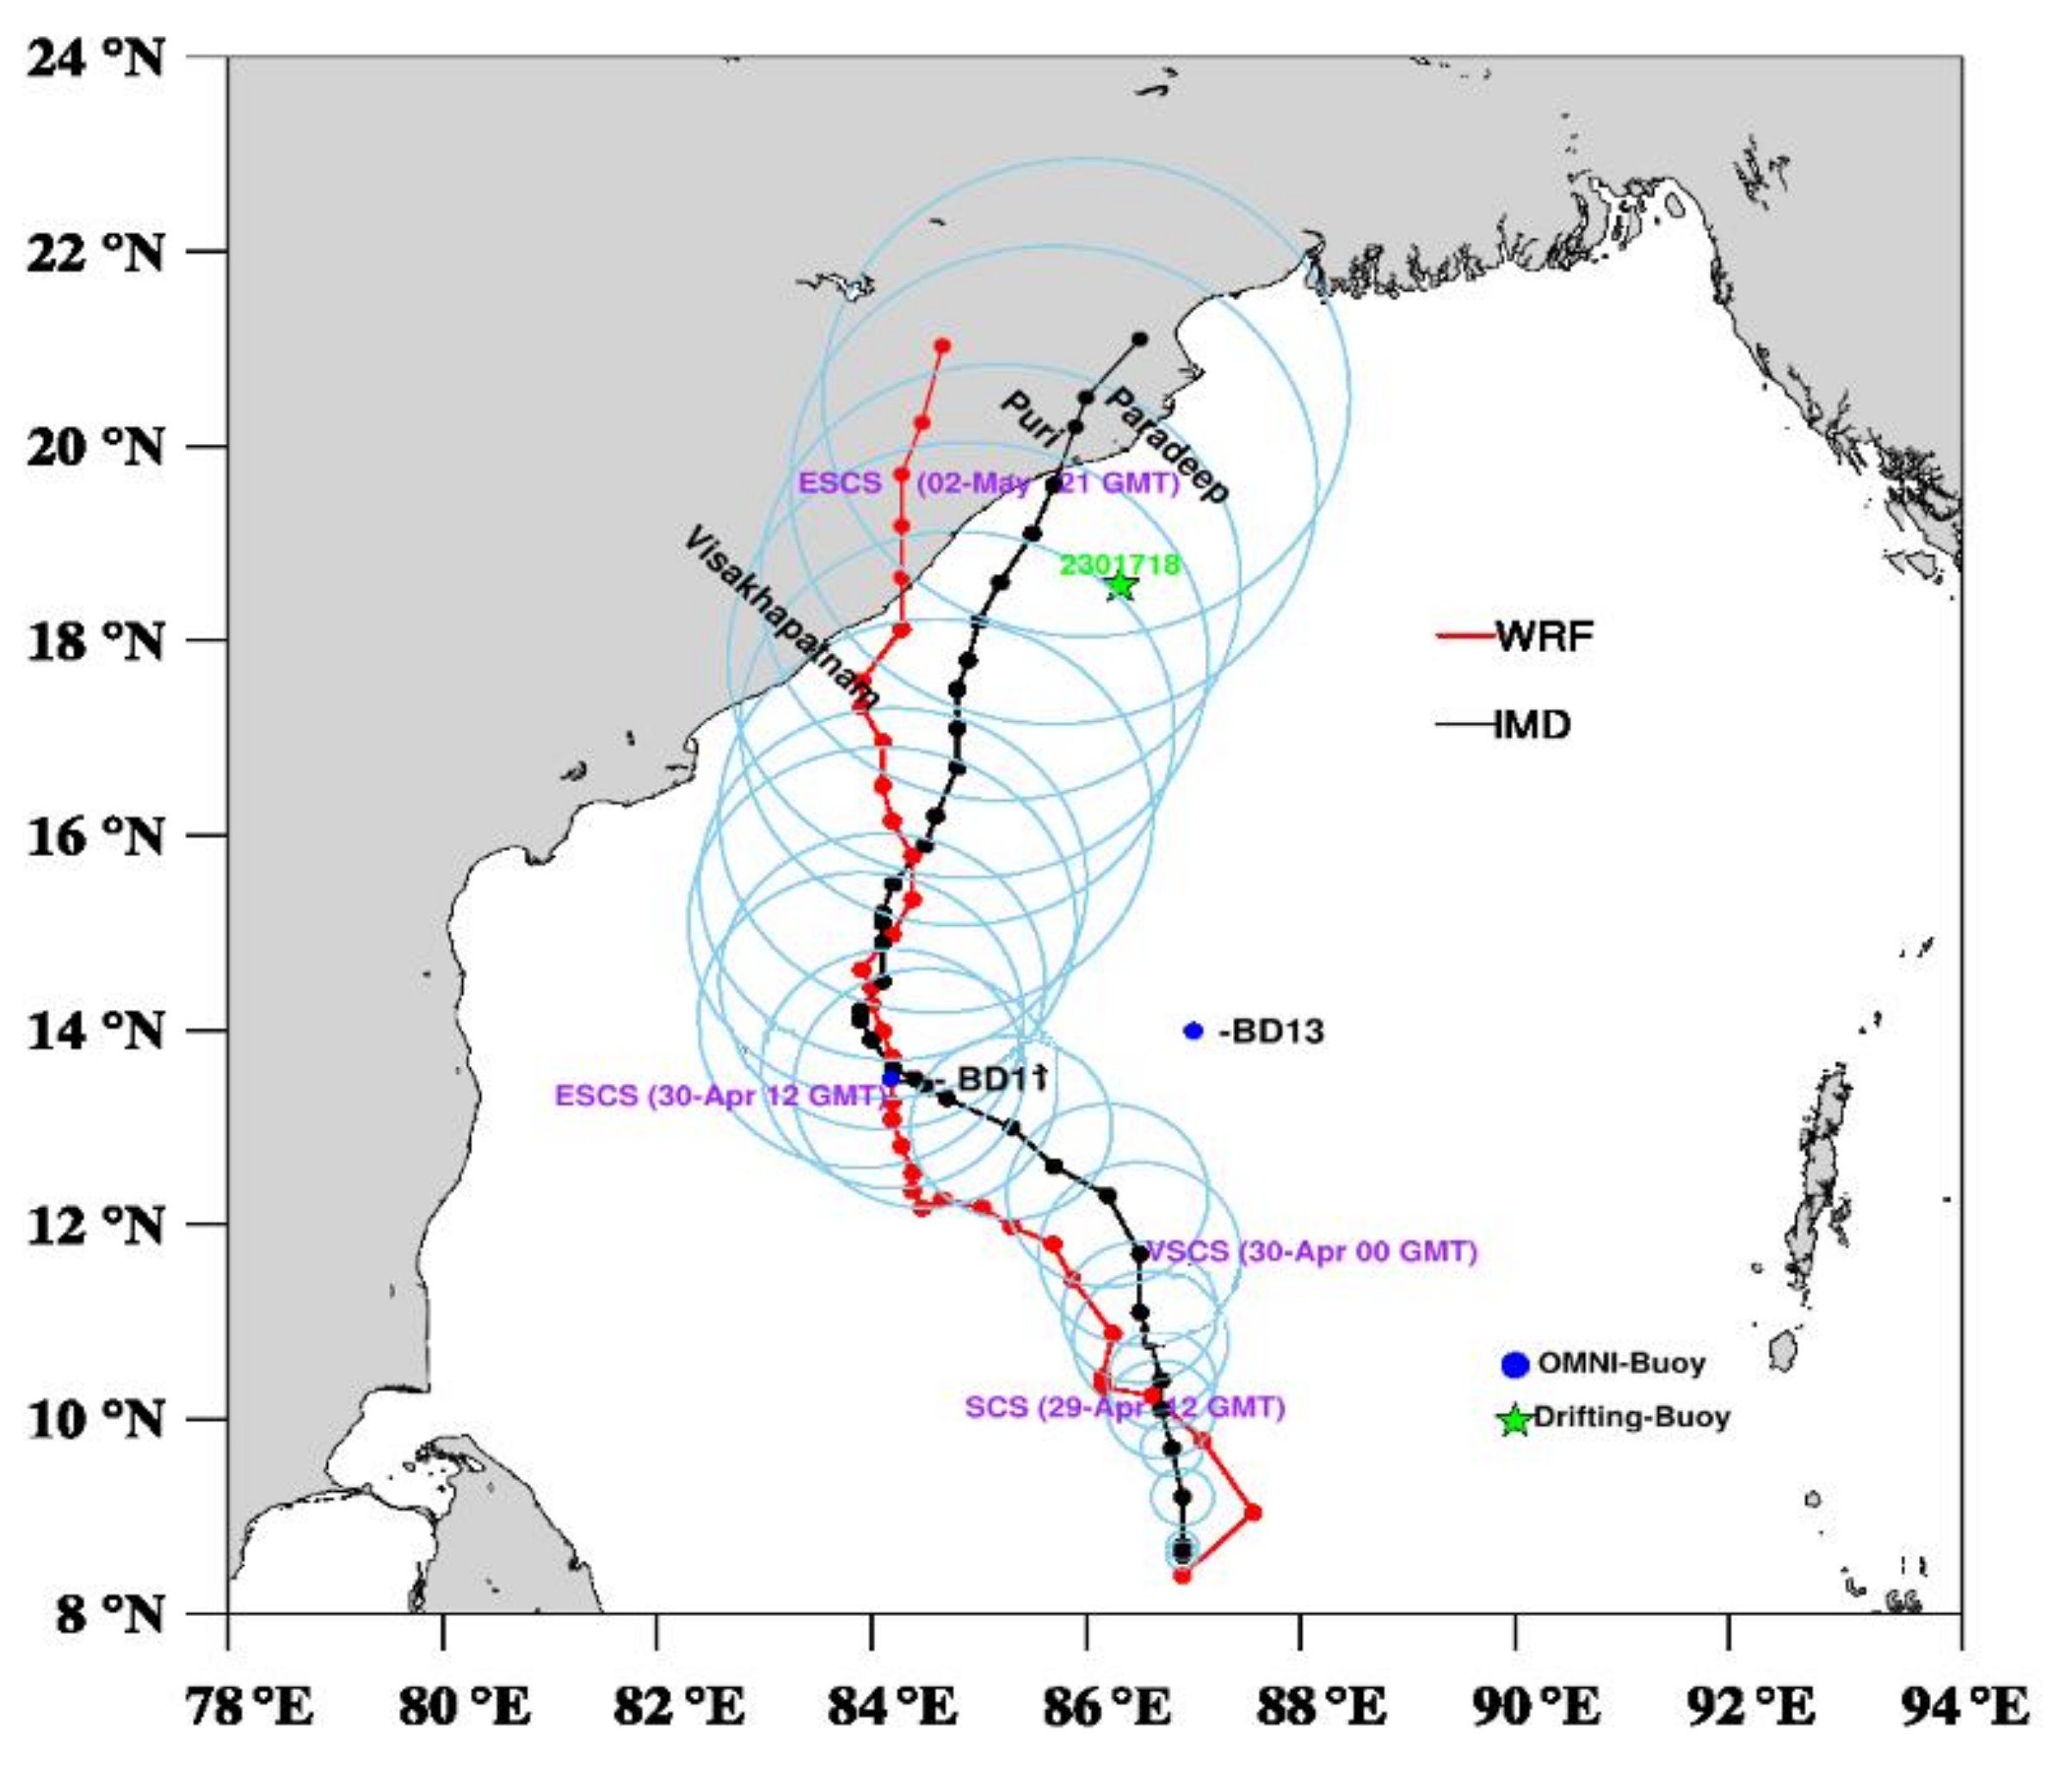
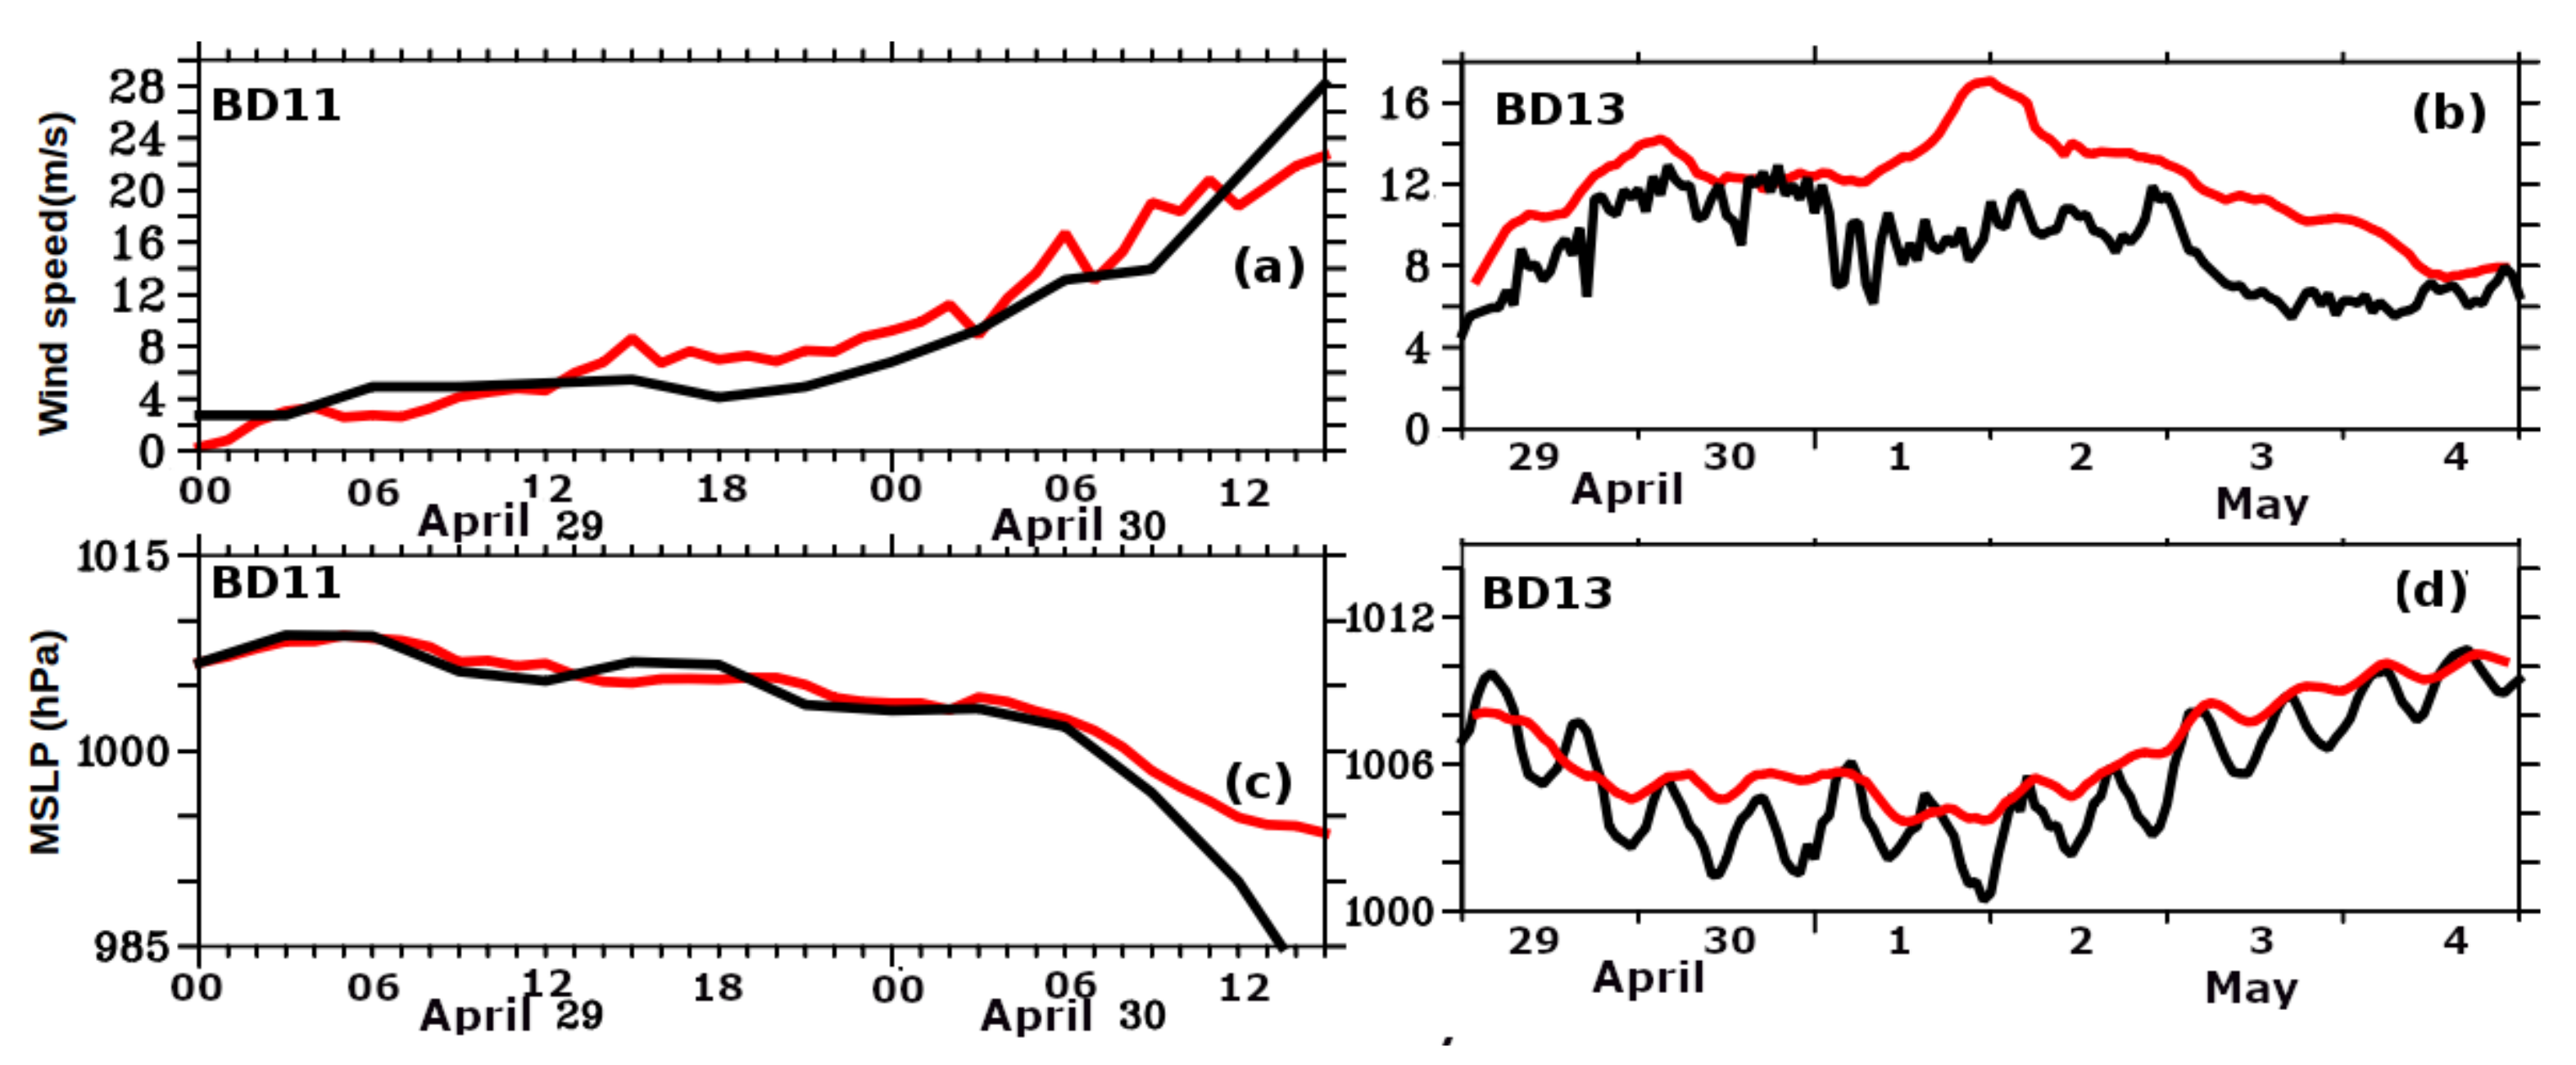
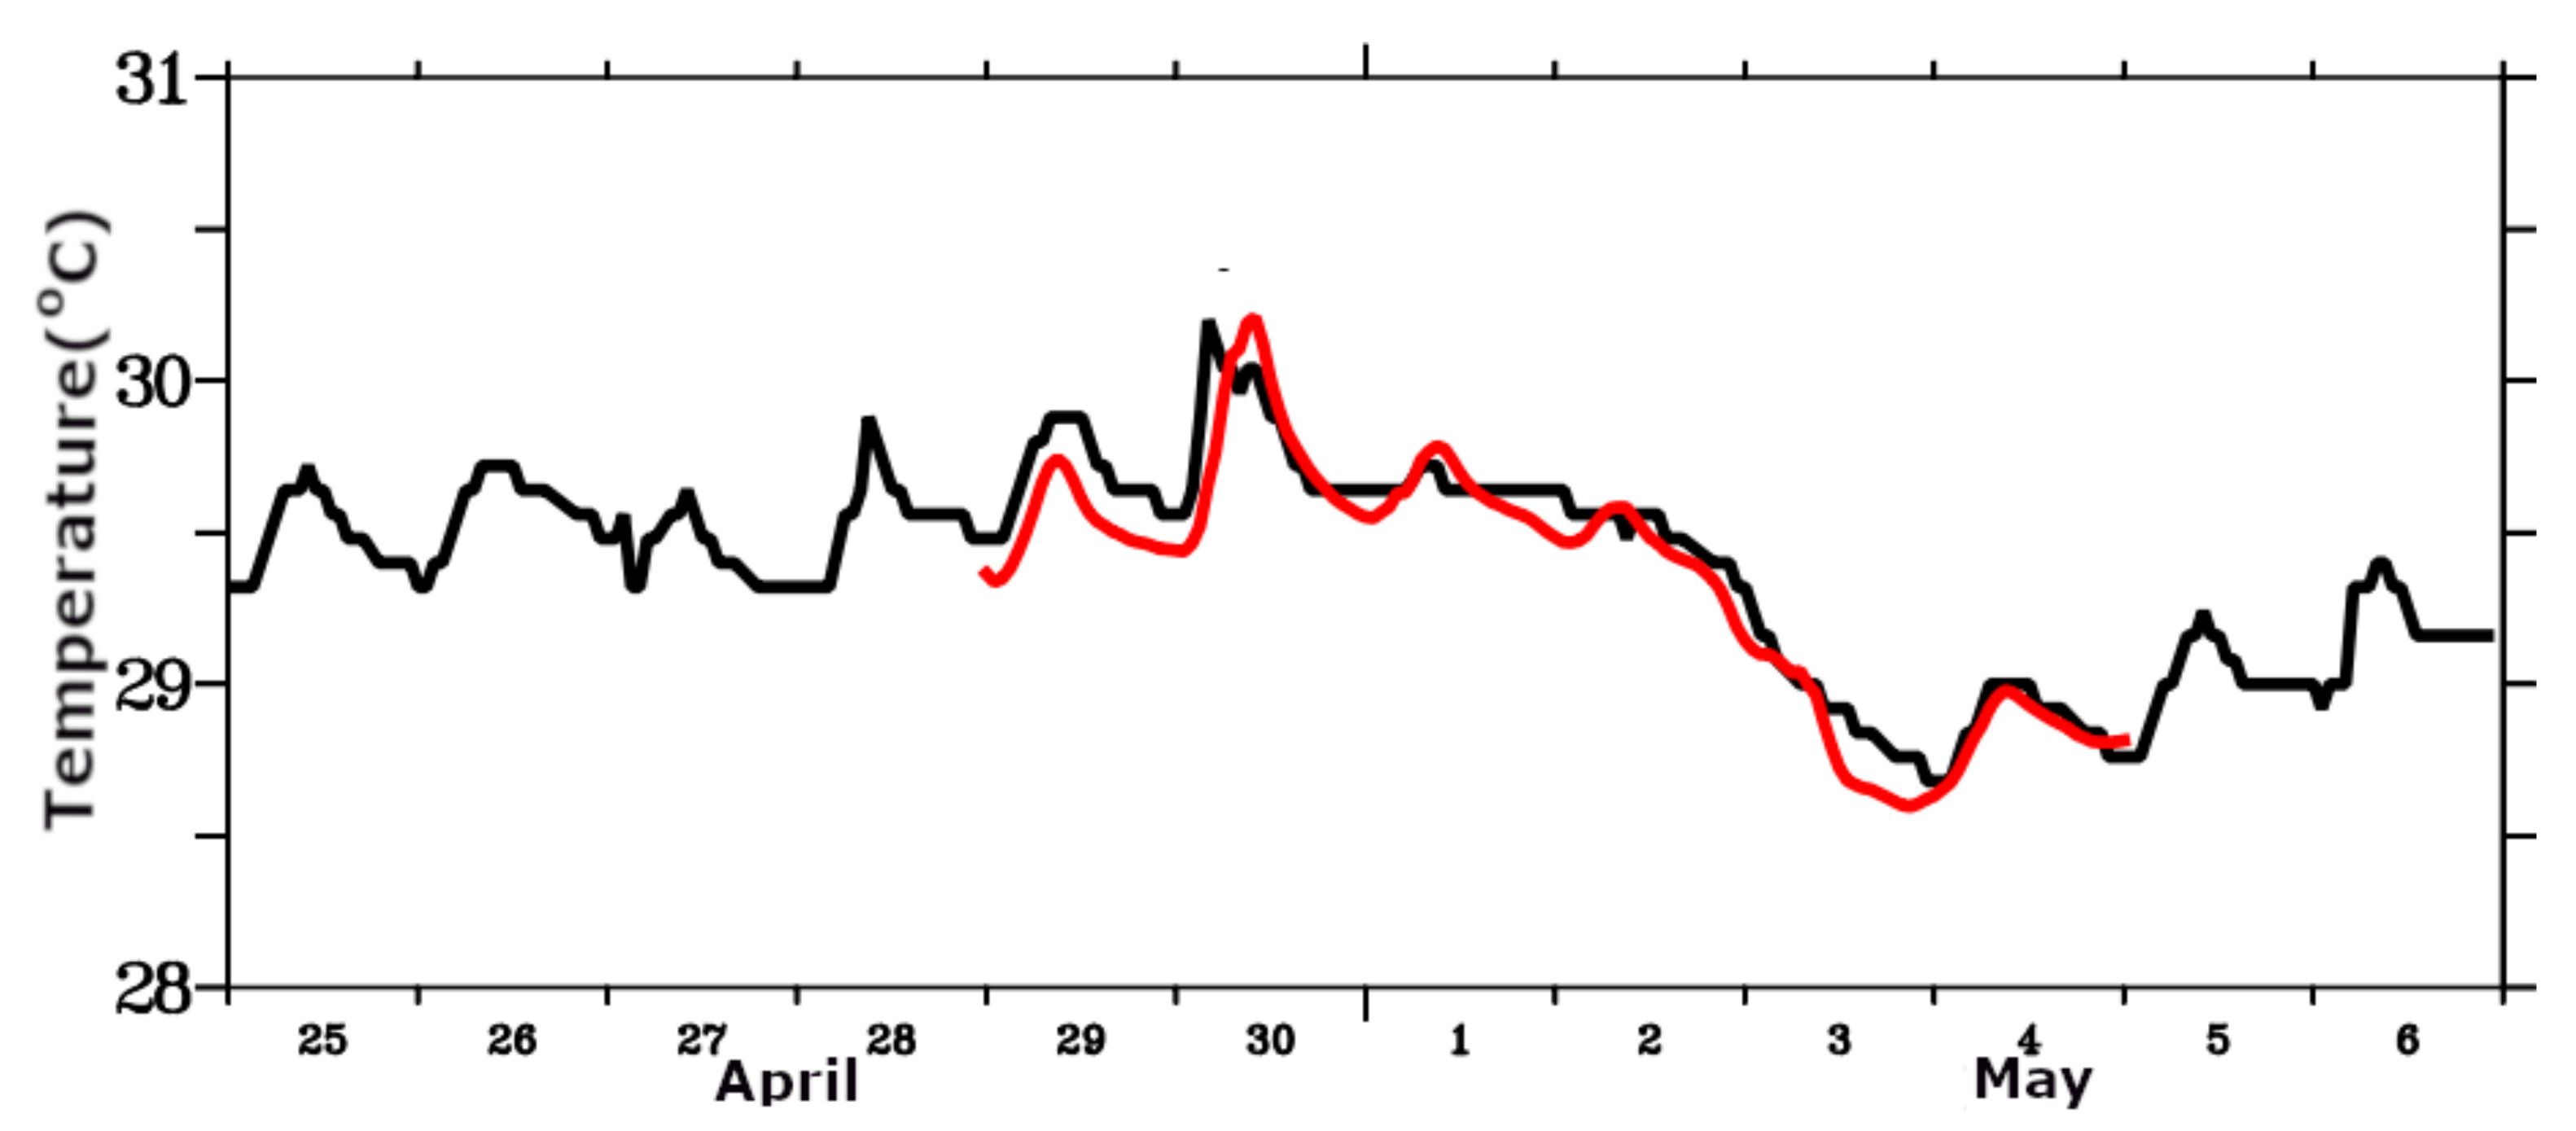
3.1. Track and Intensity Simulation of TC Fani
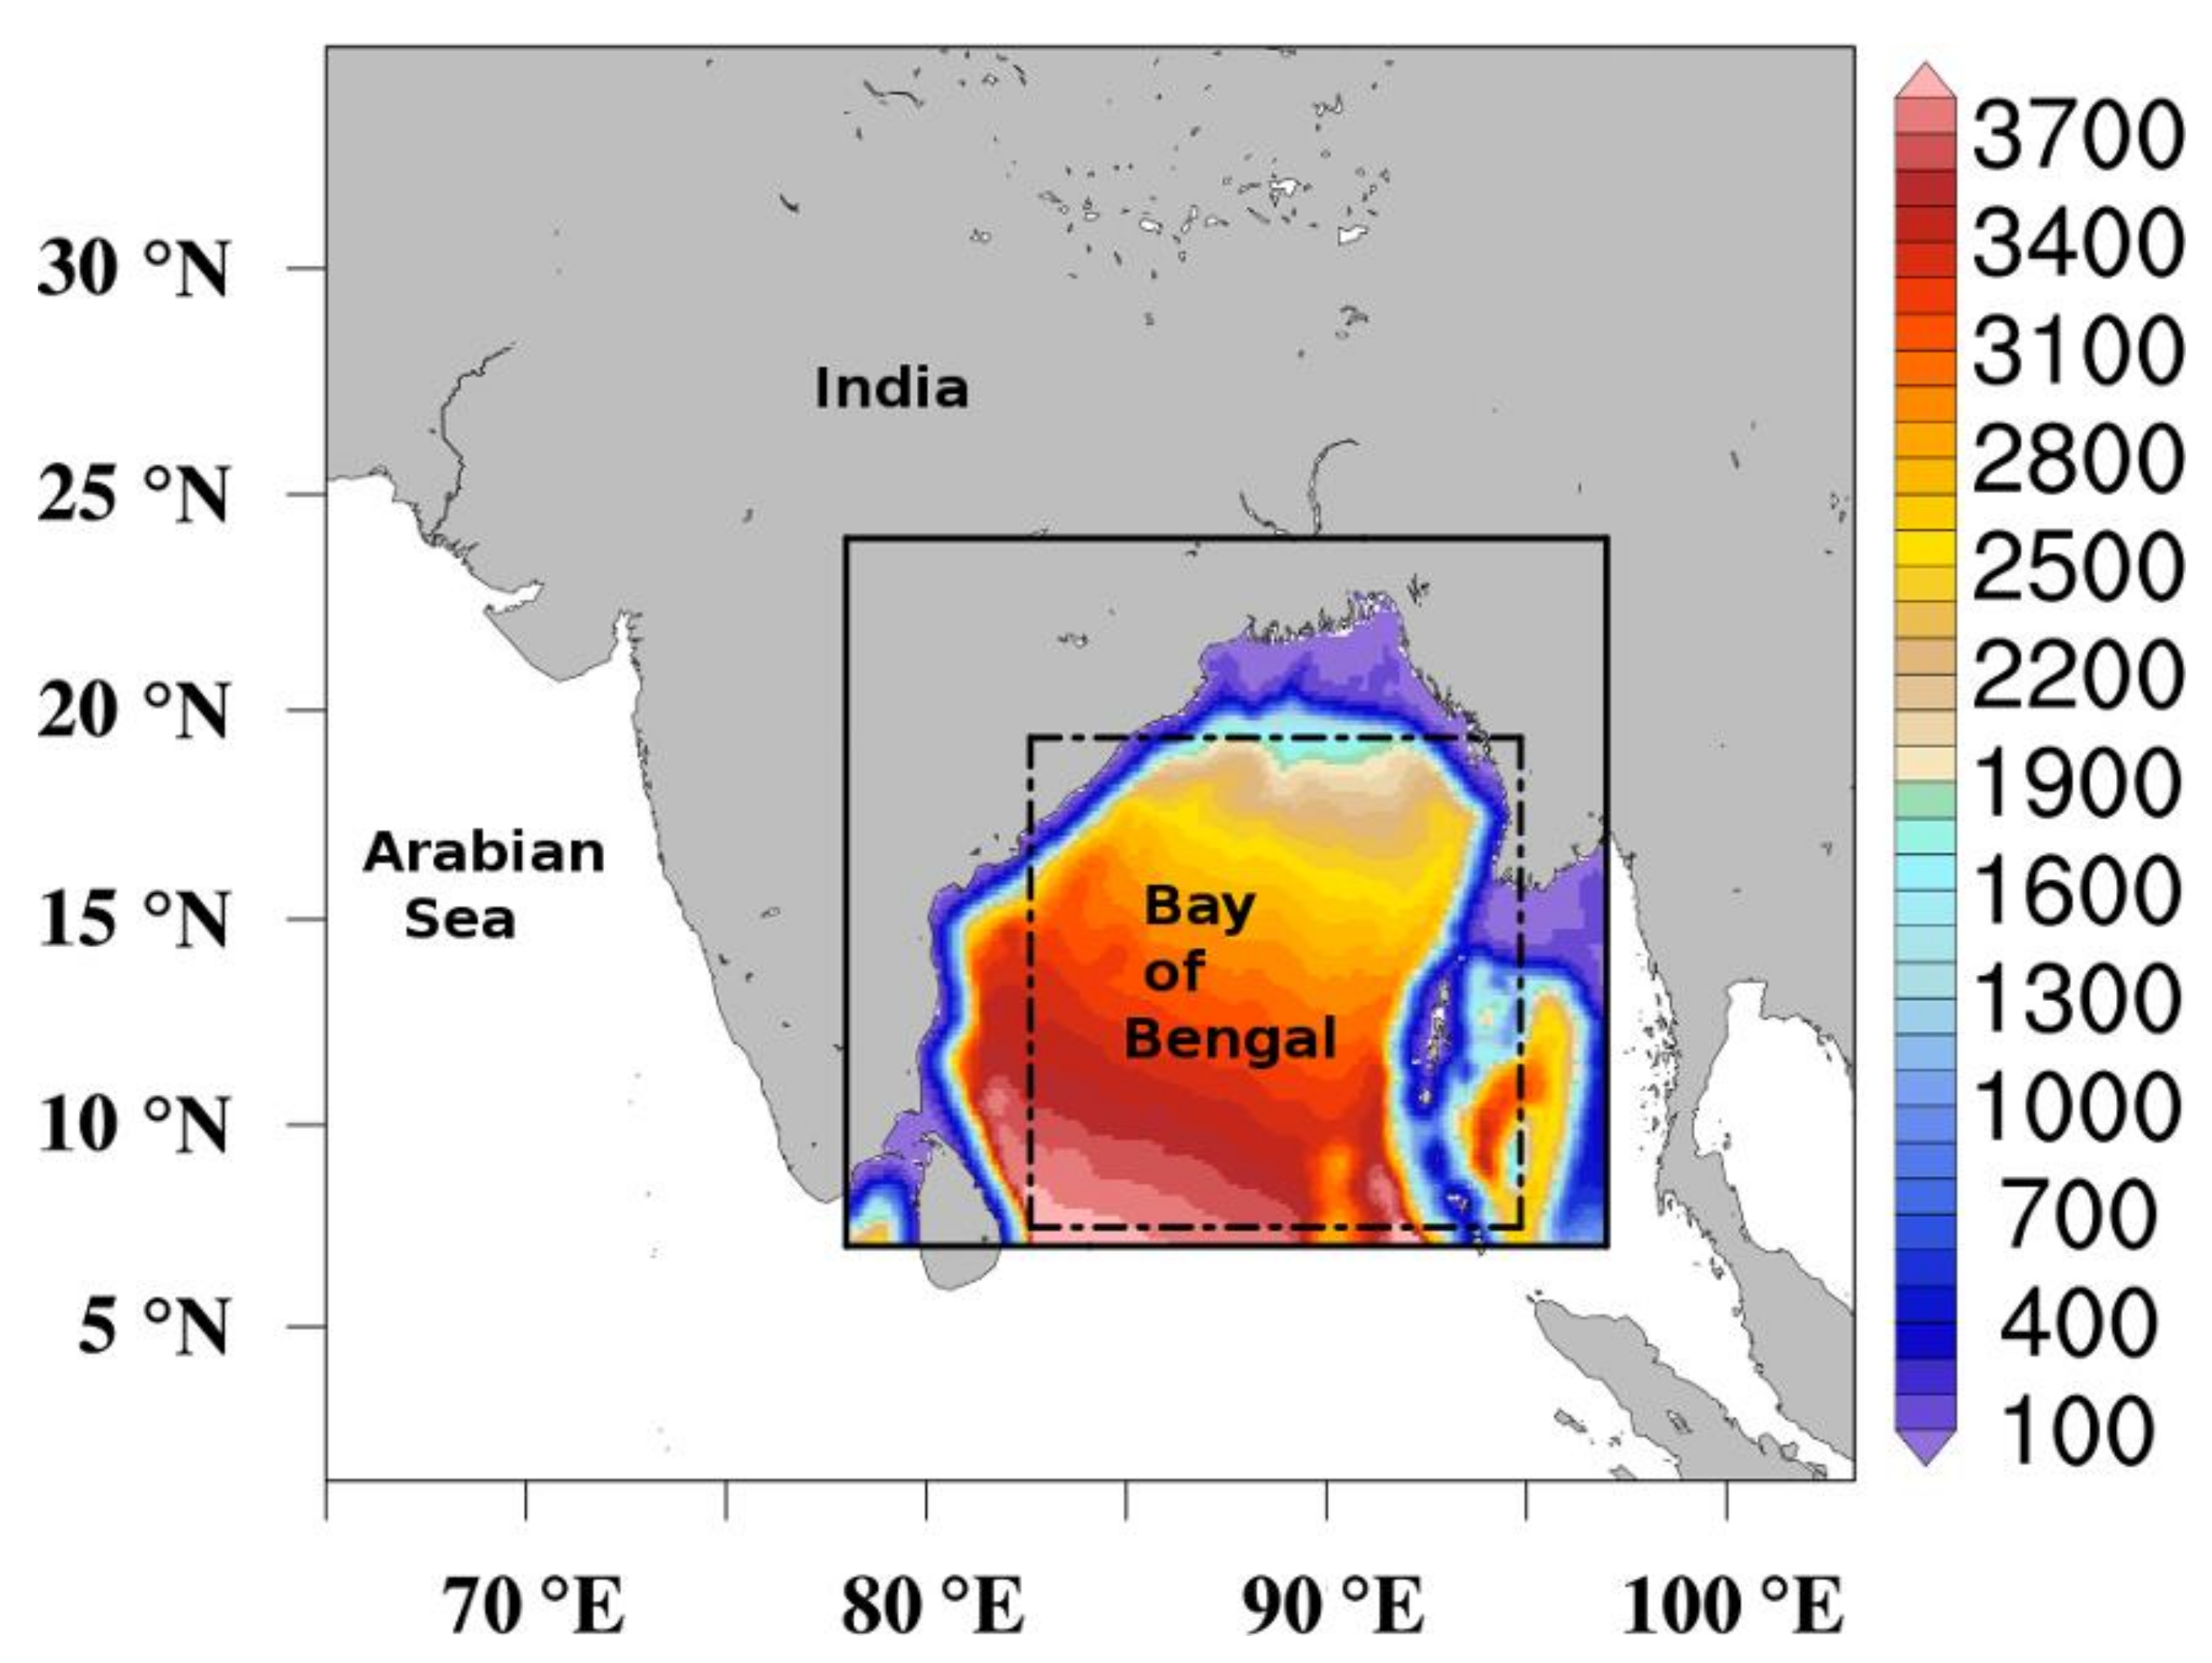
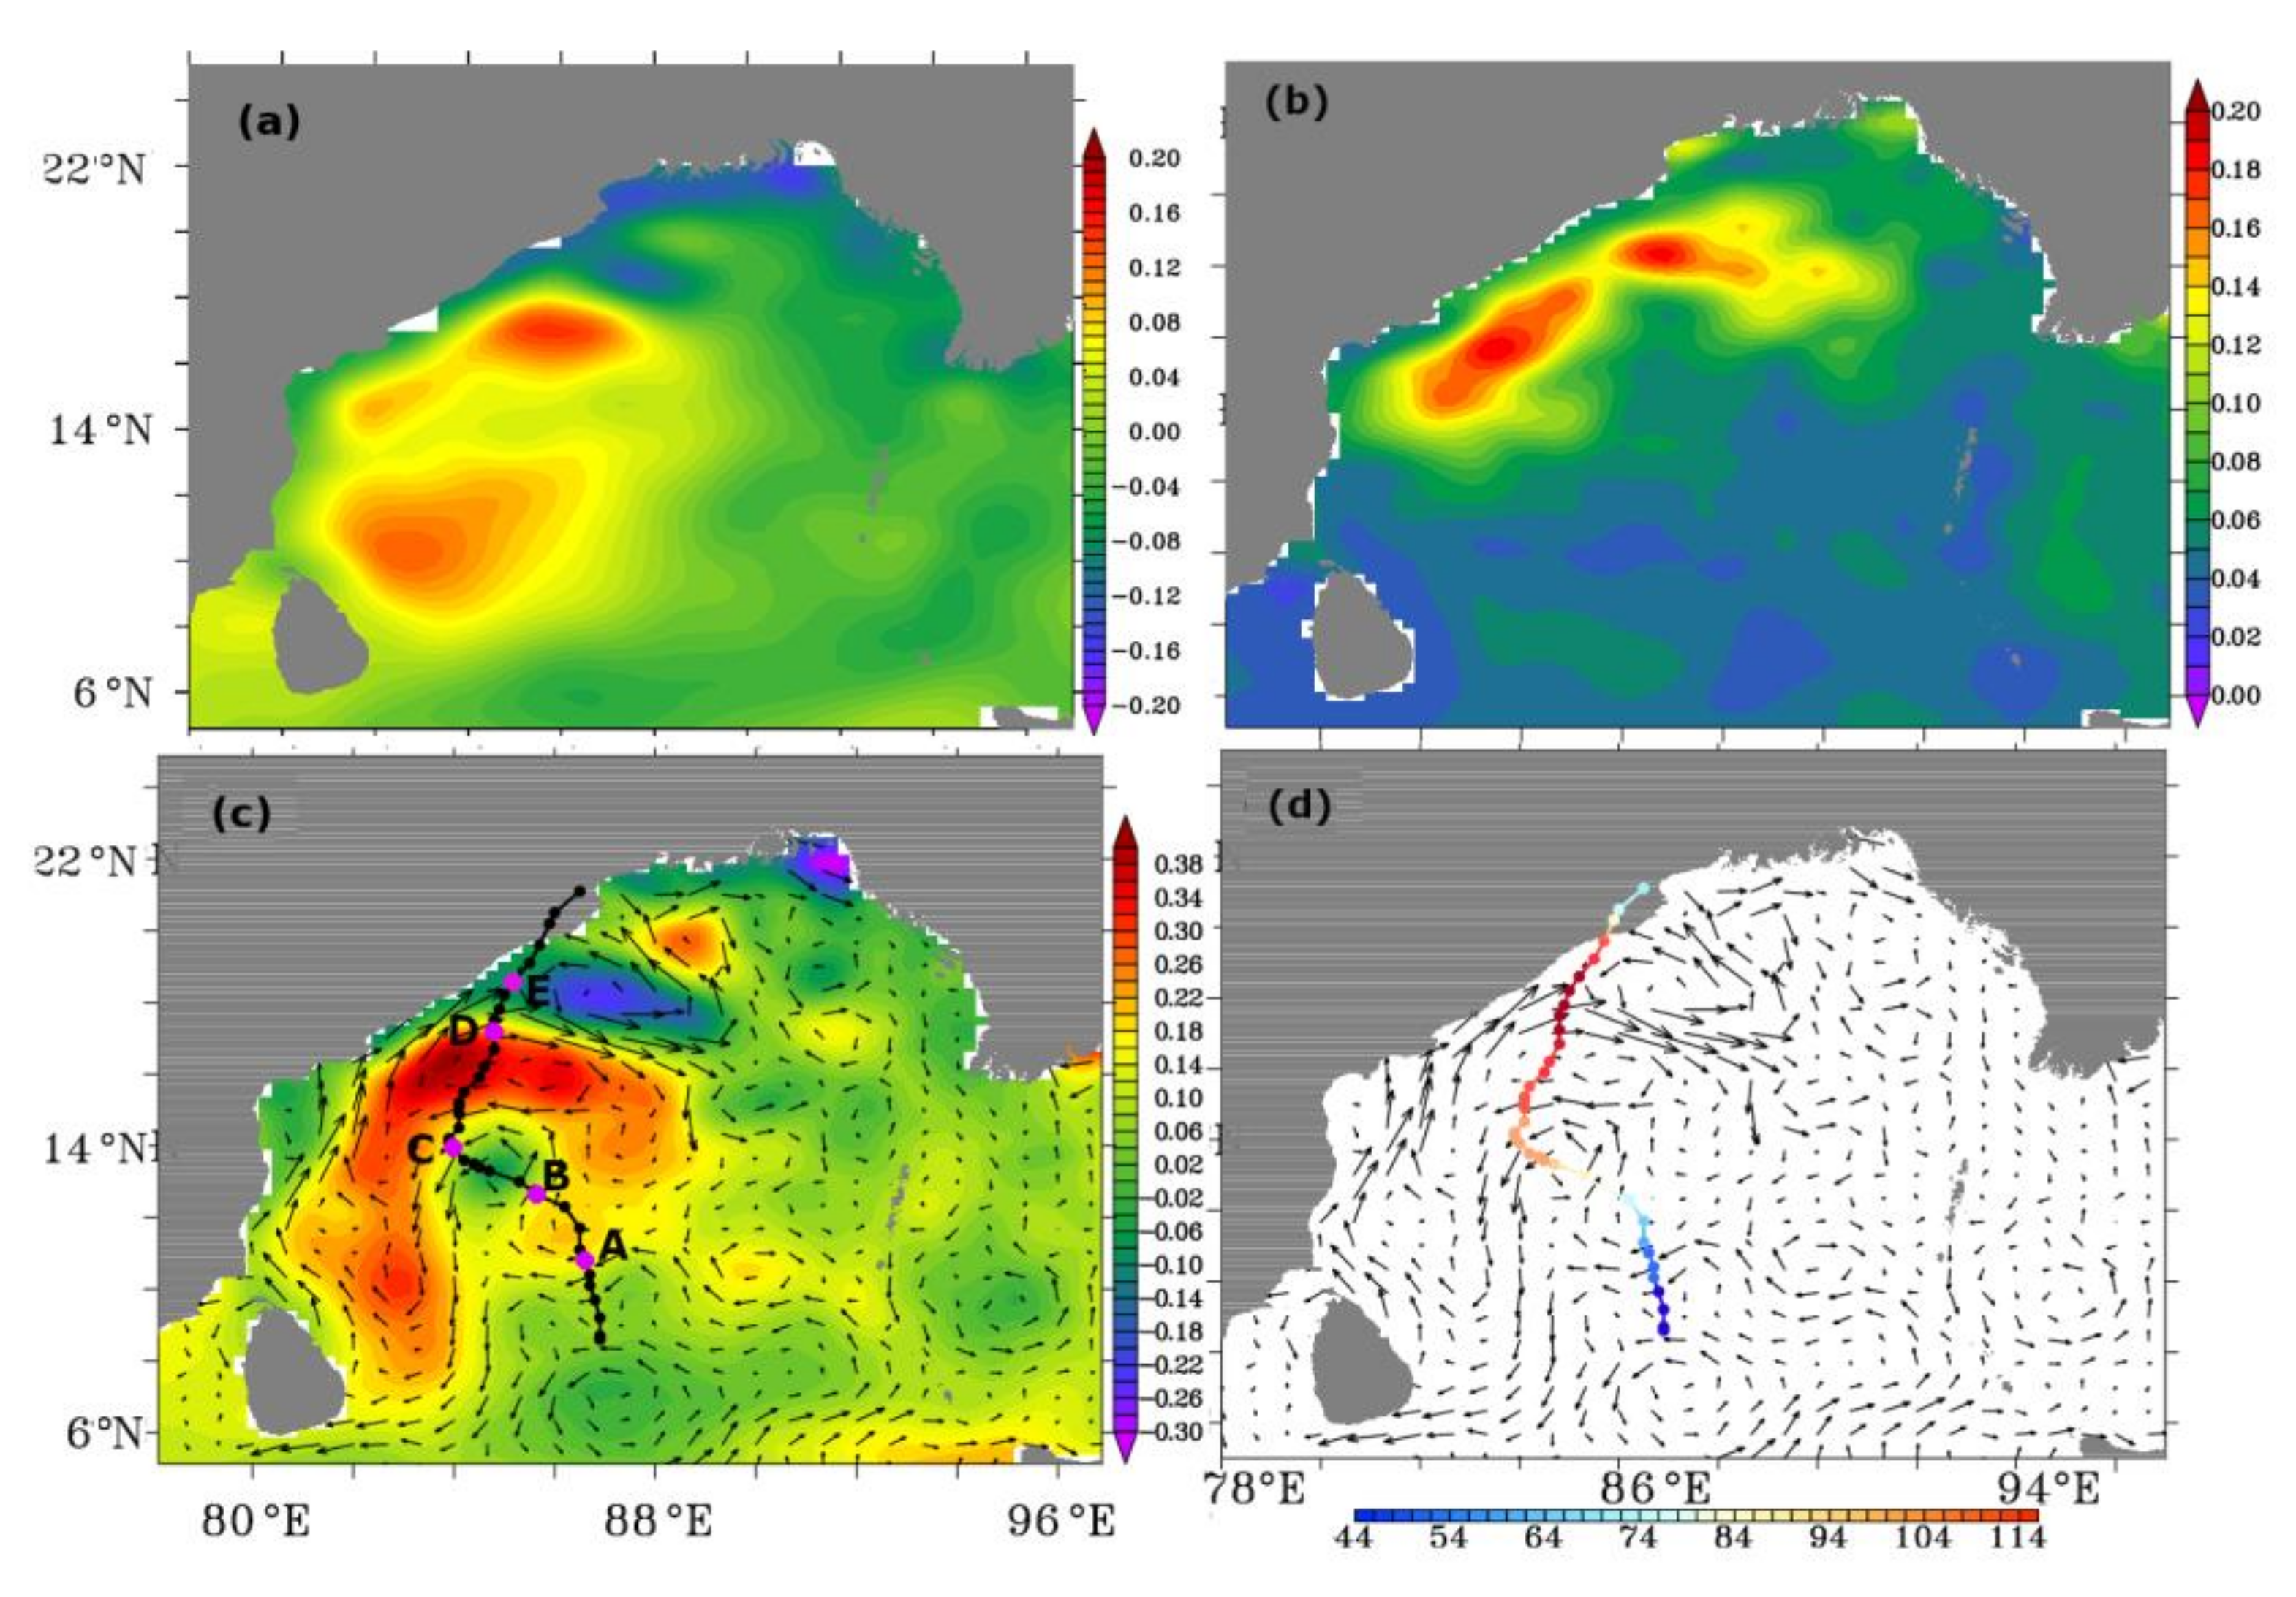
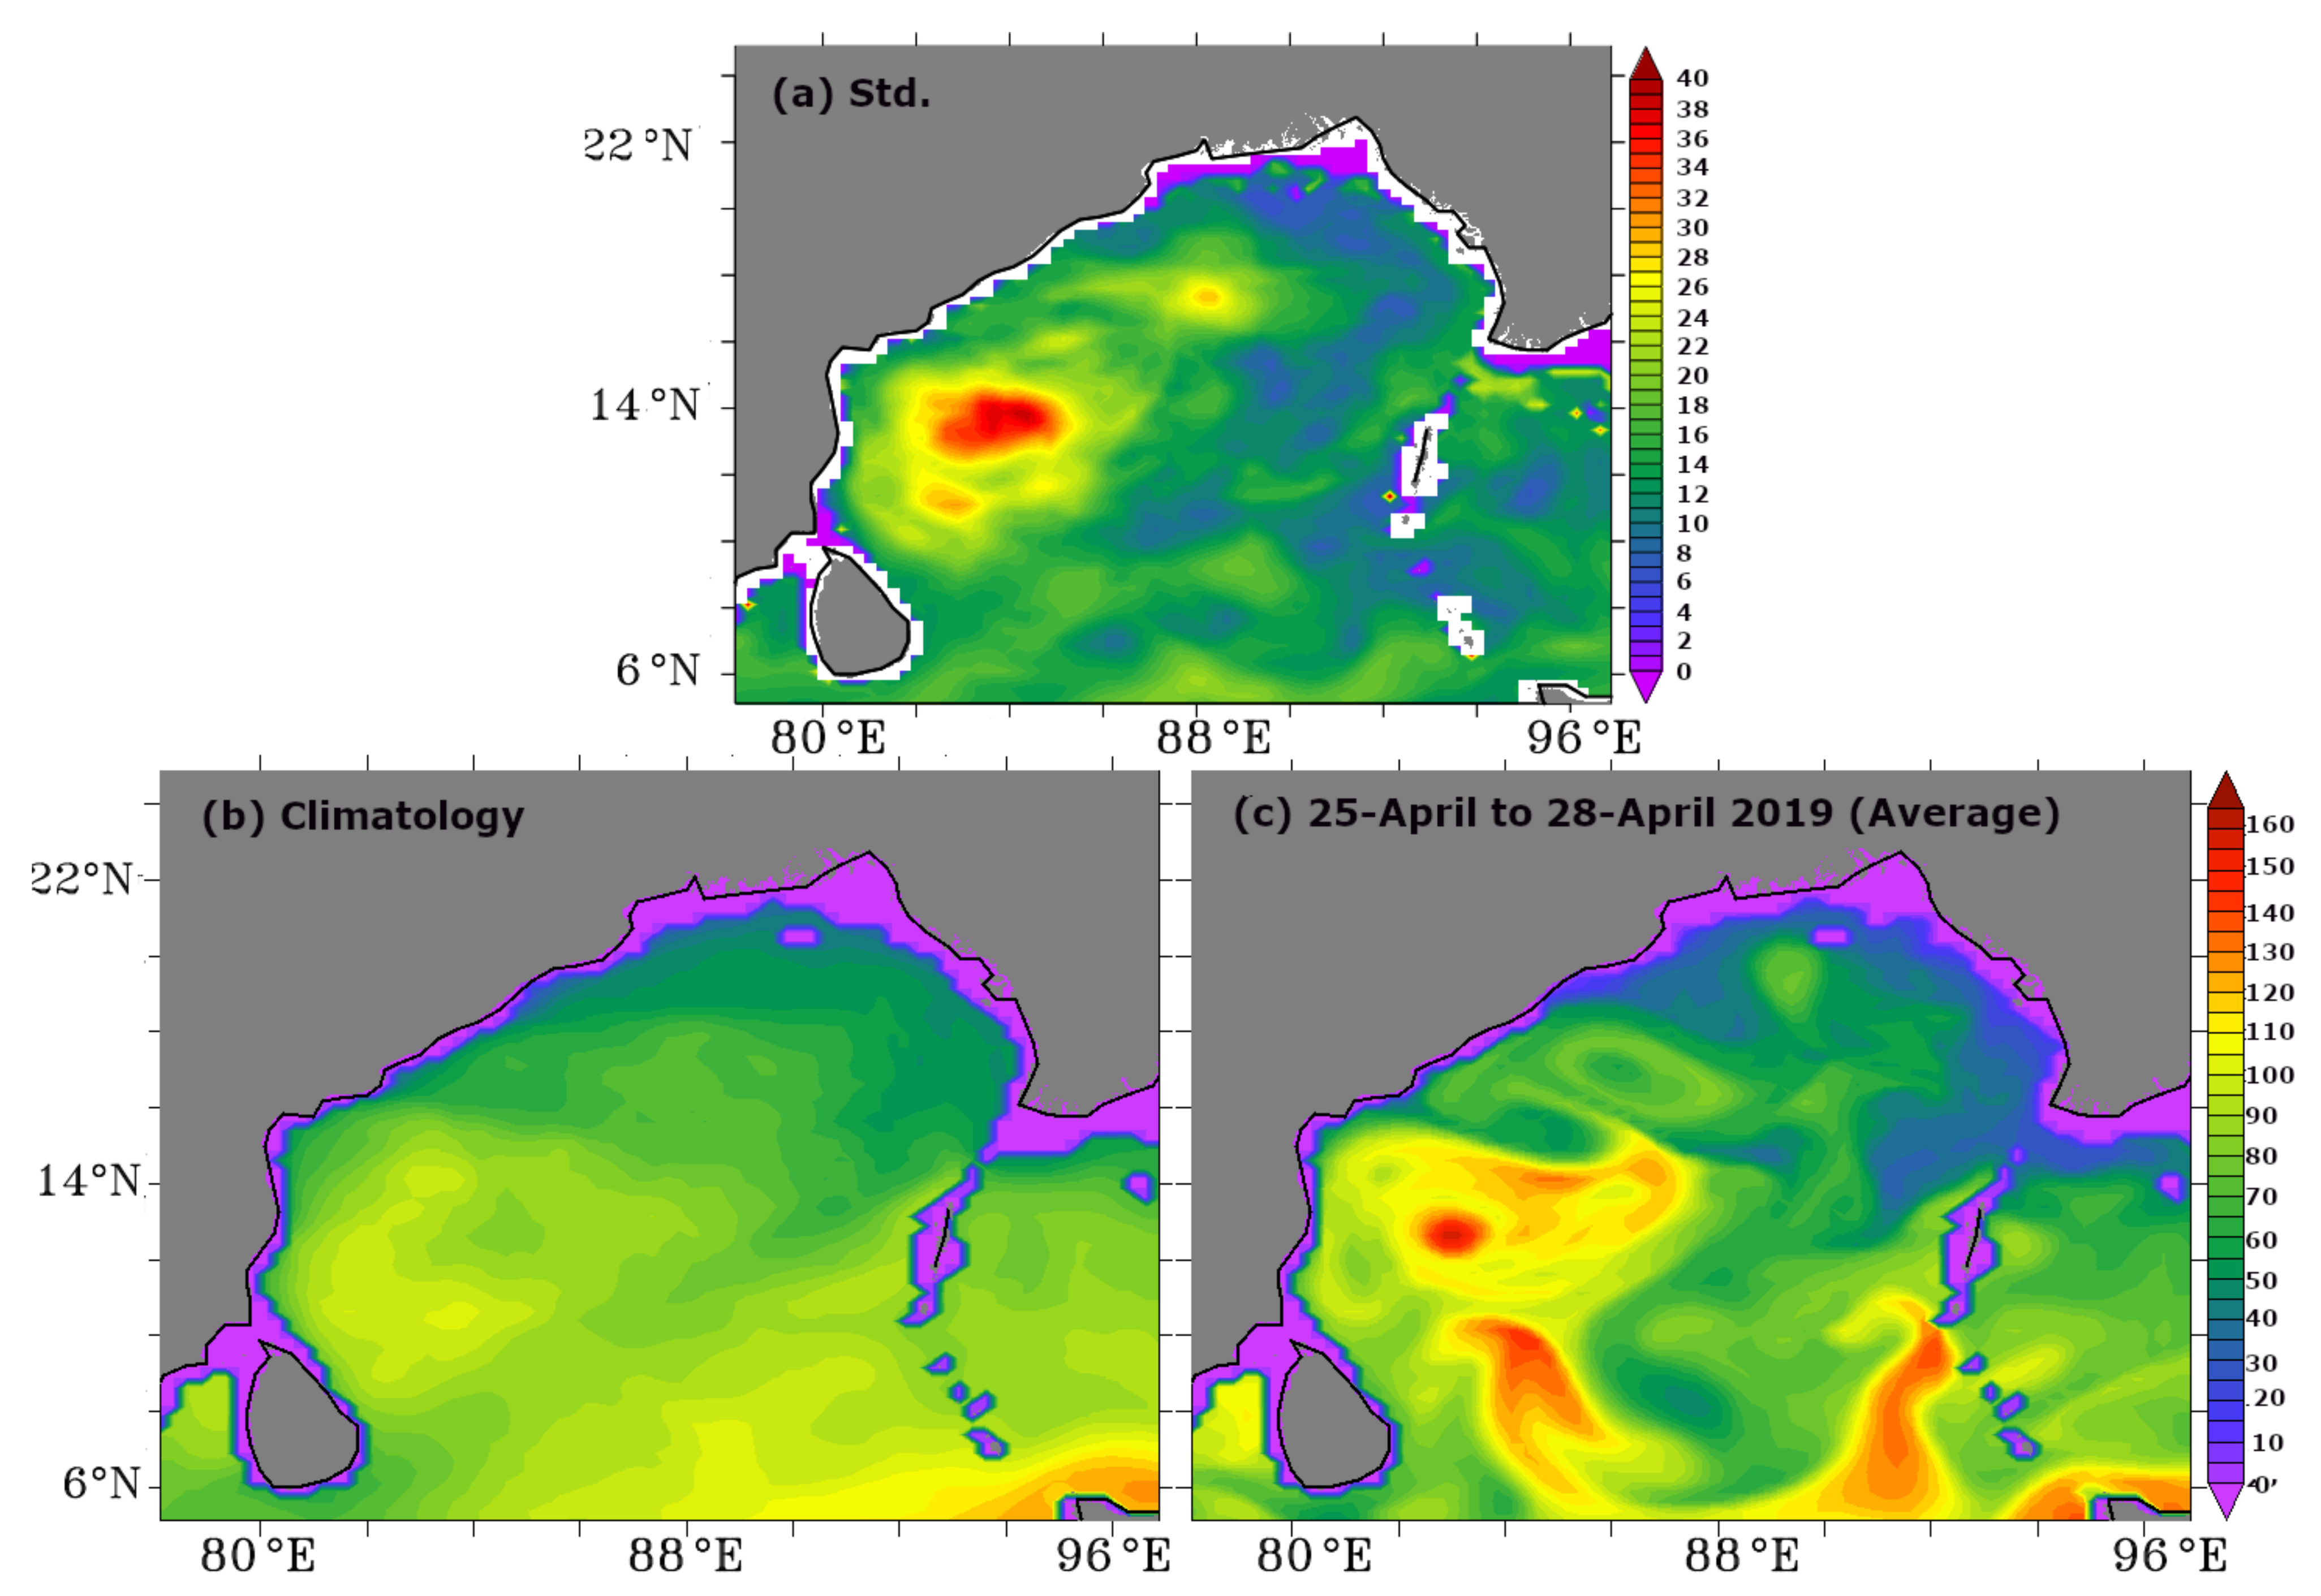
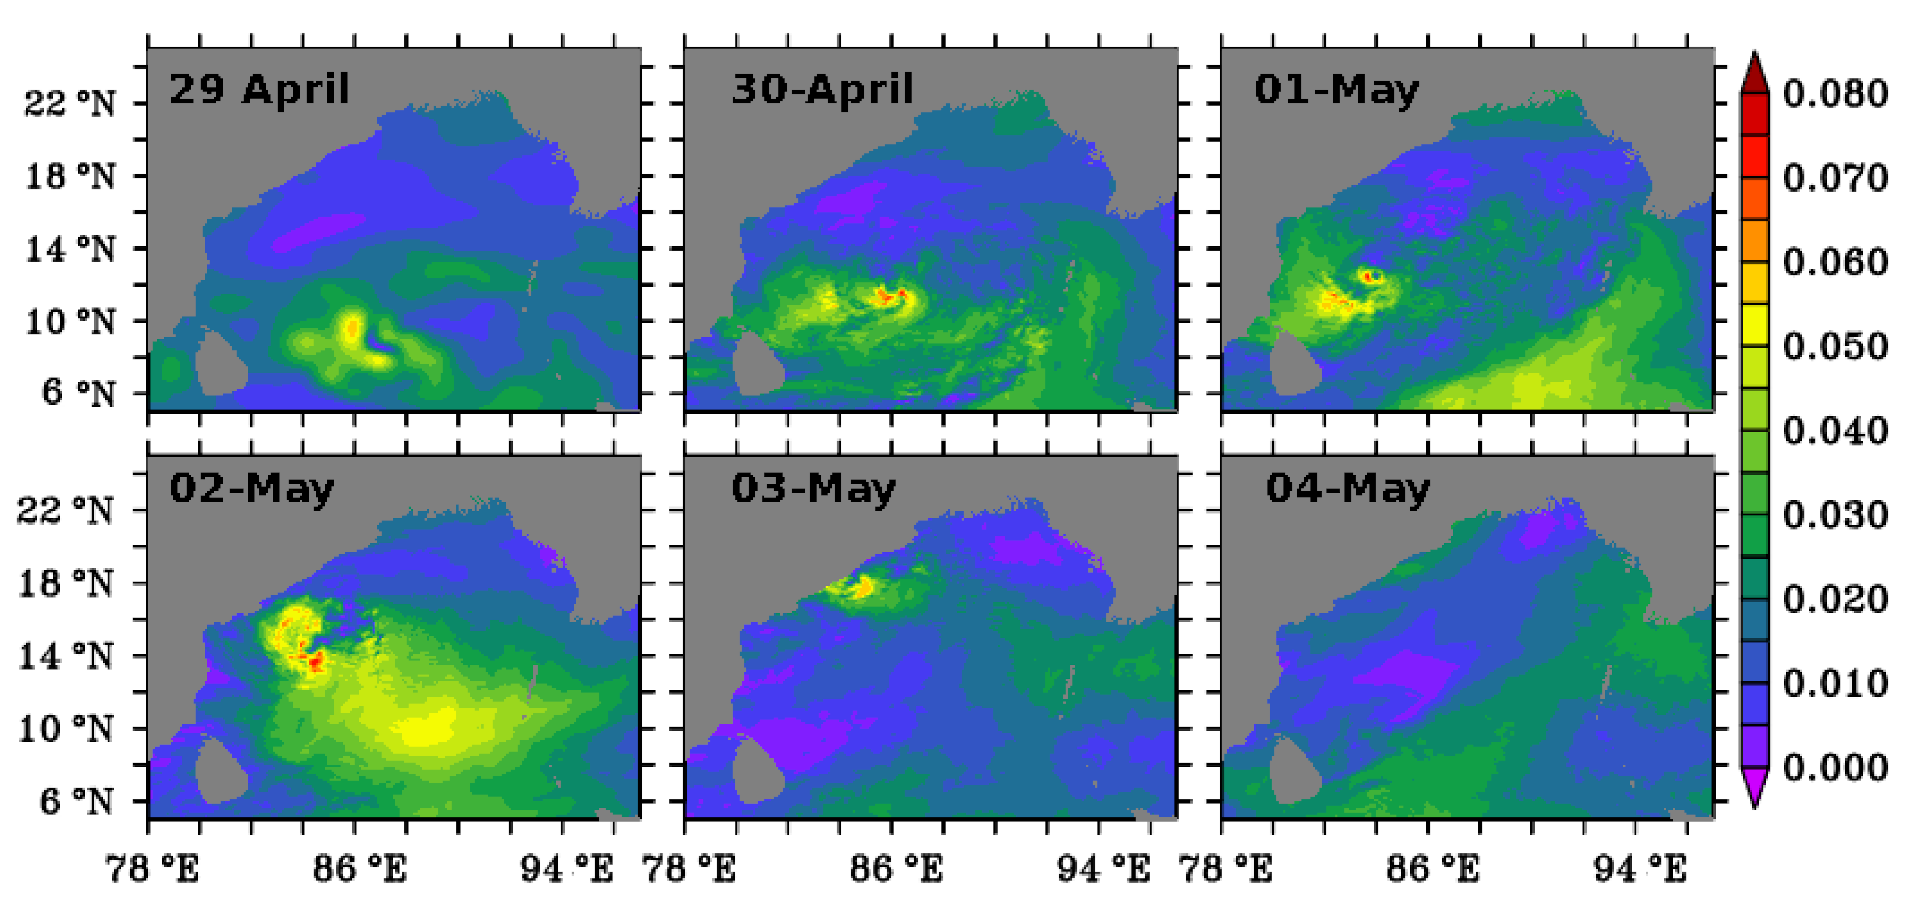
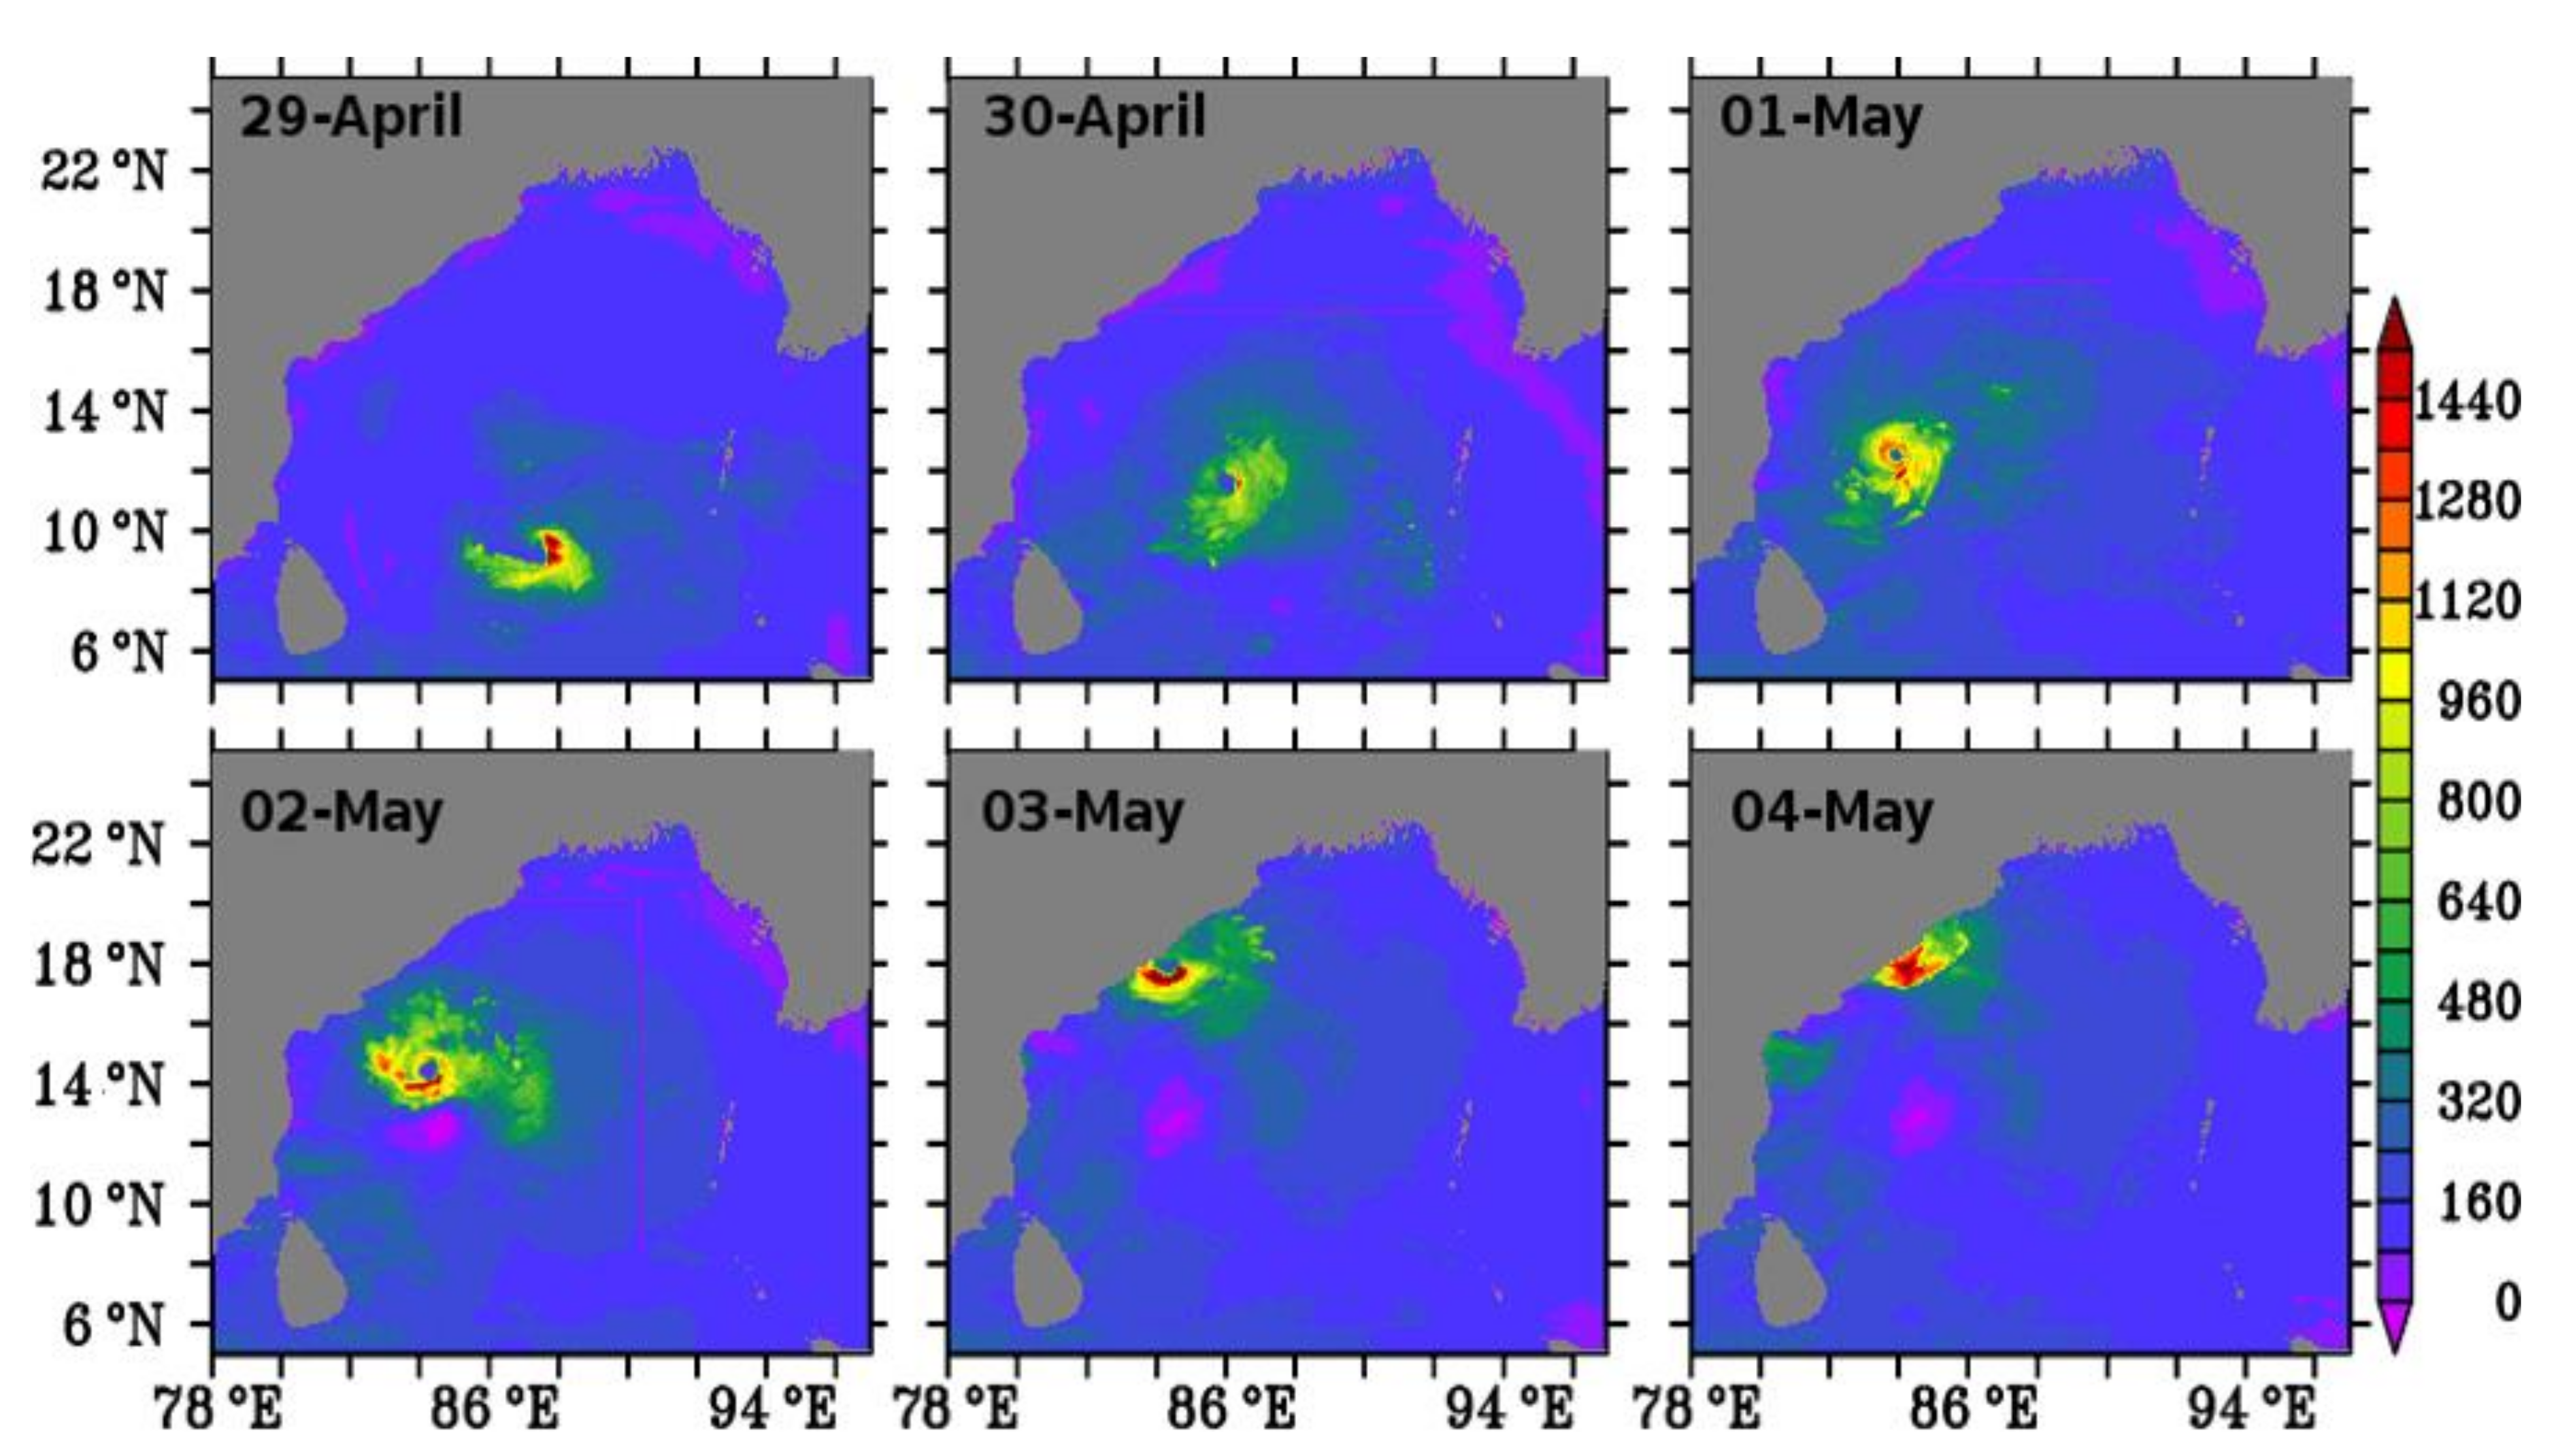
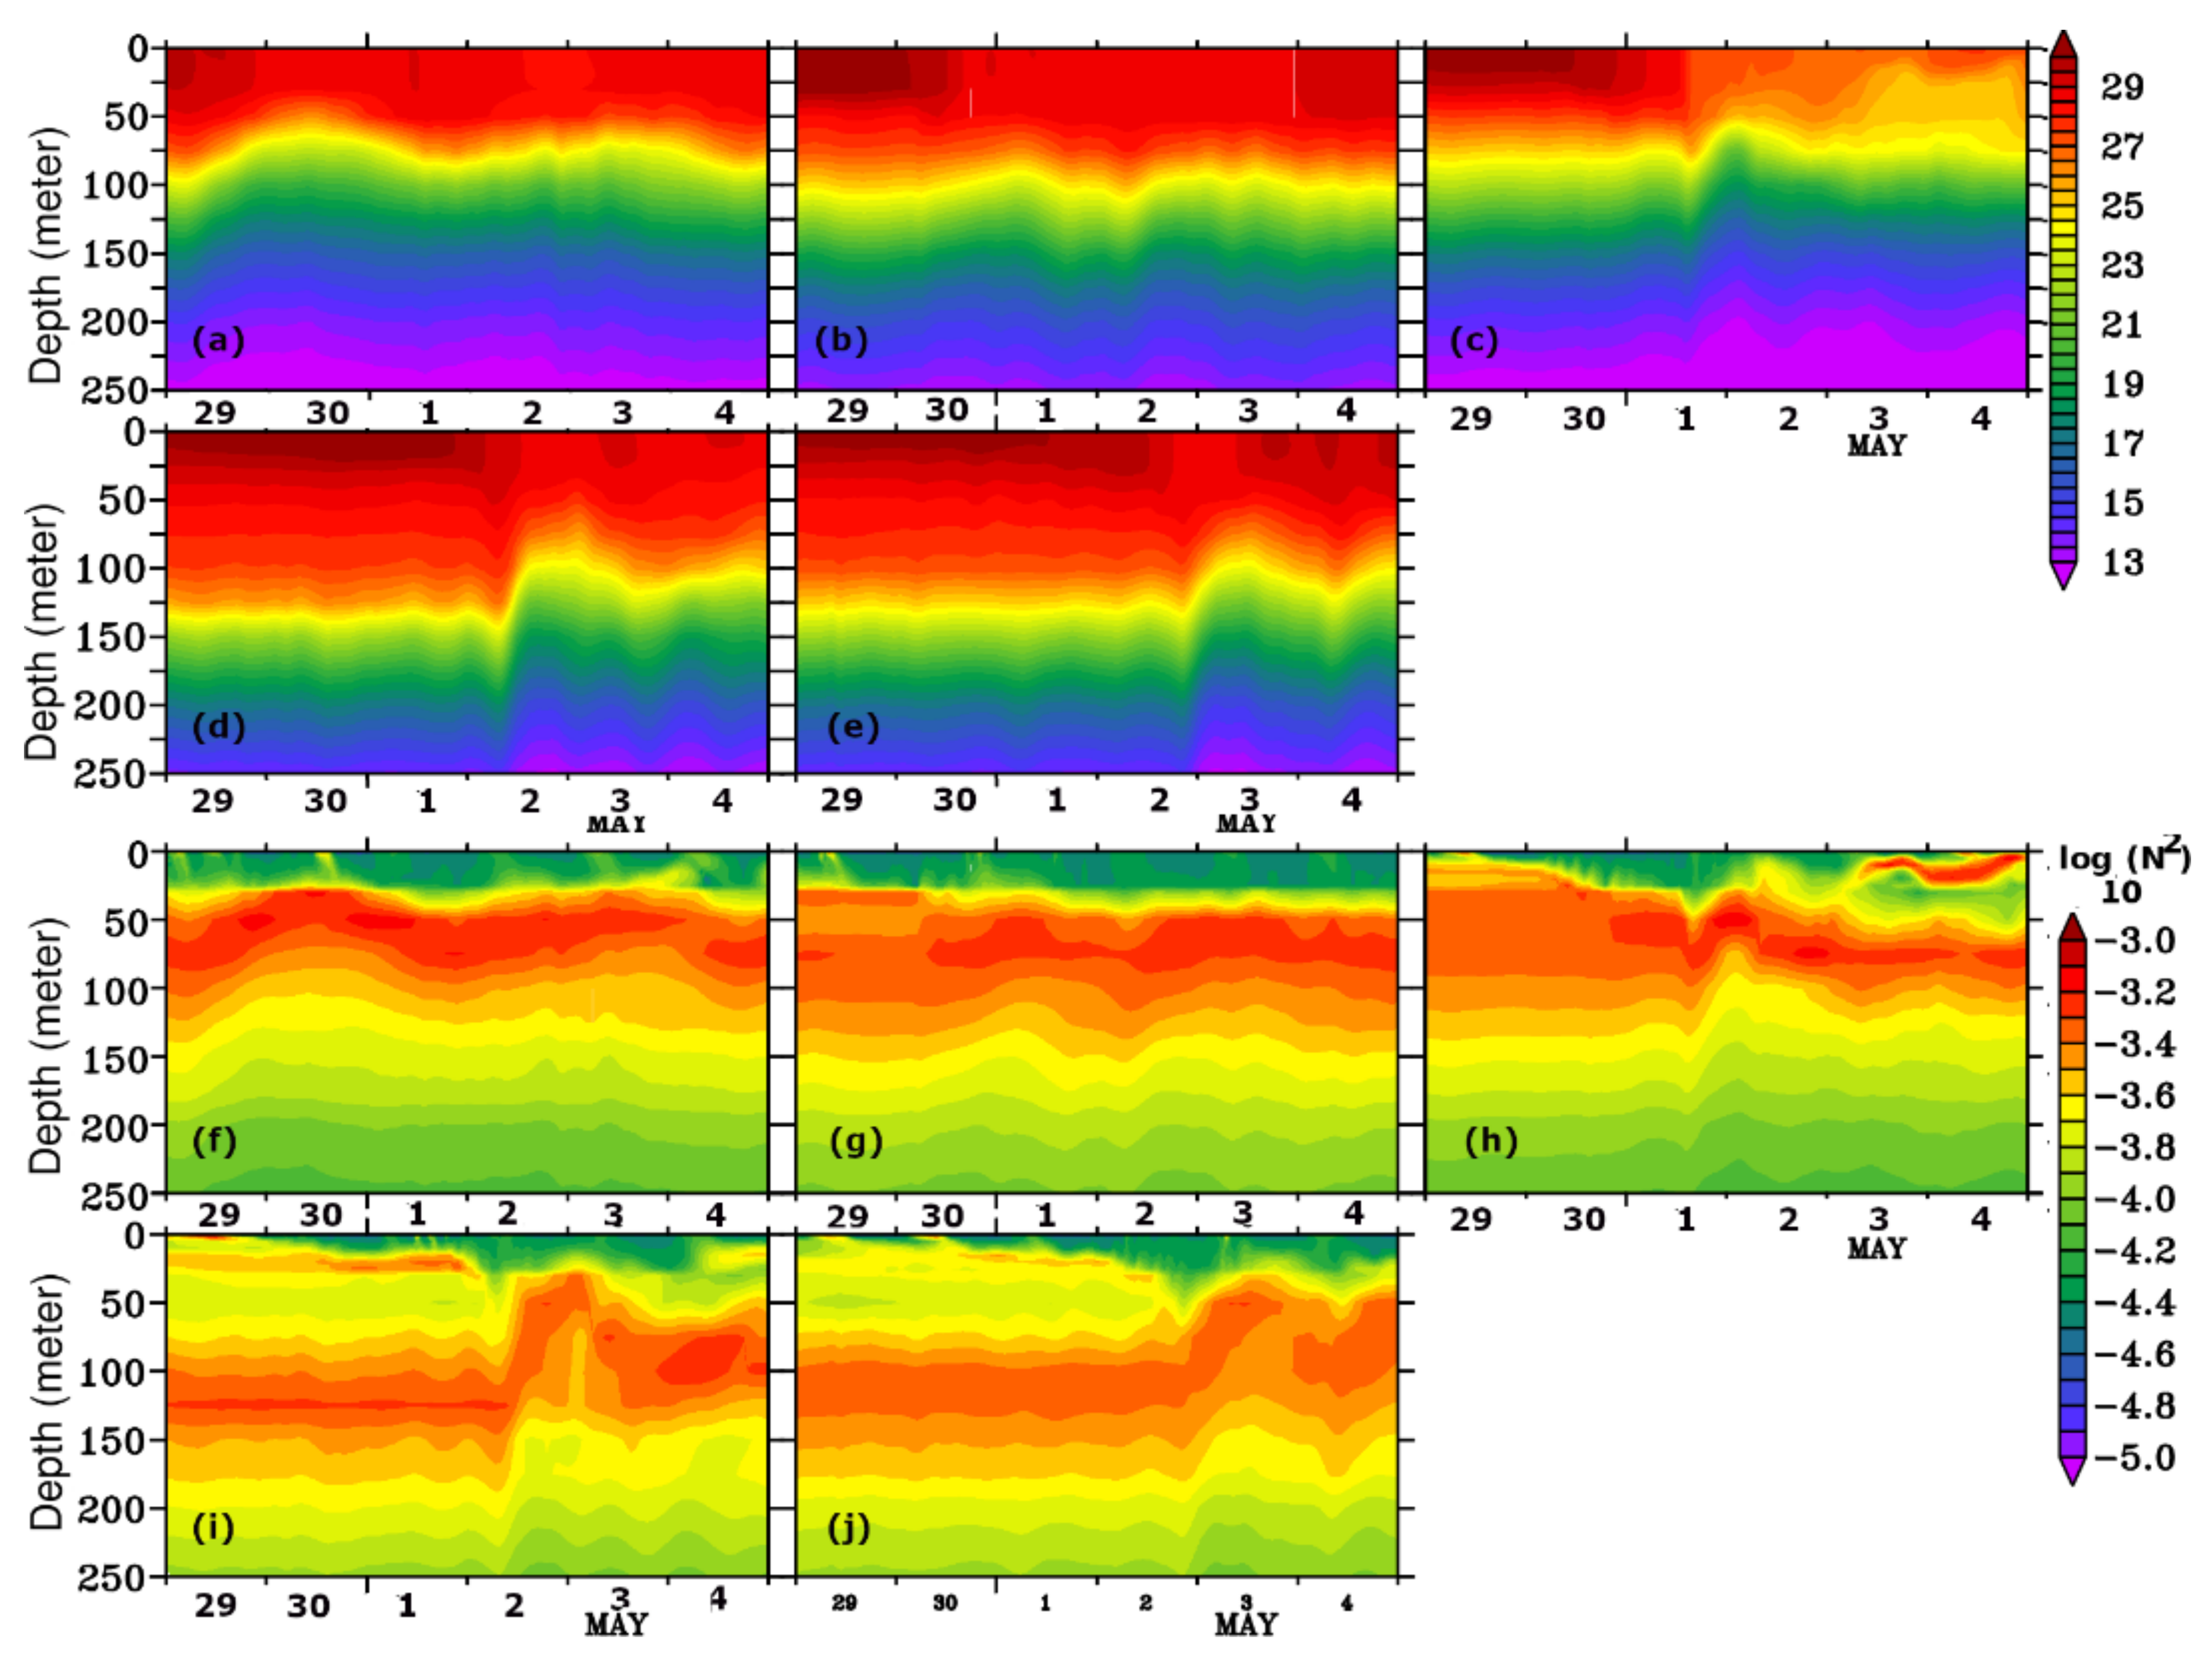
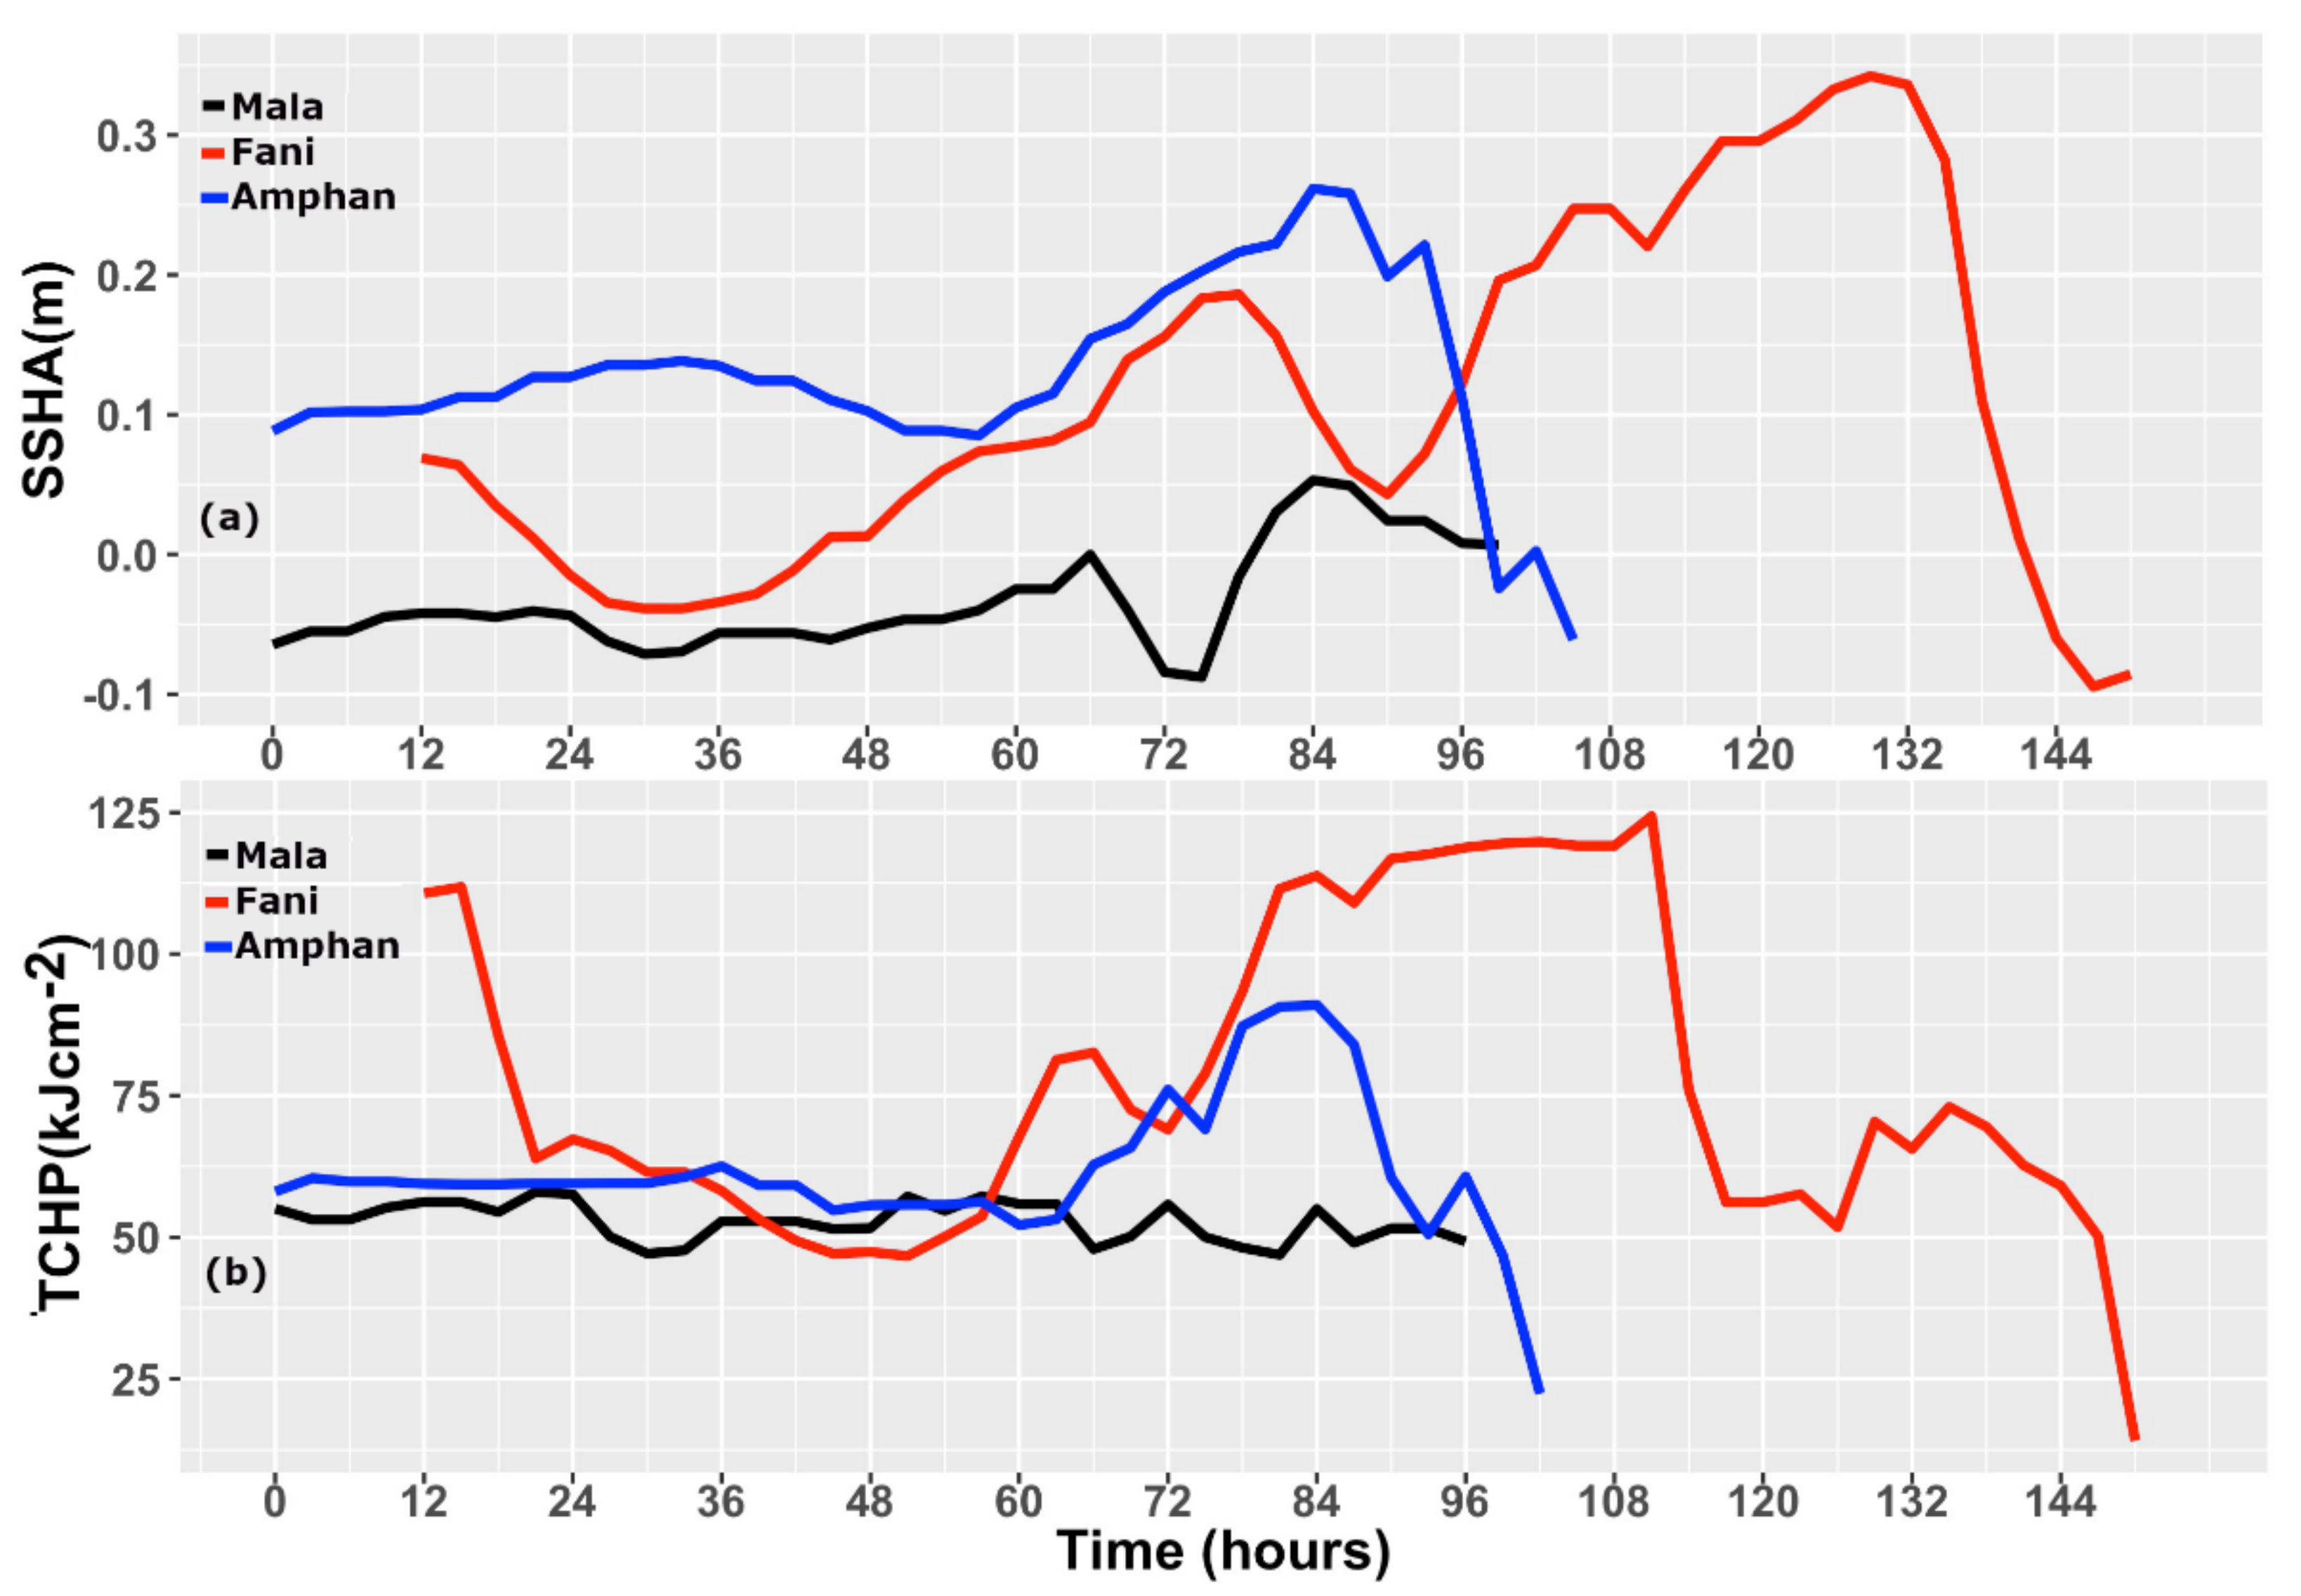
3.2. Role of Oceanic Mesoscale Eddies
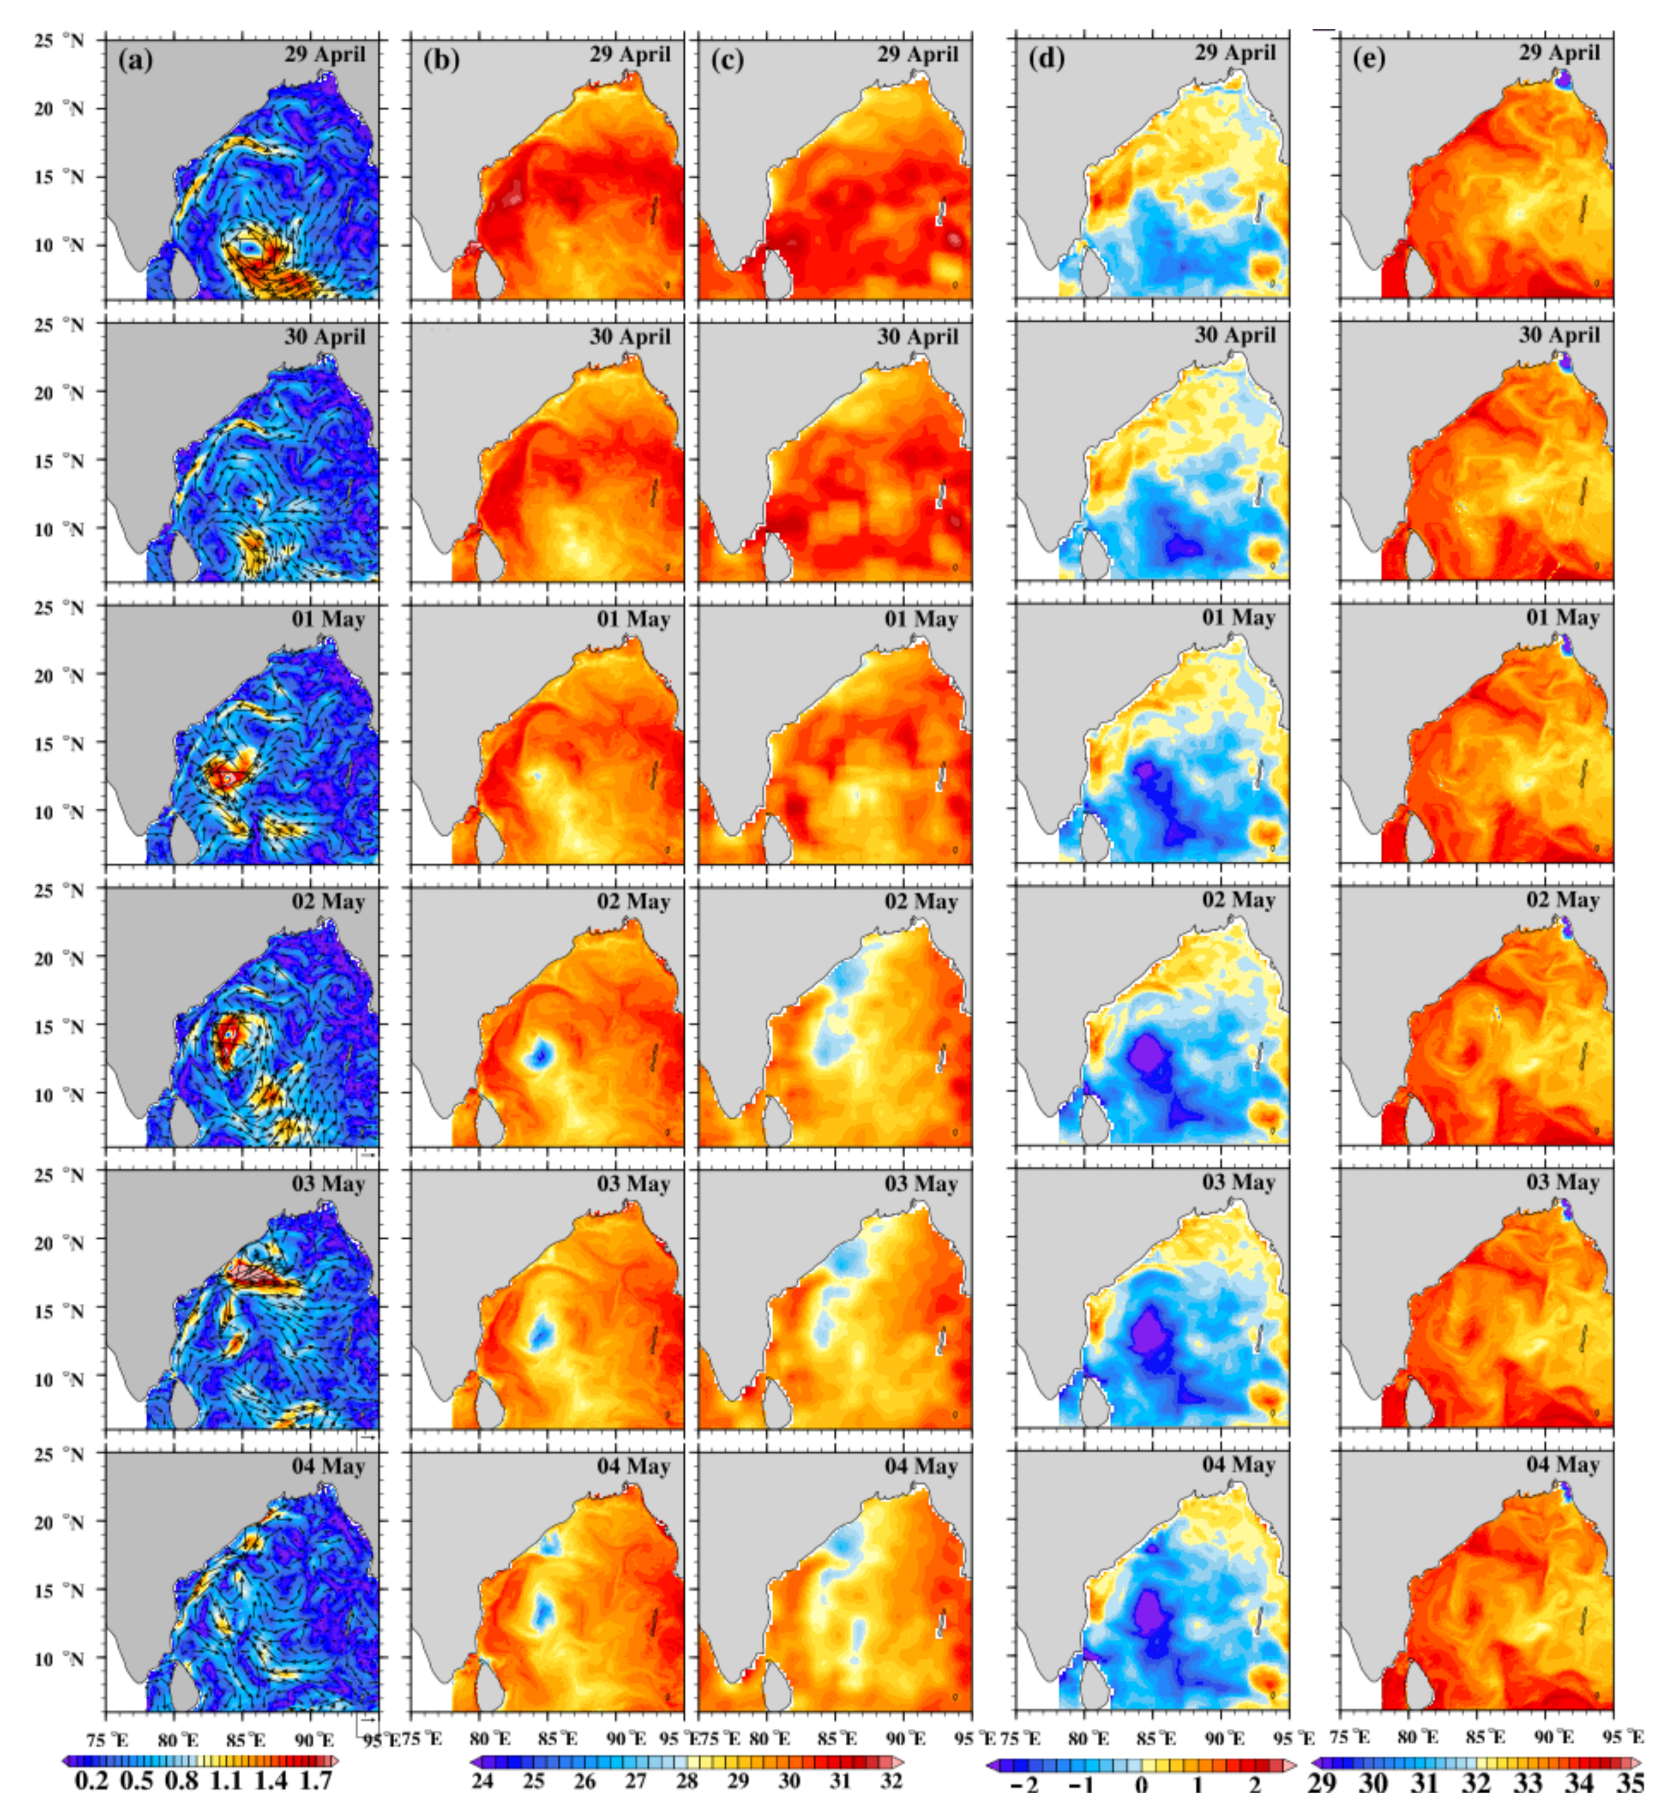
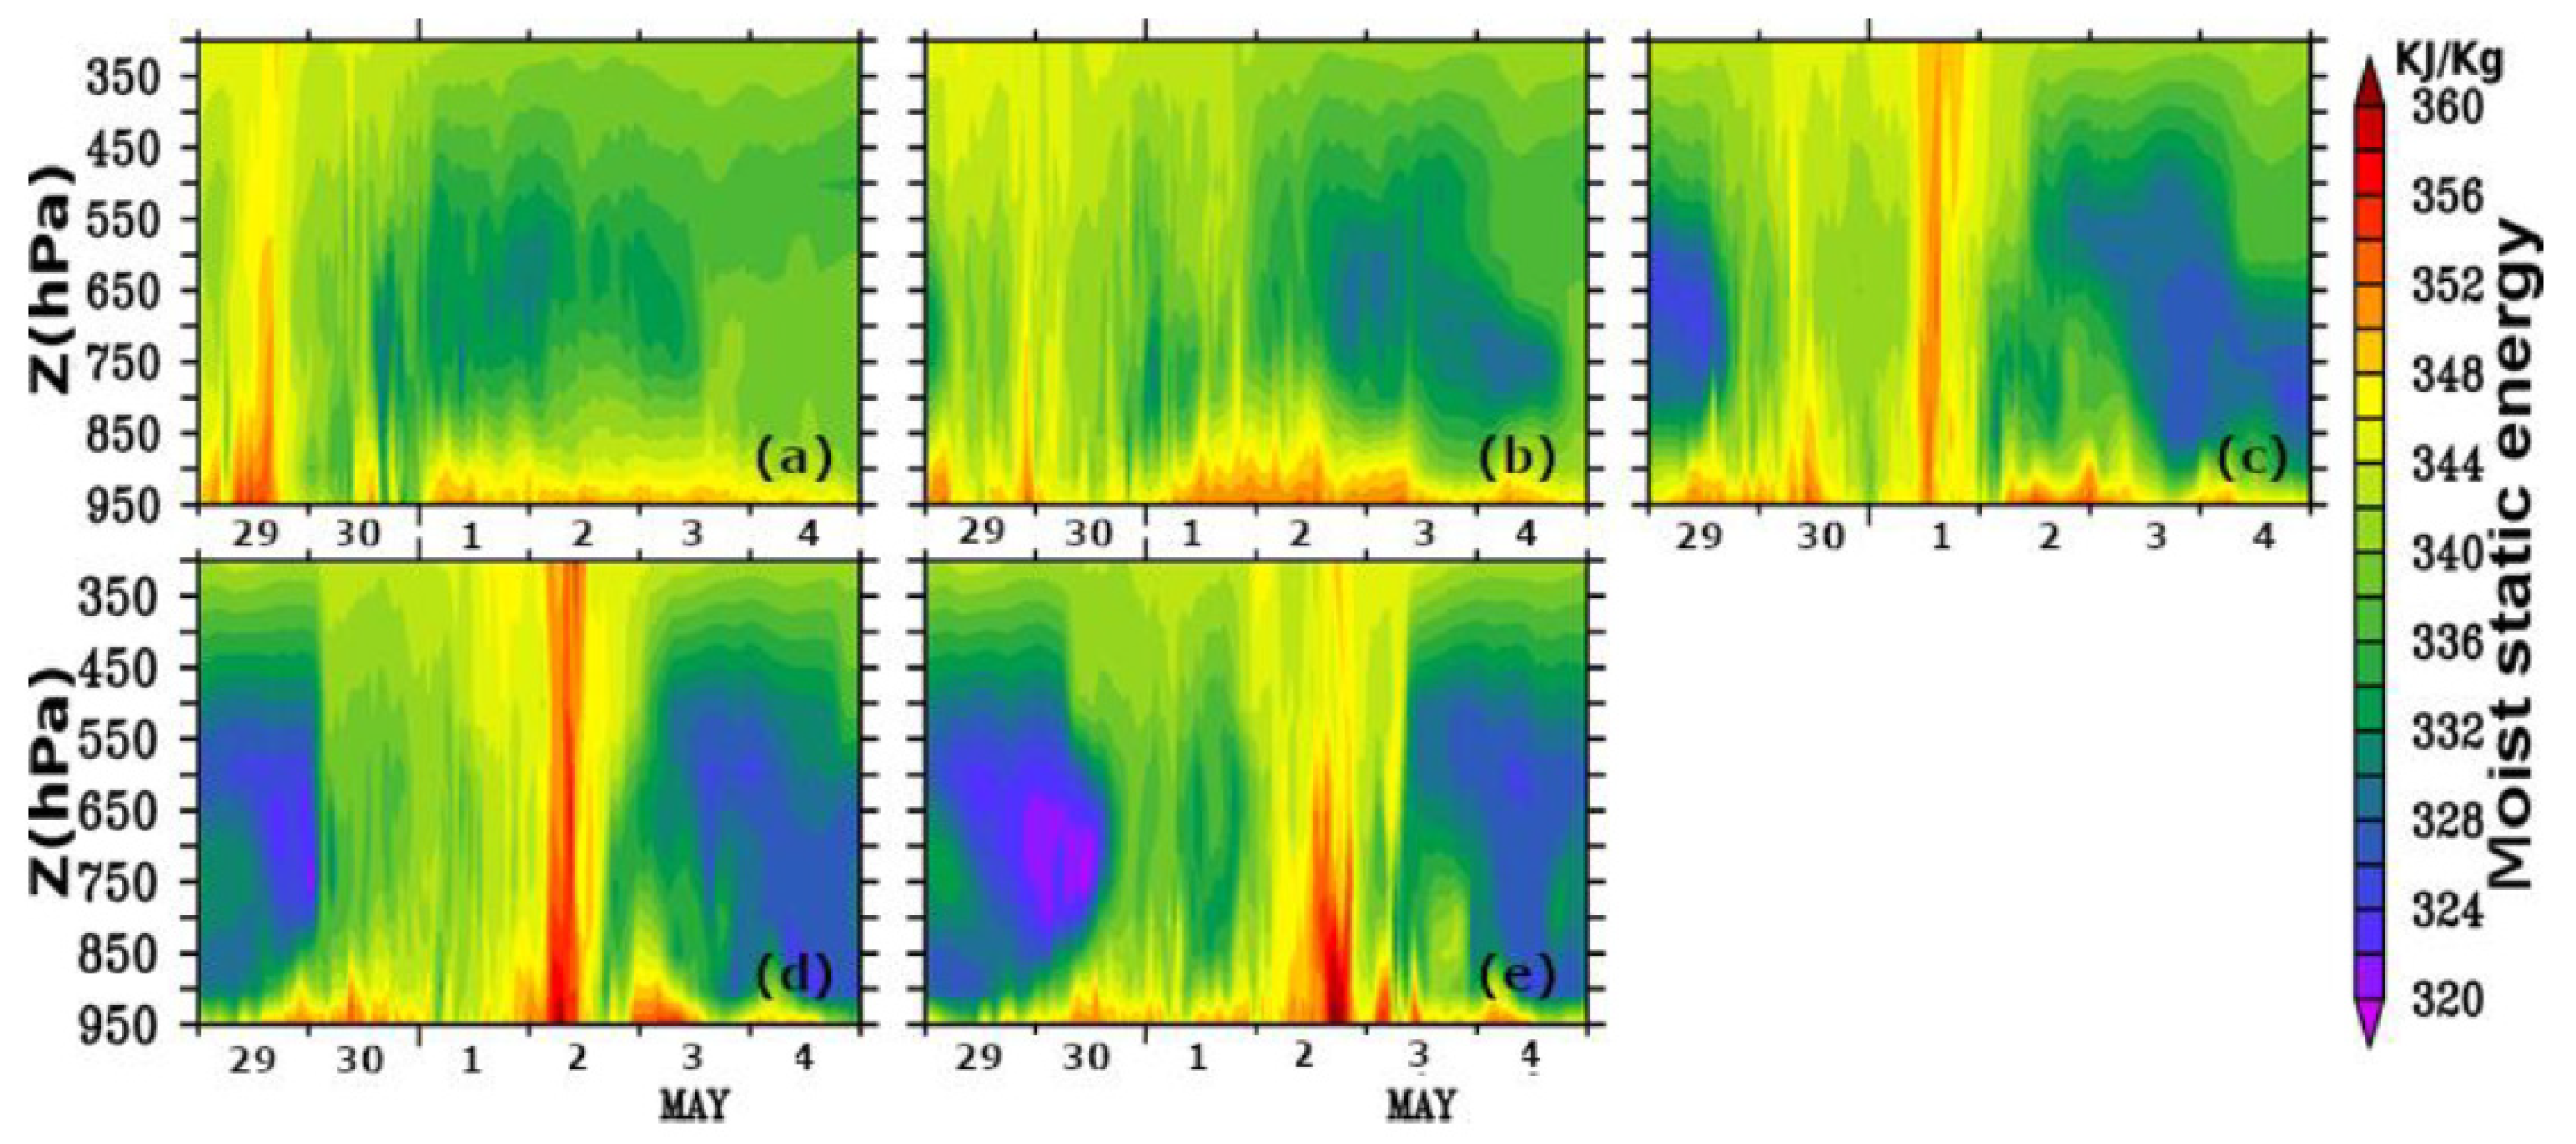
3.3. Impact of Anomalous Atmospheric and Oceanic Conditions
4. Conclusions
Author Contributions
Funding
Institutional Review Board Statement
Informed Consent Statement
Data Availability Statement
Acknowledgments
Conflicts of Interest
References
- Bender, M.A.; Ginis, I.; Kurihara, Y. Numerical simulations of tropical cyclone-ocean interaction with a high-resolution coupled model. J. Geophys. Res. Atmos. 1993, 98, 23245–23263. [Google Scholar] [CrossRef]
- Mahapatra, D.K.; Rao, A.D.; Babu, S.V.; Srinivas, C. Influence of coast line on upper ocean’s response to the tropical cyclone. Geophys. Res. Lett. 2007, 34, L17603. [Google Scholar] [CrossRef] [Green Version]
- Price, J.F. Upper ocean response to a hurricane. J. Phys. Oceanogr. 1981, 11, 153–175. [Google Scholar] [CrossRef] [Green Version]
- Lin, I.-I.; Liu, W.T.; Wu, C.-C.; Wong, G.T.F.; Hu, C.; Chen, Z.; Liang, W.-D.; Yang, Y.; Liu, K.-K. New evidence for enhanced ocean primary production triggered by tropical cyclone. Geophys. Res. Lett. 2003, 30, 1718. [Google Scholar] [CrossRef] [Green Version]
- Dickey, T.D.; Simpson, J.J. The influence of optical water type on the diurnal response of the upper ocean. Tellus B Chem. Phys. Meteorol. 1983, 35, 142–154. [Google Scholar] [CrossRef] [Green Version]
- Vincent, E.M.; Madec, G.; Lengaigne, M.; Vialard, J.; Koch-Larrouy, A. Influence of tropical cyclones on sea surface temperature seasonal cycle and ocean heat transport. Clim. Dyn. 2012, 41, 2019–2038. [Google Scholar] [CrossRef] [Green Version]
- Zheng, Z.-W.; Ho, C.-R.; Zheng, Q.; Lo, Y.-T.; Kuo, N.-J.; Gopalakrishnan, G. Effects of preexisting cyclonic eddies on upper ocean responses to Category 5 typhoons in the western North Pacific. J. Geophys. Res. Ocean. 2010, 115, C09013. [Google Scholar] [CrossRef]
- Shay, L.K.; Goni, G.J.; Black, P.G. Effects of a Warm Oceanic Feature on Hurricane Opal. Mon. Weather Rev. 2000, 128, 1366–1383. [Google Scholar] [CrossRef]
- Goni, G.J.; Trinanes, J.A. Ocean thermal structure monitoring could aid in the intensity forecast of tropical cyclones. Eos 2003, 84, 573–578. [Google Scholar] [CrossRef] [Green Version]
- Lin, I.I.; Wu, C.C.; Emanuel, K.; Lee, I.H.; Wu, C.R.; Pun, I.F. The interaction of Super typhoon Maemi (2003) with a warm ocean eddy. Mon. Weather Rev. 2005, 133, 2635–2649. [Google Scholar] [CrossRef]
- Scharroo, R.; Smith, W.H.F.; Lillibridge, J. Satellite altimetry and the intensification of Hurricane Katrina. Eos 2005, 86, 366. [Google Scholar] [CrossRef] [Green Version]
- Chen, G.; Li, Y.; Xie, Q.; Wang, D. Origins of Eddy Kinetic Energy in the Bay of Bengal. J. Geophys. Res. Ocean. 2018, 123, 2097–2115. [Google Scholar] [CrossRef]
- Cheng, X.; Xie, S.-P.; McCreary, J.P.; Qi, Y.; Du, Y. Intraseasonal variability of sea surface height in the Bay of Bengal. J. Geophys. Res. Ocean. 2013, 118, 816–830. [Google Scholar] [CrossRef]
- Warner, J.C.; Armstrong, B.; He, R.; Zambon, J.B. Development of a Coupled Ocean–Atmosphere–Wave–Sediment Transport (COAWST) Modeling System. Ocean Model. 2010, 35, 230–244. [Google Scholar] [CrossRef] [Green Version]
- Zambon, J.B.; He, R.; Warner, J.C. Investigation of hurricane Ivan using the coupled ocean–atmosphere–wave–sediment transport (COAWST) model. Ocean Dyn. 2014, 64, 1535–1554. [Google Scholar] [CrossRef]
- Nelson, J.; He, R.; Warner, J.C.; Bane, J.M. Air–sea interactions during strong winter extratropical storms. Ocean Dyn. 2014, 64, 1233–1246. [Google Scholar] [CrossRef]
- Renault, L.; Chiggiato, J.; Warner, J.C.; Gomez, M.; Vizoso, G.; Tintoré, J. Coupled atmosphere-ocean-wave simulations of a storm event over the Gulf of Lion and Balearic Sea. J. Geophys. Res. Ocean. 2012, 117. [Google Scholar] [CrossRef] [Green Version]
- Prakash, K.R.; Pant, V.; Nigam, T. Effects of the Sea Surface Roughness and Sea Spray-Induced Flux Parameterization on the Simulations of a Tropical Cyclone. J. Geophys. Res. Atmos. 2019, 124, 14037–14058. [Google Scholar] [CrossRef]
- Skamarock, W.C.; Klemp, J.B.; Dudhia, J.; Gill, D.O.; Barker, D.; Duda, M.G.; Huang, X.; Wang, W.; Powers, J.G. A Description of the Advanced Research WRF Version 3 (No. NCAR/TN-475+STR); University Corporation for Atmospheric Research: Boulder, CO, USA, 2008. [Google Scholar] [CrossRef]
- Nakanishi, M. Improvement of the Mellor–Yamada Turbulence Closure Model Based on Large-Eddy Simulation Data. Bound.-Layer Meteorol. 2001, 99, 349–378. [Google Scholar] [CrossRef]
- Nakanishi, M.; Niino, H. An Improved Mellor–Yamada Level-3 Model with Condensation Physics: Its Design and Verification. Bound. Layer Meteorol. 2004, 112, 1–31. [Google Scholar] [CrossRef]
- Nakanishi, M.; Niino, H. An Improved Mellor-Yamada Level-3 Model: Its Numerical Stability and Application to a Regional Prediction of Advection Fog. Bound.-Layer Meteorol. 2006, 119, 397–407. [Google Scholar] [CrossRef]
- Nakanishi, M.; Niino, H. Development of an Improved Turbulence Closure Model for the Atmospheric Boundary Layer. J. Meteorol. Soc. Jpn. Ser. II 2009, 87, 895–912. [Google Scholar] [CrossRef] [Green Version]
- NCEP. NCEP FNL Operational Model Global Tropospheric Analyses, Continuing from July 1999; NCEP: College Park, MD, USA, 2000. [Google Scholar] [CrossRef]
- Chassignet, E.P.; Arango, H.; Dietrich, D.; Ezer, T.; Ghil, M.; Haidvogel, D.B.; Ma, C.-C.; Mehra, A.; Paiva, A.; Sirkes, Z. DAMÉE-NAB: The base experiments. Dyn. Atmos. Ocean. 2000, 32, 155–183. [Google Scholar] [CrossRef]
- Haidvogel, D.B.; Arango, H.G.; Hedstrom, K.; Beckmann, A.; Malanotte-Rizzoli, P.; Shchepetkin, A.F. Model evaluation experiments in the North Atlantic Basin: Simulations in nonlinear terrain-following coordinates. Dyn. Atmos. Ocean. 2000, 32, 239–281. [Google Scholar] [CrossRef]
- Umlauf, L.; Burchard, H. A generic length-scale equation for geophysical turbulence models. J. Mar. Res. 2003, 61, 235–265. [Google Scholar] [CrossRef]
- Warner, J.C.; Sherwood, C.R.; Arango, H.G.; Signell, R. Performance of four turbulence closure models implemented using a generic length scale method. Ocean Model. 2005, 8, 81–113. [Google Scholar] [CrossRef]
- Larson, J.; Jacob, R.; Ong, E. The Model Coupling Toolkit: A New Fortran90 Toolkit for Building Multiphysics Parallel Coupled Models. Int. J. High Perform. Comput. Appl. 2005, 19, 277–292. [Google Scholar] [CrossRef]
- Jacob, R.L.; Larson, J.W.; Ong, E.T. M × N Communication and Parallel Interpolation in Community Climate System Model Version 3 Using the Model Coupling Toolkit. Int. J. High Perform. Comput. Appl. 2005, 19, 293–307. [Google Scholar] [CrossRef]
- Prakash, K.R.; Pant, V. Upper oceanic response to tropical cyclone Phailin in the Bay of Bengal using a coupled atmosphere-ocean model. Ocean Dyn. 2016, 67, 51–64. [Google Scholar] [CrossRef]
- Mohapatra, M.; Bandyopadhyay, B.K.; Tyagi, A. Best track parameters of tropical cyclones over the North Indian Ocean: A review. Nat. Hazards 2011, 63, 1285–1317. [Google Scholar] [CrossRef]
- Prakash, K.R.; Nigam, T.; Pant, V. Estimation of oceanic subsurface mixing under a severe cyclonic storm using a coupled atmosphere–ocean–wave model. Ocean Sci. 2018, 14, 259–272. [Google Scholar] [CrossRef] [Green Version]
- Nigam, T.; Prakash, K.R.; Pant, V. An assessment of the impact of oceanic initial conditions on the interaction of upper ocean with the tropical cyclones in the Arabian Sea. J. Oper. Oceanogr. 2019, 13, 121–137. [Google Scholar] [CrossRef]
- Donlon, C.J.; Martin, M.; Stark, J.; Roberts-Jones, J.; Fiedler, E.; Wimmer, W. The Operational Sea Surface Temperature and Sea Ice Analysis (OSTIA) system. Remote Sens. Environ. 2011, 116, 140–158. [Google Scholar] [CrossRef]
- Gröger, M.; Dieterich, C.; Meier, M.H.E.; Schimanke, S. Thermal air–sea coupling in hindcast simulations for the North Sea and Baltic Sea on the NW European shelf. Tellus A Dyn. Meteorol. Oceanogr. 2015, 67, 26911. [Google Scholar] [CrossRef] [Green Version]
- Shetye, S.R.; Gouveia, A.D.; Shankar, D.; Shenoi, S.S.C.; Vinayachandran, P.N.; Sundar, D.; Michael, G.S.; Nampoothiri, G. Hydrography and circulation in the western Bay of Bengal during the northeast monsoon. J. Geophys. Res. Ocean. 1996, 101, 14011–14025. [Google Scholar] [CrossRef]
- Vinayachandran, P.N.; Murty, V.S.N.; Babu, V.R. Observations of barrier layer formation in the Bay of Bengal during summer monsoon. J. Geophys. Res. Ocean. 2002, 107, SRF19. [Google Scholar] [CrossRef]
- Rao, R.R. Seasonal variability of sea surface salinity and salt budget of the mixed layer of the north Indian Ocean. J. Geophys. Res. Ocean. 2003, 108, 9-1–9-14. [Google Scholar] [CrossRef]
- Pant, V.; Girishkumar, M.S.; Bhaskar, T.V.S.U.; Ravichandran, M.; Papa, F.; Thangaprakash, V.P. Observed interannual variability of near-surface salinity in the Bay of Bengal. J. Geophys. Res. Ocean. 2015, 120, 3315–3329. [Google Scholar] [CrossRef]
- ESR. 2009 OSCAR Third Deg. Ver. 1. PO.DAAC, CA, USA. Available online: https://podaac.jpl.nasa.gov/dataset/OSCAR_L4_OC_third-deg (accessed on 10 November 2019). [CrossRef]
- Wada, A.; Usui, N. Importance of tropical cyclone heat potential for tropical cyclone intensity and intensification in the Western North Pacific. J. Oceanogr. 2007, 63, 427–447. [Google Scholar] [CrossRef]
- Pun, I.-F.; Lin, I.-I.; Wu, C.-R.; Ko, D.-S.; Liu, W.T. Validation and Application of Altimetry-Derived upper Ocean Thermal Structure in the Western North Pacific Ocean for Typhoon-Intensity Forecast. IEEE Trans. Geosci. Remote Sens. 2007, 45, 1616–1630. [Google Scholar] [CrossRef]
- Menemenlis, D.; Campin, J.M.; Heimbach, P.; Hill, C.; Lee, T.; Nguyen, A.; Schodlok, M.; Zhang, H. ECCO2: High resolution global ocean and sea ice data synthesis. Mercat. Ocean Q. Newslett. 2008, 31, 13–21. [Google Scholar]
- Gray, W.M. Global View of the Origin of Tropical Disturbances and Storms. Mon. Weather. Rev. 1968, 96, 669–700. [Google Scholar] [CrossRef]
- Singh, V.K.; Roxy, M.K.; Deshpande, M. Role of warm ocean conditions and the MJO in the genesis and intensification of extremely severe cyclone Fani. Sci. Rep. 2021, 11, 3607. [Google Scholar] [CrossRef] [PubMed]
- Sil, S.; Gangopadhyay, A.; Gawarkiewicz, G.; Pramanik, S. Shifting seasonality of cyclones and western boundary current interactions in Bay of Bengal as observed during Amphan and Fani. Sci. Rep. 2021, 11, 22052. [Google Scholar] [CrossRef] [PubMed]
- Pant, V.; Prakash, K.R. Response of Air–Sea Fluxes and Oceanic Features to the Coupling of Ocean–Atmosphere–Wave during the Passage of a Tropical Cyclone. Pure Appl. Geophys. 2020, 177, 3999–4023. [Google Scholar] [CrossRef]
- Ren, D.; Lynch, M.; Leslie, L.M.; Lemarshall, J. Sensitivity of Tropical Cyclone Tracks and Intensity to Ocean Surface Temperature: Four Cases in Four Different Basins. Tellus A: Dyn. Meteorol. Oceanogr. 2014, 66, 24212. [Google Scholar] [CrossRef] [Green Version]


Publisher’s Note: MDPI stays neutral with regard to jurisdictional claims in published maps and institutional affiliations. |
© 2022 by the authors. Licensee MDPI, Basel, Switzerland. This article is an open access article distributed under the terms and conditions of the Creative Commons Attribution (CC BY) license (https://creativecommons.org/licenses/by/4.0/).
Share and Cite
Prakash, K.R.; Pant, V.; Udaya Bhaskar, T.V.S.; Chandra, N. What Made the Sustained Intensification of Tropical Cyclone Fani in the Bay of Bengal? An Investigation Using Coupled Atmosphere–Ocean Model. Atmosphere 2022, 13, 535. https://doi.org/10.3390/atmos13040535
Prakash KR, Pant V, Udaya Bhaskar TVS, Chandra N. What Made the Sustained Intensification of Tropical Cyclone Fani in the Bay of Bengal? An Investigation Using Coupled Atmosphere–Ocean Model. Atmosphere. 2022; 13(4):535. https://doi.org/10.3390/atmos13040535
Chicago/Turabian StylePrakash, Kumar Ravi, Vimlesh Pant, T. V. S. Udaya Bhaskar, and Navin Chandra. 2022. "What Made the Sustained Intensification of Tropical Cyclone Fani in the Bay of Bengal? An Investigation Using Coupled Atmosphere–Ocean Model" Atmosphere 13, no. 4: 535. https://doi.org/10.3390/atmos13040535